Cassandra borough, PA Map & Demographics
Cassandra borough Overview
$30,027
PER CAPITA INCOME
$63,750
AVG FAMILY INCOME
$54,792
AVG HOUSEHOLD INCOME
4.8%
WAGE / INCOME GAP [ % ]
95.2¢/ $1
WAGE / INCOME GAP [ $ ]
0.37
INEQUALITY / GINI INDEX
120
TOTAL POPULATION
63
MALE POPULATION
57
FEMALE POPULATION
110.53
MALES / 100 FEMALES
90.48
FEMALES / 100 MALES
45.6
MEDIAN AGE
3.0
AVG FAMILY SIZE
2.5
AVG HOUSEHOLD SIZE
64
LABOR FORCE [ PEOPLE ]
62.7%
PERCENT IN LABOR FORCE
9.4%
UNEMPLOYMENT RATE
Income in Cassandra borough
Income Overview in Cassandra borough
Per Capita Income in Cassandra borough is $30,027, while median incomes of families and households are $63,750 and $54,792 respectively.
| Characteristic | Number | Measure |
| Per Capita Income | 120 | $30,027 |
| Median Family Income | 34 | $63,750 |
| Mean Family Income | 34 | $86,791 |
| Median Household Income | 47 | $54,792 |
| Mean Household Income | 47 | $72,862 |
| Income Deficit | 34 | $0 |
| Wage / Income Gap (%) | 120 | 4.80% |
| Wage / Income Gap ($) | 120 | 95.20¢ per $1 |
| Gini / Inequality Index | 120 | 0.37 |
Earnings by Sex in Cassandra borough
Average Earnings in Cassandra borough are $29,167, $28,958 for men and $30,417 for women, a difference of 4.8%.
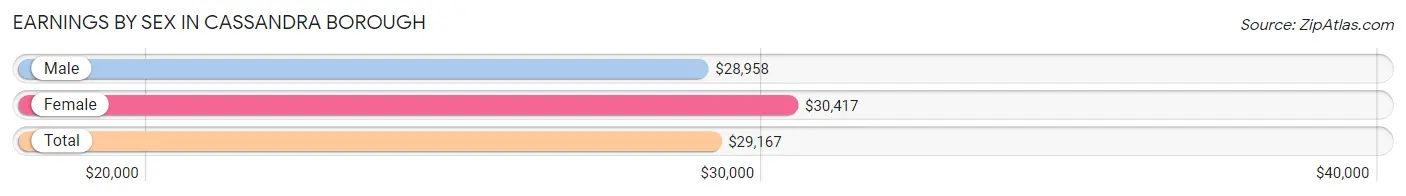
| Sex | Number | Average Earnings |
| Male | 36 (56.2%) | $28,958 |
| Female | 28 (43.8%) | $30,417 |
| Total | 64 (100.0%) | $29,167 |
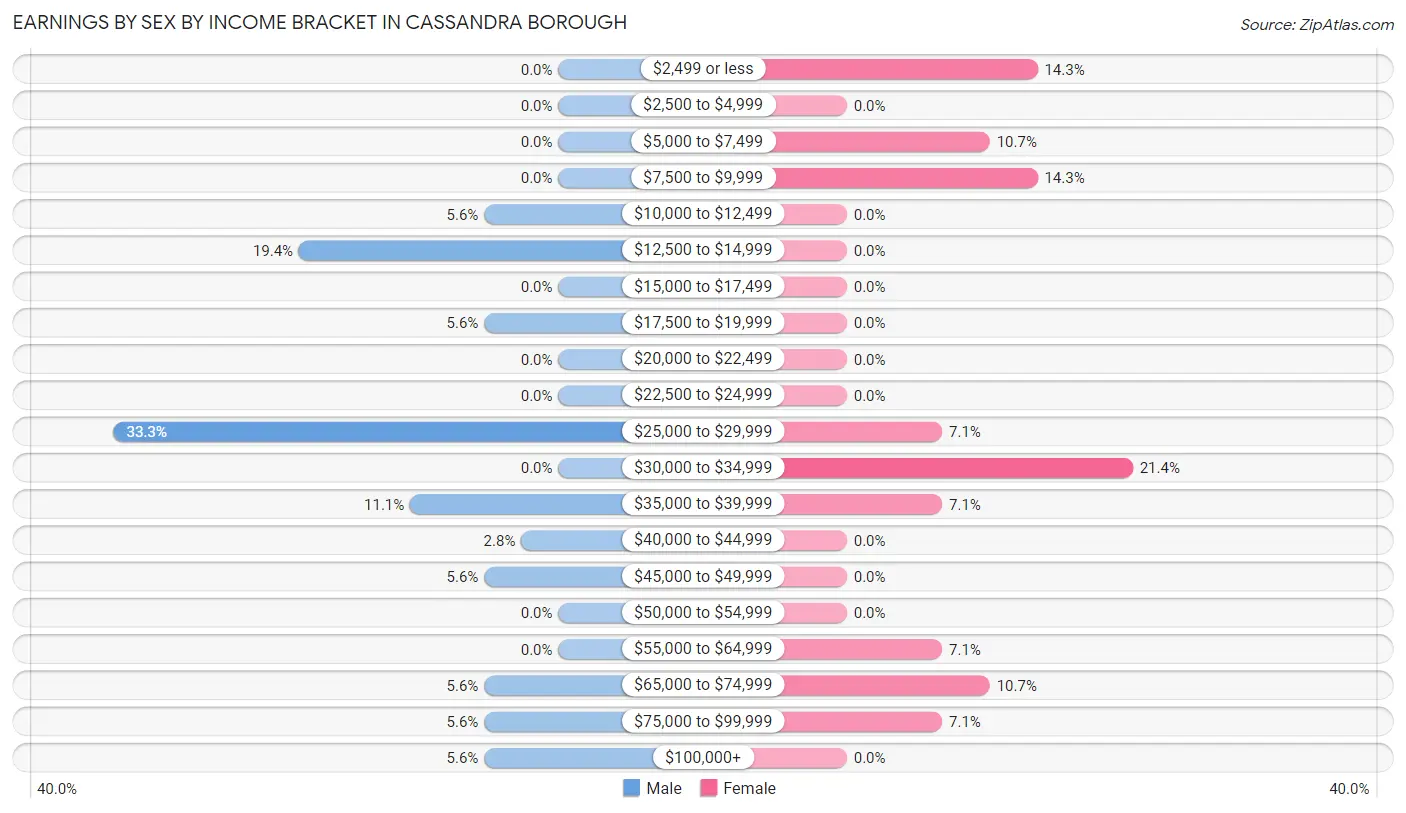
Earnings by Sex by Income Bracket in Cassandra borough
The most common earnings brackets in Cassandra borough are $25,000 to $29,999 for men (12 | 33.3%) and $30,000 to $34,999 for women (6 | 21.4%).
| Income | Male | Female |
| $2,499 or less | 0 (0.0%) | 4 (14.3%) |
| $2,500 to $4,999 | 0 (0.0%) | 0 (0.0%) |
| $5,000 to $7,499 | 0 (0.0%) | 3 (10.7%) |
| $7,500 to $9,999 | 0 (0.0%) | 4 (14.3%) |
| $10,000 to $12,499 | 2 (5.6%) | 0 (0.0%) |
| $12,500 to $14,999 | 7 (19.4%) | 0 (0.0%) |
| $15,000 to $17,499 | 0 (0.0%) | 0 (0.0%) |
| $17,500 to $19,999 | 2 (5.6%) | 0 (0.0%) |
| $20,000 to $22,499 | 0 (0.0%) | 0 (0.0%) |
| $22,500 to $24,999 | 0 (0.0%) | 0 (0.0%) |
| $25,000 to $29,999 | 12 (33.3%) | 2 (7.1%) |
| $30,000 to $34,999 | 0 (0.0%) | 6 (21.4%) |
| $35,000 to $39,999 | 4 (11.1%) | 2 (7.1%) |
| $40,000 to $44,999 | 1 (2.8%) | 0 (0.0%) |
| $45,000 to $49,999 | 2 (5.6%) | 0 (0.0%) |
| $50,000 to $54,999 | 0 (0.0%) | 0 (0.0%) |
| $55,000 to $64,999 | 0 (0.0%) | 2 (7.1%) |
| $65,000 to $74,999 | 2 (5.6%) | 3 (10.7%) |
| $75,000 to $99,999 | 2 (5.6%) | 2 (7.1%) |
| $100,000+ | 2 (5.6%) | 0 (0.0%) |
| Total | 36 (100.0%) | 28 (100.0%) |
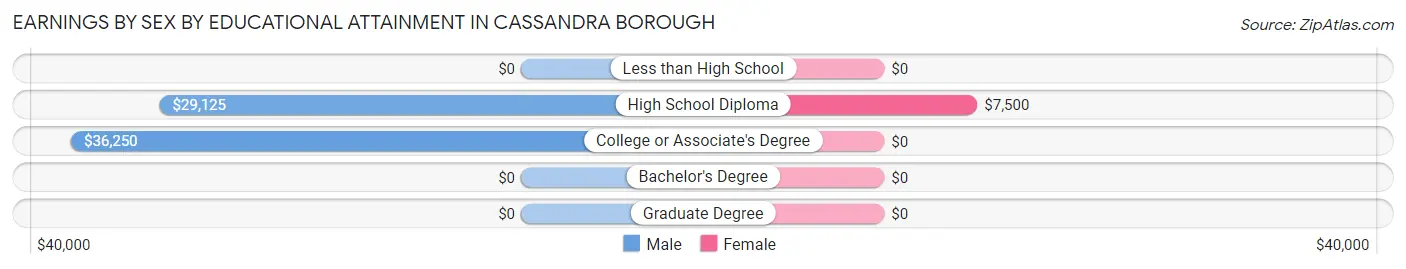
Earnings by Sex by Educational Attainment in Cassandra borough
| Educational Attainment | Male Income | Female Income |
| Less than High School | - | - |
| High School Diploma | $29,125 | $7,500 |
| College or Associate's Degree | $36,250 | $0 |
| Bachelor's Degree | - | - |
| Graduate Degree | - | - |
| Total | $29,688 | $0 |
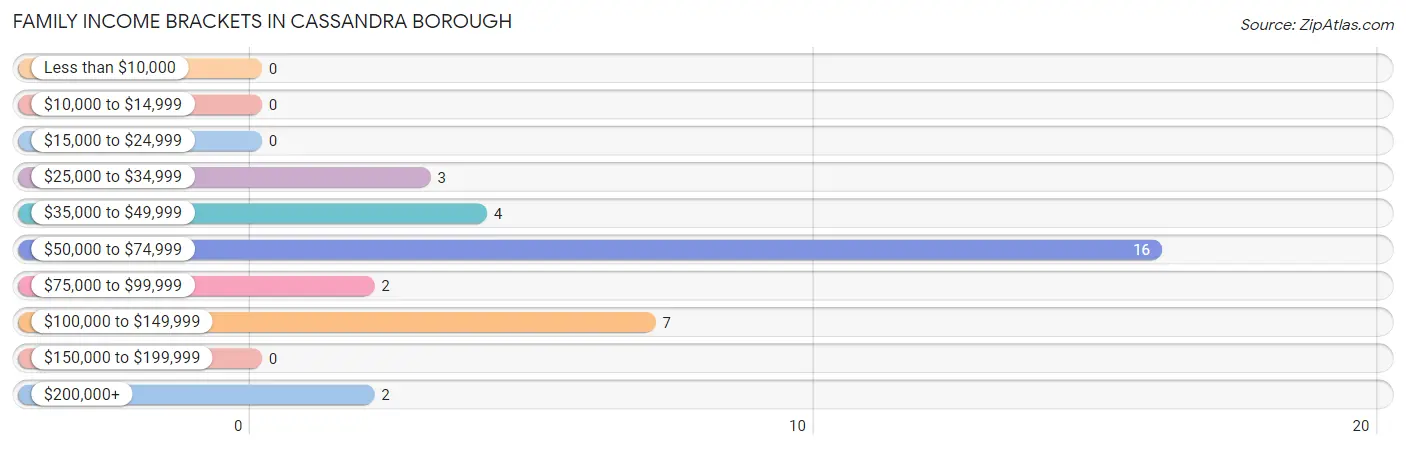
Family Income in Cassandra borough
Family Income Brackets in Cassandra borough
According to the Cassandra borough family income data, there are 16 families falling into the $50,000 to $74,999 income range, which is the most common income bracket and makes up 47.1% of all families.
| Income Bracket | # Families | % Families |
| Less than $10,000 | 0 | 0.0% |
| $10,000 to $14,999 | 0 | 0.0% |
| $15,000 to $24,999 | 0 | 0.0% |
| $25,000 to $34,999 | 3 | 8.8% |
| $35,000 to $49,999 | 4 | 11.8% |
| $50,000 to $74,999 | 16 | 47.1% |
| $75,000 to $99,999 | 2 | 5.9% |
| $100,000 to $149,999 | 7 | 20.6% |
| $150,000 to $199,999 | 0 | 0.0% |
| $200,000+ | 2 | 5.9% |
Family Income by Famaliy Size in Cassandra borough
2-person families (20 | 58.8%) account for the highest median family income in Cassandra borough with $54,000 per family, while 2-person families (20 | 58.8%) have the highest median income of $27,000 per family member.
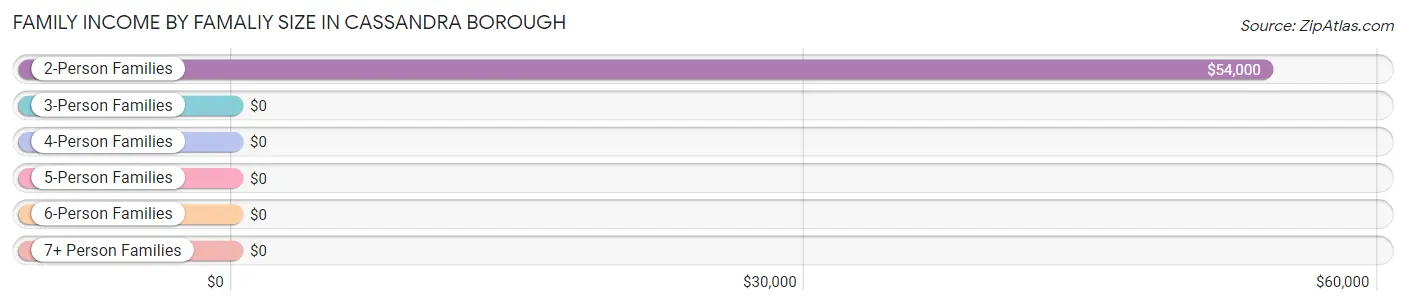
| Income Bracket | # Families | Median Income |
| 2-Person Families | 20 (58.8%) | $54,000 |
| 3-Person Families | 5 (14.7%) | $0 |
| 4-Person Families | 7 (20.6%) | $0 |
| 5-Person Families | 2 (5.9%) | $0 |
| 6-Person Families | 0 (0.0%) | $0 |
| 7+ Person Families | 0 (0.0%) | $0 |
| Total | 34 (100.0%) | $63,750 |
Family Income by Number of Earners in Cassandra borough
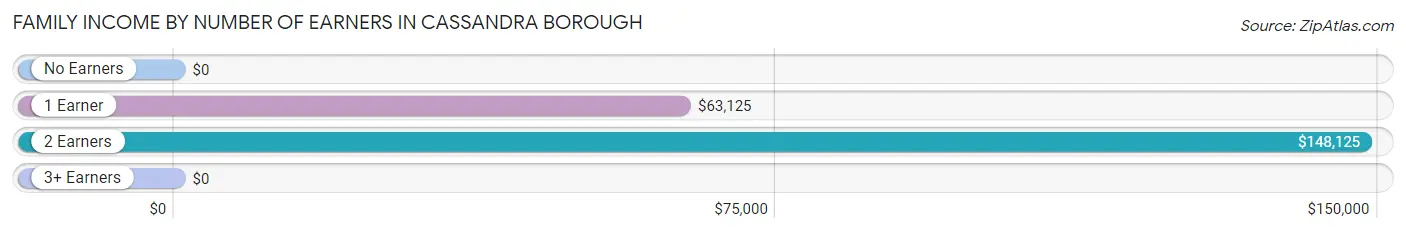
| Number of Earners | # Families | Median Income |
| No Earners | 3 (8.8%) | $0 |
| 1 Earner | 23 (67.6%) | $63,125 |
| 2 Earners | 6 (17.6%) | $148,125 |
| 3+ Earners | 2 (5.9%) | $0 |
| Total | 34 (100.0%) | $63,750 |
Household Income in Cassandra borough
Household Income Brackets in Cassandra borough
With 19 households falling in the category, the $50,000 to $74,999 income range is the most frequent in Cassandra borough, accounting for 40.4% of all households.
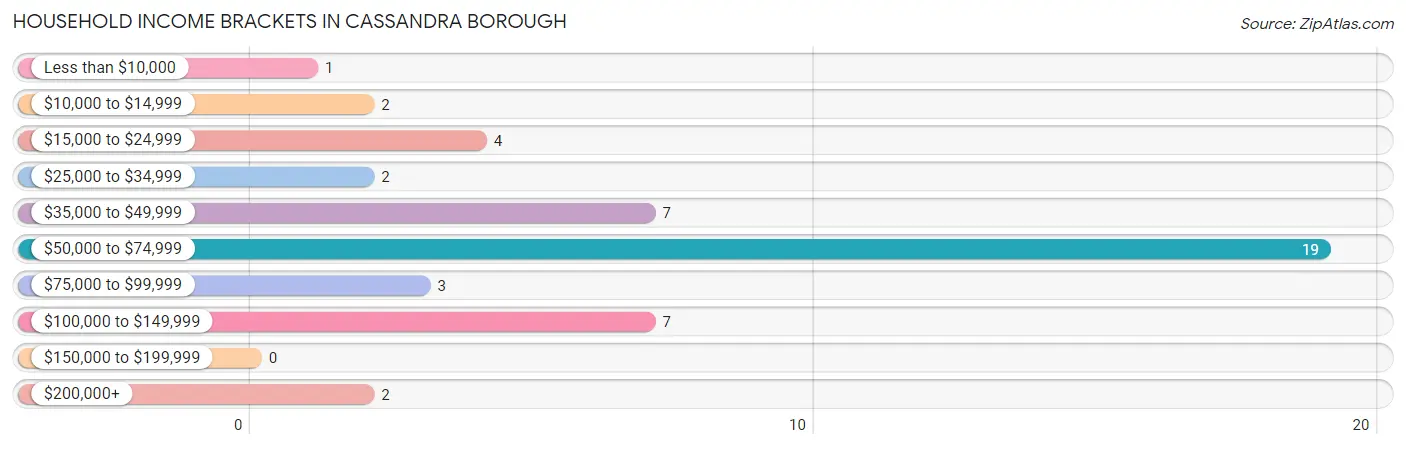
| Income Bracket | # Households | % Households |
| Less than $10,000 | 1 | 2.1% |
| $10,000 to $14,999 | 2 | 4.3% |
| $15,000 to $24,999 | 4 | 8.5% |
| $25,000 to $34,999 | 2 | 4.3% |
| $35,000 to $49,999 | 7 | 14.9% |
| $50,000 to $74,999 | 19 | 40.4% |
| $75,000 to $99,999 | 3 | 6.4% |
| $100,000 to $149,999 | 7 | 14.9% |
| $150,000 to $199,999 | 0 | 0.0% |
| $200,000+ | 2 | 4.3% |
Household Income by Householder Age in Cassandra borough
The median household income in Cassandra borough is $54,792, with the highest median household income of $73,333 found in the 25 to 44 years age bracket for the primary householder. A total of 10 households (21.3%) fall into this category. Meanwhile, the 15 to 24 years age bracket for the primary householder has the lowest median household income of $0, with 1 households (2.1%) in this group.
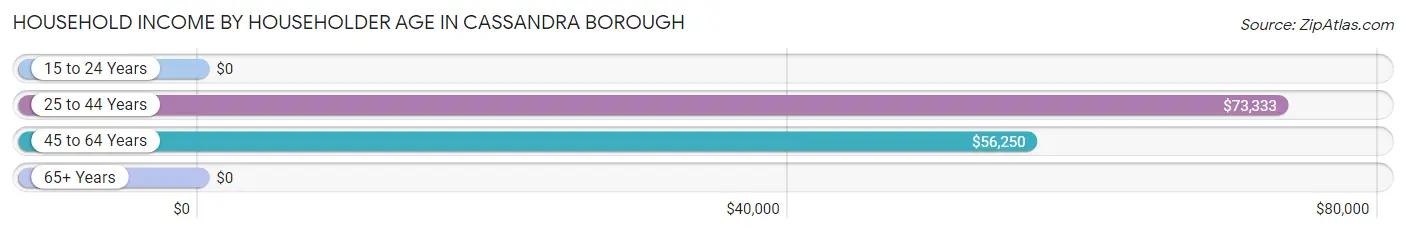
| Income Bracket | # Households | Median Income |
| 15 to 24 Years | 1 (2.1%) | $0 |
| 25 to 44 Years | 10 (21.3%) | $73,333 |
| 45 to 64 Years | 19 (40.4%) | $56,250 |
| 65+ Years | 17 (36.2%) | $0 |
| Total | 47 (100.0%) | $54,792 |
Poverty in Cassandra borough
Income Below Poverty by Sex and Age in Cassandra borough
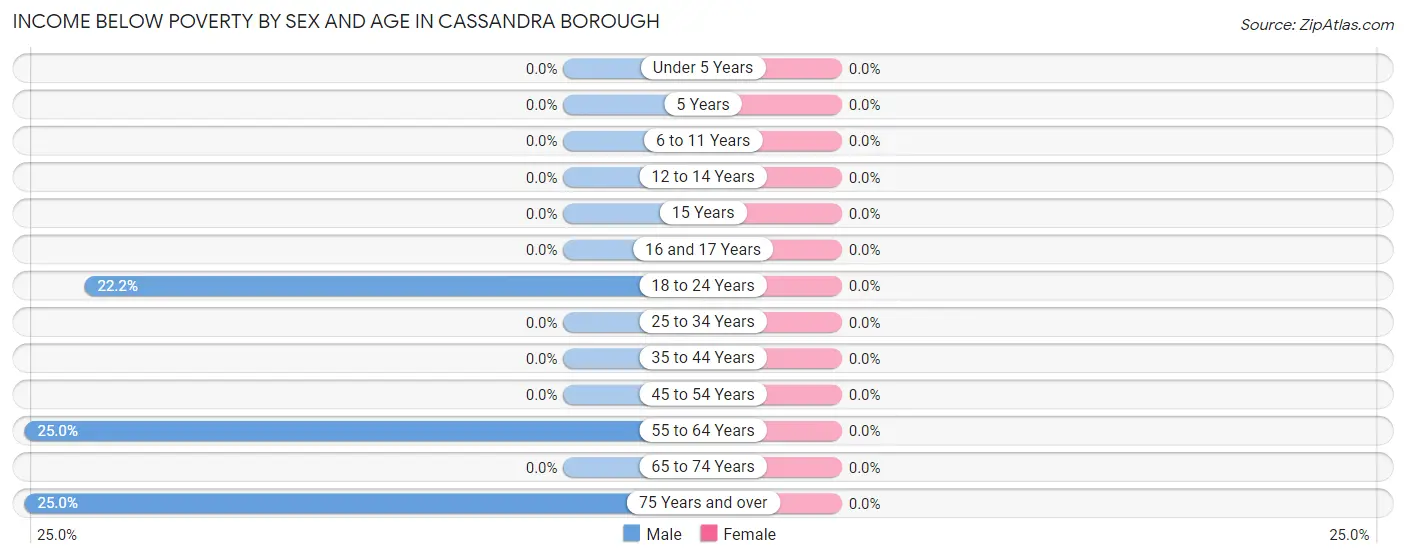
| Age Bracket | Male | Female |
| Under 5 Years | 0 (0.0%) | 0 (0.0%) |
| 5 Years | 0 (0.0%) | 0 (0.0%) |
| 6 to 11 Years | 0 (0.0%) | 0 (0.0%) |
| 12 to 14 Years | 0 (0.0%) | 0 (0.0%) |
| 15 Years | 0 (0.0%) | 0 (0.0%) |
| 16 and 17 Years | 0 (0.0%) | 0 (0.0%) |
| 18 to 24 Years | 2 (22.2%) | 0 (0.0%) |
| 25 to 34 Years | 0 (0.0%) | 0 (0.0%) |
| 35 to 44 Years | 0 (0.0%) | 0 (0.0%) |
| 45 to 54 Years | 0 (0.0%) | 0 (0.0%) |
| 55 to 64 Years | 1 (25.0%) | 0 (0.0%) |
| 65 to 74 Years | 0 (0.0%) | 0 (0.0%) |
| 75 Years and over | 1 (25.0%) | 0 (0.0%) |
| Total | 4 (6.4%) | 0 (0.0%) |
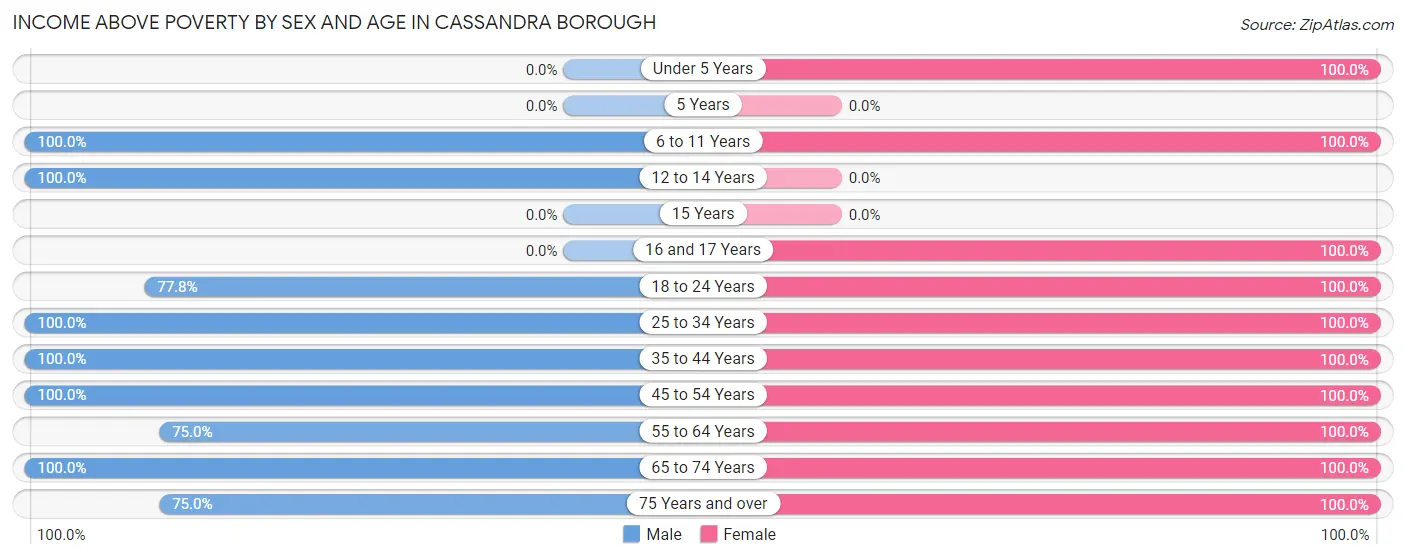
Income Above Poverty by Sex and Age in Cassandra borough
According to the poverty statistics in Cassandra borough, males aged 6 to 11 years and females aged under 5 years are the age groups that are most secure financially, with 100.0% of males and 100.0% of females in these age groups living above the poverty line.
| Age Bracket | Male | Female |
| Under 5 Years | 0 (0.0%) | 4 (100.0%) |
| 5 Years | 0 (0.0%) | 0 (0.0%) |
| 6 to 11 Years | 9 (100.0%) | 3 (100.0%) |
| 12 to 14 Years | 2 (100.0%) | 0 (0.0%) |
| 15 Years | 0 (0.0%) | 0 (0.0%) |
| 16 and 17 Years | 0 (0.0%) | 4 (100.0%) |
| 18 to 24 Years | 7 (77.8%) | 4 (100.0%) |
| 25 to 34 Years | 4 (100.0%) | 3 (100.0%) |
| 35 to 44 Years | 4 (100.0%) | 8 (100.0%) |
| 45 to 54 Years | 23 (100.0%) | 8 (100.0%) |
| 55 to 64 Years | 3 (75.0%) | 6 (100.0%) |
| 65 to 74 Years | 4 (100.0%) | 8 (100.0%) |
| 75 Years and over | 3 (75.0%) | 9 (100.0%) |
| Total | 59 (93.6%) | 57 (100.0%) |
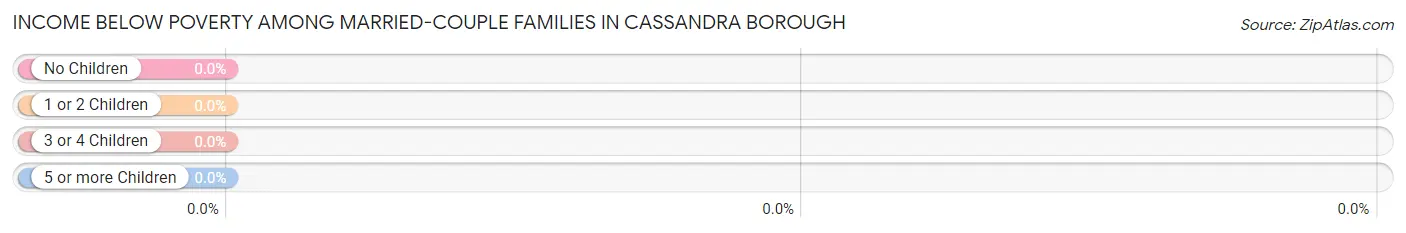
Income Below Poverty Among Married-Couple Families in Cassandra borough
| Children | Above Poverty | Below Poverty |
| No Children | 13 (100.0%) | 0 (0.0%) |
| 1 or 2 Children | 7 (100.0%) | 0 (0.0%) |
| 3 or 4 Children | 2 (100.0%) | 0 (0.0%) |
| 5 or more Children | 0 (0.0%) | 0 (0.0%) |
| Total | 22 (100.0%) | 0 (0.0%) |
Income Below Poverty Among Single-Parent Households in Cassandra borough
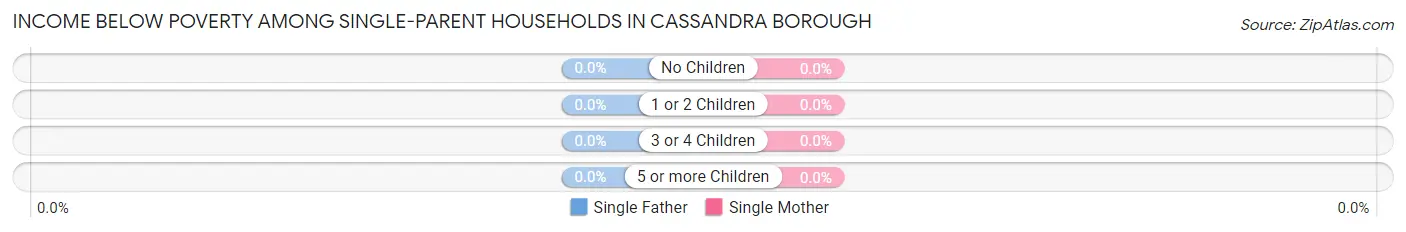
| Children | Single Father | Single Mother |
| No Children | 0 (0.0%) | 0 (0.0%) |
| 1 or 2 Children | 0 (0.0%) | 0 (0.0%) |
| 3 or 4 Children | 0 (0.0%) | 0 (0.0%) |
| 5 or more Children | 0 (0.0%) | 0 (0.0%) |
| Total | 0 (0.0%) | 0 (0.0%) |
Income Below Poverty Among Married-Couple vs Single-Parent Households in Cassandra borough
| Children | Married-Couple Families | Single-Parent Households |
| No Children | 0 (0.0%) | 0 (0.0%) |
| 1 or 2 Children | 0 (0.0%) | 0 (0.0%) |
| 3 or 4 Children | 0 (0.0%) | 0 (0.0%) |
| 5 or more Children | 0 (0.0%) | 0 (0.0%) |
| Total | 0 (0.0%) | 0 (0.0%) |
Race in Cassandra borough
The most populous races in Cassandra borough are White / Caucasian (120 | 100.0%), and Hispanic or Latino (1 | 0.8%).
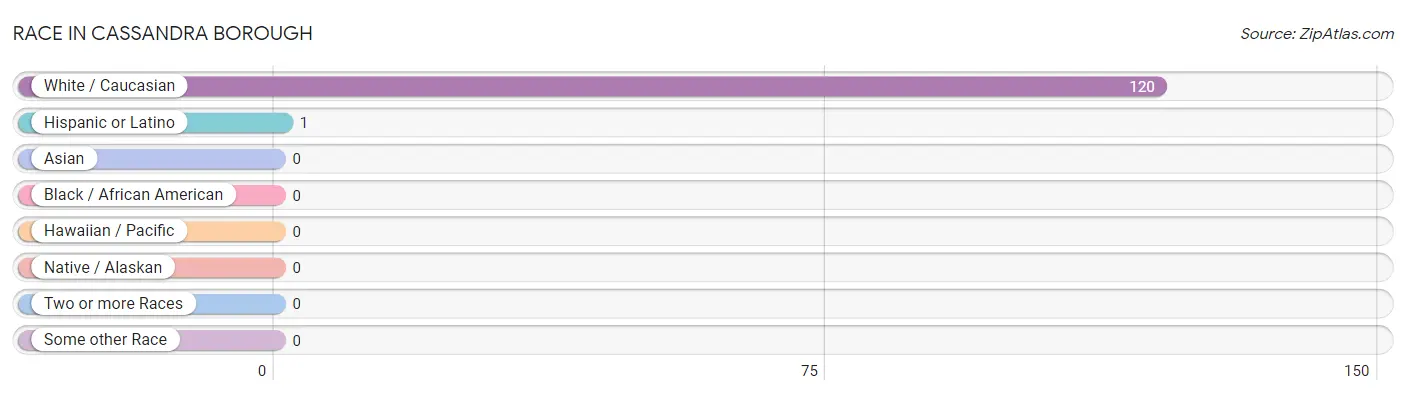
| Race | # Population | % Population |
| Asian | 0 | 0.0% |
| Black / African American | 0 | 0.0% |
| Hawaiian / Pacific | 0 | 0.0% |
| Hispanic or Latino | 1 | 0.8% |
| Native / Alaskan | 0 | 0.0% |
| White / Caucasian | 120 | 100.0% |
| Two or more Races | 0 | 0.0% |
| Some other Race | 0 | 0.0% |
| Total | 120 | 100.0% |
Ancestry in Cassandra borough
The most populous ancestries reported in Cassandra borough are German (54 | 45.0%), Polish (35 | 29.2%), Slovak (33 | 27.5%), Irish (10 | 8.3%), and English (5 | 4.2%), together accounting for 114.2% of all Cassandra borough residents.
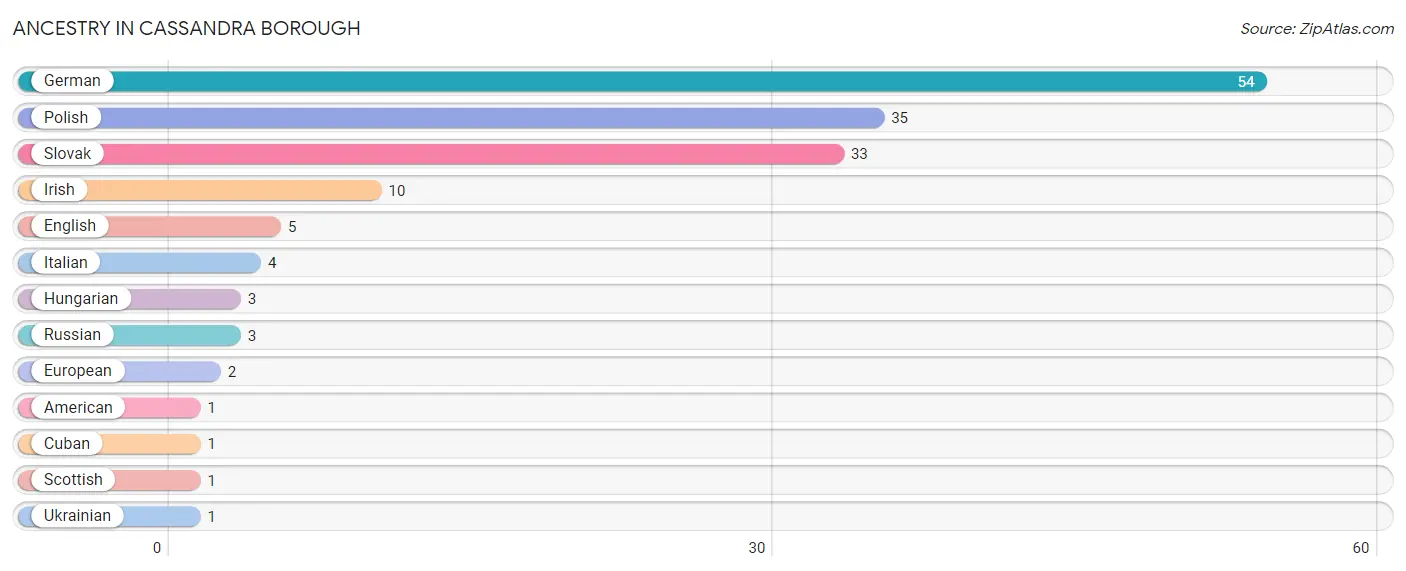
| Ancestry | # Population | % Population |
| American | 1 | 0.8% |
| Cuban | 1 | 0.8% |
| English | 5 | 4.2% |
| European | 2 | 1.7% |
| German | 54 | 45.0% |
| Hungarian | 3 | 2.5% |
| Irish | 10 | 8.3% |
| Italian | 4 | 3.3% |
| Polish | 35 | 29.2% |
| Russian | 3 | 2.5% |
| Scottish | 1 | 0.8% |
| Slovak | 33 | 27.5% |
| Ukrainian | 1 | 0.8% | View All 13 Rows |
Immigrants in Cassandra borough

| Immigration Origin | # Population | % Population | View All 0 Rows |
Sex and Age in Cassandra borough
Sex and Age in Cassandra borough
The most populous age groups in Cassandra borough are 45 to 49 Years (12 | 19.1%) for men and 65 to 69 Years (7 | 12.3%) for women.
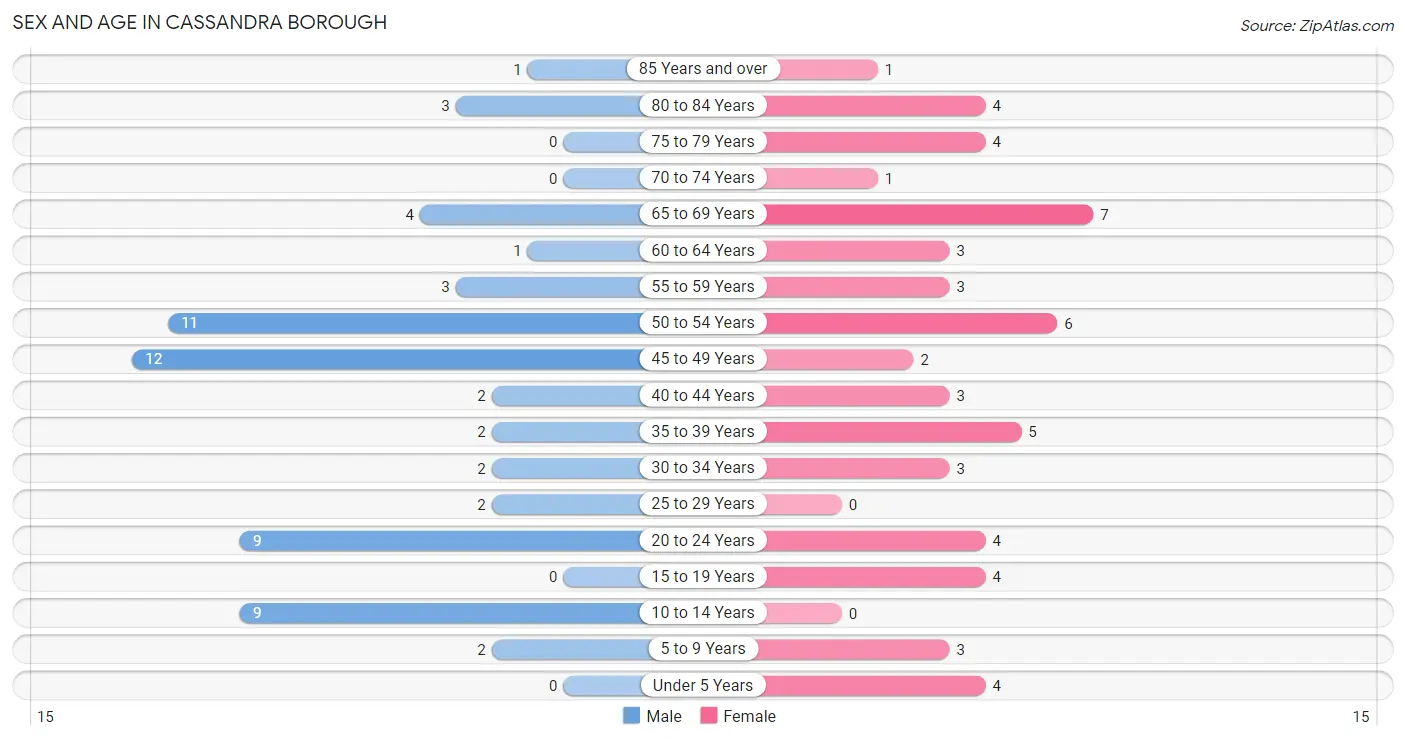
| Age Bracket | Male | Female |
| Under 5 Years | 0 (0.0%) | 4 (7.0%) |
| 5 to 9 Years | 2 (3.2%) | 3 (5.3%) |
| 10 to 14 Years | 9 (14.3%) | 0 (0.0%) |
| 15 to 19 Years | 0 (0.0%) | 4 (7.0%) |
| 20 to 24 Years | 9 (14.3%) | 4 (7.0%) |
| 25 to 29 Years | 2 (3.2%) | 0 (0.0%) |
| 30 to 34 Years | 2 (3.2%) | 3 (5.3%) |
| 35 to 39 Years | 2 (3.2%) | 5 (8.8%) |
| 40 to 44 Years | 2 (3.2%) | 3 (5.3%) |
| 45 to 49 Years | 12 (19.1%) | 2 (3.5%) |
| 50 to 54 Years | 11 (17.5%) | 6 (10.5%) |
| 55 to 59 Years | 3 (4.8%) | 3 (5.3%) |
| 60 to 64 Years | 1 (1.6%) | 3 (5.3%) |
| 65 to 69 Years | 4 (6.4%) | 7 (12.3%) |
| 70 to 74 Years | 0 (0.0%) | 1 (1.8%) |
| 75 to 79 Years | 0 (0.0%) | 4 (7.0%) |
| 80 to 84 Years | 3 (4.8%) | 4 (7.0%) |
| 85 Years and over | 1 (1.6%) | 1 (1.8%) |
| Total | 63 (100.0%) | 57 (100.0%) |
Families and Households in Cassandra borough
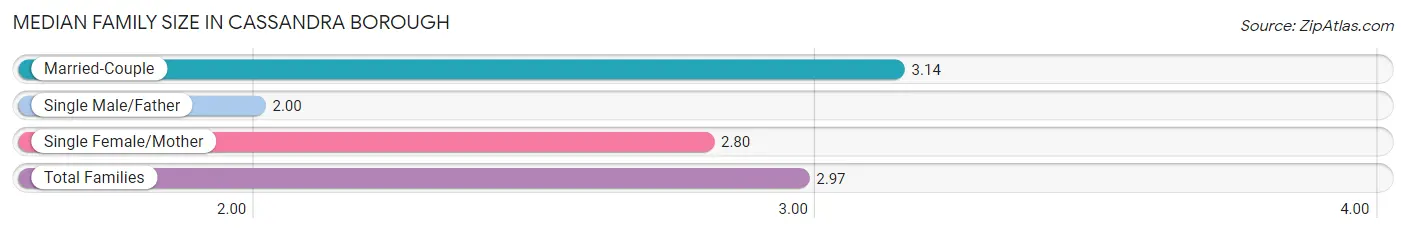
Median Family Size in Cassandra borough
The median family size in Cassandra borough is 2.97 persons per family, with married-couple families (22 | 64.7%) accounting for the largest median family size of 3.14 persons per family. On the other hand, single male/father families (2 | 5.9%) represent the smallest median family size with 2.00 persons per family.
| Family Type | # Families | Family Size |
| Married-Couple | 22 (64.7%) | 3.14 |
| Single Male/Father | 2 (5.9%) | 2.00 |
| Single Female/Mother | 10 (29.4%) | 2.80 |
| Total Families | 34 (100.0%) | 2.97 |
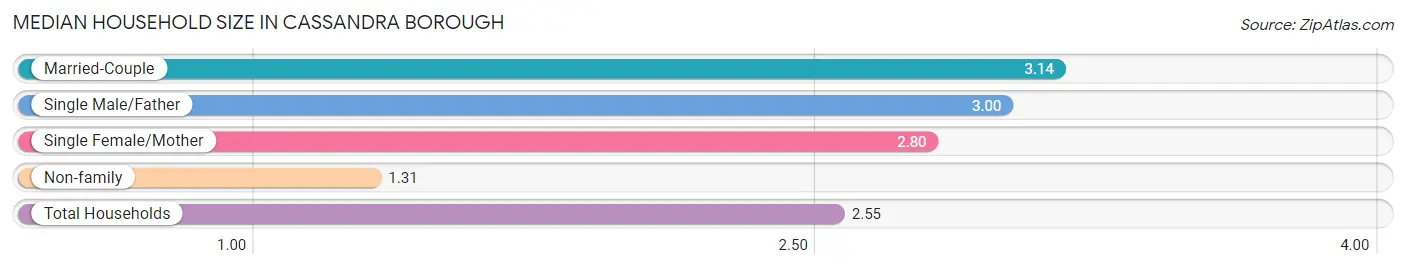
Median Household Size in Cassandra borough
The median household size in Cassandra borough is 2.55 persons per household, with married-couple households (22 | 46.8%) accounting for the largest median household size of 3.14 persons per household. non-family households (13 | 27.7%) represent the smallest median household size with 1.31 persons per household.
| Household Type | # Households | Household Size |
| Married-Couple | 22 (46.8%) | 3.14 |
| Single Male/Father | 2 (4.3%) | 3.00 |
| Single Female/Mother | 10 (21.3%) | 2.80 |
| Non-family | 13 (27.7%) | 1.31 |
| Total Households | 47 (100.0%) | 2.55 |
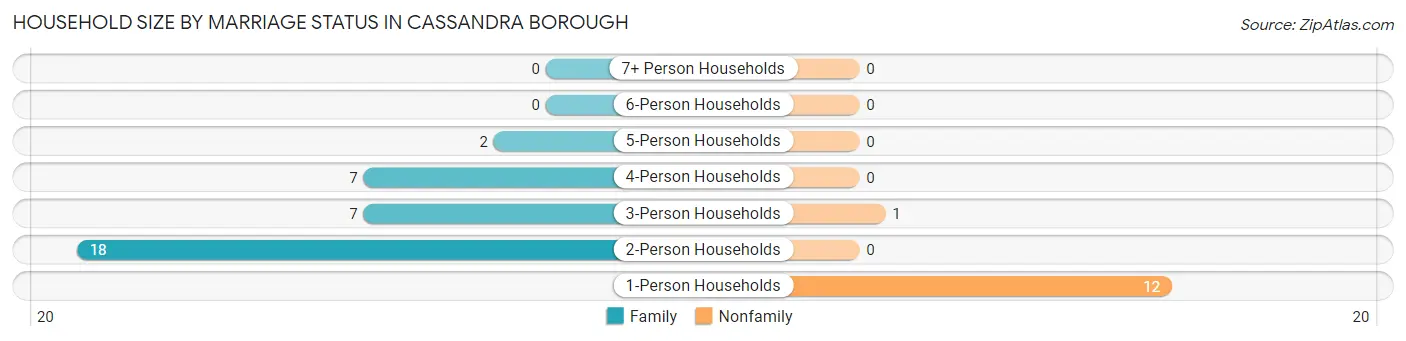
Household Size by Marriage Status in Cassandra borough
Out of a total of 47 households in Cassandra borough, 34 (72.3%) are family households, while 13 (27.7%) are nonfamily households. The most numerous type of family households are 2-person households, comprising 18, and the most common type of nonfamily households are 1-person households, comprising 12.
| Household Size | Family Households | Nonfamily Households |
| 1-Person Households | - | 12 (25.5%) |
| 2-Person Households | 18 (38.3%) | 0 (0.0%) |
| 3-Person Households | 7 (14.9%) | 1 (2.1%) |
| 4-Person Households | 7 (14.9%) | 0 (0.0%) |
| 5-Person Households | 2 (4.3%) | 0 (0.0%) |
| 6-Person Households | 0 (0.0%) | 0 (0.0%) |
| 7+ Person Households | 0 (0.0%) | 0 (0.0%) |
| Total | 34 (72.3%) | 13 (27.7%) |
Female Fertility in Cassandra borough
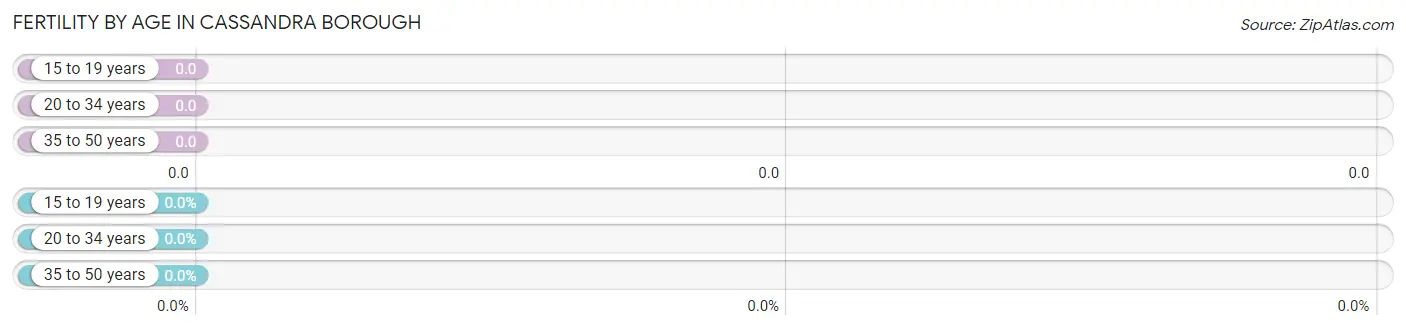
Fertility by Age in Cassandra borough
| Age Bracket | Women with Births | Births / 1,000 Women |
| 15 to 19 years | 0 (0.0%) | 0.0 |
| 20 to 34 years | 0 (0.0%) | 0.0 |
| 35 to 50 years | 0 (0.0%) | 0.0 |
| Total | 0 (0.0%) | 0.0 |
Fertility by Age by Marriage Status in Cassandra borough
| Age Bracket | Married | Unmarried |
| 15 to 19 years | 0 (0.0%) | 0 (0.0%) |
| 20 to 34 years | 0 (0.0%) | 0 (0.0%) |
| 35 to 50 years | 0 (0.0%) | 0 (0.0%) |
| Total | 0 (0.0%) | 0 (0.0%) |
Fertility by Education in Cassandra borough
| Educational Attainment | Women with Births | Births / 1,000 Women |
| Less than High School | 0 (0.0%) | 0.0 |
| High School Diploma | 0 (0.0%) | 0.0 |
| College or Associate's Degree | 0 (0.0%) | 0.0 |
| Bachelor's Degree | 0 (0.0%) | 0.0 |
| Graduate Degree | 0 (0.0%) | 0.0 |
| Total | 0 (0.0%) | 0.0 |
Fertility by Education by Marriage Status in Cassandra borough
| Educational Attainment | Married | Unmarried |
| Less than High School | 0 (0.0%) | 0 (0.0%) |
| High School Diploma | 0 (0.0%) | 0 (0.0%) |
| College or Associate's Degree | 0 (0.0%) | 0 (0.0%) |
| Bachelor's Degree | 0 (0.0%) | 0 (0.0%) |
| Graduate Degree | 0 (0.0%) | 0 (0.0%) |
| Total | 0 (0.0%) | 0 (0.0%) |
Employment Characteristics in Cassandra borough
Employment by Class of Employer in Cassandra borough
Among the 54 employed individuals in Cassandra borough, private company employees (46 | 85.2%), local government employees (3 | 5.6%), and not-for-profit organizations (2 | 3.7%) make up the most common classes of employment.
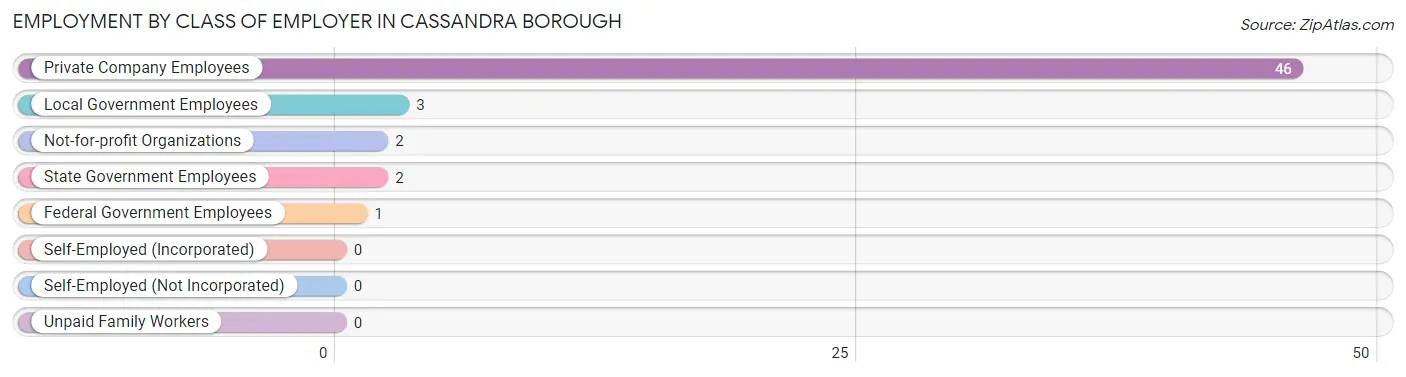
| Employer Class | # Employees | % Employees |
| Private Company Employees | 46 | 85.2% |
| Self-Employed (Incorporated) | 0 | 0.0% |
| Self-Employed (Not Incorporated) | 0 | 0.0% |
| Not-for-profit Organizations | 2 | 3.7% |
| Local Government Employees | 3 | 5.6% |
| State Government Employees | 2 | 3.7% |
| Federal Government Employees | 1 | 1.8% |
| Unpaid Family Workers | 0 | 0.0% |
| Total | 54 | 100.0% |
Employment Status by Age in Cassandra borough
According to the labor force statistics for Cassandra borough, out of the total population over 16 years of age (102), 62.7% or 64 individuals are in the labor force, with 9.4% or 6 of them unemployed. The age group with the highest labor force participation rate is 20 to 24 years, with 100.0% or 13 individuals in the labor force. Within the labor force, the 20 to 24 years age range has the highest percentage of unemployed individuals, with 46.2% or 6 of them being unemployed.
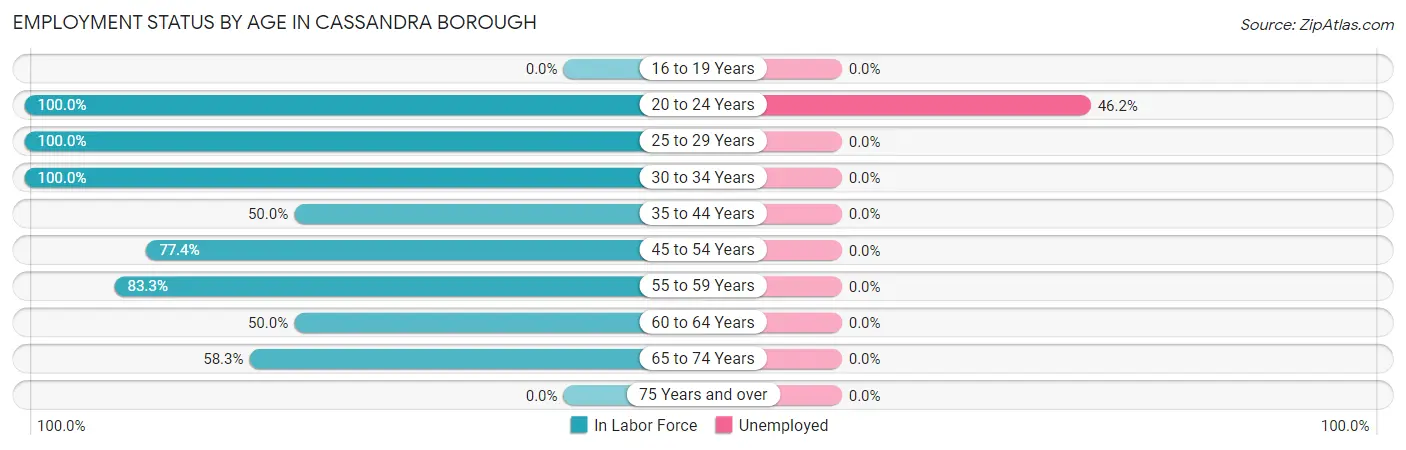
| Age Bracket | In Labor Force | Unemployed |
| 16 to 19 Years | 0 (0.0%) | 0 (0.0%) |
| 20 to 24 Years | 13 (100.0%) | 6 (46.2%) |
| 25 to 29 Years | 2 (100.0%) | 0 (0.0%) |
| 30 to 34 Years | 5 (100.0%) | 0 (0.0%) |
| 35 to 44 Years | 6 (50.0%) | 0 (0.0%) |
| 45 to 54 Years | 24 (77.4%) | 0 (0.0%) |
| 55 to 59 Years | 5 (83.3%) | 0 (0.0%) |
| 60 to 64 Years | 2 (50.0%) | 0 (0.0%) |
| 65 to 74 Years | 7 (58.3%) | 0 (0.0%) |
| 75 Years and over | 0 (0.0%) | 0 (0.0%) |
| Total | 64 (62.7%) | 6 (9.4%) |
Employment Status by Educational Attainment in Cassandra borough
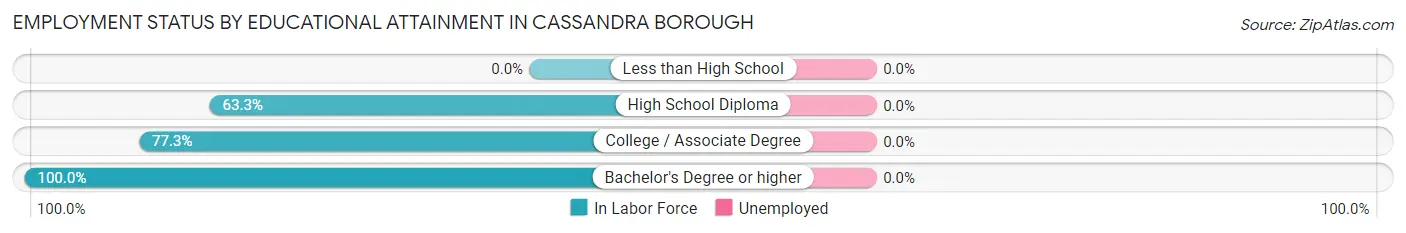
| Educational Attainment | In Labor Force | Unemployed |
| Less than High School | 0 (0.0%) | 0 (0.0%) |
| High School Diploma | 19 (63.3%) | 0 (0.0%) |
| College / Associate Degree | 17 (77.3%) | 0 (0.0%) |
| Bachelor's Degree or higher | 8 (100.0%) | 0 (0.0%) |
| Total | 44 (73.3%) | 0 (0.0%) |
Employment Occupations by Sex in Cassandra borough
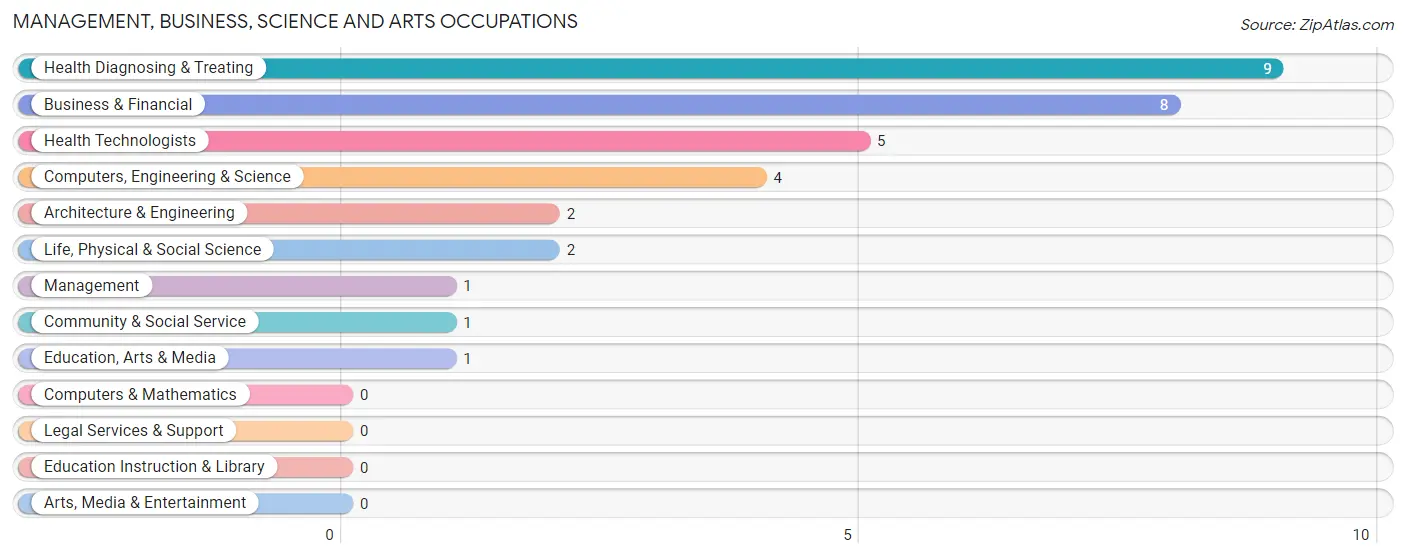
Management, Business, Science and Arts Occupations
The most common Management, Business, Science and Arts occupations in Cassandra borough are Health Diagnosing & Treating (9 | 15.5%), Business & Financial (8 | 13.8%), Health Technologists (5 | 8.6%), Computers, Engineering & Science (4 | 6.9%), and Architecture & Engineering (2 | 3.5%).
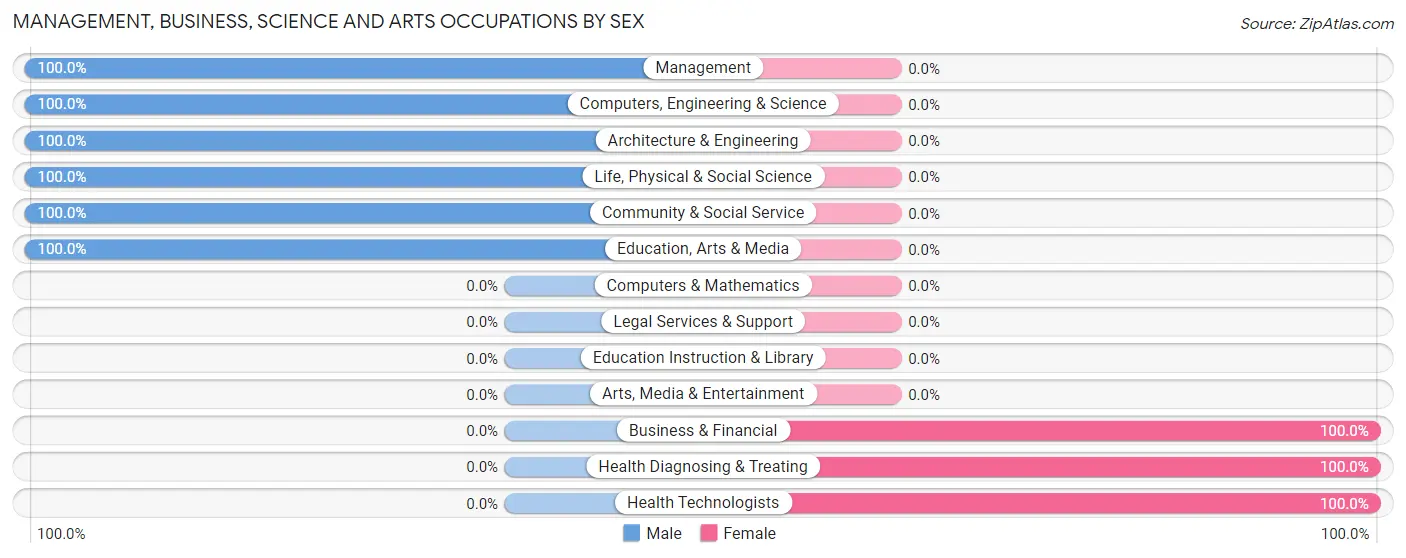
Management, Business, Science and Arts Occupations by Sex
Within the Management, Business, Science and Arts occupations in Cassandra borough, the most male-oriented occupations are Management (100.0%), Computers, Engineering & Science (100.0%), and Architecture & Engineering (100.0%), while the most female-oriented occupations are Business & Financial (100.0%), Health Diagnosing & Treating (100.0%), and Health Technologists (100.0%).
| Occupation | Male | Female |
| Management | 1 (100.0%) | 0 (0.0%) |
| Business & Financial | 0 (0.0%) | 8 (100.0%) |
| Computers, Engineering & Science | 4 (100.0%) | 0 (0.0%) |
| Computers & Mathematics | 0 (0.0%) | 0 (0.0%) |
| Architecture & Engineering | 2 (100.0%) | 0 (0.0%) |
| Life, Physical & Social Science | 2 (100.0%) | 0 (0.0%) |
| Community & Social Service | 1 (100.0%) | 0 (0.0%) |
| Education, Arts & Media | 1 (100.0%) | 0 (0.0%) |
| Legal Services & Support | 0 (0.0%) | 0 (0.0%) |
| Education Instruction & Library | 0 (0.0%) | 0 (0.0%) |
| Arts, Media & Entertainment | 0 (0.0%) | 0 (0.0%) |
| Health Diagnosing & Treating | 0 (0.0%) | 9 (100.0%) |
| Health Technologists | 0 (0.0%) | 5 (100.0%) |
| Total (Category) | 6 (26.1%) | 17 (73.9%) |
| Total (Overall) | 30 (51.7%) | 28 (48.3%) |
Services Occupations
The most common Services occupations in Cassandra borough are Food Preparation & Serving (4 | 6.9%), Security & Protection (2 | 3.5%), and Law Enforcement (2 | 3.5%).
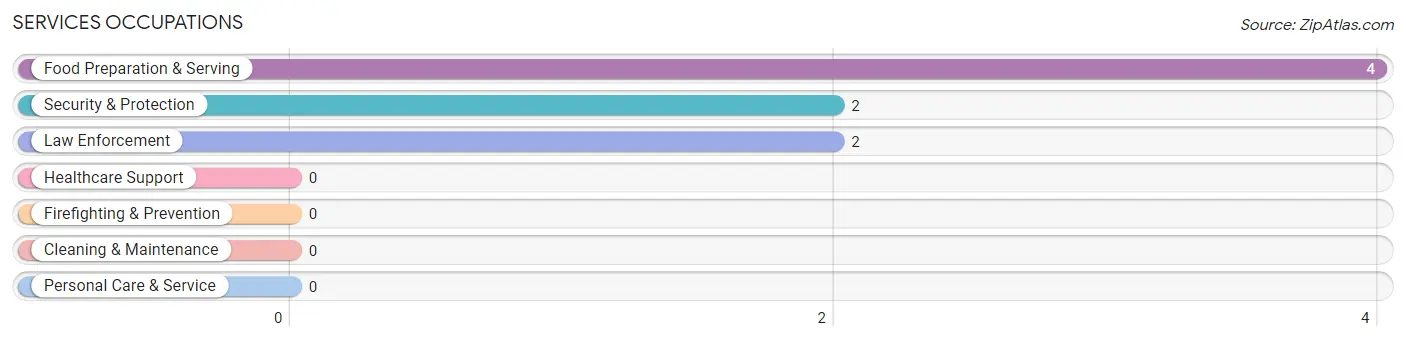
Services Occupations by Sex
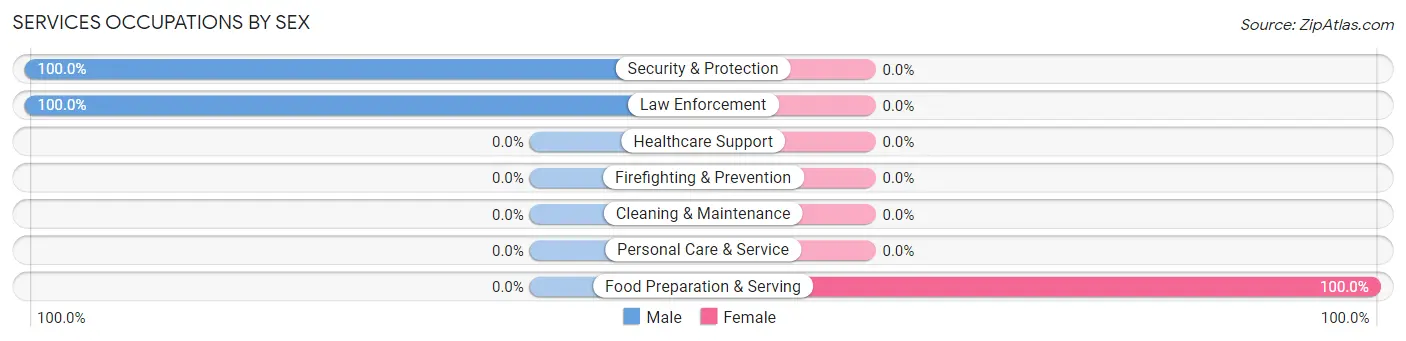
| Occupation | Male | Female |
| Healthcare Support | 0 (0.0%) | 0 (0.0%) |
| Security & Protection | 2 (100.0%) | 0 (0.0%) |
| Firefighting & Prevention | 0 (0.0%) | 0 (0.0%) |
| Law Enforcement | 2 (100.0%) | 0 (0.0%) |
| Food Preparation & Serving | 0 (0.0%) | 4 (100.0%) |
| Cleaning & Maintenance | 0 (0.0%) | 0 (0.0%) |
| Personal Care & Service | 0 (0.0%) | 0 (0.0%) |
| Total (Category) | 2 (33.3%) | 4 (66.7%) |
| Total (Overall) | 30 (51.7%) | 28 (48.3%) |
Sales and Office Occupations
The most common Sales and Office occupations in Cassandra borough are Sales & Related (4 | 6.9%), and Office & Administration (1 | 1.7%).
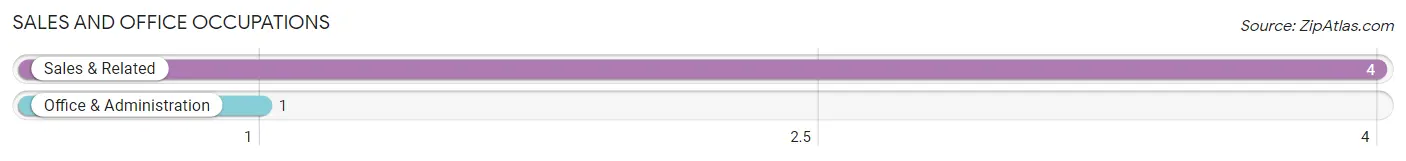
Sales and Office Occupations by Sex
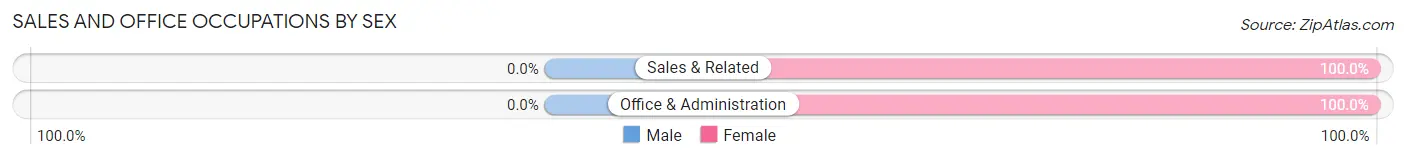
| Occupation | Male | Female |
| Sales & Related | 0 (0.0%) | 4 (100.0%) |
| Office & Administration | 0 (0.0%) | 1 (100.0%) |
| Total (Category) | 0 (0.0%) | 5 (100.0%) |
| Total (Overall) | 30 (51.7%) | 28 (48.3%) |
Natural Resources, Construction and Maintenance Occupations
The most common Natural Resources, Construction and Maintenance occupations in Cassandra borough are , and Construction & Extraction (4 | 6.9%).
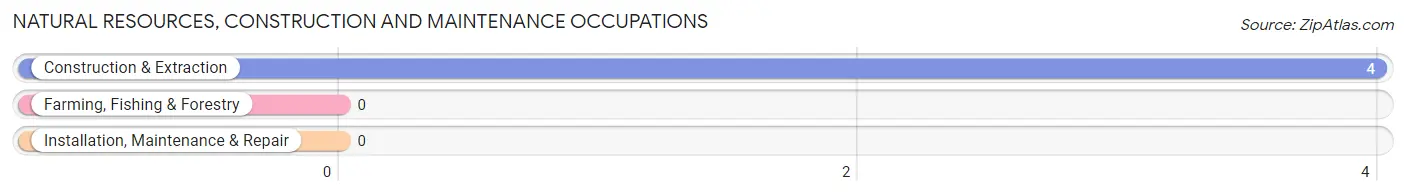
Natural Resources, Construction and Maintenance Occupations by Sex
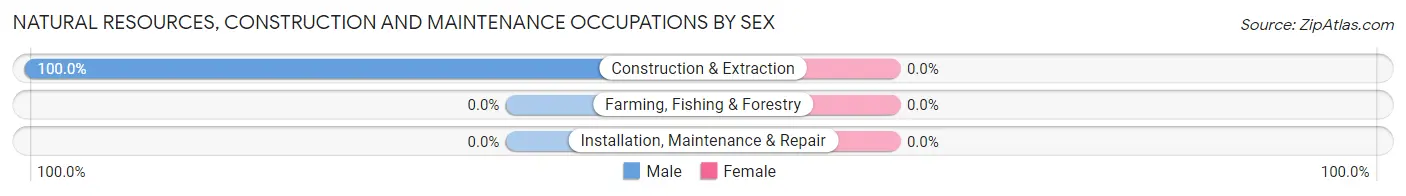
| Occupation | Male | Female |
| Farming, Fishing & Forestry | 0 (0.0%) | 0 (0.0%) |
| Construction & Extraction | 4 (100.0%) | 0 (0.0%) |
| Installation, Maintenance & Repair | 0 (0.0%) | 0 (0.0%) |
| Total (Category) | 4 (100.0%) | 0 (0.0%) |
| Total (Overall) | 30 (51.7%) | 28 (48.3%) |
Production, Transportation and Moving Occupations
The most common Production, Transportation and Moving occupations in Cassandra borough are Production (16 | 27.6%), and Material Moving (4 | 6.9%).
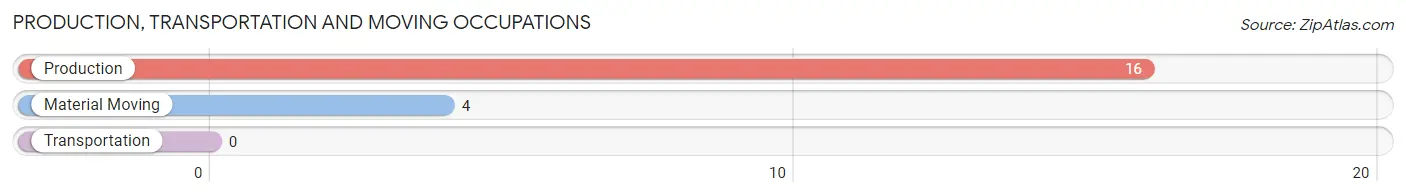
Production, Transportation and Moving Occupations by Sex
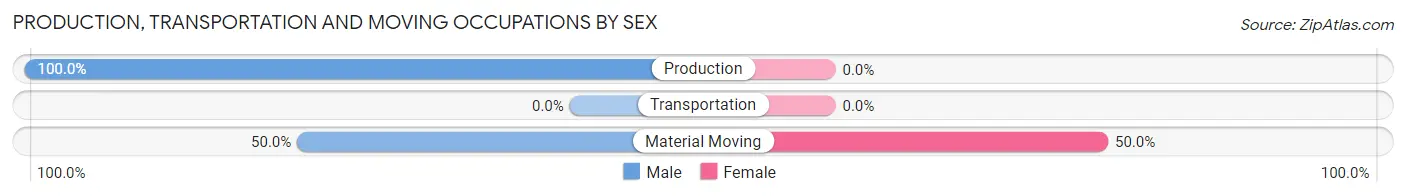
| Occupation | Male | Female |
| Production | 16 (100.0%) | 0 (0.0%) |
| Transportation | 0 (0.0%) | 0 (0.0%) |
| Material Moving | 2 (50.0%) | 2 (50.0%) |
| Total (Category) | 18 (90.0%) | 2 (10.0%) |
| Total (Overall) | 30 (51.7%) | 28 (48.3%) |
Employment Industries by Sex in Cassandra borough
Employment Industries in Cassandra borough
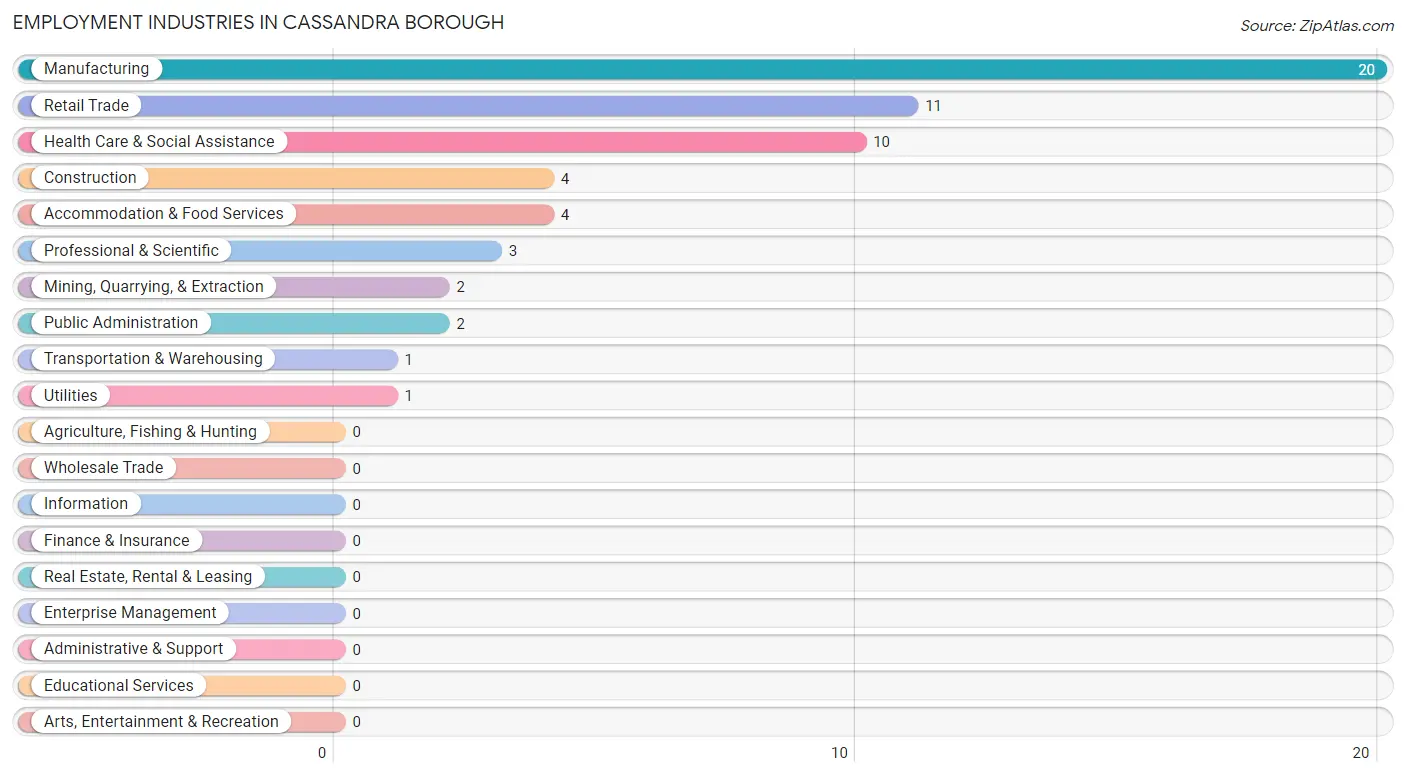
The major employment industries in Cassandra borough include Manufacturing (20 | 34.5%), Retail Trade (11 | 19.0%), Health Care & Social Assistance (10 | 17.2%), Construction (4 | 6.9%), and Accommodation & Food Services (4 | 6.9%).
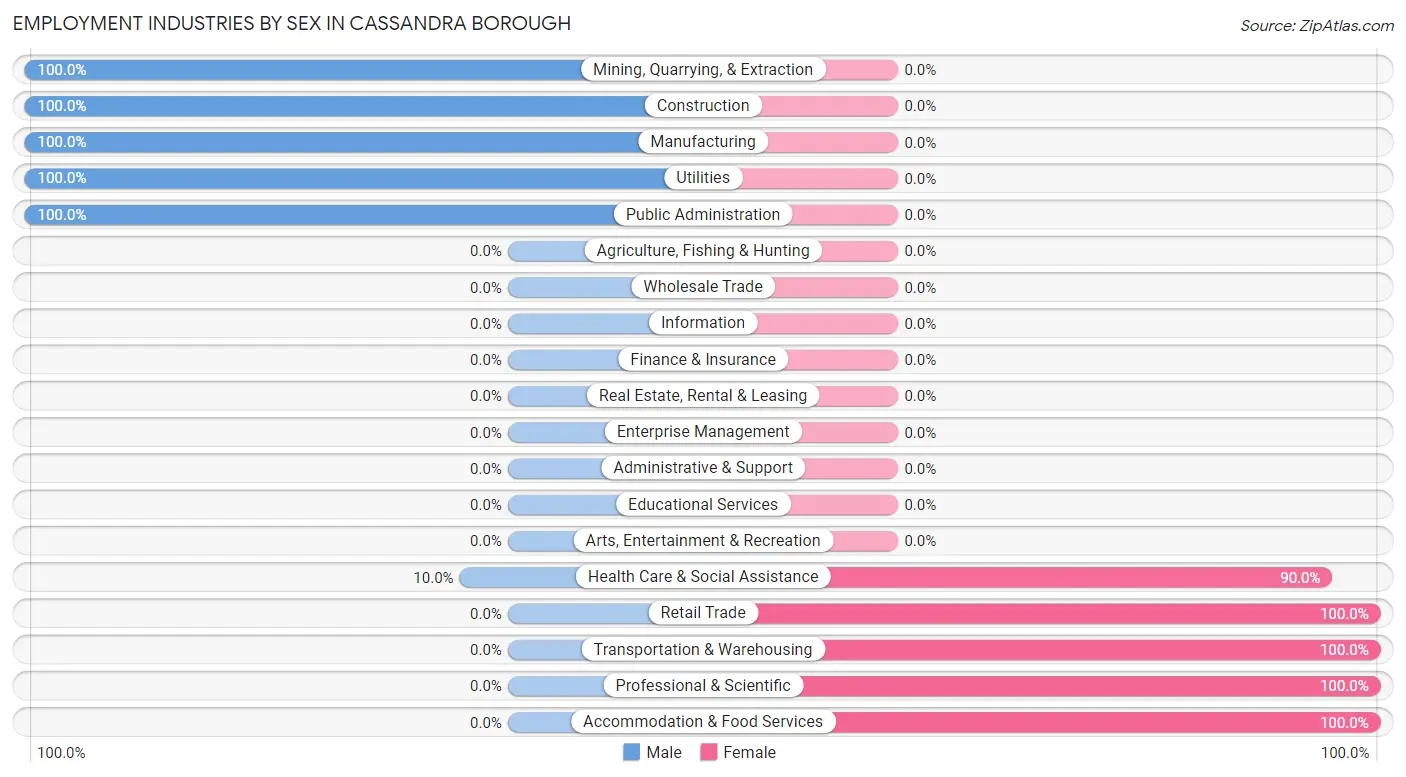
Employment Industries by Sex in Cassandra borough
The Cassandra borough industries that see more men than women are Mining, Quarrying, & Extraction (100.0%), Construction (100.0%), and Manufacturing (100.0%), whereas the industries that tend to have a higher number of women are Retail Trade (100.0%), Transportation & Warehousing (100.0%), and Professional & Scientific (100.0%).
| Industry | Male | Female |
| Agriculture, Fishing & Hunting | 0 (0.0%) | 0 (0.0%) |
| Mining, Quarrying, & Extraction | 2 (100.0%) | 0 (0.0%) |
| Construction | 4 (100.0%) | 0 (0.0%) |
| Manufacturing | 20 (100.0%) | 0 (0.0%) |
| Wholesale Trade | 0 (0.0%) | 0 (0.0%) |
| Retail Trade | 0 (0.0%) | 11 (100.0%) |
| Transportation & Warehousing | 0 (0.0%) | 1 (100.0%) |
| Utilities | 1 (100.0%) | 0 (0.0%) |
| Information | 0 (0.0%) | 0 (0.0%) |
| Finance & Insurance | 0 (0.0%) | 0 (0.0%) |
| Real Estate, Rental & Leasing | 0 (0.0%) | 0 (0.0%) |
| Professional & Scientific | 0 (0.0%) | 3 (100.0%) |
| Enterprise Management | 0 (0.0%) | 0 (0.0%) |
| Administrative & Support | 0 (0.0%) | 0 (0.0%) |
| Educational Services | 0 (0.0%) | 0 (0.0%) |
| Health Care & Social Assistance | 1 (10.0%) | 9 (90.0%) |
| Arts, Entertainment & Recreation | 0 (0.0%) | 0 (0.0%) |
| Accommodation & Food Services | 0 (0.0%) | 4 (100.0%) |
| Public Administration | 2 (100.0%) | 0 (0.0%) |
| Total | 30 (51.7%) | 28 (48.3%) |
Education in Cassandra borough
School Enrollment in Cassandra borough
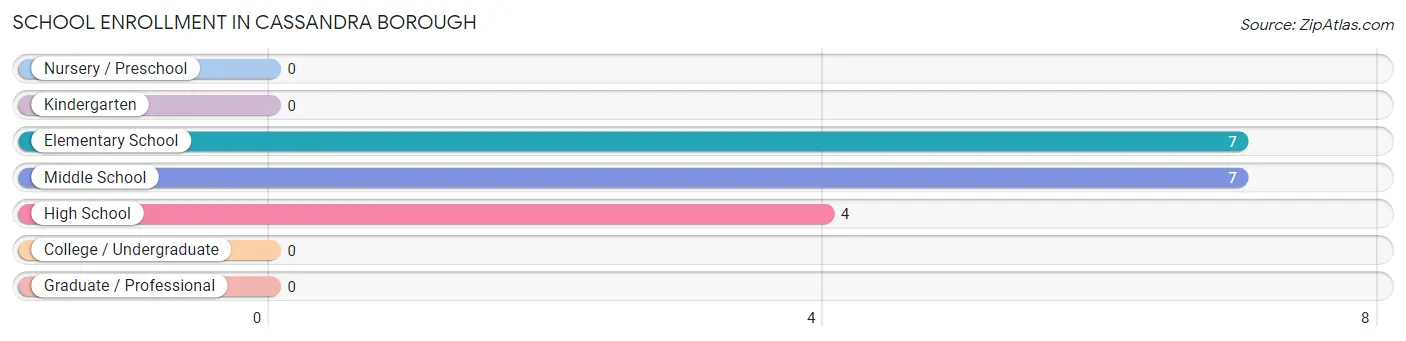
The most common levels of schooling among the 18 students in Cassandra borough are elementary school (7 | 38.9%), middle school (7 | 38.9%), and high school (4 | 22.2%).
| School Level | # Students | % Students |
| Nursery / Preschool | 0 | 0.0% |
| Kindergarten | 0 | 0.0% |
| Elementary School | 7 | 38.9% |
| Middle School | 7 | 38.9% |
| High School | 4 | 22.2% |
| College / Undergraduate | 0 | 0.0% |
| Graduate / Professional | 0 | 0.0% |
| Total | 18 | 100.0% |
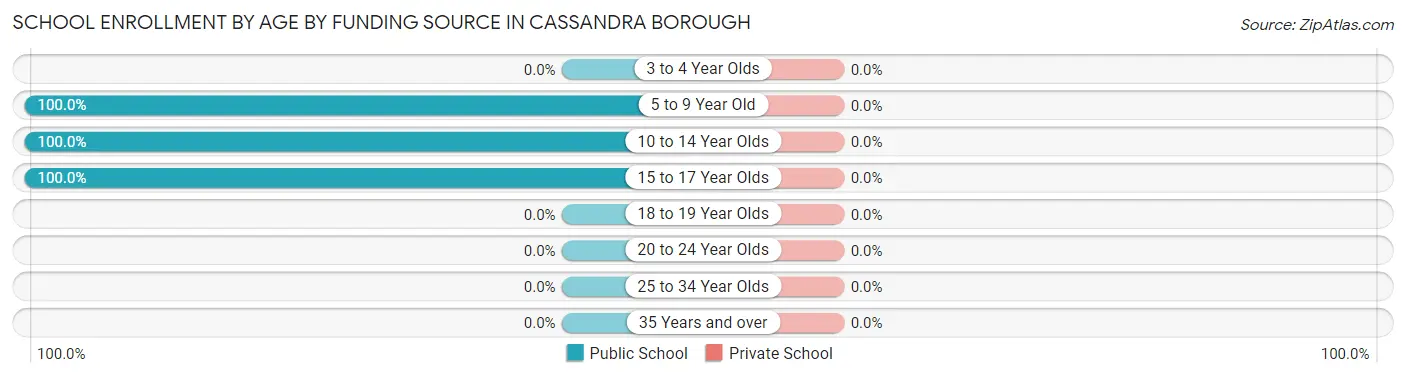
School Enrollment by Age by Funding Source in Cassandra borough
| Age Bracket | Public School | Private School |
| 3 to 4 Year Olds | 0 (0.0%) | 0 (0.0%) |
| 5 to 9 Year Old | 5 (100.0%) | 0 (0.0%) |
| 10 to 14 Year Olds | 9 (100.0%) | 0 (0.0%) |
| 15 to 17 Year Olds | 4 (100.0%) | 0 (0.0%) |
| 18 to 19 Year Olds | 0 (0.0%) | 0 (0.0%) |
| 20 to 24 Year Olds | 0 (0.0%) | 0 (0.0%) |
| 25 to 34 Year Olds | 0 (0.0%) | 0 (0.0%) |
| 35 Years and over | 0 (0.0%) | 0 (0.0%) |
| Total | 18 (100.0%) | 0 (0.0%) |
Educational Attainment by Field of Study in Cassandra borough
Business (4 | 50.0%), psychology (2 | 25.0%), and social sciences (2 | 25.0%) are the most common fields of study among 8 individuals in Cassandra borough who have obtained a bachelor's degree or higher.
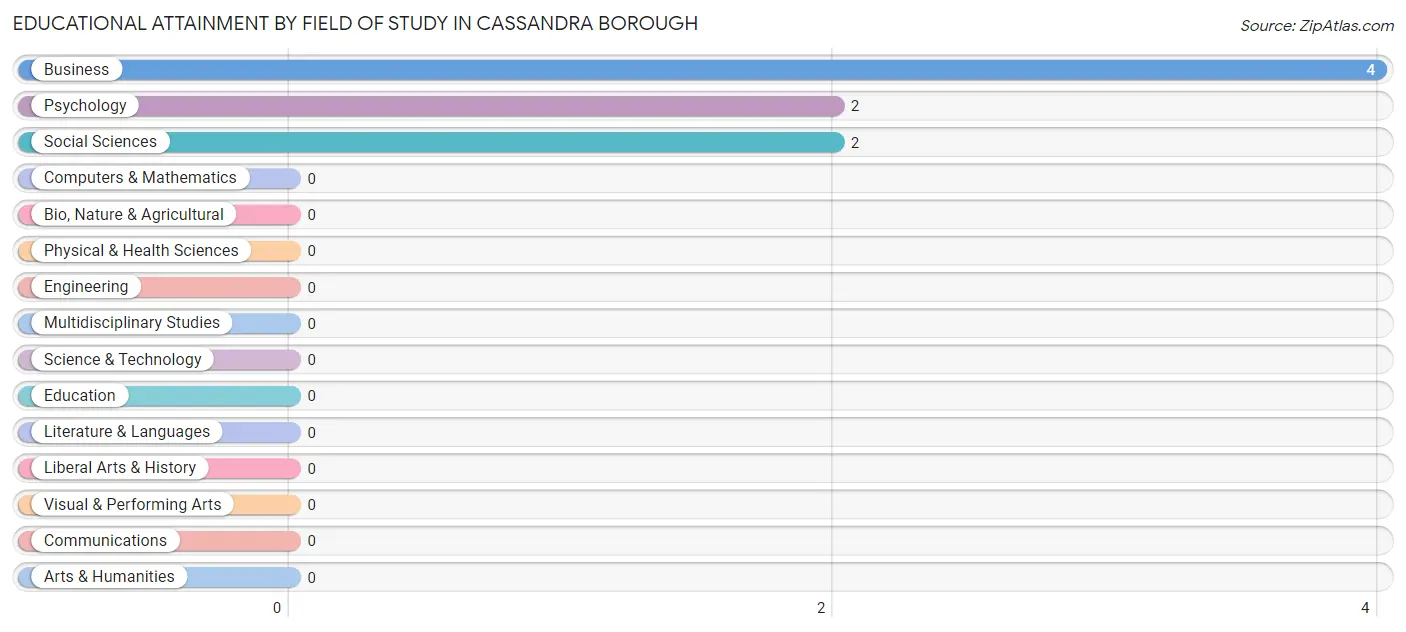
| Field of Study | # Graduates | % Graduates |
| Computers & Mathematics | 0 | 0.0% |
| Bio, Nature & Agricultural | 0 | 0.0% |
| Physical & Health Sciences | 0 | 0.0% |
| Psychology | 2 | 25.0% |
| Social Sciences | 2 | 25.0% |
| Engineering | 0 | 0.0% |
| Multidisciplinary Studies | 0 | 0.0% |
| Science & Technology | 0 | 0.0% |
| Business | 4 | 50.0% |
| Education | 0 | 0.0% |
| Literature & Languages | 0 | 0.0% |
| Liberal Arts & History | 0 | 0.0% |
| Visual & Performing Arts | 0 | 0.0% |
| Communications | 0 | 0.0% |
| Arts & Humanities | 0 | 0.0% |
| Total | 8 | 100.0% |
Transportation & Commute in Cassandra borough
Vehicle Availability by Sex in Cassandra borough
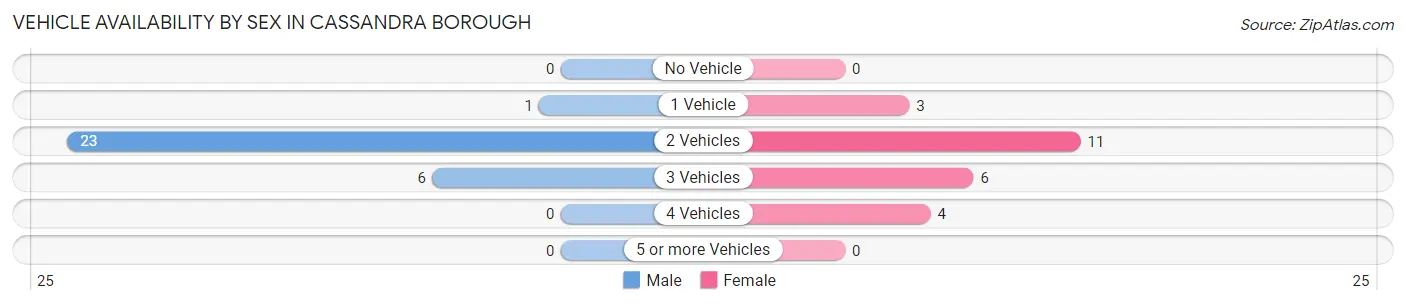
The most prevalent vehicle ownership categories in Cassandra borough are males with 2 vehicles (23, accounting for 76.7%) and females with 2 vehicles (11, making up 95.8%).
| Vehicles Available | Male | Female |
| No Vehicle | 0 (0.0%) | 0 (0.0%) |
| 1 Vehicle | 1 (3.3%) | 3 (12.5%) |
| 2 Vehicles | 23 (76.7%) | 11 (45.8%) |
| 3 Vehicles | 6 (20.0%) | 6 (25.0%) |
| 4 Vehicles | 0 (0.0%) | 4 (16.7%) |
| 5 or more Vehicles | 0 (0.0%) | 0 (0.0%) |
| Total | 30 (100.0%) | 24 (100.0%) |
Commute Time in Cassandra borough
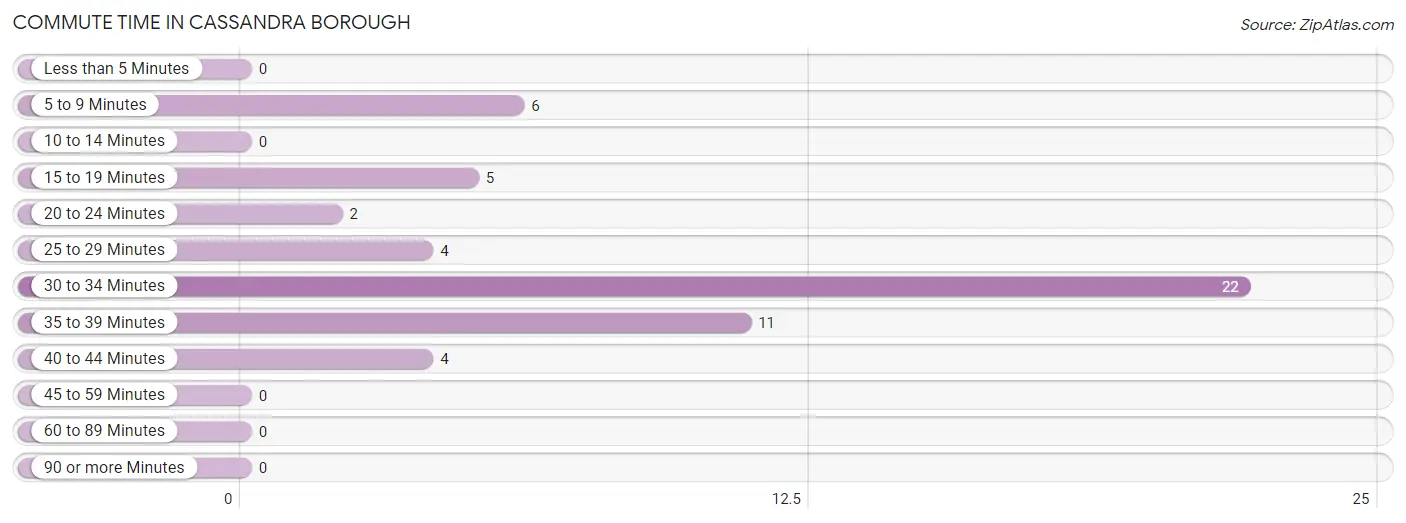
The most frequently occuring commute durations in Cassandra borough are 30 to 34 minutes (22 commuters, 40.7%), 35 to 39 minutes (11 commuters, 20.4%), and 5 to 9 minutes (6 commuters, 11.1%).
| Commute Time | # Commuters | % Commuters |
| Less than 5 Minutes | 0 | 0.0% |
| 5 to 9 Minutes | 6 | 11.1% |
| 10 to 14 Minutes | 0 | 0.0% |
| 15 to 19 Minutes | 5 | 9.3% |
| 20 to 24 Minutes | 2 | 3.7% |
| 25 to 29 Minutes | 4 | 7.4% |
| 30 to 34 Minutes | 22 | 40.7% |
| 35 to 39 Minutes | 11 | 20.4% |
| 40 to 44 Minutes | 4 | 7.4% |
| 45 to 59 Minutes | 0 | 0.0% |
| 60 to 89 Minutes | 0 | 0.0% |
| 90 or more Minutes | 0 | 0.0% |
Commute Time by Sex in Cassandra borough
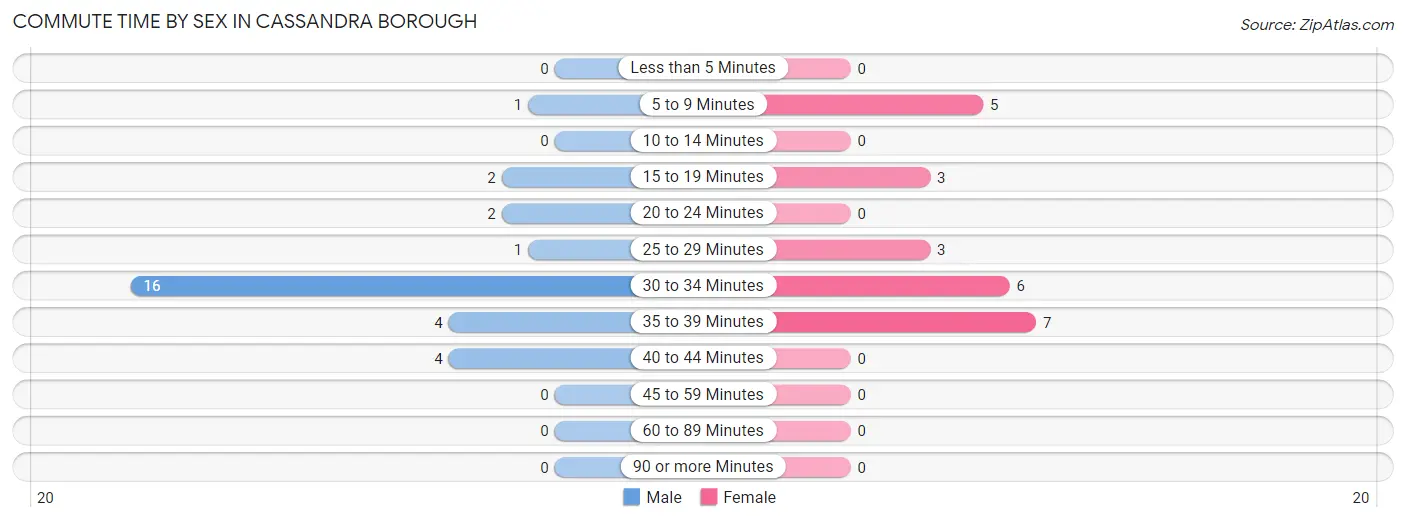
The most common commute times in Cassandra borough are 30 to 34 minutes (16 commuters, 53.3%) for males and 35 to 39 minutes (7 commuters, 29.2%) for females.
| Commute Time | Male | Female |
| Less than 5 Minutes | 0 (0.0%) | 0 (0.0%) |
| 5 to 9 Minutes | 1 (3.3%) | 5 (20.8%) |
| 10 to 14 Minutes | 0 (0.0%) | 0 (0.0%) |
| 15 to 19 Minutes | 2 (6.7%) | 3 (12.5%) |
| 20 to 24 Minutes | 2 (6.7%) | 0 (0.0%) |
| 25 to 29 Minutes | 1 (3.3%) | 3 (12.5%) |
| 30 to 34 Minutes | 16 (53.3%) | 6 (25.0%) |
| 35 to 39 Minutes | 4 (13.3%) | 7 (29.2%) |
| 40 to 44 Minutes | 4 (13.3%) | 0 (0.0%) |
| 45 to 59 Minutes | 0 (0.0%) | 0 (0.0%) |
| 60 to 89 Minutes | 0 (0.0%) | 0 (0.0%) |
| 90 or more Minutes | 0 (0.0%) | 0 (0.0%) |
Time of Departure to Work by Sex in Cassandra borough
The most frequent times of departure to work in Cassandra borough are 6:00 AM to 6:29 AM (16, 53.3%) for males and 7:30 AM to 7:59 AM (8, 33.3%) for females.
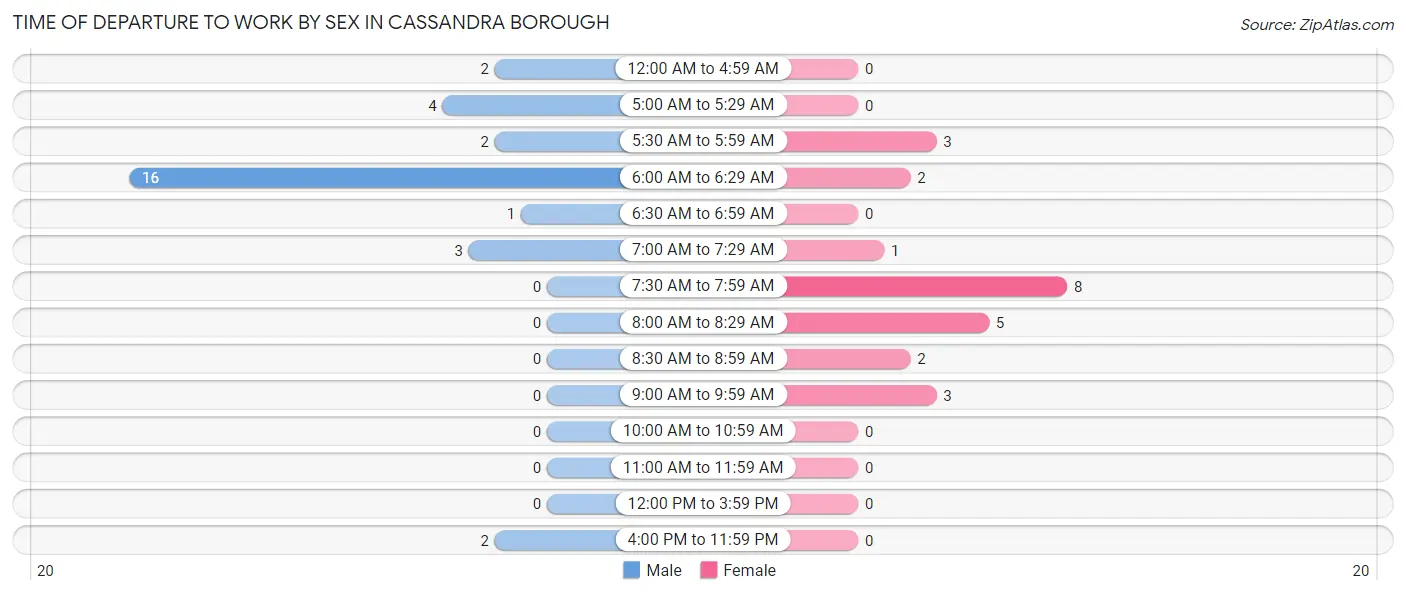
| Time of Departure | Male | Female |
| 12:00 AM to 4:59 AM | 2 (6.7%) | 0 (0.0%) |
| 5:00 AM to 5:29 AM | 4 (13.3%) | 0 (0.0%) |
| 5:30 AM to 5:59 AM | 2 (6.7%) | 3 (12.5%) |
| 6:00 AM to 6:29 AM | 16 (53.3%) | 2 (8.3%) |
| 6:30 AM to 6:59 AM | 1 (3.3%) | 0 (0.0%) |
| 7:00 AM to 7:29 AM | 3 (10.0%) | 1 (4.2%) |
| 7:30 AM to 7:59 AM | 0 (0.0%) | 8 (33.3%) |
| 8:00 AM to 8:29 AM | 0 (0.0%) | 5 (20.8%) |
| 8:30 AM to 8:59 AM | 0 (0.0%) | 2 (8.3%) |
| 9:00 AM to 9:59 AM | 0 (0.0%) | 3 (12.5%) |
| 10:00 AM to 10:59 AM | 0 (0.0%) | 0 (0.0%) |
| 11:00 AM to 11:59 AM | 0 (0.0%) | 0 (0.0%) |
| 12:00 PM to 3:59 PM | 0 (0.0%) | 0 (0.0%) |
| 4:00 PM to 11:59 PM | 2 (6.7%) | 0 (0.0%) |
| Total | 30 (100.0%) | 24 (100.0%) |
Housing Occupancy in Cassandra borough
Occupancy by Ownership in Cassandra borough
Of the total 47 dwellings in Cassandra borough, owner-occupied units account for 36 (76.6%), while renter-occupied units make up 11 (23.4%).
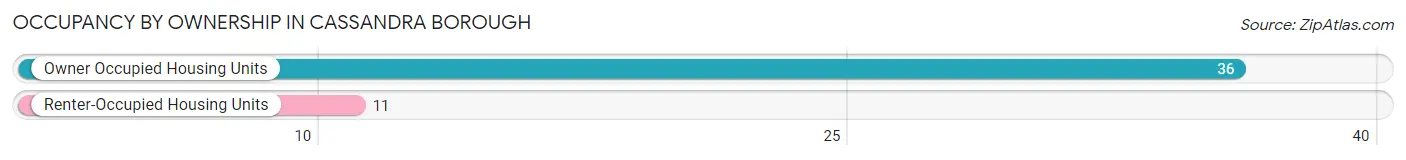
| Occupancy | # Housing Units | % Housing Units |
| Owner Occupied Housing Units | 36 | 76.6% |
| Renter-Occupied Housing Units | 11 | 23.4% |
| Total Occupied Housing Units | 47 | 100.0% |
Occupancy by Household Size in Cassandra borough
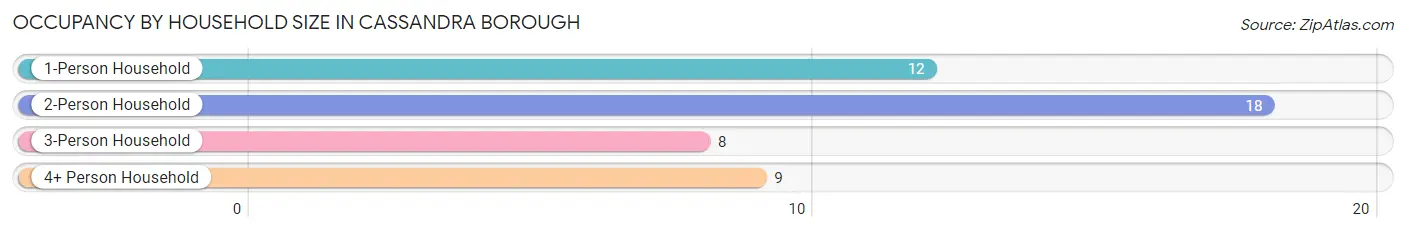
| Household Size | # Housing Units | % Housing Units |
| 1-Person Household | 12 | 25.5% |
| 2-Person Household | 18 | 38.3% |
| 3-Person Household | 8 | 17.0% |
| 4+ Person Household | 9 | 19.2% |
| Total Housing Units | 47 | 100.0% |
Occupancy by Ownership by Household Size in Cassandra borough
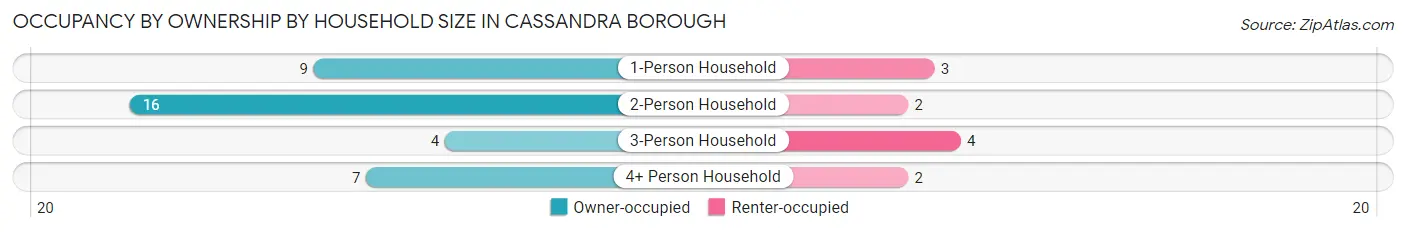
| Household Size | Owner-occupied | Renter-occupied |
| 1-Person Household | 9 (75.0%) | 3 (25.0%) |
| 2-Person Household | 16 (88.9%) | 2 (11.1%) |
| 3-Person Household | 4 (50.0%) | 4 (50.0%) |
| 4+ Person Household | 7 (77.8%) | 2 (22.2%) |
| Total Housing Units | 36 (76.6%) | 11 (23.4%) |
Occupancy by Educational Attainment in Cassandra borough
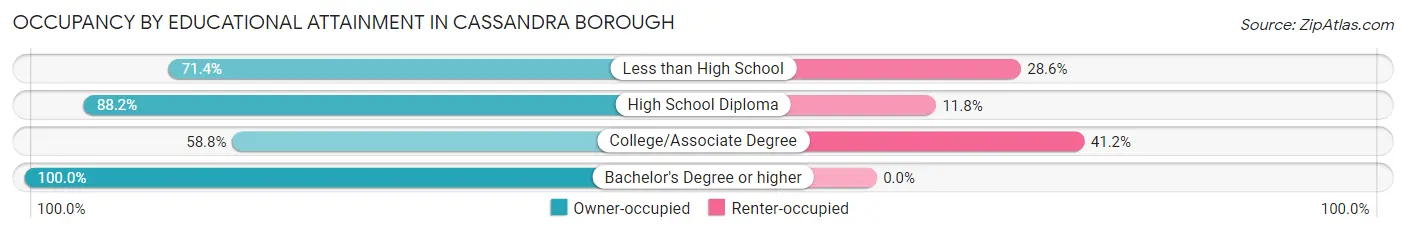
| Household Size | Owner-occupied | Renter-occupied |
| Less than High School | 5 (71.4%) | 2 (28.6%) |
| High School Diploma | 15 (88.2%) | 2 (11.8%) |
| College/Associate Degree | 10 (58.8%) | 7 (41.2%) |
| Bachelor's Degree or higher | 6 (100.0%) | 0 (0.0%) |
Occupancy by Age of Householder in Cassandra borough
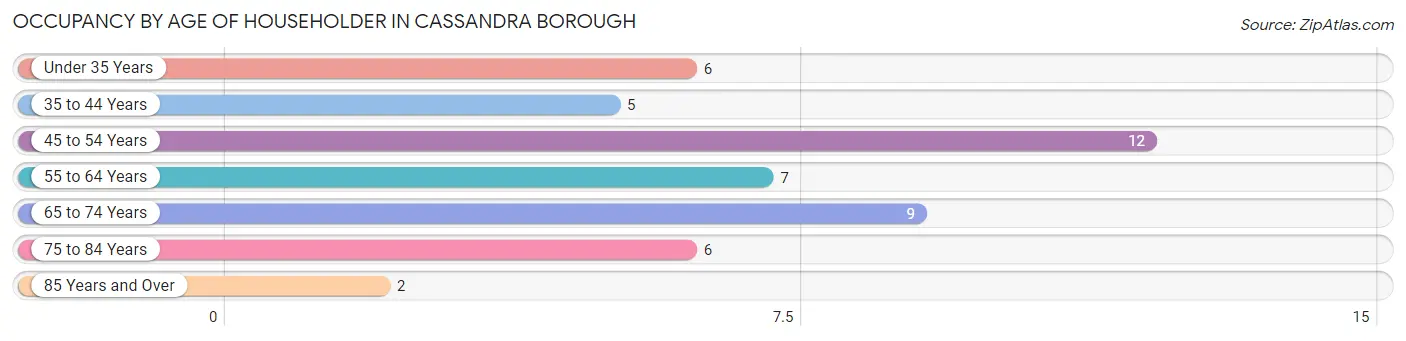
| Age Bracket | # Households | % Households |
| Under 35 Years | 6 | 12.8% |
| 35 to 44 Years | 5 | 10.6% |
| 45 to 54 Years | 12 | 25.5% |
| 55 to 64 Years | 7 | 14.9% |
| 65 to 74 Years | 9 | 19.2% |
| 75 to 84 Years | 6 | 12.8% |
| 85 Years and Over | 2 | 4.3% |
| Total | 47 | 100.0% |
Housing Finances in Cassandra borough
Median Income by Occupancy in Cassandra borough
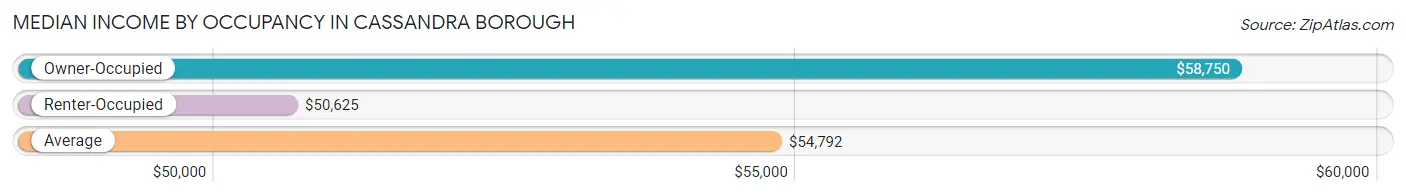
| Occupancy Type | # Households | Median Income |
| Owner-Occupied | 36 (76.6%) | $58,750 |
| Renter-Occupied | 11 (23.4%) | $50,625 |
| Average | 47 (100.0%) | $54,792 |
Occupancy by Householder Income Bracket in Cassandra borough
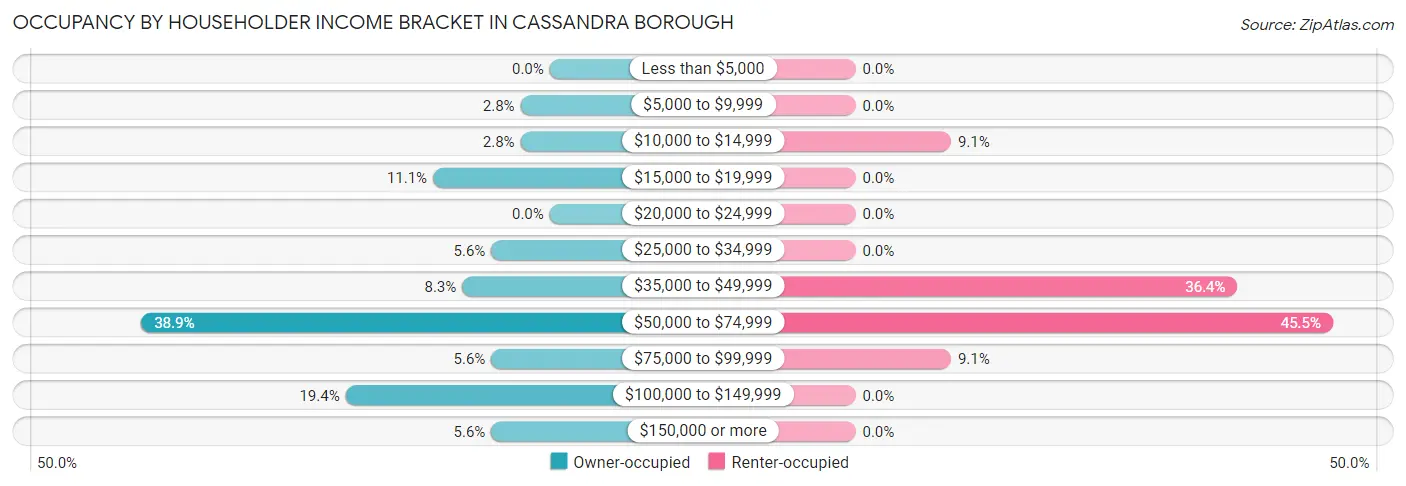
| Income Bracket | Owner-occupied | Renter-occupied |
| Less than $5,000 | 0 (0.0%) | 0 (0.0%) |
| $5,000 to $9,999 | 1 (2.8%) | 0 (0.0%) |
| $10,000 to $14,999 | 1 (2.8%) | 1 (9.1%) |
| $15,000 to $19,999 | 4 (11.1%) | 0 (0.0%) |
| $20,000 to $24,999 | 0 (0.0%) | 0 (0.0%) |
| $25,000 to $34,999 | 2 (5.6%) | 0 (0.0%) |
| $35,000 to $49,999 | 3 (8.3%) | 4 (36.4%) |
| $50,000 to $74,999 | 14 (38.9%) | 5 (45.5%) |
| $75,000 to $99,999 | 2 (5.6%) | 1 (9.1%) |
| $100,000 to $149,999 | 7 (19.4%) | 0 (0.0%) |
| $150,000 or more | 2 (5.6%) | 0 (0.0%) |
| Total | 36 (100.0%) | 11 (100.0%) |
Monthly Housing Cost Tiers in Cassandra borough
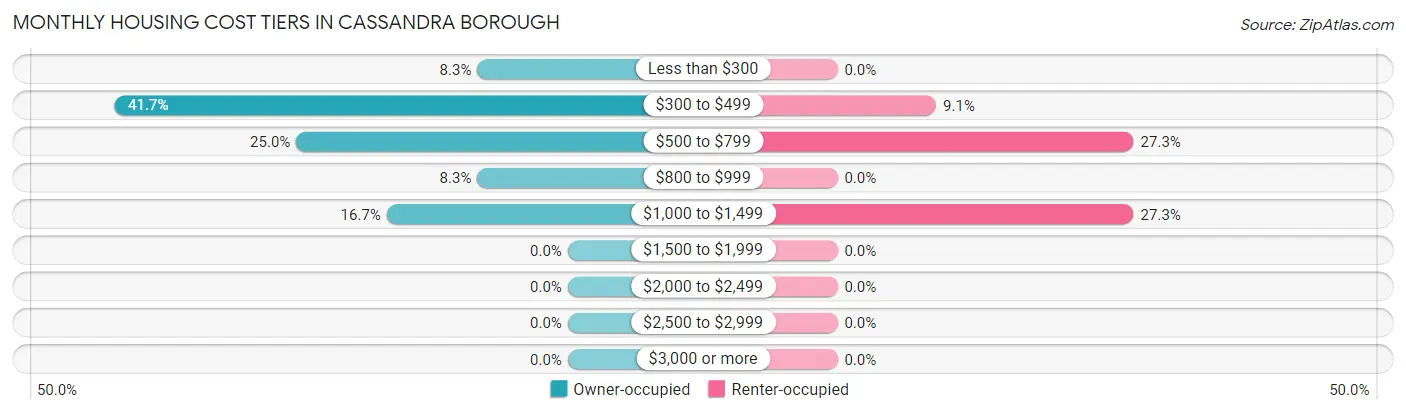
| Monthly Cost | Owner-occupied | Renter-occupied |
| Less than $300 | 3 (8.3%) | 0 (0.0%) |
| $300 to $499 | 15 (41.7%) | 1 (9.1%) |
| $500 to $799 | 9 (25.0%) | 3 (27.3%) |
| $800 to $999 | 3 (8.3%) | 0 (0.0%) |
| $1,000 to $1,499 | 6 (16.7%) | 3 (27.3%) |
| $1,500 to $1,999 | 0 (0.0%) | 0 (0.0%) |
| $2,000 to $2,499 | 0 (0.0%) | 0 (0.0%) |
| $2,500 to $2,999 | 0 (0.0%) | 0 (0.0%) |
| $3,000 or more | 0 (0.0%) | 0 (0.0%) |
| Total | 36 (100.0%) | 11 (100.0%) |
Physical Housing Characteristics in Cassandra borough
Housing Structures in Cassandra borough
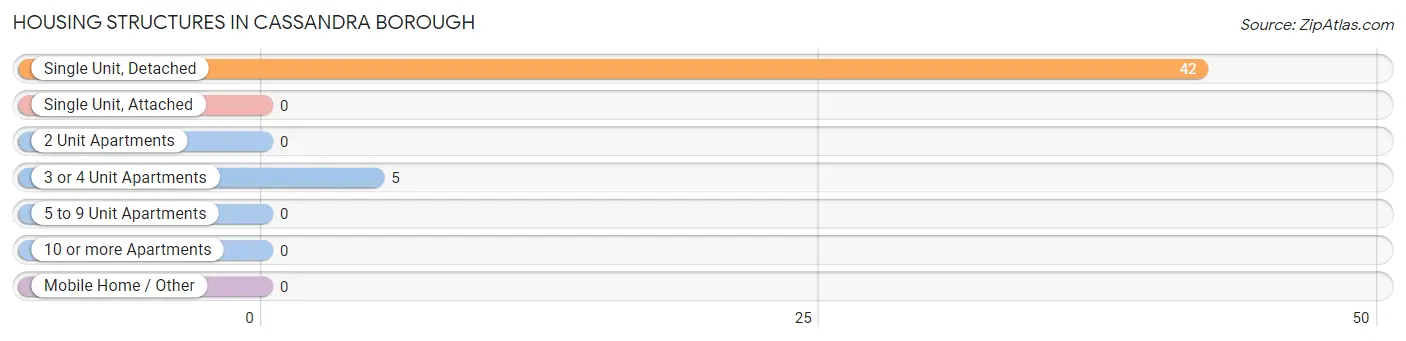
| Structure Type | # Housing Units | % Housing Units |
| Single Unit, Detached | 42 | 89.4% |
| Single Unit, Attached | 0 | 0.0% |
| 2 Unit Apartments | 0 | 0.0% |
| 3 or 4 Unit Apartments | 5 | 10.6% |
| 5 to 9 Unit Apartments | 0 | 0.0% |
| 10 or more Apartments | 0 | 0.0% |
| Mobile Home / Other | 0 | 0.0% |
| Total | 47 | 100.0% |
Housing Structures by Occupancy in Cassandra borough
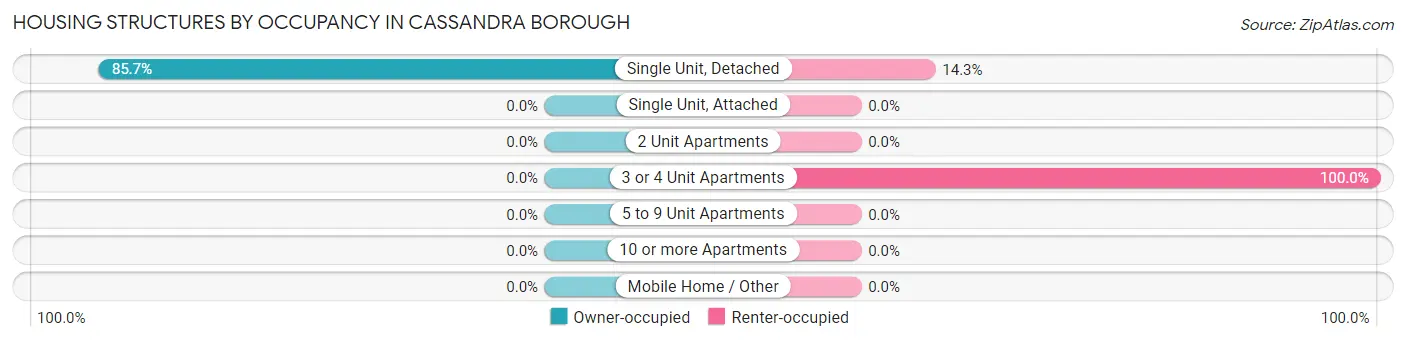
| Structure Type | Owner-occupied | Renter-occupied |
| Single Unit, Detached | 36 (85.7%) | 6 (14.3%) |
| Single Unit, Attached | 0 (0.0%) | 0 (0.0%) |
| 2 Unit Apartments | 0 (0.0%) | 0 (0.0%) |
| 3 or 4 Unit Apartments | 0 (0.0%) | 5 (100.0%) |
| 5 to 9 Unit Apartments | 0 (0.0%) | 0 (0.0%) |
| 10 or more Apartments | 0 (0.0%) | 0 (0.0%) |
| Mobile Home / Other | 0 (0.0%) | 0 (0.0%) |
| Total | 36 (76.6%) | 11 (23.4%) |
Housing Structures by Number of Rooms in Cassandra borough
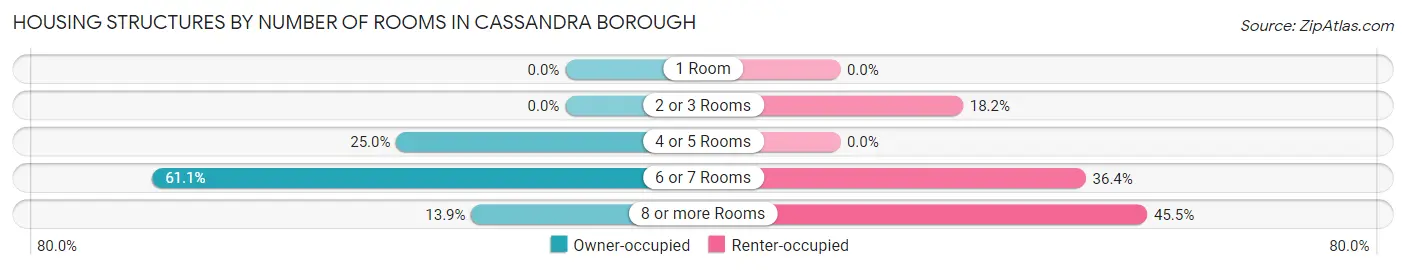
| Number of Rooms | Owner-occupied | Renter-occupied |
| 1 Room | 0 (0.0%) | 0 (0.0%) |
| 2 or 3 Rooms | 0 (0.0%) | 2 (18.2%) |
| 4 or 5 Rooms | 9 (25.0%) | 0 (0.0%) |
| 6 or 7 Rooms | 22 (61.1%) | 4 (36.4%) |
| 8 or more Rooms | 5 (13.9%) | 5 (45.5%) |
| Total | 36 (100.0%) | 11 (100.0%) |
Housing Structure by Heating Type in Cassandra borough
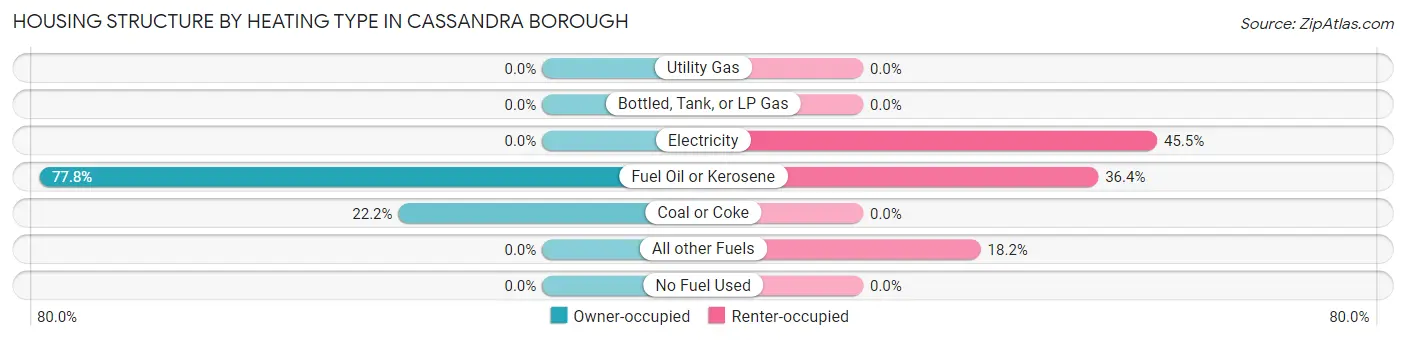
| Heating Type | Owner-occupied | Renter-occupied |
| Utility Gas | 0 (0.0%) | 0 (0.0%) |
| Bottled, Tank, or LP Gas | 0 (0.0%) | 0 (0.0%) |
| Electricity | 0 (0.0%) | 5 (45.5%) |
| Fuel Oil or Kerosene | 28 (77.8%) | 4 (36.4%) |
| Coal or Coke | 8 (22.2%) | 0 (0.0%) |
| All other Fuels | 0 (0.0%) | 2 (18.2%) |
| No Fuel Used | 0 (0.0%) | 0 (0.0%) |
| Total | 36 (100.0%) | 11 (100.0%) |
Household Vehicle Usage in Cassandra borough
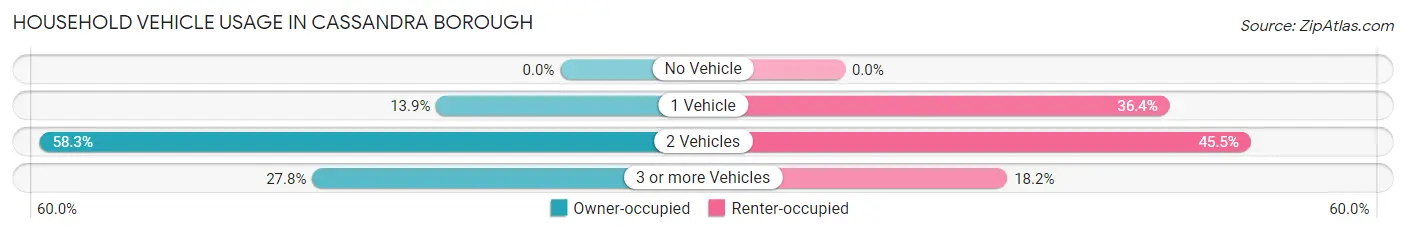
| Vehicles per Household | Owner-occupied | Renter-occupied |
| No Vehicle | 0 (0.0%) | 0 (0.0%) |
| 1 Vehicle | 5 (13.9%) | 4 (36.4%) |
| 2 Vehicles | 21 (58.3%) | 5 (45.5%) |
| 3 or more Vehicles | 10 (27.8%) | 2 (18.2%) |
| Total | 36 (100.0%) | 11 (100.0%) |
Real Estate & Mortgages in Cassandra borough
Real Estate and Mortgage Overview in Cassandra borough
| Characteristic | Without Mortgage | With Mortgage |
| Housing Units | 21 | 15 |
| Median Property Value | $95,800 | $65,000 |
| Median Household Income | $54,250 | $0 |
| Monthly Housing Costs | $442 | $0 |
| Real Estate Taxes | $1,036 | $0 |
Property Value by Mortgage Status in Cassandra borough
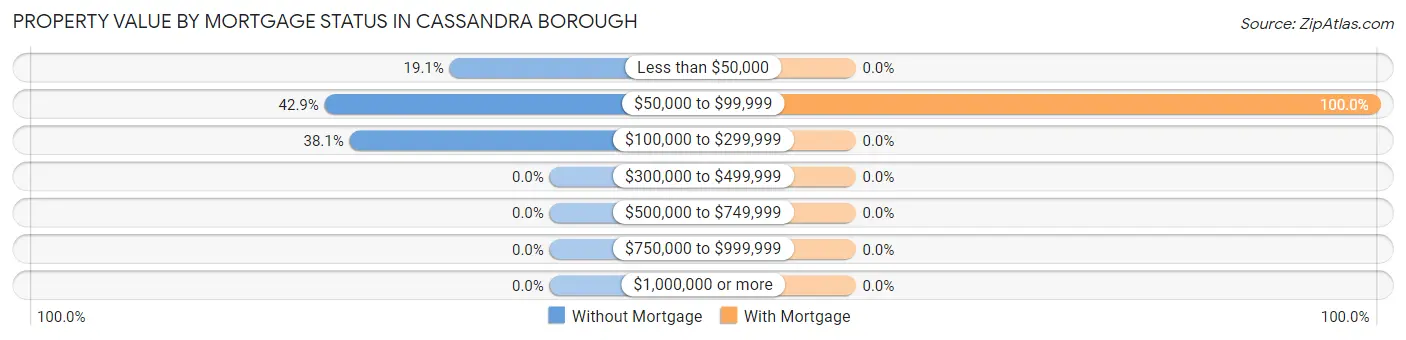
| Property Value | Without Mortgage | With Mortgage |
| Less than $50,000 | 4 (19.1%) | 0 (0.0%) |
| $50,000 to $99,999 | 9 (42.9%) | 15 (100.0%) |
| $100,000 to $299,999 | 8 (38.1%) | 0 (0.0%) |
| $300,000 to $499,999 | 0 (0.0%) | 0 (0.0%) |
| $500,000 to $749,999 | 0 (0.0%) | 0 (0.0%) |
| $750,000 to $999,999 | 0 (0.0%) | 0 (0.0%) |
| $1,000,000 or more | 0 (0.0%) | 0 (0.0%) |
| Total | 21 (100.0%) | 15 (100.0%) |
Household Income by Mortgage Status in Cassandra borough
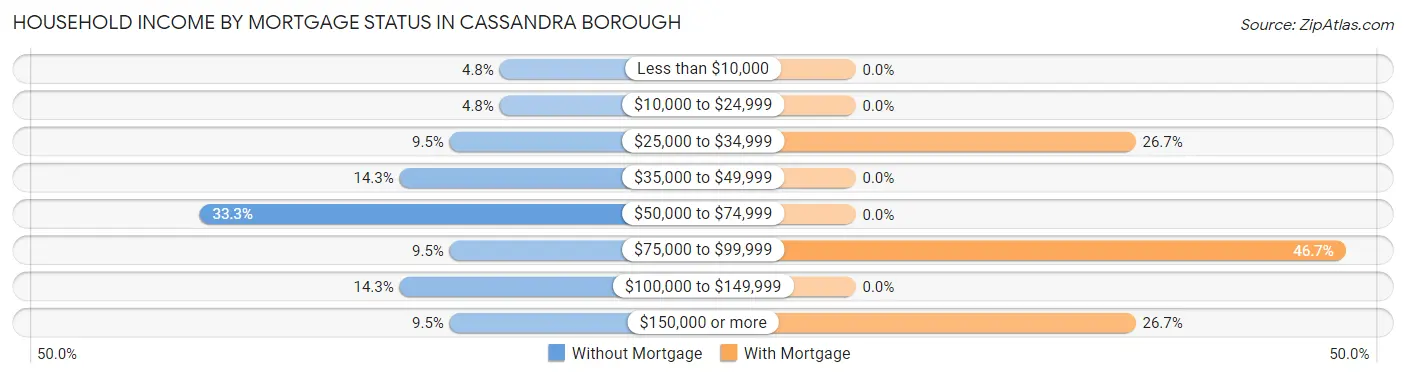
| Household Income | Without Mortgage | With Mortgage |
| Less than $10,000 | 1 (4.8%) | 0 (0.0%) |
| $10,000 to $24,999 | 1 (4.8%) | 0 (0.0%) |
| $25,000 to $34,999 | 2 (9.5%) | 4 (26.7%) |
| $35,000 to $49,999 | 3 (14.3%) | 0 (0.0%) |
| $50,000 to $74,999 | 7 (33.3%) | 0 (0.0%) |
| $75,000 to $99,999 | 2 (9.5%) | 7 (46.7%) |
| $100,000 to $149,999 | 3 (14.3%) | 0 (0.0%) |
| $150,000 or more | 2 (9.5%) | 4 (26.7%) |
| Total | 21 (100.0%) | 15 (100.0%) |
Property Value to Household Income Ratio in Cassandra borough
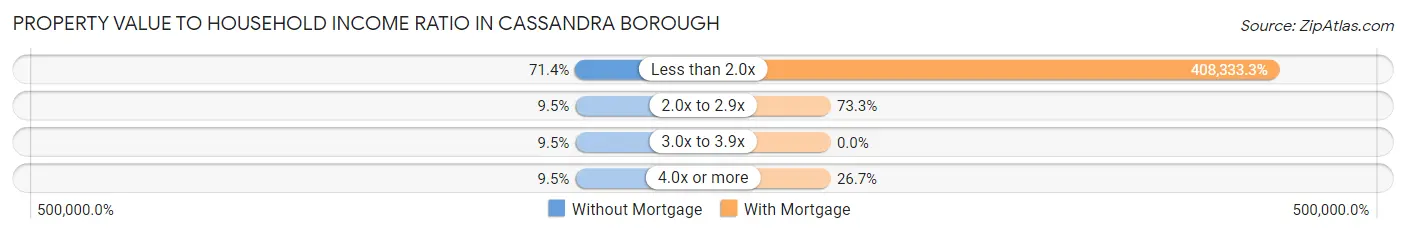
| Value-to-Income Ratio | Without Mortgage | With Mortgage |
| Less than 2.0x | 15 (71.4%) | 61,250 (408,333.3%) |
| 2.0x to 2.9x | 2 (9.5%) | 11 (73.3%) |
| 3.0x to 3.9x | 2 (9.5%) | 0 (0.0%) |
| 4.0x or more | 2 (9.5%) | 4 (26.7%) |
| Total | 21 (100.0%) | 15 (100.0%) |
Real Estate Taxes by Mortgage Status in Cassandra borough
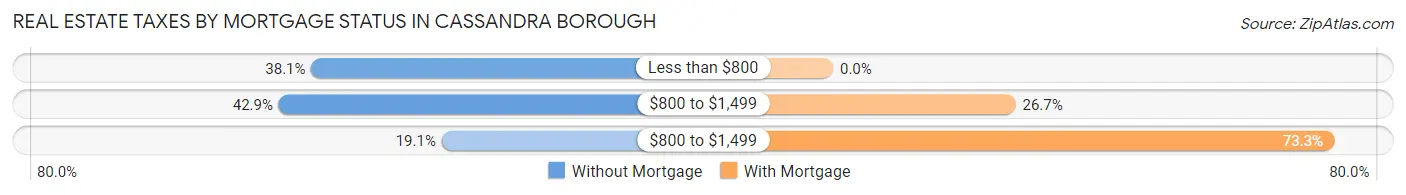
| Property Taxes | Without Mortgage | With Mortgage |
| Less than $800 | 8 (38.1%) | 0 (0.0%) |
| $800 to $1,499 | 9 (42.9%) | 4 (26.7%) |
| $800 to $1,499 | 4 (19.1%) | 11 (73.3%) |
| Total | 21 (100.0%) | 15 (100.0%) |
Health & Disability in Cassandra borough
Health Insurance Coverage by Age in Cassandra borough
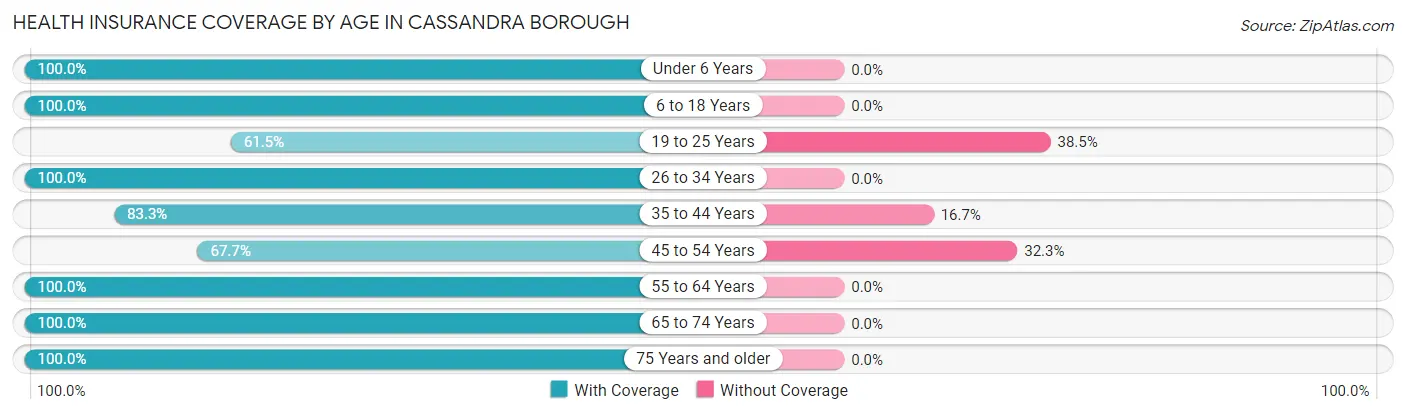
| Age Bracket | With Coverage | Without Coverage |
| Under 6 Years | 4 (100.0%) | 0 (0.0%) |
| 6 to 18 Years | 18 (100.0%) | 0 (0.0%) |
| 19 to 25 Years | 8 (61.5%) | 5 (38.5%) |
| 26 to 34 Years | 7 (100.0%) | 0 (0.0%) |
| 35 to 44 Years | 10 (83.3%) | 2 (16.7%) |
| 45 to 54 Years | 21 (67.7%) | 10 (32.3%) |
| 55 to 64 Years | 10 (100.0%) | 0 (0.0%) |
| 65 to 74 Years | 12 (100.0%) | 0 (0.0%) |
| 75 Years and older | 13 (100.0%) | 0 (0.0%) |
| Total | 103 (85.8%) | 17 (14.2%) |
Health Insurance Coverage by Citizenship Status in Cassandra borough
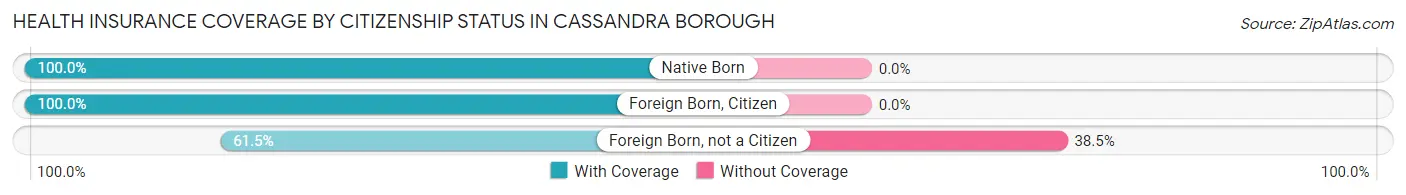
| Citizenship Status | With Coverage | Without Coverage |
| Native Born | 4 (100.0%) | 0 (0.0%) |
| Foreign Born, Citizen | 18 (100.0%) | 0 (0.0%) |
| Foreign Born, not a Citizen | 8 (61.5%) | 5 (38.5%) |
Health Insurance Coverage by Household Income in Cassandra borough
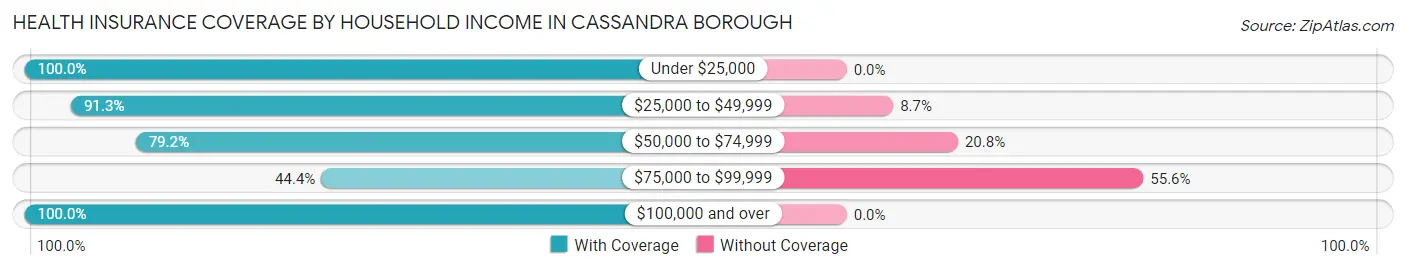
| Household Income | With Coverage | Without Coverage |
| Under $25,000 | 7 (100.0%) | 0 (0.0%) |
| $25,000 to $49,999 | 21 (91.3%) | 2 (8.7%) |
| $50,000 to $74,999 | 38 (79.2%) | 10 (20.8%) |
| $75,000 to $99,999 | 4 (44.4%) | 5 (55.6%) |
| $100,000 and over | 33 (100.0%) | 0 (0.0%) |
Public vs Private Health Insurance Coverage by Age in Cassandra borough
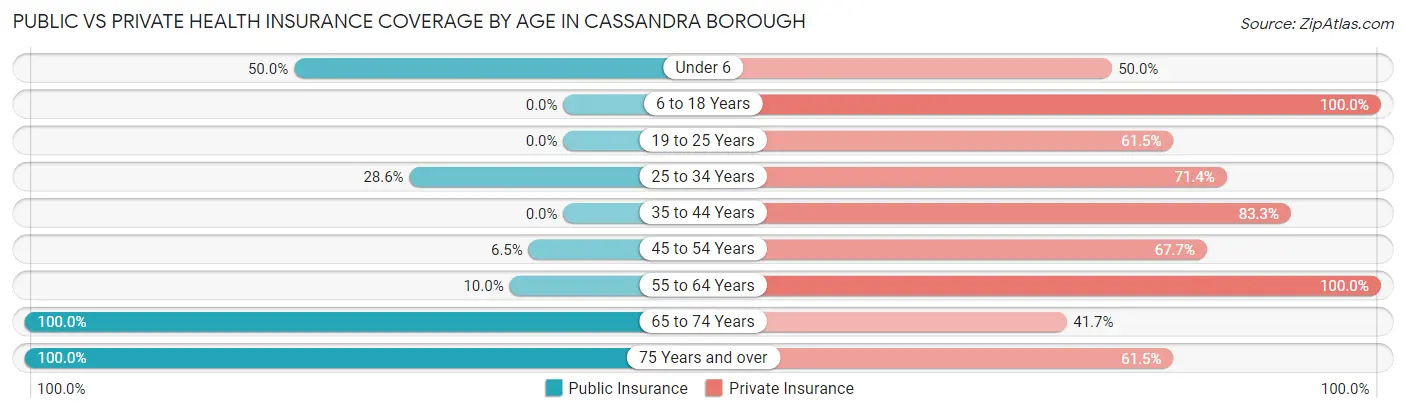
| Age Bracket | Public Insurance | Private Insurance |
| Under 6 | 2 (50.0%) | 2 (50.0%) |
| 6 to 18 Years | 0 (0.0%) | 18 (100.0%) |
| 19 to 25 Years | 0 (0.0%) | 8 (61.5%) |
| 25 to 34 Years | 2 (28.6%) | 5 (71.4%) |
| 35 to 44 Years | 0 (0.0%) | 10 (83.3%) |
| 45 to 54 Years | 2 (6.5%) | 21 (67.7%) |
| 55 to 64 Years | 1 (10.0%) | 10 (100.0%) |
| 65 to 74 Years | 12 (100.0%) | 5 (41.7%) |
| 75 Years and over | 13 (100.0%) | 8 (61.5%) |
| Total | 32 (26.7%) | 87 (72.5%) |
Disability Status by Sex by Age in Cassandra borough
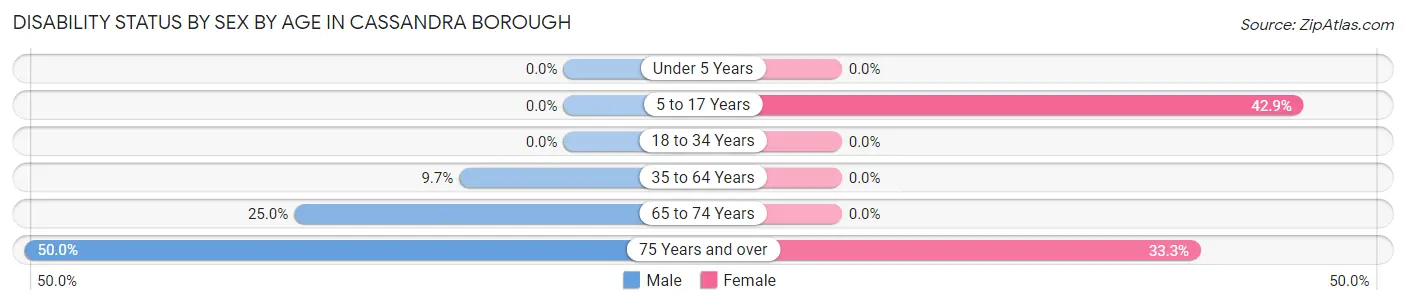
| Age Bracket | Male | Female |
| Under 5 Years | 0 (0.0%) | 0 (0.0%) |
| 5 to 17 Years | 0 (0.0%) | 3 (42.9%) |
| 18 to 34 Years | 0 (0.0%) | 0 (0.0%) |
| 35 to 64 Years | 3 (9.7%) | 0 (0.0%) |
| 65 to 74 Years | 1 (25.0%) | 0 (0.0%) |
| 75 Years and over | 2 (50.0%) | 3 (33.3%) |
Disability Class by Sex by Age in Cassandra borough
Disability Class: Hearing Difficulty
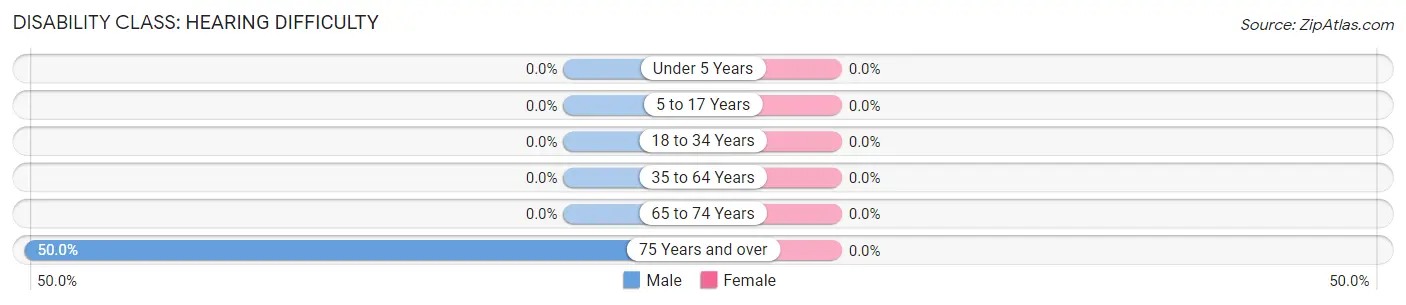
| Age Bracket | Male | Female |
| Under 5 Years | 0 (0.0%) | 0 (0.0%) |
| 5 to 17 Years | 0 (0.0%) | 0 (0.0%) |
| 18 to 34 Years | 0 (0.0%) | 0 (0.0%) |
| 35 to 64 Years | 0 (0.0%) | 0 (0.0%) |
| 65 to 74 Years | 0 (0.0%) | 0 (0.0%) |
| 75 Years and over | 2 (50.0%) | 0 (0.0%) |
Disability Class: Vision Difficulty
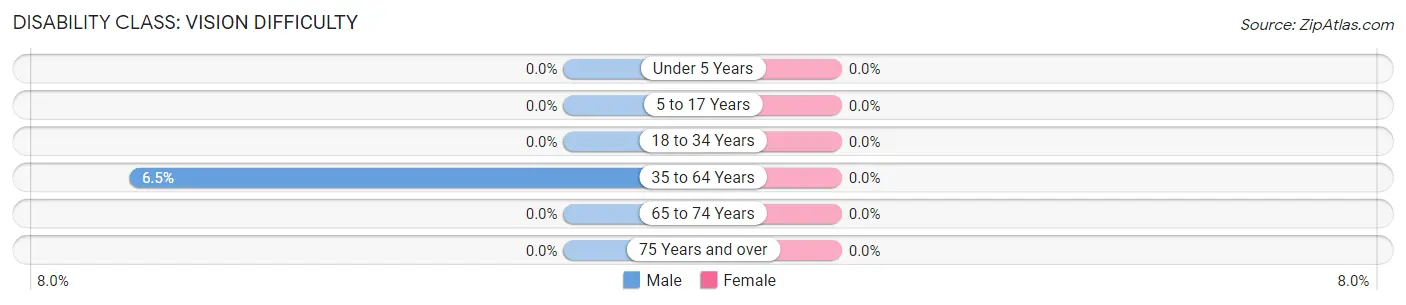
| Age Bracket | Male | Female |
| Under 5 Years | 0 (0.0%) | 0 (0.0%) |
| 5 to 17 Years | 0 (0.0%) | 0 (0.0%) |
| 18 to 34 Years | 0 (0.0%) | 0 (0.0%) |
| 35 to 64 Years | 2 (6.5%) | 0 (0.0%) |
| 65 to 74 Years | 0 (0.0%) | 0 (0.0%) |
| 75 Years and over | 0 (0.0%) | 0 (0.0%) |
Disability Class: Cognitive Difficulty
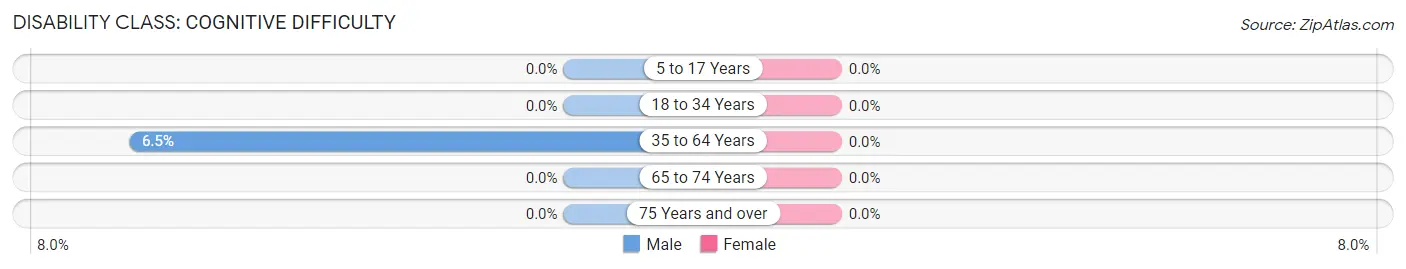
| Age Bracket | Male | Female |
| 5 to 17 Years | 0 (0.0%) | 0 (0.0%) |
| 18 to 34 Years | 0 (0.0%) | 0 (0.0%) |
| 35 to 64 Years | 2 (6.5%) | 0 (0.0%) |
| 65 to 74 Years | 0 (0.0%) | 0 (0.0%) |
| 75 Years and over | 0 (0.0%) | 0 (0.0%) |
Disability Class: Ambulatory Difficulty
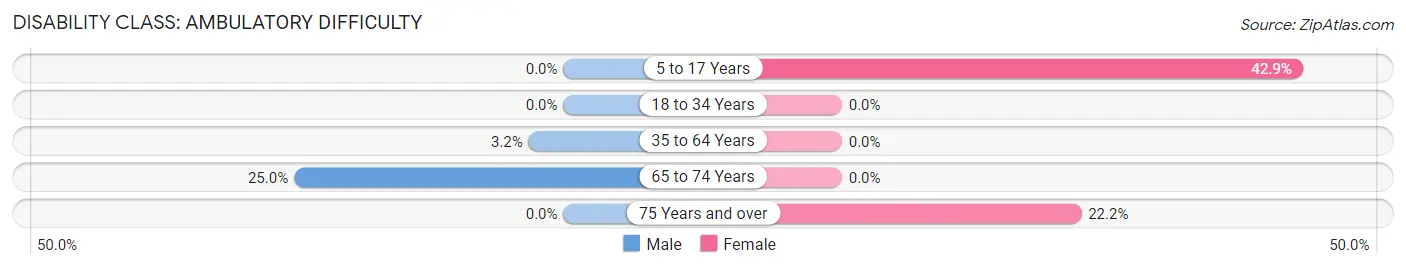
| Age Bracket | Male | Female |
| 5 to 17 Years | 0 (0.0%) | 3 (42.9%) |
| 18 to 34 Years | 0 (0.0%) | 0 (0.0%) |
| 35 to 64 Years | 1 (3.2%) | 0 (0.0%) |
| 65 to 74 Years | 1 (25.0%) | 0 (0.0%) |
| 75 Years and over | 0 (0.0%) | 2 (22.2%) |
Disability Class: Self-Care Difficulty
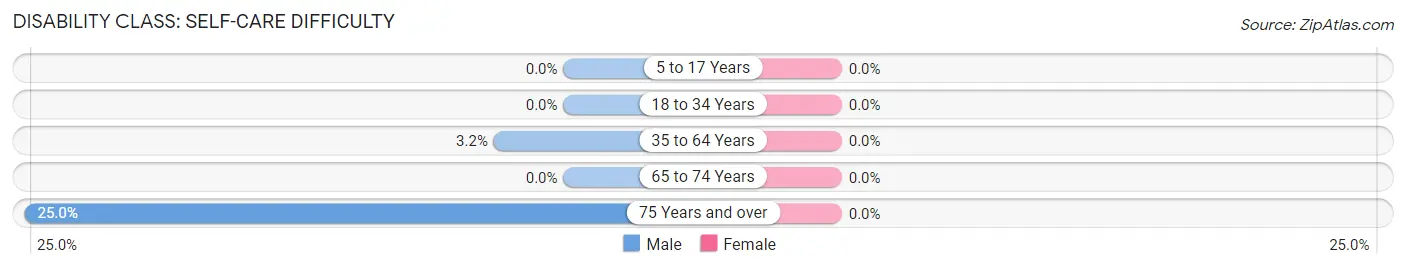
| Age Bracket | Male | Female |
| 5 to 17 Years | 0 (0.0%) | 0 (0.0%) |
| 18 to 34 Years | 0 (0.0%) | 0 (0.0%) |
| 35 to 64 Years | 1 (3.2%) | 0 (0.0%) |
| 65 to 74 Years | 0 (0.0%) | 0 (0.0%) |
| 75 Years and over | 1 (25.0%) | 0 (0.0%) |
Technology Access in Cassandra borough
Computing Device Access in Cassandra borough
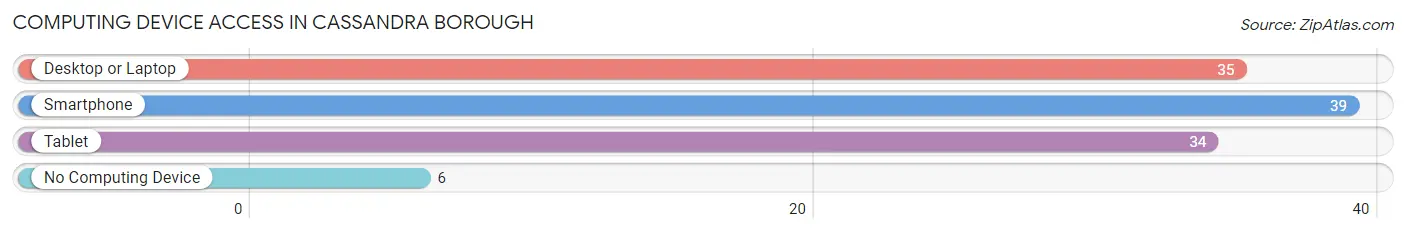
| Device Type | # Households | % Households |
| Desktop or Laptop | 35 | 74.5% |
| Smartphone | 39 | 83.0% |
| Tablet | 34 | 72.3% |
| No Computing Device | 6 | 12.8% |
| Total | 47 | 100.0% |
Internet Access in Cassandra borough
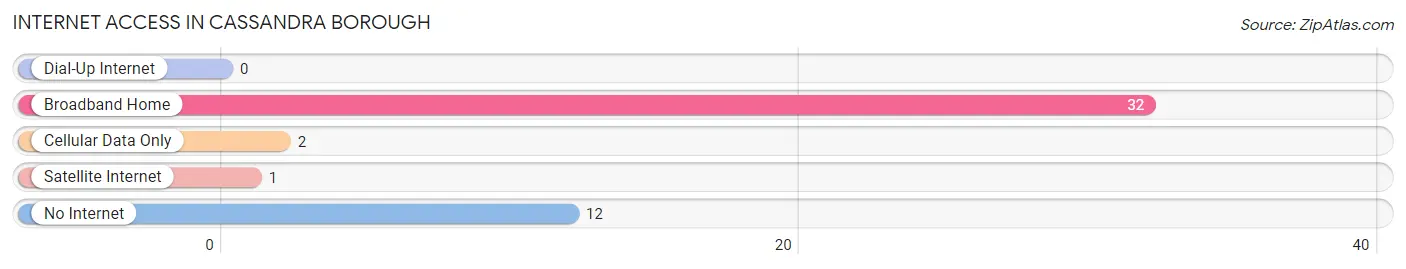
| Internet Type | # Households | % Households |
| Dial-Up Internet | 0 | 0.0% |
| Broadband Home | 32 | 68.1% |
| Cellular Data Only | 2 | 4.3% |
| Satellite Internet | 1 | 2.1% |
| No Internet | 12 | 25.5% |
| Total | 47 | 100.0% |
Cassandra borough Summary
Cassandra Borough is a small borough located in the state of Pennsylvania. It is situated in the southwestern corner of the state, in the Allegheny Mountains region. The borough is bordered by the towns of Donegal, Stonycreek, and Jenner. The population of Cassandra Borough was 1,845 as of the 2010 census.
History
The area that is now Cassandra Borough was first settled in the late 1700s by German and Scots-Irish immigrants. The borough was officially incorporated in 1845. The name of the borough is derived from the Greek mythological figure Cassandra, who was known for her prophetic powers.
The borough was an important center of industry in the late 19th and early 20th centuries. The borough was home to several coal mines, as well as a number of factories that produced glass, steel, and other products. The borough also had a thriving agricultural sector, with many farms producing dairy, poultry, and other products.
Geography
Cassandra Borough is located in the southwestern corner of Pennsylvania, in the Allegheny Mountains region. The borough is bordered by the towns of Donegal, Stonycreek, and Jenner. The borough is situated in a valley, with the Allegheny Mountains to the east and the Laurel Highlands to the west. The borough is located approximately 50 miles south of Pittsburgh.
The borough has a total area of 1.2 square miles, all of which is land. The borough is located at an elevation of 1,400 feet above sea level. The borough is located in a humid continental climate zone, with cold winters and hot, humid summers.
Economy
The economy of Cassandra Borough is largely based on tourism and agriculture. The borough is home to several tourist attractions, including the historic Donegal Inn and the Donegal Covered Bridge. The borough is also home to several farms, which produce dairy, poultry, and other products.
The borough is also home to several small businesses, including restaurants, retail stores, and service providers. The borough is also home to a number of manufacturing companies, which produce glass, steel, and other products.
Demographics
As of the 2010 census, the population of Cassandra Borough was 1,845. The racial makeup of the borough was 97.3% White, 0.9% African American, 0.2% Native American, 0.3% Asian, and 1.3% from other races. Hispanic or Latino of any race were 1.3% of the population.
The median household income in the borough was $41,250, and the median family income was $50,000. The per capita income in the borough was $20,845. About 11.3% of the population was below the poverty line.
Common Questions
What is Per Capita Income in Cassandra borough?
Per Capita income in Cassandra borough is $30,027.
What is the Median Family Income in Cassandra borough?
Median Family Income in Cassandra borough is $63,750.
What is the Median Household income in Cassandra borough?
Median Household Income in Cassandra borough is $54,792.
What is Income or Wage Gap in Cassandra borough?
Income or Wage Gap in Cassandra borough is 4.8%.
Women in Cassandra borough earn 95.2 cents for every dollar earned by a man.
What is Inequality or Gini Index in Cassandra borough?
Inequality or Gini Index in Cassandra borough is 0.37.
What is the Total Population of Cassandra borough?
Total Population of Cassandra borough is 120.
What is the Total Male Population of Cassandra borough?
Total Male Population of Cassandra borough is 63.
What is the Total Female Population of Cassandra borough?
Total Female Population of Cassandra borough is 57.
What is the Ratio of Males per 100 Females in Cassandra borough?
There are 110.53 Males per 100 Females in Cassandra borough.
What is the Ratio of Females per 100 Males in Cassandra borough?
There are 90.48 Females per 100 Males in Cassandra borough.
What is the Median Population Age in Cassandra borough?
Median Population Age in Cassandra borough is 45.6 Years.
What is the Average Family Size in Cassandra borough
Average Family Size in Cassandra borough is 3.0 People.
What is the Average Household Size in Cassandra borough
Average Household Size in Cassandra borough is 2.5 People.
How Large is the Labor Force in Cassandra borough?
There are 64 People in the Labor Forcein in Cassandra borough.
What is the Percentage of People in the Labor Force in Cassandra borough?
62.7% of People are in the Labor Force in Cassandra borough.
What is the Unemployment Rate in Cassandra borough?
Unemployment Rate in Cassandra borough is 9.4%.