Oklahoma, PA Map & Demographics
Oklahoma Map
Oklahoma Overview
$36,214
PER CAPITA INCOME
$56,595
AVG FAMILY INCOME
$57,284
AVG HOUSEHOLD INCOME
54.7%
WAGE / INCOME GAP [ % ]
45.3¢/ $1
WAGE / INCOME GAP [ $ ]
0.51
INEQUALITY / GINI INDEX
1,366
TOTAL POPULATION
698
MALE POPULATION
668
FEMALE POPULATION
104.49
MALES / 100 FEMALES
95.70
FEMALES / 100 MALES
32.7
MEDIAN AGE
3.3
AVG FAMILY SIZE
3.0
AVG HOUSEHOLD SIZE
626
LABOR FORCE [ PEOPLE ]
65.0%
PERCENT IN LABOR FORCE
Income in Oklahoma
Income Overview in Oklahoma
Per Capita Income in Oklahoma is $36,214, while median incomes of families and households are $56,595 and $57,284 respectively.
| Characteristic | Number | Measure |
| Per Capita Income | 1,366 | $36,214 |
| Median Family Income | 375 | $56,595 |
| Mean Family Income | 375 | $101,119 |
| Median Household Income | 453 | $57,284 |
| Mean Household Income | 453 | $93,795 |
| Income Deficit | 375 | $0 |
| Wage / Income Gap (%) | 1,366 | 54.73% |
| Wage / Income Gap ($) | 1,366 | 45.27¢ per $1 |
| Gini / Inequality Index | 1,366 | 0.51 |
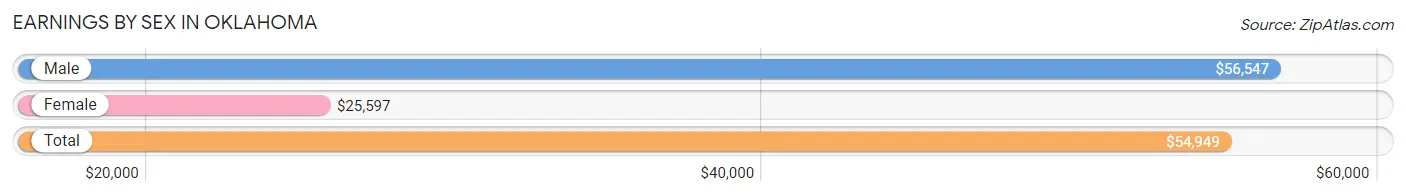
Earnings by Sex in Oklahoma
Average Earnings in Oklahoma are $54,949, $56,547 for men and $25,597 for women, a difference of 54.7%.
| Sex | Number | Average Earnings |
| Male | 349 (55.4%) | $56,547 |
| Female | 281 (44.6%) | $25,597 |
| Total | 630 (100.0%) | $54,949 |
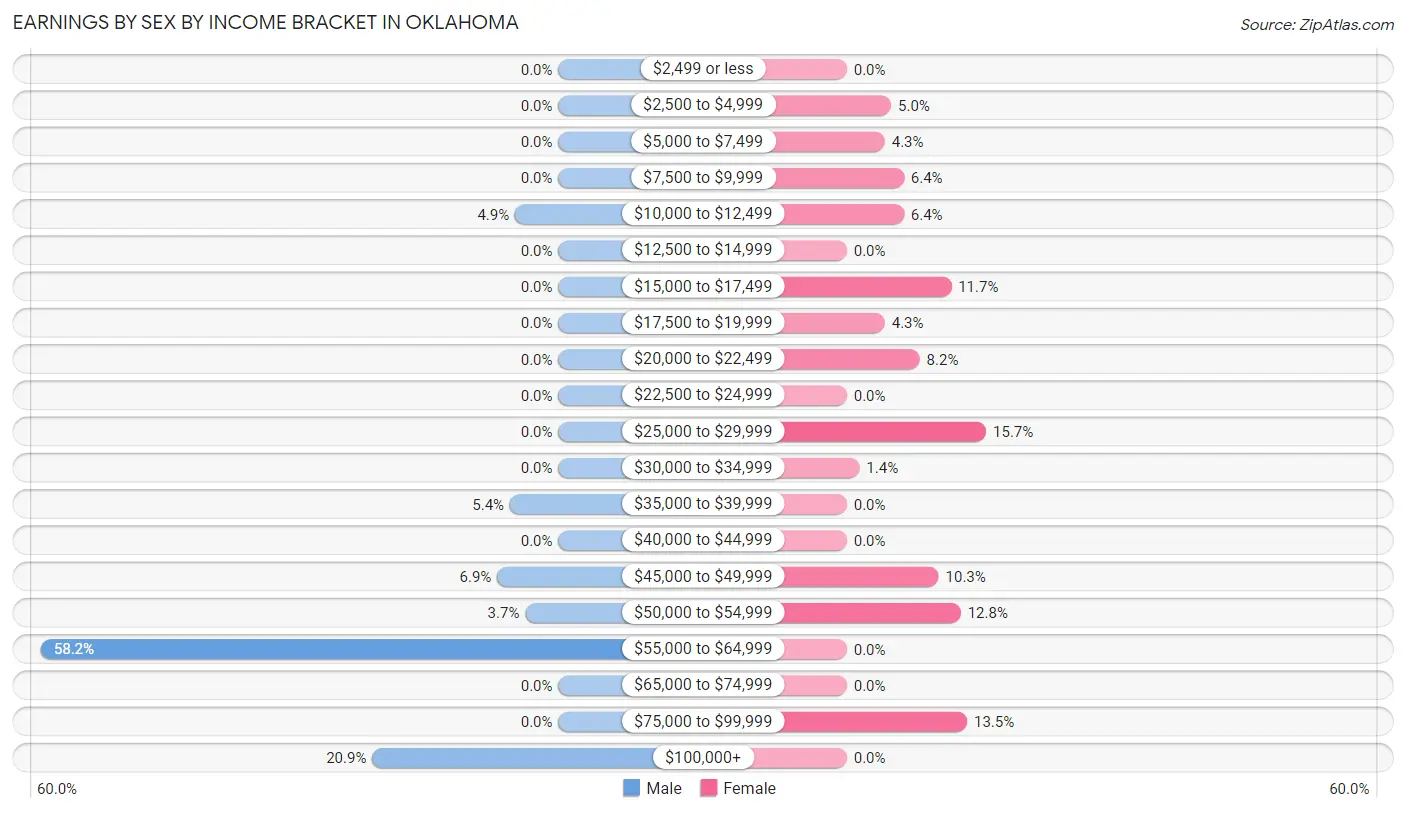
Earnings by Sex by Income Bracket in Oklahoma
The most common earnings brackets in Oklahoma are $55,000 to $64,999 for men (203 | 58.2%) and $25,000 to $29,999 for women (44 | 15.7%).
| Income | Male | Female |
| $2,499 or less | 0 (0.0%) | 0 (0.0%) |
| $2,500 to $4,999 | 0 (0.0%) | 14 (5.0%) |
| $5,000 to $7,499 | 0 (0.0%) | 12 (4.3%) |
| $7,500 to $9,999 | 0 (0.0%) | 18 (6.4%) |
| $10,000 to $12,499 | 17 (4.9%) | 18 (6.4%) |
| $12,500 to $14,999 | 0 (0.0%) | 0 (0.0%) |
| $15,000 to $17,499 | 0 (0.0%) | 33 (11.7%) |
| $17,500 to $19,999 | 0 (0.0%) | 12 (4.3%) |
| $20,000 to $22,499 | 0 (0.0%) | 23 (8.2%) |
| $22,500 to $24,999 | 0 (0.0%) | 0 (0.0%) |
| $25,000 to $29,999 | 0 (0.0%) | 44 (15.7%) |
| $30,000 to $34,999 | 0 (0.0%) | 4 (1.4%) |
| $35,000 to $39,999 | 19 (5.4%) | 0 (0.0%) |
| $40,000 to $44,999 | 0 (0.0%) | 0 (0.0%) |
| $45,000 to $49,999 | 24 (6.9%) | 29 (10.3%) |
| $50,000 to $54,999 | 13 (3.7%) | 36 (12.8%) |
| $55,000 to $64,999 | 203 (58.2%) | 0 (0.0%) |
| $65,000 to $74,999 | 0 (0.0%) | 0 (0.0%) |
| $75,000 to $99,999 | 0 (0.0%) | 38 (13.5%) |
| $100,000+ | 73 (20.9%) | 0 (0.0%) |
| Total | 349 (100.0%) | 281 (100.0%) |
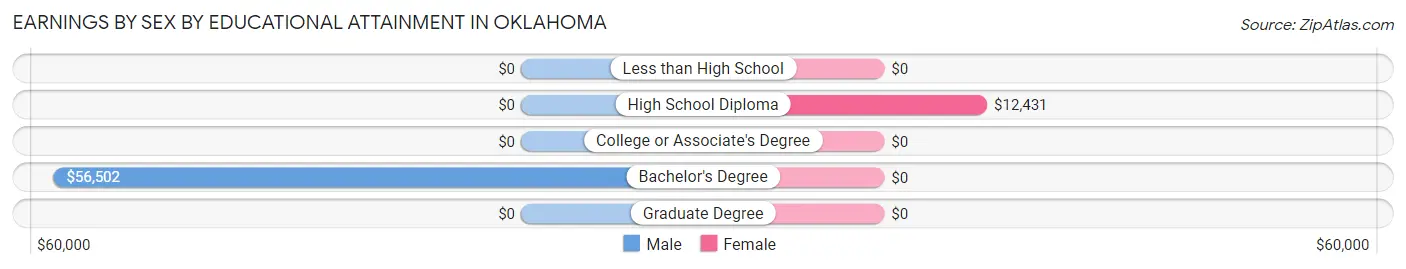
Earnings by Sex by Educational Attainment in Oklahoma
Average earnings in Oklahoma are $56,547 for men and $21,685 for women, a difference of 61.7%. Men with an educational attainment of bachelor's degree enjoy the highest average annual earnings of $56,502, while those with bachelor's degree education earn the least with $56,502. Women with an educational attainment of high school diploma earn the most with the average annual earnings of $12,431, while those with high school diploma education have the smallest earnings of $12,431.
| Educational Attainment | Male Income | Female Income |
| Less than High School | - | - |
| High School Diploma | - | - |
| College or Associate's Degree | - | - |
| Bachelor's Degree | $56,502 | $0 |
| Graduate Degree | - | - |
| Total | $56,547 | $21,685 |
Family Income in Oklahoma
Family Income Brackets in Oklahoma
According to the Oklahoma family income data, there are 112 families falling into the $15,000 to $24,999 income range, which is the most common income bracket and makes up 29.9% of all families.
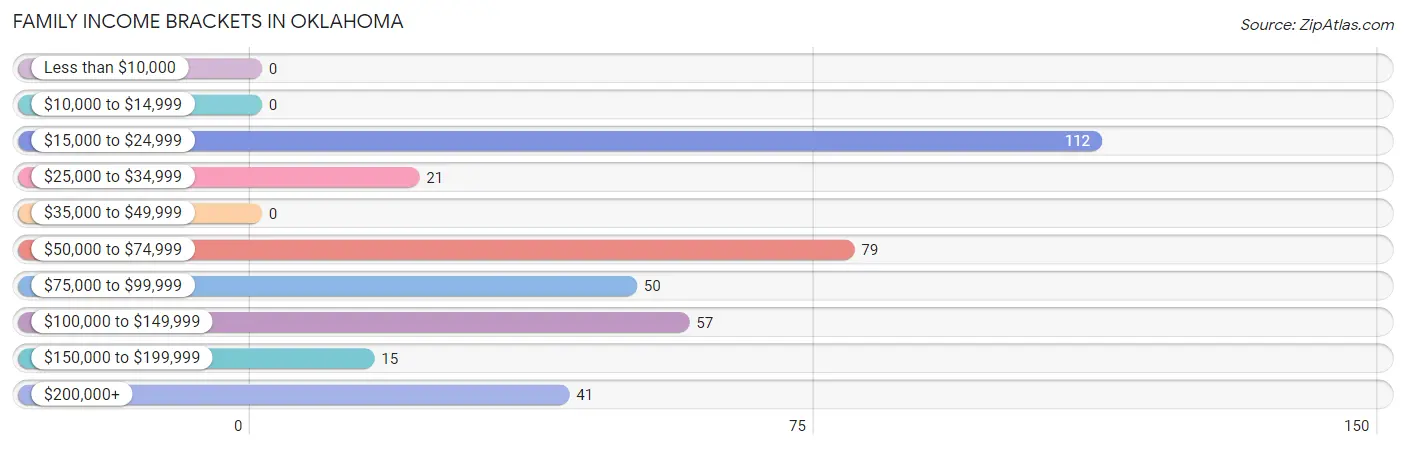
| Income Bracket | # Families | % Families |
| Less than $10,000 | 0 | 0.0% |
| $10,000 to $14,999 | 0 | 0.0% |
| $15,000 to $24,999 | 112 | 29.9% |
| $25,000 to $34,999 | 21 | 5.6% |
| $35,000 to $49,999 | 0 | 0.0% |
| $50,000 to $74,999 | 79 | 21.1% |
| $75,000 to $99,999 | 50 | 13.3% |
| $100,000 to $149,999 | 57 | 15.2% |
| $150,000 to $199,999 | 15 | 4.0% |
| $200,000+ | 41 | 10.9% |
Family Income by Famaliy Size in Oklahoma
| Income Bracket | # Families | Median Income |
| 2-Person Families | 145 (38.7%) | $0 |
| 3-Person Families | 115 (30.7%) | $0 |
| 4-Person Families | 91 (24.3%) | $0 |
| 5-Person Families | 24 (6.4%) | $0 |
| 6-Person Families | 0 (0.0%) | $0 |
| 7+ Person Families | 0 (0.0%) | $0 |
| Total | 375 (100.0%) | $56,595 |
Family Income by Number of Earners in Oklahoma
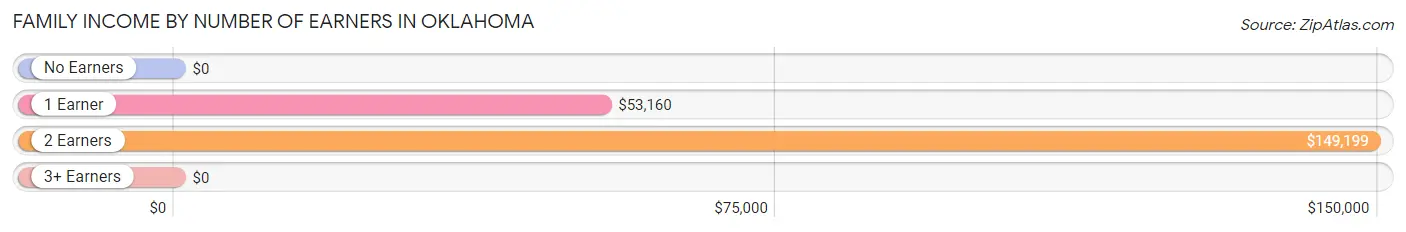
| Number of Earners | # Families | Median Income |
| No Earners | 61 (16.3%) | $0 |
| 1 Earner | 163 (43.5%) | $53,160 |
| 2 Earners | 137 (36.5%) | $149,199 |
| 3+ Earners | 14 (3.7%) | $0 |
| Total | 375 (100.0%) | $56,595 |
Household Income in Oklahoma
Household Income Brackets in Oklahoma
With 126 households falling in the category, the $15,000 to $24,999 income range is the most frequent in Oklahoma, accounting for 27.8% of all households.
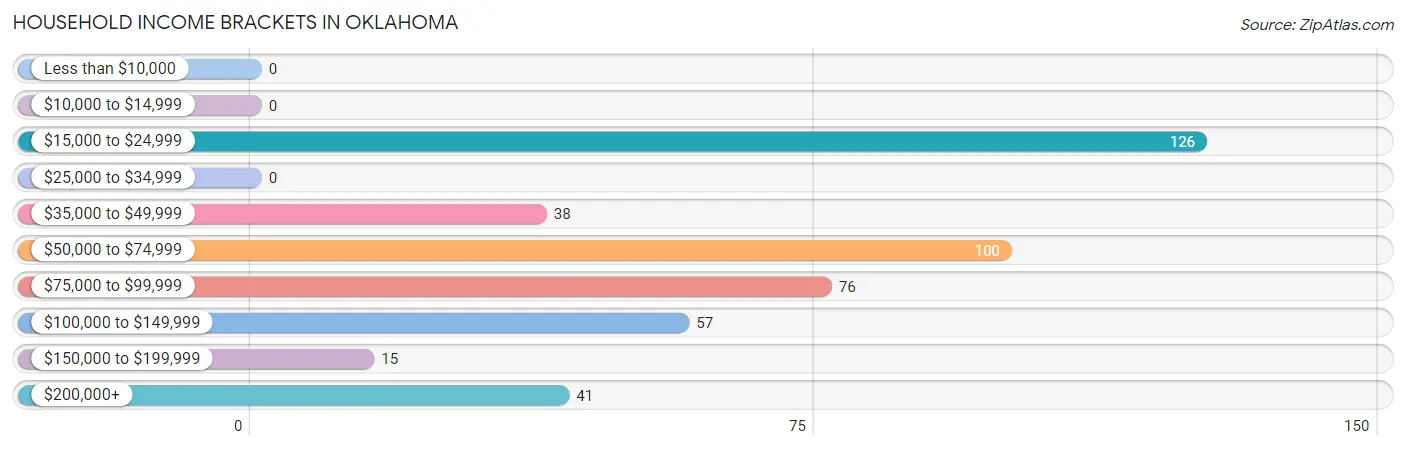
| Income Bracket | # Households | % Households |
| Less than $10,000 | 0 | 0.0% |
| $10,000 to $14,999 | 0 | 0.0% |
| $15,000 to $24,999 | 126 | 27.8% |
| $25,000 to $34,999 | 0 | 0.0% |
| $35,000 to $49,999 | 38 | 8.4% |
| $50,000 to $74,999 | 100 | 22.1% |
| $75,000 to $99,999 | 76 | 16.8% |
| $100,000 to $149,999 | 57 | 12.6% |
| $150,000 to $199,999 | 15 | 3.3% |
| $200,000+ | 41 | 9.1% |
Household Income by Householder Age in Oklahoma
The median household income in Oklahoma is $57,284, with the highest median household income of $75,577 found in the 65+ years age bracket for the primary householder. A total of 116 households (25.6%) fall into this category. Meanwhile, the 15 to 24 years age bracket for the primary householder has the lowest median household income of $0, with 36 households (8.0%) in this group.
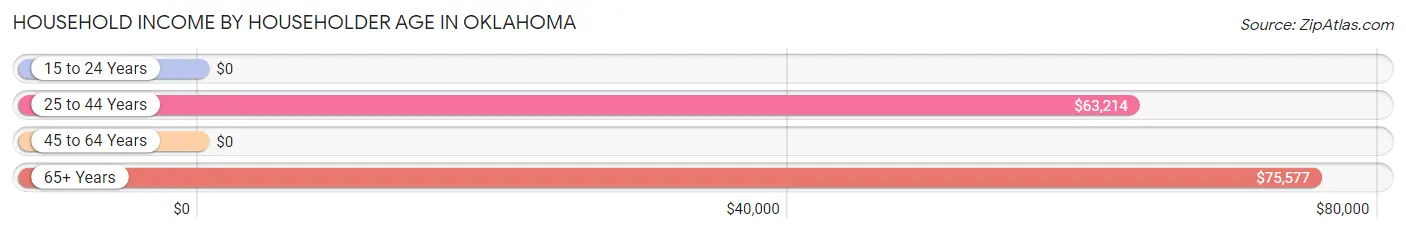
| Income Bracket | # Households | Median Income |
| 15 to 24 Years | 36 (8.0%) | $0 |
| 25 to 44 Years | 136 (30.0%) | $63,214 |
| 45 to 64 Years | 165 (36.4%) | $0 |
| 65+ Years | 116 (25.6%) | $75,577 |
| Total | 453 (100.0%) | $57,284 |
Poverty in Oklahoma
Income Below Poverty by Sex and Age in Oklahoma
With 18.7% poverty level for males and 20.1% for females among the residents of Oklahoma, 5 year old males and 45 to 54 year old females are the most vulnerable to poverty, with 33 males (100.0%) and 52 females (74.3%) in their respective age groups living below the poverty level.
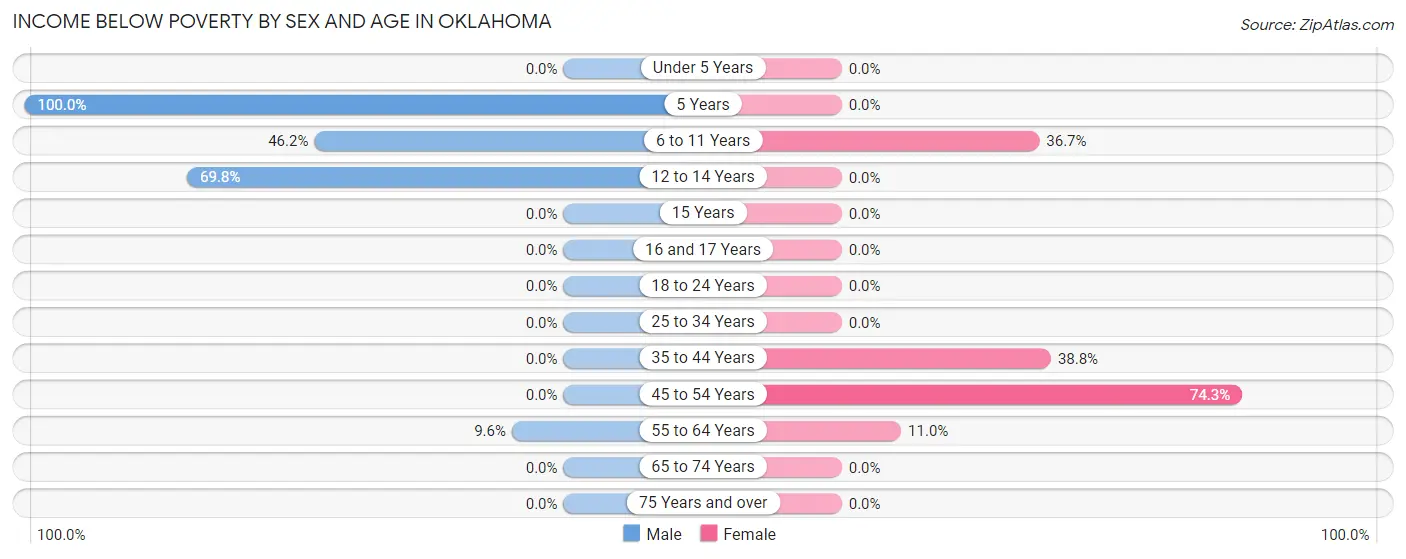
| Age Bracket | Male | Female |
| Under 5 Years | 0 (0.0%) | 0 (0.0%) |
| 5 Years | 33 (100.0%) | 0 (0.0%) |
| 6 to 11 Years | 43 (46.2%) | 33 (36.7%) |
| 12 to 14 Years | 44 (69.8%) | 0 (0.0%) |
| 15 Years | 0 (0.0%) | 0 (0.0%) |
| 16 and 17 Years | 0 (0.0%) | 0 (0.0%) |
| 18 to 24 Years | 0 (0.0%) | 0 (0.0%) |
| 25 to 34 Years | 0 (0.0%) | 0 (0.0%) |
| 35 to 44 Years | 0 (0.0%) | 33 (38.8%) |
| 45 to 54 Years | 0 (0.0%) | 52 (74.3%) |
| 55 to 64 Years | 9 (9.6%) | 13 (11.0%) |
| 65 to 74 Years | 0 (0.0%) | 0 (0.0%) |
| 75 Years and over | 0 (0.0%) | 0 (0.0%) |
| Total | 129 (18.7%) | 131 (20.1%) |
Income Above Poverty by Sex and Age in Oklahoma
According to the poverty statistics in Oklahoma, males aged under 5 years and females aged under 5 years are the age groups that are most secure financially, with 100.0% of males and 100.0% of females in these age groups living above the poverty line.
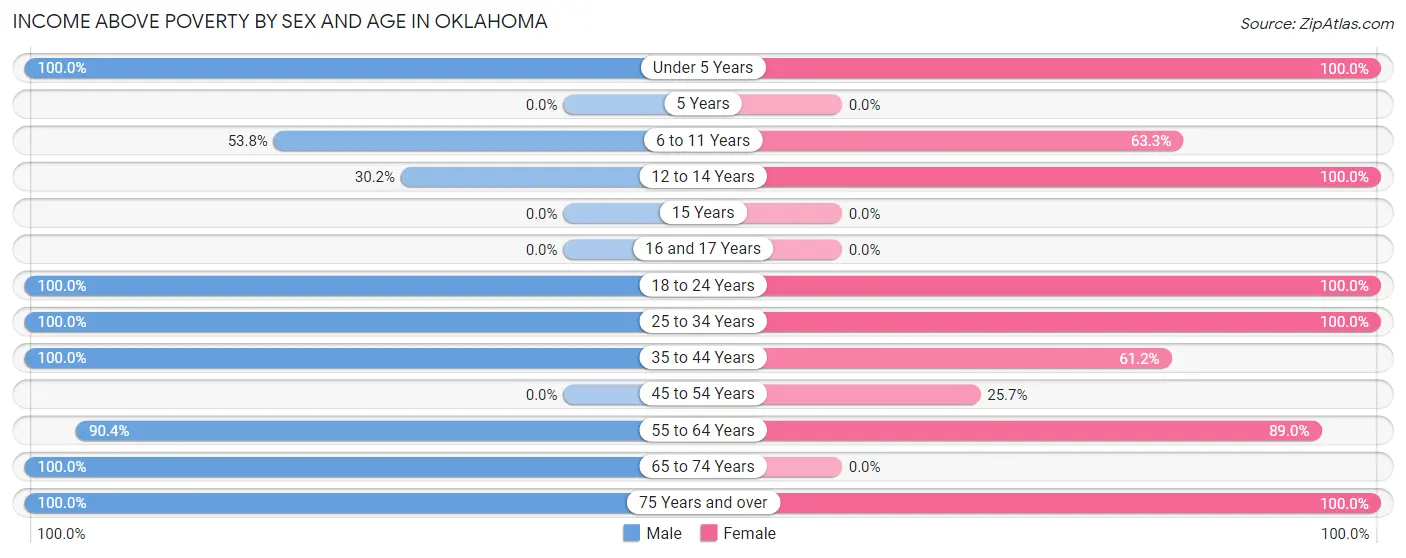
| Age Bracket | Male | Female |
| Under 5 Years | 44 (100.0%) | 49 (100.0%) |
| 5 Years | 0 (0.0%) | 0 (0.0%) |
| 6 to 11 Years | 50 (53.8%) | 57 (63.3%) |
| 12 to 14 Years | 19 (30.2%) | 31 (100.0%) |
| 15 Years | 0 (0.0%) | 0 (0.0%) |
| 16 and 17 Years | 0 (0.0%) | 0 (0.0%) |
| 18 to 24 Years | 52 (100.0%) | 36 (100.0%) |
| 25 to 34 Years | 200 (100.0%) | 50 (100.0%) |
| 35 to 44 Years | 53 (100.0%) | 52 (61.2%) |
| 45 to 54 Years | 0 (0.0%) | 18 (25.7%) |
| 55 to 64 Years | 85 (90.4%) | 105 (89.0%) |
| 65 to 74 Years | 14 (100.0%) | 0 (0.0%) |
| 75 Years and over | 44 (100.0%) | 122 (100.0%) |
| Total | 561 (81.3%) | 520 (79.9%) |
Income Below Poverty Among Married-Couple Families in Oklahoma
The poverty statistics for married-couple families in Oklahoma show that 4.2% or 9 of the total 215 families live below the poverty line. Families with no children have the highest poverty rate of 6.8%, comprising of 9 families. On the other hand, families with 1 or 2 children have the lowest poverty rate of 0.0%, which includes 0 families.
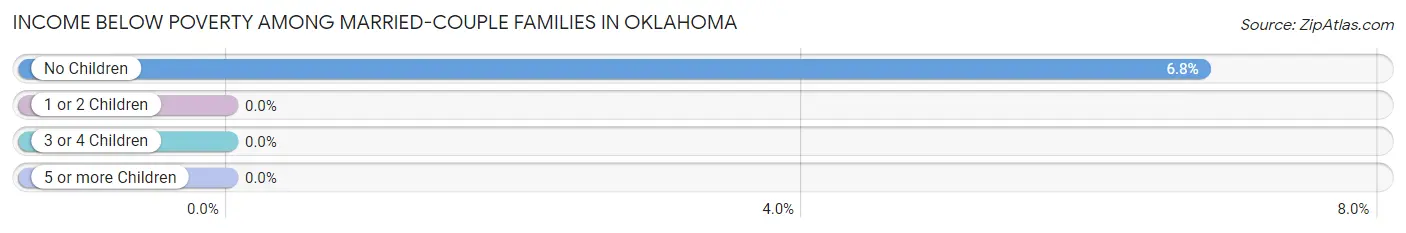
| Children | Above Poverty | Below Poverty |
| No Children | 124 (93.2%) | 9 (6.8%) |
| 1 or 2 Children | 58 (100.0%) | 0 (0.0%) |
| 3 or 4 Children | 24 (100.0%) | 0 (0.0%) |
| 5 or more Children | 0 (0.0%) | 0 (0.0%) |
| Total | 206 (95.8%) | 9 (4.2%) |
Income Below Poverty Among Single-Parent Households in Oklahoma
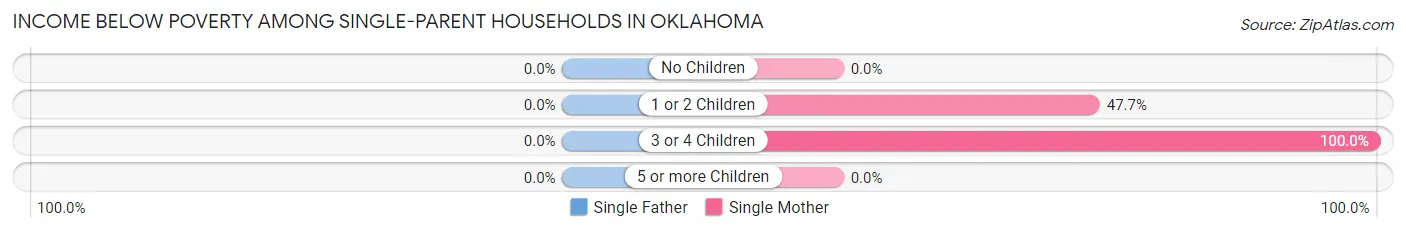
| Children | Single Father | Single Mother |
| No Children | 0 (0.0%) | 0 (0.0%) |
| 1 or 2 Children | 0 (0.0%) | 52 (47.7%) |
| 3 or 4 Children | 0 (0.0%) | 33 (100.0%) |
| 5 or more Children | 0 (0.0%) | 0 (0.0%) |
| Total | 0 (0.0%) | 85 (53.1%) |
Income Below Poverty Among Married-Couple vs Single-Parent Households in Oklahoma
The poverty data for Oklahoma shows that 9 of the married-couple family households (4.2%) and 85 of the single-parent households (53.1%) are living below the poverty level. Within the married-couple family households, those with no children have the highest poverty rate, with 9 households (6.8%) falling below the poverty line. Among the single-parent households, those with 3 or 4 children have the highest poverty rate, with 33 household (100.0%) living below poverty.
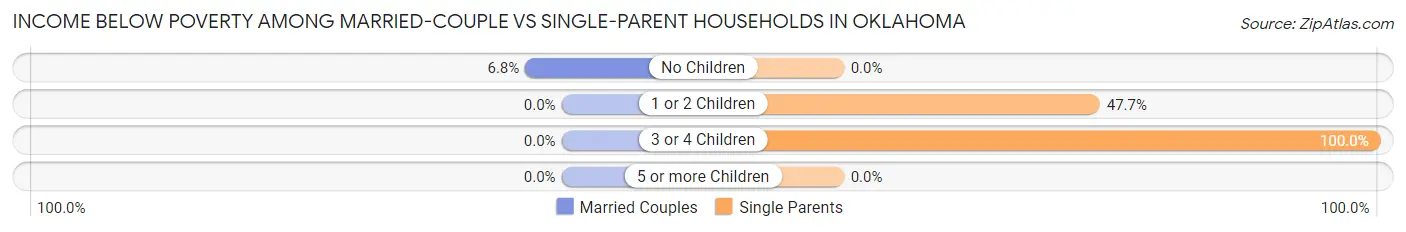
| Children | Married-Couple Families | Single-Parent Households |
| No Children | 9 (6.8%) | 0 (0.0%) |
| 1 or 2 Children | 0 (0.0%) | 52 (47.7%) |
| 3 or 4 Children | 0 (0.0%) | 33 (100.0%) |
| 5 or more Children | 0 (0.0%) | 0 (0.0%) |
| Total | 9 (4.2%) | 85 (53.1%) |
Race in Oklahoma
The most populous races in Oklahoma are White / Caucasian (1,157 | 84.7%), Hispanic or Latino (215 | 15.7%), and Two or more Races (200 | 14.6%).
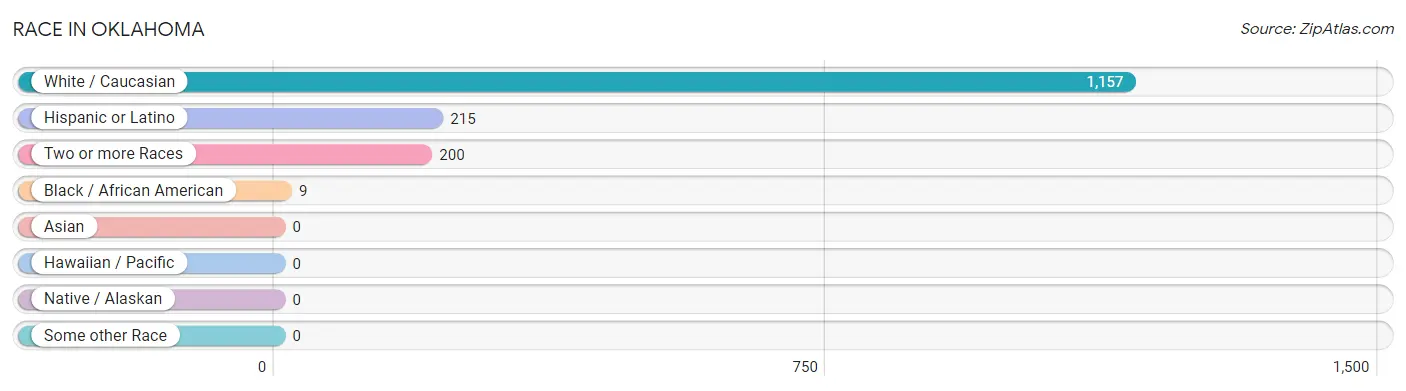
| Race | # Population | % Population |
| Asian | 0 | 0.0% |
| Black / African American | 9 | 0.7% |
| Hawaiian / Pacific | 0 | 0.0% |
| Hispanic or Latino | 215 | 15.7% |
| Native / Alaskan | 0 | 0.0% |
| White / Caucasian | 1,157 | 84.7% |
| Two or more Races | 200 | 14.6% |
| Some other Race | 0 | 0.0% |
| Total | 1,366 | 100.0% |
Ancestry in Oklahoma
The most populous ancestries reported in Oklahoma are German (412 | 30.2%), Italian (311 | 22.8%), Puerto Rican (200 | 14.6%), Swedish (147 | 10.8%), and Slovak (88 | 6.4%), together accounting for 84.8% of all Oklahoma residents.
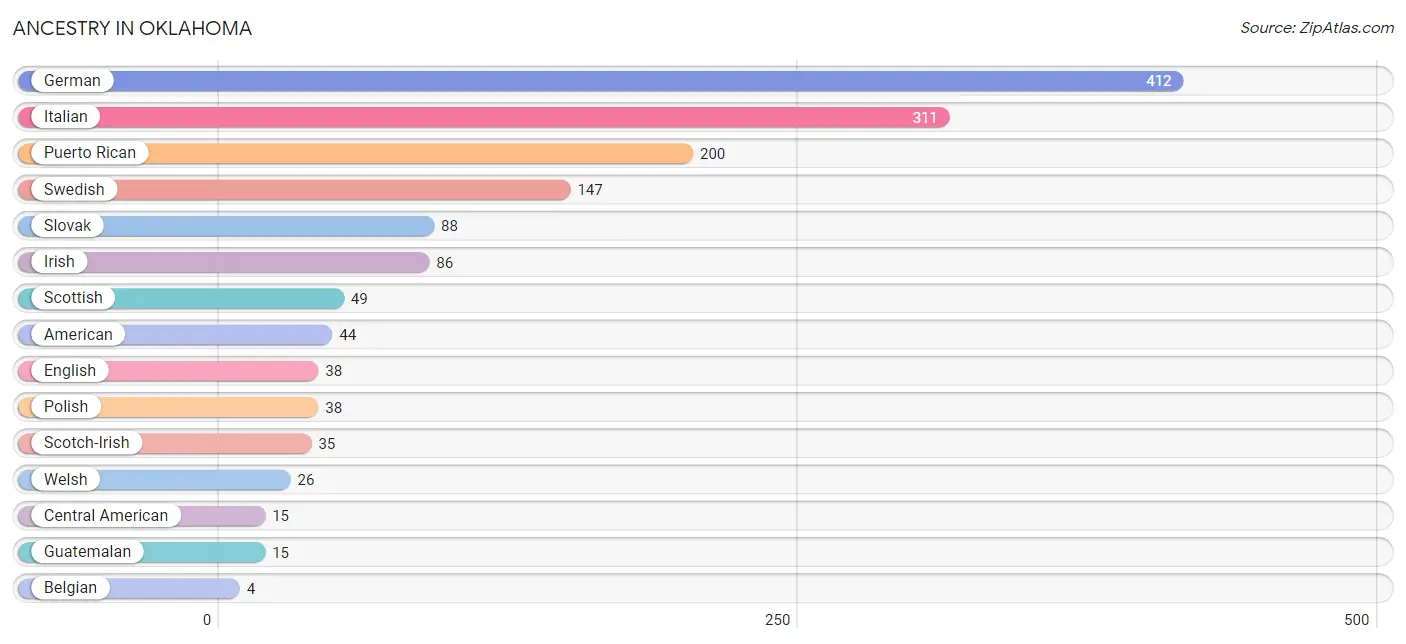
| Ancestry | # Population | % Population |
| American | 44 | 3.2% |
| Belgian | 4 | 0.3% |
| Central American | 15 | 1.1% |
| English | 38 | 2.8% |
| French | 4 | 0.3% |
| German | 412 | 30.2% |
| Guatemalan | 15 | 1.1% |
| Irish | 86 | 6.3% |
| Italian | 311 | 22.8% |
| Polish | 38 | 2.8% |
| Puerto Rican | 200 | 14.6% |
| Scotch-Irish | 35 | 2.6% |
| Scottish | 49 | 3.6% |
| Slovak | 88 | 6.4% |
| Swedish | 147 | 10.8% |
| Welsh | 26 | 1.9% | View All 16 Rows |
Immigrants in Oklahoma

| Immigration Origin | # Population | % Population | View All 0 Rows |
Sex and Age in Oklahoma
Sex and Age in Oklahoma
The most populous age groups in Oklahoma are 30 to 34 Years (183 | 26.2%) for men and 10 to 14 Years (64 | 9.6%) for women.
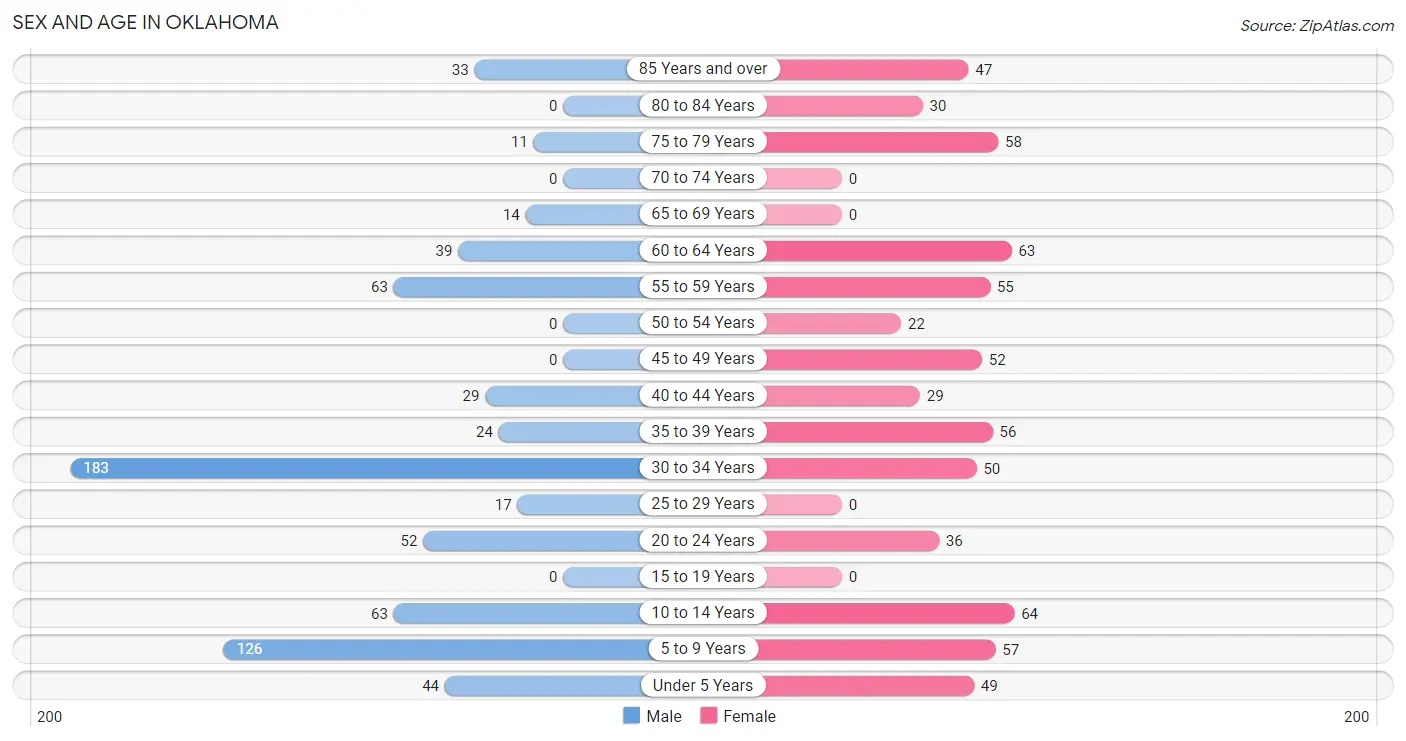
| Age Bracket | Male | Female |
| Under 5 Years | 44 (6.3%) | 49 (7.3%) |
| 5 to 9 Years | 126 (18.0%) | 57 (8.5%) |
| 10 to 14 Years | 63 (9.0%) | 64 (9.6%) |
| 15 to 19 Years | 0 (0.0%) | 0 (0.0%) |
| 20 to 24 Years | 52 (7.4%) | 36 (5.4%) |
| 25 to 29 Years | 17 (2.4%) | 0 (0.0%) |
| 30 to 34 Years | 183 (26.2%) | 50 (7.5%) |
| 35 to 39 Years | 24 (3.4%) | 56 (8.4%) |
| 40 to 44 Years | 29 (4.2%) | 29 (4.3%) |
| 45 to 49 Years | 0 (0.0%) | 52 (7.8%) |
| 50 to 54 Years | 0 (0.0%) | 22 (3.3%) |
| 55 to 59 Years | 63 (9.0%) | 55 (8.2%) |
| 60 to 64 Years | 39 (5.6%) | 63 (9.4%) |
| 65 to 69 Years | 14 (2.0%) | 0 (0.0%) |
| 70 to 74 Years | 0 (0.0%) | 0 (0.0%) |
| 75 to 79 Years | 11 (1.6%) | 58 (8.7%) |
| 80 to 84 Years | 0 (0.0%) | 30 (4.5%) |
| 85 Years and over | 33 (4.7%) | 47 (7.0%) |
| Total | 698 (100.0%) | 668 (100.0%) |
Families and Households in Oklahoma
Median Family Size in Oklahoma
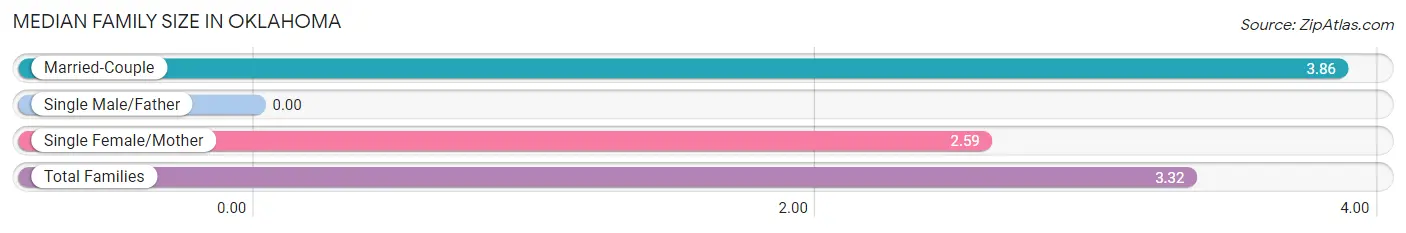
| Family Type | # Families | Family Size |
| Married-Couple | 215 (57.3%) | 3.86 |
| Single Male/Father | 0 (0.0%) | - |
| Single Female/Mother | 160 (42.7%) | 2.59 |
| Total Families | 375 (100.0%) | 3.32 |
Median Household Size in Oklahoma
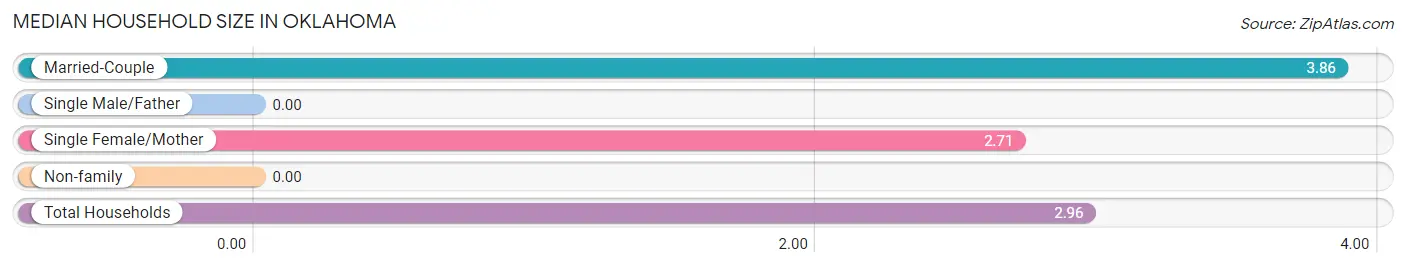
| Household Type | # Households | Household Size |
| Married-Couple | 215 (47.5%) | 3.86 |
| Single Male/Father | 0 (0.0%) | - |
| Single Female/Mother | 160 (35.3%) | 2.71 |
| Non-family | 78 (17.2%) | - |
| Total Households | 453 (100.0%) | 2.96 |
Household Size by Marriage Status in Oklahoma
Out of a total of 453 households in Oklahoma, 375 (82.8%) are family households, while 78 (17.2%) are nonfamily households. The most numerous type of family households are 3-person households, comprising 136, and the most common type of nonfamily households are 1-person households, comprising 78.
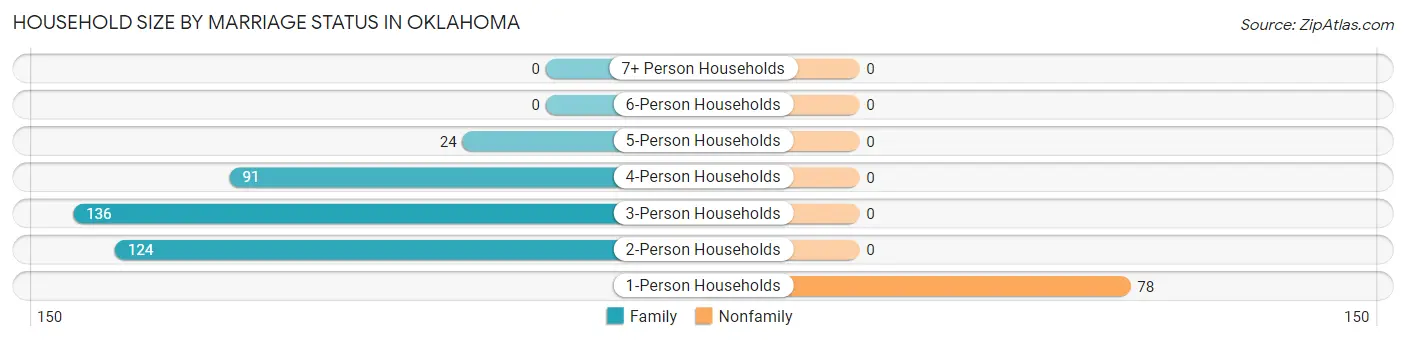
| Household Size | Family Households | Nonfamily Households |
| 1-Person Households | - | 78 (17.2%) |
| 2-Person Households | 124 (27.4%) | 0 (0.0%) |
| 3-Person Households | 136 (30.0%) | 0 (0.0%) |
| 4-Person Households | 91 (20.1%) | 0 (0.0%) |
| 5-Person Households | 24 (5.3%) | 0 (0.0%) |
| 6-Person Households | 0 (0.0%) | 0 (0.0%) |
| 7+ Person Households | 0 (0.0%) | 0 (0.0%) |
| Total | 375 (82.8%) | 78 (17.2%) |
Female Fertility in Oklahoma
Fertility by Age in Oklahoma
| Age Bracket | Women with Births | Births / 1,000 Women |
| 15 to 19 years | 0 (0.0%) | 0.0 |
| 20 to 34 years | 0 (0.0%) | 0.0 |
| 35 to 50 years | 0 (0.0%) | 0.0 |
| Total | 0 (0.0%) | 0.0 |
Fertility by Age by Marriage Status in Oklahoma
| Age Bracket | Married | Unmarried |
| 15 to 19 years | 0 (0.0%) | 0 (0.0%) |
| 20 to 34 years | 0 (0.0%) | 0 (0.0%) |
| 35 to 50 years | 0 (0.0%) | 0 (0.0%) |
| Total | 0 (0.0%) | 0 (0.0%) |
Fertility by Education in Oklahoma
| Educational Attainment | Women with Births | Births / 1,000 Women |
| Less than High School | 0 (0.0%) | 0.0 |
| High School Diploma | 0 (0.0%) | 0.0 |
| College or Associate's Degree | 0 (0.0%) | 0.0 |
| Bachelor's Degree | 0 (0.0%) | 0.0 |
| Graduate Degree | 0 (0.0%) | 0.0 |
| Total | 0 (0.0%) | 0.0 |
Fertility by Education by Marriage Status in Oklahoma
| Educational Attainment | Married | Unmarried |
| Less than High School | 0 (0.0%) | 0 (0.0%) |
| High School Diploma | 0 (0.0%) | 0 (0.0%) |
| College or Associate's Degree | 0 (0.0%) | 0 (0.0%) |
| Bachelor's Degree | 0 (0.0%) | 0 (0.0%) |
| Graduate Degree | 0 (0.0%) | 0 (0.0%) |
| Total | 0 (0.0%) | 0 (0.0%) |
Employment Characteristics in Oklahoma
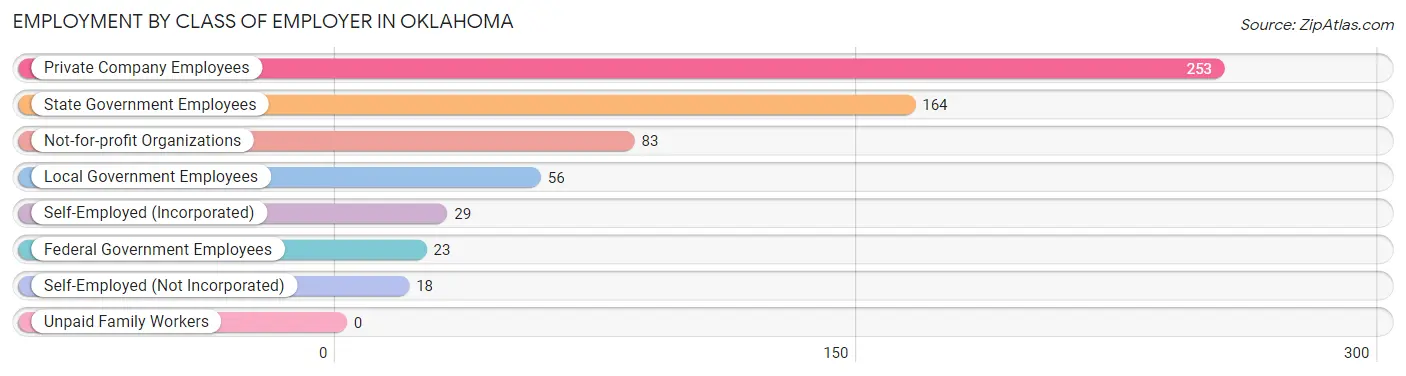
Employment by Class of Employer in Oklahoma
Among the 626 employed individuals in Oklahoma, private company employees (253 | 40.4%), state government employees (164 | 26.2%), and not-for-profit organizations (83 | 13.3%) make up the most common classes of employment.
| Employer Class | # Employees | % Employees |
| Private Company Employees | 253 | 40.4% |
| Self-Employed (Incorporated) | 29 | 4.6% |
| Self-Employed (Not Incorporated) | 18 | 2.9% |
| Not-for-profit Organizations | 83 | 13.3% |
| Local Government Employees | 56 | 8.9% |
| State Government Employees | 164 | 26.2% |
| Federal Government Employees | 23 | 3.7% |
| Unpaid Family Workers | 0 | 0.0% |
| Total | 626 | 100.0% |
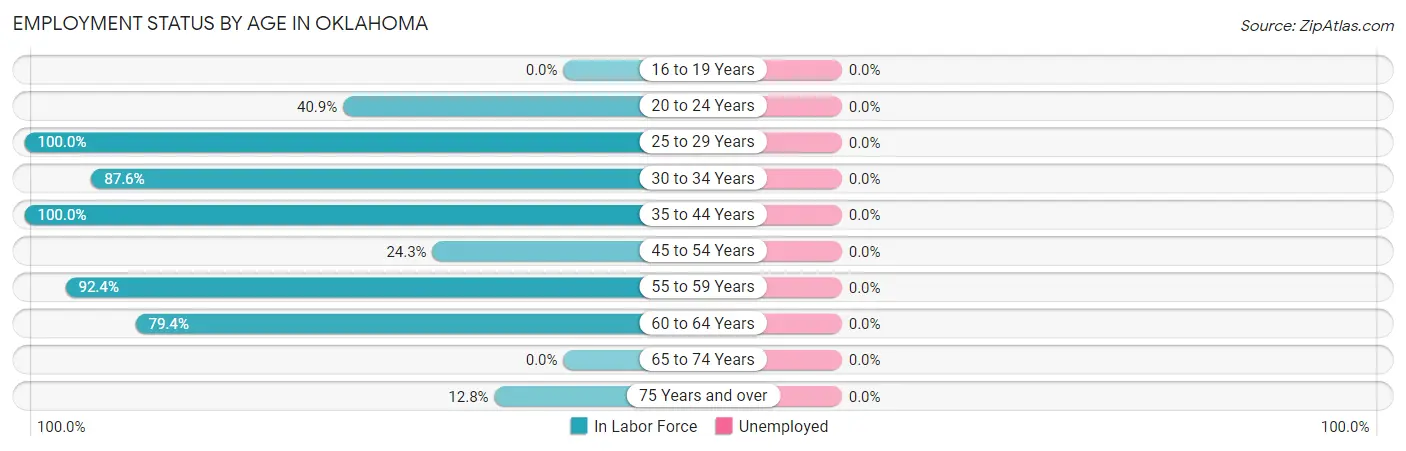
Employment Status by Age in Oklahoma
| Age Bracket | In Labor Force | Unemployed |
| 16 to 19 Years | 0 (0.0%) | 0 (0.0%) |
| 20 to 24 Years | 36 (40.9%) | 0 (0.0%) |
| 25 to 29 Years | 17 (100.0%) | 0 (0.0%) |
| 30 to 34 Years | 204 (87.6%) | 0 (0.0%) |
| 35 to 44 Years | 138 (100.0%) | 0 (0.0%) |
| 45 to 54 Years | 18 (24.3%) | 0 (0.0%) |
| 55 to 59 Years | 109 (92.4%) | 0 (0.0%) |
| 60 to 64 Years | 81 (79.4%) | 0 (0.0%) |
| 65 to 74 Years | 0 (0.0%) | 0 (0.0%) |
| 75 Years and over | 23 (12.8%) | 0 (0.0%) |
| Total | 626 (65.0%) | 0 (0.0%) |
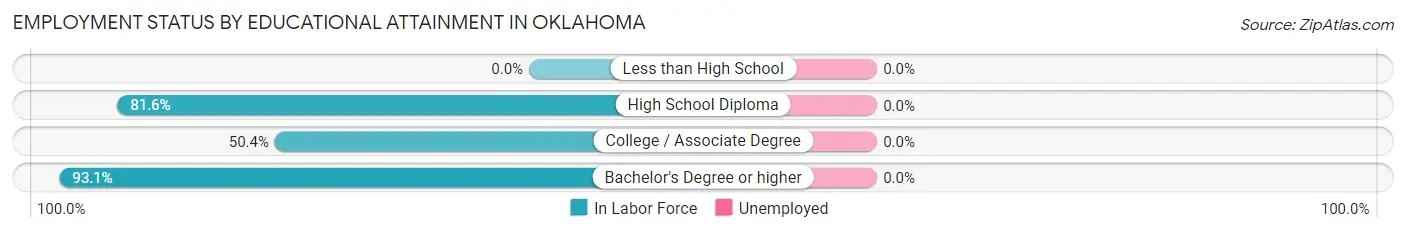
Employment Status by Educational Attainment in Oklahoma
| Educational Attainment | In Labor Force | Unemployed |
| Less than High School | 0 (0.0%) | 0 (0.0%) |
| High School Diploma | 115 (81.6%) | 0 (0.0%) |
| College / Associate Degree | 61 (50.4%) | 0 (0.0%) |
| Bachelor's Degree or higher | 391 (93.1%) | 0 (0.0%) |
| Total | 567 (83.1%) | 0 (0.0%) |
Employment Occupations by Sex in Oklahoma
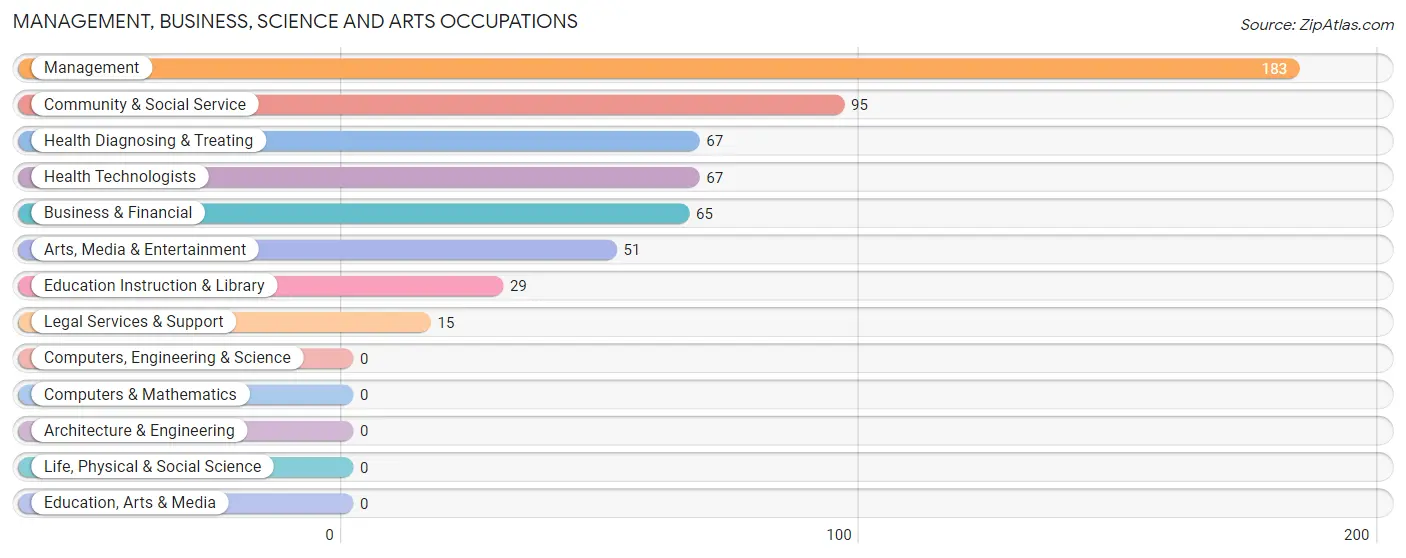
Management, Business, Science and Arts Occupations
The most common Management, Business, Science and Arts occupations in Oklahoma are Management (183 | 29.2%), Community & Social Service (95 | 15.2%), Health Diagnosing & Treating (67 | 10.7%), Health Technologists (67 | 10.7%), and Business & Financial (65 | 10.4%).
Management, Business, Science and Arts Occupations by Sex
Within the Management, Business, Science and Arts occupations in Oklahoma, the most male-oriented occupations are Management (100.0%), Legal Services & Support (100.0%), and Arts, Media & Entertainment (76.5%), while the most female-oriented occupations are Education Instruction & Library (100.0%), Health Diagnosing & Treating (56.7%), and Health Technologists (56.7%).
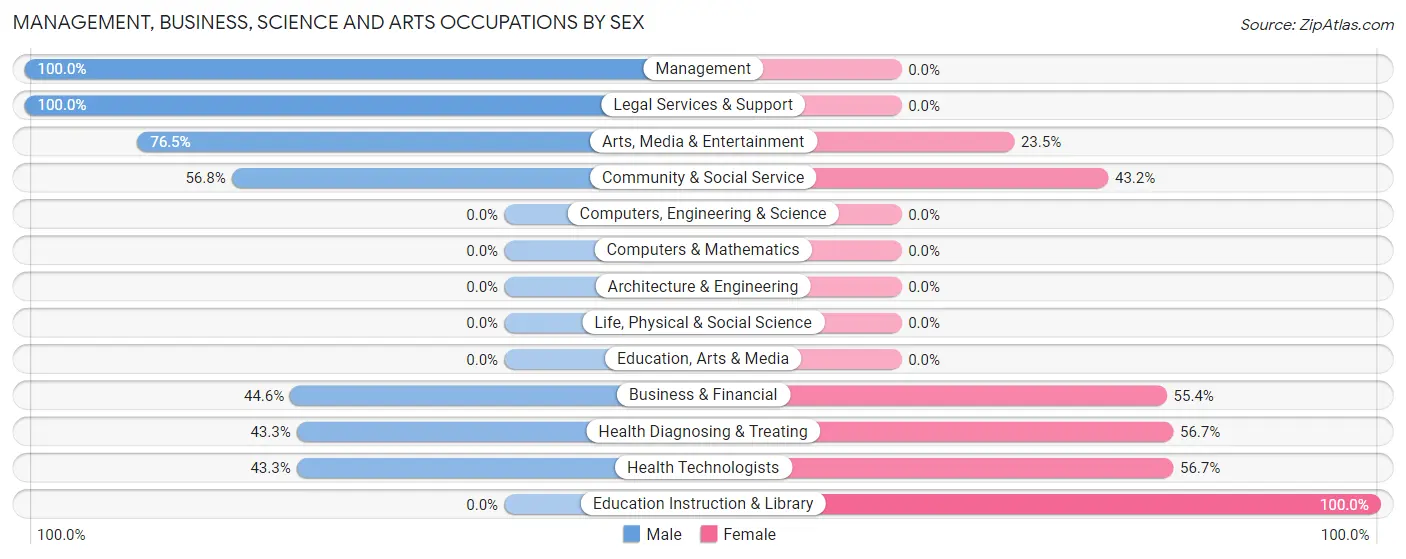
| Occupation | Male | Female |
| Management | 183 (100.0%) | 0 (0.0%) |
| Business & Financial | 29 (44.6%) | 36 (55.4%) |
| Computers, Engineering & Science | 0 (0.0%) | 0 (0.0%) |
| Computers & Mathematics | 0 (0.0%) | 0 (0.0%) |
| Architecture & Engineering | 0 (0.0%) | 0 (0.0%) |
| Life, Physical & Social Science | 0 (0.0%) | 0 (0.0%) |
| Community & Social Service | 54 (56.8%) | 41 (43.2%) |
| Education, Arts & Media | 0 (0.0%) | 0 (0.0%) |
| Legal Services & Support | 15 (100.0%) | 0 (0.0%) |
| Education Instruction & Library | 0 (0.0%) | 29 (100.0%) |
| Arts, Media & Entertainment | 39 (76.5%) | 12 (23.5%) |
| Health Diagnosing & Treating | 29 (43.3%) | 38 (56.7%) |
| Health Technologists | 29 (43.3%) | 38 (56.7%) |
| Total (Category) | 295 (72.0%) | 115 (28.1%) |
| Total (Overall) | 349 (55.7%) | 277 (44.3%) |
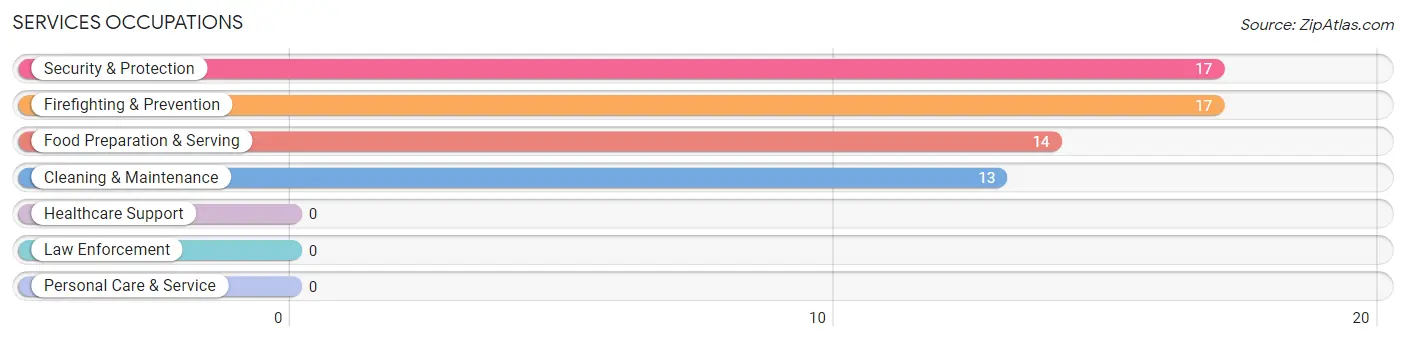
Services Occupations
The most common Services occupations in Oklahoma are Security & Protection (17 | 2.7%), Firefighting & Prevention (17 | 2.7%), Food Preparation & Serving (14 | 2.2%), and Cleaning & Maintenance (13 | 2.1%).
Services Occupations by Sex
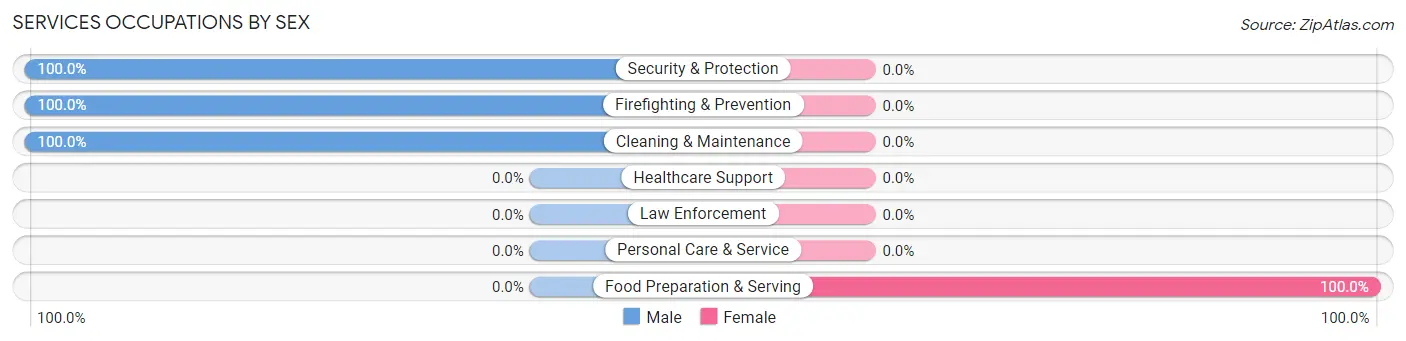
| Occupation | Male | Female |
| Healthcare Support | 0 (0.0%) | 0 (0.0%) |
| Security & Protection | 17 (100.0%) | 0 (0.0%) |
| Firefighting & Prevention | 17 (100.0%) | 0 (0.0%) |
| Law Enforcement | 0 (0.0%) | 0 (0.0%) |
| Food Preparation & Serving | 0 (0.0%) | 14 (100.0%) |
| Cleaning & Maintenance | 13 (100.0%) | 0 (0.0%) |
| Personal Care & Service | 0 (0.0%) | 0 (0.0%) |
| Total (Category) | 30 (68.2%) | 14 (31.8%) |
| Total (Overall) | 349 (55.7%) | 277 (44.3%) |
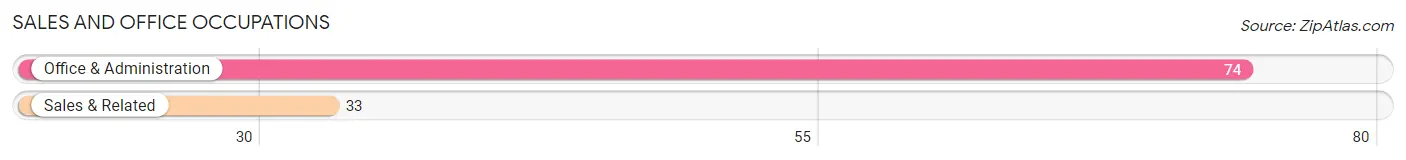
Sales and Office Occupations
The most common Sales and Office occupations in Oklahoma are Office & Administration (74 | 11.8%), and Sales & Related (33 | 5.3%).
Sales and Office Occupations by Sex
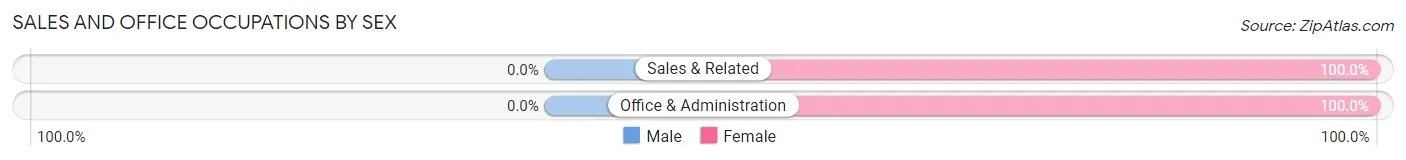
| Occupation | Male | Female |
| Sales & Related | 0 (0.0%) | 33 (100.0%) |
| Office & Administration | 0 (0.0%) | 74 (100.0%) |
| Total (Category) | 0 (0.0%) | 107 (100.0%) |
| Total (Overall) | 349 (55.7%) | 277 (44.3%) |
Natural Resources, Construction and Maintenance Occupations
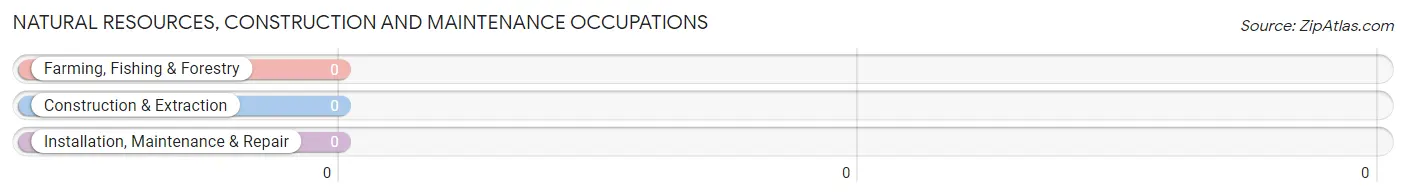
Natural Resources, Construction and Maintenance Occupations by Sex
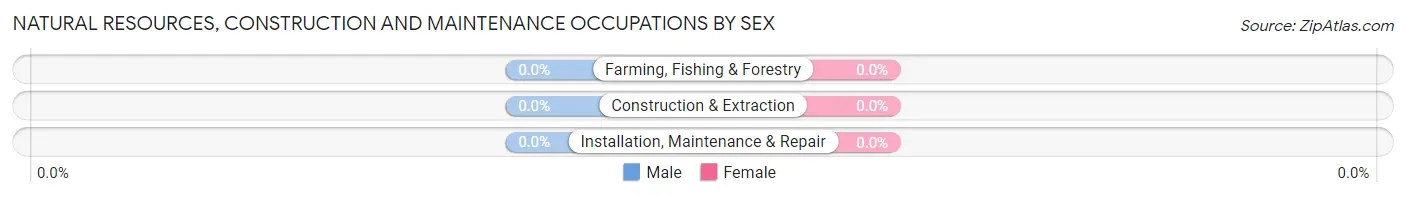
| Occupation | Male | Female |
| Farming, Fishing & Forestry | 0 (0.0%) | 0 (0.0%) |
| Construction & Extraction | 0 (0.0%) | 0 (0.0%) |
| Installation, Maintenance & Repair | 0 (0.0%) | 0 (0.0%) |
| Total (Category) | 0 (0.0%) | 0 (0.0%) |
| Total (Overall) | 349 (55.7%) | 277 (44.3%) |
Production, Transportation and Moving Occupations
The most common Production, Transportation and Moving occupations in Oklahoma are Material Moving (24 | 3.8%), Production (23 | 3.7%), and Transportation (18 | 2.9%).
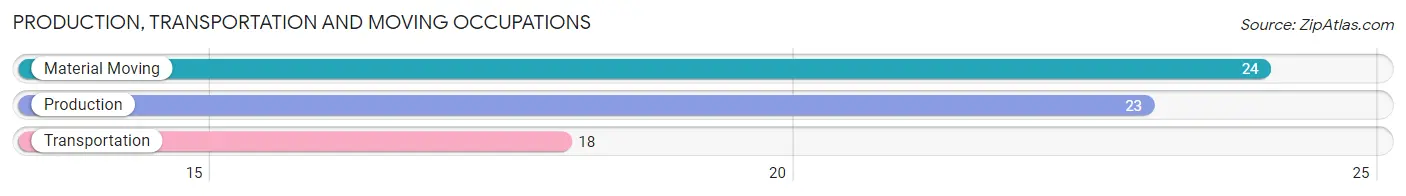
Production, Transportation and Moving Occupations by Sex
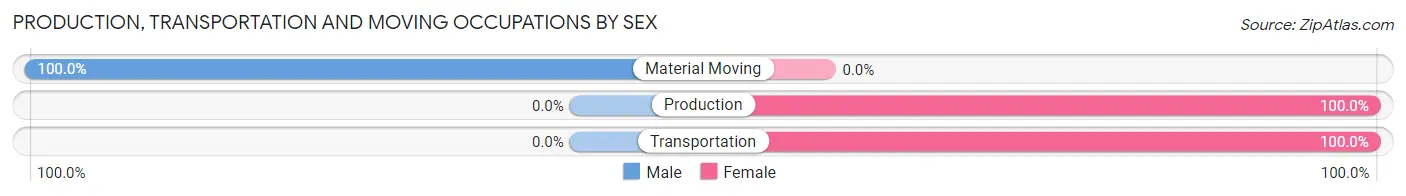
| Occupation | Male | Female |
| Production | 0 (0.0%) | 23 (100.0%) |
| Transportation | 0 (0.0%) | 18 (100.0%) |
| Material Moving | 24 (100.0%) | 0 (0.0%) |
| Total (Category) | 24 (36.9%) | 41 (63.1%) |
| Total (Overall) | 349 (55.7%) | 277 (44.3%) |
Employment Industries by Sex in Oklahoma
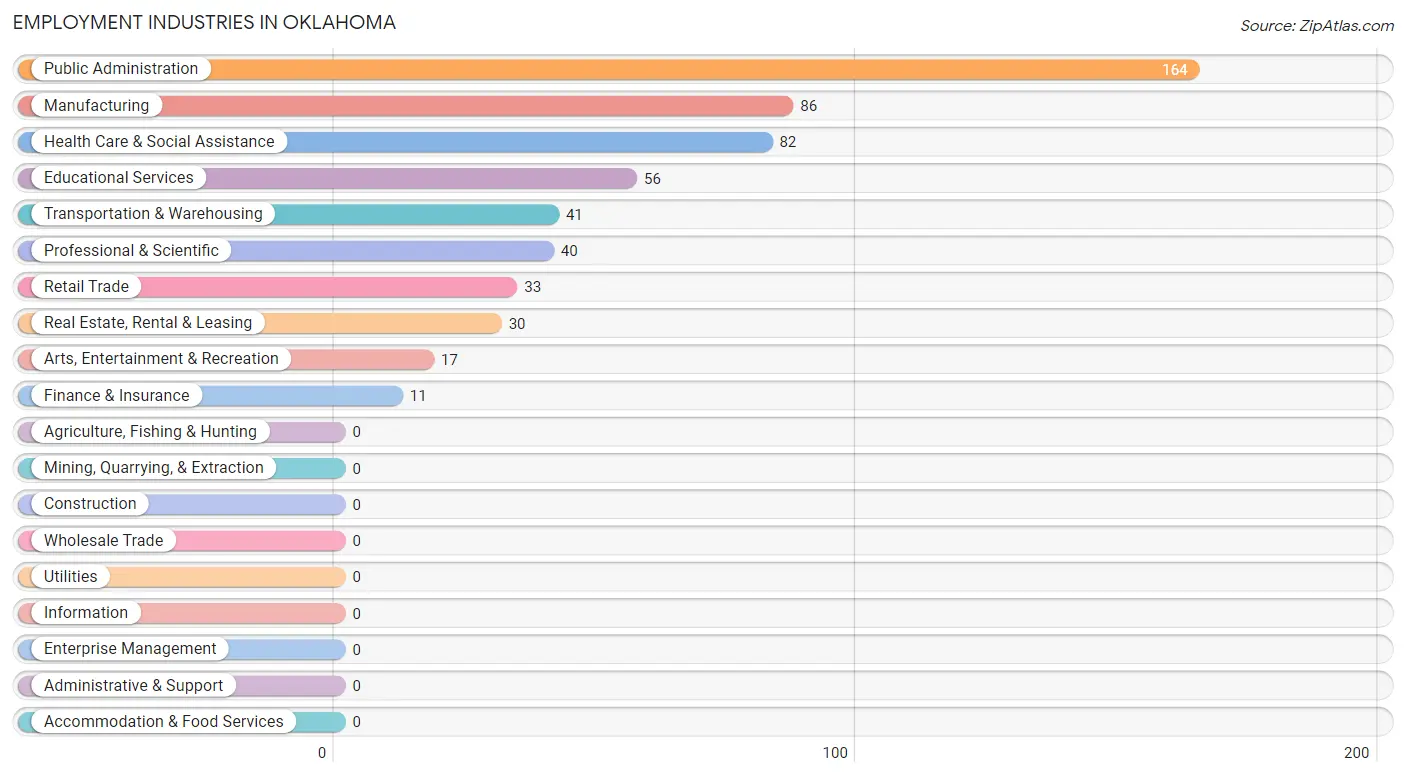
Employment Industries in Oklahoma
The major employment industries in Oklahoma include Public Administration (164 | 26.2%), Manufacturing (86 | 13.7%), Health Care & Social Assistance (82 | 13.1%), Educational Services (56 | 8.9%), and Transportation & Warehousing (41 | 6.6%).
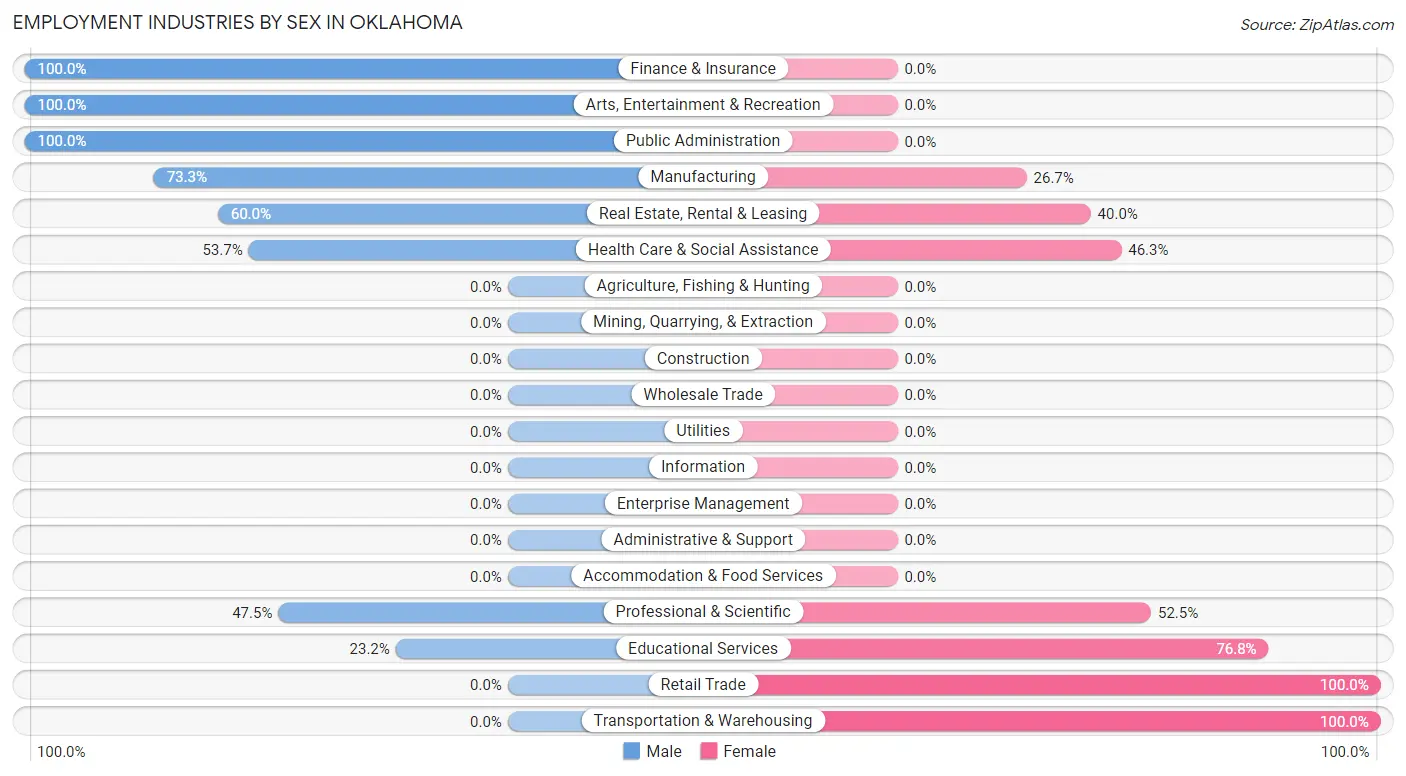
Employment Industries by Sex in Oklahoma
The Oklahoma industries that see more men than women are Finance & Insurance (100.0%), Arts, Entertainment & Recreation (100.0%), and Public Administration (100.0%), whereas the industries that tend to have a higher number of women are Retail Trade (100.0%), Transportation & Warehousing (100.0%), and Educational Services (76.8%).
| Industry | Male | Female |
| Agriculture, Fishing & Hunting | 0 (0.0%) | 0 (0.0%) |
| Mining, Quarrying, & Extraction | 0 (0.0%) | 0 (0.0%) |
| Construction | 0 (0.0%) | 0 (0.0%) |
| Manufacturing | 63 (73.3%) | 23 (26.7%) |
| Wholesale Trade | 0 (0.0%) | 0 (0.0%) |
| Retail Trade | 0 (0.0%) | 33 (100.0%) |
| Transportation & Warehousing | 0 (0.0%) | 41 (100.0%) |
| Utilities | 0 (0.0%) | 0 (0.0%) |
| Information | 0 (0.0%) | 0 (0.0%) |
| Finance & Insurance | 11 (100.0%) | 0 (0.0%) |
| Real Estate, Rental & Leasing | 18 (60.0%) | 12 (40.0%) |
| Professional & Scientific | 19 (47.5%) | 21 (52.5%) |
| Enterprise Management | 0 (0.0%) | 0 (0.0%) |
| Administrative & Support | 0 (0.0%) | 0 (0.0%) |
| Educational Services | 13 (23.2%) | 43 (76.8%) |
| Health Care & Social Assistance | 44 (53.7%) | 38 (46.3%) |
| Arts, Entertainment & Recreation | 17 (100.0%) | 0 (0.0%) |
| Accommodation & Food Services | 0 (0.0%) | 0 (0.0%) |
| Public Administration | 164 (100.0%) | 0 (0.0%) |
| Total | 349 (55.7%) | 277 (44.3%) |
Education in Oklahoma
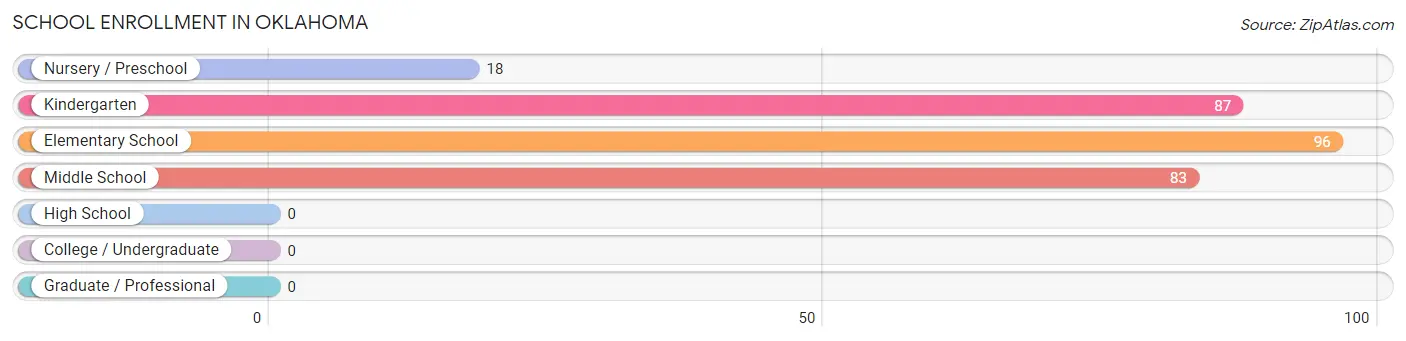
School Enrollment in Oklahoma
The most common levels of schooling among the 284 students in Oklahoma are elementary school (96 | 33.8%), kindergarten (87 | 30.6%), and middle school (83 | 29.2%).
| School Level | # Students | % Students |
| Nursery / Preschool | 18 | 6.3% |
| Kindergarten | 87 | 30.6% |
| Elementary School | 96 | 33.8% |
| Middle School | 83 | 29.2% |
| High School | 0 | 0.0% |
| College / Undergraduate | 0 | 0.0% |
| Graduate / Professional | 0 | 0.0% |
| Total | 284 | 100.0% |
School Enrollment by Age by Funding Source in Oklahoma
Out of a total of 284 students who are enrolled in schools in Oklahoma, 51 (18.0%) attend a private institution, while the remaining 233 (82.0%) are enrolled in public schools. The age group of 3 to 4 year olds has the highest likelihood of being enrolled in private schools, with 18 (100.0% in the age bracket) enrolled. Conversely, the age group of 5 to 9 year old has the lowest likelihood of being enrolled in a private school, with 183 (100.0% in the age bracket) attending a public institution.
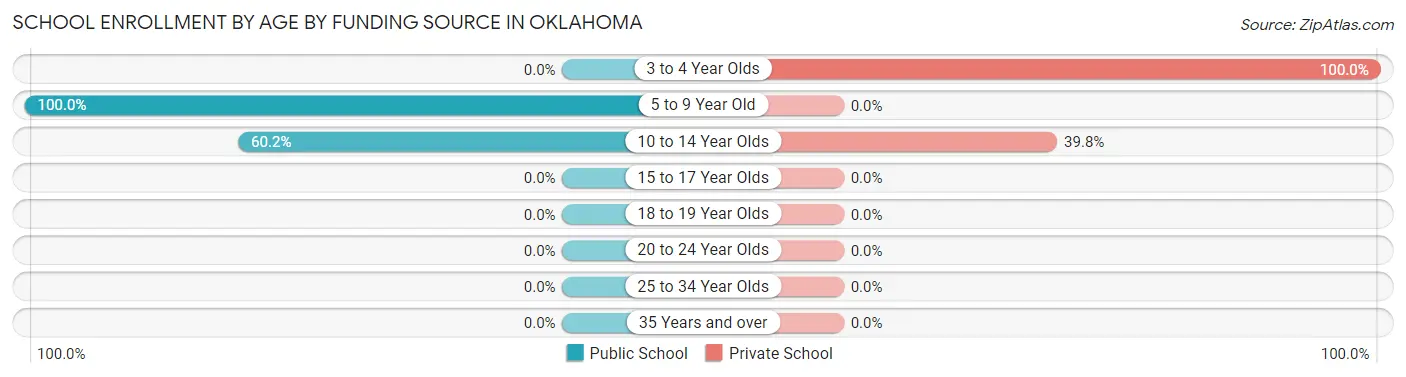
| Age Bracket | Public School | Private School |
| 3 to 4 Year Olds | 0 (0.0%) | 18 (100.0%) |
| 5 to 9 Year Old | 183 (100.0%) | 0 (0.0%) |
| 10 to 14 Year Olds | 50 (60.2%) | 33 (39.8%) |
| 15 to 17 Year Olds | 0 (0.0%) | 0 (0.0%) |
| 18 to 19 Year Olds | 0 (0.0%) | 0 (0.0%) |
| 20 to 24 Year Olds | 0 (0.0%) | 0 (0.0%) |
| 25 to 34 Year Olds | 0 (0.0%) | 0 (0.0%) |
| 35 Years and over | 0 (0.0%) | 0 (0.0%) |
| Total | 233 (82.0%) | 51 (18.0%) |
Educational Attainment by Field of Study in Oklahoma
Social sciences (164 | 38.2%), science & technology (79 | 18.4%), liberal arts & history (54 | 12.6%), education (38 | 8.9%), and literature & languages (29 | 6.8%) are the most common fields of study among 429 individuals in Oklahoma who have obtained a bachelor's degree or higher.
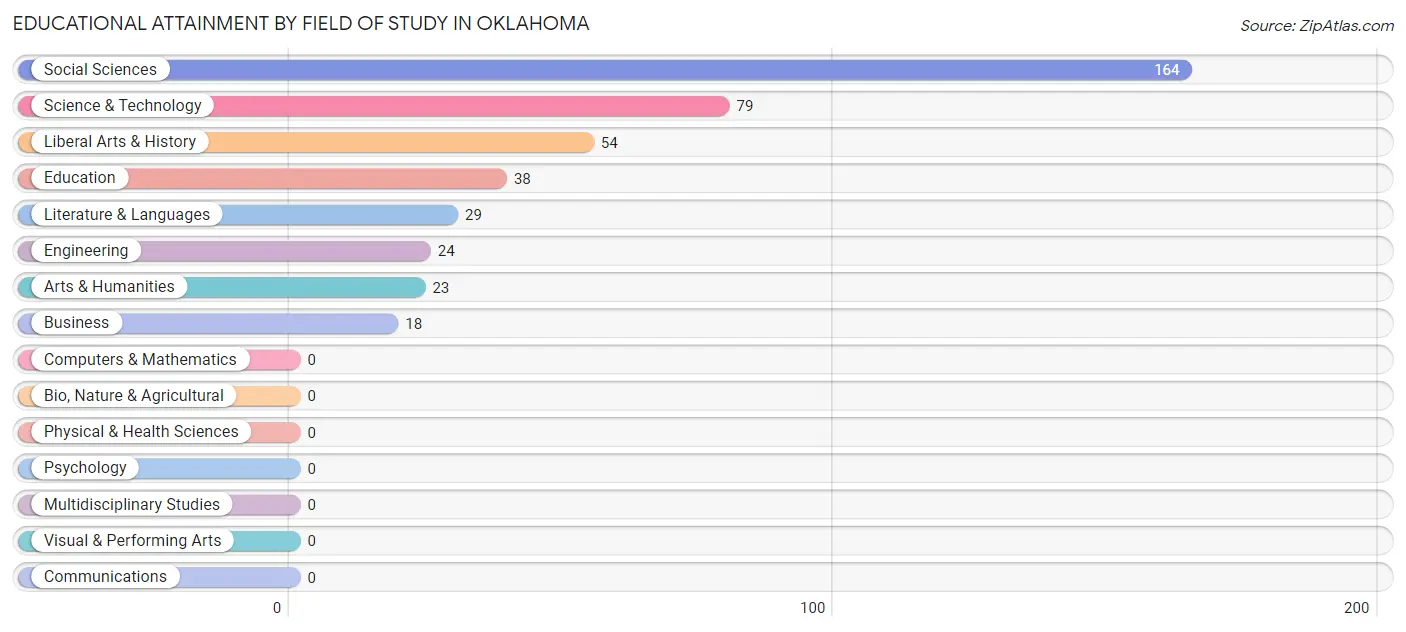
| Field of Study | # Graduates | % Graduates |
| Computers & Mathematics | 0 | 0.0% |
| Bio, Nature & Agricultural | 0 | 0.0% |
| Physical & Health Sciences | 0 | 0.0% |
| Psychology | 0 | 0.0% |
| Social Sciences | 164 | 38.2% |
| Engineering | 24 | 5.6% |
| Multidisciplinary Studies | 0 | 0.0% |
| Science & Technology | 79 | 18.4% |
| Business | 18 | 4.2% |
| Education | 38 | 8.9% |
| Literature & Languages | 29 | 6.8% |
| Liberal Arts & History | 54 | 12.6% |
| Visual & Performing Arts | 0 | 0.0% |
| Communications | 0 | 0.0% |
| Arts & Humanities | 23 | 5.4% |
| Total | 429 | 100.0% |
Transportation & Commute in Oklahoma
Vehicle Availability by Sex in Oklahoma
The most prevalent vehicle ownership categories in Oklahoma are males with 2 vehicles (221, accounting for 63.3%) and females with 2 vehicles (86, making up 79.8%).
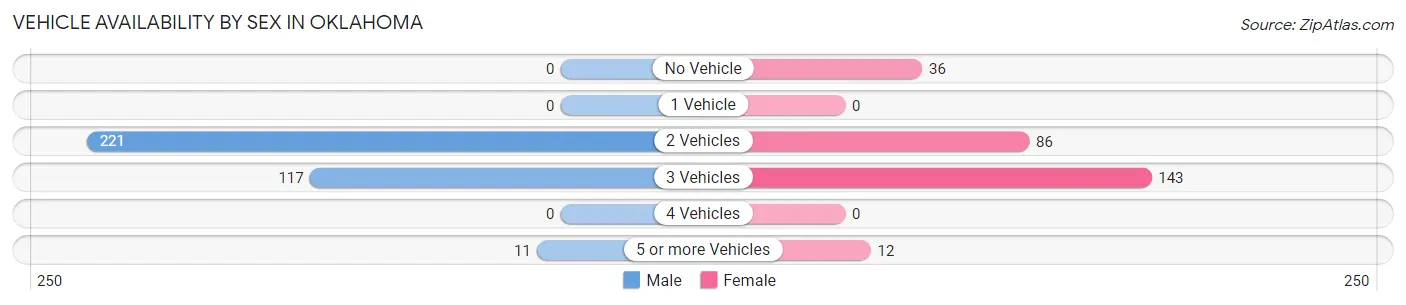
| Vehicles Available | Male | Female |
| No Vehicle | 0 (0.0%) | 36 (13.0%) |
| 1 Vehicle | 0 (0.0%) | 0 (0.0%) |
| 2 Vehicles | 221 (63.3%) | 86 (31.0%) |
| 3 Vehicles | 117 (33.5%) | 143 (51.6%) |
| 4 Vehicles | 0 (0.0%) | 0 (0.0%) |
| 5 or more Vehicles | 11 (3.2%) | 12 (4.3%) |
| Total | 349 (100.0%) | 277 (100.0%) |
Commute Time in Oklahoma
The most frequently occuring commute durations in Oklahoma are 5 to 9 minutes (494 commuters, 78.9%), 30 to 34 minutes (52 commuters, 8.3%), and 35 to 39 minutes (33 commuters, 5.3%).
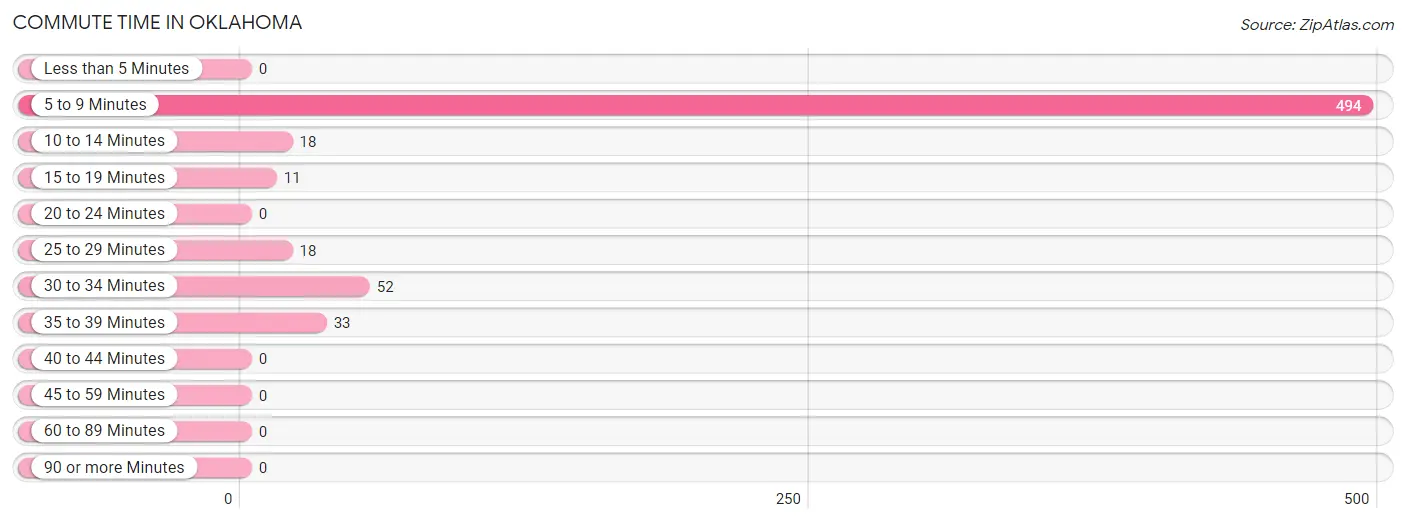
| Commute Time | # Commuters | % Commuters |
| Less than 5 Minutes | 0 | 0.0% |
| 5 to 9 Minutes | 494 | 78.9% |
| 10 to 14 Minutes | 18 | 2.9% |
| 15 to 19 Minutes | 11 | 1.8% |
| 20 to 24 Minutes | 0 | 0.0% |
| 25 to 29 Minutes | 18 | 2.9% |
| 30 to 34 Minutes | 52 | 8.3% |
| 35 to 39 Minutes | 33 | 5.3% |
| 40 to 44 Minutes | 0 | 0.0% |
| 45 to 59 Minutes | 0 | 0.0% |
| 60 to 89 Minutes | 0 | 0.0% |
| 90 or more Minutes | 0 | 0.0% |
Commute Time by Sex in Oklahoma
The most common commute times in Oklahoma are 5 to 9 minutes (301 commuters, 86.3%) for males and 5 to 9 minutes (193 commuters, 69.7%) for females.
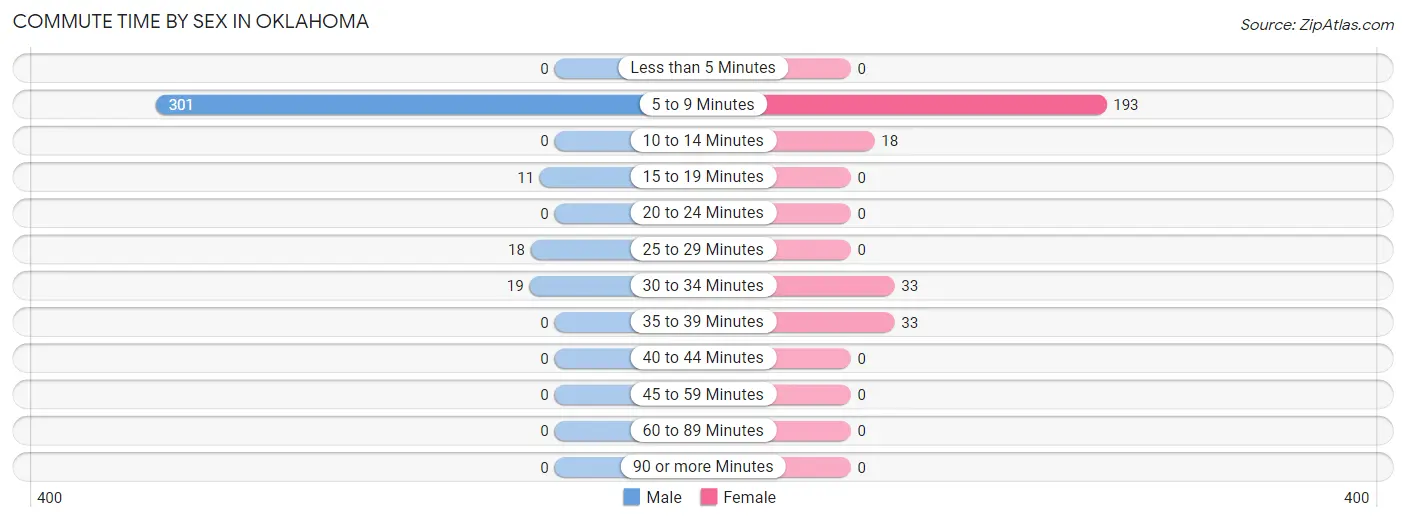
| Commute Time | Male | Female |
| Less than 5 Minutes | 0 (0.0%) | 0 (0.0%) |
| 5 to 9 Minutes | 301 (86.3%) | 193 (69.7%) |
| 10 to 14 Minutes | 0 (0.0%) | 18 (6.5%) |
| 15 to 19 Minutes | 11 (3.2%) | 0 (0.0%) |
| 20 to 24 Minutes | 0 (0.0%) | 0 (0.0%) |
| 25 to 29 Minutes | 18 (5.2%) | 0 (0.0%) |
| 30 to 34 Minutes | 19 (5.4%) | 33 (11.9%) |
| 35 to 39 Minutes | 0 (0.0%) | 33 (11.9%) |
| 40 to 44 Minutes | 0 (0.0%) | 0 (0.0%) |
| 45 to 59 Minutes | 0 (0.0%) | 0 (0.0%) |
| 60 to 89 Minutes | 0 (0.0%) | 0 (0.0%) |
| 90 or more Minutes | 0 (0.0%) | 0 (0.0%) |
Time of Departure to Work by Sex in Oklahoma
The most frequent times of departure to work in Oklahoma are 7:30 AM to 7:59 AM (198, 56.7%) for males and 9:00 AM to 9:59 AM (66, 23.8%) for females.
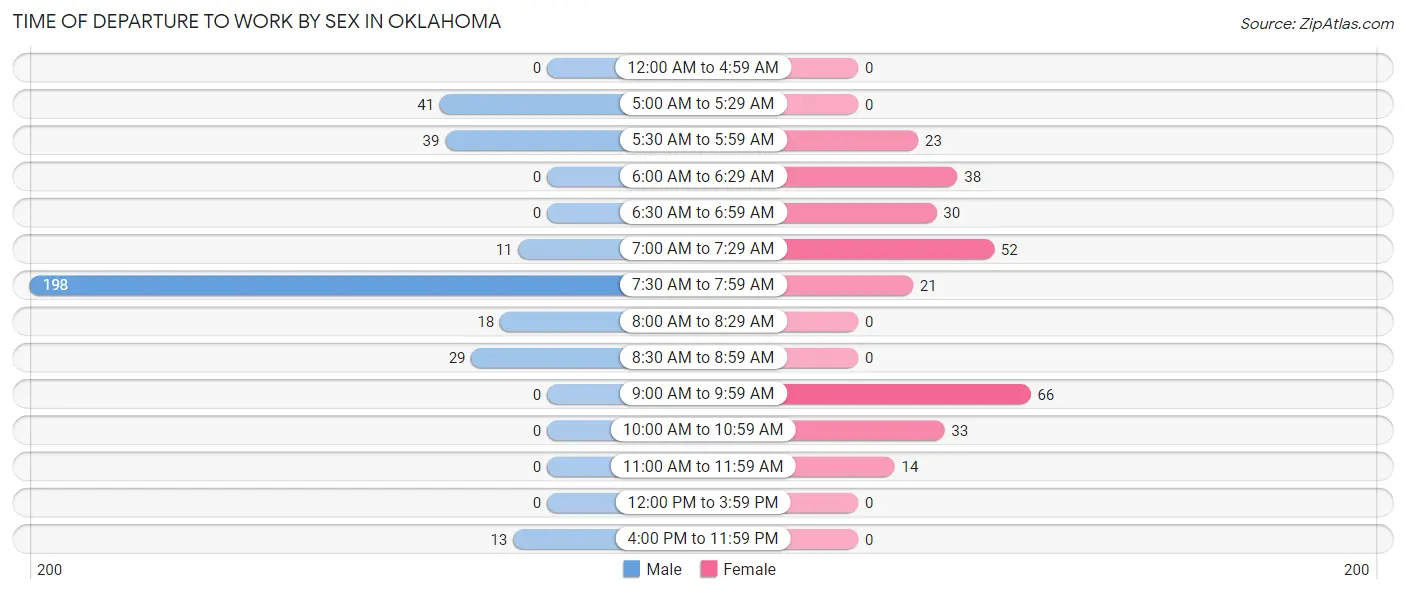
| Time of Departure | Male | Female |
| 12:00 AM to 4:59 AM | 0 (0.0%) | 0 (0.0%) |
| 5:00 AM to 5:29 AM | 41 (11.7%) | 0 (0.0%) |
| 5:30 AM to 5:59 AM | 39 (11.2%) | 23 (8.3%) |
| 6:00 AM to 6:29 AM | 0 (0.0%) | 38 (13.7%) |
| 6:30 AM to 6:59 AM | 0 (0.0%) | 30 (10.8%) |
| 7:00 AM to 7:29 AM | 11 (3.2%) | 52 (18.8%) |
| 7:30 AM to 7:59 AM | 198 (56.7%) | 21 (7.6%) |
| 8:00 AM to 8:29 AM | 18 (5.2%) | 0 (0.0%) |
| 8:30 AM to 8:59 AM | 29 (8.3%) | 0 (0.0%) |
| 9:00 AM to 9:59 AM | 0 (0.0%) | 66 (23.8%) |
| 10:00 AM to 10:59 AM | 0 (0.0%) | 33 (11.9%) |
| 11:00 AM to 11:59 AM | 0 (0.0%) | 14 (5.1%) |
| 12:00 PM to 3:59 PM | 0 (0.0%) | 0 (0.0%) |
| 4:00 PM to 11:59 PM | 13 (3.7%) | 0 (0.0%) |
| Total | 349 (100.0%) | 277 (100.0%) |
Housing Occupancy in Oklahoma
Occupancy by Ownership in Oklahoma
Of the total 453 dwellings in Oklahoma, owner-occupied units account for 300 (66.2%), while renter-occupied units make up 153 (33.8%).
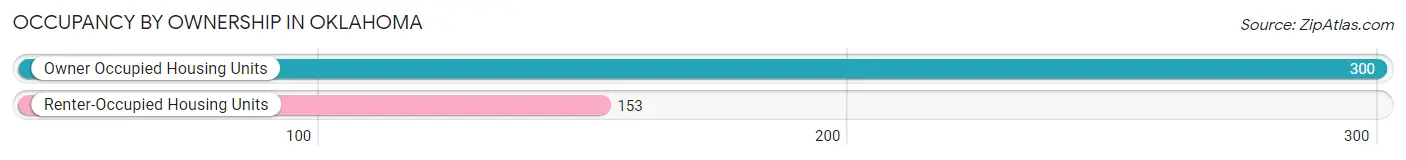
| Occupancy | # Housing Units | % Housing Units |
| Owner Occupied Housing Units | 300 | 66.2% |
| Renter-Occupied Housing Units | 153 | 33.8% |
| Total Occupied Housing Units | 453 | 100.0% |
Occupancy by Household Size in Oklahoma
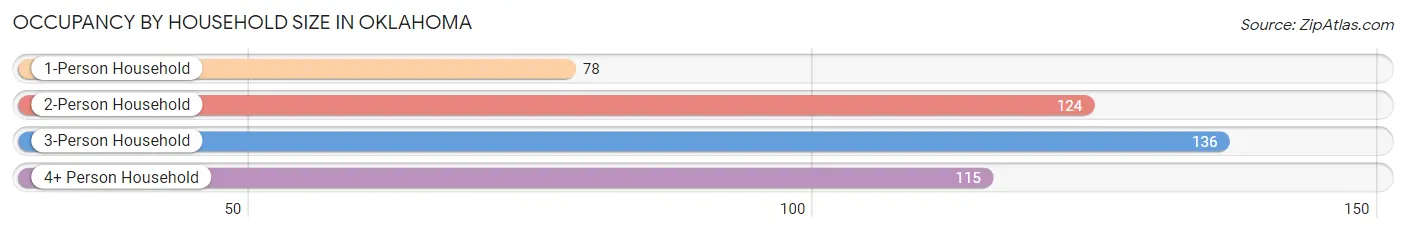
| Household Size | # Housing Units | % Housing Units |
| 1-Person Household | 78 | 17.2% |
| 2-Person Household | 124 | 27.4% |
| 3-Person Household | 136 | 30.0% |
| 4+ Person Household | 115 | 25.4% |
| Total Housing Units | 453 | 100.0% |
Occupancy by Ownership by Household Size in Oklahoma
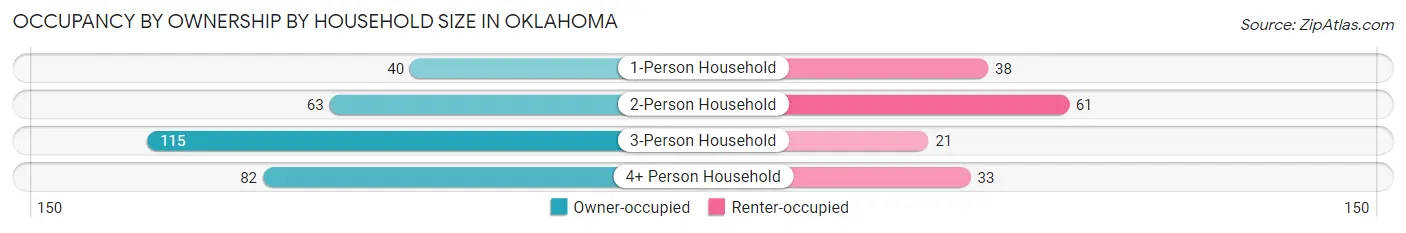
| Household Size | Owner-occupied | Renter-occupied |
| 1-Person Household | 40 (51.3%) | 38 (48.7%) |
| 2-Person Household | 63 (50.8%) | 61 (49.2%) |
| 3-Person Household | 115 (84.6%) | 21 (15.4%) |
| 4+ Person Household | 82 (71.3%) | 33 (28.7%) |
| Total Housing Units | 300 (66.2%) | 153 (33.8%) |
Occupancy by Educational Attainment in Oklahoma
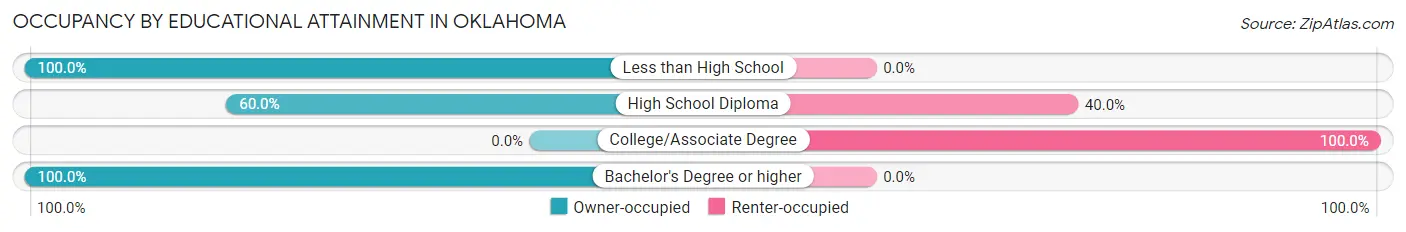
| Household Size | Owner-occupied | Renter-occupied |
| Less than High School | 26 (100.0%) | 0 (0.0%) |
| High School Diploma | 120 (60.0%) | 80 (40.0%) |
| College/Associate Degree | 0 (0.0%) | 73 (100.0%) |
| Bachelor's Degree or higher | 154 (100.0%) | 0 (0.0%) |
Occupancy by Age of Householder in Oklahoma
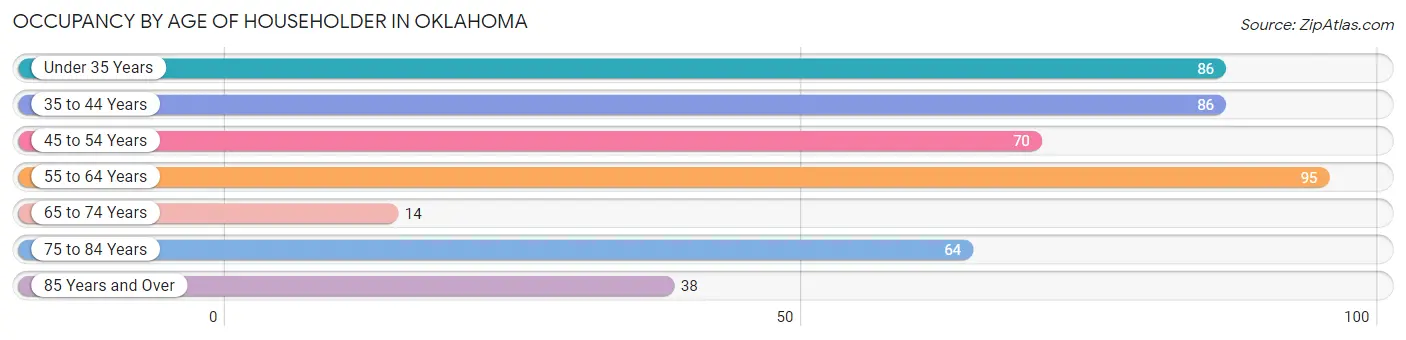
| Age Bracket | # Households | % Households |
| Under 35 Years | 86 | 19.0% |
| 35 to 44 Years | 86 | 19.0% |
| 45 to 54 Years | 70 | 15.4% |
| 55 to 64 Years | 95 | 21.0% |
| 65 to 74 Years | 14 | 3.1% |
| 75 to 84 Years | 64 | 14.1% |
| 85 Years and Over | 38 | 8.4% |
| Total | 453 | 100.0% |
Housing Finances in Oklahoma
Median Income by Occupancy in Oklahoma
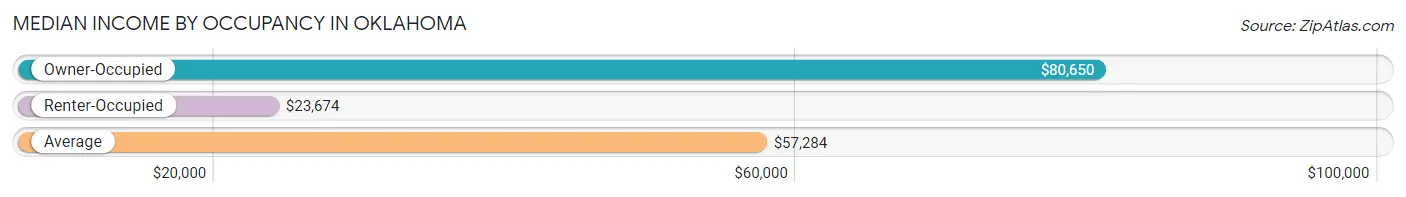
| Occupancy Type | # Households | Median Income |
| Owner-Occupied | 300 (66.2%) | $80,650 |
| Renter-Occupied | 153 (33.8%) | $23,674 |
| Average | 453 (100.0%) | $57,284 |
Occupancy by Householder Income Bracket in Oklahoma
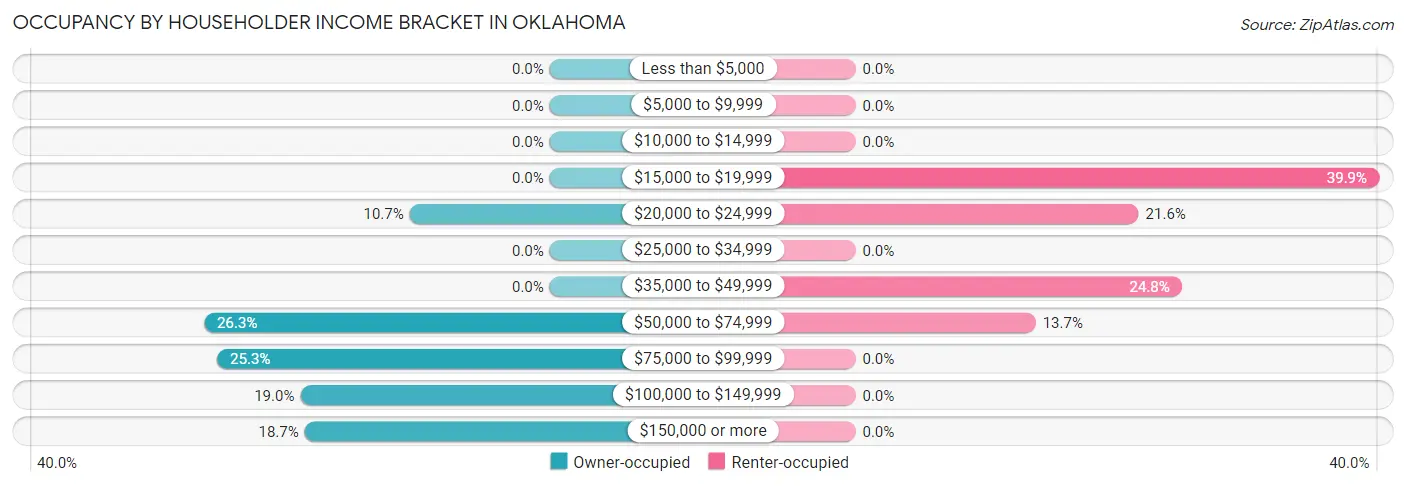
| Income Bracket | Owner-occupied | Renter-occupied |
| Less than $5,000 | 0 (0.0%) | 0 (0.0%) |
| $5,000 to $9,999 | 0 (0.0%) | 0 (0.0%) |
| $10,000 to $14,999 | 0 (0.0%) | 0 (0.0%) |
| $15,000 to $19,999 | 0 (0.0%) | 61 (39.9%) |
| $20,000 to $24,999 | 32 (10.7%) | 33 (21.6%) |
| $25,000 to $34,999 | 0 (0.0%) | 0 (0.0%) |
| $35,000 to $49,999 | 0 (0.0%) | 38 (24.8%) |
| $50,000 to $74,999 | 79 (26.3%) | 21 (13.7%) |
| $75,000 to $99,999 | 76 (25.3%) | 0 (0.0%) |
| $100,000 to $149,999 | 57 (19.0%) | 0 (0.0%) |
| $150,000 or more | 56 (18.7%) | 0 (0.0%) |
| Total | 300 (100.0%) | 153 (100.0%) |
Monthly Housing Cost Tiers in Oklahoma
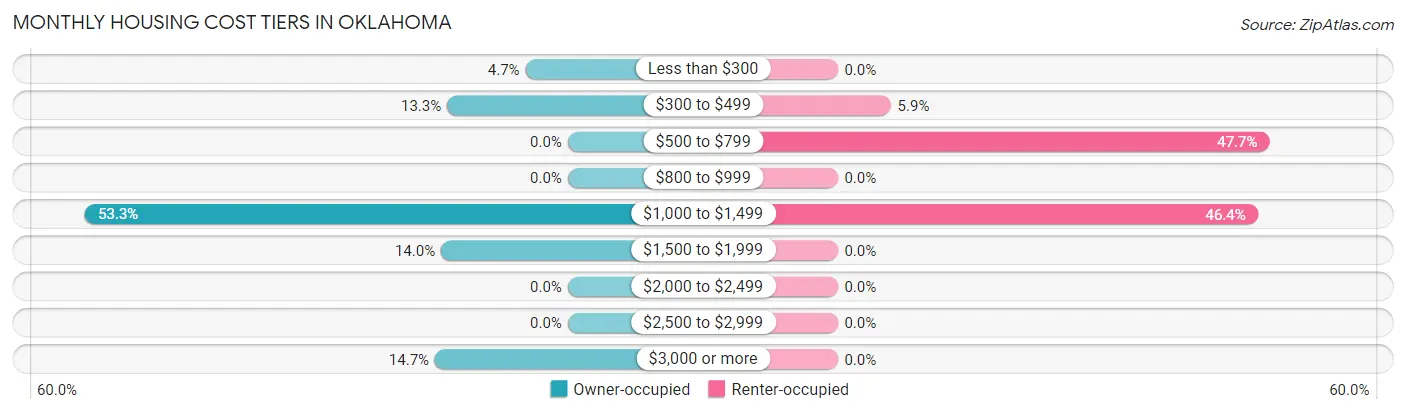
| Monthly Cost | Owner-occupied | Renter-occupied |
| Less than $300 | 14 (4.7%) | 0 (0.0%) |
| $300 to $499 | 40 (13.3%) | 9 (5.9%) |
| $500 to $799 | 0 (0.0%) | 73 (47.7%) |
| $800 to $999 | 0 (0.0%) | 0 (0.0%) |
| $1,000 to $1,499 | 160 (53.3%) | 71 (46.4%) |
| $1,500 to $1,999 | 42 (14.0%) | 0 (0.0%) |
| $2,000 to $2,499 | 0 (0.0%) | 0 (0.0%) |
| $2,500 to $2,999 | 0 (0.0%) | 0 (0.0%) |
| $3,000 or more | 44 (14.7%) | 0 (0.0%) |
| Total | 300 (100.0%) | 153 (100.0%) |
Physical Housing Characteristics in Oklahoma
Housing Structures in Oklahoma
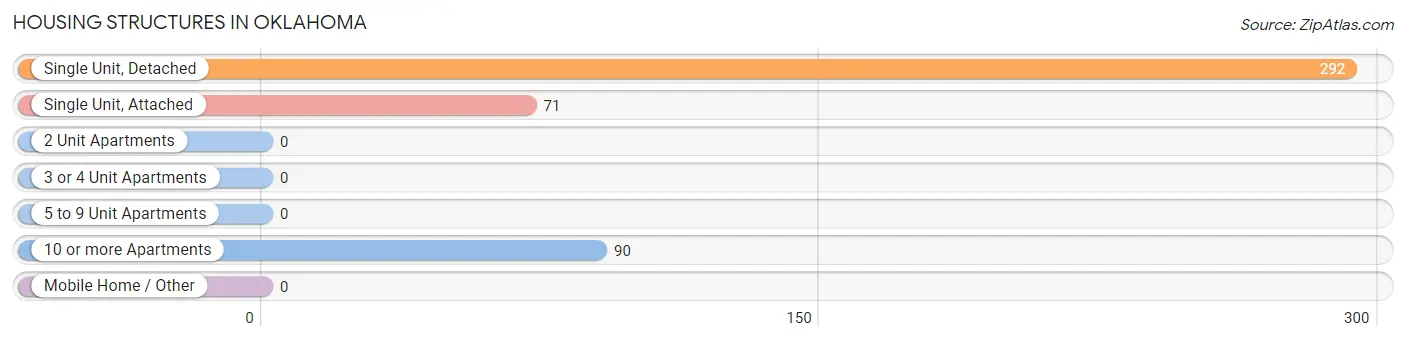
| Structure Type | # Housing Units | % Housing Units |
| Single Unit, Detached | 292 | 64.5% |
| Single Unit, Attached | 71 | 15.7% |
| 2 Unit Apartments | 0 | 0.0% |
| 3 or 4 Unit Apartments | 0 | 0.0% |
| 5 to 9 Unit Apartments | 0 | 0.0% |
| 10 or more Apartments | 90 | 19.9% |
| Mobile Home / Other | 0 | 0.0% |
| Total | 453 | 100.0% |
Housing Structures by Occupancy in Oklahoma
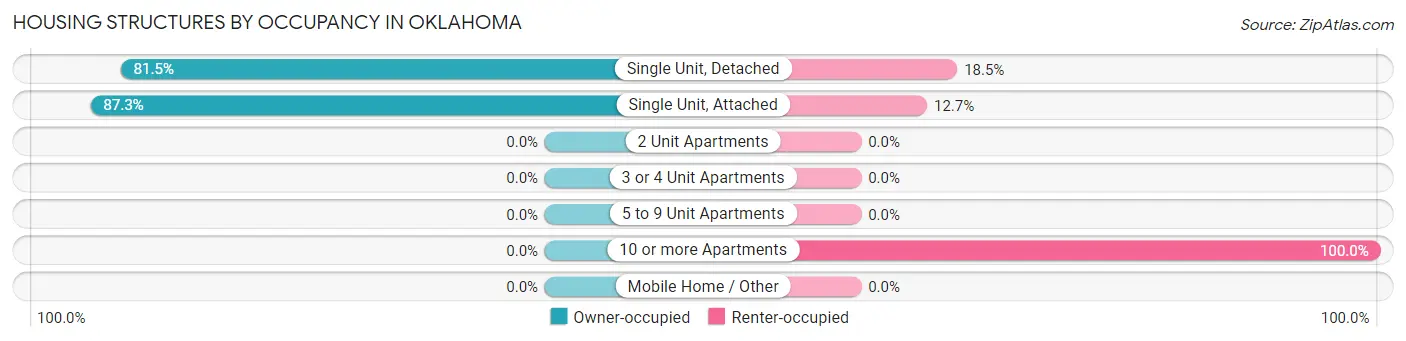
| Structure Type | Owner-occupied | Renter-occupied |
| Single Unit, Detached | 238 (81.5%) | 54 (18.5%) |
| Single Unit, Attached | 62 (87.3%) | 9 (12.7%) |
| 2 Unit Apartments | 0 (0.0%) | 0 (0.0%) |
| 3 or 4 Unit Apartments | 0 (0.0%) | 0 (0.0%) |
| 5 to 9 Unit Apartments | 0 (0.0%) | 0 (0.0%) |
| 10 or more Apartments | 0 (0.0%) | 90 (100.0%) |
| Mobile Home / Other | 0 (0.0%) | 0 (0.0%) |
| Total | 300 (66.2%) | 153 (33.8%) |
Housing Structures by Number of Rooms in Oklahoma
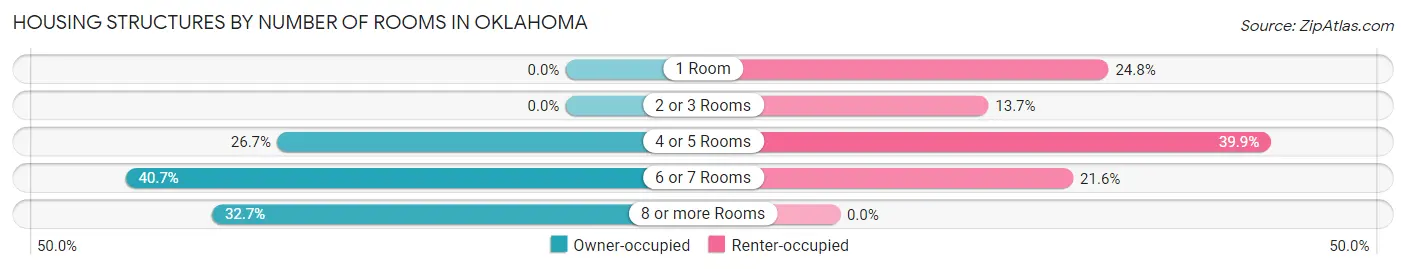
| Number of Rooms | Owner-occupied | Renter-occupied |
| 1 Room | 0 (0.0%) | 38 (24.8%) |
| 2 or 3 Rooms | 0 (0.0%) | 21 (13.7%) |
| 4 or 5 Rooms | 80 (26.7%) | 61 (39.9%) |
| 6 or 7 Rooms | 122 (40.7%) | 33 (21.6%) |
| 8 or more Rooms | 98 (32.7%) | 0 (0.0%) |
| Total | 300 (100.0%) | 153 (100.0%) |
Housing Structure by Heating Type in Oklahoma
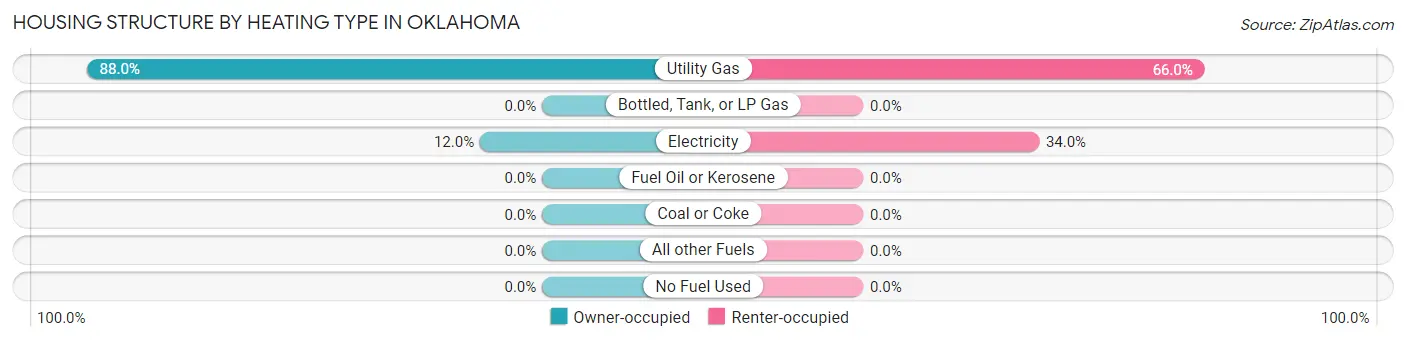
| Heating Type | Owner-occupied | Renter-occupied |
| Utility Gas | 264 (88.0%) | 101 (66.0%) |
| Bottled, Tank, or LP Gas | 0 (0.0%) | 0 (0.0%) |
| Electricity | 36 (12.0%) | 52 (34.0%) |
| Fuel Oil or Kerosene | 0 (0.0%) | 0 (0.0%) |
| Coal or Coke | 0 (0.0%) | 0 (0.0%) |
| All other Fuels | 0 (0.0%) | 0 (0.0%) |
| No Fuel Used | 0 (0.0%) | 0 (0.0%) |
| Total | 300 (100.0%) | 153 (100.0%) |
Household Vehicle Usage in Oklahoma
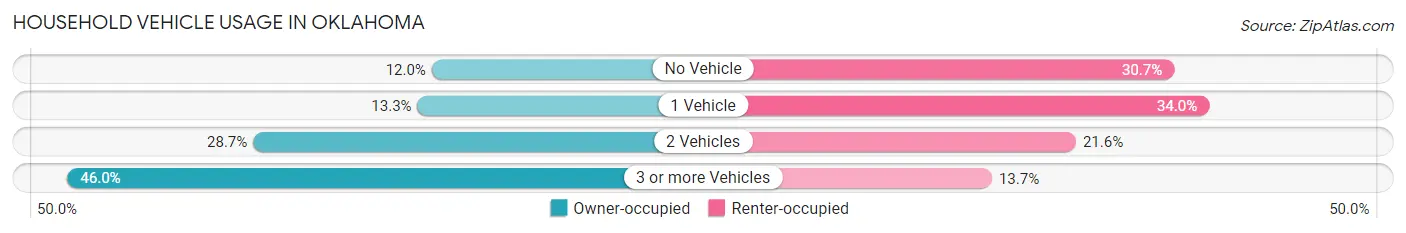
| Vehicles per Household | Owner-occupied | Renter-occupied |
| No Vehicle | 36 (12.0%) | 47 (30.7%) |
| 1 Vehicle | 40 (13.3%) | 52 (34.0%) |
| 2 Vehicles | 86 (28.7%) | 33 (21.6%) |
| 3 or more Vehicles | 138 (46.0%) | 21 (13.7%) |
| Total | 300 (100.0%) | 153 (100.0%) |
Real Estate & Mortgages in Oklahoma
Real Estate and Mortgage Overview in Oklahoma
| Characteristic | Without Mortgage | With Mortgage |
| Housing Units | 66 | 234 |
| Median Property Value | - | - |
| Median Household Income | $75,481 | $44 |
| Monthly Housing Costs | $448 | $44 |
| Real Estate Taxes | - | - |
Property Value by Mortgage Status in Oklahoma
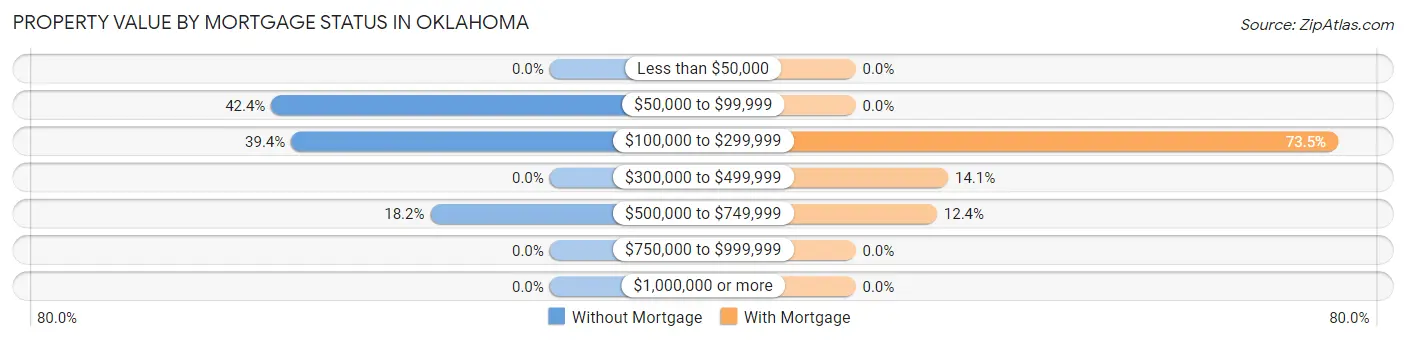
| Property Value | Without Mortgage | With Mortgage |
| Less than $50,000 | 0 (0.0%) | 0 (0.0%) |
| $50,000 to $99,999 | 28 (42.4%) | 0 (0.0%) |
| $100,000 to $299,999 | 26 (39.4%) | 172 (73.5%) |
| $300,000 to $499,999 | 0 (0.0%) | 33 (14.1%) |
| $500,000 to $749,999 | 12 (18.2%) | 29 (12.4%) |
| $750,000 to $999,999 | 0 (0.0%) | 0 (0.0%) |
| $1,000,000 or more | 0 (0.0%) | 0 (0.0%) |
| Total | 66 (100.0%) | 234 (100.0%) |
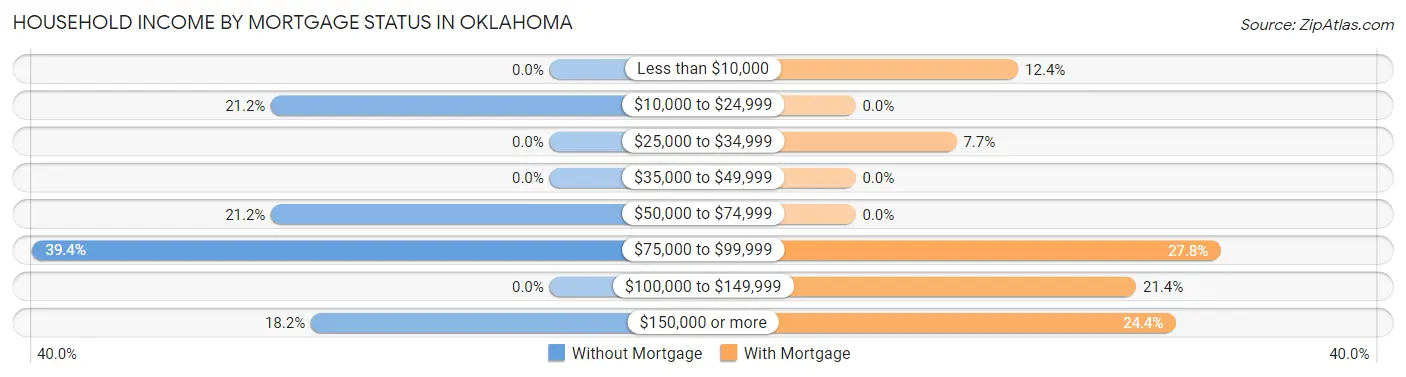
Household Income by Mortgage Status in Oklahoma
| Household Income | Without Mortgage | With Mortgage |
| Less than $10,000 | 0 (0.0%) | 29 (12.4%) |
| $10,000 to $24,999 | 14 (21.2%) | 0 (0.0%) |
| $25,000 to $34,999 | 0 (0.0%) | 18 (7.7%) |
| $35,000 to $49,999 | 0 (0.0%) | 0 (0.0%) |
| $50,000 to $74,999 | 14 (21.2%) | 0 (0.0%) |
| $75,000 to $99,999 | 26 (39.4%) | 65 (27.8%) |
| $100,000 to $149,999 | 0 (0.0%) | 50 (21.4%) |
| $150,000 or more | 12 (18.2%) | 57 (24.4%) |
| Total | 66 (100.0%) | 234 (100.0%) |
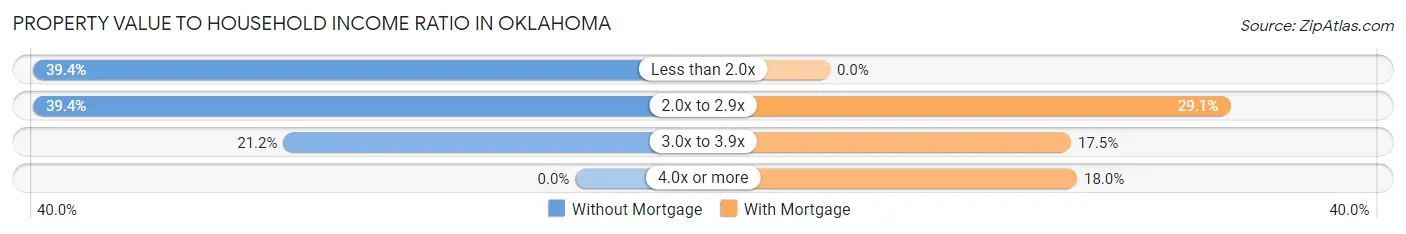
Property Value to Household Income Ratio in Oklahoma
| Value-to-Income Ratio | Without Mortgage | With Mortgage |
| Less than 2.0x | 26 (39.4%) | 0 (0.0%) |
| 2.0x to 2.9x | 26 (39.4%) | 68 (29.1%) |
| 3.0x to 3.9x | 14 (21.2%) | 41 (17.5%) |
| 4.0x or more | 0 (0.0%) | 42 (17.9%) |
| Total | 66 (100.0%) | 234 (100.0%) |
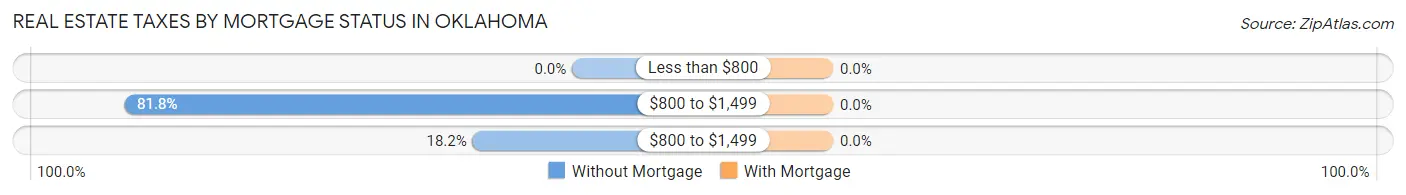
Real Estate Taxes by Mortgage Status in Oklahoma
| Property Taxes | Without Mortgage | With Mortgage |
| Less than $800 | 0 (0.0%) | 0 (0.0%) |
| $800 to $1,499 | 54 (81.8%) | 0 (0.0%) |
| $800 to $1,499 | 12 (18.2%) | 0 (0.0%) |
| Total | 66 (100.0%) | 234 (100.0%) |
Health & Disability in Oklahoma
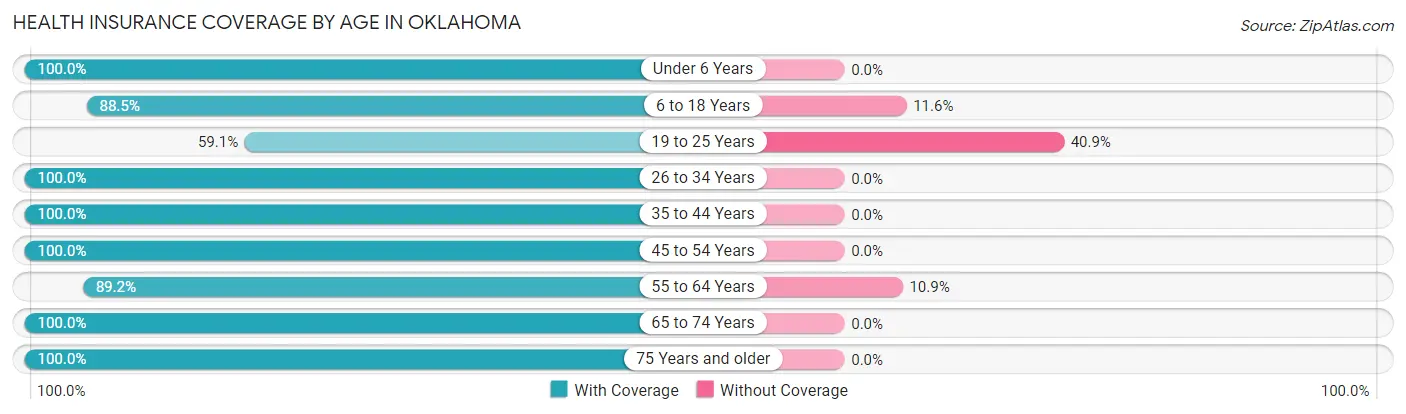
Health Insurance Coverage by Age in Oklahoma
| Age Bracket | With Coverage | Without Coverage |
| Under 6 Years | 126 (100.0%) | 0 (0.0%) |
| 6 to 18 Years | 245 (88.4%) | 32 (11.6%) |
| 19 to 25 Years | 52 (59.1%) | 36 (40.9%) |
| 26 to 34 Years | 250 (100.0%) | 0 (0.0%) |
| 35 to 44 Years | 138 (100.0%) | 0 (0.0%) |
| 45 to 54 Years | 70 (100.0%) | 0 (0.0%) |
| 55 to 64 Years | 189 (89.1%) | 23 (10.8%) |
| 65 to 74 Years | 14 (100.0%) | 0 (0.0%) |
| 75 Years and older | 166 (100.0%) | 0 (0.0%) |
| Total | 1,250 (93.2%) | 91 (6.8%) |
Health Insurance Coverage by Citizenship Status in Oklahoma
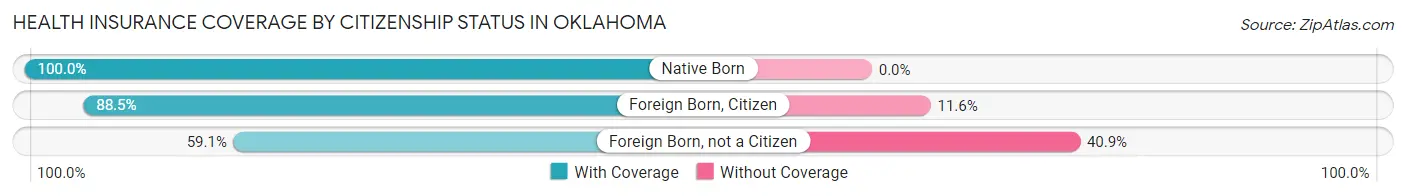
| Citizenship Status | With Coverage | Without Coverage |
| Native Born | 126 (100.0%) | 0 (0.0%) |
| Foreign Born, Citizen | 245 (88.4%) | 32 (11.6%) |
| Foreign Born, not a Citizen | 52 (59.1%) | 36 (40.9%) |
Health Insurance Coverage by Household Income in Oklahoma
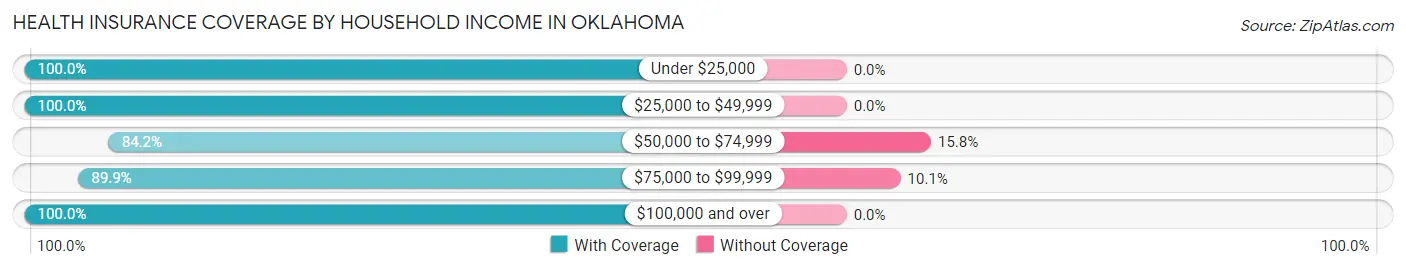
| Household Income | With Coverage | Without Coverage |
| Under $25,000 | 312 (100.0%) | 0 (0.0%) |
| $25,000 to $49,999 | 38 (100.0%) | 0 (0.0%) |
| $50,000 to $74,999 | 363 (84.2%) | 68 (15.8%) |
| $75,000 to $99,999 | 205 (89.9%) | 23 (10.1%) |
| $100,000 and over | 332 (100.0%) | 0 (0.0%) |
Public vs Private Health Insurance Coverage by Age in Oklahoma
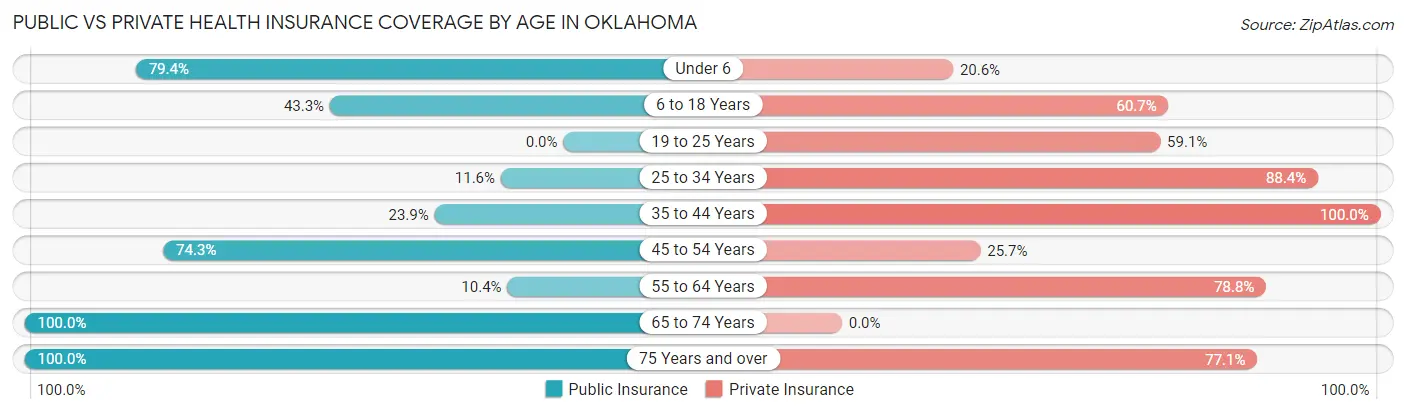
| Age Bracket | Public Insurance | Private Insurance |
| Under 6 | 100 (79.4%) | 26 (20.6%) |
| 6 to 18 Years | 120 (43.3%) | 168 (60.7%) |
| 19 to 25 Years | 0 (0.0%) | 52 (59.1%) |
| 25 to 34 Years | 29 (11.6%) | 221 (88.4%) |
| 35 to 44 Years | 33 (23.9%) | 138 (100.0%) |
| 45 to 54 Years | 52 (74.3%) | 18 (25.7%) |
| 55 to 64 Years | 22 (10.4%) | 167 (78.8%) |
| 65 to 74 Years | 14 (100.0%) | 0 (0.0%) |
| 75 Years and over | 166 (100.0%) | 128 (77.1%) |
| Total | 536 (40.0%) | 918 (68.5%) |
Disability Status by Sex by Age in Oklahoma
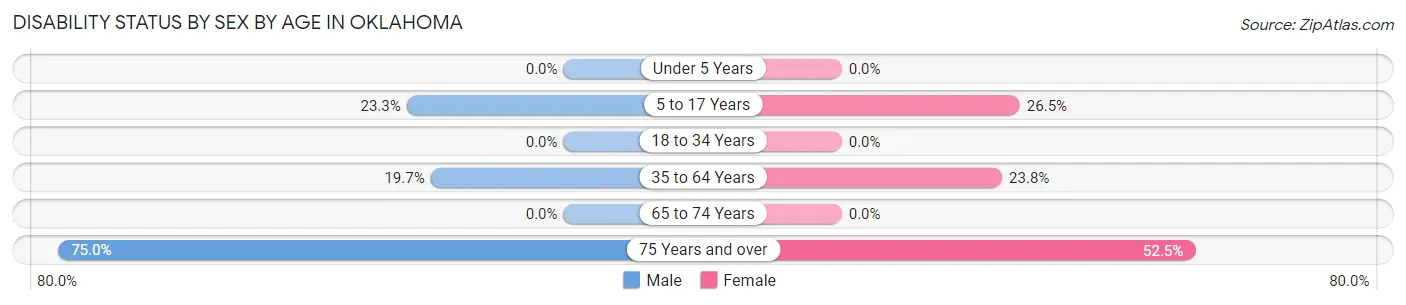
| Age Bracket | Male | Female |
| Under 5 Years | 0 (0.0%) | 0 (0.0%) |
| 5 to 17 Years | 44 (23.3%) | 32 (26.5%) |
| 18 to 34 Years | 0 (0.0%) | 0 (0.0%) |
| 35 to 64 Years | 29 (19.7%) | 65 (23.8%) |
| 65 to 74 Years | 0 (0.0%) | 0 (0.0%) |
| 75 Years and over | 33 (75.0%) | 64 (52.5%) |
Disability Class by Sex by Age in Oklahoma
Disability Class: Hearing Difficulty
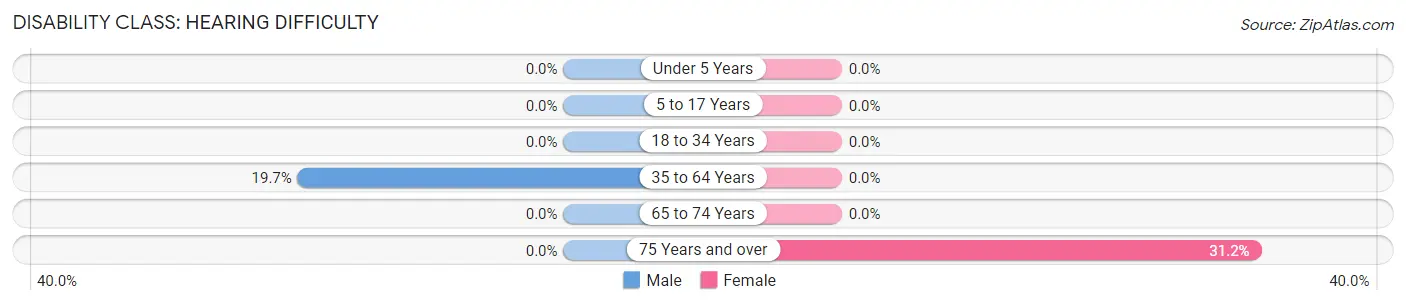
| Age Bracket | Male | Female |
| Under 5 Years | 0 (0.0%) | 0 (0.0%) |
| 5 to 17 Years | 0 (0.0%) | 0 (0.0%) |
| 18 to 34 Years | 0 (0.0%) | 0 (0.0%) |
| 35 to 64 Years | 29 (19.7%) | 0 (0.0%) |
| 65 to 74 Years | 0 (0.0%) | 0 (0.0%) |
| 75 Years and over | 0 (0.0%) | 38 (31.1%) |
Disability Class: Vision Difficulty
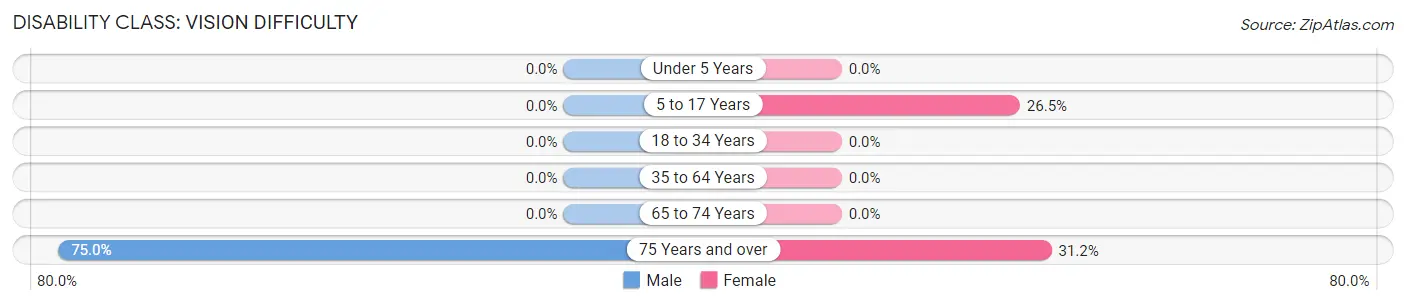
| Age Bracket | Male | Female |
| Under 5 Years | 0 (0.0%) | 0 (0.0%) |
| 5 to 17 Years | 0 (0.0%) | 32 (26.5%) |
| 18 to 34 Years | 0 (0.0%) | 0 (0.0%) |
| 35 to 64 Years | 0 (0.0%) | 0 (0.0%) |
| 65 to 74 Years | 0 (0.0%) | 0 (0.0%) |
| 75 Years and over | 33 (75.0%) | 38 (31.1%) |
Disability Class: Cognitive Difficulty
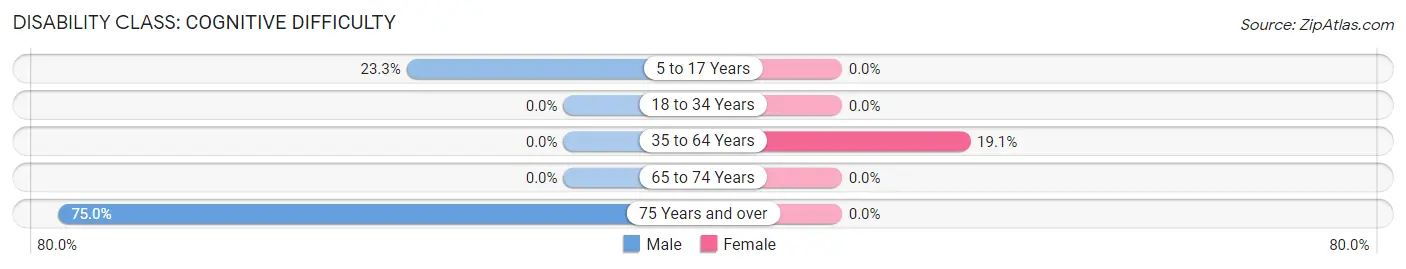
| Age Bracket | Male | Female |
| 5 to 17 Years | 44 (23.3%) | 0 (0.0%) |
| 18 to 34 Years | 0 (0.0%) | 0 (0.0%) |
| 35 to 64 Years | 0 (0.0%) | 52 (19.1%) |
| 65 to 74 Years | 0 (0.0%) | 0 (0.0%) |
| 75 Years and over | 33 (75.0%) | 0 (0.0%) |
Disability Class: Ambulatory Difficulty
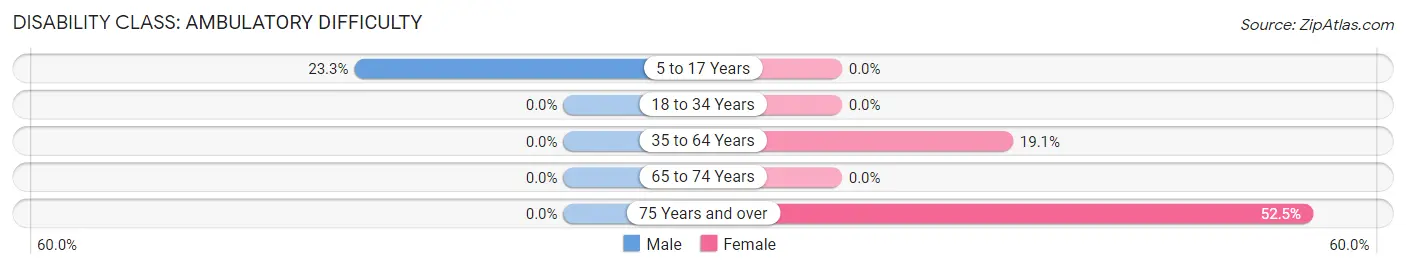
| Age Bracket | Male | Female |
| 5 to 17 Years | 44 (23.3%) | 0 (0.0%) |
| 18 to 34 Years | 0 (0.0%) | 0 (0.0%) |
| 35 to 64 Years | 0 (0.0%) | 52 (19.1%) |
| 65 to 74 Years | 0 (0.0%) | 0 (0.0%) |
| 75 Years and over | 0 (0.0%) | 64 (52.5%) |
Disability Class: Self-Care Difficulty
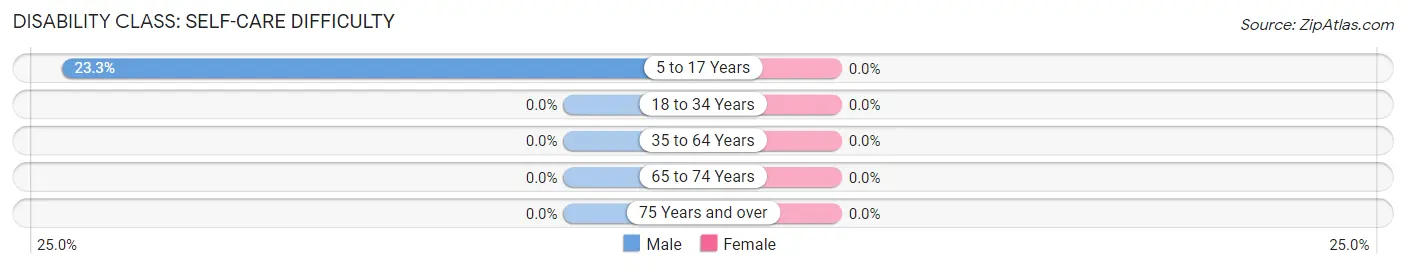
| Age Bracket | Male | Female |
| 5 to 17 Years | 44 (23.3%) | 0 (0.0%) |
| 18 to 34 Years | 0 (0.0%) | 0 (0.0%) |
| 35 to 64 Years | 0 (0.0%) | 0 (0.0%) |
| 65 to 74 Years | 0 (0.0%) | 0 (0.0%) |
| 75 Years and over | 0 (0.0%) | 0 (0.0%) |
Technology Access in Oklahoma
Computing Device Access in Oklahoma
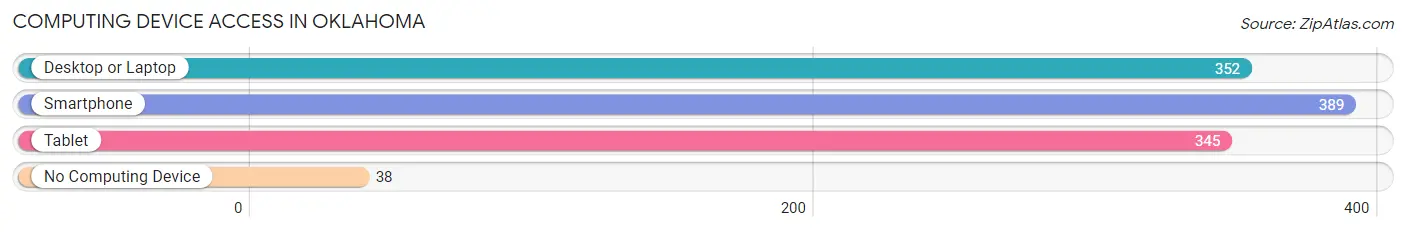
| Device Type | # Households | % Households |
| Desktop or Laptop | 352 | 77.7% |
| Smartphone | 389 | 85.9% |
| Tablet | 345 | 76.2% |
| No Computing Device | 38 | 8.4% |
| Total | 453 | 100.0% |
Internet Access in Oklahoma
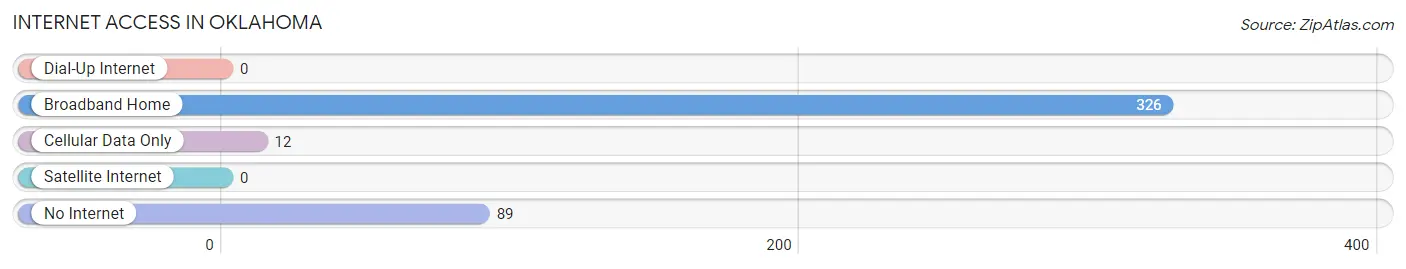
| Internet Type | # Households | % Households |
| Dial-Up Internet | 0 | 0.0% |
| Broadband Home | 326 | 72.0% |
| Cellular Data Only | 12 | 2.6% |
| Satellite Internet | 0 | 0.0% |
| No Internet | 89 | 19.7% |
| Total | 453 | 100.0% |
Oklahoma Summary
Oklahoma is a state located in the South Central region of the United States. It is bordered by Arkansas and Missouri to the east, Kansas to the north, Texas to the south and west, and New Mexico to the west. Oklahoma is the 20th most extensive and the 28th most populous of the 50 United States. The state's name is derived from the Choctaw words okla and humma, meaning "red people". It is also known informally by its nickname, The Sooner State, in reference to the non-Native settlers who staked their claims on the choicest pieces of land before the official opening date of lands in the western Oklahoma Territory or before the Indian Appropriations Act of 1889, which increased European-American settlement in the eastern Indian Territory.
History
The area now known as Oklahoma was first settled by Native Americans, including the Caddo, Comanche, Osage, and Quapaw. The first European to visit the region was Spanish explorer Francisco Vásquez de Coronado in 1541. In the early 1800s, the United States government began to negotiate treaties with the Native American tribes in the area, culminating in the Treaty of Dancing Rabbit Creek in 1830, which removed the Choctaw Nation from the southeastern United States to the area now known as Oklahoma.
In 1889, the Oklahoma Organic Act was passed, creating the Oklahoma Territory. The act opened up the area to non-Native settlers, and the land rush of 1889 saw thousands of settlers flock to the area. In 1907, Oklahoma became the 46th state admitted to the Union.
Geography
Oklahoma is located in the South Central region of the United States. It is bordered by Arkansas and Missouri to the east, Kansas to the north, Texas to the south and west, and New Mexico to the west. Oklahoma is the 20th most extensive and the 28th most populous of the 50 United States.
The state is divided into 77 counties and contains five primary physiographic regions: the Ozark Mountains in the northeast, the Ouachita Mountains in the southeast, the Arbuckle Mountains in the south-central region, the Wichita Mountains in the southwest, and the Great Plains in the northwest. The state's highest point is Black Mesa, at 4,973 feet (1,516 m).
Economy
Oklahoma's economy is largely based on the production of oil and natural gas, agriculture, and manufacturing. The state is the third-largest producer of natural gas in the United States and the fifth-largest producer of crude oil. Oklahoma is also a major producer of wheat, cotton, and other agricultural products.
The state's manufacturing sector is diverse, with products ranging from aircraft components to food processing. Oklahoma is also home to several major corporations, including American Airlines, AT&T, Boeing, Dell, and Walmart.
Demographics
As of the 2010 United States Census, Oklahoma had a population of 3,751,616. The racial makeup of the state was 68.1% White, 8.2% African American, 8.9% Native American, 2.9% Asian, 0.1% Pacific Islander, and 8.7% from two or more races. Hispanic or Latino of any race were 10.5% of the population.
The median household income in Oklahoma was $45,690 in 2019, and the median family income was $54,945. The poverty rate was 16.2%. The state's population is largely rural, with only 17.3% of the population living in urban areas.
Common Questions
What is Per Capita Income in Oklahoma?
Per Capita income in Oklahoma is $36,214.
What is the Median Family Income in Oklahoma?
Median Family Income in Oklahoma is $56,595.
What is the Median Household income in Oklahoma?
Median Household Income in Oklahoma is $57,284.
What is Income or Wage Gap in Oklahoma?
Income or Wage Gap in Oklahoma is 54.7%.
Women in Oklahoma earn 45.3 cents for every dollar earned by a man.
What is Inequality or Gini Index in Oklahoma?
Inequality or Gini Index in Oklahoma is 0.51.
What is the Total Population of Oklahoma?
Total Population of Oklahoma is 1,366.
What is the Total Male Population of Oklahoma?
Total Male Population of Oklahoma is 698.
What is the Total Female Population of Oklahoma?
Total Female Population of Oklahoma is 668.
What is the Ratio of Males per 100 Females in Oklahoma?
There are 104.49 Males per 100 Females in Oklahoma.
What is the Ratio of Females per 100 Males in Oklahoma?
There are 95.70 Females per 100 Males in Oklahoma.
What is the Median Population Age in Oklahoma?
Median Population Age in Oklahoma is 32.7 Years.
What is the Average Family Size in Oklahoma
Average Family Size in Oklahoma is 3.3 People.
What is the Average Household Size in Oklahoma
Average Household Size in Oklahoma is 3.0 People.
How Large is the Labor Force in Oklahoma?
There are 626 People in the Labor Forcein in Oklahoma.
What is the Percentage of People in the Labor Force in Oklahoma?
65.0% of People are in the Labor Force in Oklahoma.