Greens Landing, PA Map & Demographics
Greens Landing Map
Greens Landing Overview
$32,601
PER CAPITA INCOME
$71,442
AVG HOUSEHOLD INCOME
0.39
INEQUALITY / GINI INDEX
561
TOTAL POPULATION
264
MALE POPULATION
297
FEMALE POPULATION
88.89
MALES / 100 FEMALES
112.50
FEMALES / 100 MALES
38.6
MEDIAN AGE
3.4
AVG FAMILY SIZE
2.7
AVG HOUSEHOLD SIZE
262
LABOR FORCE [ PEOPLE ]
55.5%
PERCENT IN LABOR FORCE
4.6%
UNEMPLOYMENT RATE
Income in Greens Landing
Income Overview in Greens Landing
| Characteristic | Number | Measure |
| Per Capita Income | 561 | $32,601 |
| Median Family Income | 133 | $0 |
| Mean Family Income | 133 | $103,762 |
| Median Household Income | 207 | $71,442 |
| Mean Household Income | 207 | $87,136 |
| Income Deficit | 133 | $0 |
| Wage / Income Gap (%) | 561 | 0.00% |
| Wage / Income Gap ($) | 561 | 100.00¢ per $1 |
| Gini / Inequality Index | 561 | 0.39 |
Earnings by Sex in Greens Landing
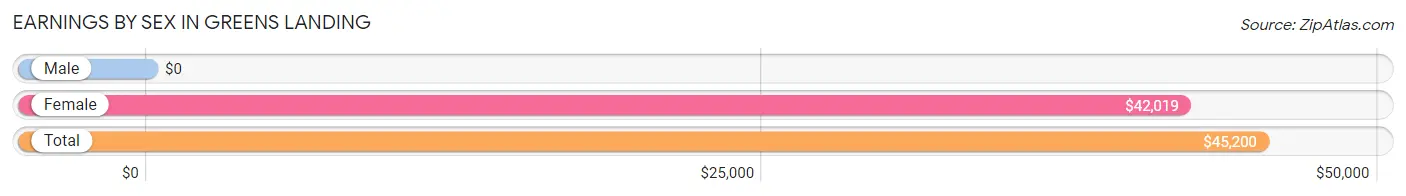
| Sex | Number | Average Earnings |
| Male | 135 (49.6%) | $0 |
| Female | 137 (50.4%) | $42,019 |
| Total | 272 (100.0%) | $45,200 |
Earnings by Sex by Income Bracket in Greens Landing
The most common earnings brackets in Greens Landing are $75,000 to $99,999 for men (32 | 23.7%) and $45,000 to $49,999 for women (55 | 40.2%).
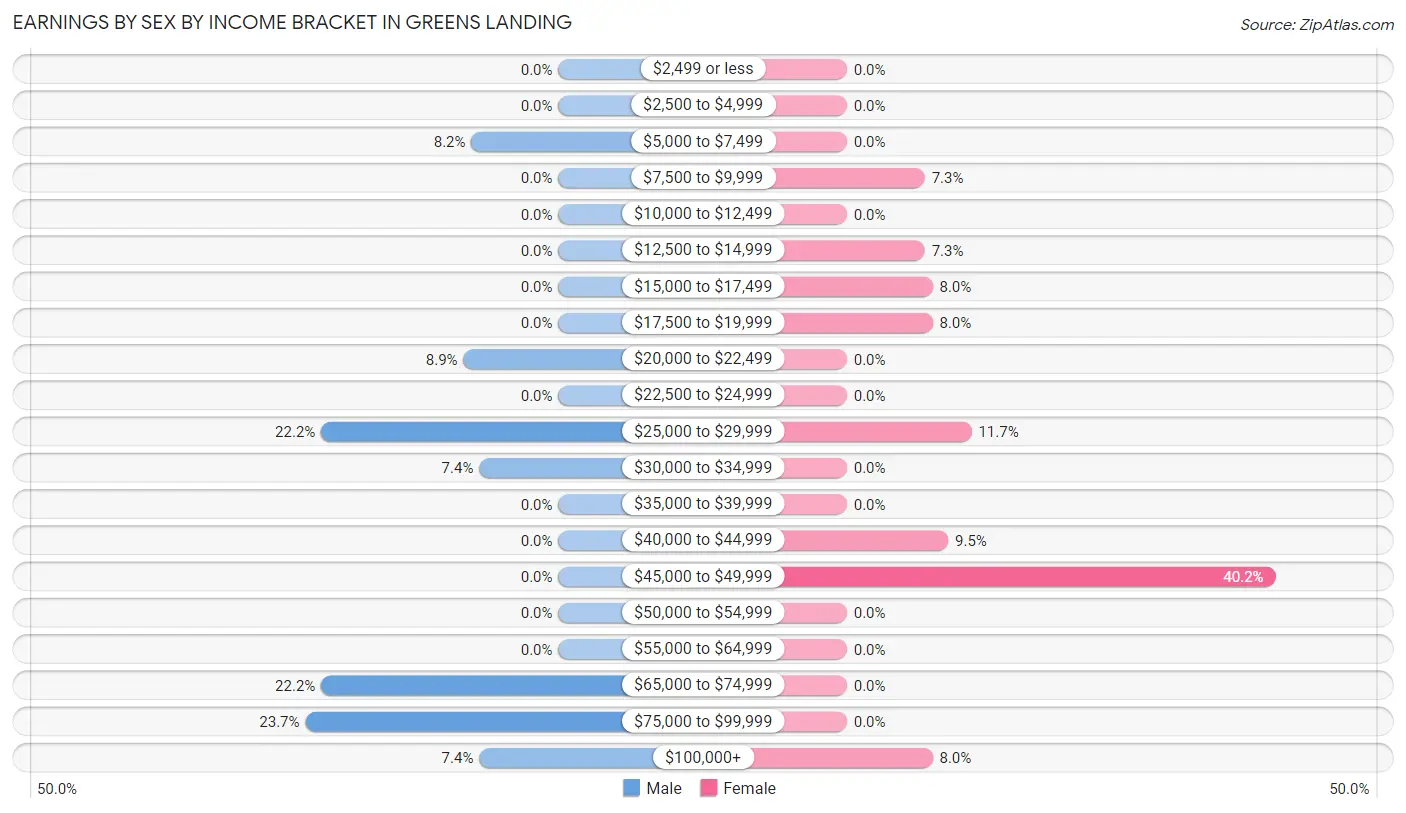
| Income | Male | Female |
| $2,499 or less | 0 (0.0%) | 0 (0.0%) |
| $2,500 to $4,999 | 0 (0.0%) | 0 (0.0%) |
| $5,000 to $7,499 | 11 (8.2%) | 0 (0.0%) |
| $7,500 to $9,999 | 0 (0.0%) | 10 (7.3%) |
| $10,000 to $12,499 | 0 (0.0%) | 0 (0.0%) |
| $12,500 to $14,999 | 0 (0.0%) | 10 (7.3%) |
| $15,000 to $17,499 | 0 (0.0%) | 11 (8.0%) |
| $17,500 to $19,999 | 0 (0.0%) | 11 (8.0%) |
| $20,000 to $22,499 | 12 (8.9%) | 0 (0.0%) |
| $22,500 to $24,999 | 0 (0.0%) | 0 (0.0%) |
| $25,000 to $29,999 | 30 (22.2%) | 16 (11.7%) |
| $30,000 to $34,999 | 10 (7.4%) | 0 (0.0%) |
| $35,000 to $39,999 | 0 (0.0%) | 0 (0.0%) |
| $40,000 to $44,999 | 0 (0.0%) | 13 (9.5%) |
| $45,000 to $49,999 | 0 (0.0%) | 55 (40.2%) |
| $50,000 to $54,999 | 0 (0.0%) | 0 (0.0%) |
| $55,000 to $64,999 | 0 (0.0%) | 0 (0.0%) |
| $65,000 to $74,999 | 30 (22.2%) | 0 (0.0%) |
| $75,000 to $99,999 | 32 (23.7%) | 0 (0.0%) |
| $100,000+ | 10 (7.4%) | 11 (8.0%) |
| Total | 135 (100.0%) | 137 (100.0%) |
Earnings by Sex by Educational Attainment in Greens Landing
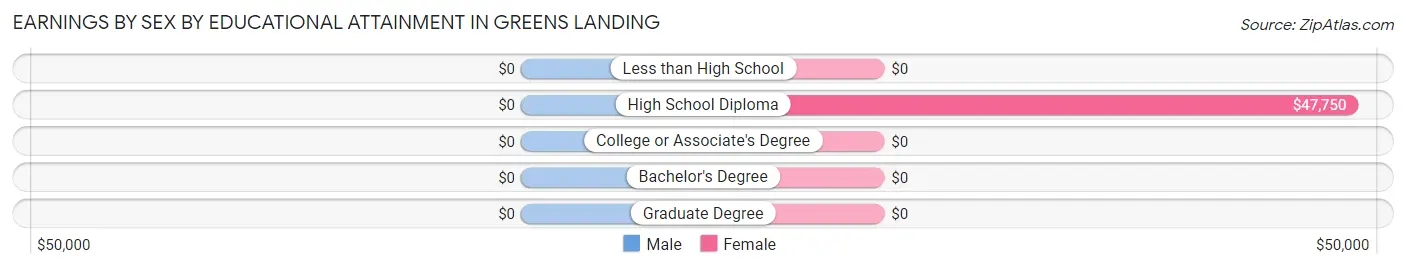
| Educational Attainment | Male Income | Female Income |
| Less than High School | - | - |
| High School Diploma | - | - |
| College or Associate's Degree | - | - |
| Bachelor's Degree | - | - |
| Graduate Degree | - | - |
| Total | $69,519 | $41,827 |
Family Income in Greens Landing
Family Income Brackets in Greens Landing
According to the Greens Landing family income data, there are 43 families falling into the $150,000 to $199,999 income range, which is the most common income bracket and makes up 32.3% of all families.

| Income Bracket | # Families | % Families |
| Less than $10,000 | 0 | 0.0% |
| $10,000 to $14,999 | 0 | 0.0% |
| $15,000 to $24,999 | 0 | 0.0% |
| $25,000 to $34,999 | 30 | 22.6% |
| $35,000 to $49,999 | 16 | 12.0% |
| $50,000 to $74,999 | 11 | 8.3% |
| $75,000 to $99,999 | 21 | 15.8% |
| $100,000 to $149,999 | 12 | 9.0% |
| $150,000 to $199,999 | 43 | 32.3% |
| $200,000+ | 0 | 0.0% |
Family Income by Famaliy Size in Greens Landing
2-person families (48 | 36.1%) account for the highest median family income in Greens Landing with $86,818 per family, while 2-person families (48 | 36.1%) have the highest median income of $43,409 per family member.
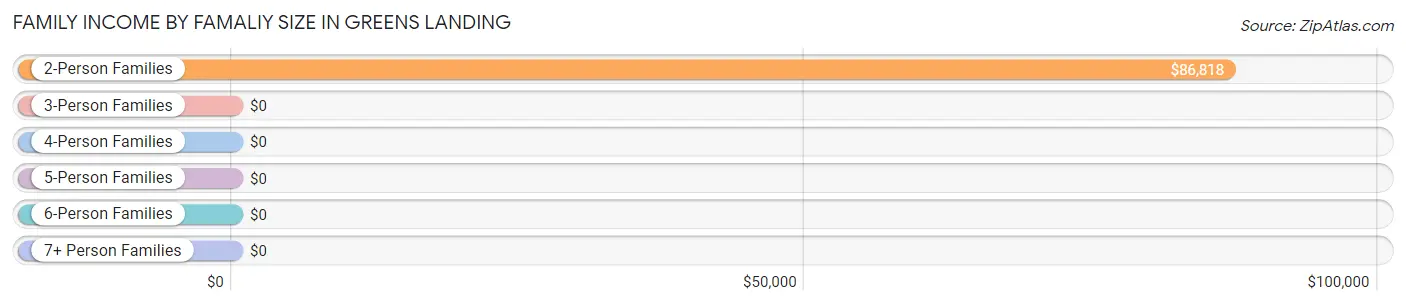
| Income Bracket | # Families | Median Income |
| 2-Person Families | 48 (36.1%) | $86,818 |
| 3-Person Families | 12 (9.0%) | $0 |
| 4-Person Families | 32 (24.1%) | $0 |
| 5-Person Families | 41 (30.8%) | $0 |
| 6-Person Families | 0 (0.0%) | $0 |
| 7+ Person Families | 0 (0.0%) | $0 |
| Total | 133 (100.0%) | $0 |
Family Income by Number of Earners in Greens Landing
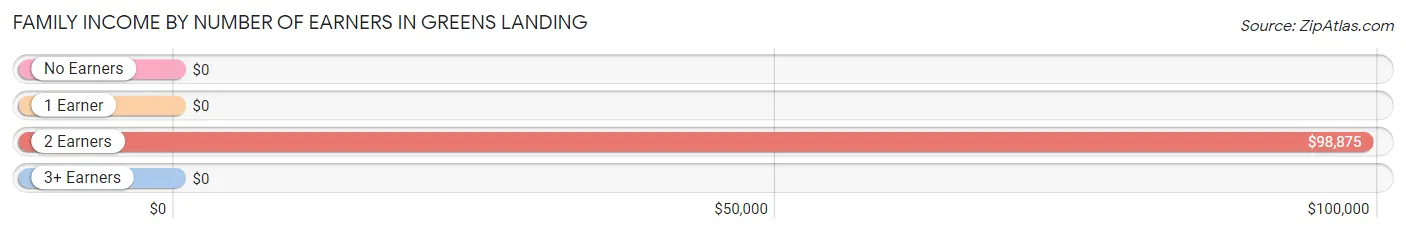
| Number of Earners | # Families | Median Income |
| No Earners | 16 (12.0%) | $0 |
| 1 Earner | 30 (22.6%) | $0 |
| 2 Earners | 55 (41.3%) | $98,875 |
| 3+ Earners | 32 (24.1%) | $0 |
| Total | 133 (100.0%) | $0 |
Household Income in Greens Landing
Household Income Brackets in Greens Landing
With 43 households falling in the category, the $150,000 to $199,999 income range is the most frequent in Greens Landing, accounting for 20.8% of all households.
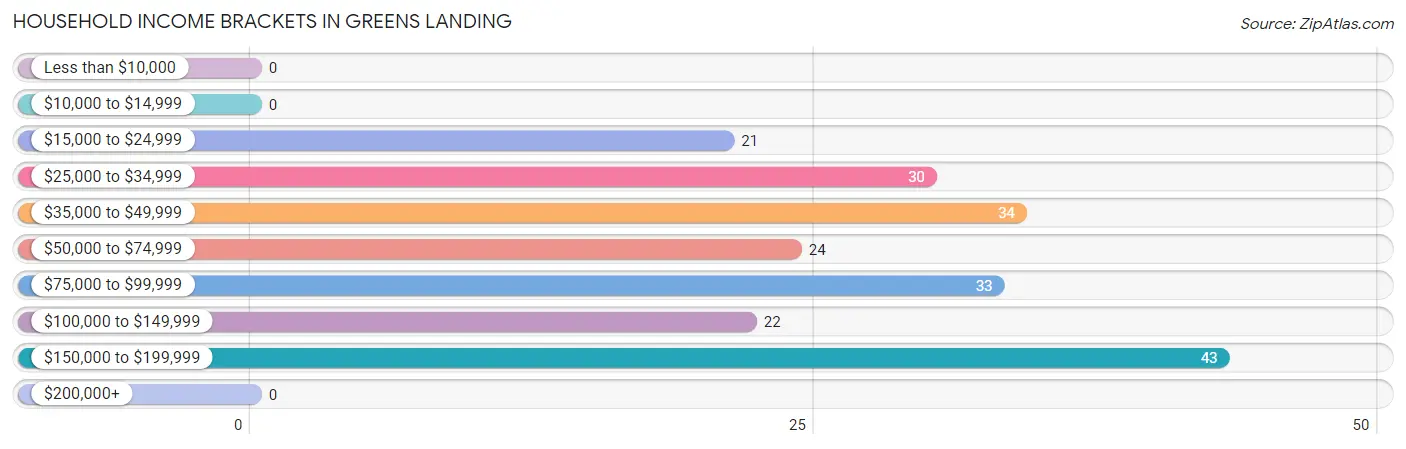
| Income Bracket | # Households | % Households |
| Less than $10,000 | 0 | 0.0% |
| $10,000 to $14,999 | 0 | 0.0% |
| $15,000 to $24,999 | 21 | 10.1% |
| $25,000 to $34,999 | 30 | 14.5% |
| $35,000 to $49,999 | 34 | 16.4% |
| $50,000 to $74,999 | 24 | 11.6% |
| $75,000 to $99,999 | 33 | 15.9% |
| $100,000 to $149,999 | 22 | 10.6% |
| $150,000 to $199,999 | 43 | 20.8% |
| $200,000+ | 0 | 0.0% |
Household Income by Householder Age in Greens Landing
| Income Bracket | # Households | Median Income |
| 15 to 24 Years | 13 (6.3%) | $0 |
| 25 to 44 Years | 70 (33.8%) | $0 |
| 45 to 64 Years | 77 (37.2%) | $0 |
| 65+ Years | 47 (22.7%) | $0 |
| Total | 207 (100.0%) | $71,442 |
Poverty in Greens Landing
Income Below Poverty by Sex and Age in Greens Landing
With 34.5% poverty level for males and 29.0% for females among the residents of Greens Landing, 16 and 17 year old males and 16 and 17 year old females are the most vulnerable to poverty, with 34 males (100.0%) and 27 females (100.0%) in their respective age groups living below the poverty level.
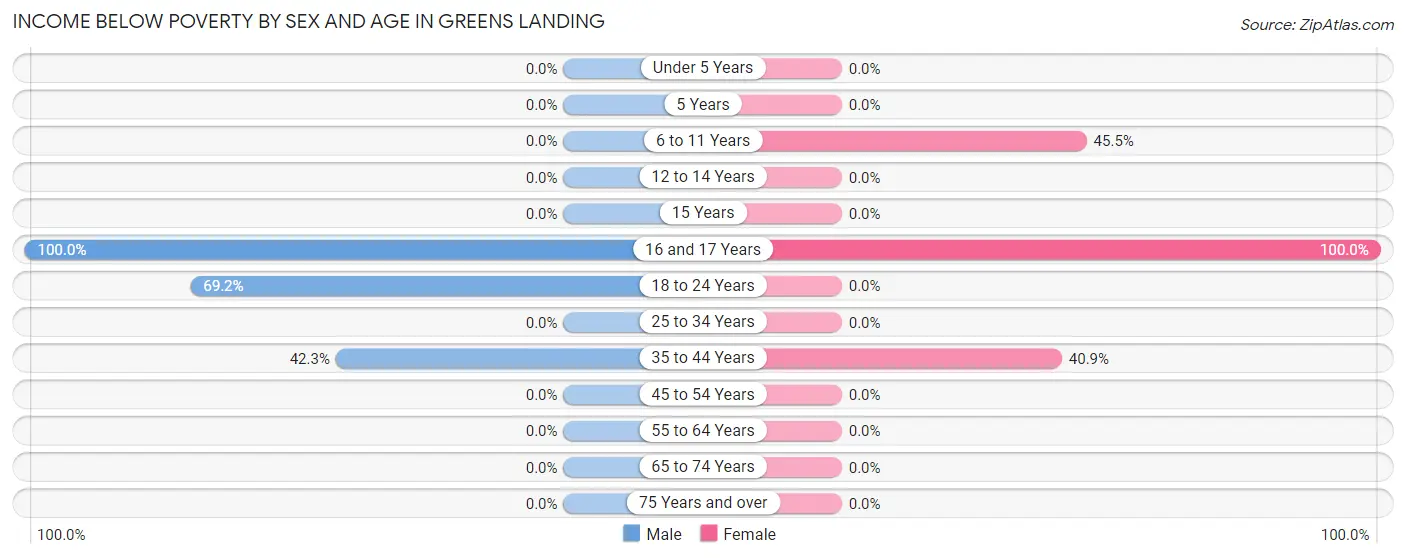
| Age Bracket | Male | Female |
| Under 5 Years | 0 (0.0%) | 0 (0.0%) |
| 5 Years | 0 (0.0%) | 0 (0.0%) |
| 6 to 11 Years | 0 (0.0%) | 30 (45.5%) |
| 12 to 14 Years | 0 (0.0%) | 0 (0.0%) |
| 15 Years | 0 (0.0%) | 0 (0.0%) |
| 16 and 17 Years | 34 (100.0%) | 27 (100.0%) |
| 18 to 24 Years | 27 (69.2%) | 0 (0.0%) |
| 25 to 34 Years | 0 (0.0%) | 0 (0.0%) |
| 35 to 44 Years | 30 (42.2%) | 29 (40.8%) |
| 45 to 54 Years | 0 (0.0%) | 0 (0.0%) |
| 55 to 64 Years | 0 (0.0%) | 0 (0.0%) |
| 65 to 74 Years | 0 (0.0%) | 0 (0.0%) |
| 75 Years and over | 0 (0.0%) | 0 (0.0%) |
| Total | 91 (34.5%) | 86 (29.0%) |
Income Above Poverty by Sex and Age in Greens Landing
According to the poverty statistics in Greens Landing, males aged under 5 years and females aged 18 to 24 years are the age groups that are most secure financially, with 100.0% of males and 100.0% of females in these age groups living above the poverty line.
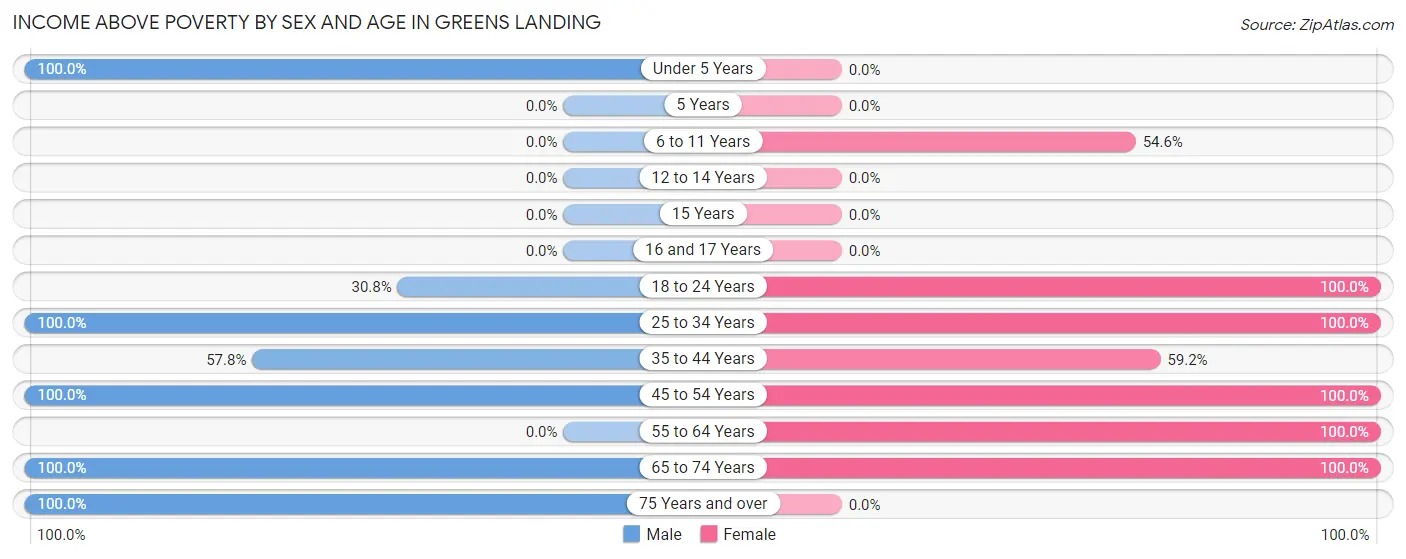
| Age Bracket | Male | Female |
| Under 5 Years | 23 (100.0%) | 0 (0.0%) |
| 5 Years | 0 (0.0%) | 0 (0.0%) |
| 6 to 11 Years | 0 (0.0%) | 36 (54.5%) |
| 12 to 14 Years | 0 (0.0%) | 0 (0.0%) |
| 15 Years | 0 (0.0%) | 0 (0.0%) |
| 16 and 17 Years | 0 (0.0%) | 0 (0.0%) |
| 18 to 24 Years | 12 (30.8%) | 24 (100.0%) |
| 25 to 34 Years | 17 (100.0%) | 16 (100.0%) |
| 35 to 44 Years | 41 (57.8%) | 42 (59.2%) |
| 45 to 54 Years | 43 (100.0%) | 11 (100.0%) |
| 55 to 64 Years | 0 (0.0%) | 47 (100.0%) |
| 65 to 74 Years | 21 (100.0%) | 35 (100.0%) |
| 75 Years and over | 16 (100.0%) | 0 (0.0%) |
| Total | 173 (65.5%) | 211 (71.0%) |
Income Below Poverty Among Married-Couple Families in Greens Landing
| Children | Above Poverty | Below Poverty |
| No Children | 38 (100.0%) | 0 (0.0%) |
| 1 or 2 Children | 55 (100.0%) | 0 (0.0%) |
| 3 or 4 Children | 0 (0.0%) | 0 (0.0%) |
| 5 or more Children | 0 (0.0%) | 0 (0.0%) |
| Total | 93 (100.0%) | 0 (0.0%) |
Income Below Poverty Among Single-Parent Households in Greens Landing
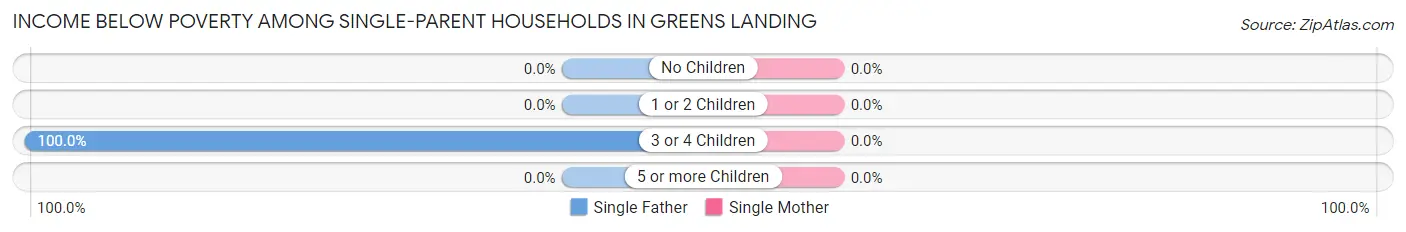
| Children | Single Father | Single Mother |
| No Children | 0 (0.0%) | 0 (0.0%) |
| 1 or 2 Children | 0 (0.0%) | 0 (0.0%) |
| 3 or 4 Children | 30 (100.0%) | 0 (0.0%) |
| 5 or more Children | 0 (0.0%) | 0 (0.0%) |
| Total | 30 (100.0%) | 0 (0.0%) |
Income Below Poverty Among Married-Couple vs Single-Parent Households in Greens Landing
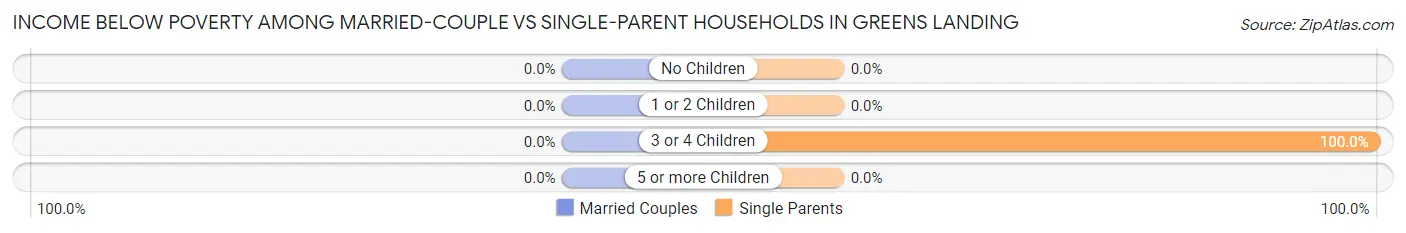
| Children | Married-Couple Families | Single-Parent Households |
| No Children | 0 (0.0%) | 0 (0.0%) |
| 1 or 2 Children | 0 (0.0%) | 0 (0.0%) |
| 3 or 4 Children | 0 (0.0%) | 30 (100.0%) |
| 5 or more Children | 0 (0.0%) | 0 (0.0%) |
| Total | 0 (0.0%) | 30 (75.0%) |
Race in Greens Landing
The most populous races in Greens Landing are White / Caucasian (511 | 91.1%), Hawaiian / Pacific (38 | 6.8%), and Two or more Races (12 | 2.1%).
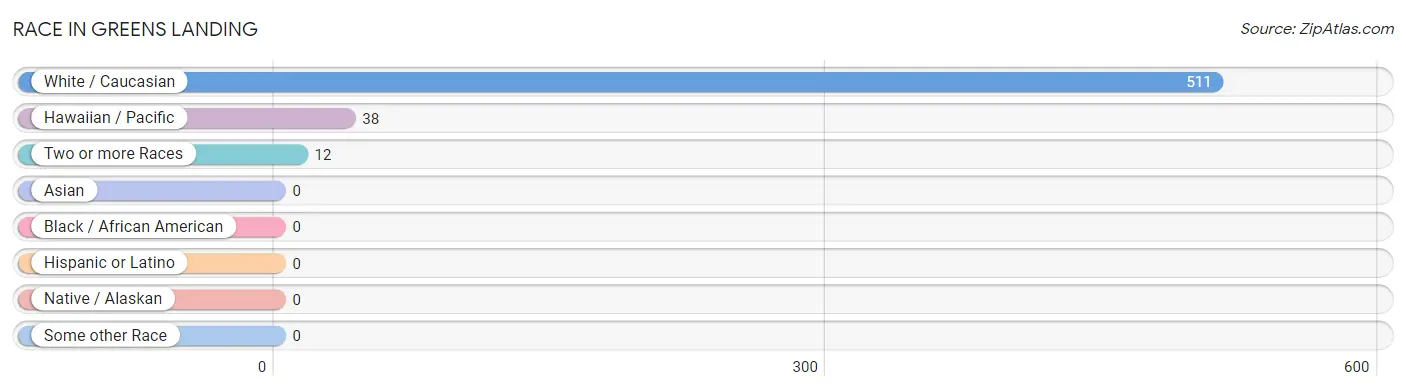
| Race | # Population | % Population |
| Asian | 0 | 0.0% |
| Black / African American | 0 | 0.0% |
| Hawaiian / Pacific | 38 | 6.8% |
| Hispanic or Latino | 0 | 0.0% |
| Native / Alaskan | 0 | 0.0% |
| White / Caucasian | 511 | 91.1% |
| Two or more Races | 12 | 2.1% |
| Some other Race | 0 | 0.0% |
| Total | 561 | 100.0% |
Ancestry in Greens Landing
The most populous ancestries reported in Greens Landing are German (246 | 43.9%), Polish (160 | 28.5%), Italian (55 | 9.8%), Irish (53 | 9.5%), and English (34 | 6.1%), together accounting for 97.7% of all Greens Landing residents.
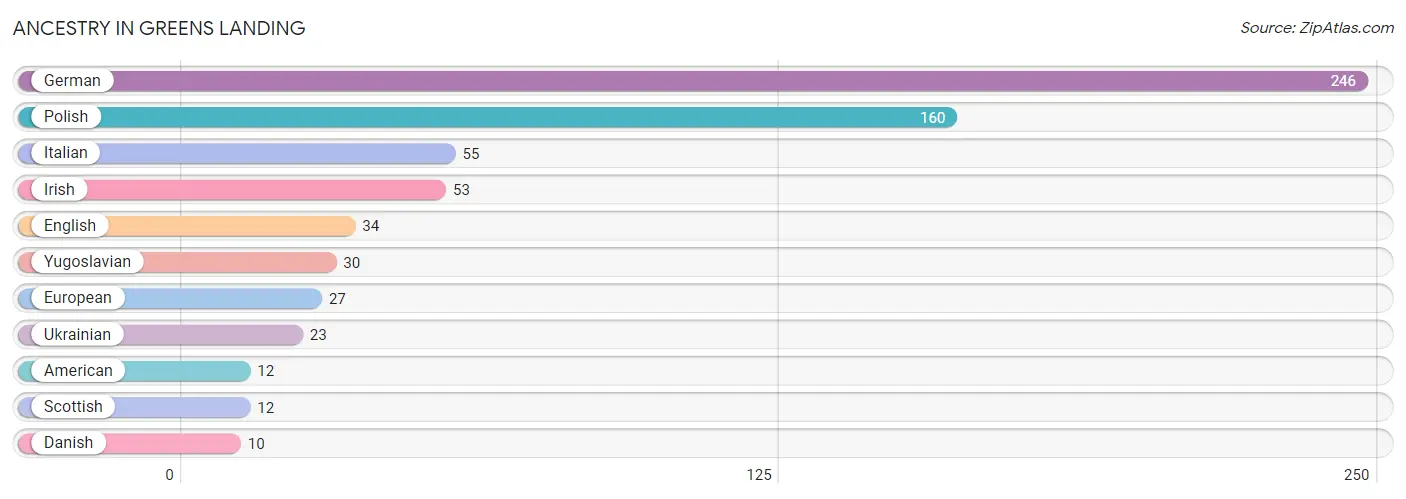
| Ancestry | # Population | % Population |
| American | 12 | 2.1% |
| Danish | 10 | 1.8% |
| English | 34 | 6.1% |
| European | 27 | 4.8% |
| German | 246 | 43.9% |
| Irish | 53 | 9.5% |
| Italian | 55 | 9.8% |
| Polish | 160 | 28.5% |
| Scottish | 12 | 2.1% |
| Ukrainian | 23 | 4.1% |
| Yugoslavian | 30 | 5.3% | View All 11 Rows |
Immigrants in Greens Landing

| Immigration Origin | # Population | % Population | View All 0 Rows |
Sex and Age in Greens Landing
Sex and Age in Greens Landing
The most populous age groups in Greens Landing are 15 to 19 Years (61 | 23.1%) for men and 40 to 44 Years (42 | 14.1%) for women.
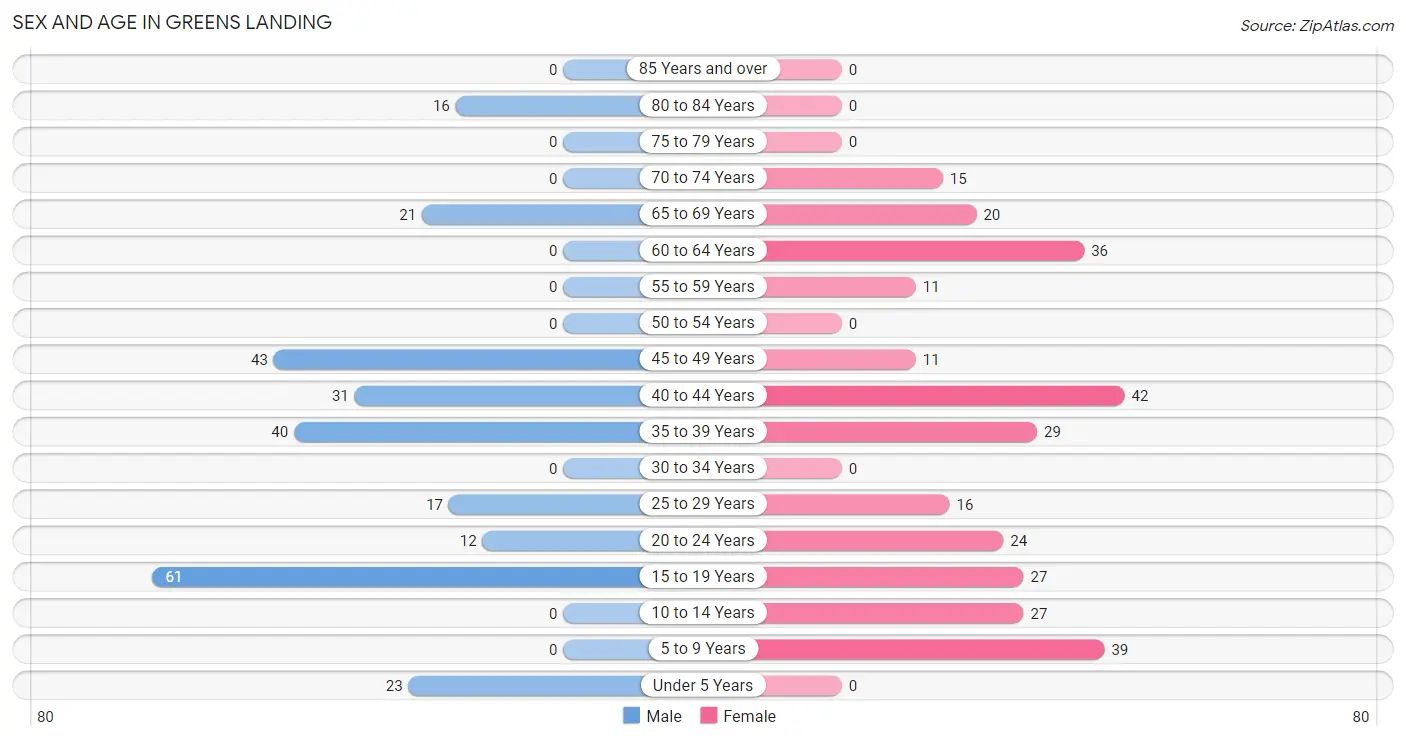
| Age Bracket | Male | Female |
| Under 5 Years | 23 (8.7%) | 0 (0.0%) |
| 5 to 9 Years | 0 (0.0%) | 39 (13.1%) |
| 10 to 14 Years | 0 (0.0%) | 27 (9.1%) |
| 15 to 19 Years | 61 (23.1%) | 27 (9.1%) |
| 20 to 24 Years | 12 (4.5%) | 24 (8.1%) |
| 25 to 29 Years | 17 (6.4%) | 16 (5.4%) |
| 30 to 34 Years | 0 (0.0%) | 0 (0.0%) |
| 35 to 39 Years | 40 (15.1%) | 29 (9.8%) |
| 40 to 44 Years | 31 (11.7%) | 42 (14.1%) |
| 45 to 49 Years | 43 (16.3%) | 11 (3.7%) |
| 50 to 54 Years | 0 (0.0%) | 0 (0.0%) |
| 55 to 59 Years | 0 (0.0%) | 11 (3.7%) |
| 60 to 64 Years | 0 (0.0%) | 36 (12.1%) |
| 65 to 69 Years | 21 (8.0%) | 20 (6.7%) |
| 70 to 74 Years | 0 (0.0%) | 15 (5.1%) |
| 75 to 79 Years | 0 (0.0%) | 0 (0.0%) |
| 80 to 84 Years | 16 (6.1%) | 0 (0.0%) |
| 85 Years and over | 0 (0.0%) | 0 (0.0%) |
| Total | 264 (100.0%) | 297 (100.0%) |
Families and Households in Greens Landing
Median Family Size in Greens Landing
The median family size in Greens Landing is 3.35 persons per family, with single male/father families (30 | 22.6%) accounting for the largest median family size of 4.93 persons per family. On the other hand, single female/mother families (10 | 7.5%) represent the smallest median family size with 2.70 persons per family.
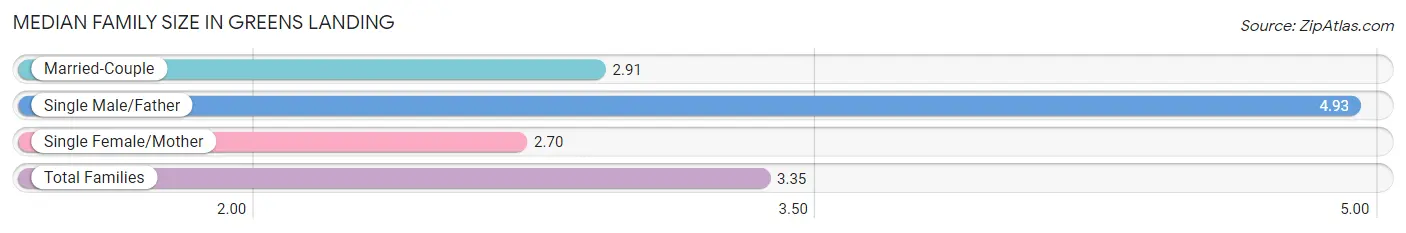
| Family Type | # Families | Family Size |
| Married-Couple | 93 (69.9%) | 2.91 |
| Single Male/Father | 30 (22.6%) | 4.93 |
| Single Female/Mother | 10 (7.5%) | 2.70 |
| Total Families | 133 (100.0%) | 3.35 |
Median Household Size in Greens Landing
The median household size in Greens Landing is 2.71 persons per household, with single male/father households (30 | 14.5%) accounting for the largest median household size of 5.9 persons per household. non-family households (74 | 35.7%) represent the smallest median household size with 1.16 persons per household.
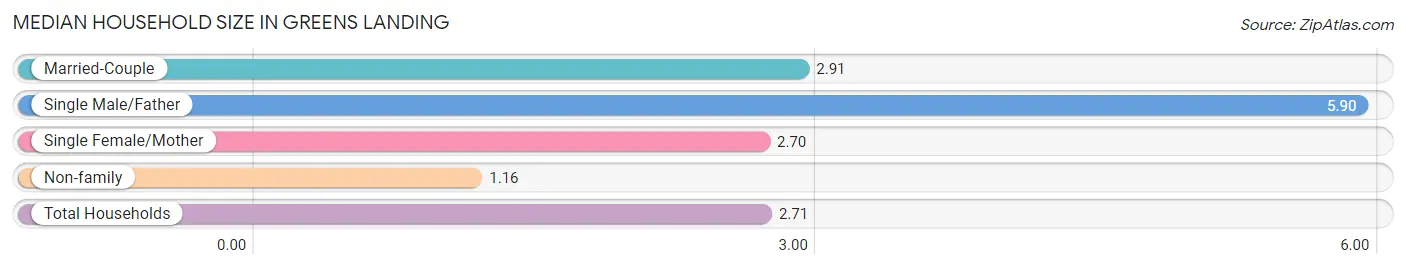
| Household Type | # Households | Household Size |
| Married-Couple | 93 (44.9%) | 2.91 |
| Single Male/Father | 30 (14.5%) | 5.90 |
| Single Female/Mother | 10 (4.8%) | 2.70 |
| Non-family | 74 (35.7%) | 1.16 |
| Total Households | 207 (100.0%) | 2.71 |
Household Size by Marriage Status in Greens Landing
Out of a total of 207 households in Greens Landing, 133 (64.2%) are family households, while 74 (35.7%) are nonfamily households. The most numerous type of family households are 2-person households, comprising 48, and the most common type of nonfamily households are 1-person households, comprising 61.
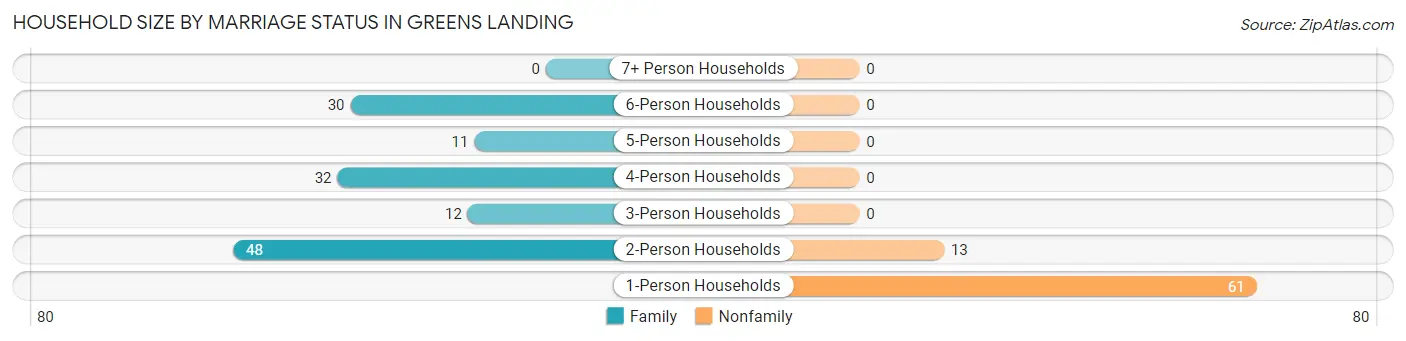
| Household Size | Family Households | Nonfamily Households |
| 1-Person Households | - | 61 (29.5%) |
| 2-Person Households | 48 (23.2%) | 13 (6.3%) |
| 3-Person Households | 12 (5.8%) | 0 (0.0%) |
| 4-Person Households | 32 (15.5%) | 0 (0.0%) |
| 5-Person Households | 11 (5.3%) | 0 (0.0%) |
| 6-Person Households | 30 (14.5%) | 0 (0.0%) |
| 7+ Person Households | 0 (0.0%) | 0 (0.0%) |
| Total | 133 (64.2%) | 74 (35.7%) |
Female Fertility in Greens Landing
Fertility by Age in Greens Landing
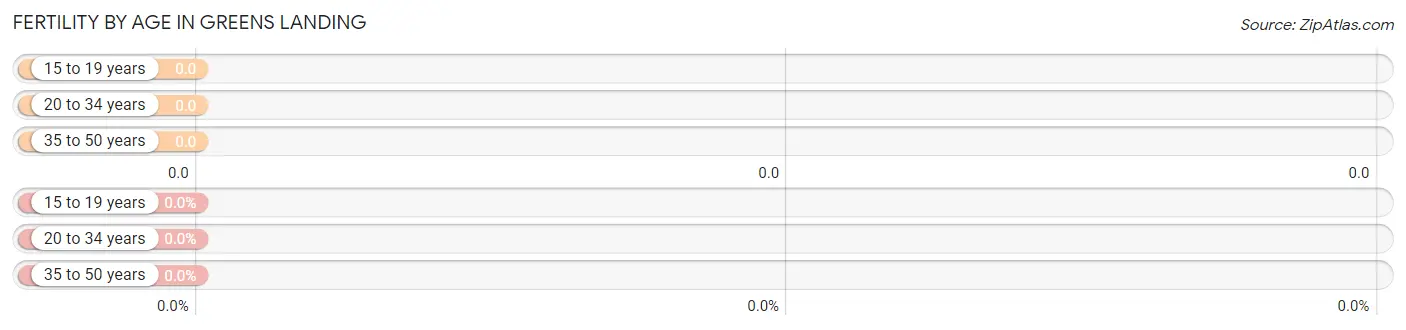
| Age Bracket | Women with Births | Births / 1,000 Women |
| 15 to 19 years | 0 (0.0%) | 0.0 |
| 20 to 34 years | 0 (0.0%) | 0.0 |
| 35 to 50 years | 0 (0.0%) | 0.0 |
| Total | 0 (0.0%) | 0.0 |
Fertility by Age by Marriage Status in Greens Landing
| Age Bracket | Married | Unmarried |
| 15 to 19 years | 0 (0.0%) | 0 (0.0%) |
| 20 to 34 years | 0 (0.0%) | 0 (0.0%) |
| 35 to 50 years | 0 (0.0%) | 0 (0.0%) |
| Total | 0 (0.0%) | 0 (0.0%) |
Fertility by Education in Greens Landing
| Educational Attainment | Women with Births | Births / 1,000 Women |
| Less than High School | 0 (0.0%) | 0.0 |
| High School Diploma | 0 (0.0%) | 0.0 |
| College or Associate's Degree | 0 (0.0%) | 0.0 |
| Bachelor's Degree | 0 (0.0%) | 0.0 |
| Graduate Degree | 0 (0.0%) | 0.0 |
| Total | 0 (0.0%) | 0.0 |
Fertility by Education by Marriage Status in Greens Landing
| Educational Attainment | Married | Unmarried |
| Less than High School | 0 (0.0%) | 0 (0.0%) |
| High School Diploma | 0 (0.0%) | 0 (0.0%) |
| College or Associate's Degree | 0 (0.0%) | 0 (0.0%) |
| Bachelor's Degree | 0 (0.0%) | 0 (0.0%) |
| Graduate Degree | 0 (0.0%) | 0 (0.0%) |
| Total | 0 (0.0%) | 0 (0.0%) |
Employment Characteristics in Greens Landing
Employment by Class of Employer in Greens Landing
Among the 250 employed individuals in Greens Landing, private company employees (157 | 62.8%), not-for-profit organizations (61 | 24.4%), and federal government employees (32 | 12.8%) make up the most common classes of employment.
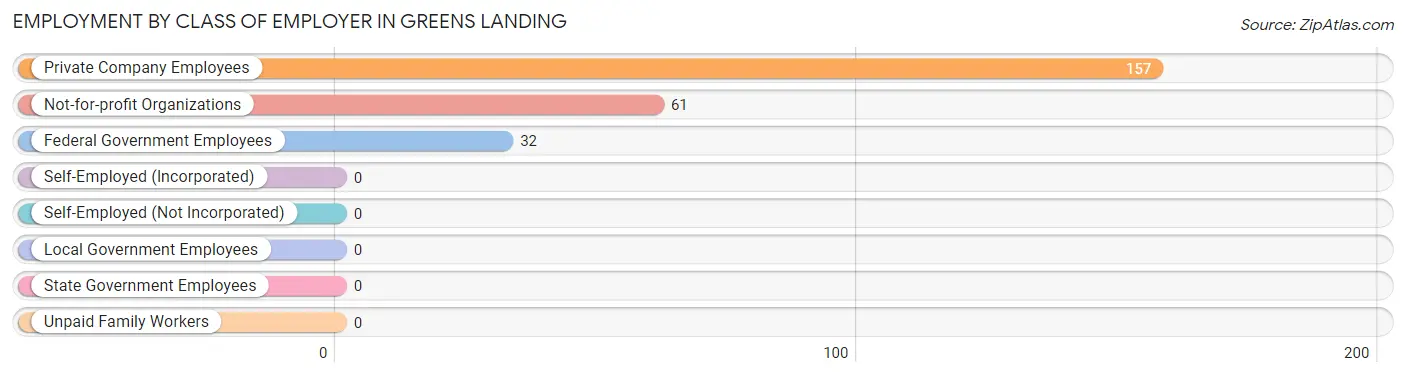
| Employer Class | # Employees | % Employees |
| Private Company Employees | 157 | 62.8% |
| Self-Employed (Incorporated) | 0 | 0.0% |
| Self-Employed (Not Incorporated) | 0 | 0.0% |
| Not-for-profit Organizations | 61 | 24.4% |
| Local Government Employees | 0 | 0.0% |
| State Government Employees | 0 | 0.0% |
| Federal Government Employees | 32 | 12.8% |
| Unpaid Family Workers | 0 | 0.0% |
| Total | 250 | 100.0% |
Employment Status by Age in Greens Landing
According to the labor force statistics for Greens Landing, out of the total population over 16 years of age (472), 55.5% or 262 individuals are in the labor force, with 4.6% or 12 of them unemployed. The age group with the highest labor force participation rate is 20 to 24 years, with 100.0% or 36 individuals in the labor force. Within the labor force, the 35 to 44 years age range has the highest percentage of unemployed individuals, with 12.6% or 12 of them being unemployed.
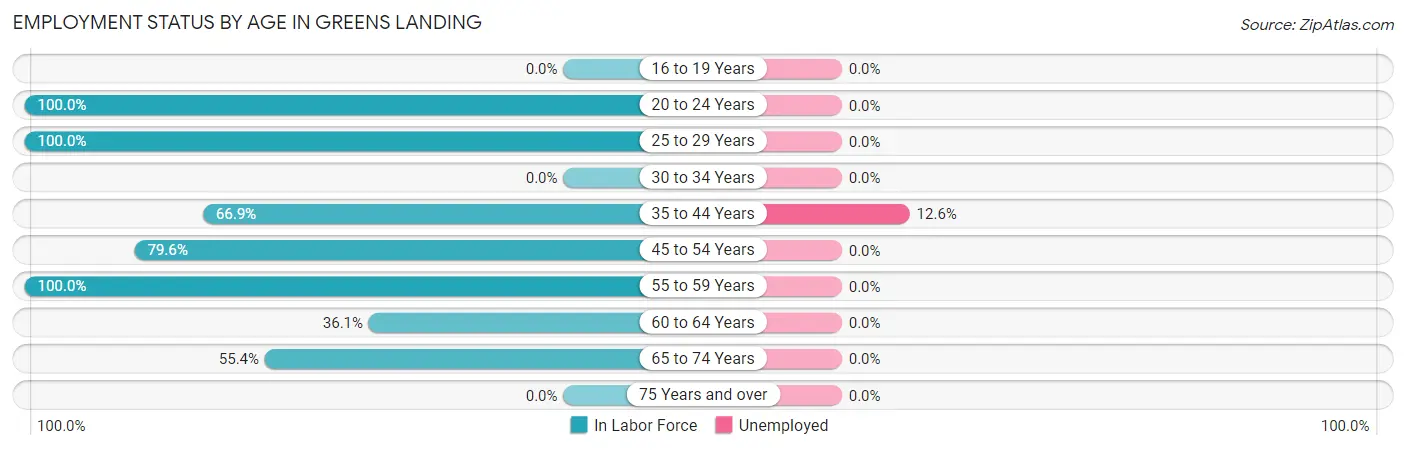
| Age Bracket | In Labor Force | Unemployed |
| 16 to 19 Years | 0 (0.0%) | 0 (0.0%) |
| 20 to 24 Years | 36 (100.0%) | 0 (0.0%) |
| 25 to 29 Years | 33 (100.0%) | 0 (0.0%) |
| 30 to 34 Years | 0 (0.0%) | 0 (0.0%) |
| 35 to 44 Years | 95 (66.9%) | 12 (12.6%) |
| 45 to 54 Years | 43 (79.6%) | 0 (0.0%) |
| 55 to 59 Years | 11 (100.0%) | 0 (0.0%) |
| 60 to 64 Years | 13 (36.1%) | 0 (0.0%) |
| 65 to 74 Years | 31 (55.4%) | 0 (0.0%) |
| 75 Years and over | 0 (0.0%) | 0 (0.0%) |
| Total | 262 (55.5%) | 12 (4.6%) |
Employment Status by Educational Attainment in Greens Landing
According to labor force statistics for Greens Landing, 70.7% of individuals (195) out of the total population between 25 and 64 years of age (276) are in the labor force, with 6.2% or 12 of them being unemployed. The group with the highest labor force participation rate are those with the educational attainment of college / associate degree, with 100.0% or 29 individuals in the labor force. Within the labor force, individuals with bachelor's degree or higher education have the highest percentage of unemployment, with 14.6% or 12 of them being unemployed.
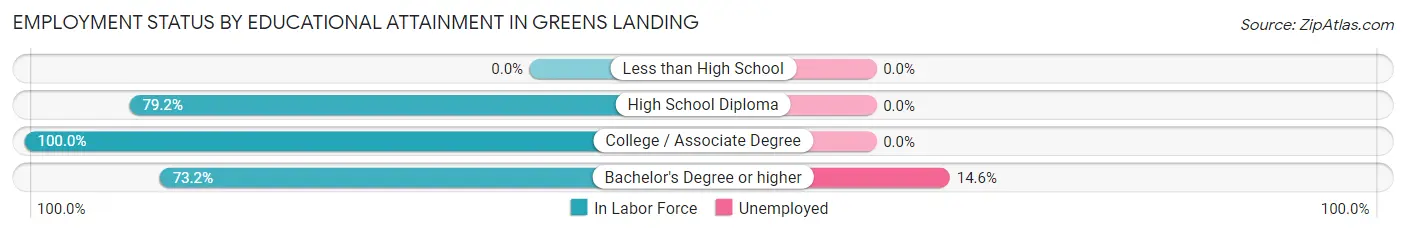
| Educational Attainment | In Labor Force | Unemployed |
| Less than High School | 0 (0.0%) | 0 (0.0%) |
| High School Diploma | 84 (79.2%) | 0 (0.0%) |
| College / Associate Degree | 29 (100.0%) | 0 (0.0%) |
| Bachelor's Degree or higher | 82 (73.2%) | 16 (14.6%) |
| Total | 195 (70.7%) | 17 (6.2%) |
Employment Occupations by Sex in Greens Landing
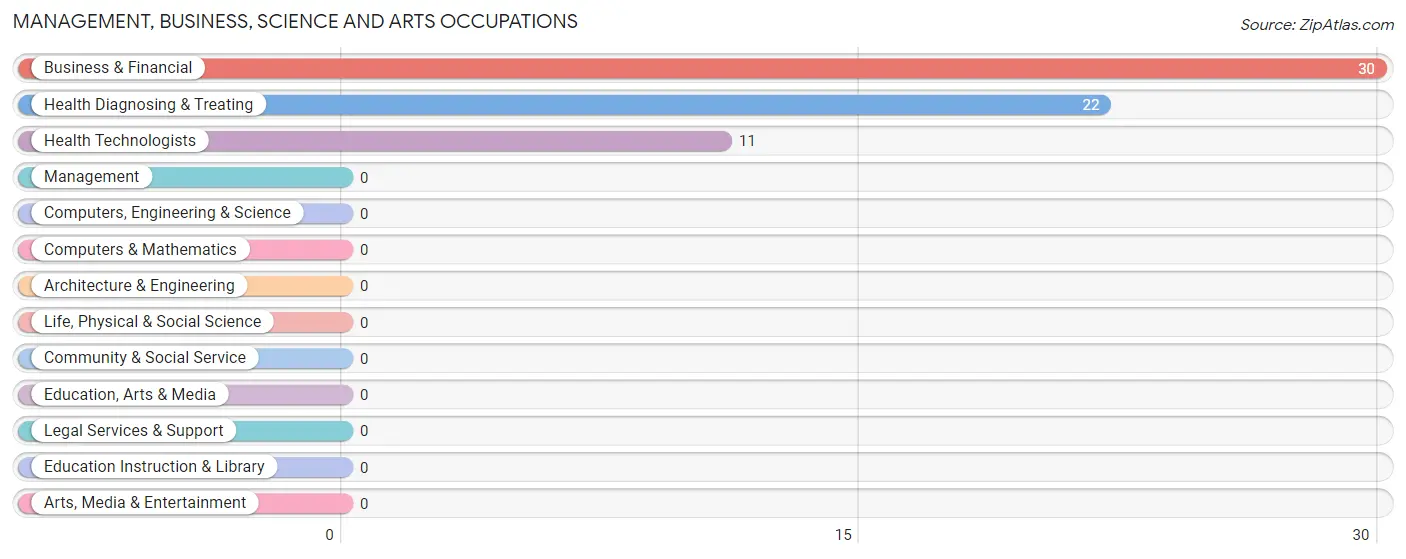
Management, Business, Science and Arts Occupations
The most common Management, Business, Science and Arts occupations in Greens Landing are Business & Financial (30 | 12.0%), Health Diagnosing & Treating (22 | 8.8%), and Health Technologists (11 | 4.4%).
Management, Business, Science and Arts Occupations by Sex
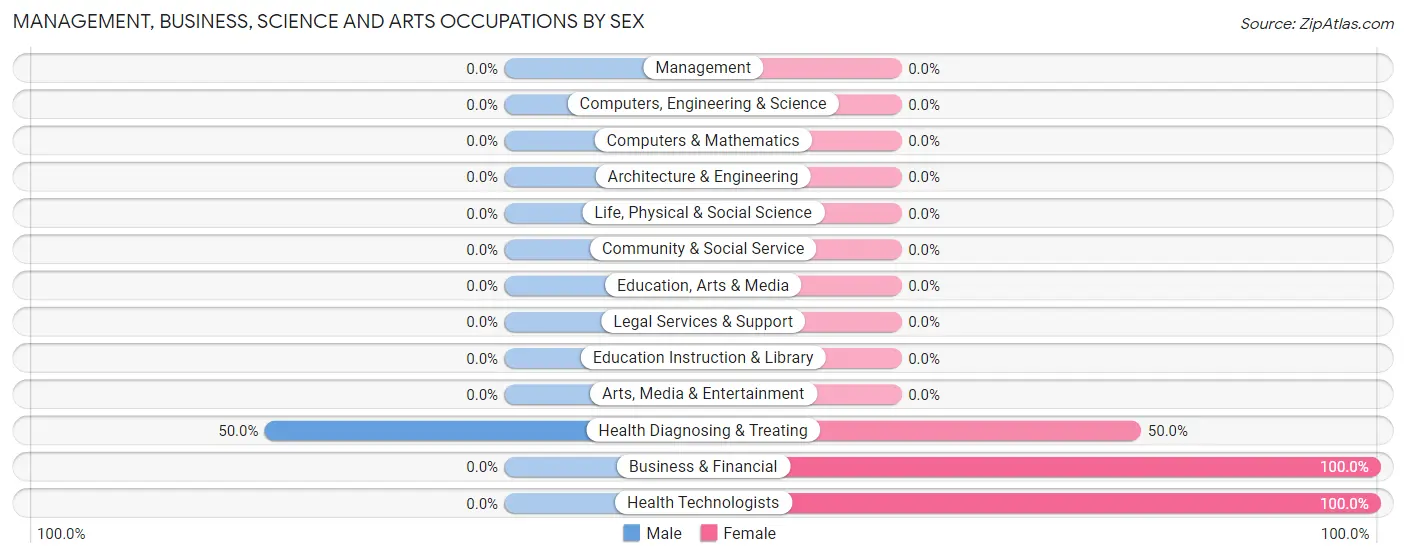
| Occupation | Male | Female |
| Management | 0 (0.0%) | 0 (0.0%) |
| Business & Financial | 0 (0.0%) | 30 (100.0%) |
| Computers, Engineering & Science | 0 (0.0%) | 0 (0.0%) |
| Computers & Mathematics | 0 (0.0%) | 0 (0.0%) |
| Architecture & Engineering | 0 (0.0%) | 0 (0.0%) |
| Life, Physical & Social Science | 0 (0.0%) | 0 (0.0%) |
| Community & Social Service | 0 (0.0%) | 0 (0.0%) |
| Education, Arts & Media | 0 (0.0%) | 0 (0.0%) |
| Legal Services & Support | 0 (0.0%) | 0 (0.0%) |
| Education Instruction & Library | 0 (0.0%) | 0 (0.0%) |
| Arts, Media & Entertainment | 0 (0.0%) | 0 (0.0%) |
| Health Diagnosing & Treating | 11 (50.0%) | 11 (50.0%) |
| Health Technologists | 0 (0.0%) | 11 (100.0%) |
| Total (Category) | 11 (21.1%) | 41 (78.8%) |
| Total (Overall) | 135 (54.0%) | 115 (46.0%) |
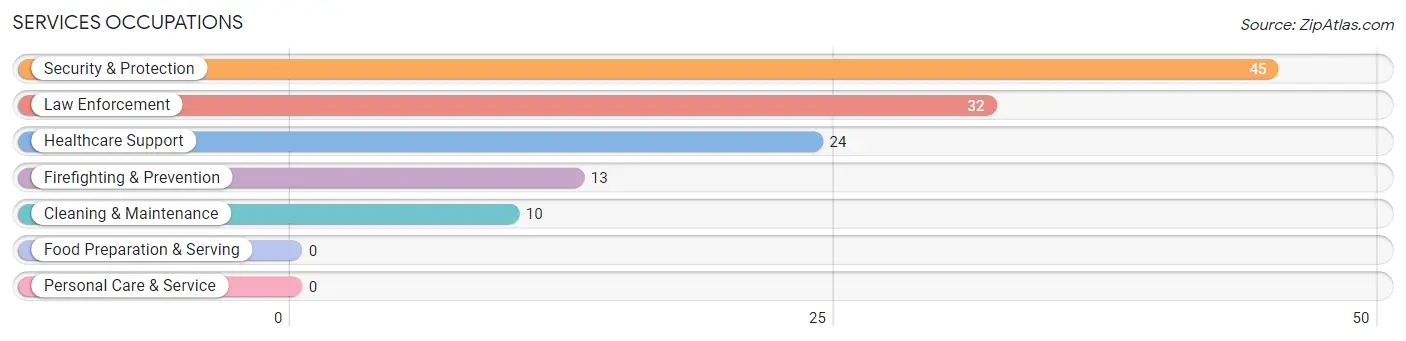
Services Occupations
The most common Services occupations in Greens Landing are Security & Protection (45 | 18.0%), Law Enforcement (32 | 12.8%), Healthcare Support (24 | 9.6%), Firefighting & Prevention (13 | 5.2%), and Cleaning & Maintenance (10 | 4.0%).
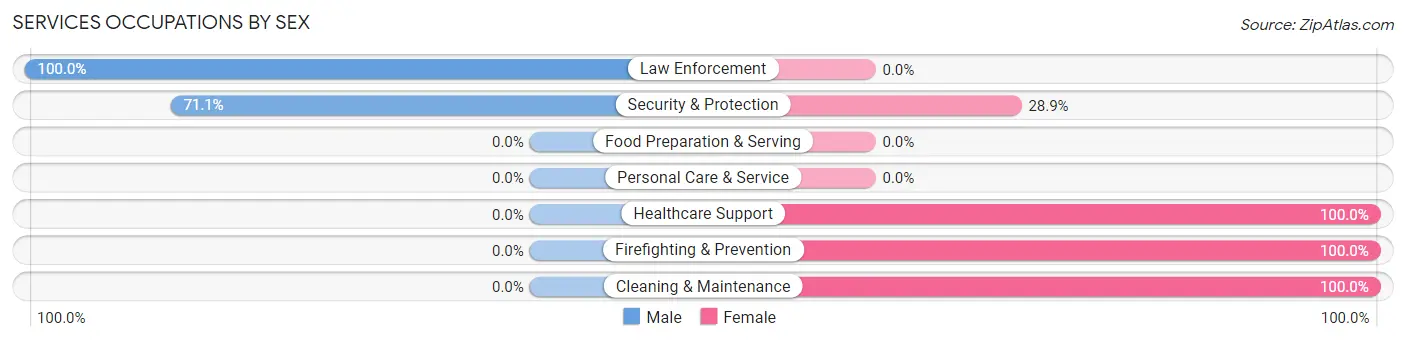
Services Occupations by Sex
Within the Services occupations in Greens Landing, the most male-oriented occupations are Law Enforcement (100.0%), and Security & Protection (71.1%), while the most female-oriented occupations are Healthcare Support (100.0%), Firefighting & Prevention (100.0%), and Cleaning & Maintenance (100.0%).
| Occupation | Male | Female |
| Healthcare Support | 0 (0.0%) | 24 (100.0%) |
| Security & Protection | 32 (71.1%) | 13 (28.9%) |
| Firefighting & Prevention | 0 (0.0%) | 13 (100.0%) |
| Law Enforcement | 32 (100.0%) | 0 (0.0%) |
| Food Preparation & Serving | 0 (0.0%) | 0 (0.0%) |
| Cleaning & Maintenance | 0 (0.0%) | 10 (100.0%) |
| Personal Care & Service | 0 (0.0%) | 0 (0.0%) |
| Total (Category) | 32 (40.5%) | 47 (59.5%) |
| Total (Overall) | 135 (54.0%) | 115 (46.0%) |
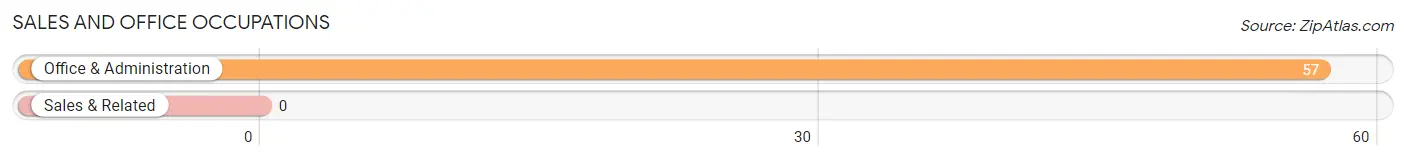
Sales and Office Occupations
The most common Sales and Office occupations in Greens Landing are , and Office & Administration (57 | 22.8%).
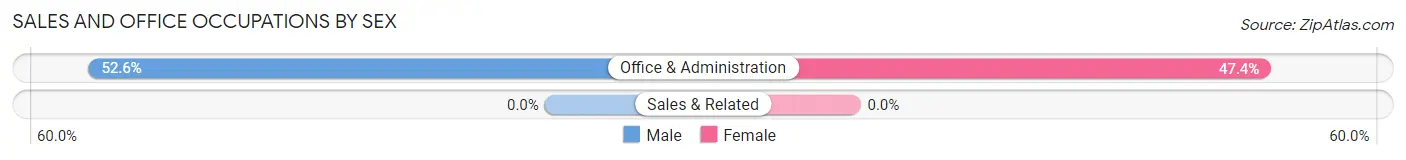
Sales and Office Occupations by Sex
| Occupation | Male | Female |
| Sales & Related | 0 (0.0%) | 0 (0.0%) |
| Office & Administration | 30 (52.6%) | 27 (47.4%) |
| Total (Category) | 30 (52.6%) | 27 (47.4%) |
| Total (Overall) | 135 (54.0%) | 115 (46.0%) |
Natural Resources, Construction and Maintenance Occupations
The most common Natural Resources, Construction and Maintenance occupations in Greens Landing are , and Installation, Maintenance & Repair (10 | 4.0%).
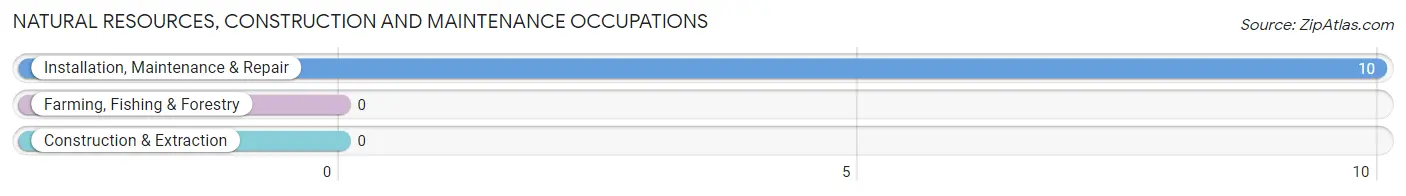
Natural Resources, Construction and Maintenance Occupations by Sex
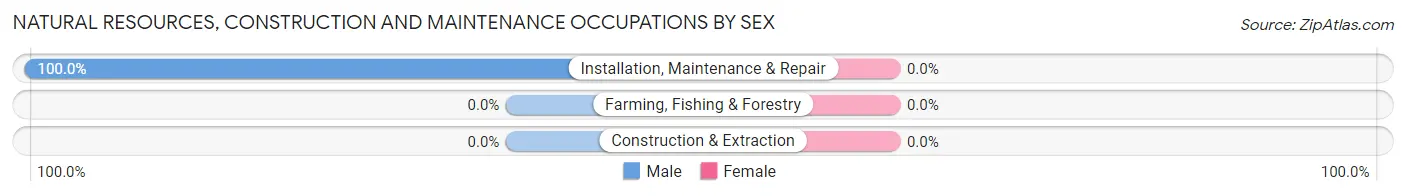
| Occupation | Male | Female |
| Farming, Fishing & Forestry | 0 (0.0%) | 0 (0.0%) |
| Construction & Extraction | 0 (0.0%) | 0 (0.0%) |
| Installation, Maintenance & Repair | 10 (100.0%) | 0 (0.0%) |
| Total (Category) | 10 (100.0%) | 0 (0.0%) |
| Total (Overall) | 135 (54.0%) | 115 (46.0%) |
Production, Transportation and Moving Occupations
The most common Production, Transportation and Moving occupations in Greens Landing are , and Production (52 | 20.8%).
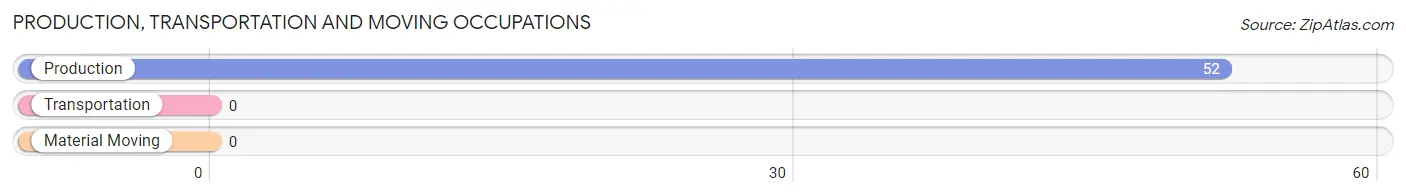
Production, Transportation and Moving Occupations by Sex
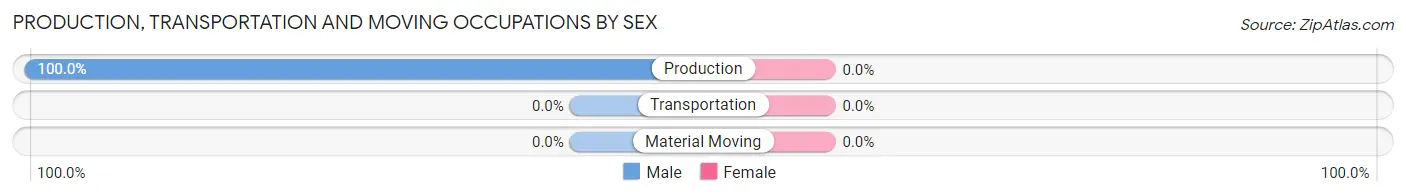
| Occupation | Male | Female |
| Production | 52 (100.0%) | 0 (0.0%) |
| Transportation | 0 (0.0%) | 0 (0.0%) |
| Material Moving | 0 (0.0%) | 0 (0.0%) |
| Total (Category) | 52 (100.0%) | 0 (0.0%) |
| Total (Overall) | 135 (54.0%) | 115 (46.0%) |
Employment Industries by Sex in Greens Landing
Employment Industries in Greens Landing
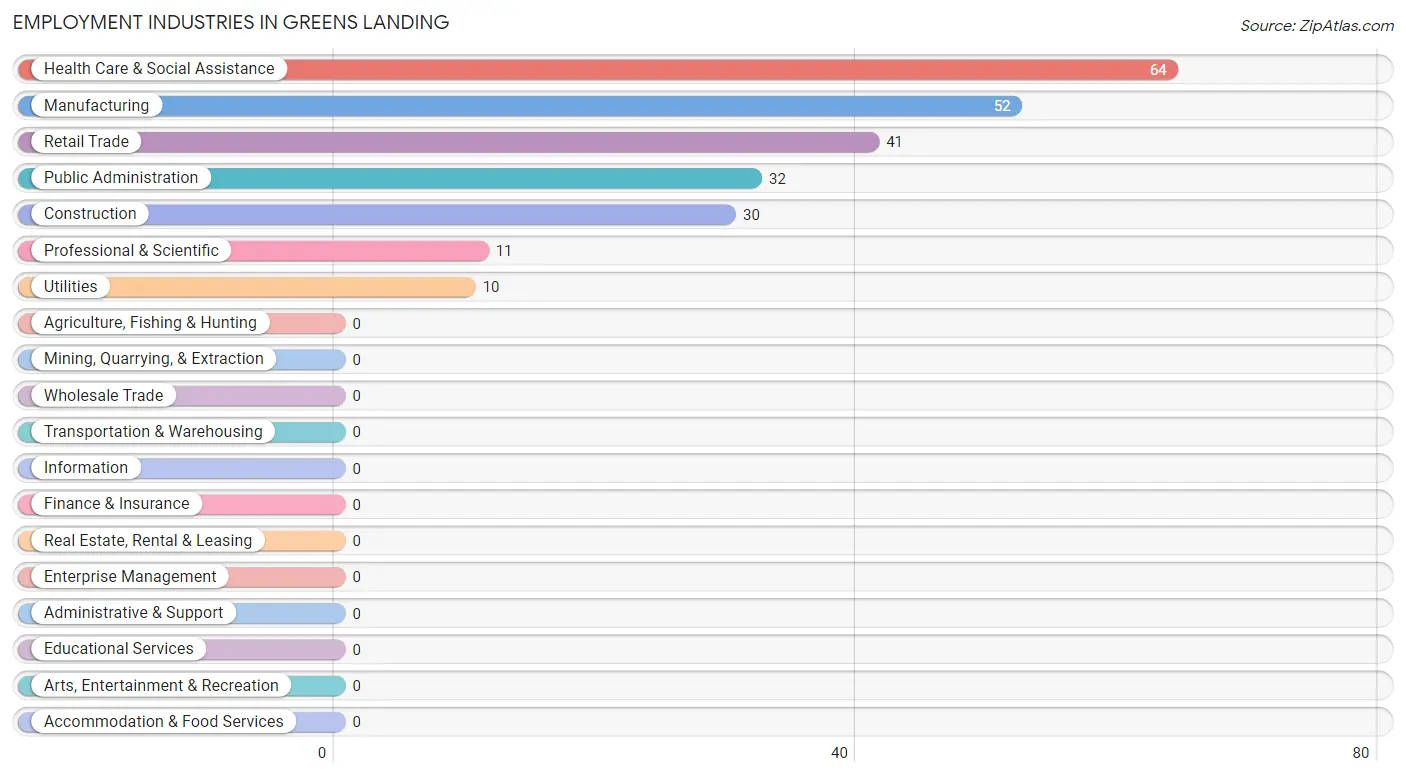
The major employment industries in Greens Landing include Health Care & Social Assistance (64 | 25.6%), Manufacturing (52 | 20.8%), Retail Trade (41 | 16.4%), Public Administration (32 | 12.8%), and Construction (30 | 12.0%).
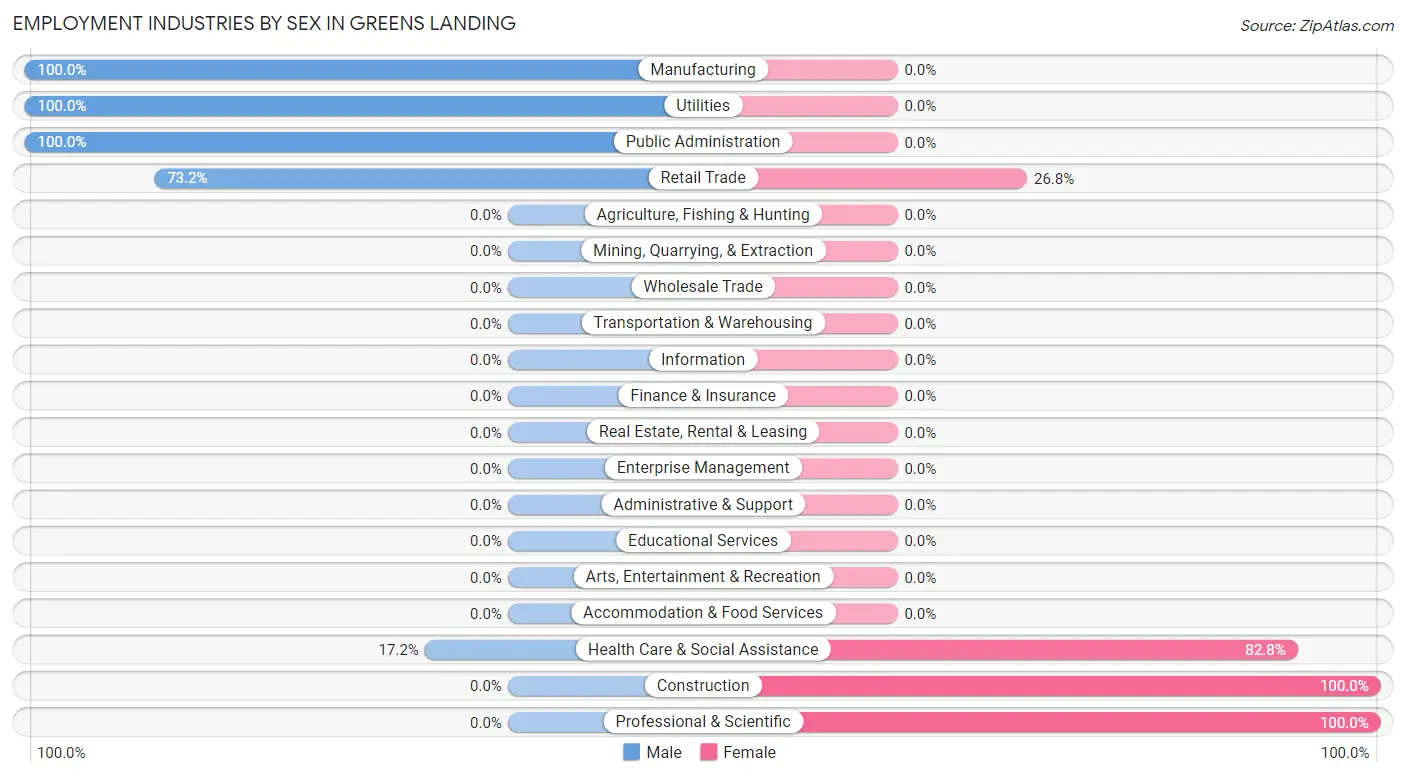
Employment Industries by Sex in Greens Landing
The Greens Landing industries that see more men than women are Manufacturing (100.0%), Utilities (100.0%), and Public Administration (100.0%), whereas the industries that tend to have a higher number of women are Construction (100.0%), Professional & Scientific (100.0%), and Health Care & Social Assistance (82.8%).
| Industry | Male | Female |
| Agriculture, Fishing & Hunting | 0 (0.0%) | 0 (0.0%) |
| Mining, Quarrying, & Extraction | 0 (0.0%) | 0 (0.0%) |
| Construction | 0 (0.0%) | 30 (100.0%) |
| Manufacturing | 52 (100.0%) | 0 (0.0%) |
| Wholesale Trade | 0 (0.0%) | 0 (0.0%) |
| Retail Trade | 30 (73.2%) | 11 (26.8%) |
| Transportation & Warehousing | 0 (0.0%) | 0 (0.0%) |
| Utilities | 10 (100.0%) | 0 (0.0%) |
| Information | 0 (0.0%) | 0 (0.0%) |
| Finance & Insurance | 0 (0.0%) | 0 (0.0%) |
| Real Estate, Rental & Leasing | 0 (0.0%) | 0 (0.0%) |
| Professional & Scientific | 0 (0.0%) | 11 (100.0%) |
| Enterprise Management | 0 (0.0%) | 0 (0.0%) |
| Administrative & Support | 0 (0.0%) | 0 (0.0%) |
| Educational Services | 0 (0.0%) | 0 (0.0%) |
| Health Care & Social Assistance | 11 (17.2%) | 53 (82.8%) |
| Arts, Entertainment & Recreation | 0 (0.0%) | 0 (0.0%) |
| Accommodation & Food Services | 0 (0.0%) | 0 (0.0%) |
| Public Administration | 32 (100.0%) | 0 (0.0%) |
| Total | 135 (54.0%) | 115 (46.0%) |
Education in Greens Landing
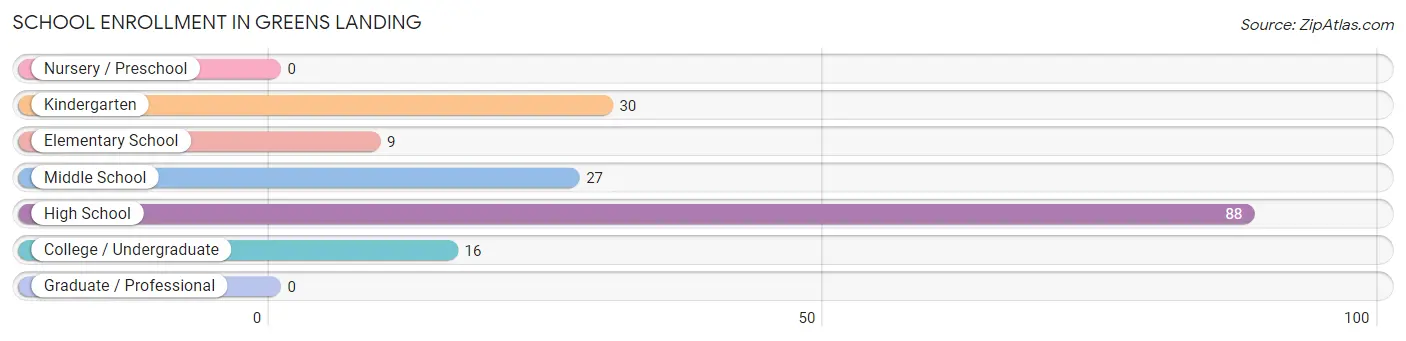
School Enrollment in Greens Landing
The most common levels of schooling among the 170 students in Greens Landing are high school (88 | 51.8%), kindergarten (30 | 17.6%), and middle school (27 | 15.9%).
| School Level | # Students | % Students |
| Nursery / Preschool | 0 | 0.0% |
| Kindergarten | 30 | 17.6% |
| Elementary School | 9 | 5.3% |
| Middle School | 27 | 15.9% |
| High School | 88 | 51.8% |
| College / Undergraduate | 16 | 9.4% |
| Graduate / Professional | 0 | 0.0% |
| Total | 170 | 100.0% |
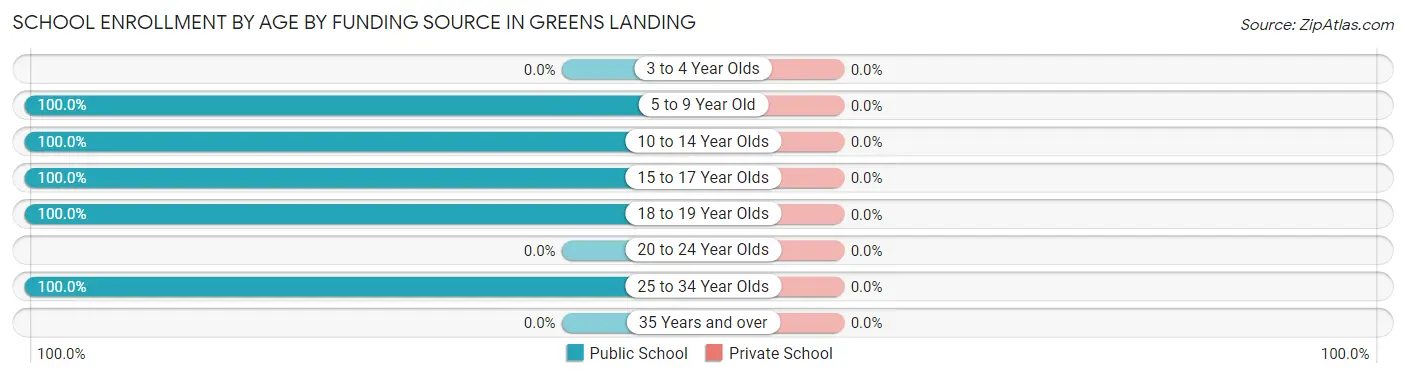
School Enrollment by Age by Funding Source in Greens Landing
| Age Bracket | Public School | Private School |
| 3 to 4 Year Olds | 0 (0.0%) | 0 (0.0%) |
| 5 to 9 Year Old | 39 (100.0%) | 0 (0.0%) |
| 10 to 14 Year Olds | 27 (100.0%) | 0 (0.0%) |
| 15 to 17 Year Olds | 61 (100.0%) | 0 (0.0%) |
| 18 to 19 Year Olds | 27 (100.0%) | 0 (0.0%) |
| 20 to 24 Year Olds | 0 (0.0%) | 0 (0.0%) |
| 25 to 34 Year Olds | 16 (100.0%) | 0 (0.0%) |
| 35 Years and over | 0 (0.0%) | 0 (0.0%) |
| Total | 170 (100.0%) | 0 (0.0%) |
Educational Attainment by Field of Study in Greens Landing
Arts & humanities (42 | 31.3%), social sciences (30 | 22.4%), bio, nature & agricultural (28 | 20.9%), science & technology (12 | 9.0%), and education (12 | 9.0%) are the most common fields of study among 134 individuals in Greens Landing who have obtained a bachelor's degree or higher.
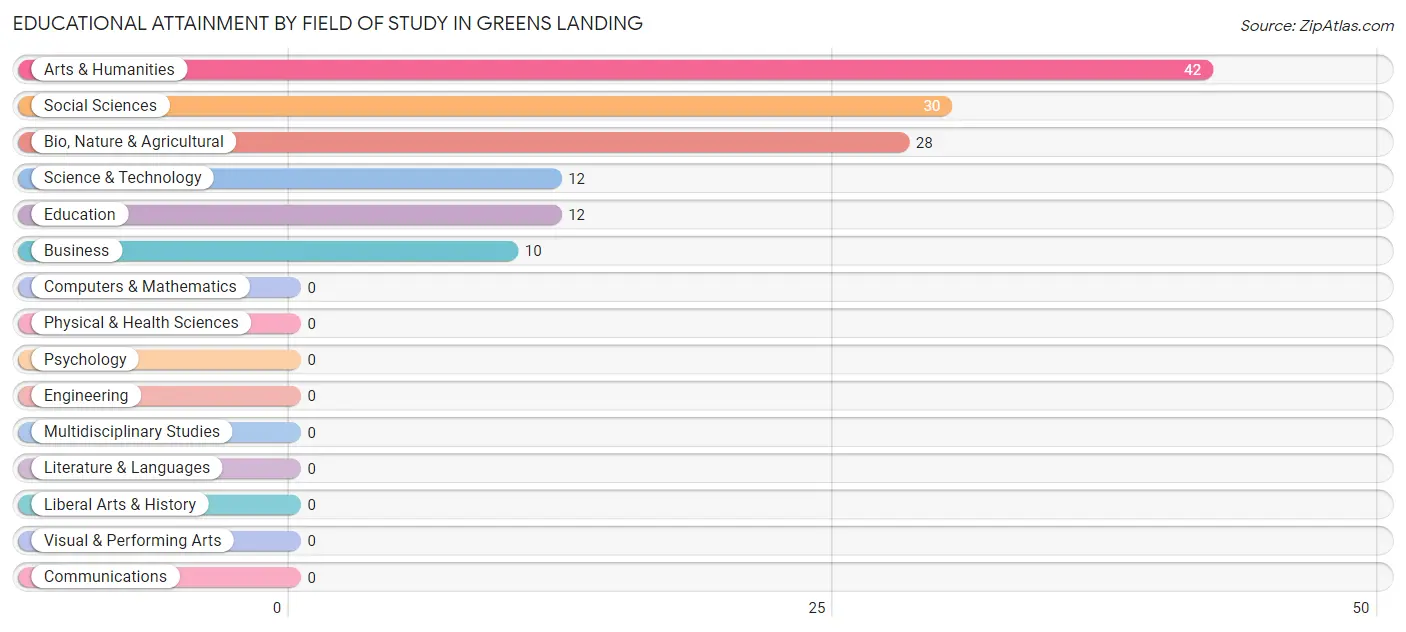
| Field of Study | # Graduates | % Graduates |
| Computers & Mathematics | 0 | 0.0% |
| Bio, Nature & Agricultural | 28 | 20.9% |
| Physical & Health Sciences | 0 | 0.0% |
| Psychology | 0 | 0.0% |
| Social Sciences | 30 | 22.4% |
| Engineering | 0 | 0.0% |
| Multidisciplinary Studies | 0 | 0.0% |
| Science & Technology | 12 | 9.0% |
| Business | 10 | 7.5% |
| Education | 12 | 9.0% |
| Literature & Languages | 0 | 0.0% |
| Liberal Arts & History | 0 | 0.0% |
| Visual & Performing Arts | 0 | 0.0% |
| Communications | 0 | 0.0% |
| Arts & Humanities | 42 | 31.3% |
| Total | 134 | 100.0% |
Transportation & Commute in Greens Landing
Vehicle Availability by Sex in Greens Landing
The most prevalent vehicle ownership categories in Greens Landing are males with 2 vehicles (50, accounting for 37.0%) and females with 2 vehicles (48, making up 43.5%).
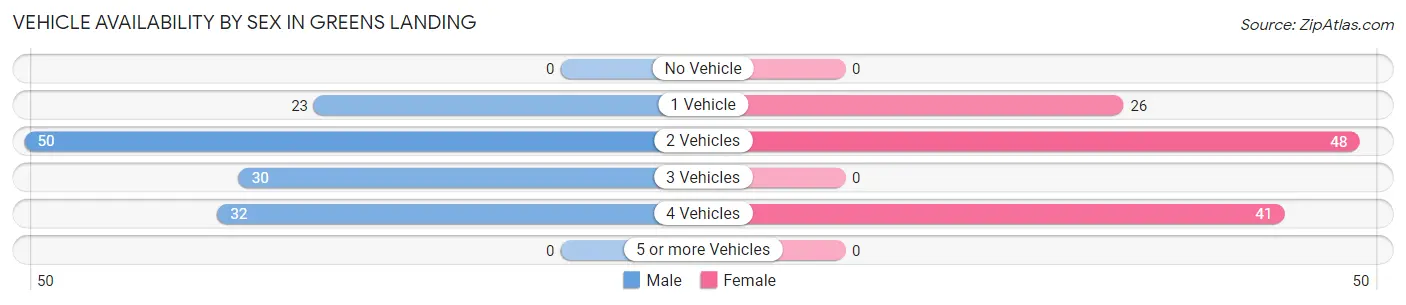
| Vehicles Available | Male | Female |
| No Vehicle | 0 (0.0%) | 0 (0.0%) |
| 1 Vehicle | 23 (17.0%) | 26 (22.6%) |
| 2 Vehicles | 50 (37.0%) | 48 (41.7%) |
| 3 Vehicles | 30 (22.2%) | 0 (0.0%) |
| 4 Vehicles | 32 (23.7%) | 41 (35.6%) |
| 5 or more Vehicles | 0 (0.0%) | 0 (0.0%) |
| Total | 135 (100.0%) | 115 (100.0%) |
Commute Time in Greens Landing
The most frequently occuring commute durations in Greens Landing are 10 to 14 minutes (83 commuters, 35.0%), 5 to 9 minutes (62 commuters, 26.2%), and 15 to 19 minutes (40 commuters, 16.9%).
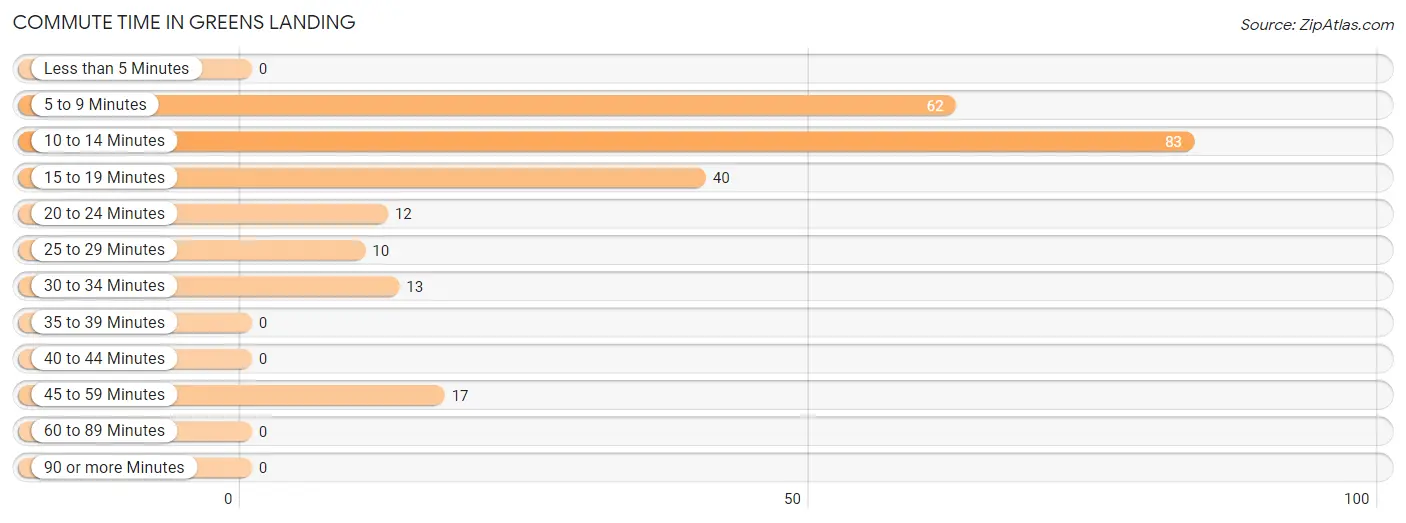
| Commute Time | # Commuters | % Commuters |
| Less than 5 Minutes | 0 | 0.0% |
| 5 to 9 Minutes | 62 | 26.2% |
| 10 to 14 Minutes | 83 | 35.0% |
| 15 to 19 Minutes | 40 | 16.9% |
| 20 to 24 Minutes | 12 | 5.1% |
| 25 to 29 Minutes | 10 | 4.2% |
| 30 to 34 Minutes | 13 | 5.5% |
| 35 to 39 Minutes | 0 | 0.0% |
| 40 to 44 Minutes | 0 | 0.0% |
| 45 to 59 Minutes | 17 | 7.2% |
| 60 to 89 Minutes | 0 | 0.0% |
| 90 or more Minutes | 0 | 0.0% |
Commute Time by Sex in Greens Landing
The most common commute times in Greens Landing are 5 to 9 minutes (32 commuters, 23.7%) for males and 10 to 14 minutes (62 commuters, 60.8%) for females.
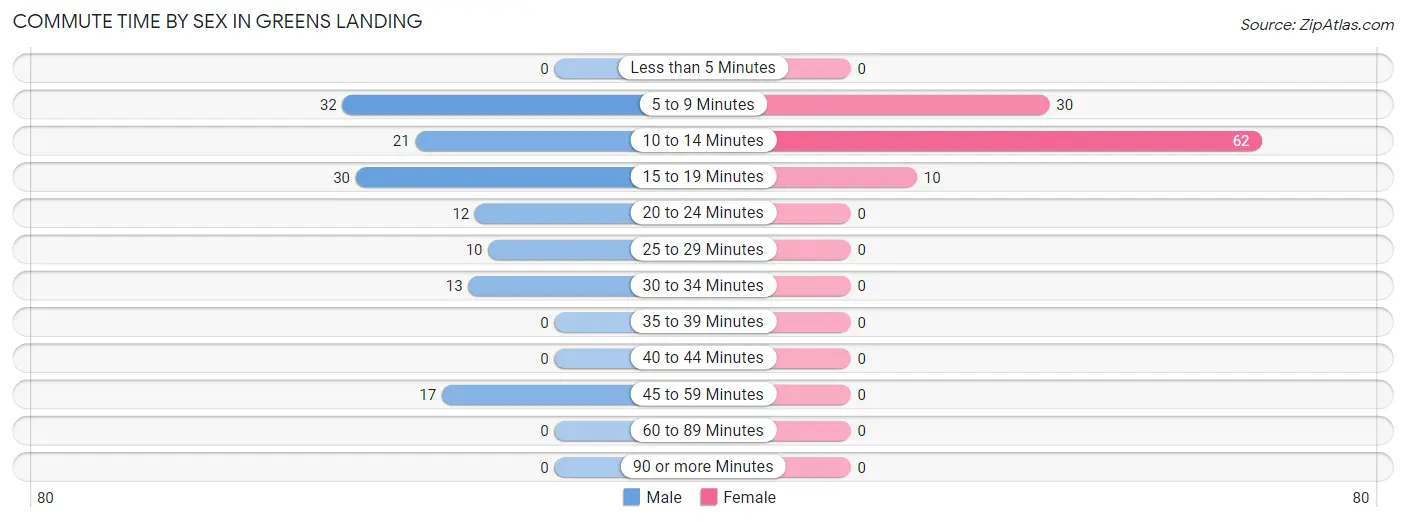
| Commute Time | Male | Female |
| Less than 5 Minutes | 0 (0.0%) | 0 (0.0%) |
| 5 to 9 Minutes | 32 (23.7%) | 30 (29.4%) |
| 10 to 14 Minutes | 21 (15.6%) | 62 (60.8%) |
| 15 to 19 Minutes | 30 (22.2%) | 10 (9.8%) |
| 20 to 24 Minutes | 12 (8.9%) | 0 (0.0%) |
| 25 to 29 Minutes | 10 (7.4%) | 0 (0.0%) |
| 30 to 34 Minutes | 13 (9.6%) | 0 (0.0%) |
| 35 to 39 Minutes | 0 (0.0%) | 0 (0.0%) |
| 40 to 44 Minutes | 0 (0.0%) | 0 (0.0%) |
| 45 to 59 Minutes | 17 (12.6%) | 0 (0.0%) |
| 60 to 89 Minutes | 0 (0.0%) | 0 (0.0%) |
| 90 or more Minutes | 0 (0.0%) | 0 (0.0%) |
Time of Departure to Work by Sex in Greens Landing
The most frequent times of departure to work in Greens Landing are 7:00 AM to 7:29 AM (49, 36.3%) for males and 7:00 AM to 7:29 AM (57, 55.9%) for females.
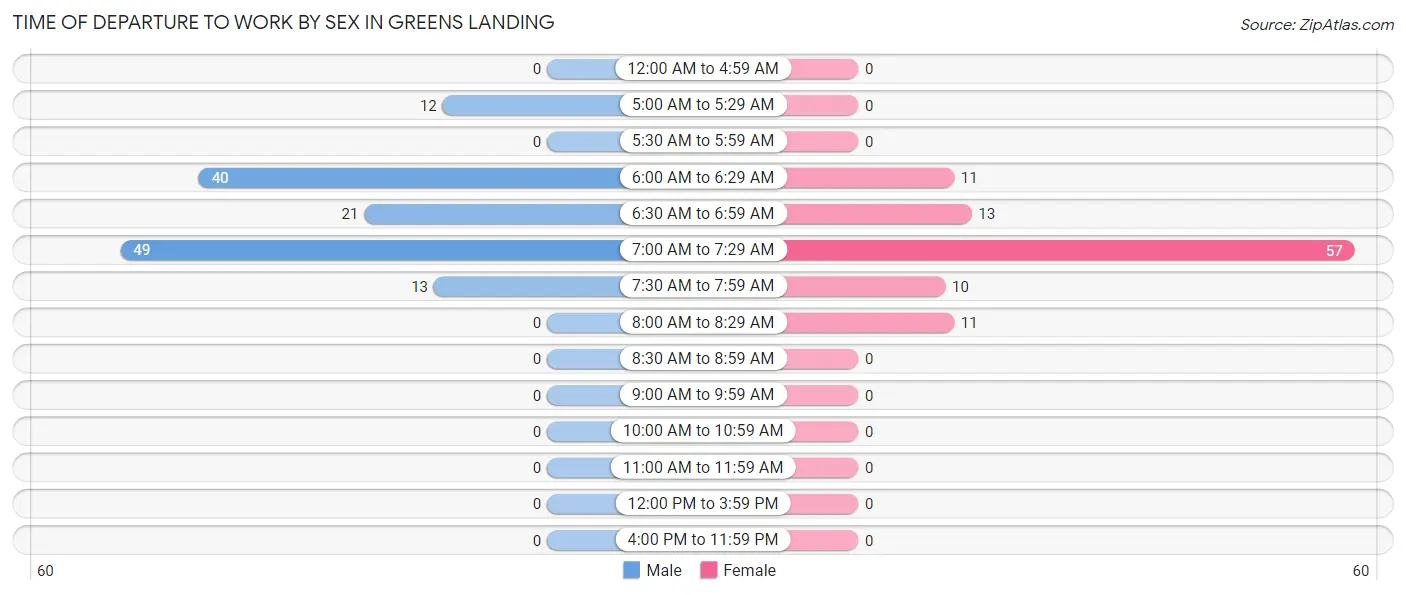
| Time of Departure | Male | Female |
| 12:00 AM to 4:59 AM | 0 (0.0%) | 0 (0.0%) |
| 5:00 AM to 5:29 AM | 12 (8.9%) | 0 (0.0%) |
| 5:30 AM to 5:59 AM | 0 (0.0%) | 0 (0.0%) |
| 6:00 AM to 6:29 AM | 40 (29.6%) | 11 (10.8%) |
| 6:30 AM to 6:59 AM | 21 (15.6%) | 13 (12.8%) |
| 7:00 AM to 7:29 AM | 49 (36.3%) | 57 (55.9%) |
| 7:30 AM to 7:59 AM | 13 (9.6%) | 10 (9.8%) |
| 8:00 AM to 8:29 AM | 0 (0.0%) | 11 (10.8%) |
| 8:30 AM to 8:59 AM | 0 (0.0%) | 0 (0.0%) |
| 9:00 AM to 9:59 AM | 0 (0.0%) | 0 (0.0%) |
| 10:00 AM to 10:59 AM | 0 (0.0%) | 0 (0.0%) |
| 11:00 AM to 11:59 AM | 0 (0.0%) | 0 (0.0%) |
| 12:00 PM to 3:59 PM | 0 (0.0%) | 0 (0.0%) |
| 4:00 PM to 11:59 PM | 0 (0.0%) | 0 (0.0%) |
| Total | 135 (100.0%) | 102 (100.0%) |
Housing Occupancy in Greens Landing
Occupancy by Ownership in Greens Landing
Of the total 207 dwellings in Greens Landing, owner-occupied units account for 133 (64.2%), while renter-occupied units make up 74 (35.7%).
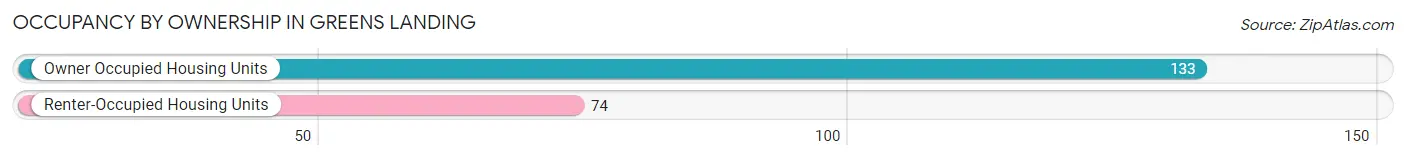
| Occupancy | # Housing Units | % Housing Units |
| Owner Occupied Housing Units | 133 | 64.2% |
| Renter-Occupied Housing Units | 74 | 35.7% |
| Total Occupied Housing Units | 207 | 100.0% |
Occupancy by Household Size in Greens Landing
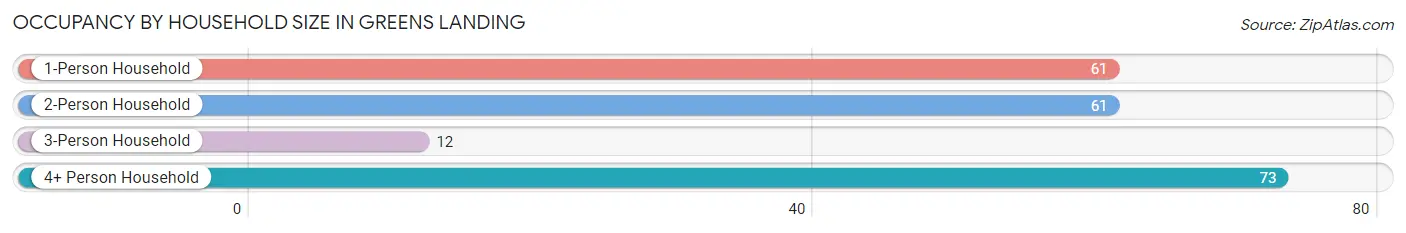
| Household Size | # Housing Units | % Housing Units |
| 1-Person Household | 61 | 29.5% |
| 2-Person Household | 61 | 29.5% |
| 3-Person Household | 12 | 5.8% |
| 4+ Person Household | 73 | 35.3% |
| Total Housing Units | 207 | 100.0% |
Occupancy by Ownership by Household Size in Greens Landing
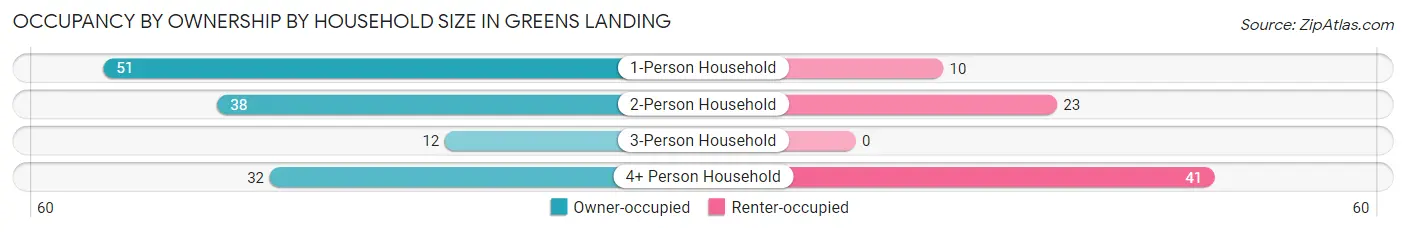
| Household Size | Owner-occupied | Renter-occupied |
| 1-Person Household | 51 (83.6%) | 10 (16.4%) |
| 2-Person Household | 38 (62.3%) | 23 (37.7%) |
| 3-Person Household | 12 (100.0%) | 0 (0.0%) |
| 4+ Person Household | 32 (43.8%) | 41 (56.2%) |
| Total Housing Units | 133 (64.2%) | 74 (35.7%) |
Occupancy by Educational Attainment in Greens Landing
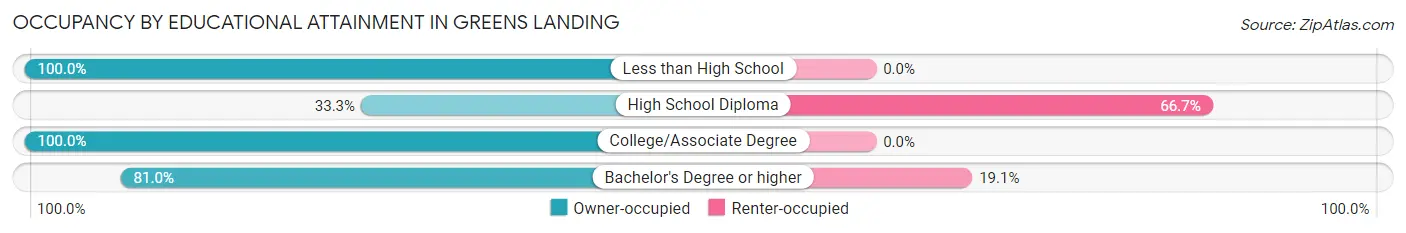
| Household Size | Owner-occupied | Renter-occupied |
| Less than High School | 10 (100.0%) | 0 (0.0%) |
| High School Diploma | 27 (33.3%) | 54 (66.7%) |
| College/Associate Degree | 11 (100.0%) | 0 (0.0%) |
| Bachelor's Degree or higher | 85 (80.9%) | 20 (19.1%) |
Occupancy by Age of Householder in Greens Landing
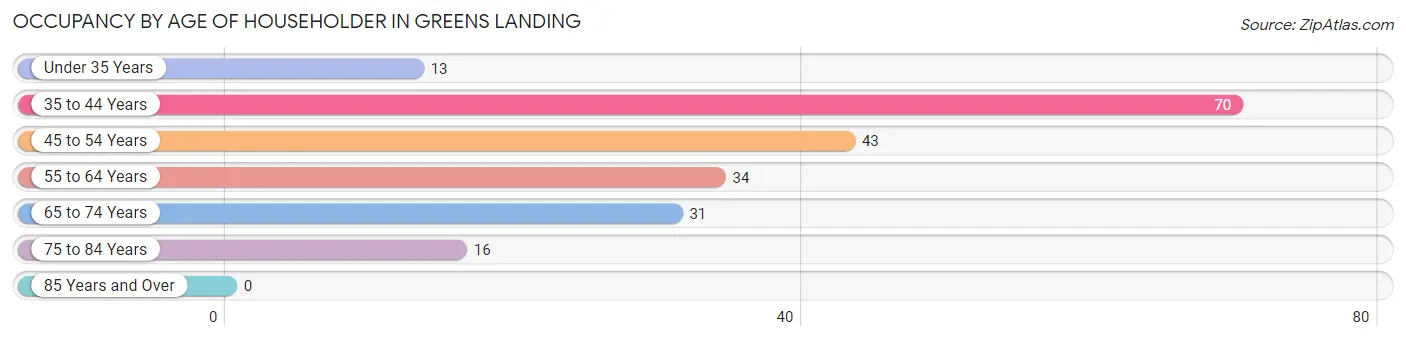
| Age Bracket | # Households | % Households |
| Under 35 Years | 13 | 6.3% |
| 35 to 44 Years | 70 | 33.8% |
| 45 to 54 Years | 43 | 20.8% |
| 55 to 64 Years | 34 | 16.4% |
| 65 to 74 Years | 31 | 15.0% |
| 75 to 84 Years | 16 | 7.7% |
| 85 Years and Over | 0 | 0.0% |
| Total | 207 | 100.0% |
Housing Finances in Greens Landing
Median Income by Occupancy in Greens Landing
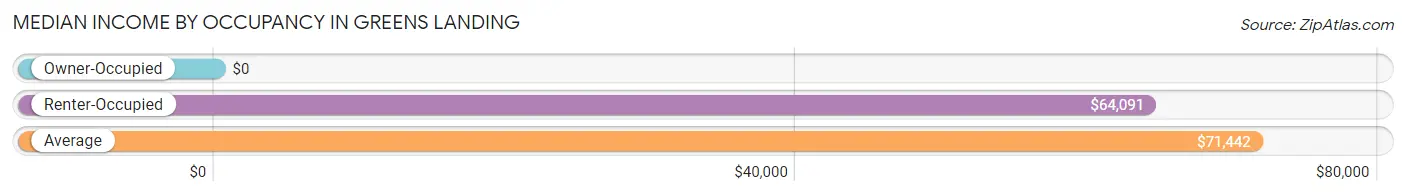
| Occupancy Type | # Households | Median Income |
| Owner-Occupied | 133 (64.2%) | $0 |
| Renter-Occupied | 74 (35.7%) | $64,091 |
| Average | 207 (100.0%) | $71,442 |
Occupancy by Householder Income Bracket in Greens Landing
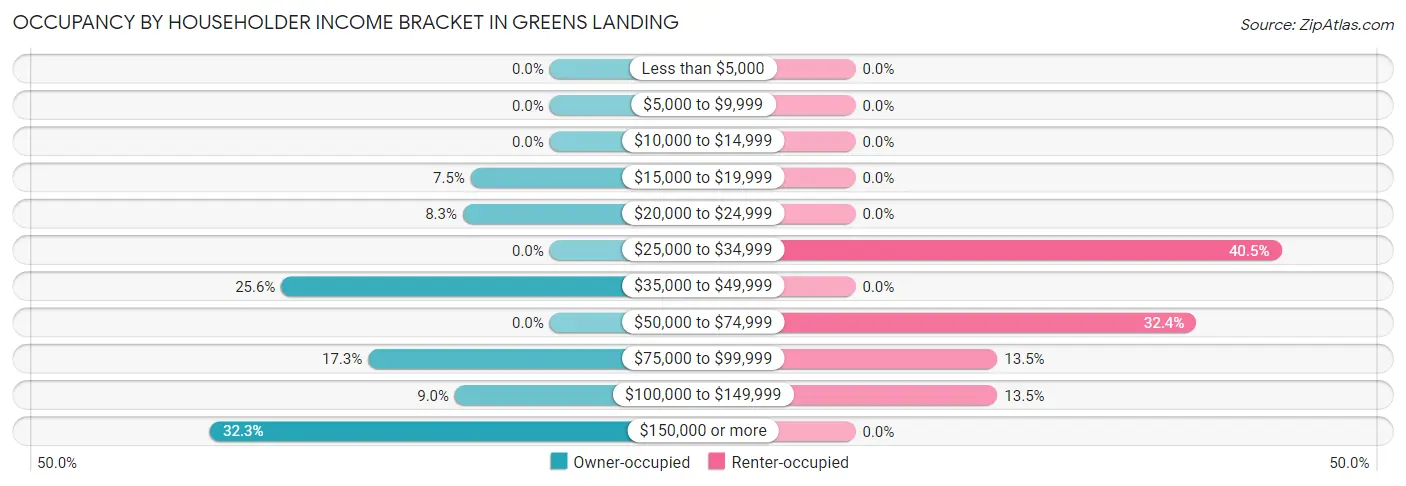
| Income Bracket | Owner-occupied | Renter-occupied |
| Less than $5,000 | 0 (0.0%) | 0 (0.0%) |
| $5,000 to $9,999 | 0 (0.0%) | 0 (0.0%) |
| $10,000 to $14,999 | 0 (0.0%) | 0 (0.0%) |
| $15,000 to $19,999 | 10 (7.5%) | 0 (0.0%) |
| $20,000 to $24,999 | 11 (8.3%) | 0 (0.0%) |
| $25,000 to $34,999 | 0 (0.0%) | 30 (40.5%) |
| $35,000 to $49,999 | 34 (25.6%) | 0 (0.0%) |
| $50,000 to $74,999 | 0 (0.0%) | 24 (32.4%) |
| $75,000 to $99,999 | 23 (17.3%) | 10 (13.5%) |
| $100,000 to $149,999 | 12 (9.0%) | 10 (13.5%) |
| $150,000 or more | 43 (32.3%) | 0 (0.0%) |
| Total | 133 (100.0%) | 74 (100.0%) |
Monthly Housing Cost Tiers in Greens Landing
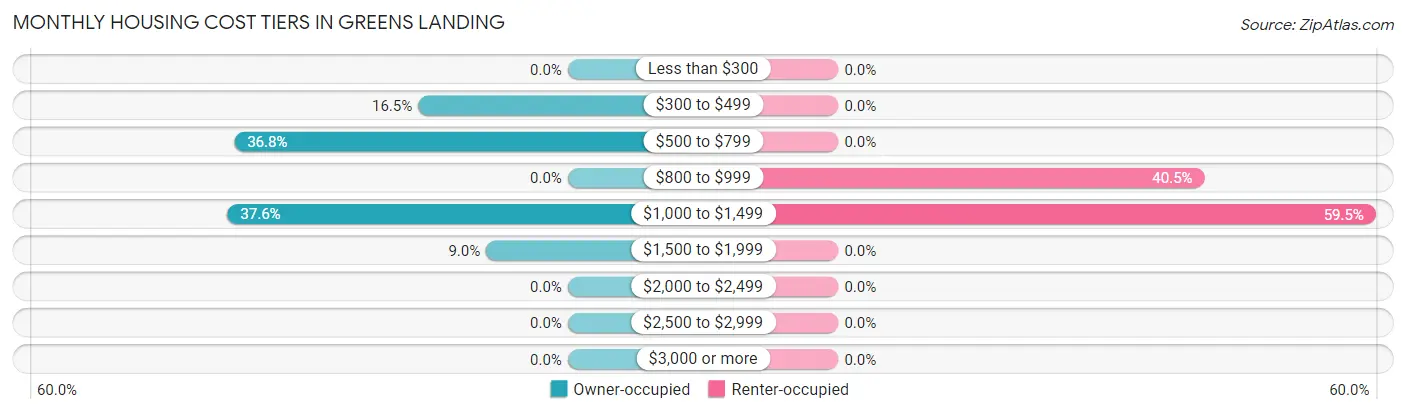
| Monthly Cost | Owner-occupied | Renter-occupied |
| Less than $300 | 0 (0.0%) | 0 (0.0%) |
| $300 to $499 | 22 (16.5%) | 0 (0.0%) |
| $500 to $799 | 49 (36.8%) | 0 (0.0%) |
| $800 to $999 | 0 (0.0%) | 30 (40.5%) |
| $1,000 to $1,499 | 50 (37.6%) | 44 (59.5%) |
| $1,500 to $1,999 | 12 (9.0%) | 0 (0.0%) |
| $2,000 to $2,499 | 0 (0.0%) | 0 (0.0%) |
| $2,500 to $2,999 | 0 (0.0%) | 0 (0.0%) |
| $3,000 or more | 0 (0.0%) | 0 (0.0%) |
| Total | 133 (100.0%) | 74 (100.0%) |
Physical Housing Characteristics in Greens Landing
Housing Structures in Greens Landing
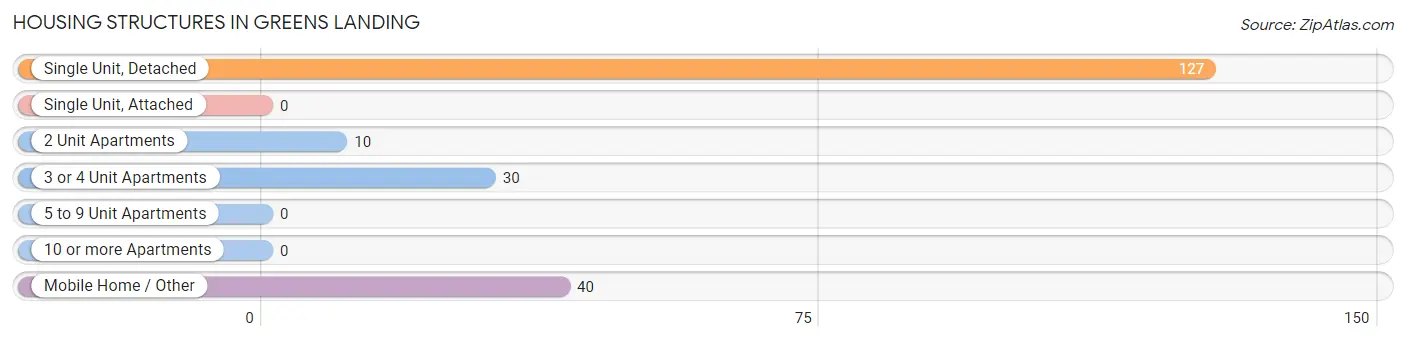
| Structure Type | # Housing Units | % Housing Units |
| Single Unit, Detached | 127 | 61.4% |
| Single Unit, Attached | 0 | 0.0% |
| 2 Unit Apartments | 10 | 4.8% |
| 3 or 4 Unit Apartments | 30 | 14.5% |
| 5 to 9 Unit Apartments | 0 | 0.0% |
| 10 or more Apartments | 0 | 0.0% |
| Mobile Home / Other | 40 | 19.3% |
| Total | 207 | 100.0% |
Housing Structures by Occupancy in Greens Landing
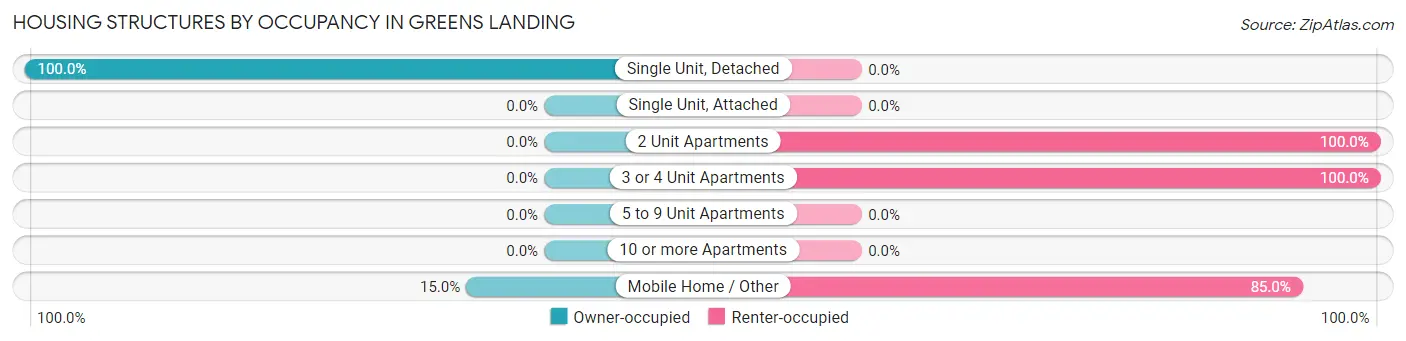
| Structure Type | Owner-occupied | Renter-occupied |
| Single Unit, Detached | 127 (100.0%) | 0 (0.0%) |
| Single Unit, Attached | 0 (0.0%) | 0 (0.0%) |
| 2 Unit Apartments | 0 (0.0%) | 10 (100.0%) |
| 3 or 4 Unit Apartments | 0 (0.0%) | 30 (100.0%) |
| 5 to 9 Unit Apartments | 0 (0.0%) | 0 (0.0%) |
| 10 or more Apartments | 0 (0.0%) | 0 (0.0%) |
| Mobile Home / Other | 6 (15.0%) | 34 (85.0%) |
| Total | 133 (64.2%) | 74 (35.7%) |
Housing Structures by Number of Rooms in Greens Landing
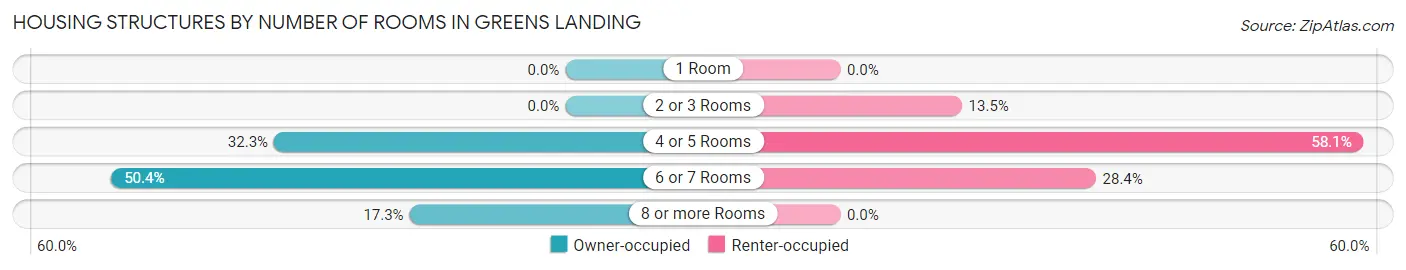
| Number of Rooms | Owner-occupied | Renter-occupied |
| 1 Room | 0 (0.0%) | 0 (0.0%) |
| 2 or 3 Rooms | 0 (0.0%) | 10 (13.5%) |
| 4 or 5 Rooms | 43 (32.3%) | 43 (58.1%) |
| 6 or 7 Rooms | 67 (50.4%) | 21 (28.4%) |
| 8 or more Rooms | 23 (17.3%) | 0 (0.0%) |
| Total | 133 (100.0%) | 74 (100.0%) |
Housing Structure by Heating Type in Greens Landing
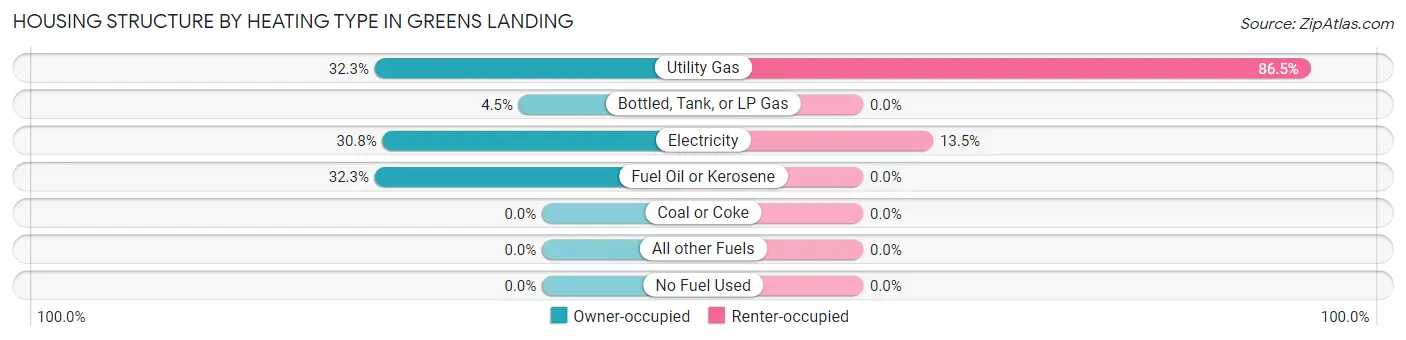
| Heating Type | Owner-occupied | Renter-occupied |
| Utility Gas | 43 (32.3%) | 64 (86.5%) |
| Bottled, Tank, or LP Gas | 6 (4.5%) | 0 (0.0%) |
| Electricity | 41 (30.8%) | 10 (13.5%) |
| Fuel Oil or Kerosene | 43 (32.3%) | 0 (0.0%) |
| Coal or Coke | 0 (0.0%) | 0 (0.0%) |
| All other Fuels | 0 (0.0%) | 0 (0.0%) |
| No Fuel Used | 0 (0.0%) | 0 (0.0%) |
| Total | 133 (100.0%) | 74 (100.0%) |
Household Vehicle Usage in Greens Landing
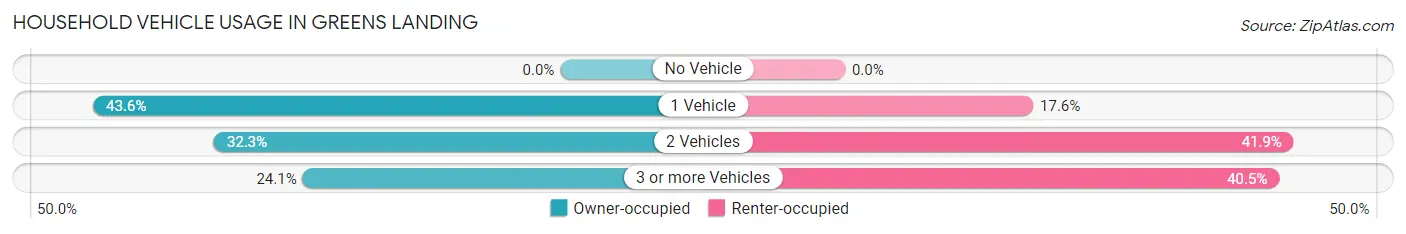
| Vehicles per Household | Owner-occupied | Renter-occupied |
| No Vehicle | 0 (0.0%) | 0 (0.0%) |
| 1 Vehicle | 58 (43.6%) | 13 (17.6%) |
| 2 Vehicles | 43 (32.3%) | 31 (41.9%) |
| 3 or more Vehicles | 32 (24.1%) | 30 (40.5%) |
| Total | 133 (100.0%) | 74 (100.0%) |
Real Estate & Mortgages in Greens Landing
Real Estate and Mortgage Overview in Greens Landing
| Characteristic | Without Mortgage | With Mortgage |
| Housing Units | 71 | 62 |
| Median Property Value | $115,200 | $185,200 |
| Median Household Income | - | - |
| Monthly Housing Costs | $531 | $0 |
| Real Estate Taxes | $2,405 | $0 |
Property Value by Mortgage Status in Greens Landing
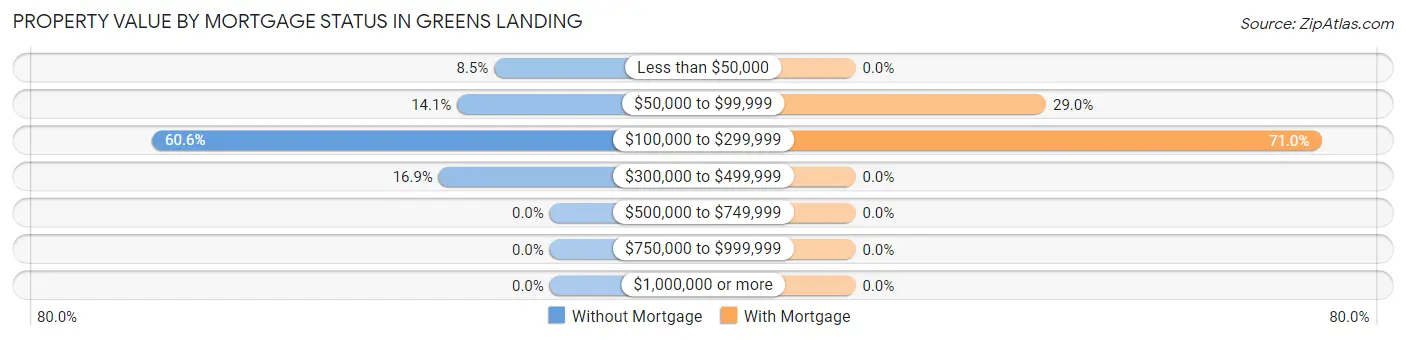
| Property Value | Without Mortgage | With Mortgage |
| Less than $50,000 | 6 (8.5%) | 0 (0.0%) |
| $50,000 to $99,999 | 10 (14.1%) | 18 (29.0%) |
| $100,000 to $299,999 | 43 (60.6%) | 44 (71.0%) |
| $300,000 to $499,999 | 12 (16.9%) | 0 (0.0%) |
| $500,000 to $749,999 | 0 (0.0%) | 0 (0.0%) |
| $750,000 to $999,999 | 0 (0.0%) | 0 (0.0%) |
| $1,000,000 or more | 0 (0.0%) | 0 (0.0%) |
| Total | 71 (100.0%) | 62 (100.0%) |
Household Income by Mortgage Status in Greens Landing
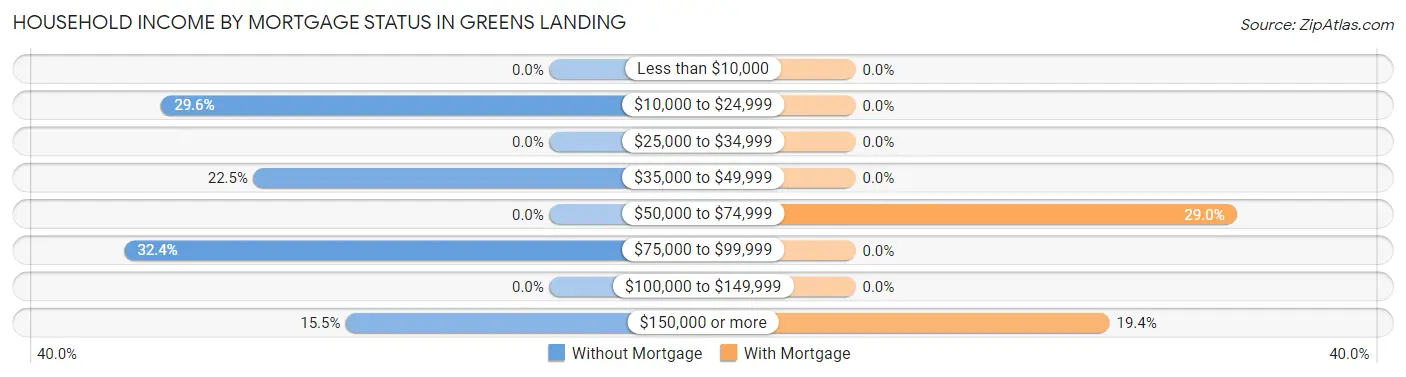
| Household Income | Without Mortgage | With Mortgage |
| Less than $10,000 | 0 (0.0%) | 0 (0.0%) |
| $10,000 to $24,999 | 21 (29.6%) | 0 (0.0%) |
| $25,000 to $34,999 | 0 (0.0%) | 0 (0.0%) |
| $35,000 to $49,999 | 16 (22.5%) | 0 (0.0%) |
| $50,000 to $74,999 | 0 (0.0%) | 18 (29.0%) |
| $75,000 to $99,999 | 23 (32.4%) | 0 (0.0%) |
| $100,000 to $149,999 | 0 (0.0%) | 0 (0.0%) |
| $150,000 or more | 11 (15.5%) | 12 (19.4%) |
| Total | 71 (100.0%) | 62 (100.0%) |
Property Value to Household Income Ratio in Greens Landing
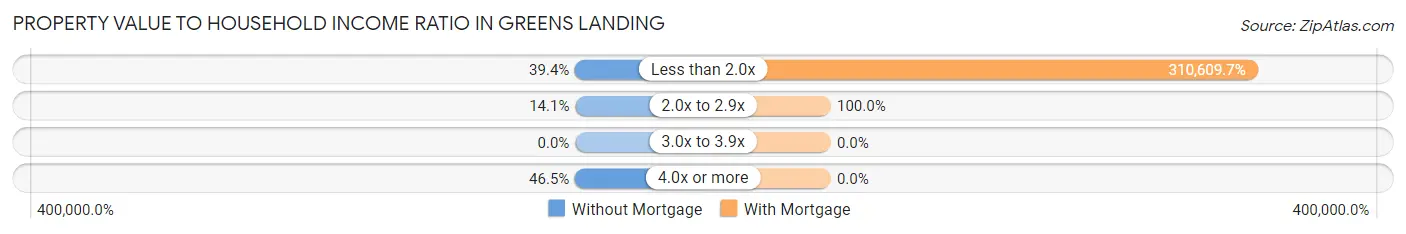
| Value-to-Income Ratio | Without Mortgage | With Mortgage |
| Less than 2.0x | 28 (39.4%) | 192,578 (310,609.7%) |
| 2.0x to 2.9x | 10 (14.1%) | 62 (100.0%) |
| 3.0x to 3.9x | 0 (0.0%) | 0 (0.0%) |
| 4.0x or more | 33 (46.5%) | 0 (0.0%) |
| Total | 71 (100.0%) | 62 (100.0%) |
Real Estate Taxes by Mortgage Status in Greens Landing
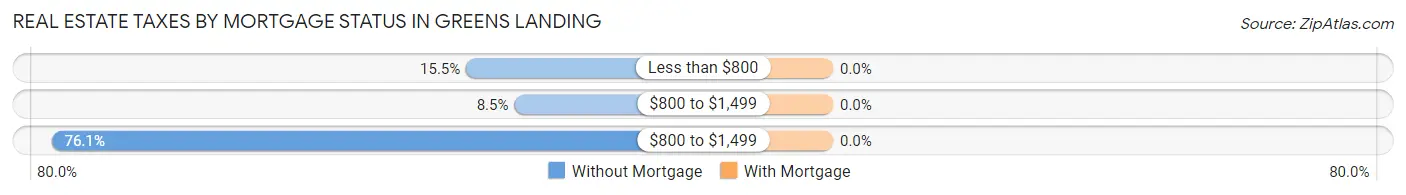
| Property Taxes | Without Mortgage | With Mortgage |
| Less than $800 | 11 (15.5%) | 0 (0.0%) |
| $800 to $1,499 | 6 (8.5%) | 0 (0.0%) |
| $800 to $1,499 | 54 (76.1%) | 0 (0.0%) |
| Total | 71 (100.0%) | 62 (100.0%) |
Health & Disability in Greens Landing
Health Insurance Coverage by Age in Greens Landing
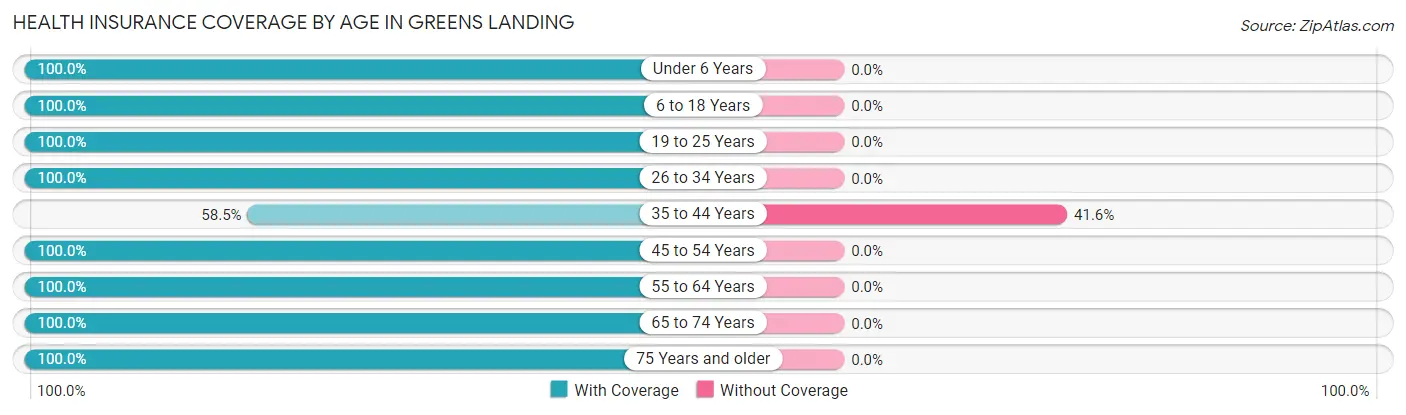
| Age Bracket | With Coverage | Without Coverage |
| Under 6 Years | 23 (100.0%) | 0 (0.0%) |
| 6 to 18 Years | 154 (100.0%) | 0 (0.0%) |
| 19 to 25 Years | 53 (100.0%) | 0 (0.0%) |
| 26 to 34 Years | 16 (100.0%) | 0 (0.0%) |
| 35 to 44 Years | 83 (58.5%) | 59 (41.5%) |
| 45 to 54 Years | 54 (100.0%) | 0 (0.0%) |
| 55 to 64 Years | 47 (100.0%) | 0 (0.0%) |
| 65 to 74 Years | 56 (100.0%) | 0 (0.0%) |
| 75 Years and older | 16 (100.0%) | 0 (0.0%) |
| Total | 502 (89.5%) | 59 (10.5%) |
Health Insurance Coverage by Citizenship Status in Greens Landing
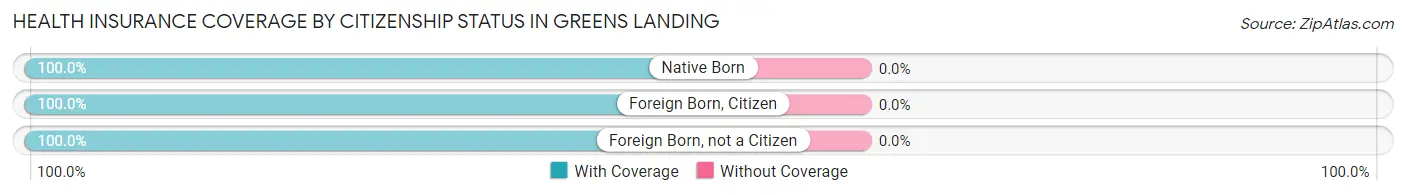
| Citizenship Status | With Coverage | Without Coverage |
| Native Born | 23 (100.0%) | 0 (0.0%) |
| Foreign Born, Citizen | 154 (100.0%) | 0 (0.0%) |
| Foreign Born, not a Citizen | 53 (100.0%) | 0 (0.0%) |
Health Insurance Coverage by Household Income in Greens Landing
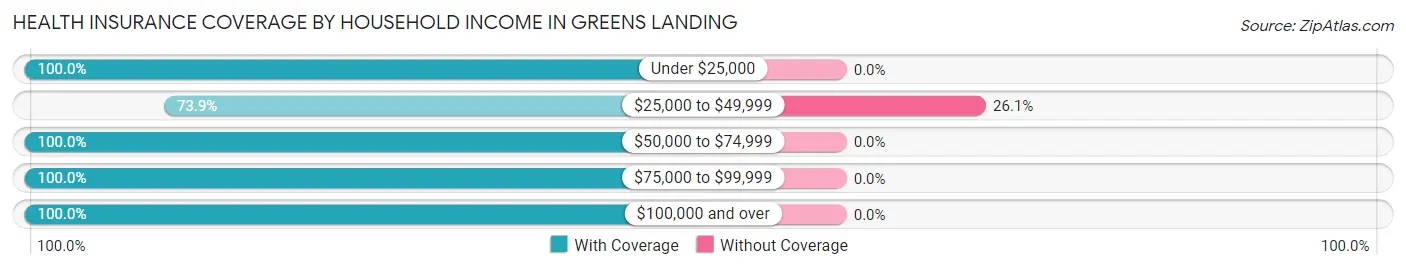
| Household Income | With Coverage | Without Coverage |
| Under $25,000 | 21 (100.0%) | 0 (0.0%) |
| $25,000 to $49,999 | 167 (73.9%) | 59 (26.1%) |
| $50,000 to $74,999 | 86 (100.0%) | 0 (0.0%) |
| $75,000 to $99,999 | 63 (100.0%) | 0 (0.0%) |
| $100,000 and over | 165 (100.0%) | 0 (0.0%) |
Public vs Private Health Insurance Coverage by Age in Greens Landing
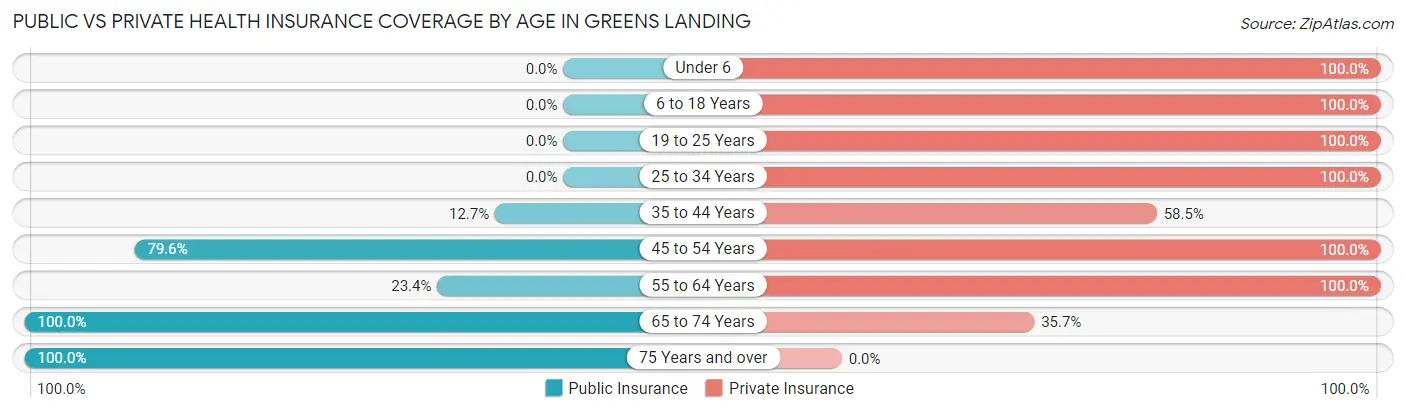
| Age Bracket | Public Insurance | Private Insurance |
| Under 6 | 0 (0.0%) | 23 (100.0%) |
| 6 to 18 Years | 0 (0.0%) | 154 (100.0%) |
| 19 to 25 Years | 0 (0.0%) | 53 (100.0%) |
| 25 to 34 Years | 0 (0.0%) | 16 (100.0%) |
| 35 to 44 Years | 18 (12.7%) | 83 (58.5%) |
| 45 to 54 Years | 43 (79.6%) | 54 (100.0%) |
| 55 to 64 Years | 11 (23.4%) | 47 (100.0%) |
| 65 to 74 Years | 56 (100.0%) | 20 (35.7%) |
| 75 Years and over | 16 (100.0%) | 0 (0.0%) |
| Total | 144 (25.7%) | 450 (80.2%) |
Disability Status by Sex by Age in Greens Landing
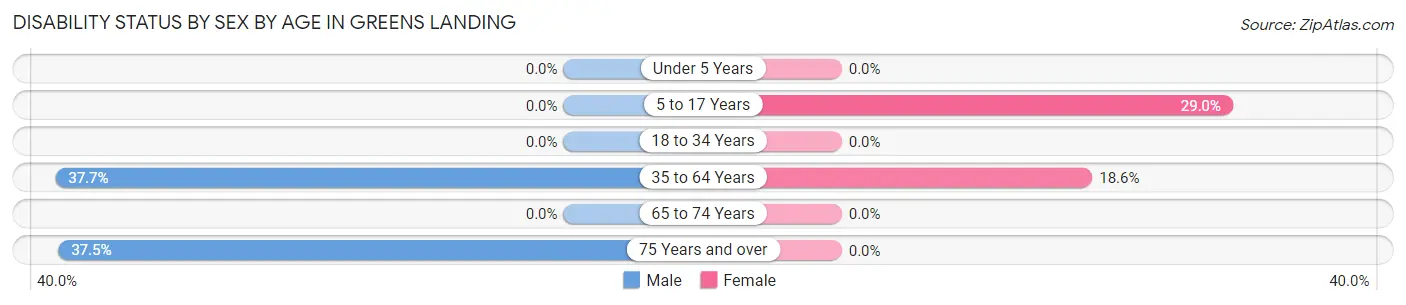
| Age Bracket | Male | Female |
| Under 5 Years | 0 (0.0%) | 0 (0.0%) |
| 5 to 17 Years | 0 (0.0%) | 27 (29.0%) |
| 18 to 34 Years | 0 (0.0%) | 0 (0.0%) |
| 35 to 64 Years | 43 (37.7%) | 24 (18.6%) |
| 65 to 74 Years | 0 (0.0%) | 0 (0.0%) |
| 75 Years and over | 6 (37.5%) | 0 (0.0%) |
Disability Class by Sex by Age in Greens Landing
Disability Class: Hearing Difficulty
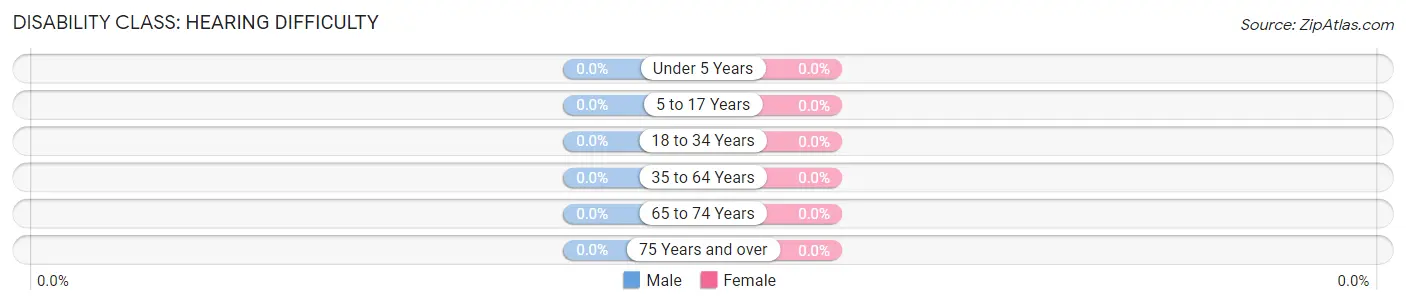
| Age Bracket | Male | Female |
| Under 5 Years | 0 (0.0%) | 0 (0.0%) |
| 5 to 17 Years | 0 (0.0%) | 0 (0.0%) |
| 18 to 34 Years | 0 (0.0%) | 0 (0.0%) |
| 35 to 64 Years | 0 (0.0%) | 0 (0.0%) |
| 65 to 74 Years | 0 (0.0%) | 0 (0.0%) |
| 75 Years and over | 0 (0.0%) | 0 (0.0%) |
Disability Class: Vision Difficulty
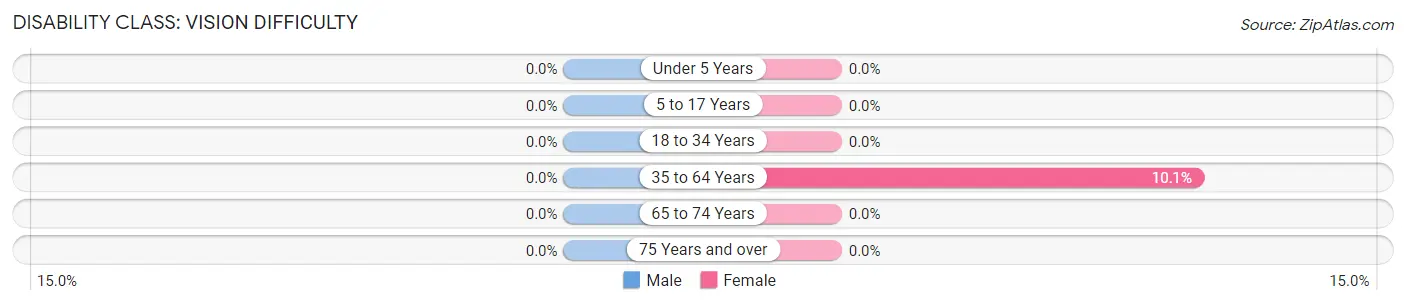
| Age Bracket | Male | Female |
| Under 5 Years | 0 (0.0%) | 0 (0.0%) |
| 5 to 17 Years | 0 (0.0%) | 0 (0.0%) |
| 18 to 34 Years | 0 (0.0%) | 0 (0.0%) |
| 35 to 64 Years | 0 (0.0%) | 13 (10.1%) |
| 65 to 74 Years | 0 (0.0%) | 0 (0.0%) |
| 75 Years and over | 0 (0.0%) | 0 (0.0%) |
Disability Class: Cognitive Difficulty
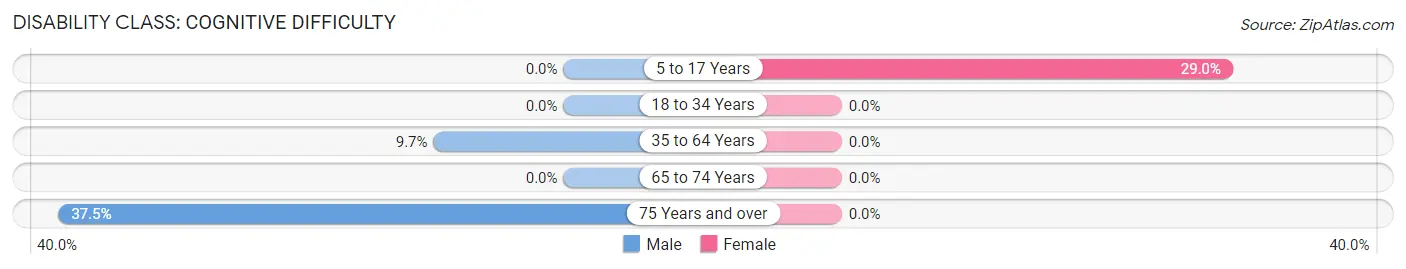
| Age Bracket | Male | Female |
| 5 to 17 Years | 0 (0.0%) | 27 (29.0%) |
| 18 to 34 Years | 0 (0.0%) | 0 (0.0%) |
| 35 to 64 Years | 11 (9.7%) | 0 (0.0%) |
| 65 to 74 Years | 0 (0.0%) | 0 (0.0%) |
| 75 Years and over | 6 (37.5%) | 0 (0.0%) |
Disability Class: Ambulatory Difficulty
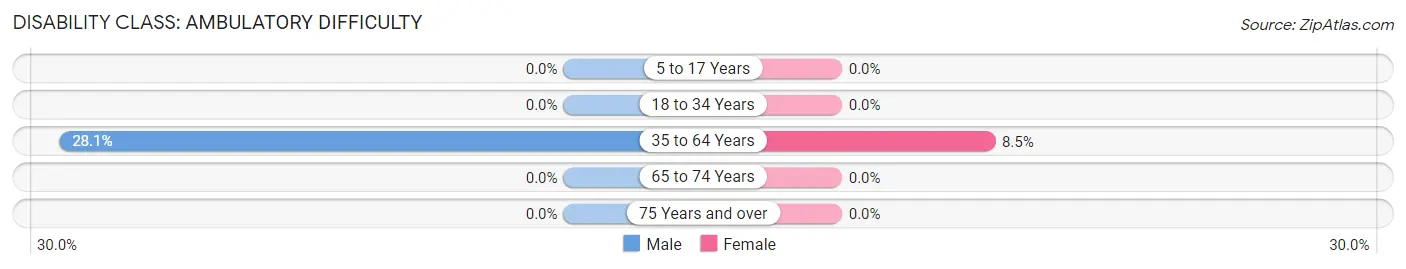
| Age Bracket | Male | Female |
| 5 to 17 Years | 0 (0.0%) | 0 (0.0%) |
| 18 to 34 Years | 0 (0.0%) | 0 (0.0%) |
| 35 to 64 Years | 32 (28.1%) | 11 (8.5%) |
| 65 to 74 Years | 0 (0.0%) | 0 (0.0%) |
| 75 Years and over | 0 (0.0%) | 0 (0.0%) |
Disability Class: Self-Care Difficulty
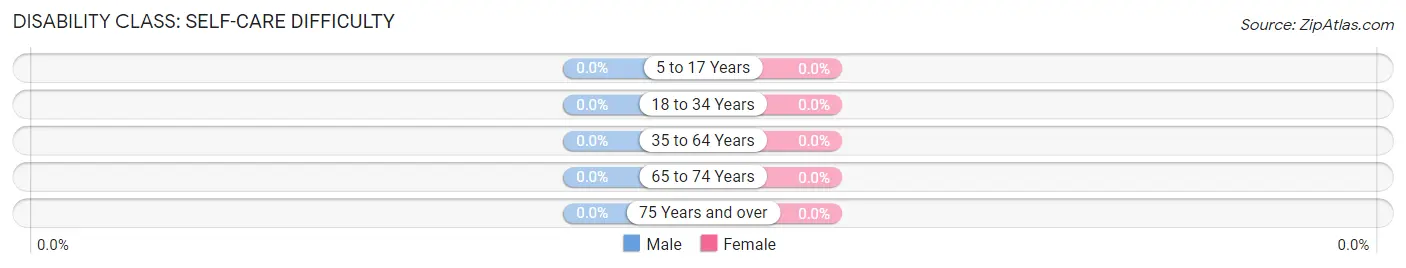
| Age Bracket | Male | Female |
| 5 to 17 Years | 0 (0.0%) | 0 (0.0%) |
| 18 to 34 Years | 0 (0.0%) | 0 (0.0%) |
| 35 to 64 Years | 0 (0.0%) | 0 (0.0%) |
| 65 to 74 Years | 0 (0.0%) | 0 (0.0%) |
| 75 Years and over | 0 (0.0%) | 0 (0.0%) |
Technology Access in Greens Landing
Computing Device Access in Greens Landing
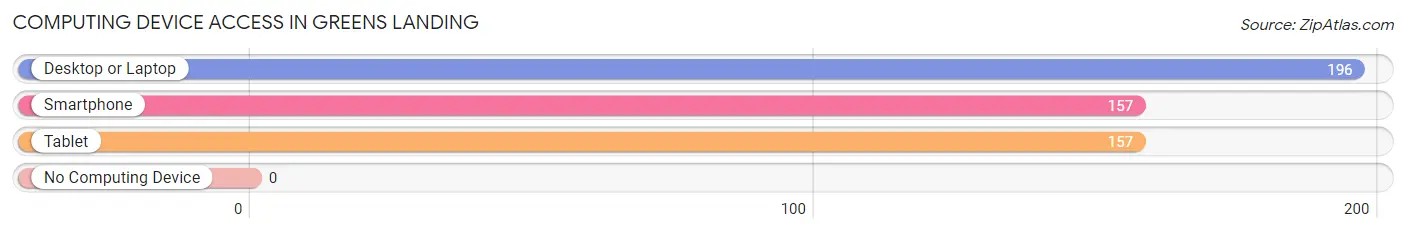
| Device Type | # Households | % Households |
| Desktop or Laptop | 196 | 94.7% |
| Smartphone | 157 | 75.8% |
| Tablet | 157 | 75.8% |
| No Computing Device | 0 | 0.0% |
| Total | 207 | 100.0% |
Internet Access in Greens Landing
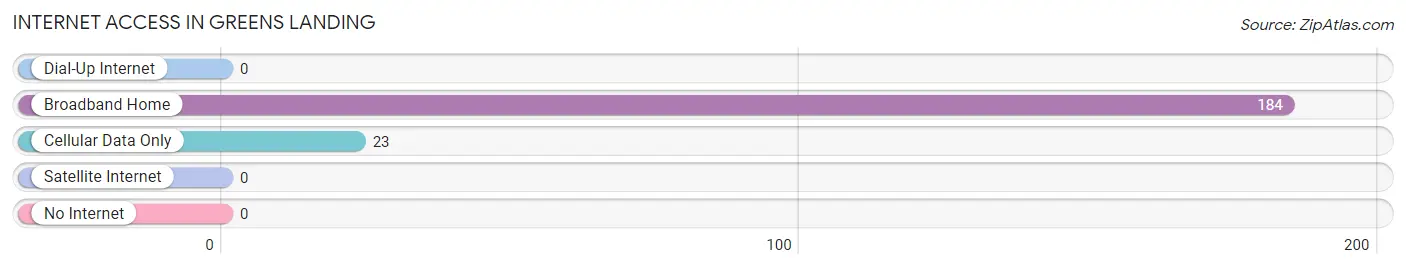
| Internet Type | # Households | % Households |
| Dial-Up Internet | 0 | 0.0% |
| Broadband Home | 184 | 88.9% |
| Cellular Data Only | 23 | 11.1% |
| Satellite Internet | 0 | 0.0% |
| No Internet | 0 | 0.0% |
| Total | 207 | 100.0% |
Greens Landing Summary
Greens Landing is a small unincorporated community located in Bucks County, Pennsylvania. It is situated along the Delaware River, just south of the borough of New Hope. The community is part of the larger New Hope-Lambertville area, which is known for its vibrant arts and culture scene.
History
Greens Landing was first settled in the late 1700s by a Quaker family named Green. The family built a grist mill and a saw mill on the banks of the Delaware River, and the area became known as Greens Landing. The Greens were active in the local community, and their descendants still live in the area today.
In the early 1800s, the area was a popular destination for travelers and tourists. The Delaware Canal, which ran through the area, was a major transportation route for goods and people. The canal was also used for recreational activities, such as fishing and boating.
In the late 1800s, the area began to attract more permanent residents. The population grew steadily until the 1950s, when the population began to decline. Today, the population of Greens Landing is estimated to be around 200 people.
Geography
Greens Landing is located in Bucks County, Pennsylvania, along the Delaware River. The community is situated between the boroughs of New Hope and Lambertville, and is part of the larger New Hope-Lambertville area. The area is known for its rolling hills and lush forests, and is a popular destination for outdoor activities such as hiking, biking, and fishing.
The climate in Greens Landing is typical of the Northeastern United States, with cold winters and hot, humid summers. The average annual temperature is around 50 degrees Fahrenheit, and the average annual precipitation is around 40 inches.
Economy
Greens Landing is a small, rural community with a limited economy. The primary industries in the area are tourism and agriculture. The area is known for its scenic beauty and outdoor activities, and is a popular destination for tourists and outdoor enthusiasts.
Agriculture is also an important part of the local economy. The area is home to several small farms, which produce a variety of crops, including corn, soybeans, and hay.
Demographics
Greens Landing is a small, rural community with a population of around 200 people. The population is predominantly white, with a small minority of African Americans and Hispanics. The median household income is around $50,000, and the median home value is around $200,000.
The area is served by the New Hope-Solebury School District, which includes two elementary schools, one middle school, and one high school. The area is also home to several churches, including the Greens Landing United Methodist Church.
Conclusion
Greens Landing is a small, rural community located in Bucks County, Pennsylvania. The area is known for its scenic beauty and outdoor activities, and is a popular destination for tourists and outdoor enthusiasts. The economy is primarily based on tourism and agriculture, and the population is predominantly white. The area is served by the New Hope-Solebury School District, and is home to several churches.
Common Questions
What is Per Capita Income in Greens Landing?
Per Capita income in Greens Landing is $32,601.
What is the Median Household income in Greens Landing?
Median Household Income in Greens Landing is $71,442.
What is Inequality or Gini Index in Greens Landing?
Inequality or Gini Index in Greens Landing is 0.39.
What is the Total Population of Greens Landing?
Total Population of Greens Landing is 561.
What is the Total Male Population of Greens Landing?
Total Male Population of Greens Landing is 264.
What is the Total Female Population of Greens Landing?
Total Female Population of Greens Landing is 297.
What is the Ratio of Males per 100 Females in Greens Landing?
There are 88.89 Males per 100 Females in Greens Landing.
What is the Ratio of Females per 100 Males in Greens Landing?
There are 112.50 Females per 100 Males in Greens Landing.
What is the Median Population Age in Greens Landing?
Median Population Age in Greens Landing is 38.6 Years.
What is the Average Family Size in Greens Landing
Average Family Size in Greens Landing is 3.4 People.
What is the Average Household Size in Greens Landing
Average Household Size in Greens Landing is 2.7 People.
How Large is the Labor Force in Greens Landing?
There are 262 People in the Labor Forcein in Greens Landing.
What is the Percentage of People in the Labor Force in Greens Landing?
55.5% of People are in the Labor Force in Greens Landing.
What is the Unemployment Rate in Greens Landing?
Unemployment Rate in Greens Landing is 4.6%.