Bellwood borough, PA Map & Demographics
Bellwood borough Overview
$27,666
PER CAPITA INCOME
$73,929
AVG FAMILY INCOME
$50,250
AVG HOUSEHOLD INCOME
23.0%
WAGE / INCOME GAP [ % ]
77.0¢/ $1
WAGE / INCOME GAP [ $ ]
0.41
INEQUALITY / GINI INDEX
1,681
TOTAL POPULATION
855
MALE POPULATION
826
FEMALE POPULATION
103.51
MALES / 100 FEMALES
96.61
FEMALES / 100 MALES
39.8
MEDIAN AGE
3.1
AVG FAMILY SIZE
2.5
AVG HOUSEHOLD SIZE
923
LABOR FORCE [ PEOPLE ]
68.0%
PERCENT IN LABOR FORCE
4.9%
UNEMPLOYMENT RATE
Income in Bellwood borough
Income Overview in Bellwood borough
Per Capita Income in Bellwood borough is $27,666, while median incomes of families and households are $73,929 and $50,250 respectively.
| Characteristic | Number | Measure |
| Per Capita Income | 1,681 | $27,666 |
| Median Family Income | 428 | $73,929 |
| Mean Family Income | 428 | $82,515 |
| Median Household Income | 684 | $50,250 |
| Mean Household Income | 684 | $68,282 |
| Income Deficit | 428 | $0 |
| Wage / Income Gap (%) | 1,681 | 23.00% |
| Wage / Income Gap ($) | 1,681 | 77.00¢ per $1 |
| Gini / Inequality Index | 1,681 | 0.41 |
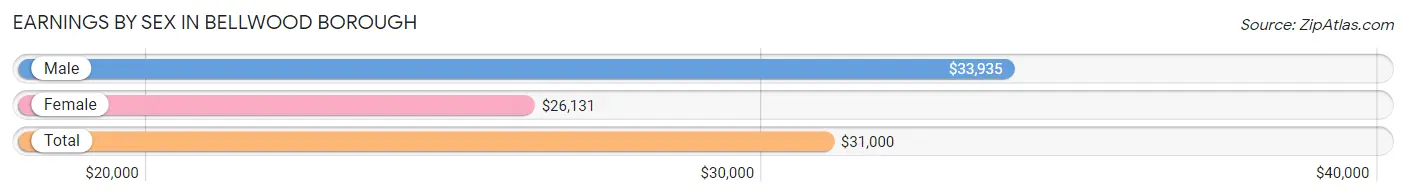
Earnings by Sex in Bellwood borough
Average Earnings in Bellwood borough are $31,000, $33,935 for men and $26,131 for women, a difference of 23.0%.
| Sex | Number | Average Earnings |
| Male | 485 (49.4%) | $33,935 |
| Female | 497 (50.6%) | $26,131 |
| Total | 982 (100.0%) | $31,000 |
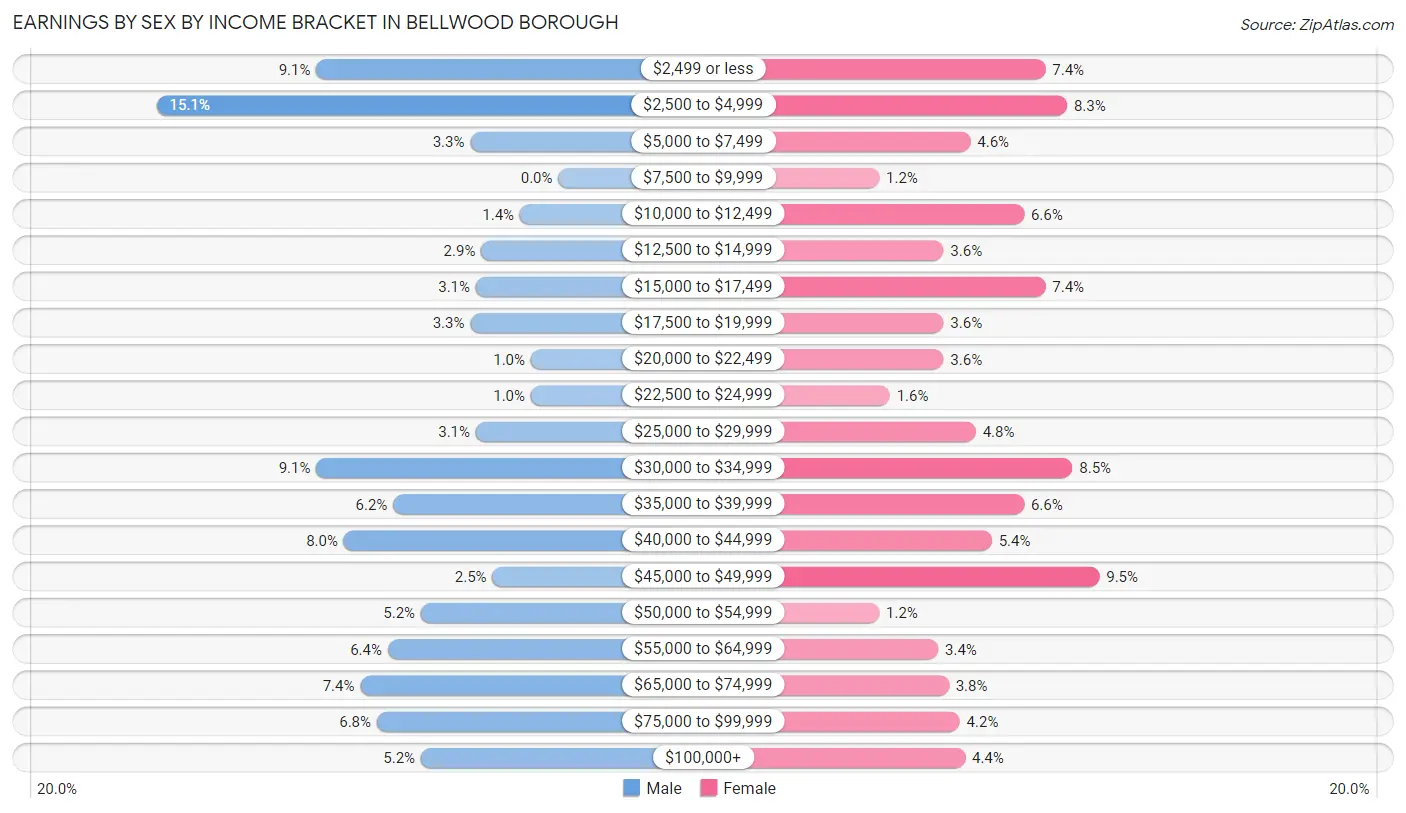
Earnings by Sex by Income Bracket in Bellwood borough
The most common earnings brackets in Bellwood borough are $2,500 to $4,999 for men (73 | 15.0%) and $45,000 to $49,999 for women (47 | 9.5%).
| Income | Male | Female |
| $2,499 or less | 44 (9.1%) | 37 (7.4%) |
| $2,500 to $4,999 | 73 (15.0%) | 41 (8.3%) |
| $5,000 to $7,499 | 16 (3.3%) | 23 (4.6%) |
| $7,500 to $9,999 | 0 (0.0%) | 6 (1.2%) |
| $10,000 to $12,499 | 7 (1.4%) | 33 (6.6%) |
| $12,500 to $14,999 | 14 (2.9%) | 18 (3.6%) |
| $15,000 to $17,499 | 15 (3.1%) | 37 (7.4%) |
| $17,500 to $19,999 | 16 (3.3%) | 18 (3.6%) |
| $20,000 to $22,499 | 5 (1.0%) | 18 (3.6%) |
| $22,500 to $24,999 | 5 (1.0%) | 8 (1.6%) |
| $25,000 to $29,999 | 15 (3.1%) | 24 (4.8%) |
| $30,000 to $34,999 | 44 (9.1%) | 42 (8.5%) |
| $35,000 to $39,999 | 30 (6.2%) | 33 (6.6%) |
| $40,000 to $44,999 | 39 (8.0%) | 27 (5.4%) |
| $45,000 to $49,999 | 12 (2.5%) | 47 (9.5%) |
| $50,000 to $54,999 | 25 (5.1%) | 6 (1.2%) |
| $55,000 to $64,999 | 31 (6.4%) | 17 (3.4%) |
| $65,000 to $74,999 | 36 (7.4%) | 19 (3.8%) |
| $75,000 to $99,999 | 33 (6.8%) | 21 (4.2%) |
| $100,000+ | 25 (5.1%) | 22 (4.4%) |
| Total | 485 (100.0%) | 497 (100.0%) |
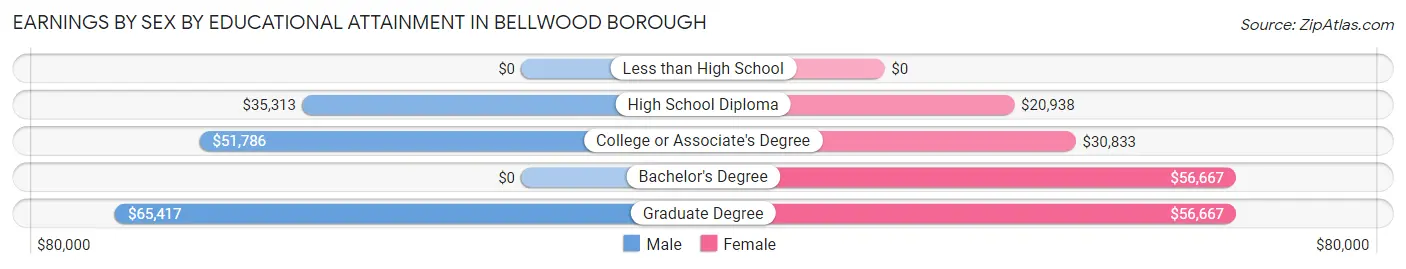
Earnings by Sex by Educational Attainment in Bellwood borough
Average earnings in Bellwood borough are $38,167 for men and $31,339 for women, a difference of 17.9%. Men with an educational attainment of graduate degree enjoy the highest average annual earnings of $65,417, while those with high school diploma education earn the least with $35,313. Women with an educational attainment of bachelor's degree earn the most with the average annual earnings of $56,667, while those with high school diploma education have the smallest earnings of $20,938.
| Educational Attainment | Male Income | Female Income |
| Less than High School | - | - |
| High School Diploma | $35,313 | $20,938 |
| College or Associate's Degree | $51,786 | $30,833 |
| Bachelor's Degree | - | - |
| Graduate Degree | $65,417 | $56,667 |
| Total | $38,167 | $31,339 |
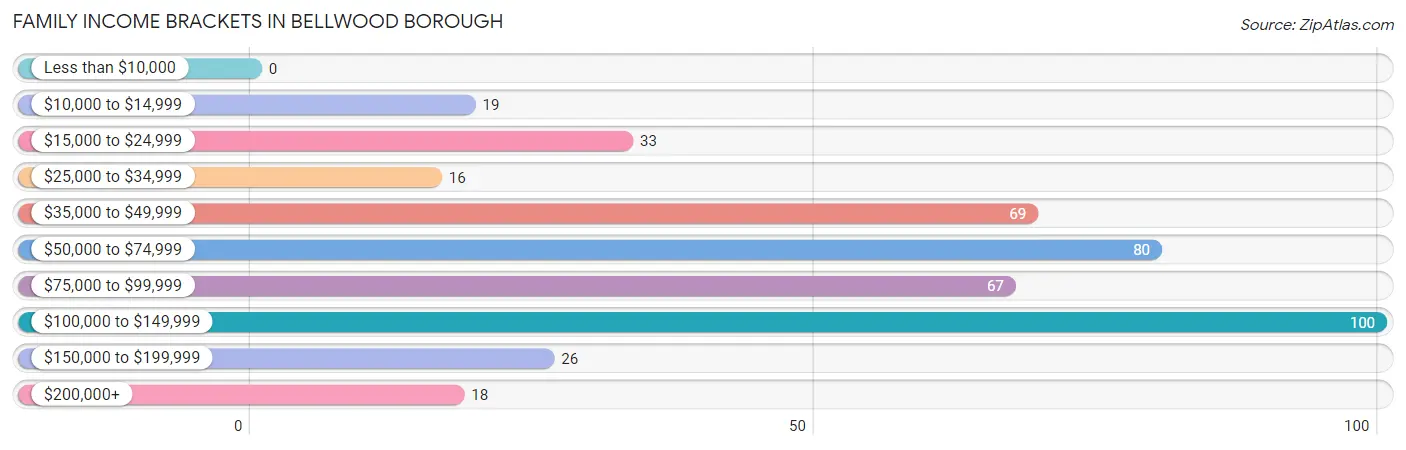
Family Income in Bellwood borough
Family Income Brackets in Bellwood borough
According to the Bellwood borough family income data, there are 100 families falling into the $100,000 to $149,999 income range, which is the most common income bracket and makes up 23.4% of all families.
| Income Bracket | # Families | % Families |
| Less than $10,000 | 0 | 0.0% |
| $10,000 to $14,999 | 19 | 4.4% |
| $15,000 to $24,999 | 33 | 7.7% |
| $25,000 to $34,999 | 16 | 3.7% |
| $35,000 to $49,999 | 69 | 16.1% |
| $50,000 to $74,999 | 80 | 18.7% |
| $75,000 to $99,999 | 67 | 15.7% |
| $100,000 to $149,999 | 100 | 23.4% |
| $150,000 to $199,999 | 26 | 6.1% |
| $200,000+ | 18 | 4.2% |
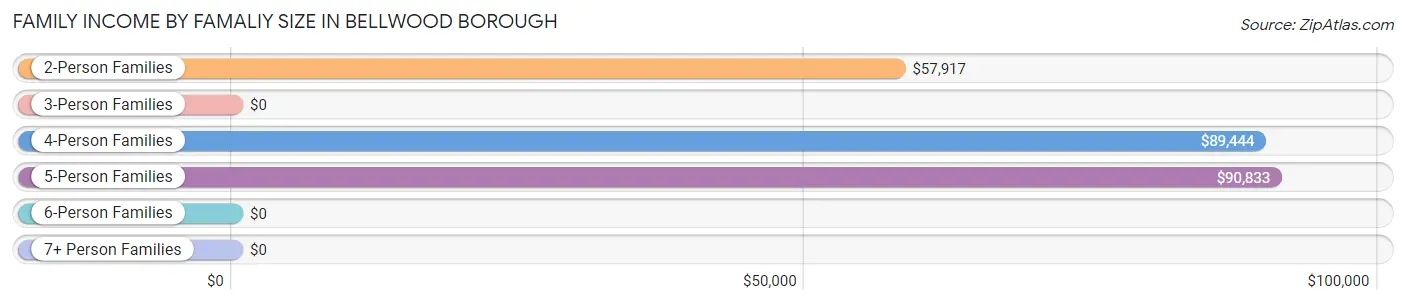
Family Income by Famaliy Size in Bellwood borough
5-person families (26 | 6.1%) account for the highest median family income in Bellwood borough with $90,833 per family, while 2-person families (153 | 35.7%) have the highest median income of $28,958 per family member.
| Income Bracket | # Families | Median Income |
| 2-Person Families | 153 (35.7%) | $57,917 |
| 3-Person Families | 145 (33.9%) | $0 |
| 4-Person Families | 94 (22.0%) | $89,444 |
| 5-Person Families | 26 (6.1%) | $90,833 |
| 6-Person Families | 10 (2.3%) | $0 |
| 7+ Person Families | 0 (0.0%) | $0 |
| Total | 428 (100.0%) | $73,929 |
Family Income by Number of Earners in Bellwood borough
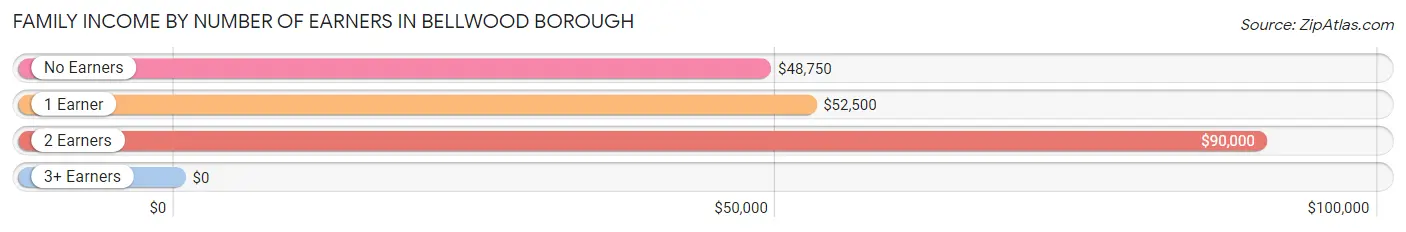
| Number of Earners | # Families | Median Income |
| No Earners | 74 (17.3%) | $48,750 |
| 1 Earner | 54 (12.6%) | $52,500 |
| 2 Earners | 222 (51.9%) | $90,000 |
| 3+ Earners | 78 (18.2%) | $0 |
| Total | 428 (100.0%) | $73,929 |
Household Income in Bellwood borough
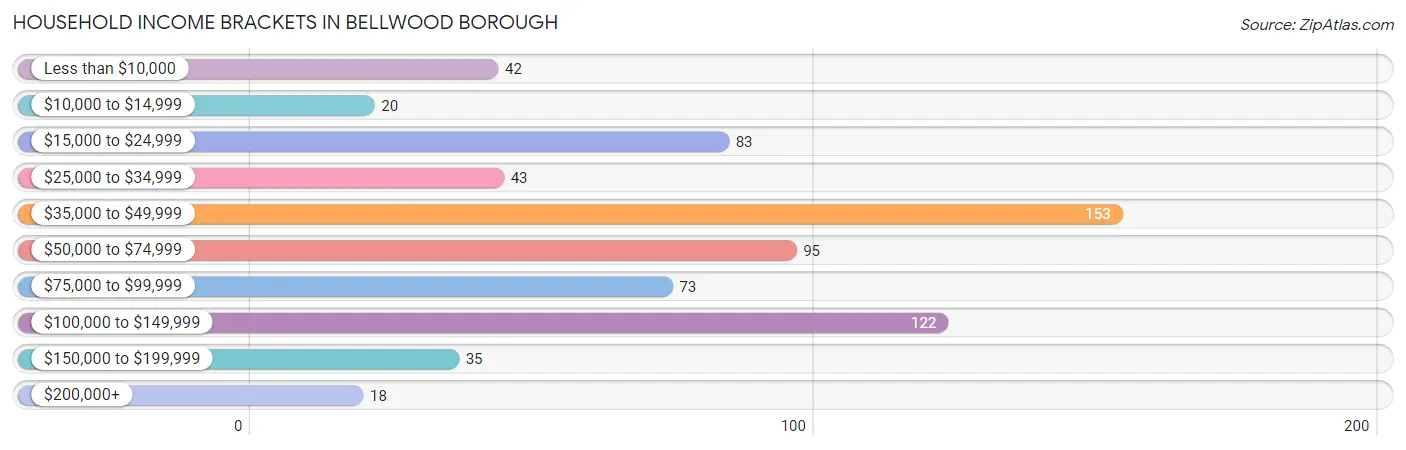
Household Income Brackets in Bellwood borough
With 153 households falling in the category, the $35,000 to $49,999 income range is the most frequent in Bellwood borough, accounting for 22.4% of all households. In contrast, only 18 households (2.6%) fall into the $200,000+ income bracket, making it the least populous group.
| Income Bracket | # Households | % Households |
| Less than $10,000 | 42 | 6.1% |
| $10,000 to $14,999 | 20 | 2.9% |
| $15,000 to $24,999 | 83 | 12.1% |
| $25,000 to $34,999 | 43 | 6.3% |
| $35,000 to $49,999 | 153 | 22.4% |
| $50,000 to $74,999 | 95 | 13.9% |
| $75,000 to $99,999 | 73 | 10.7% |
| $100,000 to $149,999 | 122 | 17.8% |
| $150,000 to $199,999 | 35 | 5.1% |
| $200,000+ | 18 | 2.6% |
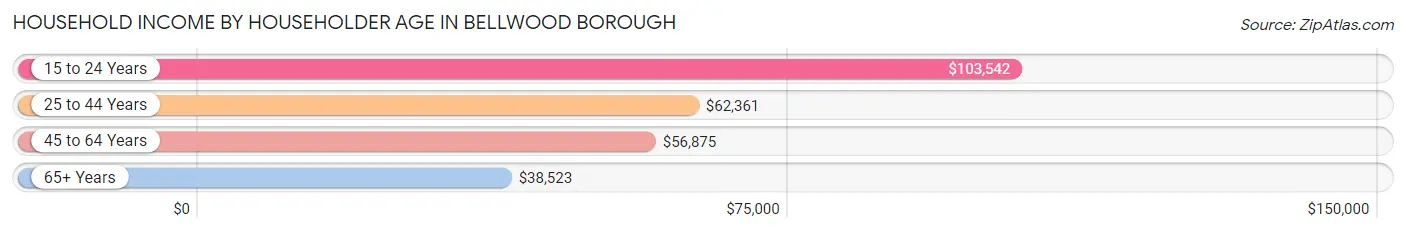
Household Income by Householder Age in Bellwood borough
The median household income in Bellwood borough is $50,250, with the highest median household income of $103,542 found in the 15 to 24 years age bracket for the primary householder. A total of 13 households (1.9%) fall into this category. Meanwhile, the 65+ years age bracket for the primary householder has the lowest median household income of $38,523, with 155 households (22.7%) in this group.
| Income Bracket | # Households | Median Income |
| 15 to 24 Years | 13 (1.9%) | $103,542 |
| 25 to 44 Years | 221 (32.3%) | $62,361 |
| 45 to 64 Years | 295 (43.1%) | $56,875 |
| 65+ Years | 155 (22.7%) | $38,523 |
| Total | 684 (100.0%) | $50,250 |
Poverty in Bellwood borough
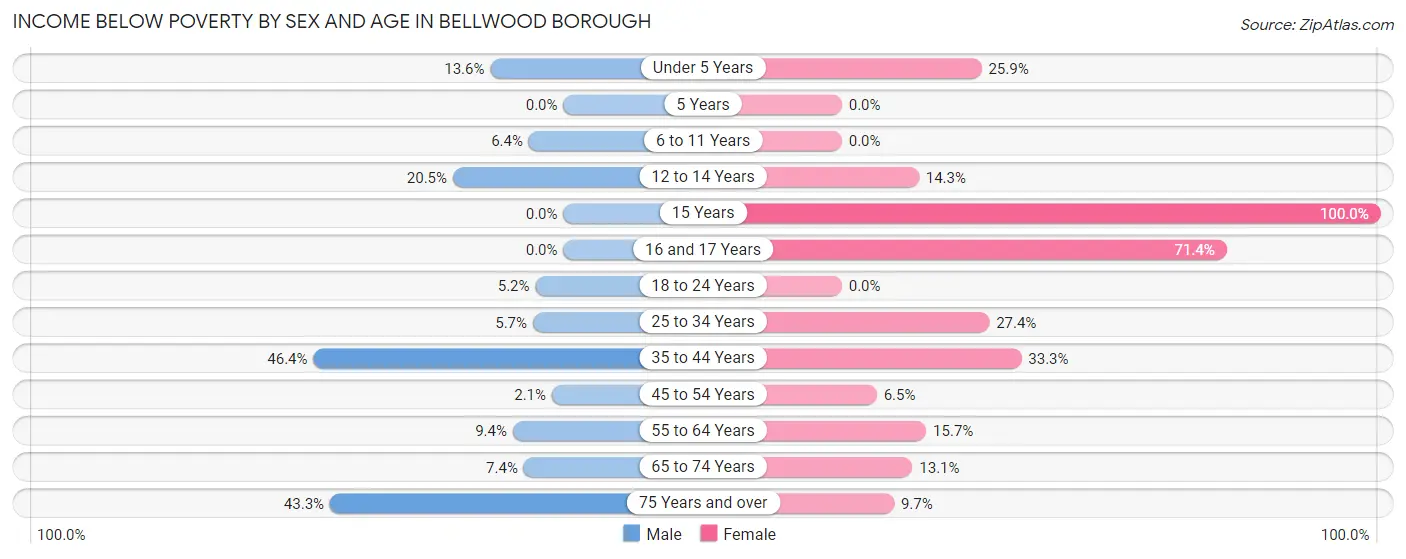
Income Below Poverty by Sex and Age in Bellwood borough
With 14.2% poverty level for males and 20.8% for females among the residents of Bellwood borough, 35 to 44 year old males and 15 year old females are the most vulnerable to poverty, with 58 males (46.4%) and 11 females (100.0%) in their respective age groups living below the poverty level.
| Age Bracket | Male | Female |
| Under 5 Years | 8 (13.6%) | 7 (25.9%) |
| 5 Years | 0 (0.0%) | 0 (0.0%) |
| 6 to 11 Years | 5 (6.4%) | 0 (0.0%) |
| 12 to 14 Years | 8 (20.5%) | 6 (14.3%) |
| 15 Years | 0 (0.0%) | 11 (100.0%) |
| 16 and 17 Years | 0 (0.0%) | 25 (71.4%) |
| 18 to 24 Years | 4 (5.2%) | 0 (0.0%) |
| 25 to 34 Years | 6 (5.7%) | 29 (27.4%) |
| 35 to 44 Years | 58 (46.4%) | 56 (33.3%) |
| 45 to 54 Years | 2 (2.1%) | 7 (6.5%) |
| 55 to 64 Years | 12 (9.4%) | 13 (15.7%) |
| 65 to 74 Years | 5 (7.3%) | 11 (13.1%) |
| 75 Years and over | 13 (43.3%) | 6 (9.7%) |
| Total | 121 (14.2%) | 171 (20.8%) |
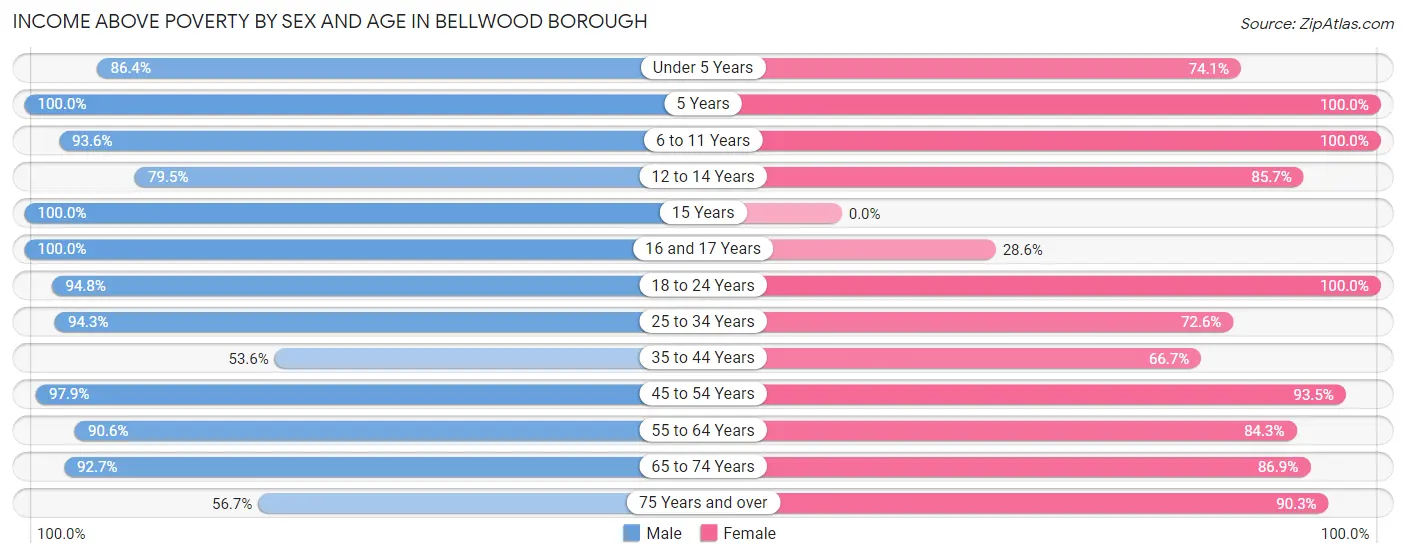
Income Above Poverty by Sex and Age in Bellwood borough
According to the poverty statistics in Bellwood borough, males aged 5 years and females aged 5 years are the age groups that are most secure financially, with 100.0% of males and 100.0% of females in these age groups living above the poverty line.
| Age Bracket | Male | Female |
| Under 5 Years | 51 (86.4%) | 20 (74.1%) |
| 5 Years | 13 (100.0%) | 12 (100.0%) |
| 6 to 11 Years | 73 (93.6%) | 29 (100.0%) |
| 12 to 14 Years | 31 (79.5%) | 36 (85.7%) |
| 15 Years | 7 (100.0%) | 0 (0.0%) |
| 16 and 17 Years | 28 (100.0%) | 10 (28.6%) |
| 18 to 24 Years | 73 (94.8%) | 56 (100.0%) |
| 25 to 34 Years | 100 (94.3%) | 77 (72.6%) |
| 35 to 44 Years | 67 (53.6%) | 112 (66.7%) |
| 45 to 54 Years | 92 (97.9%) | 101 (93.5%) |
| 55 to 64 Years | 116 (90.6%) | 70 (84.3%) |
| 65 to 74 Years | 63 (92.6%) | 73 (86.9%) |
| 75 Years and over | 17 (56.7%) | 56 (90.3%) |
| Total | 731 (85.8%) | 652 (79.2%) |
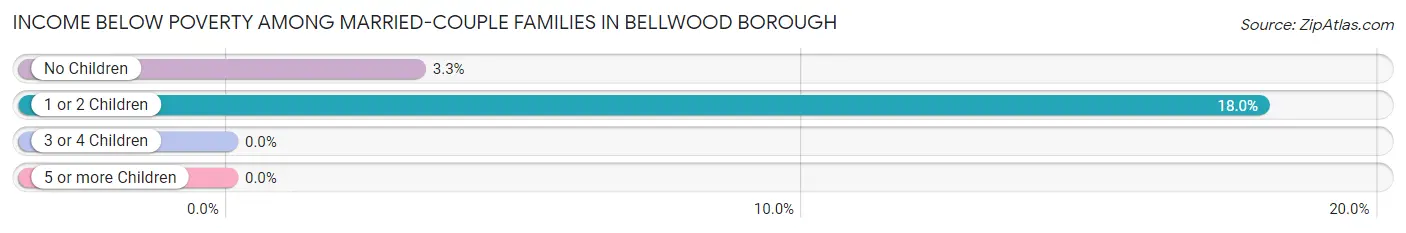
Income Below Poverty Among Married-Couple Families in Bellwood borough
The poverty statistics for married-couple families in Bellwood borough show that 10.6% or 35 of the total 331 families live below the poverty line. Families with 1 or 2 children have the highest poverty rate of 18.0%, comprising of 30 families. On the other hand, families with 3 or 4 children have the lowest poverty rate of 0.0%, which includes 0 families.
| Children | Above Poverty | Below Poverty |
| No Children | 148 (96.7%) | 5 (3.3%) |
| 1 or 2 Children | 137 (82.0%) | 30 (18.0%) |
| 3 or 4 Children | 11 (100.0%) | 0 (0.0%) |
| 5 or more Children | 0 (0.0%) | 0 (0.0%) |
| Total | 296 (89.4%) | 35 (10.6%) |
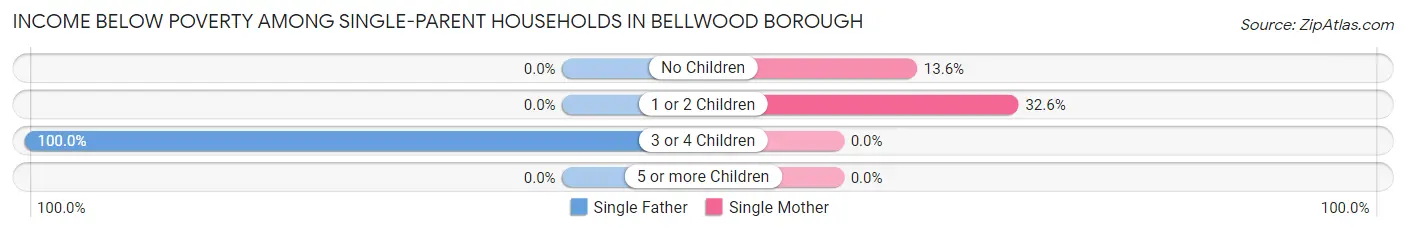
Income Below Poverty Among Single-Parent Households in Bellwood borough
According to the poverty data in Bellwood borough, 25.9% or 7 single-father households and 24.3% or 17 single-mother households are living below the poverty line. Among single-father households, those with 3 or 4 children have the highest poverty rate, with 7 households (100.0%) experiencing poverty. Likewise, among single-mother households, those with 1 or 2 children have the highest poverty rate, with 14 households (32.6%) falling below the poverty line.
| Children | Single Father | Single Mother |
| No Children | 0 (0.0%) | 3 (13.6%) |
| 1 or 2 Children | 0 (0.0%) | 14 (32.6%) |
| 3 or 4 Children | 7 (100.0%) | 0 (0.0%) |
| 5 or more Children | 0 (0.0%) | 0 (0.0%) |
| Total | 7 (25.9%) | 17 (24.3%) |
Income Below Poverty Among Married-Couple vs Single-Parent Households in Bellwood borough
The poverty data for Bellwood borough shows that 35 of the married-couple family households (10.6%) and 24 of the single-parent households (24.7%) are living below the poverty level. Within the married-couple family households, those with 1 or 2 children have the highest poverty rate, with 30 households (18.0%) falling below the poverty line. Among the single-parent households, those with 3 or 4 children have the highest poverty rate, with 7 household (58.3%) living below poverty.
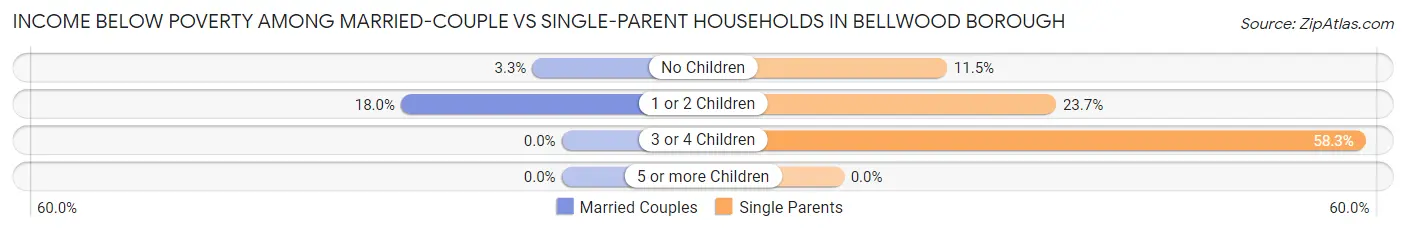
| Children | Married-Couple Families | Single-Parent Households |
| No Children | 5 (3.3%) | 3 (11.5%) |
| 1 or 2 Children | 30 (18.0%) | 14 (23.7%) |
| 3 or 4 Children | 0 (0.0%) | 7 (58.3%) |
| 5 or more Children | 0 (0.0%) | 0 (0.0%) |
| Total | 35 (10.6%) | 24 (24.7%) |
Race in Bellwood borough
The most populous races in Bellwood borough are White / Caucasian (1,616 | 96.1%), Two or more Races (47 | 2.8%), and Hispanic or Latino (32 | 1.9%).
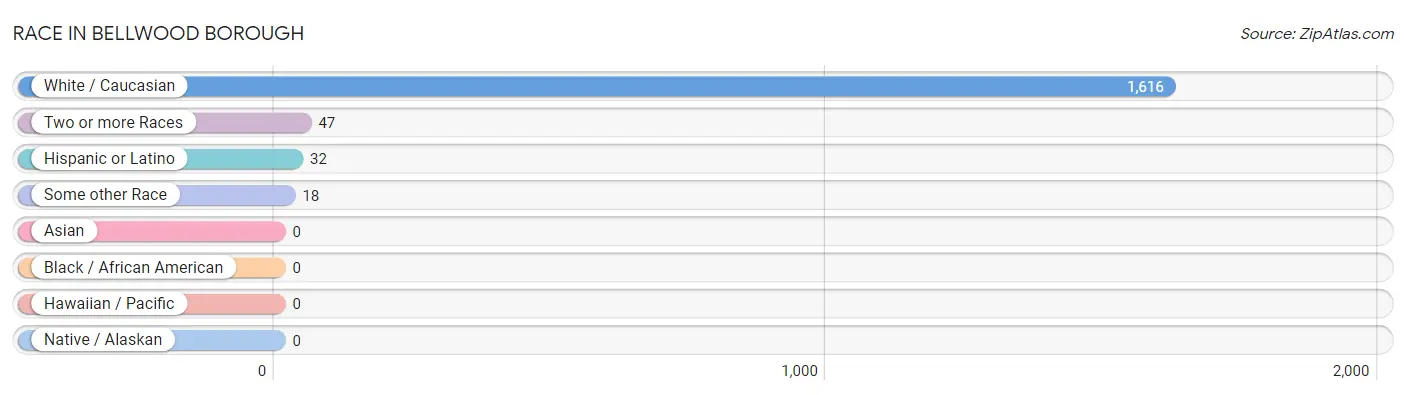
| Race | # Population | % Population |
| Asian | 0 | 0.0% |
| Black / African American | 0 | 0.0% |
| Hawaiian / Pacific | 0 | 0.0% |
| Hispanic or Latino | 32 | 1.9% |
| Native / Alaskan | 0 | 0.0% |
| White / Caucasian | 1,616 | 96.1% |
| Two or more Races | 47 | 2.8% |
| Some other Race | 18 | 1.1% |
| Total | 1,681 | 100.0% |
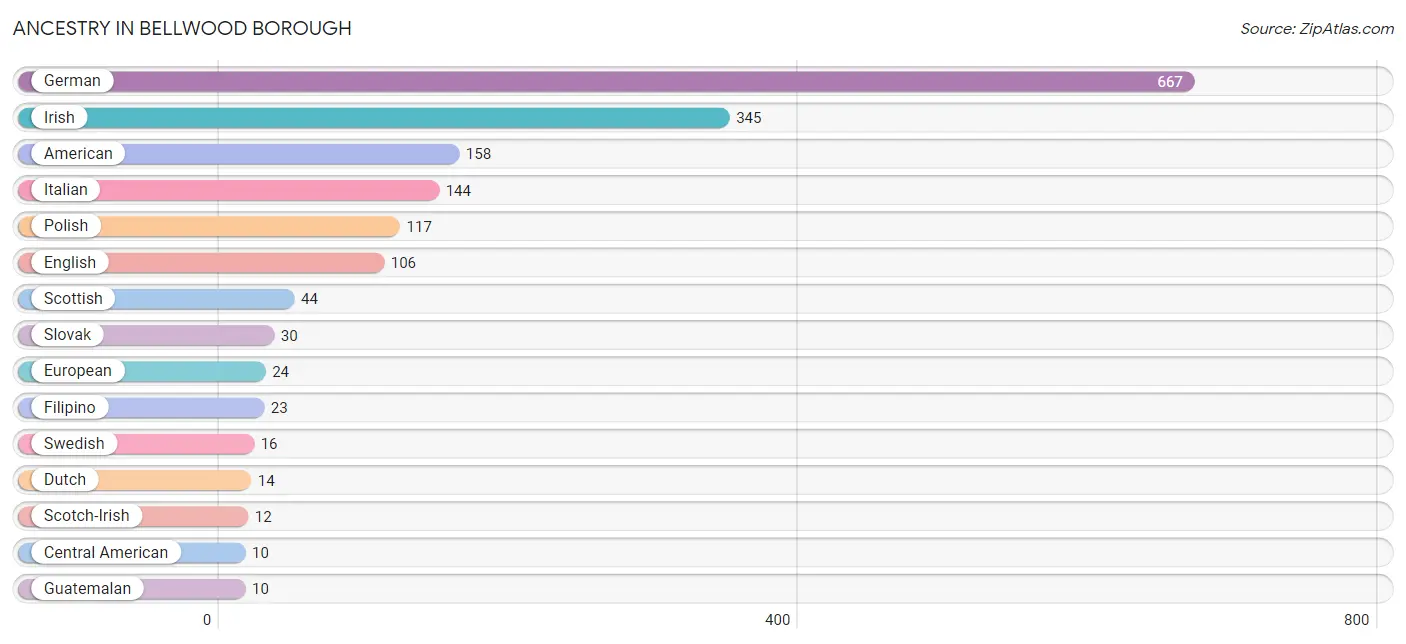
Ancestry in Bellwood borough
The most populous ancestries reported in Bellwood borough are German (667 | 39.7%), Irish (345 | 20.5%), American (158 | 9.4%), Italian (144 | 8.6%), and Polish (117 | 7.0%), together accounting for 85.1% of all Bellwood borough residents.
| Ancestry | # Population | % Population |
| American | 158 | 9.4% |
| Arab | 8 | 0.5% |
| Bhutanese | 9 | 0.5% |
| Blackfeet | 1 | 0.1% |
| Central American | 10 | 0.6% |
| Central American Indian | 9 | 0.5% |
| Czech | 6 | 0.4% |
| Dominican | 3 | 0.2% |
| Dutch | 14 | 0.8% |
| English | 106 | 6.3% |
| European | 24 | 1.4% |
| Filipino | 23 | 1.4% |
| French | 5 | 0.3% |
| German | 667 | 39.7% |
| Guatemalan | 10 | 0.6% |
| Irish | 345 | 20.5% |
| Iroquois | 3 | 0.2% |
| Italian | 144 | 8.6% |
| Native Hawaiian | 9 | 0.5% |
| Norwegian | 1 | 0.1% |
| Pennsylvania German | 5 | 0.3% |
| Polish | 117 | 7.0% |
| Scotch-Irish | 12 | 0.7% |
| Scottish | 44 | 2.6% |
| Slovak | 30 | 1.8% |
| Swedish | 16 | 0.9% |
| Swiss | 4 | 0.2% |
| Syrian | 8 | 0.5% |
| Welsh | 9 | 0.5% | View All 29 Rows |
Immigrants in Bellwood borough
The most numerous immigrant groups reported in Bellwood borough came from Central America (10 | 0.6%), Guatemala (10 | 0.6%), and Latin America (10 | 0.6%), together accounting for 1.8% of all Bellwood borough residents.
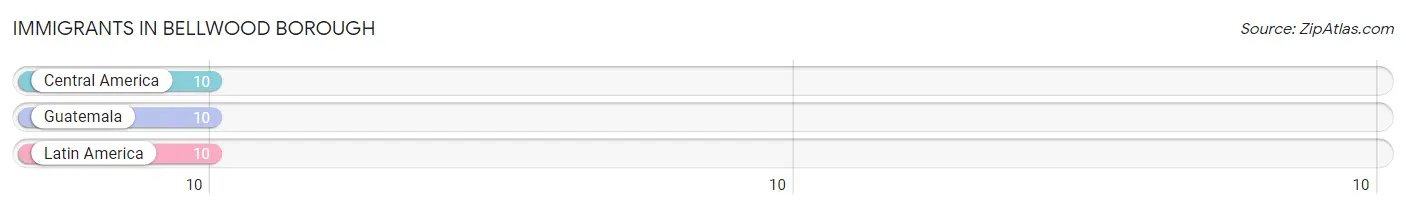
| Immigration Origin | # Population | % Population |
| Central America | 10 | 0.6% |
| Guatemala | 10 | 0.6% |
| Latin America | 10 | 0.6% | View All 3 Rows |
Sex and Age in Bellwood borough
Sex and Age in Bellwood borough
The most populous age groups in Bellwood borough are 40 to 44 Years (99 | 11.6%) for men and 35 to 39 Years (92 | 11.1%) for women.
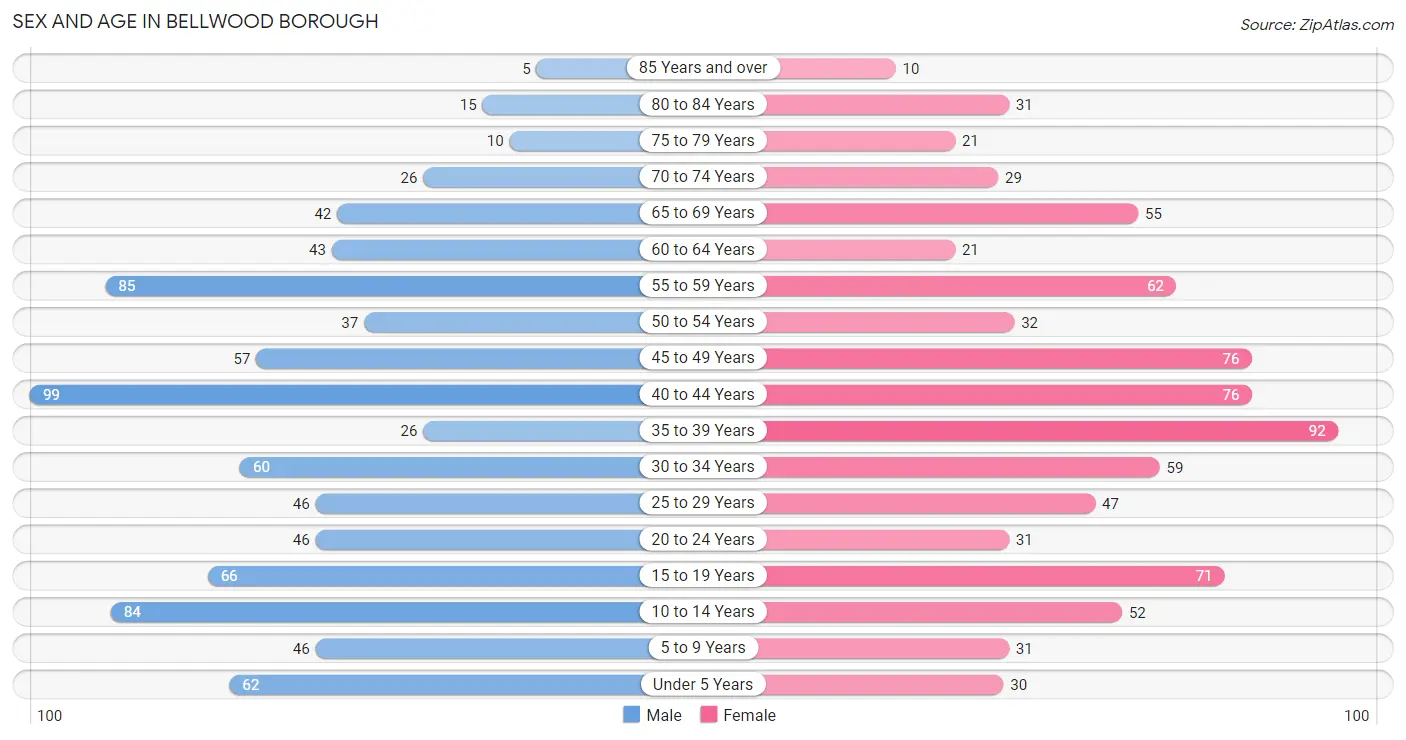
| Age Bracket | Male | Female |
| Under 5 Years | 62 (7.2%) | 30 (3.6%) |
| 5 to 9 Years | 46 (5.4%) | 31 (3.7%) |
| 10 to 14 Years | 84 (9.8%) | 52 (6.3%) |
| 15 to 19 Years | 66 (7.7%) | 71 (8.6%) |
| 20 to 24 Years | 46 (5.4%) | 31 (3.7%) |
| 25 to 29 Years | 46 (5.4%) | 47 (5.7%) |
| 30 to 34 Years | 60 (7.0%) | 59 (7.1%) |
| 35 to 39 Years | 26 (3.0%) | 92 (11.1%) |
| 40 to 44 Years | 99 (11.6%) | 76 (9.2%) |
| 45 to 49 Years | 57 (6.7%) | 76 (9.2%) |
| 50 to 54 Years | 37 (4.3%) | 32 (3.9%) |
| 55 to 59 Years | 85 (9.9%) | 62 (7.5%) |
| 60 to 64 Years | 43 (5.0%) | 21 (2.5%) |
| 65 to 69 Years | 42 (4.9%) | 55 (6.7%) |
| 70 to 74 Years | 26 (3.0%) | 29 (3.5%) |
| 75 to 79 Years | 10 (1.2%) | 21 (2.5%) |
| 80 to 84 Years | 15 (1.8%) | 31 (3.7%) |
| 85 Years and over | 5 (0.6%) | 10 (1.2%) |
| Total | 855 (100.0%) | 826 (100.0%) |
Families and Households in Bellwood borough
Median Family Size in Bellwood borough
The median family size in Bellwood borough is 3.11 persons per family, with single male/father families (27 | 6.3%) accounting for the largest median family size of 4.11 persons per family. On the other hand, single female/mother families (70 | 16.4%) represent the smallest median family size with 2.77 persons per family.
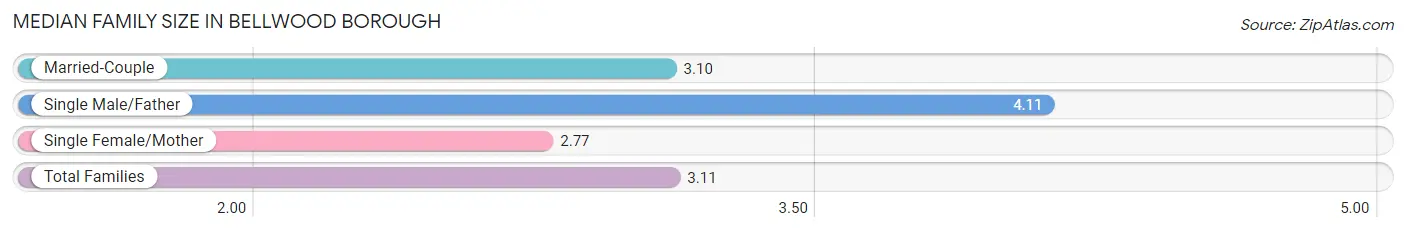
| Family Type | # Families | Family Size |
| Married-Couple | 331 (77.3%) | 3.10 |
| Single Male/Father | 27 (6.3%) | 4.11 |
| Single Female/Mother | 70 (16.4%) | 2.77 |
| Total Families | 428 (100.0%) | 3.11 |
Median Household Size in Bellwood borough
The median household size in Bellwood borough is 2.46 persons per household, with single male/father households (27 | 4.0%) accounting for the largest median household size of 4.78 persons per household. non-family households (256 | 37.4%) represent the smallest median household size with 1.21 persons per household.
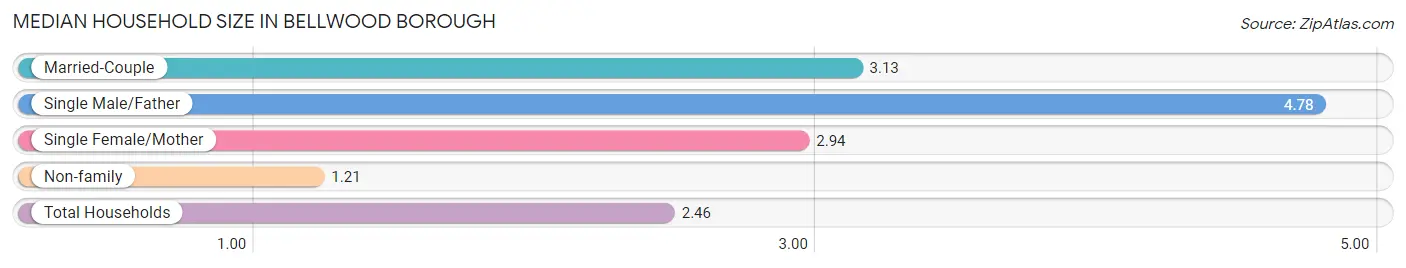
| Household Type | # Households | Household Size |
| Married-Couple | 331 (48.4%) | 3.13 |
| Single Male/Father | 27 (4.0%) | 4.78 |
| Single Female/Mother | 70 (10.2%) | 2.94 |
| Non-family | 256 (37.4%) | 1.21 |
| Total Households | 684 (100.0%) | 2.46 |
Household Size by Marriage Status in Bellwood borough
Out of a total of 684 households in Bellwood borough, 428 (62.6%) are family households, while 256 (37.4%) are nonfamily households. The most numerous type of family households are 2-person households, comprising 145, and the most common type of nonfamily households are 1-person households, comprising 211.
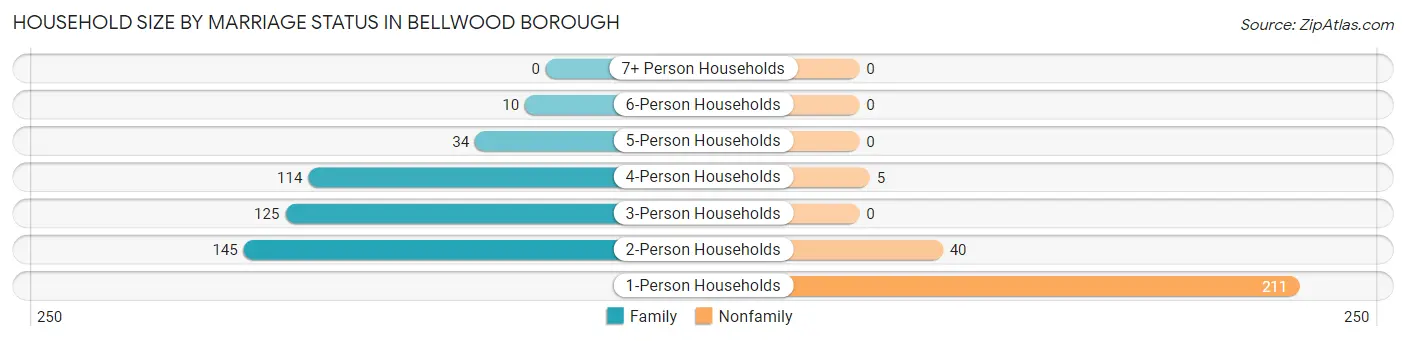
| Household Size | Family Households | Nonfamily Households |
| 1-Person Households | - | 211 (30.8%) |
| 2-Person Households | 145 (21.2%) | 40 (5.9%) |
| 3-Person Households | 125 (18.3%) | 0 (0.0%) |
| 4-Person Households | 114 (16.7%) | 5 (0.7%) |
| 5-Person Households | 34 (5.0%) | 0 (0.0%) |
| 6-Person Households | 10 (1.5%) | 0 (0.0%) |
| 7+ Person Households | 0 (0.0%) | 0 (0.0%) |
| Total | 428 (62.6%) | 256 (37.4%) |
Female Fertility in Bellwood borough
Fertility by Age in Bellwood borough
Average fertility rate in Bellwood borough is 22.0 births per 1,000 women. Women in the age bracket of 20 to 34 years have the highest fertility rate with 29.0 births per 1,000 women. Women in the age bracket of 35 to 50 years acount for 60.0% of all women with births.
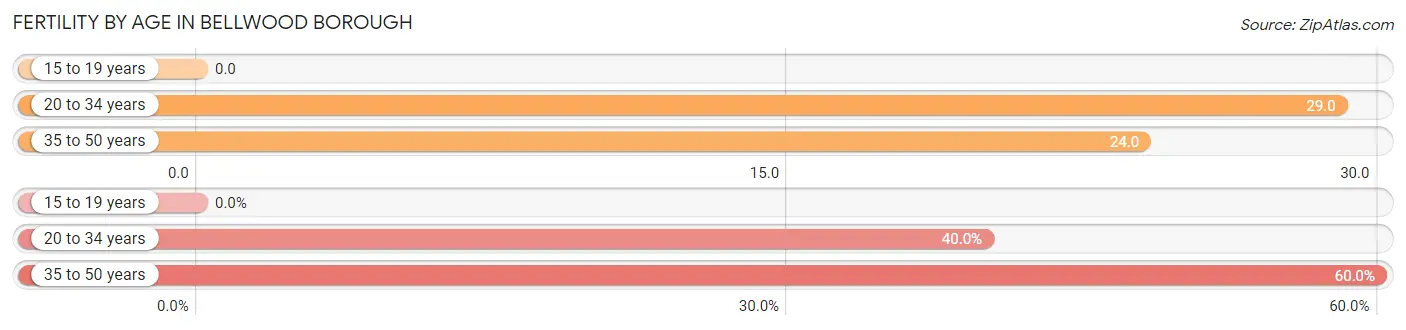
| Age Bracket | Women with Births | Births / 1,000 Women |
| 15 to 19 years | 0 (0.0%) | 0.0 |
| 20 to 34 years | 4 (40.0%) | 29.0 |
| 35 to 50 years | 6 (60.0%) | 24.0 |
| Total | 10 (100.0%) | 22.0 |
Fertility by Age by Marriage Status in Bellwood borough
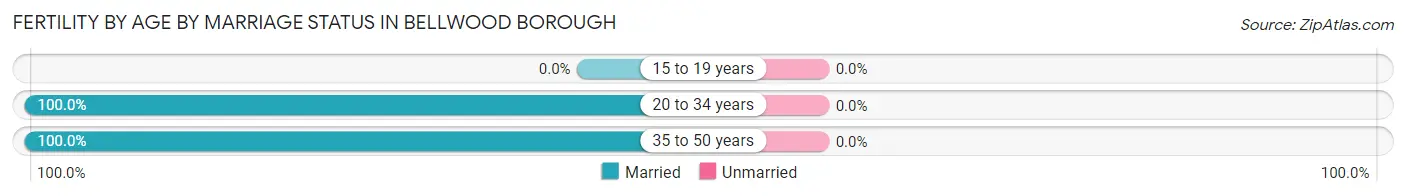
| Age Bracket | Married | Unmarried |
| 15 to 19 years | 0 (0.0%) | 0 (0.0%) |
| 20 to 34 years | 4 (100.0%) | 0 (0.0%) |
| 35 to 50 years | 6 (100.0%) | 0 (0.0%) |
| Total | 10 (100.0%) | 0 (0.0%) |
Fertility by Education in Bellwood borough
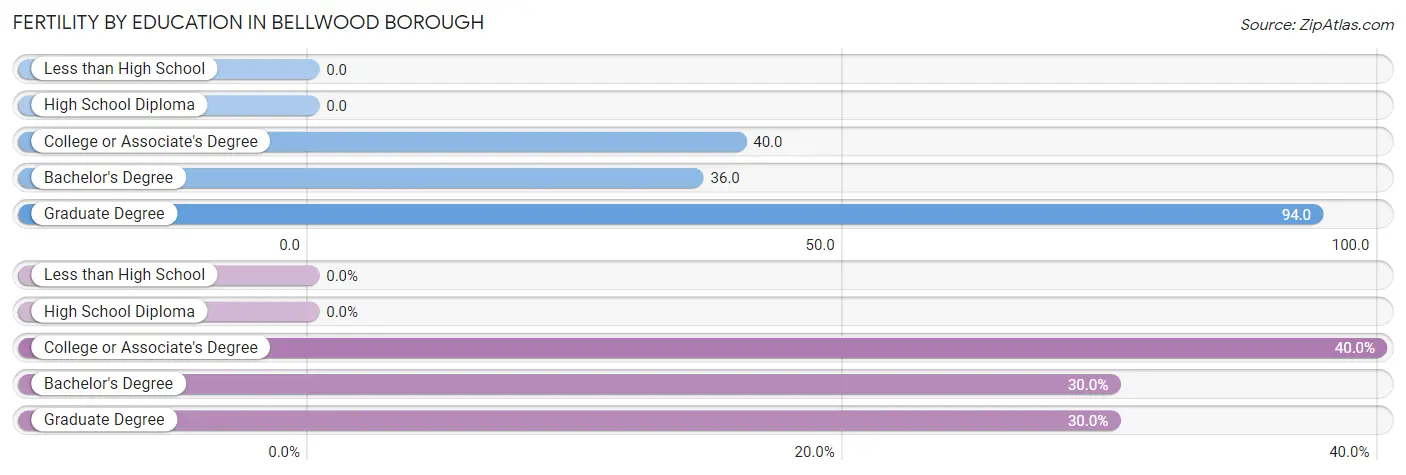
| Educational Attainment | Women with Births | Births / 1,000 Women |
| Less than High School | 0 (0.0%) | 0.0 |
| High School Diploma | 0 (0.0%) | 0.0 |
| College or Associate's Degree | 4 (40.0%) | 40.0 |
| Bachelor's Degree | 3 (30.0%) | 36.0 |
| Graduate Degree | 3 (30.0%) | 94.0 |
| Total | 10 (100.0%) | 22.0 |
Fertility by Education by Marriage Status in Bellwood borough
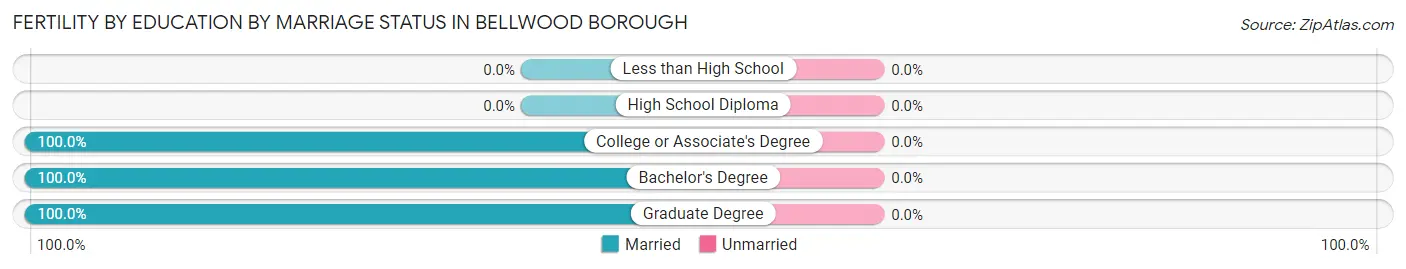
| Educational Attainment | Married | Unmarried |
| Less than High School | 0 (0.0%) | 0 (0.0%) |
| High School Diploma | 0 (0.0%) | 0 (0.0%) |
| College or Associate's Degree | 4 (100.0%) | 0 (0.0%) |
| Bachelor's Degree | 3 (100.0%) | 0 (0.0%) |
| Graduate Degree | 3 (100.0%) | 0 (0.0%) |
| Total | 10 (100.0%) | 0 (0.0%) |
Employment Characteristics in Bellwood borough
Employment by Class of Employer in Bellwood borough
Among the 875 employed individuals in Bellwood borough, private company employees (623 | 71.2%), not-for-profit organizations (92 | 10.5%), and state government employees (61 | 7.0%) make up the most common classes of employment.
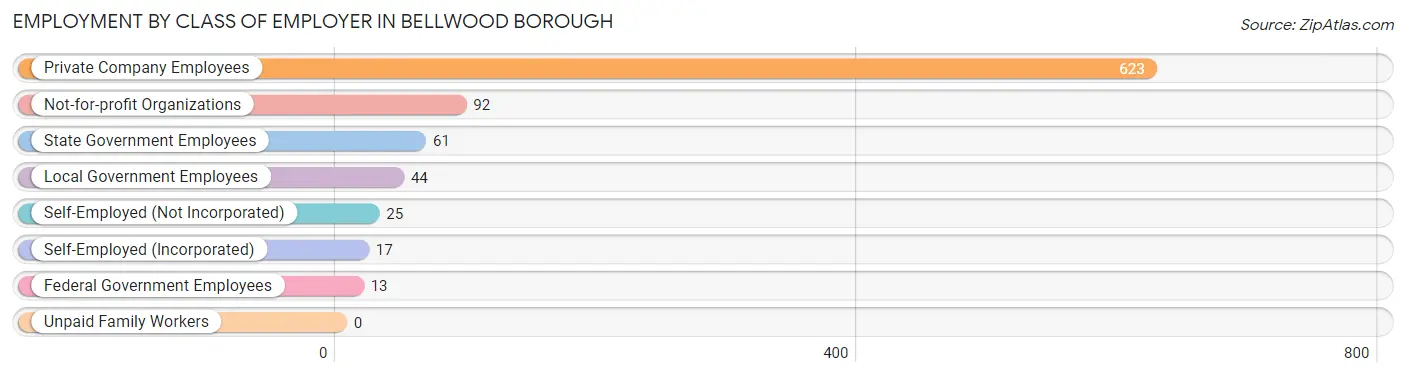
| Employer Class | # Employees | % Employees |
| Private Company Employees | 623 | 71.2% |
| Self-Employed (Incorporated) | 17 | 1.9% |
| Self-Employed (Not Incorporated) | 25 | 2.9% |
| Not-for-profit Organizations | 92 | 10.5% |
| Local Government Employees | 44 | 5.0% |
| State Government Employees | 61 | 7.0% |
| Federal Government Employees | 13 | 1.5% |
| Unpaid Family Workers | 0 | 0.0% |
| Total | 875 | 100.0% |
Employment Status by Age in Bellwood borough
According to the labor force statistics for Bellwood borough, out of the total population over 16 years of age (1,358), 68.0% or 923 individuals are in the labor force, with 4.9% or 45 of them unemployed. The age group with the highest labor force participation rate is 45 to 54 years, with 94.1% or 190 individuals in the labor force. Within the labor force, the 16 to 19 years age range has the highest percentage of unemployed individuals, with 42.4% or 28 of them being unemployed.
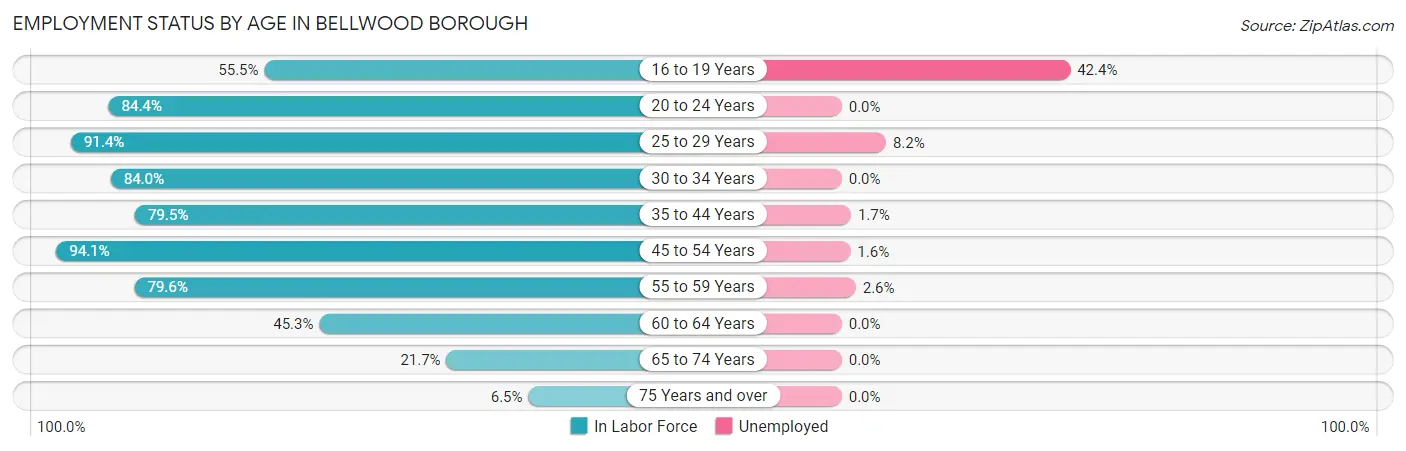
| Age Bracket | In Labor Force | Unemployed |
| 16 to 19 Years | 66 (55.5%) | 28 (42.4%) |
| 20 to 24 Years | 65 (84.4%) | 0 (0.0%) |
| 25 to 29 Years | 85 (91.4%) | 7 (8.2%) |
| 30 to 34 Years | 100 (84.0%) | 0 (0.0%) |
| 35 to 44 Years | 233 (79.5%) | 4 (1.7%) |
| 45 to 54 Years | 190 (94.1%) | 3 (1.6%) |
| 55 to 59 Years | 117 (79.6%) | 3 (2.6%) |
| 60 to 64 Years | 29 (45.3%) | 0 (0.0%) |
| 65 to 74 Years | 33 (21.7%) | 0 (0.0%) |
| 75 Years and over | 6 (6.5%) | 0 (0.0%) |
| Total | 923 (68.0%) | 45 (4.9%) |
Employment Status by Educational Attainment in Bellwood borough
According to labor force statistics for Bellwood borough, 82.1% of individuals (754) out of the total population between 25 and 64 years of age (918) are in the labor force, with 2.3% or 17 of them being unemployed. The group with the highest labor force participation rate are those with the educational attainment of college / associate degree, with 90.0% or 198 individuals in the labor force. Within the labor force, individuals with bachelor's degree or higher education have the highest percentage of unemployment, with 4.5% or 10 of them being unemployed.
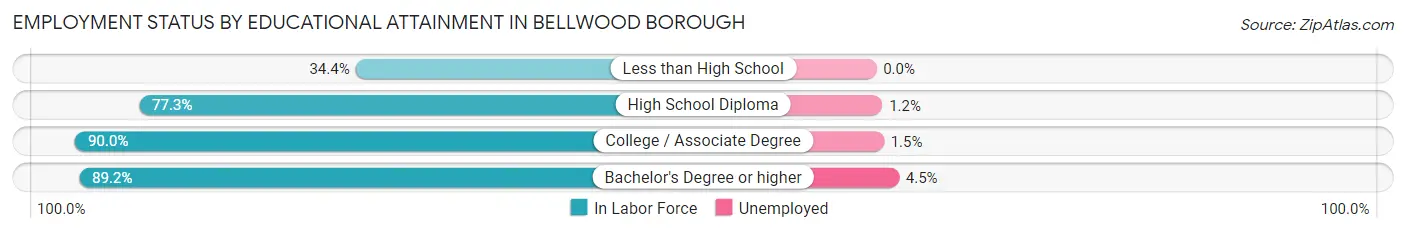
| Educational Attainment | In Labor Force | Unemployed |
| Less than High School | 11 (34.4%) | 0 (0.0%) |
| High School Diploma | 321 (77.3%) | 5 (1.2%) |
| College / Associate Degree | 198 (90.0%) | 3 (1.5%) |
| Bachelor's Degree or higher | 224 (89.2%) | 11 (4.5%) |
| Total | 754 (82.1%) | 21 (2.3%) |
Employment Occupations by Sex in Bellwood borough
Management, Business, Science and Arts Occupations
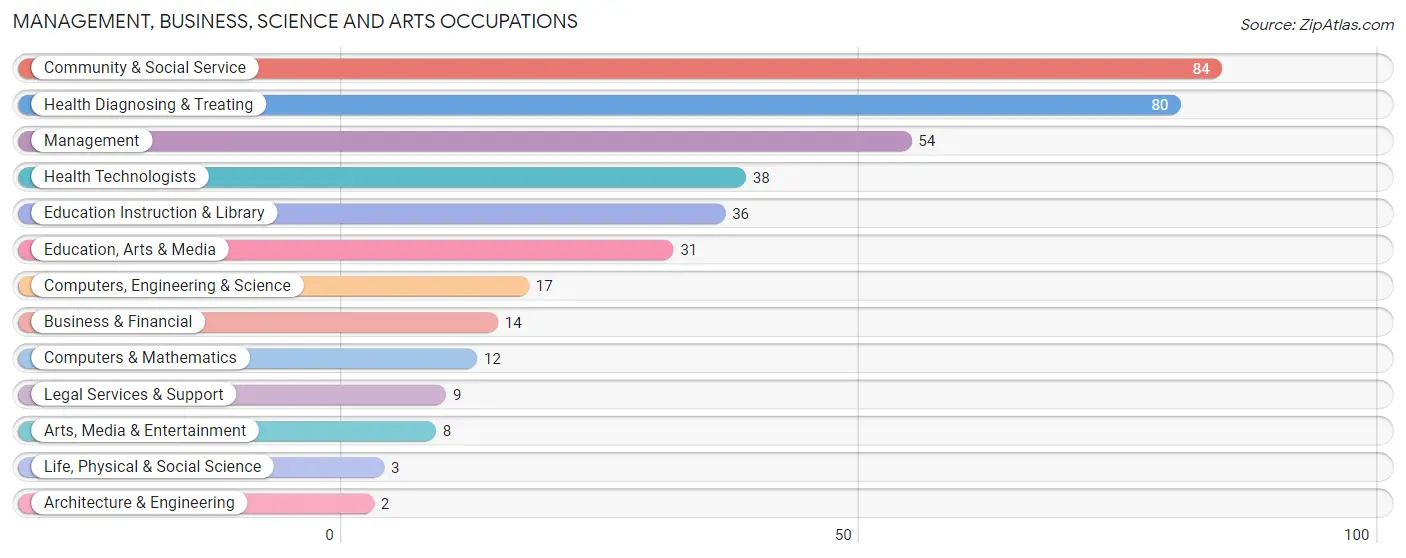
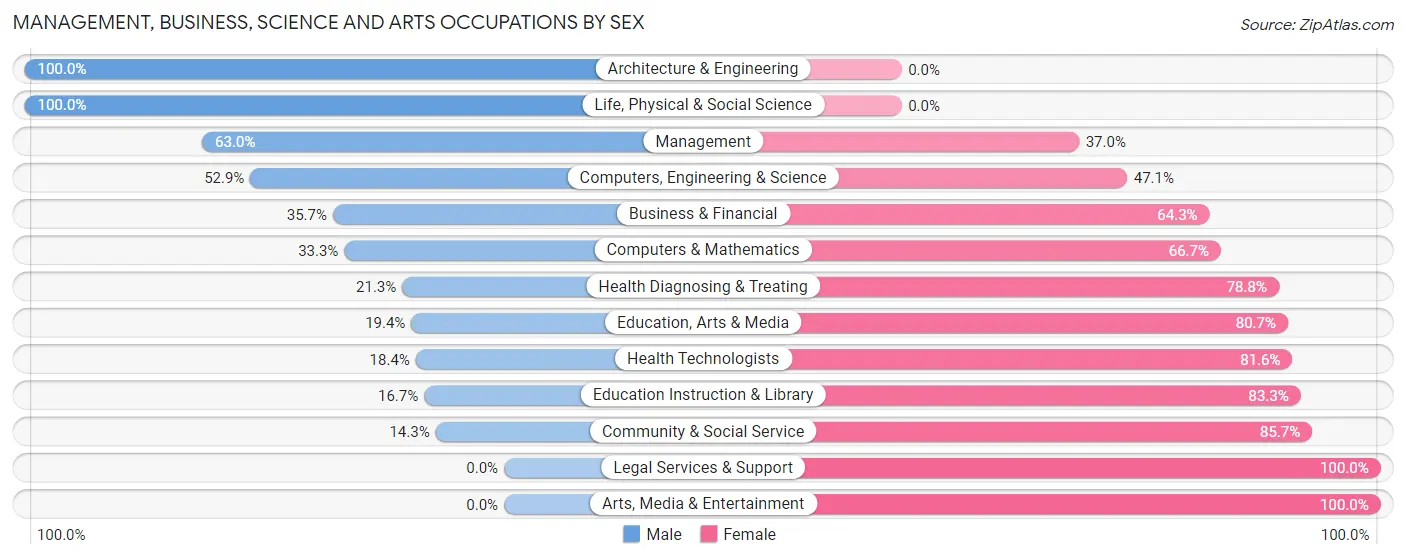
The most common Management, Business, Science and Arts occupations in Bellwood borough are Community & Social Service (84 | 9.6%), Health Diagnosing & Treating (80 | 9.1%), Management (54 | 6.1%), Health Technologists (38 | 4.3%), and Education Instruction & Library (36 | 4.1%).
Management, Business, Science and Arts Occupations by Sex
Within the Management, Business, Science and Arts occupations in Bellwood borough, the most male-oriented occupations are Architecture & Engineering (100.0%), Life, Physical & Social Science (100.0%), and Management (63.0%), while the most female-oriented occupations are Legal Services & Support (100.0%), Arts, Media & Entertainment (100.0%), and Community & Social Service (85.7%).
| Occupation | Male | Female |
| Management | 34 (63.0%) | 20 (37.0%) |
| Business & Financial | 5 (35.7%) | 9 (64.3%) |
| Computers, Engineering & Science | 9 (52.9%) | 8 (47.1%) |
| Computers & Mathematics | 4 (33.3%) | 8 (66.7%) |
| Architecture & Engineering | 2 (100.0%) | 0 (0.0%) |
| Life, Physical & Social Science | 3 (100.0%) | 0 (0.0%) |
| Community & Social Service | 12 (14.3%) | 72 (85.7%) |
| Education, Arts & Media | 6 (19.4%) | 25 (80.6%) |
| Legal Services & Support | 0 (0.0%) | 9 (100.0%) |
| Education Instruction & Library | 6 (16.7%) | 30 (83.3%) |
| Arts, Media & Entertainment | 0 (0.0%) | 8 (100.0%) |
| Health Diagnosing & Treating | 17 (21.2%) | 63 (78.7%) |
| Health Technologists | 7 (18.4%) | 31 (81.6%) |
| Total (Category) | 77 (30.9%) | 172 (69.1%) |
| Total (Overall) | 446 (50.7%) | 433 (49.3%) |
Services Occupations
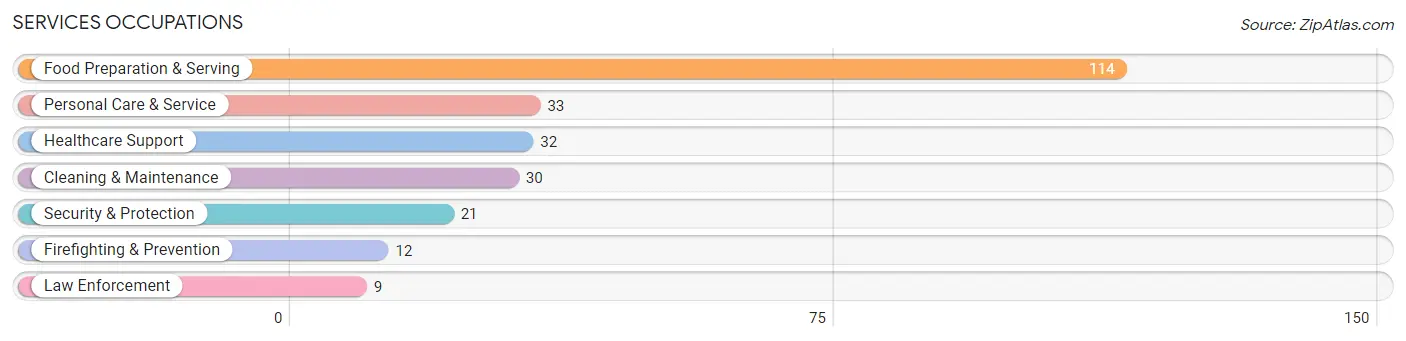
The most common Services occupations in Bellwood borough are Food Preparation & Serving (114 | 13.0%), Personal Care & Service (33 | 3.7%), Healthcare Support (32 | 3.6%), Cleaning & Maintenance (30 | 3.4%), and Security & Protection (21 | 2.4%).
Services Occupations by Sex
Within the Services occupations in Bellwood borough, the most male-oriented occupations are Security & Protection (100.0%), Firefighting & Prevention (100.0%), and Law Enforcement (100.0%), while the most female-oriented occupations are Personal Care & Service (100.0%), Healthcare Support (90.6%), and Food Preparation & Serving (49.1%).
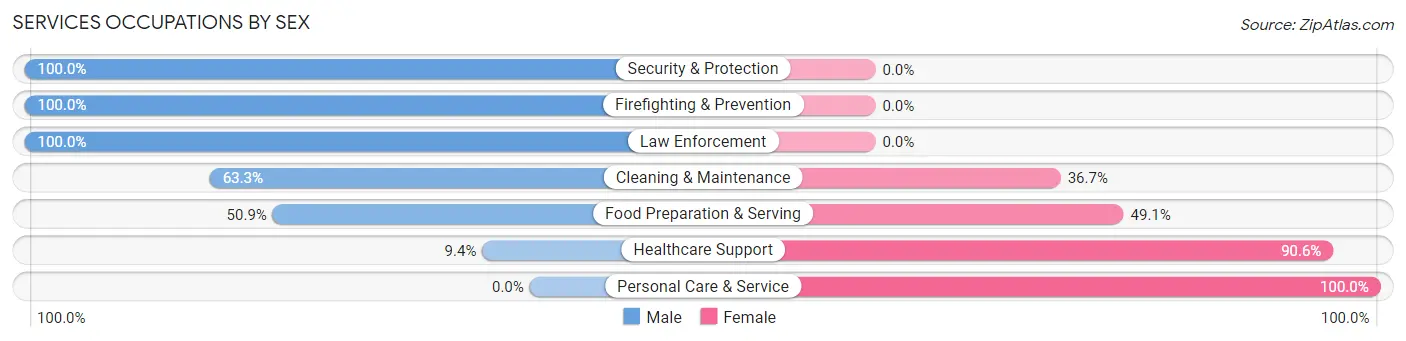
| Occupation | Male | Female |
| Healthcare Support | 3 (9.4%) | 29 (90.6%) |
| Security & Protection | 21 (100.0%) | 0 (0.0%) |
| Firefighting & Prevention | 12 (100.0%) | 0 (0.0%) |
| Law Enforcement | 9 (100.0%) | 0 (0.0%) |
| Food Preparation & Serving | 58 (50.9%) | 56 (49.1%) |
| Cleaning & Maintenance | 19 (63.3%) | 11 (36.7%) |
| Personal Care & Service | 0 (0.0%) | 33 (100.0%) |
| Total (Category) | 101 (43.9%) | 129 (56.1%) |
| Total (Overall) | 446 (50.7%) | 433 (49.3%) |
Sales and Office Occupations
The most common Sales and Office occupations in Bellwood borough are Sales & Related (92 | 10.5%), and Office & Administration (59 | 6.7%).
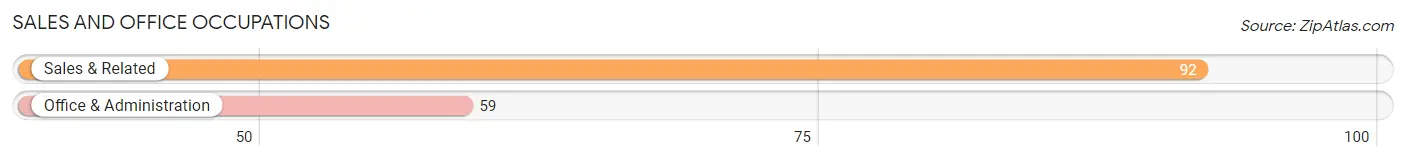
Sales and Office Occupations by Sex
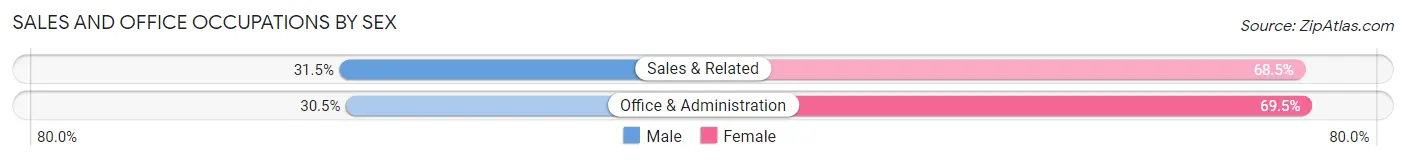
| Occupation | Male | Female |
| Sales & Related | 29 (31.5%) | 63 (68.5%) |
| Office & Administration | 18 (30.5%) | 41 (69.5%) |
| Total (Category) | 47 (31.1%) | 104 (68.9%) |
| Total (Overall) | 446 (50.7%) | 433 (49.3%) |
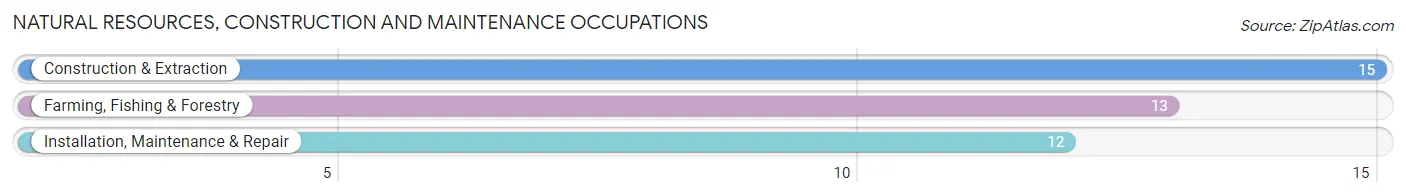
Natural Resources, Construction and Maintenance Occupations
The most common Natural Resources, Construction and Maintenance occupations in Bellwood borough are Construction & Extraction (15 | 1.7%), Farming, Fishing & Forestry (13 | 1.5%), and Installation, Maintenance & Repair (12 | 1.4%).
Natural Resources, Construction and Maintenance Occupations by Sex
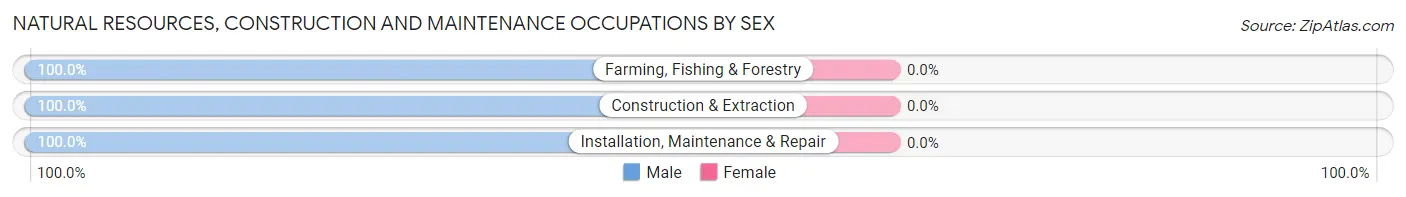
| Occupation | Male | Female |
| Farming, Fishing & Forestry | 13 (100.0%) | 0 (0.0%) |
| Construction & Extraction | 15 (100.0%) | 0 (0.0%) |
| Installation, Maintenance & Repair | 12 (100.0%) | 0 (0.0%) |
| Total (Category) | 40 (100.0%) | 0 (0.0%) |
| Total (Overall) | 446 (50.7%) | 433 (49.3%) |
Production, Transportation and Moving Occupations
The most common Production, Transportation and Moving occupations in Bellwood borough are Transportation (83 | 9.4%), Production (72 | 8.2%), and Material Moving (54 | 6.1%).
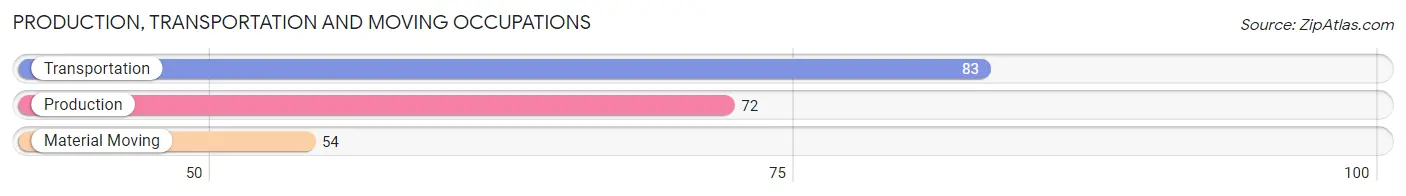
Production, Transportation and Moving Occupations by Sex
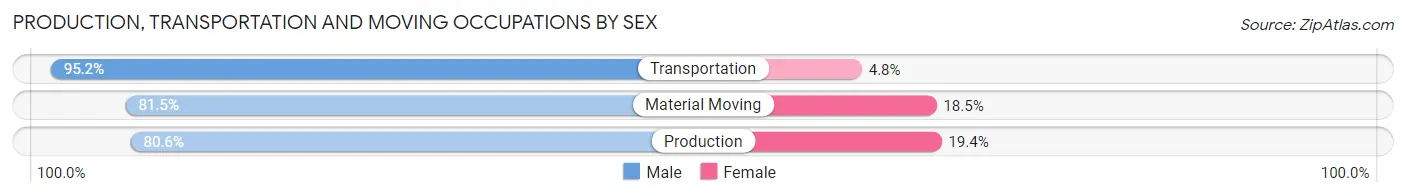
| Occupation | Male | Female |
| Production | 58 (80.6%) | 14 (19.4%) |
| Transportation | 79 (95.2%) | 4 (4.8%) |
| Material Moving | 44 (81.5%) | 10 (18.5%) |
| Total (Category) | 181 (86.6%) | 28 (13.4%) |
| Total (Overall) | 446 (50.7%) | 433 (49.3%) |
Employment Industries by Sex in Bellwood borough
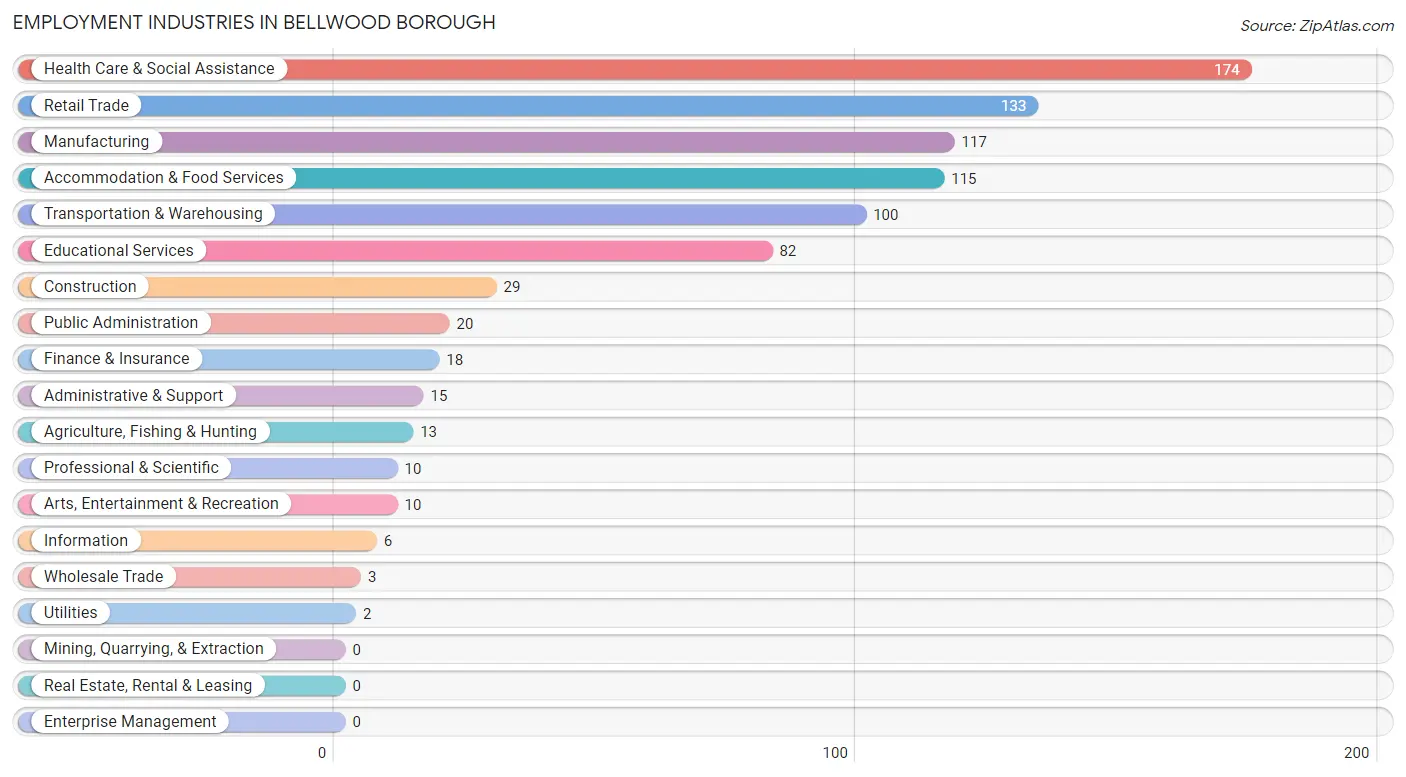
Employment Industries in Bellwood borough
The major employment industries in Bellwood borough include Health Care & Social Assistance (174 | 19.8%), Retail Trade (133 | 15.1%), Manufacturing (117 | 13.3%), Accommodation & Food Services (115 | 13.1%), and Transportation & Warehousing (100 | 11.4%).
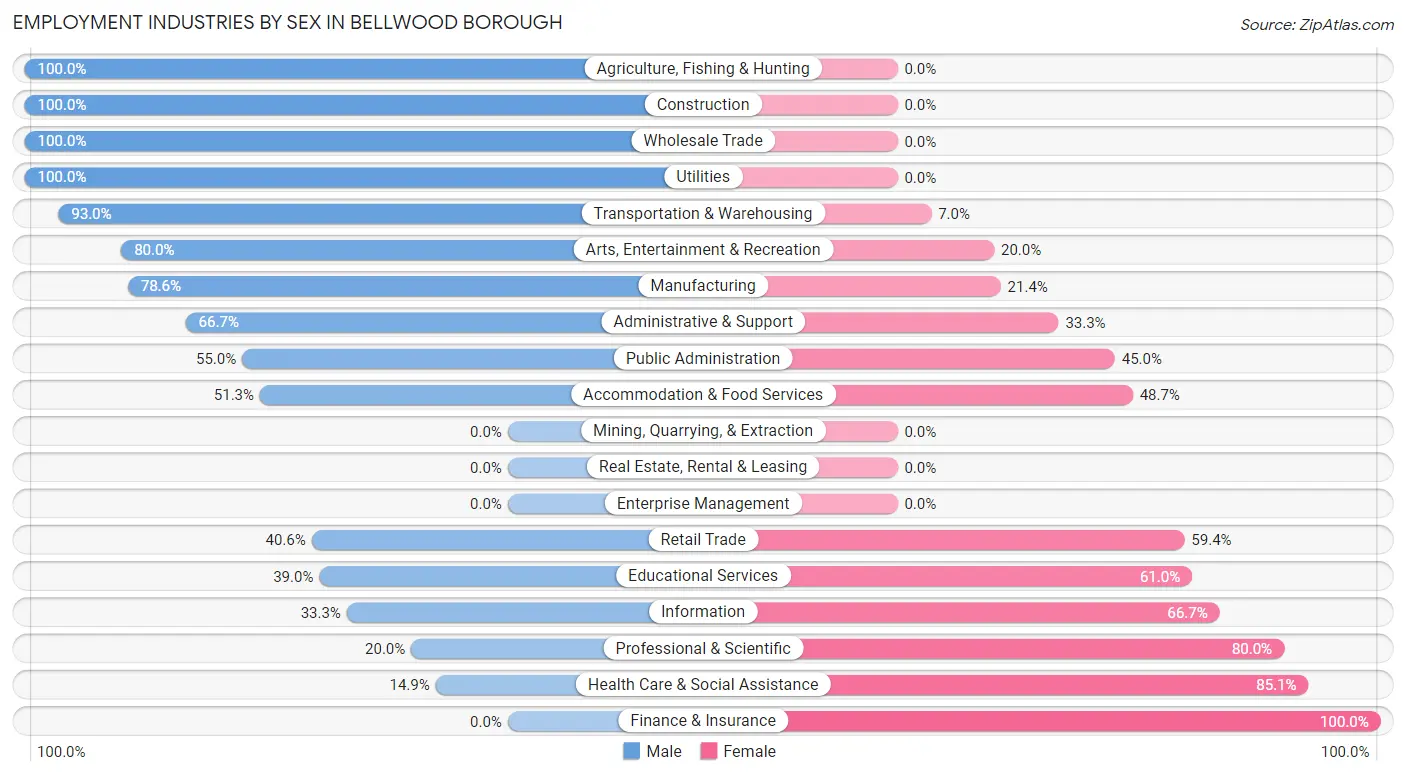
Employment Industries by Sex in Bellwood borough
The Bellwood borough industries that see more men than women are Agriculture, Fishing & Hunting (100.0%), Construction (100.0%), and Wholesale Trade (100.0%), whereas the industries that tend to have a higher number of women are Finance & Insurance (100.0%), Health Care & Social Assistance (85.1%), and Professional & Scientific (80.0%).
| Industry | Male | Female |
| Agriculture, Fishing & Hunting | 13 (100.0%) | 0 (0.0%) |
| Mining, Quarrying, & Extraction | 0 (0.0%) | 0 (0.0%) |
| Construction | 29 (100.0%) | 0 (0.0%) |
| Manufacturing | 92 (78.6%) | 25 (21.4%) |
| Wholesale Trade | 3 (100.0%) | 0 (0.0%) |
| Retail Trade | 54 (40.6%) | 79 (59.4%) |
| Transportation & Warehousing | 93 (93.0%) | 7 (7.0%) |
| Utilities | 2 (100.0%) | 0 (0.0%) |
| Information | 2 (33.3%) | 4 (66.7%) |
| Finance & Insurance | 0 (0.0%) | 18 (100.0%) |
| Real Estate, Rental & Leasing | 0 (0.0%) | 0 (0.0%) |
| Professional & Scientific | 2 (20.0%) | 8 (80.0%) |
| Enterprise Management | 0 (0.0%) | 0 (0.0%) |
| Administrative & Support | 10 (66.7%) | 5 (33.3%) |
| Educational Services | 32 (39.0%) | 50 (61.0%) |
| Health Care & Social Assistance | 26 (14.9%) | 148 (85.1%) |
| Arts, Entertainment & Recreation | 8 (80.0%) | 2 (20.0%) |
| Accommodation & Food Services | 59 (51.3%) | 56 (48.7%) |
| Public Administration | 11 (55.0%) | 9 (45.0%) |
| Total | 446 (50.7%) | 433 (49.3%) |
Education in Bellwood borough
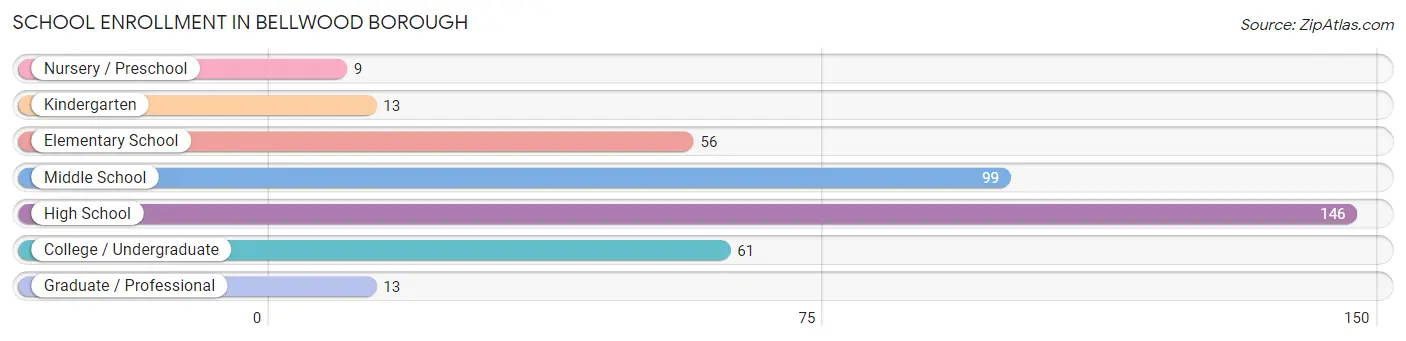
School Enrollment in Bellwood borough
The most common levels of schooling among the 397 students in Bellwood borough are high school (146 | 36.8%), middle school (99 | 24.9%), and college / undergraduate (61 | 15.4%).
| School Level | # Students | % Students |
| Nursery / Preschool | 9 | 2.3% |
| Kindergarten | 13 | 3.3% |
| Elementary School | 56 | 14.1% |
| Middle School | 99 | 24.9% |
| High School | 146 | 36.8% |
| College / Undergraduate | 61 | 15.4% |
| Graduate / Professional | 13 | 3.3% |
| Total | 397 | 100.0% |
School Enrollment by Age by Funding Source in Bellwood borough
Out of a total of 397 students who are enrolled in schools in Bellwood borough, 20 (5.0%) attend a private institution, while the remaining 377 (95.0%) are enrolled in public schools. The age group of 18 to 19 year olds has the highest likelihood of being enrolled in private schools, with 7 (16.7% in the age bracket) enrolled. Conversely, the age group of 3 to 4 year olds has the lowest likelihood of being enrolled in a private school, with 7 (100.0% in the age bracket) attending a public institution.
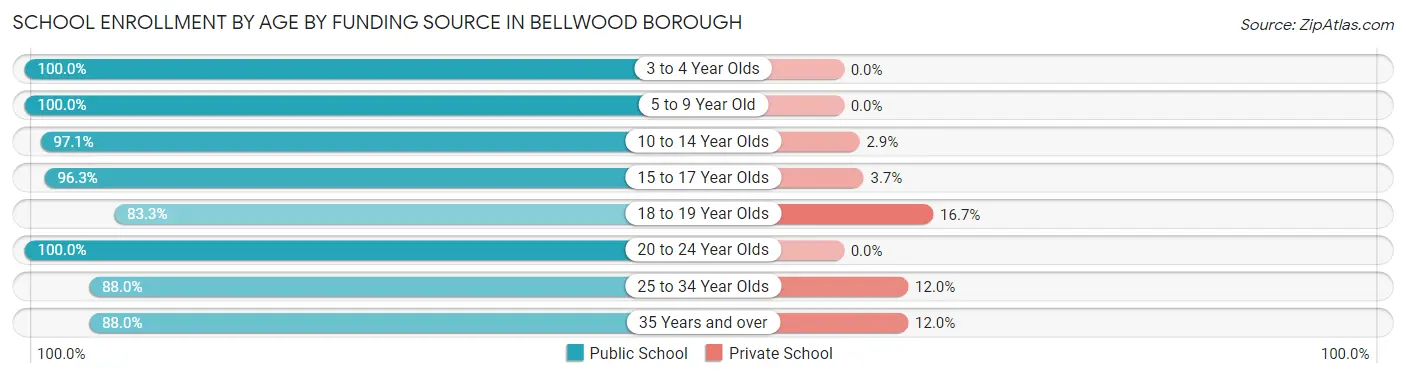
| Age Bracket | Public School | Private School |
| 3 to 4 Year Olds | 7 (100.0%) | 0 (0.0%) |
| 5 to 9 Year Old | 63 (100.0%) | 0 (0.0%) |
| 10 to 14 Year Olds | 132 (97.1%) | 4 (2.9%) |
| 15 to 17 Year Olds | 78 (96.3%) | 3 (3.7%) |
| 18 to 19 Year Olds | 35 (83.3%) | 7 (16.7%) |
| 20 to 24 Year Olds | 18 (100.0%) | 0 (0.0%) |
| 25 to 34 Year Olds | 22 (88.0%) | 3 (12.0%) |
| 35 Years and over | 22 (88.0%) | 3 (12.0%) |
| Total | 377 (95.0%) | 20 (5.0%) |
Educational Attainment by Field of Study in Bellwood borough
Social sciences (59 | 20.6%), education (41 | 14.3%), arts & humanities (38 | 13.3%), science & technology (29 | 10.1%), and computers & mathematics (20 | 7.0%) are the most common fields of study among 286 individuals in Bellwood borough who have obtained a bachelor's degree or higher.
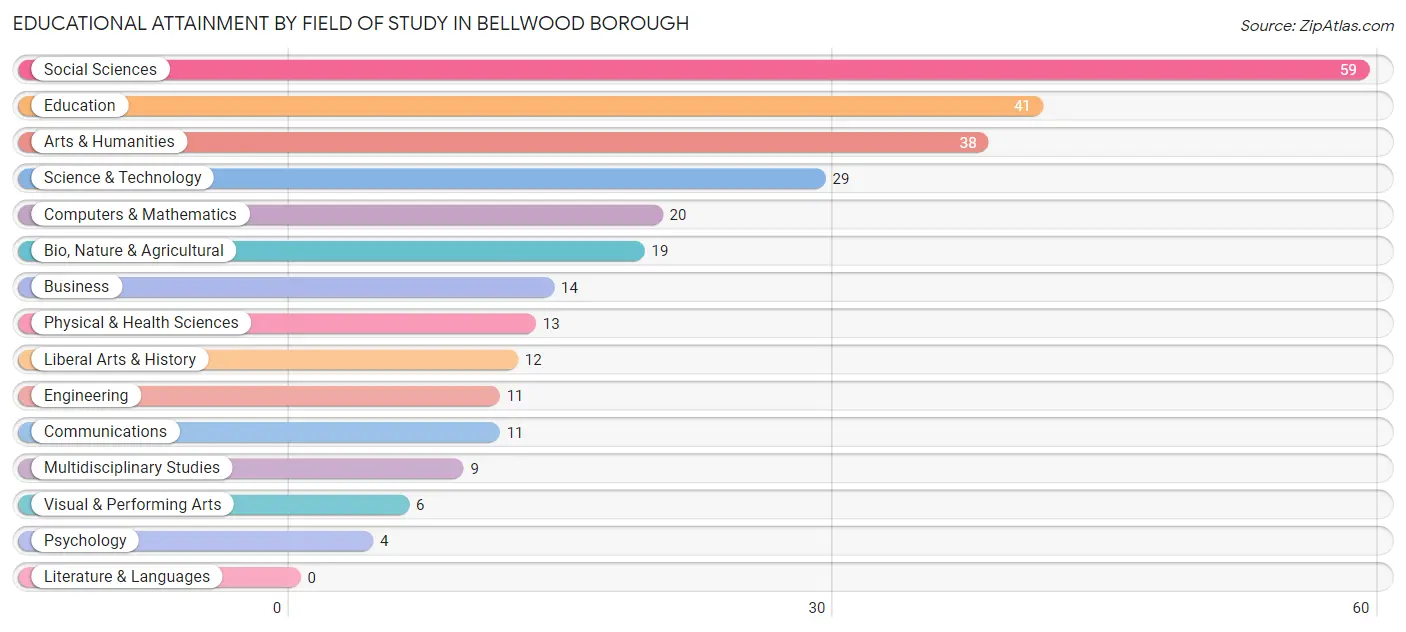
| Field of Study | # Graduates | % Graduates |
| Computers & Mathematics | 20 | 7.0% |
| Bio, Nature & Agricultural | 19 | 6.6% |
| Physical & Health Sciences | 13 | 4.5% |
| Psychology | 4 | 1.4% |
| Social Sciences | 59 | 20.6% |
| Engineering | 11 | 3.8% |
| Multidisciplinary Studies | 9 | 3.2% |
| Science & Technology | 29 | 10.1% |
| Business | 14 | 4.9% |
| Education | 41 | 14.3% |
| Literature & Languages | 0 | 0.0% |
| Liberal Arts & History | 12 | 4.2% |
| Visual & Performing Arts | 6 | 2.1% |
| Communications | 11 | 3.8% |
| Arts & Humanities | 38 | 13.3% |
| Total | 286 | 100.0% |
Transportation & Commute in Bellwood borough
Vehicle Availability by Sex in Bellwood borough
The most prevalent vehicle ownership categories in Bellwood borough are males with 2 vehicles (283, accounting for 64.0%) and females with 2 vehicles (215, making up 65.4%).
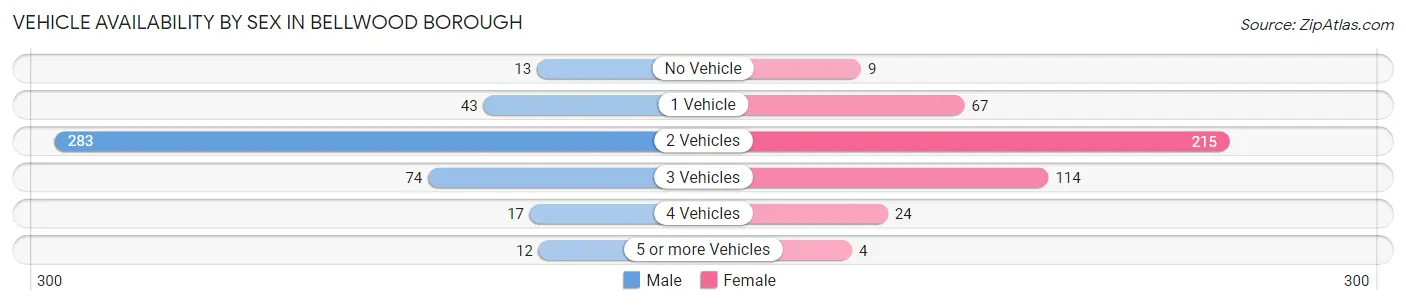
| Vehicles Available | Male | Female |
| No Vehicle | 13 (2.9%) | 9 (2.1%) |
| 1 Vehicle | 43 (9.7%) | 67 (15.5%) |
| 2 Vehicles | 283 (64.0%) | 215 (49.6%) |
| 3 Vehicles | 74 (16.7%) | 114 (26.3%) |
| 4 Vehicles | 17 (3.8%) | 24 (5.5%) |
| 5 or more Vehicles | 12 (2.7%) | 4 (0.9%) |
| Total | 442 (100.0%) | 433 (100.0%) |
Commute Time in Bellwood borough
The most frequently occuring commute durations in Bellwood borough are 15 to 19 minutes (216 commuters, 26.0%), 5 to 9 minutes (174 commuters, 20.9%), and 20 to 24 minutes (118 commuters, 14.2%).
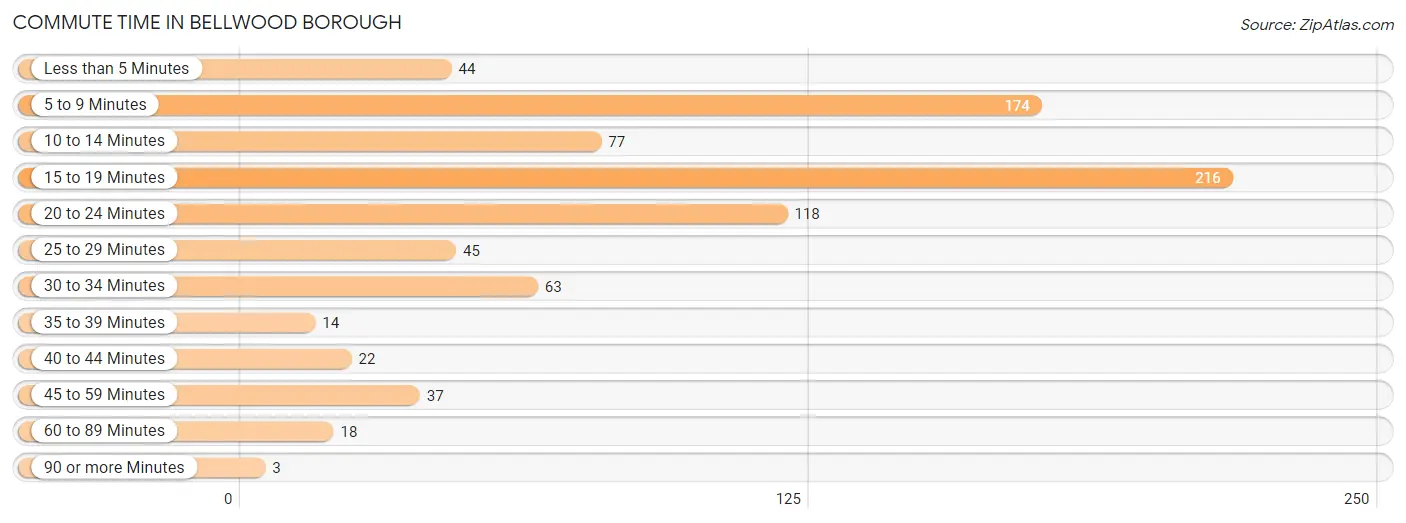
| Commute Time | # Commuters | % Commuters |
| Less than 5 Minutes | 44 | 5.3% |
| 5 to 9 Minutes | 174 | 20.9% |
| 10 to 14 Minutes | 77 | 9.3% |
| 15 to 19 Minutes | 216 | 26.0% |
| 20 to 24 Minutes | 118 | 14.2% |
| 25 to 29 Minutes | 45 | 5.4% |
| 30 to 34 Minutes | 63 | 7.6% |
| 35 to 39 Minutes | 14 | 1.7% |
| 40 to 44 Minutes | 22 | 2.6% |
| 45 to 59 Minutes | 37 | 4.4% |
| 60 to 89 Minutes | 18 | 2.2% |
| 90 or more Minutes | 3 | 0.4% |
Commute Time by Sex in Bellwood borough
The most common commute times in Bellwood borough are 5 to 9 minutes (146 commuters, 34.0%) for males and 15 to 19 minutes (122 commuters, 30.4%) for females.
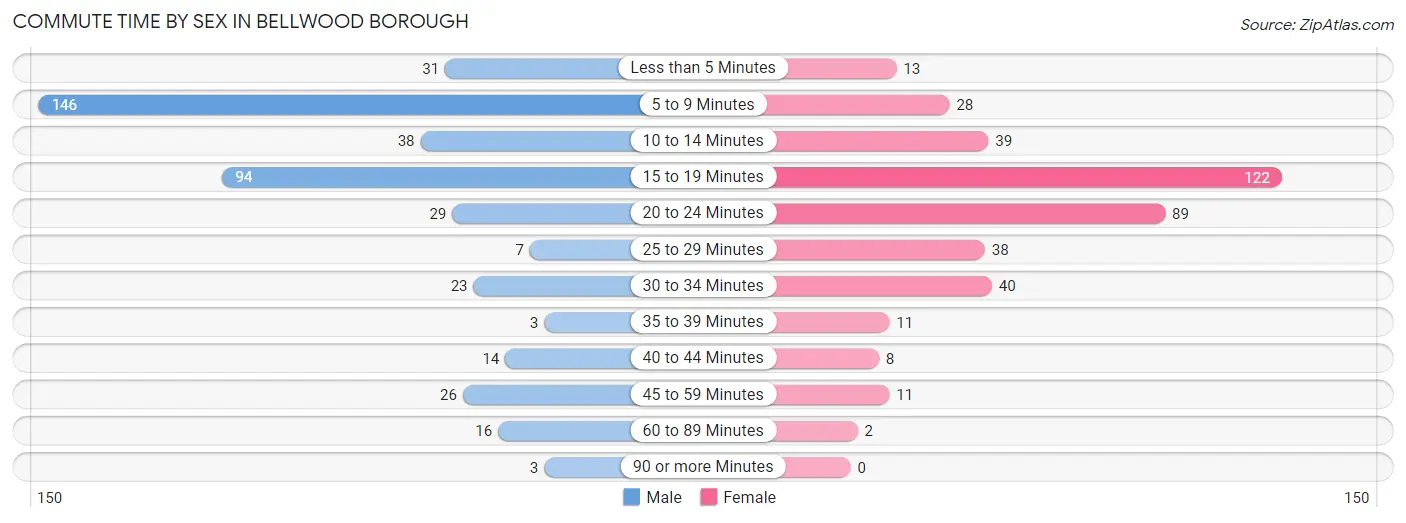
| Commute Time | Male | Female |
| Less than 5 Minutes | 31 (7.2%) | 13 (3.2%) |
| 5 to 9 Minutes | 146 (34.0%) | 28 (7.0%) |
| 10 to 14 Minutes | 38 (8.8%) | 39 (9.7%) |
| 15 to 19 Minutes | 94 (21.9%) | 122 (30.4%) |
| 20 to 24 Minutes | 29 (6.7%) | 89 (22.2%) |
| 25 to 29 Minutes | 7 (1.6%) | 38 (9.5%) |
| 30 to 34 Minutes | 23 (5.3%) | 40 (10.0%) |
| 35 to 39 Minutes | 3 (0.7%) | 11 (2.7%) |
| 40 to 44 Minutes | 14 (3.3%) | 8 (2.0%) |
| 45 to 59 Minutes | 26 (6.0%) | 11 (2.7%) |
| 60 to 89 Minutes | 16 (3.7%) | 2 (0.5%) |
| 90 or more Minutes | 3 (0.7%) | 0 (0.0%) |
Time of Departure to Work by Sex in Bellwood borough
The most frequent times of departure to work in Bellwood borough are 6:00 AM to 6:29 AM (91, 21.2%) for males and 7:00 AM to 7:29 AM (65, 16.2%) for females.
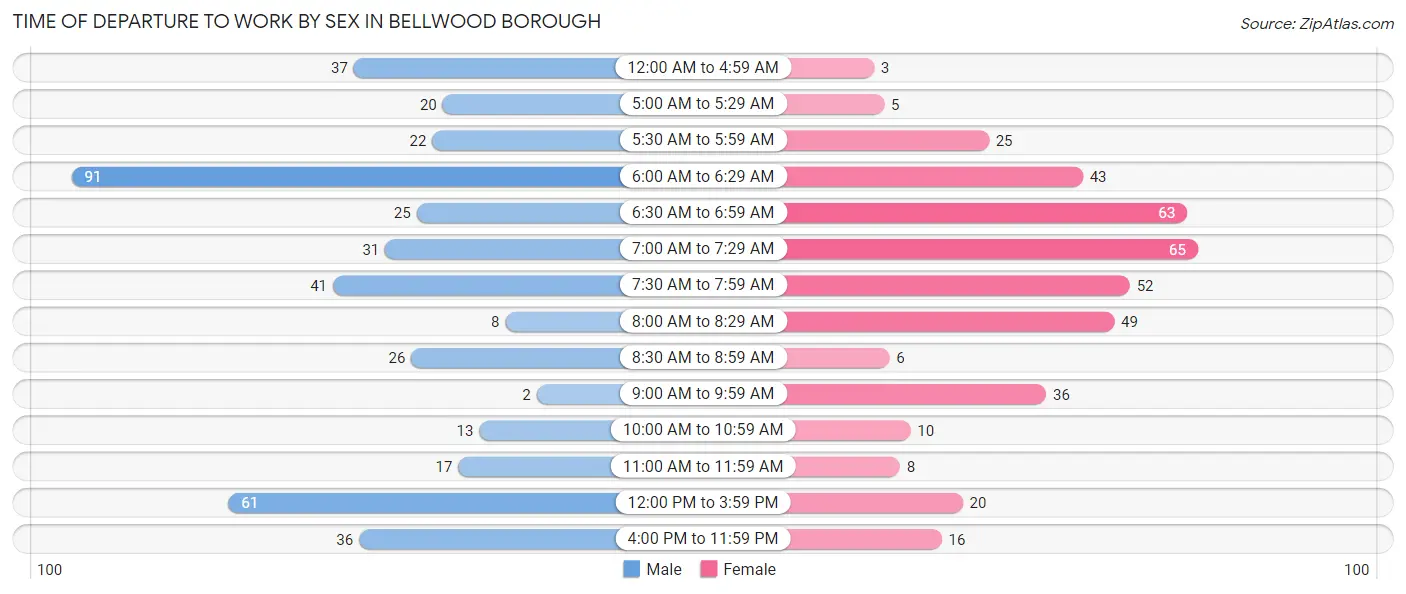
| Time of Departure | Male | Female |
| 12:00 AM to 4:59 AM | 37 (8.6%) | 3 (0.7%) |
| 5:00 AM to 5:29 AM | 20 (4.6%) | 5 (1.3%) |
| 5:30 AM to 5:59 AM | 22 (5.1%) | 25 (6.2%) |
| 6:00 AM to 6:29 AM | 91 (21.2%) | 43 (10.7%) |
| 6:30 AM to 6:59 AM | 25 (5.8%) | 63 (15.7%) |
| 7:00 AM to 7:29 AM | 31 (7.2%) | 65 (16.2%) |
| 7:30 AM to 7:59 AM | 41 (9.5%) | 52 (13.0%) |
| 8:00 AM to 8:29 AM | 8 (1.9%) | 49 (12.2%) |
| 8:30 AM to 8:59 AM | 26 (6.0%) | 6 (1.5%) |
| 9:00 AM to 9:59 AM | 2 (0.5%) | 36 (9.0%) |
| 10:00 AM to 10:59 AM | 13 (3.0%) | 10 (2.5%) |
| 11:00 AM to 11:59 AM | 17 (4.0%) | 8 (2.0%) |
| 12:00 PM to 3:59 PM | 61 (14.2%) | 20 (5.0%) |
| 4:00 PM to 11:59 PM | 36 (8.4%) | 16 (4.0%) |
| Total | 430 (100.0%) | 401 (100.0%) |
Housing Occupancy in Bellwood borough
Occupancy by Ownership in Bellwood borough
Of the total 684 dwellings in Bellwood borough, owner-occupied units account for 507 (74.1%), while renter-occupied units make up 177 (25.9%).
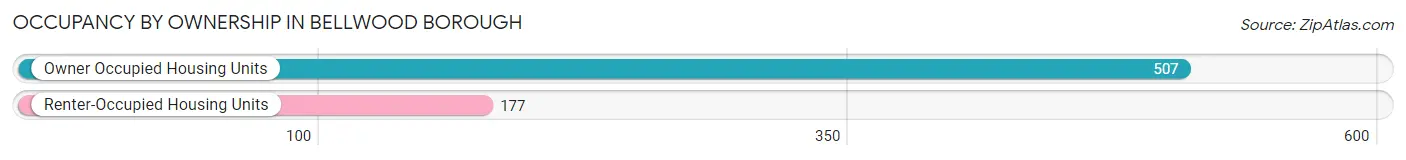
| Occupancy | # Housing Units | % Housing Units |
| Owner Occupied Housing Units | 507 | 74.1% |
| Renter-Occupied Housing Units | 177 | 25.9% |
| Total Occupied Housing Units | 684 | 100.0% |
Occupancy by Household Size in Bellwood borough
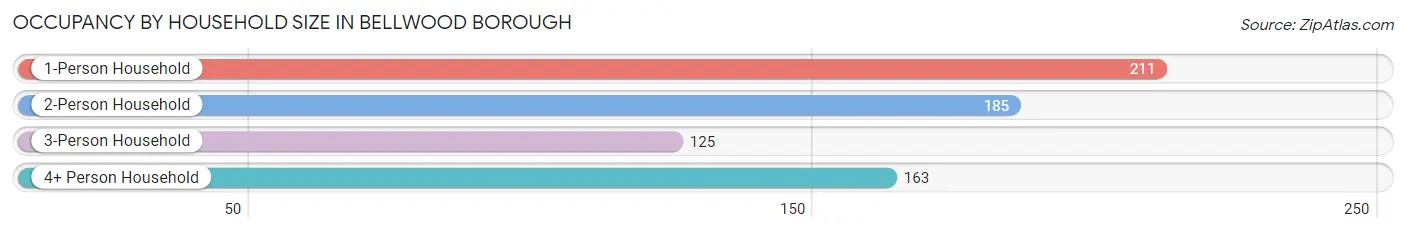
| Household Size | # Housing Units | % Housing Units |
| 1-Person Household | 211 | 30.8% |
| 2-Person Household | 185 | 27.1% |
| 3-Person Household | 125 | 18.3% |
| 4+ Person Household | 163 | 23.8% |
| Total Housing Units | 684 | 100.0% |
Occupancy by Ownership by Household Size in Bellwood borough
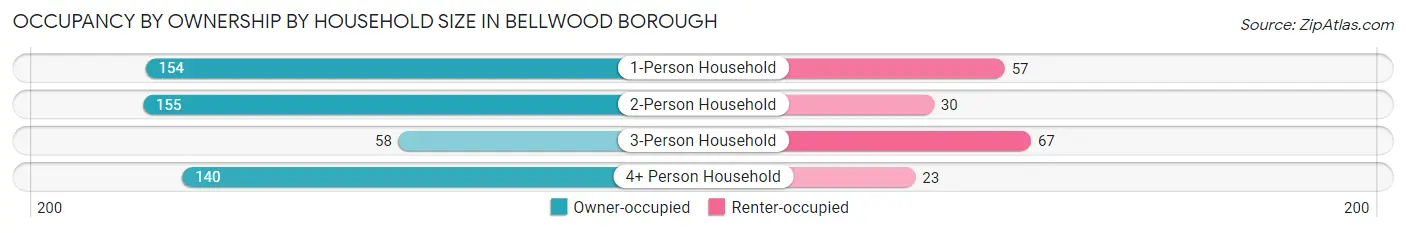
| Household Size | Owner-occupied | Renter-occupied |
| 1-Person Household | 154 (73.0%) | 57 (27.0%) |
| 2-Person Household | 155 (83.8%) | 30 (16.2%) |
| 3-Person Household | 58 (46.4%) | 67 (53.6%) |
| 4+ Person Household | 140 (85.9%) | 23 (14.1%) |
| Total Housing Units | 507 (74.1%) | 177 (25.9%) |
Occupancy by Educational Attainment in Bellwood borough
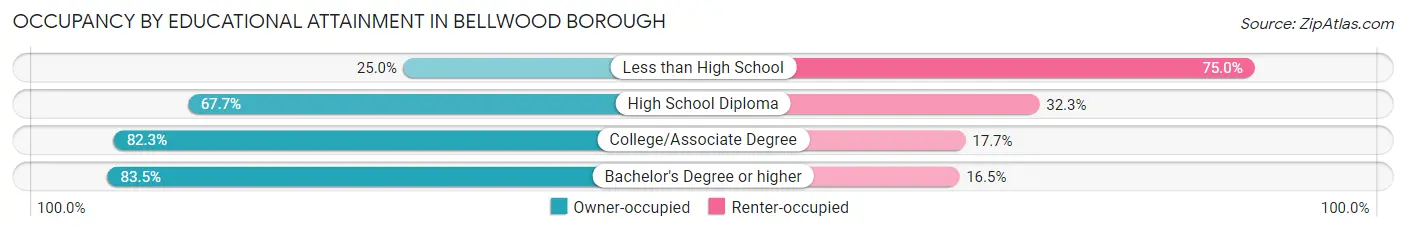
| Household Size | Owner-occupied | Renter-occupied |
| Less than High School | 4 (25.0%) | 12 (75.0%) |
| High School Diploma | 226 (67.7%) | 108 (32.3%) |
| College/Associate Degree | 135 (82.3%) | 29 (17.7%) |
| Bachelor's Degree or higher | 142 (83.5%) | 28 (16.5%) |
Occupancy by Age of Householder in Bellwood borough
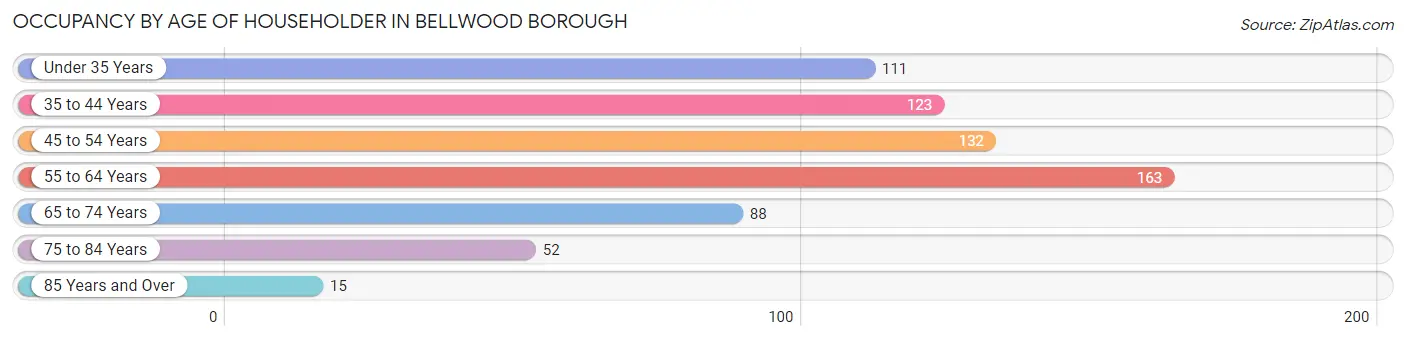
| Age Bracket | # Households | % Households |
| Under 35 Years | 111 | 16.2% |
| 35 to 44 Years | 123 | 18.0% |
| 45 to 54 Years | 132 | 19.3% |
| 55 to 64 Years | 163 | 23.8% |
| 65 to 74 Years | 88 | 12.9% |
| 75 to 84 Years | 52 | 7.6% |
| 85 Years and Over | 15 | 2.2% |
| Total | 684 | 100.0% |
Housing Finances in Bellwood borough
Median Income by Occupancy in Bellwood borough
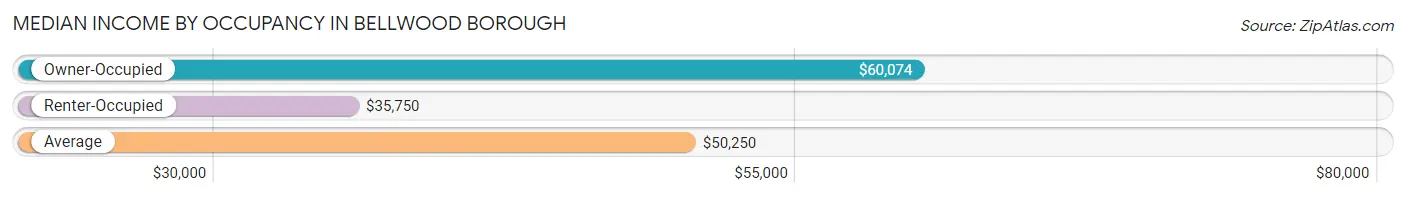
| Occupancy Type | # Households | Median Income |
| Owner-Occupied | 507 (74.1%) | $60,074 |
| Renter-Occupied | 177 (25.9%) | $35,750 |
| Average | 684 (100.0%) | $50,250 |
Occupancy by Householder Income Bracket in Bellwood borough
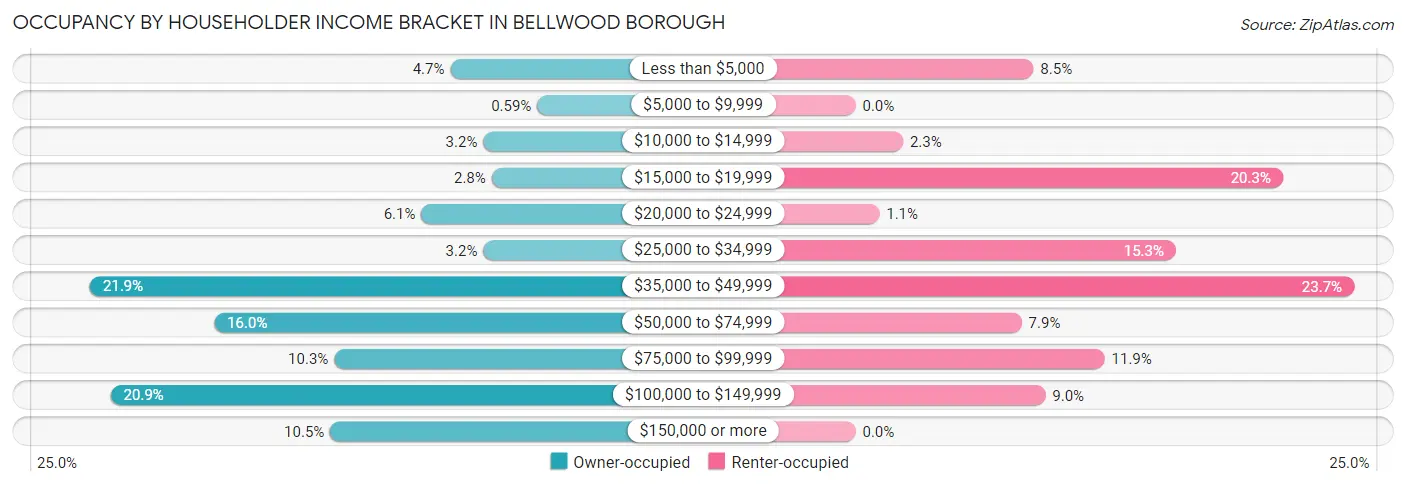
| Income Bracket | Owner-occupied | Renter-occupied |
| Less than $5,000 | 24 (4.7%) | 15 (8.5%) |
| $5,000 to $9,999 | 3 (0.6%) | 0 (0.0%) |
| $10,000 to $14,999 | 16 (3.2%) | 4 (2.3%) |
| $15,000 to $19,999 | 14 (2.8%) | 36 (20.3%) |
| $20,000 to $24,999 | 31 (6.1%) | 2 (1.1%) |
| $25,000 to $34,999 | 16 (3.2%) | 27 (15.2%) |
| $35,000 to $49,999 | 111 (21.9%) | 42 (23.7%) |
| $50,000 to $74,999 | 81 (16.0%) | 14 (7.9%) |
| $75,000 to $99,999 | 52 (10.3%) | 21 (11.9%) |
| $100,000 to $149,999 | 106 (20.9%) | 16 (9.0%) |
| $150,000 or more | 53 (10.4%) | 0 (0.0%) |
| Total | 507 (100.0%) | 177 (100.0%) |
Monthly Housing Cost Tiers in Bellwood borough
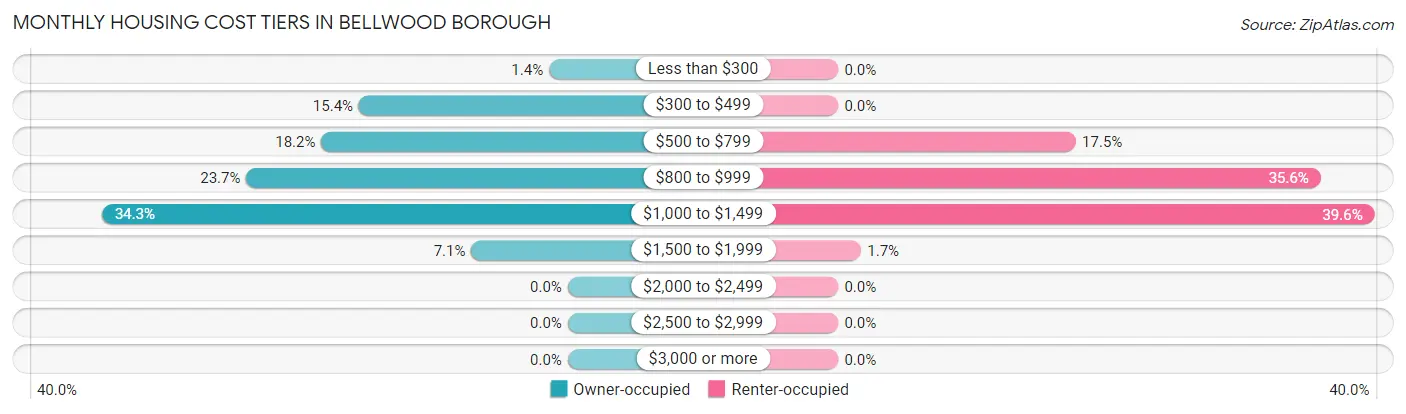
| Monthly Cost | Owner-occupied | Renter-occupied |
| Less than $300 | 7 (1.4%) | 0 (0.0%) |
| $300 to $499 | 78 (15.4%) | 0 (0.0%) |
| $500 to $799 | 92 (18.1%) | 31 (17.5%) |
| $800 to $999 | 120 (23.7%) | 63 (35.6%) |
| $1,000 to $1,499 | 174 (34.3%) | 70 (39.6%) |
| $1,500 to $1,999 | 36 (7.1%) | 3 (1.7%) |
| $2,000 to $2,499 | 0 (0.0%) | 0 (0.0%) |
| $2,500 to $2,999 | 0 (0.0%) | 0 (0.0%) |
| $3,000 or more | 0 (0.0%) | 0 (0.0%) |
| Total | 507 (100.0%) | 177 (100.0%) |
Physical Housing Characteristics in Bellwood borough
Housing Structures in Bellwood borough
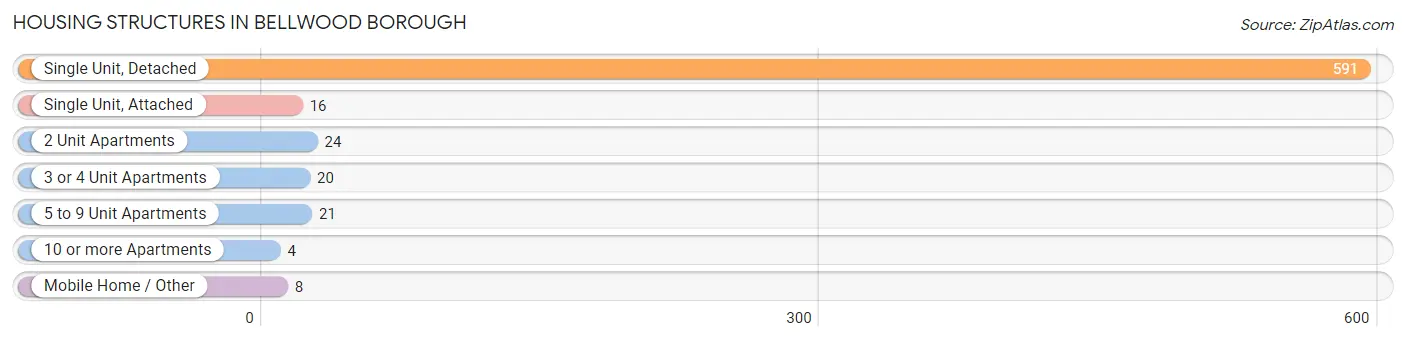
| Structure Type | # Housing Units | % Housing Units |
| Single Unit, Detached | 591 | 86.4% |
| Single Unit, Attached | 16 | 2.3% |
| 2 Unit Apartments | 24 | 3.5% |
| 3 or 4 Unit Apartments | 20 | 2.9% |
| 5 to 9 Unit Apartments | 21 | 3.1% |
| 10 or more Apartments | 4 | 0.6% |
| Mobile Home / Other | 8 | 1.2% |
| Total | 684 | 100.0% |
Housing Structures by Occupancy in Bellwood borough
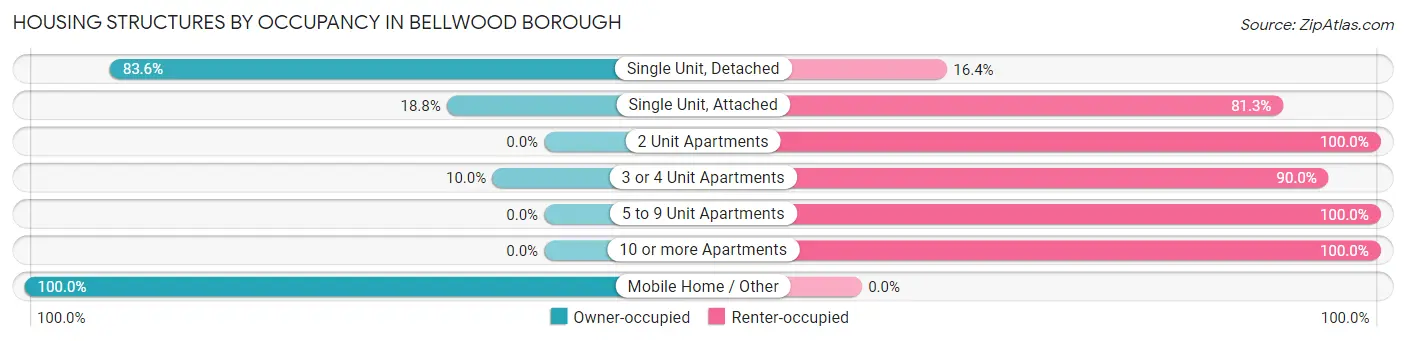
| Structure Type | Owner-occupied | Renter-occupied |
| Single Unit, Detached | 494 (83.6%) | 97 (16.4%) |
| Single Unit, Attached | 3 (18.8%) | 13 (81.2%) |
| 2 Unit Apartments | 0 (0.0%) | 24 (100.0%) |
| 3 or 4 Unit Apartments | 2 (10.0%) | 18 (90.0%) |
| 5 to 9 Unit Apartments | 0 (0.0%) | 21 (100.0%) |
| 10 or more Apartments | 0 (0.0%) | 4 (100.0%) |
| Mobile Home / Other | 8 (100.0%) | 0 (0.0%) |
| Total | 507 (74.1%) | 177 (25.9%) |
Housing Structures by Number of Rooms in Bellwood borough
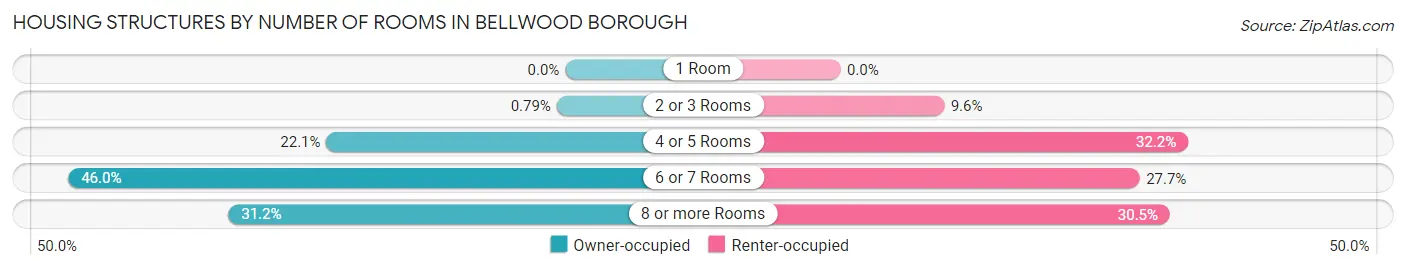
| Number of Rooms | Owner-occupied | Renter-occupied |
| 1 Room | 0 (0.0%) | 0 (0.0%) |
| 2 or 3 Rooms | 4 (0.8%) | 17 (9.6%) |
| 4 or 5 Rooms | 112 (22.1%) | 57 (32.2%) |
| 6 or 7 Rooms | 233 (46.0%) | 49 (27.7%) |
| 8 or more Rooms | 158 (31.2%) | 54 (30.5%) |
| Total | 507 (100.0%) | 177 (100.0%) |
Housing Structure by Heating Type in Bellwood borough
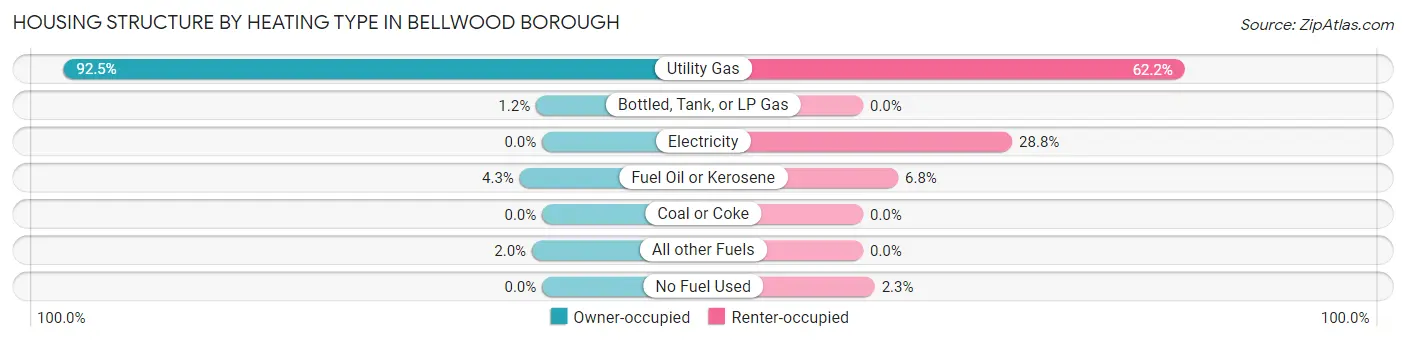
| Heating Type | Owner-occupied | Renter-occupied |
| Utility Gas | 469 (92.5%) | 110 (62.2%) |
| Bottled, Tank, or LP Gas | 6 (1.2%) | 0 (0.0%) |
| Electricity | 0 (0.0%) | 51 (28.8%) |
| Fuel Oil or Kerosene | 22 (4.3%) | 12 (6.8%) |
| Coal or Coke | 0 (0.0%) | 0 (0.0%) |
| All other Fuels | 10 (2.0%) | 0 (0.0%) |
| No Fuel Used | 0 (0.0%) | 4 (2.3%) |
| Total | 507 (100.0%) | 177 (100.0%) |
Household Vehicle Usage in Bellwood borough
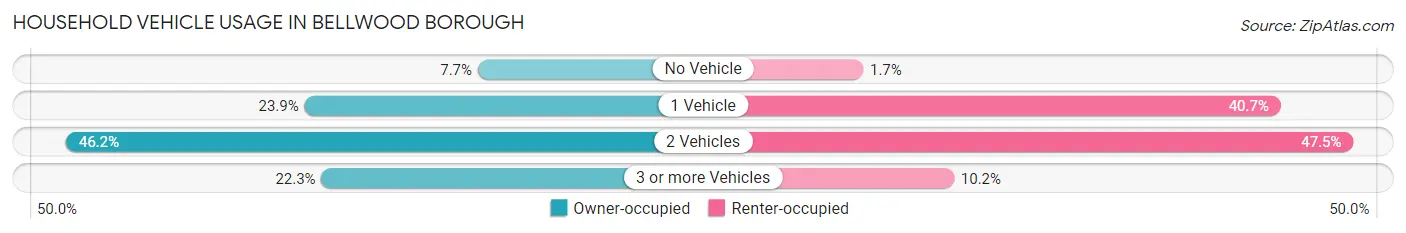
| Vehicles per Household | Owner-occupied | Renter-occupied |
| No Vehicle | 39 (7.7%) | 3 (1.7%) |
| 1 Vehicle | 121 (23.9%) | 72 (40.7%) |
| 2 Vehicles | 234 (46.2%) | 84 (47.5%) |
| 3 or more Vehicles | 113 (22.3%) | 18 (10.2%) |
| Total | 507 (100.0%) | 177 (100.0%) |
Real Estate & Mortgages in Bellwood borough
Real Estate and Mortgage Overview in Bellwood borough
| Characteristic | Without Mortgage | With Mortgage |
| Housing Units | 178 | 329 |
| Median Property Value | $131,900 | $138,900 |
| Median Household Income | $40,833 | $46 |
| Monthly Housing Costs | $519 | $0 |
| Real Estate Taxes | $1,893 | $3 |
Property Value by Mortgage Status in Bellwood borough
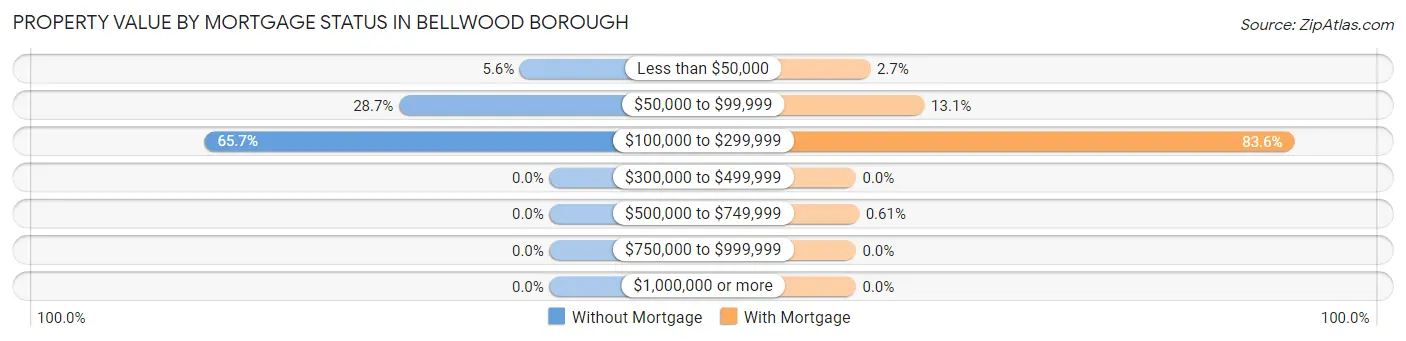
| Property Value | Without Mortgage | With Mortgage |
| Less than $50,000 | 10 (5.6%) | 9 (2.7%) |
| $50,000 to $99,999 | 51 (28.6%) | 43 (13.1%) |
| $100,000 to $299,999 | 117 (65.7%) | 275 (83.6%) |
| $300,000 to $499,999 | 0 (0.0%) | 0 (0.0%) |
| $500,000 to $749,999 | 0 (0.0%) | 2 (0.6%) |
| $750,000 to $999,999 | 0 (0.0%) | 0 (0.0%) |
| $1,000,000 or more | 0 (0.0%) | 0 (0.0%) |
| Total | 178 (100.0%) | 329 (100.0%) |
Household Income by Mortgage Status in Bellwood borough
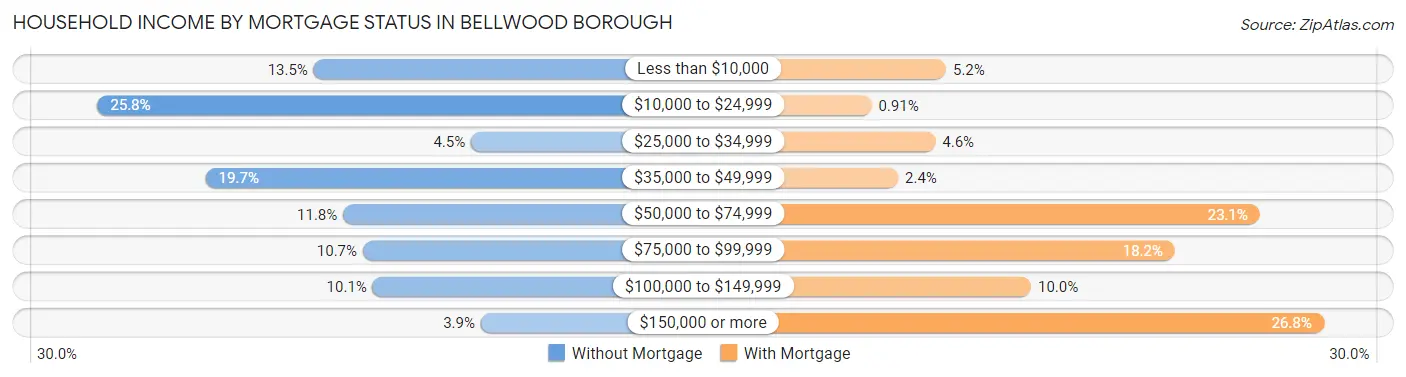
| Household Income | Without Mortgage | With Mortgage |
| Less than $10,000 | 24 (13.5%) | 17 (5.2%) |
| $10,000 to $24,999 | 46 (25.8%) | 3 (0.9%) |
| $25,000 to $34,999 | 8 (4.5%) | 15 (4.6%) |
| $35,000 to $49,999 | 35 (19.7%) | 8 (2.4%) |
| $50,000 to $74,999 | 21 (11.8%) | 76 (23.1%) |
| $75,000 to $99,999 | 19 (10.7%) | 60 (18.2%) |
| $100,000 to $149,999 | 18 (10.1%) | 33 (10.0%) |
| $150,000 or more | 7 (3.9%) | 88 (26.8%) |
| Total | 178 (100.0%) | 329 (100.0%) |
Property Value to Household Income Ratio in Bellwood borough
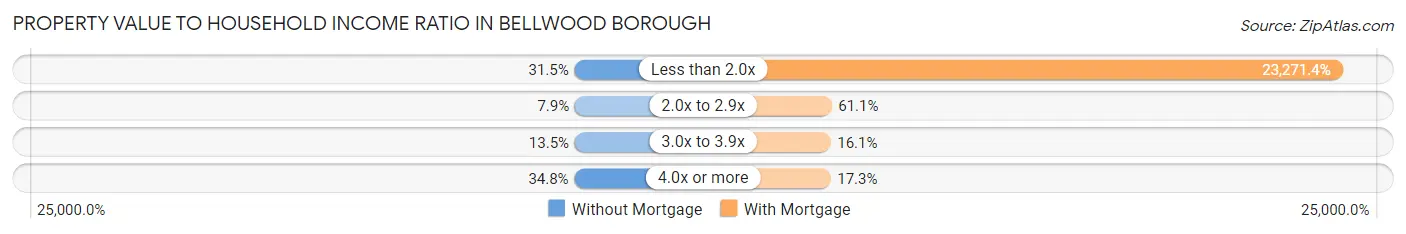
| Value-to-Income Ratio | Without Mortgage | With Mortgage |
| Less than 2.0x | 56 (31.5%) | 76,563 (23,271.4%) |
| 2.0x to 2.9x | 14 (7.9%) | 201 (61.1%) |
| 3.0x to 3.9x | 24 (13.5%) | 53 (16.1%) |
| 4.0x or more | 62 (34.8%) | 57 (17.3%) |
| Total | 178 (100.0%) | 329 (100.0%) |
Real Estate Taxes by Mortgage Status in Bellwood borough
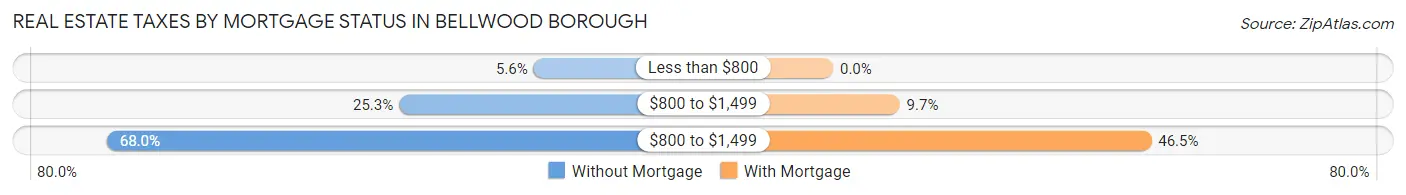
| Property Taxes | Without Mortgage | With Mortgage |
| Less than $800 | 10 (5.6%) | 0 (0.0%) |
| $800 to $1,499 | 45 (25.3%) | 32 (9.7%) |
| $800 to $1,499 | 121 (68.0%) | 153 (46.5%) |
| Total | 178 (100.0%) | 329 (100.0%) |
Health & Disability in Bellwood borough
Health Insurance Coverage by Age in Bellwood borough
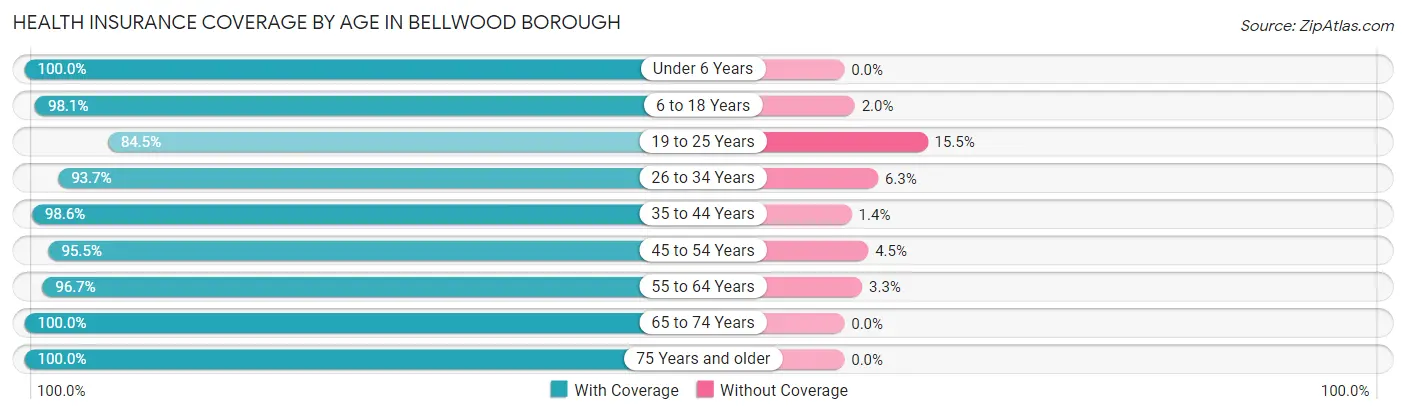
| Age Bracket | With Coverage | Without Coverage |
| Under 6 Years | 117 (100.0%) | 0 (0.0%) |
| 6 to 18 Years | 301 (98.1%) | 6 (1.9%) |
| 19 to 25 Years | 98 (84.5%) | 18 (15.5%) |
| 26 to 34 Years | 179 (93.7%) | 12 (6.3%) |
| 35 to 44 Years | 289 (98.6%) | 4 (1.4%) |
| 45 to 54 Years | 193 (95.5%) | 9 (4.5%) |
| 55 to 64 Years | 204 (96.7%) | 7 (3.3%) |
| 65 to 74 Years | 152 (100.0%) | 0 (0.0%) |
| 75 Years and older | 92 (100.0%) | 0 (0.0%) |
| Total | 1,625 (96.7%) | 56 (3.3%) |
Health Insurance Coverage by Citizenship Status in Bellwood borough
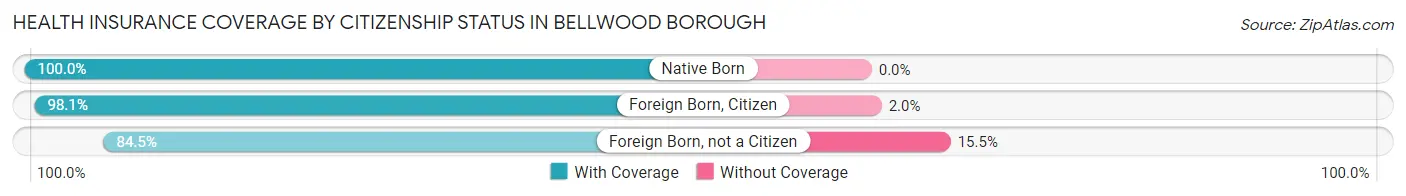
| Citizenship Status | With Coverage | Without Coverage |
| Native Born | 117 (100.0%) | 0 (0.0%) |
| Foreign Born, Citizen | 301 (98.1%) | 6 (1.9%) |
| Foreign Born, not a Citizen | 98 (84.5%) | 18 (15.5%) |
Health Insurance Coverage by Household Income in Bellwood borough
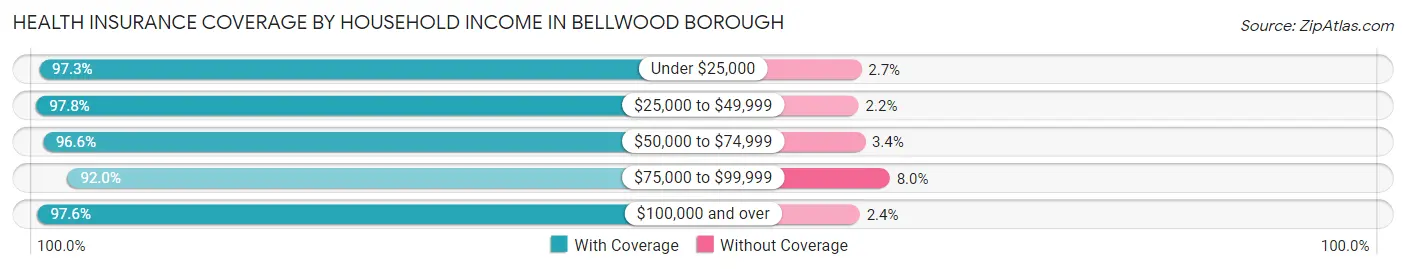
| Household Income | With Coverage | Without Coverage |
| Under $25,000 | 214 (97.3%) | 6 (2.7%) |
| $25,000 to $49,999 | 396 (97.8%) | 9 (2.2%) |
| $50,000 to $74,999 | 284 (96.6%) | 10 (3.4%) |
| $75,000 to $99,999 | 206 (92.0%) | 18 (8.0%) |
| $100,000 and over | 525 (97.6%) | 13 (2.4%) |
Public vs Private Health Insurance Coverage by Age in Bellwood borough
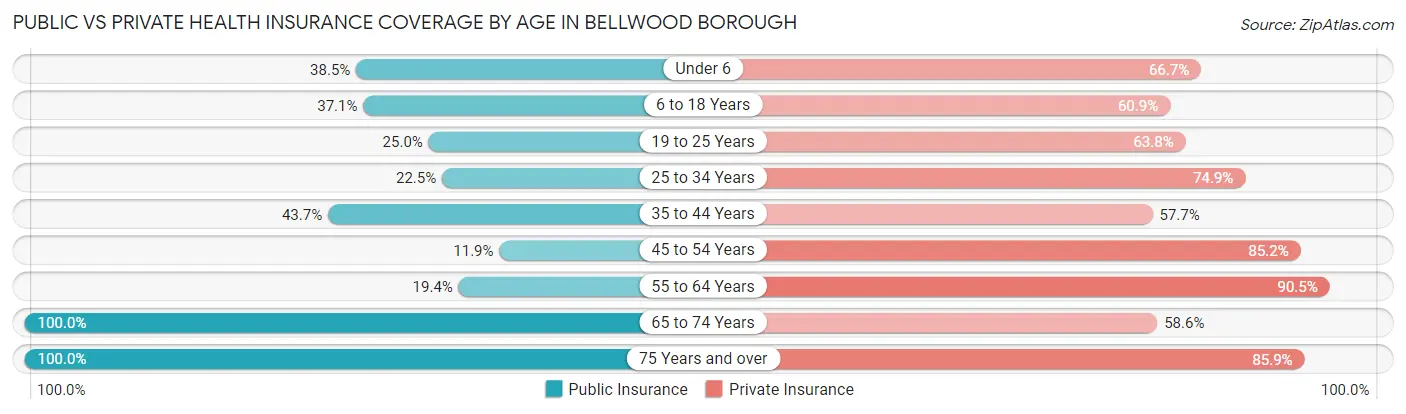
| Age Bracket | Public Insurance | Private Insurance |
| Under 6 | 45 (38.5%) | 78 (66.7%) |
| 6 to 18 Years | 114 (37.1%) | 187 (60.9%) |
| 19 to 25 Years | 29 (25.0%) | 74 (63.8%) |
| 25 to 34 Years | 43 (22.5%) | 143 (74.9%) |
| 35 to 44 Years | 128 (43.7%) | 169 (57.7%) |
| 45 to 54 Years | 24 (11.9%) | 172 (85.2%) |
| 55 to 64 Years | 41 (19.4%) | 191 (90.5%) |
| 65 to 74 Years | 152 (100.0%) | 89 (58.6%) |
| 75 Years and over | 92 (100.0%) | 79 (85.9%) |
| Total | 668 (39.7%) | 1,182 (70.3%) |
Disability Status by Sex by Age in Bellwood borough
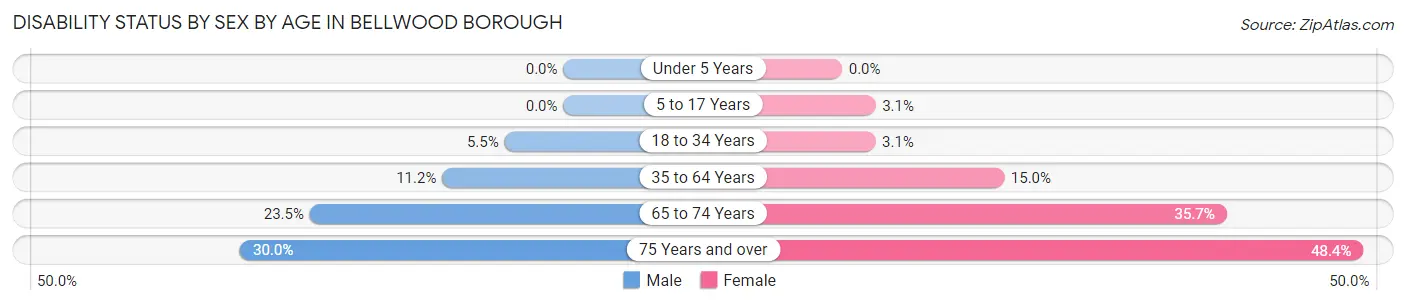
| Age Bracket | Male | Female |
| Under 5 Years | 0 (0.0%) | 0 (0.0%) |
| 5 to 17 Years | 0 (0.0%) | 4 (3.1%) |
| 18 to 34 Years | 10 (5.5%) | 5 (3.1%) |
| 35 to 64 Years | 39 (11.2%) | 54 (15.0%) |
| 65 to 74 Years | 16 (23.5%) | 30 (35.7%) |
| 75 Years and over | 9 (30.0%) | 30 (48.4%) |
Disability Class by Sex by Age in Bellwood borough
Disability Class: Hearing Difficulty
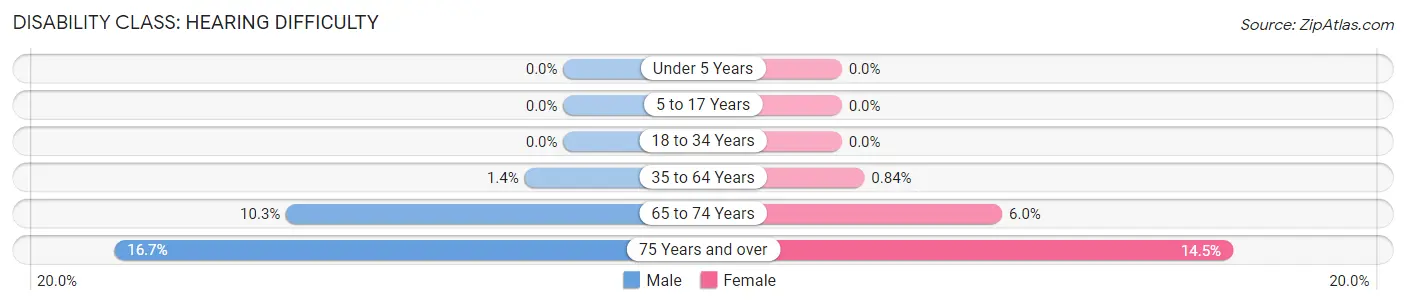
| Age Bracket | Male | Female |
| Under 5 Years | 0 (0.0%) | 0 (0.0%) |
| 5 to 17 Years | 0 (0.0%) | 0 (0.0%) |
| 18 to 34 Years | 0 (0.0%) | 0 (0.0%) |
| 35 to 64 Years | 5 (1.4%) | 3 (0.8%) |
| 65 to 74 Years | 7 (10.3%) | 5 (5.9%) |
| 75 Years and over | 5 (16.7%) | 9 (14.5%) |
Disability Class: Vision Difficulty
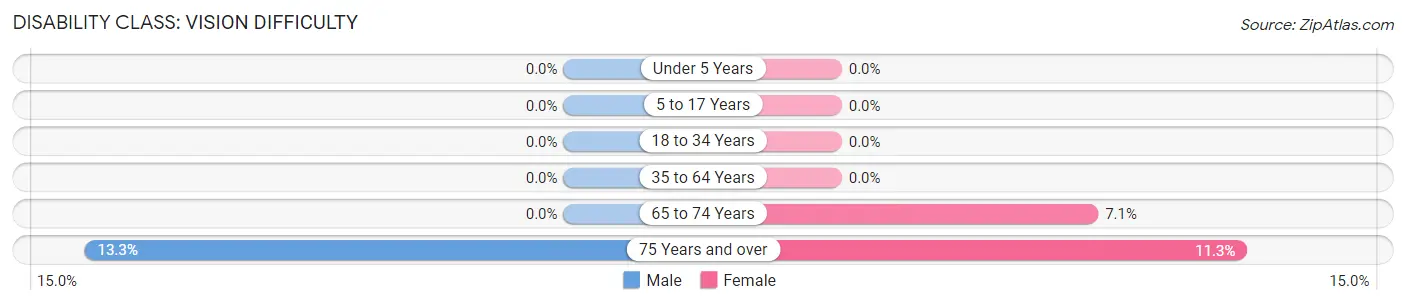
| Age Bracket | Male | Female |
| Under 5 Years | 0 (0.0%) | 0 (0.0%) |
| 5 to 17 Years | 0 (0.0%) | 0 (0.0%) |
| 18 to 34 Years | 0 (0.0%) | 0 (0.0%) |
| 35 to 64 Years | 0 (0.0%) | 0 (0.0%) |
| 65 to 74 Years | 0 (0.0%) | 6 (7.1%) |
| 75 Years and over | 4 (13.3%) | 7 (11.3%) |
Disability Class: Cognitive Difficulty
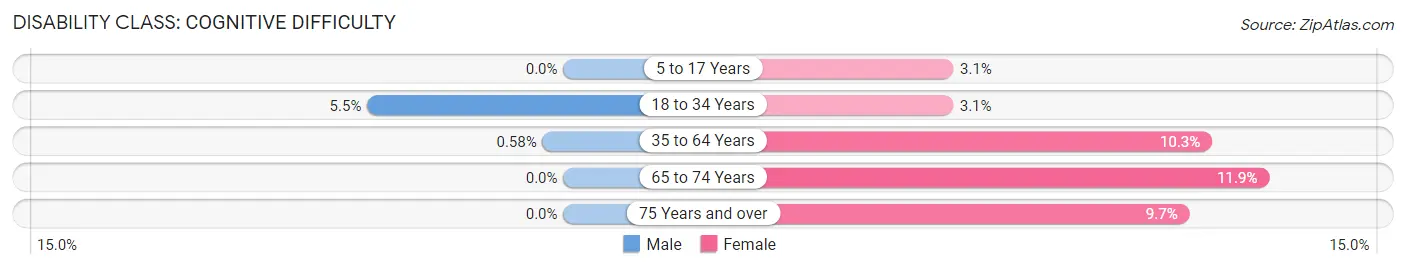
| Age Bracket | Male | Female |
| 5 to 17 Years | 0 (0.0%) | 4 (3.1%) |
| 18 to 34 Years | 10 (5.5%) | 5 (3.1%) |
| 35 to 64 Years | 2 (0.6%) | 37 (10.3%) |
| 65 to 74 Years | 0 (0.0%) | 10 (11.9%) |
| 75 Years and over | 0 (0.0%) | 6 (9.7%) |
Disability Class: Ambulatory Difficulty
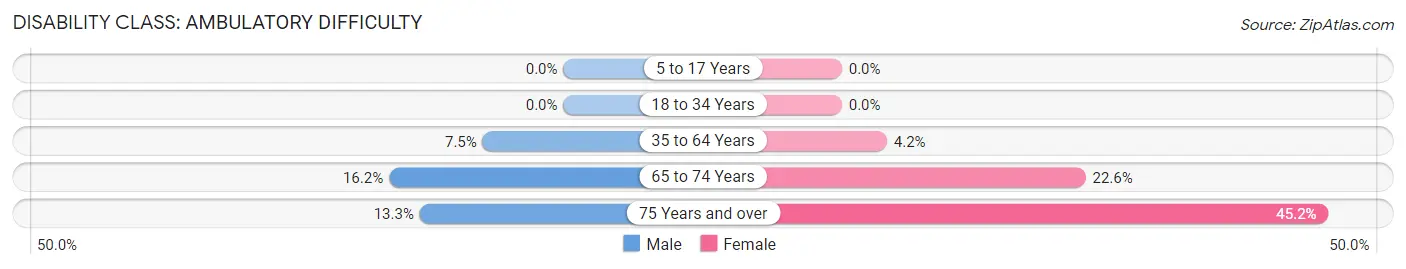
| Age Bracket | Male | Female |
| 5 to 17 Years | 0 (0.0%) | 0 (0.0%) |
| 18 to 34 Years | 0 (0.0%) | 0 (0.0%) |
| 35 to 64 Years | 26 (7.5%) | 15 (4.2%) |
| 65 to 74 Years | 11 (16.2%) | 19 (22.6%) |
| 75 Years and over | 4 (13.3%) | 28 (45.2%) |
Disability Class: Self-Care Difficulty
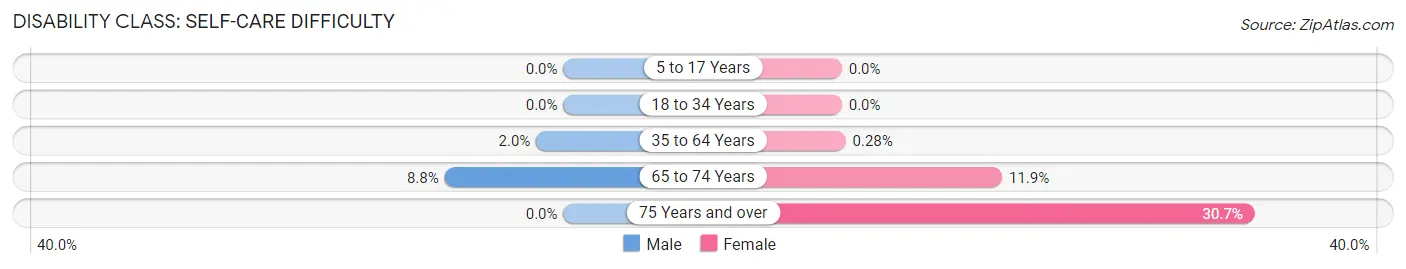
| Age Bracket | Male | Female |
| 5 to 17 Years | 0 (0.0%) | 0 (0.0%) |
| 18 to 34 Years | 0 (0.0%) | 0 (0.0%) |
| 35 to 64 Years | 7 (2.0%) | 1 (0.3%) |
| 65 to 74 Years | 6 (8.8%) | 10 (11.9%) |
| 75 Years and over | 0 (0.0%) | 19 (30.6%) |
Technology Access in Bellwood borough
Computing Device Access in Bellwood borough
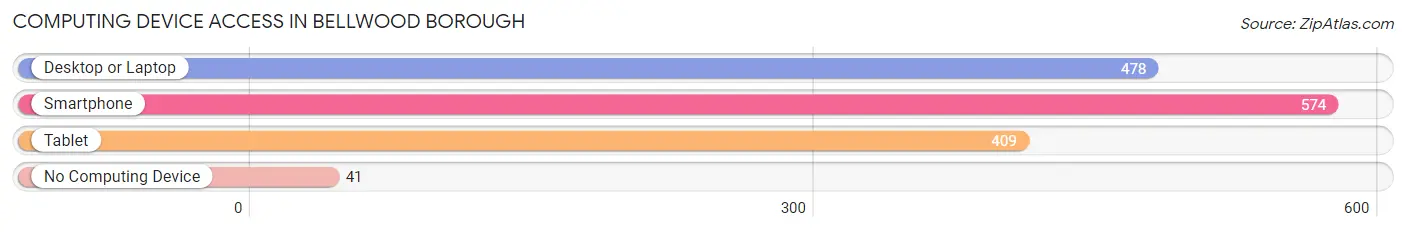
| Device Type | # Households | % Households |
| Desktop or Laptop | 478 | 69.9% |
| Smartphone | 574 | 83.9% |
| Tablet | 409 | 59.8% |
| No Computing Device | 41 | 6.0% |
| Total | 684 | 100.0% |
Internet Access in Bellwood borough
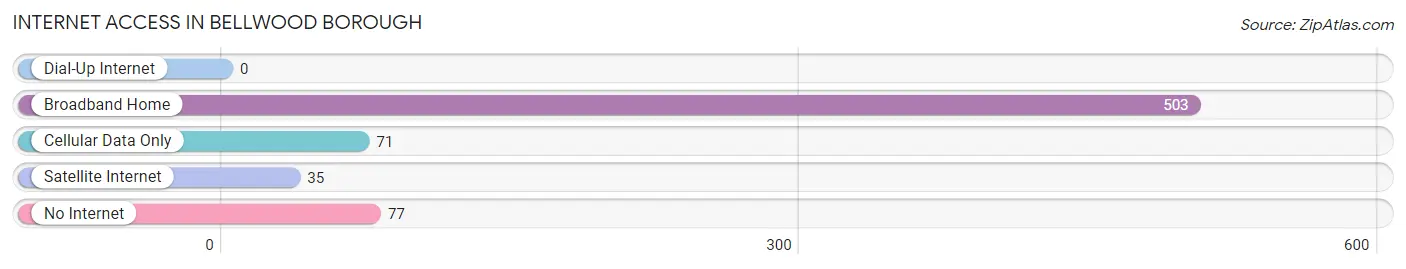
| Internet Type | # Households | % Households |
| Dial-Up Internet | 0 | 0.0% |
| Broadband Home | 503 | 73.5% |
| Cellular Data Only | 71 | 10.4% |
| Satellite Internet | 35 | 5.1% |
| No Internet | 77 | 11.3% |
| Total | 684 | 100.0% |
Bellwood borough Summary
Bellwood Borough is a small borough located in Blair County, Pennsylvania. It is situated in the central part of the state, approximately 10 miles east of Altoona and about 90 miles east of Pittsburgh. The borough is bordered by Antis Township to the north, Tyrone Borough to the east, and Frankstown Township to the south and west. According to the 2010 census, the population of Bellwood Borough was 2,717.
History
The area that is now Bellwood Borough was first settled in the late 1700s by German and Irish immigrants. The first permanent settlers were the Bell family, who arrived in 1810 and established a small farm. The area was known as Bell’s Woods until 1876, when it was officially incorporated as Bellwood Borough.
The borough was named after the Bell family, who were prominent in the area. The Bells were involved in many aspects of the local economy, including farming, lumbering, and coal mining. The Bells also owned a general store, which was the first business in the borough.
In the late 1800s, the borough began to grow and develop. The Bellwood and Tyrone Railroad was built in 1887, connecting the borough to Altoona and other nearby towns. This allowed for the transportation of goods and people, and helped to spur economic growth.
In the early 1900s, the borough continued to grow and develop. The Bellwood and Tyrone Railroad was replaced by the Altoona and Bellwood Railroad in 1906, and the Bellwood and Tyrone Electric Railway was built in 1910. These new transportation options allowed for the further development of the borough.
In the 1920s, the borough experienced a period of rapid growth. The population increased from 1,000 in 1920 to 2,000 in 1930. This growth was due to the influx of new residents, as well as the development of new businesses and industries.
In the 1940s, the borough experienced a period of decline. The population decreased from 2,000 in 1940 to 1,800 in 1950. This decline was due to the closure of several businesses and industries, as well as the departure of many residents.
In the 1950s, the borough began to experience a period of recovery. The population increased from 1,800 in 1950 to 2,000 in 1960. This recovery was due to the development of new businesses and industries, as well as the influx of new residents.
Geography
Bellwood Borough is located in the central part of Blair County, Pennsylvania. It is situated in the Appalachian Mountains, approximately 10 miles east of Altoona and about 90 miles east of Pittsburgh. The borough is bordered by Antis Township to the north, Tyrone Borough to the east, and Frankstown Township to the south and west.
The borough has a total area of 1.2 square miles, all of which is land. The terrain is mostly hilly, with some flat areas. The borough is located in a humid continental climate zone, with cold winters and hot, humid summers.
Economy
The economy of Bellwood Borough is largely based on manufacturing and services. The borough is home to several manufacturing companies, including a paper mill, a plastics factory, and a metal fabrication plant. The borough also has several retail stores, restaurants, and other service-based businesses.
The borough is also home to several educational institutions, including a community college and a technical school. These institutions provide educational opportunities for residents and help to attract new businesses and industries to the area.
Demographics
According to the 2010 census, the population of Bellwood Borough was 2,717. The population is largely white (94.3%), with small percentages of African American (2.2%), Asian (1.2%), and Hispanic (1.2%) residents. The median household income is $41,944, and the median age is 41.
The borough is home to a large number of families, with 44.3% of households consisting of married couples. The borough also has a large number of single-parent households (25.3%). The majority of residents (90.2%) are high school graduates, and the majority (77.2%) are employed.
Conclusion
Bellwood Borough is a small borough located in Blair County, Pennsylvania. It is situated in the central part of the state, approximately 10 miles east of Altoona and about 90 miles east of Pittsburgh. The borough is bordered by Antis Township to the north, Tyrone Borough to the east, and Frankstown Township to the south and west. According to the 2010 census, the population of Bellwood Borough was 2,717.
The economy of Bellwood Borough is largely based on manufacturing and services. The borough is home to several manufacturing companies, as well as several retail stores, restaurants, and other service-based businesses. The borough is also home to several educational institutions, which provide educational opportunities for residents and help to attract new businesses and industries to the area.
The population of Bellwood Borough is largely white (94.3%), with small percentages of African American (2.2%), Asian (1.2%), and Hispanic (1.2%) residents. The median household income is $41,944, and the median age is 41. The majority of residents (90.2%) are high school graduates, and the majority (77.2%) are employed.
Common Questions
What is Per Capita Income in Bellwood borough?
Per Capita income in Bellwood borough is $27,666.
What is the Median Family Income in Bellwood borough?
Median Family Income in Bellwood borough is $73,929.
What is the Median Household income in Bellwood borough?
Median Household Income in Bellwood borough is $50,250.
What is Income or Wage Gap in Bellwood borough?
Income or Wage Gap in Bellwood borough is 23.0%.
Women in Bellwood borough earn 77.0 cents for every dollar earned by a man.
What is Inequality or Gini Index in Bellwood borough?
Inequality or Gini Index in Bellwood borough is 0.41.
What is the Total Population of Bellwood borough?
Total Population of Bellwood borough is 1,681.
What is the Total Male Population of Bellwood borough?
Total Male Population of Bellwood borough is 855.
What is the Total Female Population of Bellwood borough?
Total Female Population of Bellwood borough is 826.
What is the Ratio of Males per 100 Females in Bellwood borough?
There are 103.51 Males per 100 Females in Bellwood borough.
What is the Ratio of Females per 100 Males in Bellwood borough?
There are 96.61 Females per 100 Males in Bellwood borough.
What is the Median Population Age in Bellwood borough?
Median Population Age in Bellwood borough is 39.8 Years.
What is the Average Family Size in Bellwood borough
Average Family Size in Bellwood borough is 3.1 People.
What is the Average Household Size in Bellwood borough
Average Household Size in Bellwood borough is 2.5 People.
How Large is the Labor Force in Bellwood borough?
There are 923 People in the Labor Forcein in Bellwood borough.
What is the Percentage of People in the Labor Force in Bellwood borough?
68.0% of People are in the Labor Force in Bellwood borough.
What is the Unemployment Rate in Bellwood borough?
Unemployment Rate in Bellwood borough is 4.9%.