Zip Codes with the Highest Percentage of Population with a Degree in Social Sciences in Pittsburgh, PA

RELATED REPORTS & OPTIONS

Social Sciences
Population
Families and Households
Female Fertility
Female Fertility (Unmarried)
Race (Community Size)
Race (Percentage)
Ancestry (Community Size)
AfghanAfricanAlbanianAlsatianAmericanApacheArabArgentineanArmenianAustralianAustrianBahamianBarbadianBasqueBelgianBhutaneseBlackfeetBolivianBrazilianBritishBritish West IndianBulgarianBurmeseCajunCambodianCanadianCape VerdeanCarpatho RusynCelticCentral AmericanCentral American IndianCherokeeChickasawChileanChippewaChoctawColombianComancheCosta RicanCreekCroatianCubanCypriotCzechCzechoslovakianDanishDelawareDominicanDutchEastern EuropeanEcuadorianEgyptianEnglishEthiopianEuropeanFilipinoFinnishFrenchFrench American IndianFrench CanadianGermanGhanaianGreekGuamanian / ChamorroGuatemalanGuyaneseHaitianHonduranHungarianIndian (Asian)IndonesianIranianIraqiIrishIroquoisIsraeliItalianJamaicanJapaneseJordanianKenyanKoreanLaotianLatvianLebaneseLiberianLithuanianLumbeeLuxembourgerMacedonianMalaysianMalteseMexicanMexican American IndianMongolianMoroccanNative HawaiianNavajoNew ZealanderNicaraguanNigerianNorthern EuropeanNorwegianPakistaniPalestinianPanamanianParaguayanPennsylvania GermanPeruvianPolishPortuguesePuerto RicanRomanianRussianSalvadoranSamoanScandinavianScotch-IrishScottishSeminoleSerbianSiouxSlavicSlovakSloveneSouth AfricanSouth AmericanSouth American IndianSoviet UnionSpaniardSpanishSri LankanSubsaharan AfricanSudaneseSwedishSwissSyrianThaiTrinidadian and TobagonianTurkishU.S. Virgin IslanderUgandanUkrainianUruguayanVenezuelanVietnameseWelshWest IndianYugoslavian
Ancestry (Percentage)
AfghanAfricanAlbanianAlsatianAmericanApacheArabArgentineanArmenianAustralianAustrianBahamianBarbadianBasqueBelgianBhutaneseBlackfeetBolivianBrazilianBritishBritish West IndianBulgarianBurmeseCajunCambodianCanadianCape VerdeanCarpatho RusynCelticCentral AmericanCentral American IndianCherokeeChickasawChileanChippewaChoctawColombianComancheCosta RicanCreekCroatianCubanCypriotCzechCzechoslovakianDanishDelawareDominicanDutchEastern EuropeanEcuadorianEgyptianEnglishEthiopianEuropeanFilipinoFinnishFrenchFrench American IndianFrench CanadianGermanGhanaianGreekGuamanian / ChamorroGuatemalanGuyaneseHaitianHonduranHungarianIndian (Asian)IndonesianIranianIraqiIrishIroquoisIsraeliItalianJamaicanJapaneseJordanianKenyanKoreanLaotianLatvianLebaneseLiberianLithuanianLumbeeLuxembourgerMacedonianMalaysianMalteseMexicanMexican American IndianMongolianMoroccanNative HawaiianNavajoNew ZealanderNicaraguanNigerianNorthern EuropeanNorwegianPakistaniPalestinianPanamanianParaguayanPennsylvania GermanPeruvianPolishPortuguesePuerto RicanRomanianRussianSalvadoranSamoanScandinavianScotch-IrishScottishSeminoleSerbianSiouxSlavicSlovakSloveneSouth AfricanSouth AmericanSouth American IndianSoviet UnionSpaniardSpanishSri LankanSubsaharan AfricanSudaneseSwedishSwissSyrianThaiTrinidadian and TobagonianTurkishU.S. Virgin IslanderUgandanUkrainianUruguayanVenezuelanVietnameseWelshWest IndianYugoslavian
Immigrant Origin (Total)
AfghanistanAfricaAlbaniaArgentinaAsiaAustraliaAustriaBahamasBangladeshBelarusBelgiumBoliviaBosnia and HerzegovinaBrazilBulgariaBurma / MyanmarCambodiaCameroonCanadaCaribbeanCentral AmericaChileChinaColombiaCongoCosta RicaCroatiaCubaCzechoslovakiaDenmarkDominican RepublicEastern AfricaEastern AsiaEastern EuropeEcuadorEgyptEl SalvadorEnglandEritreaEthiopiaEuropeFranceGermanyGhanaGreeceGuatemalaGuyanaHaitiHondurasHong KongHungaryIndiaIndonesiaIranIraqIrelandIsraelItalyJamaicaJapanJordanKazakhstanKenyaKoreaKuwaitLatin AmericaLatviaLebanonLiberiaLithuaniaMalaysiaMexicoMiddle AfricaMoldovaMoroccoNepalNetherlandsNigeriaNorthern AfricaNorthern EuropeNorwayOceaniaPakistanPanamaPeruPhilippinesPolandPortugalRomaniaRussiaSaudi ArabiaScotlandSerbiaSingaporeSouth AfricaSouth AmericaSouth Central AsiaSouth Eastern AsiaSouthern EuropeSpainSri LankaSudanSwedenSwitzerlandSyriaTaiwanThailandTrinidad and TobagoTurkeyUgandaUkraineUzbekistanVenezuelaVietnamWestern AfricaWestern AsiaWestern EuropeZaire
Immigrant Origin (Percentage)
AfghanistanAfricaAlbaniaArgentinaAsiaAustraliaAustriaBahamasBangladeshBelarusBelgiumBoliviaBosnia and HerzegovinaBrazilBulgariaBurma / MyanmarCambodiaCameroonCanadaCaribbeanCentral AmericaChileChinaColombiaCongoCosta RicaCroatiaCubaCzechoslovakiaDenmarkDominican RepublicEastern AfricaEastern AsiaEastern EuropeEcuadorEgyptEl SalvadorEnglandEritreaEthiopiaEuropeFranceGermanyGhanaGreeceGuatemalaGuyanaHaitiHondurasHong KongHungaryIndiaIndonesiaIranIraqIrelandIsraelItalyJamaicaJapanJordanKazakhstanKenyaKoreaKuwaitLatin AmericaLatviaLebanonLiberiaLithuaniaMalaysiaMexicoMiddle AfricaMoldovaMoroccoNepalNetherlandsNigeriaNorthern AfricaNorthern EuropeNorwayOceaniaPakistanPanamaPeruPhilippinesPolandPortugalRomaniaRussiaSaudi ArabiaScotlandSerbiaSingaporeSouth AfricaSouth AmericaSouth Central AsiaSouth Eastern AsiaSouthern EuropeSpainSri LankaSudanSwedenSwitzerlandSyriaTaiwanThailandTrinidad and TobagoTurkeyUgandaUkraineUzbekistanVenezuelaVietnamWestern AfricaWestern AsiaWestern EuropeZaire
Income
Income (Families)
Income (Households)
Poverty
Poverty (Families)
Unemployment
Employment Occupations
Employment Industries
Employer Class
Commute Time
Commute Means
School Enrollment
Education by Degree Field
Occupancy
Finances
Physical Characteristics
Pittsburgh
Compare Zip Codes
Comparison Subject

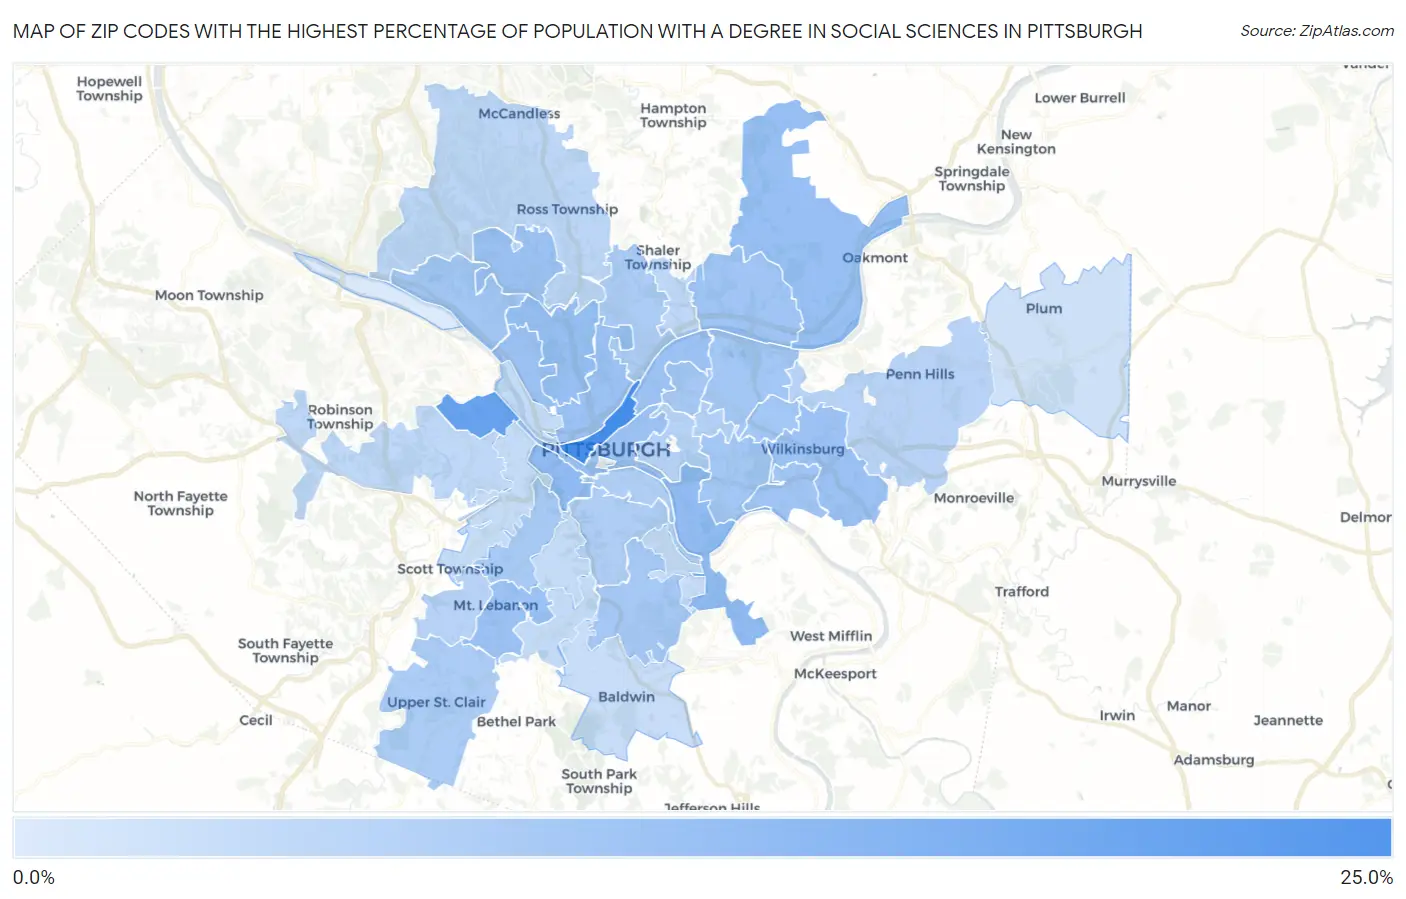
Map of Zip Codes with the Highest Percentage of Population with a Degree in Social Sciences in Pittsburgh

0.0%
25.0%
Zip Codes with the Highest Percentage of Population with a Degree in Social Sciences in Pittsburgh Map

Zip Codes with the Highest Percentage of Population with a Degree in Social Sciences in Pittsburgh, PA

Zip Code % Graduates vs State vs National
1.1522220.2%7.2%(+13.0)#658.1%(+12.1)#948
2.1520416.4%7.2%(+9.23)#968.1%(+8.33)#1,537
3.1520711.6%7.2%(+4.44)#1858.1%(+3.53)#3,825
4.1521111.4%7.2%(+4.28)#1898.1%(+3.37)#3,958
5.1523810.8%7.2%(+3.65)#2138.1%(+2.74)#4,565
6.1521410.7%7.2%(+3.52)#2218.1%(+2.61)#4,717
7.1522910.6%7.2%(+3.46)#2288.1%(+2.56)#4,779
8.1521910.6%7.2%(+3.42)#2308.1%(+2.51)#4,839
9.1521210.5%7.2%(+3.37)#2348.1%(+2.47)#4,888
10.1522810.5%7.2%(+3.36)#2368.1%(+2.45)#4,913
11.1522110.4%7.2%(+3.24)#2418.1%(+2.34)#5,074
12.1520110.3%7.2%(+3.12)#2478.1%(+2.21)#5,197
13.152159.8%7.2%(+2.65)#2768.1%(+1.74)#5,791
14.152189.8%7.2%(+2.65)#2778.1%(+1.74)#5,795
15.152089.6%7.2%(+2.42)#2928.1%(+1.52)#6,096
16.152179.5%7.2%(+2.31)#2978.1%(+1.40)#6,240
17.152069.4%7.2%(+2.26)#3018.1%(+1.35)#6,333
18.152029.4%7.2%(+2.21)#3068.1%(+1.31)#6,380
19.152249.2%7.2%(+2.01)#3178.1%(+1.10)#6,672
20.152279.1%7.2%(+1.95)#3238.1%(+1.04)#6,761
21.152168.9%7.2%(+1.73)#3388.1%(+0.825)#7,122
22.152418.5%7.2%(+1.35)#3738.1%(+0.445)#7,767
23.152098.4%7.2%(+1.21)#3818.1%(+0.306)#8,039
24.152108.1%7.2%(+0.946)#4008.1%(+0.041)#8,529
25.152037.9%7.2%(+0.704)#4228.1%(-0.201)#9,021
26.152327.7%7.2%(+0.558)#4408.1%(-0.348)#9,316
27.152137.5%7.2%(+0.360)#4548.1%(-0.546)#9,724
28.152357.2%7.2%(+0.038)#4888.1%(-0.867)#10,431
29.152437.1%7.2%(-0.054)#5048.1%(-0.959)#10,665
30.152376.7%7.2%(-0.501)#5718.1%(-1.41)#11,716
31.152056.4%7.2%(-0.761)#5988.1%(-1.67)#12,360
32.152236.4%7.2%(-0.775)#5998.1%(-1.68)#12,398
33.152346.0%7.2%(-1.14)#6688.1%(-2.04)#13,257
34.152205.8%7.2%(-1.36)#7028.1%(-2.26)#13,805
35.152335.7%7.2%(-1.43)#7138.1%(-2.34)#13,979
36.152265.7%7.2%(-1.51)#7258.1%(-2.41)#14,174
37.152365.4%7.2%(-1.72)#7578.1%(-2.62)#14,687
38.152394.8%7.2%(-2.40)#8718.1%(-3.30)#16,339
39.152253.3%7.2%(-3.89)#1,0758.1%(-4.79)#19,786

Common Questions

What are the Top 10 Zip Codes with the Highest Percentage of Population with a Degree in Social Sciences in Pittsburgh, PA?
Top 10 Zip Codes with the Highest Percentage of Population with a Degree in Social Sciences in Pittsburgh, PA are:
#1
20.2%
#2
16.4%
#3
11.6%
#4
11.4%
#5
10.8%
#6
10.7%
#7
10.6%
#8
10.6%
#9
10.5%
#10
10.5%
What zip code has the Highest Percentage of Population with a Degree in Social Sciences in Pittsburgh, PA?
15222 has the Highest Percentage of Population with a Degree in Social Sciences in Pittsburgh, PA with 20.2%.
What is the Percentage of Population with a Degree in Social Sciences in Pittsburgh, PA?
Percentage of Population with a Degree in Social Sciences in Pittsburgh is 9.6%.
What is the Percentage of Population with a Degree in Social Sciences in Pennsylvania?
Percentage of Population with a Degree in Social Sciences in Pennsylvania is 7.2%.
What is the Percentage of Population with a Degree in Social Sciences in the United States?
Percentage of Population with a Degree in Social Sciences in the United States is 8.1%.