Reynolds Heights, PA Map & Demographics
Reynolds Heights Map
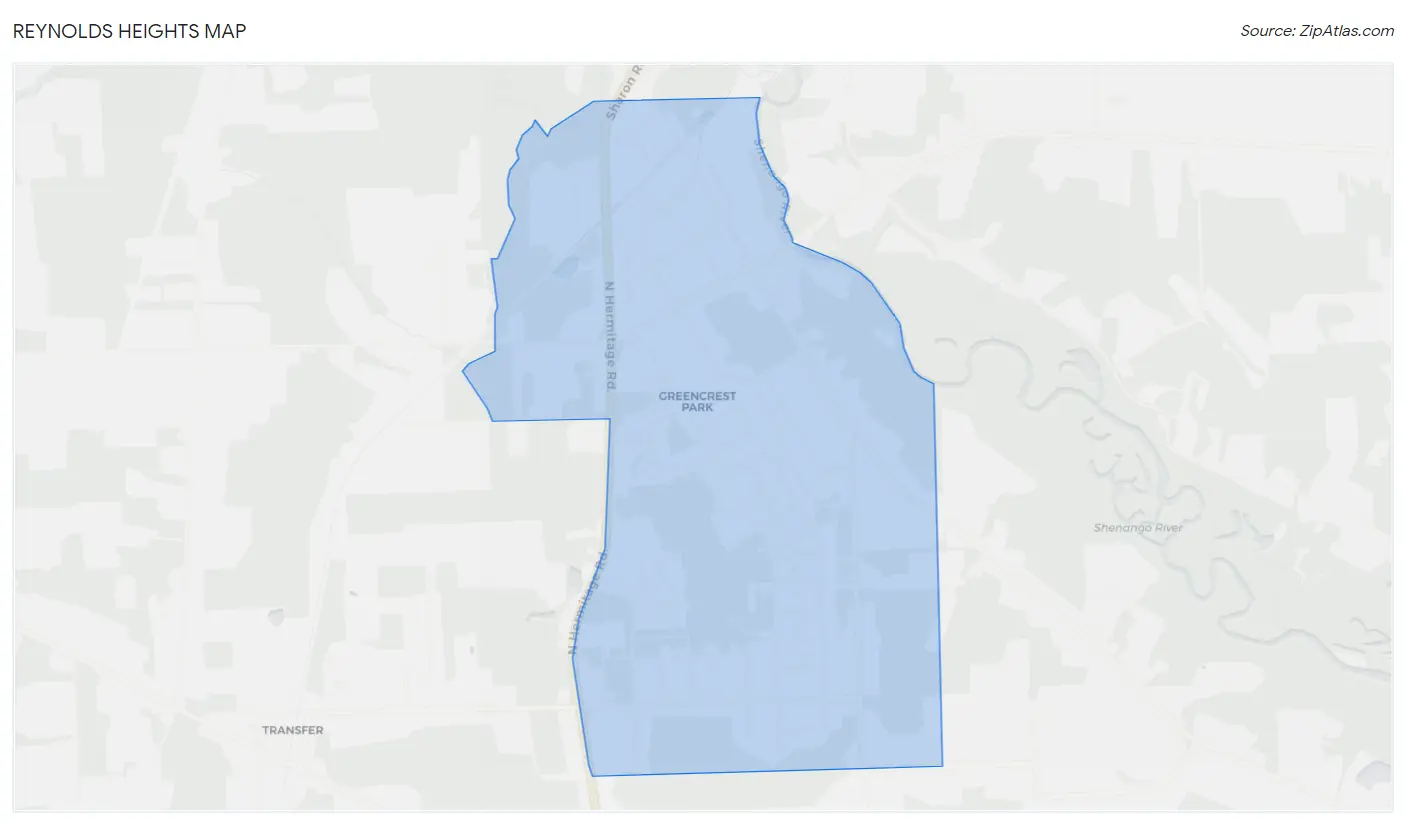
Reynolds Heights Overview
$29,138
PER CAPITA INCOME
$70,417
AVG FAMILY INCOME
$48,775
AVG HOUSEHOLD INCOME
10.8%
WAGE / INCOME GAP [ % ]
89.2¢/ $1
WAGE / INCOME GAP [ $ ]
0.44
INEQUALITY / GINI INDEX
1,977
TOTAL POPULATION
991
MALE POPULATION
986
FEMALE POPULATION
100.51
MALES / 100 FEMALES
99.50
FEMALES / 100 MALES
50.6
MEDIAN AGE
2.7
AVG FAMILY SIZE
2.3
AVG HOUSEHOLD SIZE
978
LABOR FORCE [ PEOPLE ]
60.2%
PERCENT IN LABOR FORCE
4.2%
UNEMPLOYMENT RATE
Income in Reynolds Heights
Income Overview in Reynolds Heights
Per Capita Income in Reynolds Heights is $29,138, while median incomes of families and households are $70,417 and $48,775 respectively.
| Characteristic | Number | Measure |
| Per Capita Income | 1,977 | $29,138 |
| Median Family Income | 605 | $70,417 |
| Mean Family Income | 605 | $76,176 |
| Median Household Income | 845 | $48,775 |
| Mean Household Income | 845 | $66,058 |
| Income Deficit | 605 | $0 |
| Wage / Income Gap (%) | 1,977 | 10.79% |
| Wage / Income Gap ($) | 1,977 | 89.21¢ per $1 |
| Gini / Inequality Index | 1,977 | 0.44 |
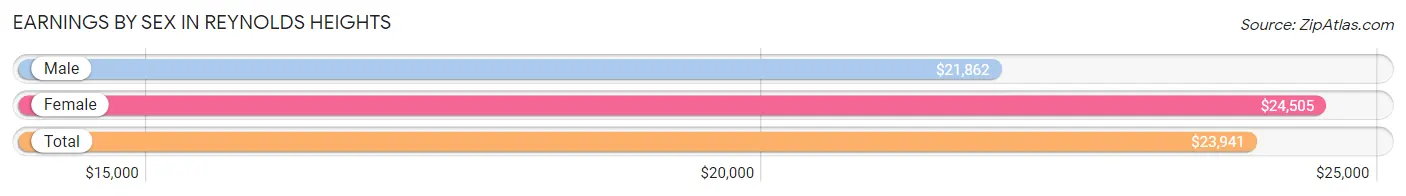
Earnings by Sex in Reynolds Heights
Average Earnings in Reynolds Heights are $23,941, $21,862 for men and $24,505 for women, a difference of 10.8%.
| Sex | Number | Average Earnings |
| Male | 414 (40.4%) | $21,862 |
| Female | 612 (59.7%) | $24,505 |
| Total | 1,026 (100.0%) | $23,941 |
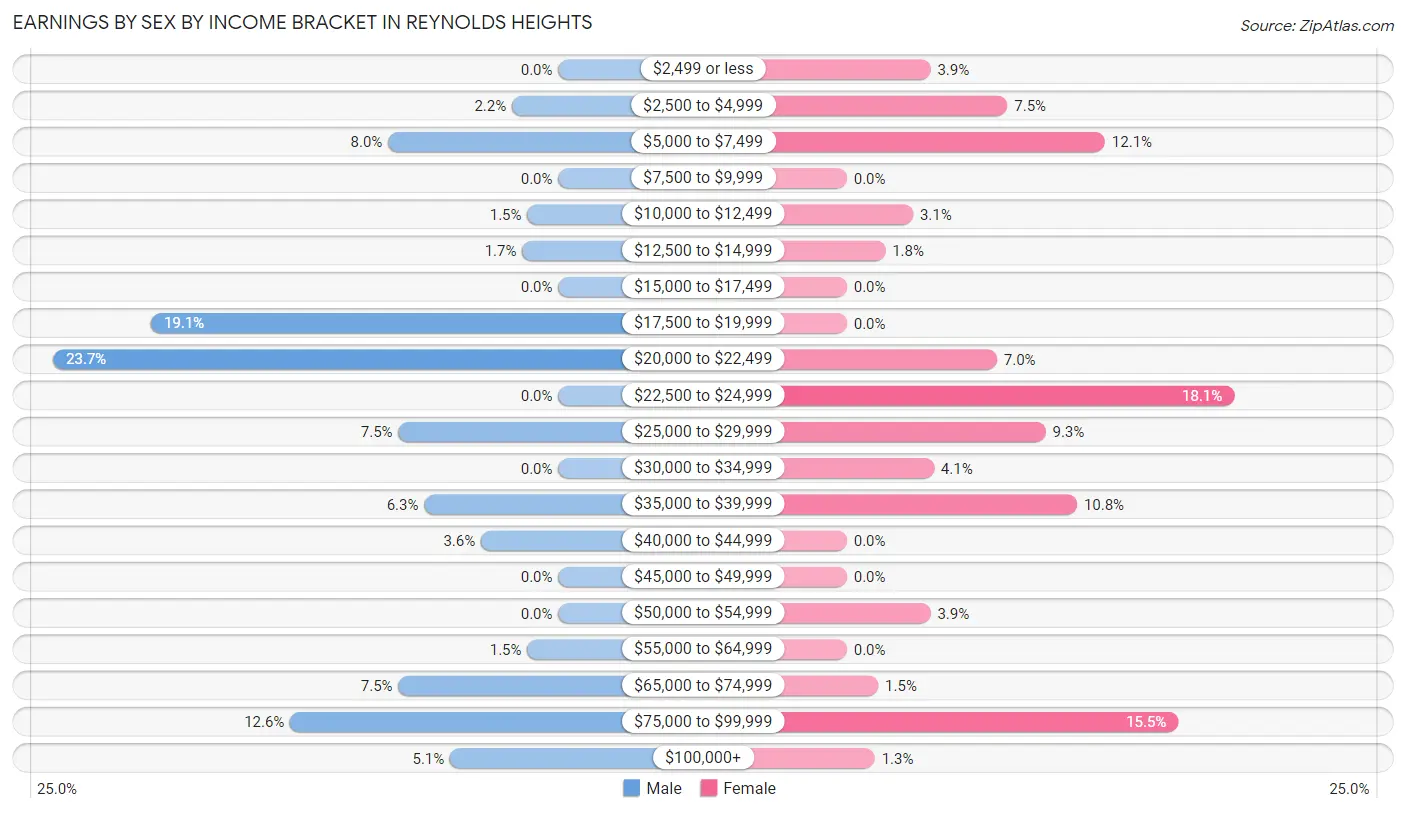
Earnings by Sex by Income Bracket in Reynolds Heights
The most common earnings brackets in Reynolds Heights are $20,000 to $22,499 for men (98 | 23.7%) and $22,500 to $24,999 for women (111 | 18.1%).
| Income | Male | Female |
| $2,499 or less | 0 (0.0%) | 24 (3.9%) |
| $2,500 to $4,999 | 9 (2.2%) | 46 (7.5%) |
| $5,000 to $7,499 | 33 (8.0%) | 74 (12.1%) |
| $7,500 to $9,999 | 0 (0.0%) | 0 (0.0%) |
| $10,000 to $12,499 | 6 (1.5%) | 19 (3.1%) |
| $12,500 to $14,999 | 7 (1.7%) | 11 (1.8%) |
| $15,000 to $17,499 | 0 (0.0%) | 0 (0.0%) |
| $17,500 to $19,999 | 79 (19.1%) | 0 (0.0%) |
| $20,000 to $22,499 | 98 (23.7%) | 43 (7.0%) |
| $22,500 to $24,999 | 0 (0.0%) | 111 (18.1%) |
| $25,000 to $29,999 | 31 (7.5%) | 57 (9.3%) |
| $30,000 to $34,999 | 0 (0.0%) | 25 (4.1%) |
| $35,000 to $39,999 | 26 (6.3%) | 66 (10.8%) |
| $40,000 to $44,999 | 15 (3.6%) | 0 (0.0%) |
| $45,000 to $49,999 | 0 (0.0%) | 0 (0.0%) |
| $50,000 to $54,999 | 0 (0.0%) | 24 (3.9%) |
| $55,000 to $64,999 | 6 (1.5%) | 0 (0.0%) |
| $65,000 to $74,999 | 31 (7.5%) | 9 (1.5%) |
| $75,000 to $99,999 | 52 (12.6%) | 95 (15.5%) |
| $100,000+ | 21 (5.1%) | 8 (1.3%) |
| Total | 414 (100.0%) | 612 (100.0%) |
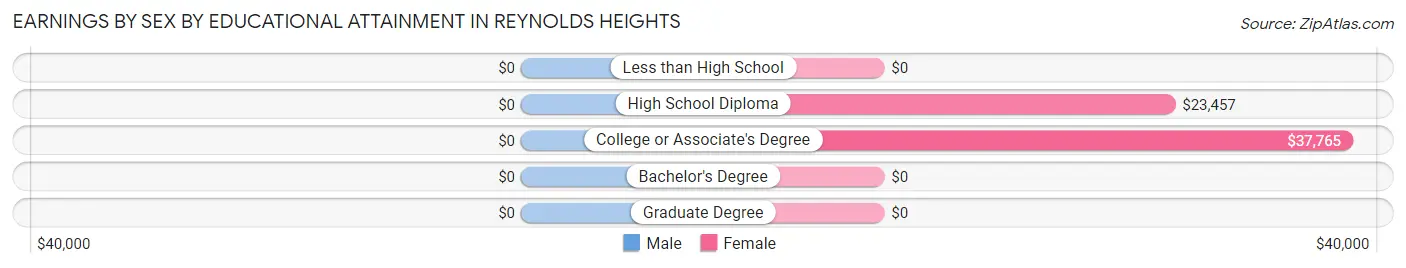
Earnings by Sex by Educational Attainment in Reynolds Heights
| Educational Attainment | Male Income | Female Income |
| Less than High School | - | - |
| High School Diploma | - | - |
| College or Associate's Degree | - | - |
| Bachelor's Degree | - | - |
| Graduate Degree | - | - |
| Total | $22,283 | $25,326 |
Family Income in Reynolds Heights
Family Income Brackets in Reynolds Heights
According to the Reynolds Heights family income data, there are 172 families falling into the $100,000 to $149,999 income range, which is the most common income bracket and makes up 28.4% of all families.
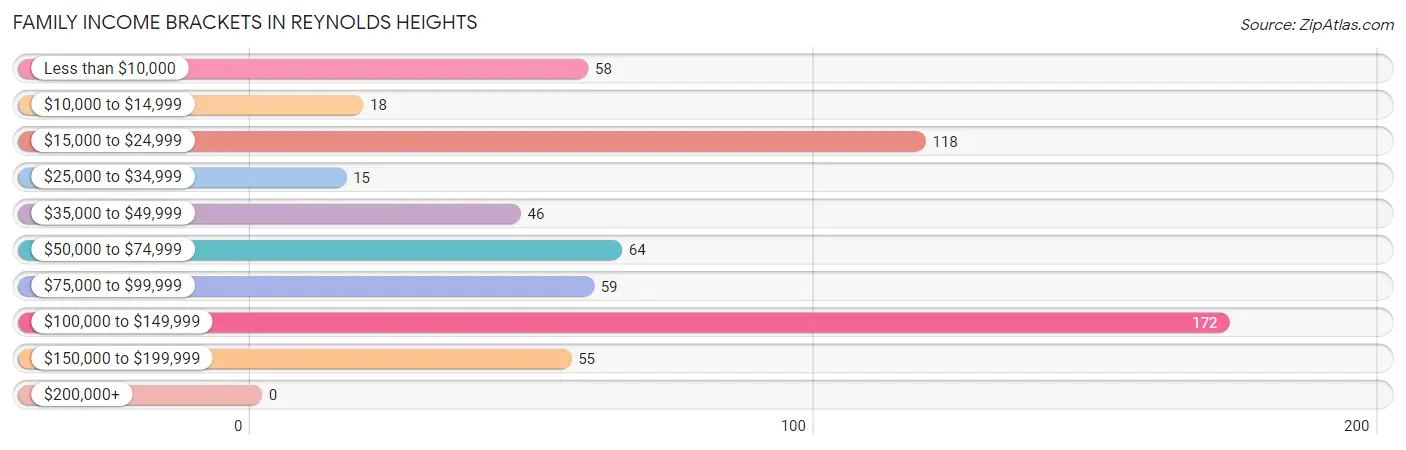
| Income Bracket | # Families | % Families |
| Less than $10,000 | 58 | 9.6% |
| $10,000 to $14,999 | 18 | 3.0% |
| $15,000 to $24,999 | 118 | 19.5% |
| $25,000 to $34,999 | 15 | 2.5% |
| $35,000 to $49,999 | 46 | 7.6% |
| $50,000 to $74,999 | 64 | 10.6% |
| $75,000 to $99,999 | 59 | 9.8% |
| $100,000 to $149,999 | 172 | 28.4% |
| $150,000 to $199,999 | 55 | 9.1% |
| $200,000+ | 0 | 0.0% |
Family Income by Famaliy Size in Reynolds Heights
4-person families (102 | 16.9%) account for the highest median family income in Reynolds Heights with $136,406 per family, while 3-person families (152 | 25.1%) have the highest median income of $34,940 per family member.
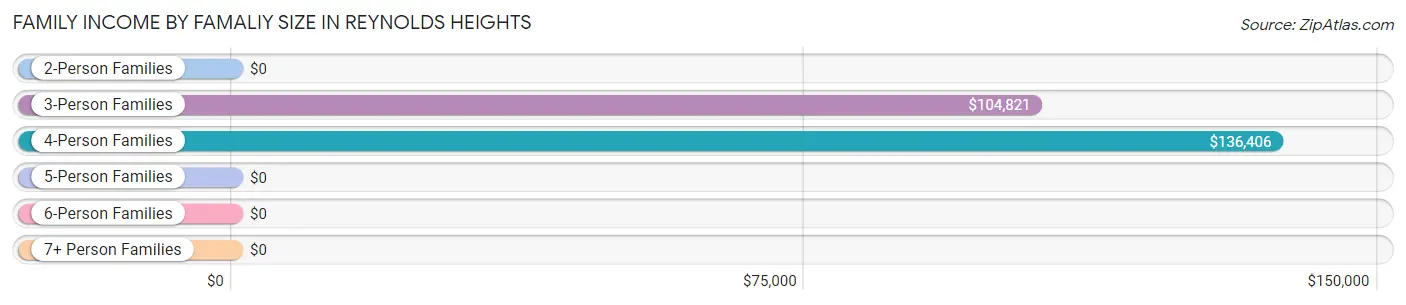
| Income Bracket | # Families | Median Income |
| 2-Person Families | 331 (54.7%) | $0 |
| 3-Person Families | 152 (25.1%) | $104,821 |
| 4-Person Families | 102 (16.9%) | $136,406 |
| 5-Person Families | 20 (3.3%) | $0 |
| 6-Person Families | 0 (0.0%) | $0 |
| 7+ Person Families | 0 (0.0%) | $0 |
| Total | 605 (100.0%) | $70,417 |
Family Income by Number of Earners in Reynolds Heights
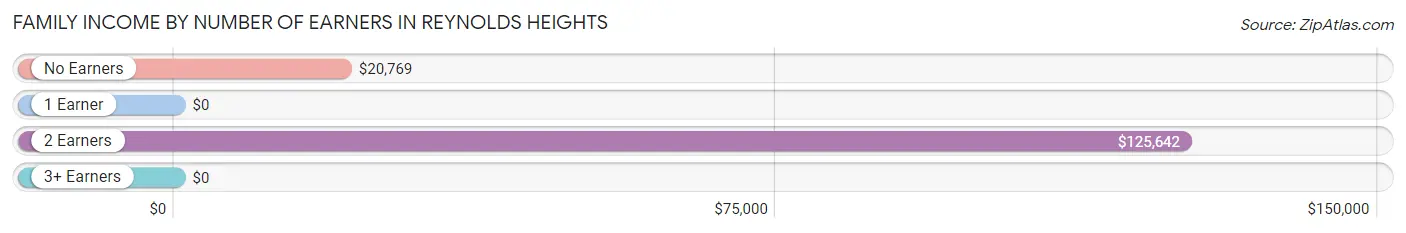
| Number of Earners | # Families | Median Income |
| No Earners | 92 (15.2%) | $20,769 |
| 1 Earner | 184 (30.4%) | $0 |
| 2 Earners | 278 (46.0%) | $125,642 |
| 3+ Earners | 51 (8.4%) | $0 |
| Total | 605 (100.0%) | $70,417 |
Household Income in Reynolds Heights
Household Income Brackets in Reynolds Heights
With 172 households falling in the category, the $100,000 to $149,999 income range is the most frequent in Reynolds Heights, accounting for 20.4% of all households. In contrast, only 8 households (0.9%) fall into the $200,000+ income bracket, making it the least populous group.
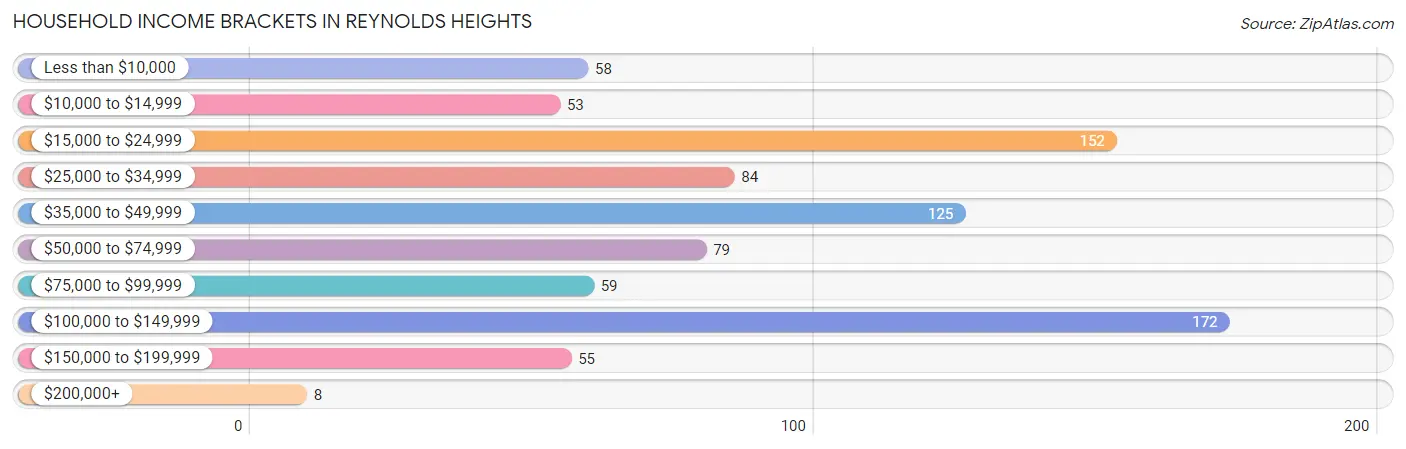
| Income Bracket | # Households | % Households |
| Less than $10,000 | 58 | 6.9% |
| $10,000 to $14,999 | 53 | 6.3% |
| $15,000 to $24,999 | 152 | 18.0% |
| $25,000 to $34,999 | 84 | 9.9% |
| $35,000 to $49,999 | 125 | 14.8% |
| $50,000 to $74,999 | 79 | 9.3% |
| $75,000 to $99,999 | 59 | 7.0% |
| $100,000 to $149,999 | 172 | 20.4% |
| $150,000 to $199,999 | 55 | 6.5% |
| $200,000+ | 8 | 0.9% |
Household Income by Householder Age in Reynolds Heights
The median household income in Reynolds Heights is $48,775, with the highest median household income of $102,589 found in the 45 to 64 years age bracket for the primary householder. A total of 440 households (52.1%) fall into this category. Meanwhile, the 15 to 24 years age bracket for the primary householder has the lowest median household income of $0, with 35 households (4.1%) in this group.

| Income Bracket | # Households | Median Income |
| 15 to 24 Years | 35 (4.1%) | $0 |
| 25 to 44 Years | 128 (15.1%) | $0 |
| 45 to 64 Years | 440 (52.1%) | $102,589 |
| 65+ Years | 242 (28.6%) | $29,902 |
| Total | 845 (100.0%) | $48,775 |
Poverty in Reynolds Heights
Income Below Poverty by Sex and Age in Reynolds Heights
With 14.5% poverty level for males and 25.1% for females among the residents of Reynolds Heights, 12 to 14 year old males and 16 and 17 year old females are the most vulnerable to poverty, with 26 males (100.0%) and 24 females (100.0%) in their respective age groups living below the poverty level.
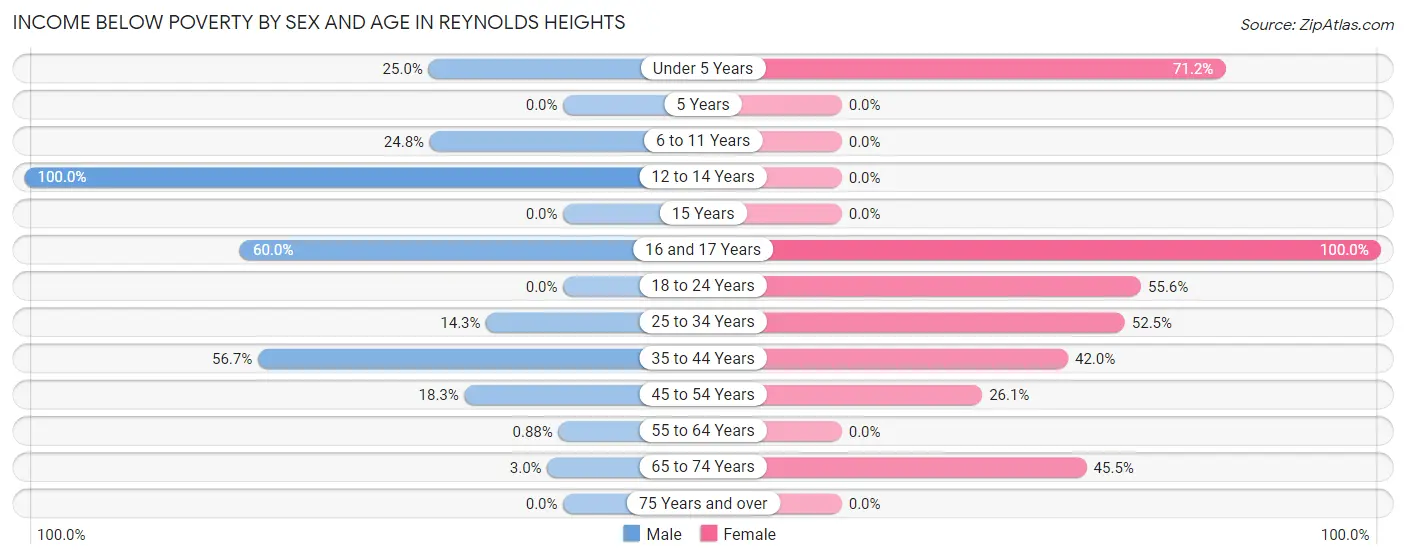
| Age Bracket | Male | Female |
| Under 5 Years | 8 (25.0%) | 37 (71.2%) |
| 5 Years | 0 (0.0%) | 0 (0.0%) |
| 6 to 11 Years | 27 (24.8%) | 0 (0.0%) |
| 12 to 14 Years | 26 (100.0%) | 0 (0.0%) |
| 15 Years | 0 (0.0%) | 0 (0.0%) |
| 16 and 17 Years | 18 (60.0%) | 24 (100.0%) |
| 18 to 24 Years | 0 (0.0%) | 35 (55.6%) |
| 25 to 34 Years | 9 (14.3%) | 31 (52.5%) |
| 35 to 44 Years | 17 (56.7%) | 21 (42.0%) |
| 45 to 54 Years | 33 (18.3%) | 74 (26.1%) |
| 55 to 64 Years | 2 (0.9%) | 0 (0.0%) |
| 65 to 74 Years | 4 (3.0%) | 25 (45.5%) |
| 75 Years and over | 0 (0.0%) | 0 (0.0%) |
| Total | 144 (14.5%) | 247 (25.1%) |
Income Above Poverty by Sex and Age in Reynolds Heights
According to the poverty statistics in Reynolds Heights, males aged 15 years and females aged 5 years are the age groups that are most secure financially, with 100.0% of males and 100.0% of females in these age groups living above the poverty line.
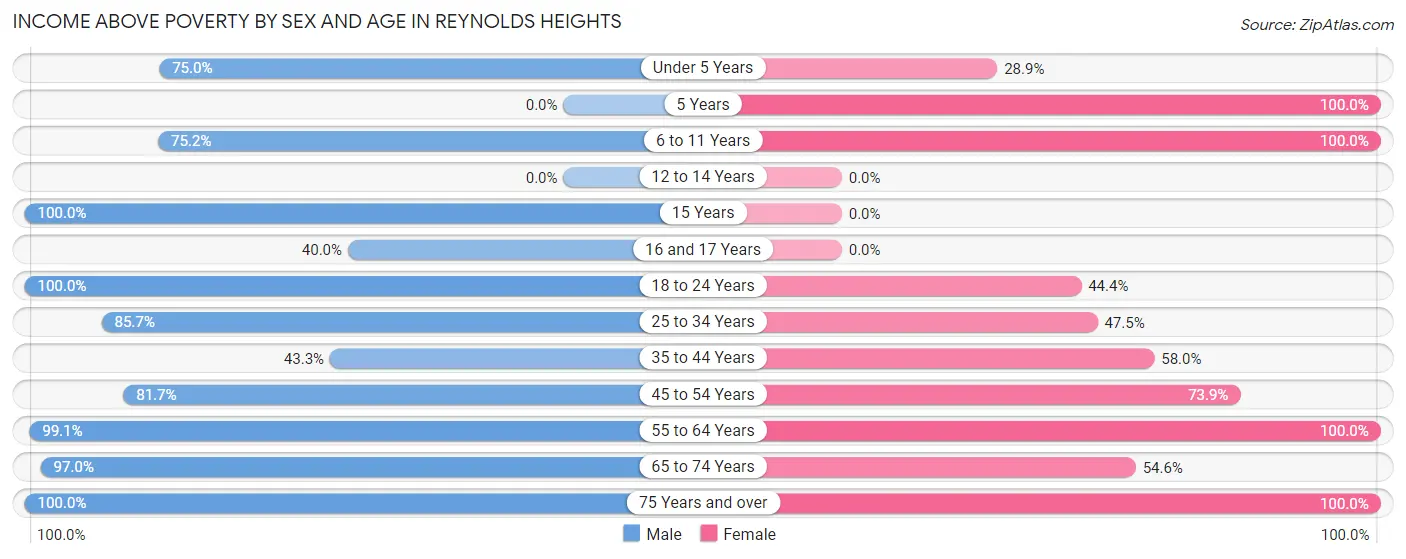
| Age Bracket | Male | Female |
| Under 5 Years | 24 (75.0%) | 15 (28.8%) |
| 5 Years | 0 (0.0%) | 13 (100.0%) |
| 6 to 11 Years | 82 (75.2%) | 46 (100.0%) |
| 12 to 14 Years | 0 (0.0%) | 0 (0.0%) |
| 15 Years | 74 (100.0%) | 0 (0.0%) |
| 16 and 17 Years | 12 (40.0%) | 0 (0.0%) |
| 18 to 24 Years | 15 (100.0%) | 28 (44.4%) |
| 25 to 34 Years | 54 (85.7%) | 28 (47.5%) |
| 35 to 44 Years | 13 (43.3%) | 29 (58.0%) |
| 45 to 54 Years | 147 (81.7%) | 210 (73.9%) |
| 55 to 64 Years | 225 (99.1%) | 266 (100.0%) |
| 65 to 74 Years | 131 (97.0%) | 30 (54.5%) |
| 75 Years and over | 70 (100.0%) | 74 (100.0%) |
| Total | 847 (85.5%) | 739 (75.0%) |
Income Below Poverty Among Married-Couple Families in Reynolds Heights
| Children | Above Poverty | Below Poverty |
| No Children | 246 (100.0%) | 0 (0.0%) |
| 1 or 2 Children | 85 (100.0%) | 0 (0.0%) |
| 3 or 4 Children | 20 (100.0%) | 0 (0.0%) |
| 5 or more Children | 0 (0.0%) | 0 (0.0%) |
| Total | 351 (100.0%) | 0 (0.0%) |
Income Below Poverty Among Single-Parent Households in Reynolds Heights
According to the poverty data in Reynolds Heights, 52.5% or 42 single-father households and 49.4% or 86 single-mother households are living below the poverty line. Among single-father households, those with 1 or 2 children have the highest poverty rate, with 42 households (87.5%) experiencing poverty. Likewise, among single-mother households, those with 1 or 2 children have the highest poverty rate, with 86 households (62.3%) falling below the poverty line.
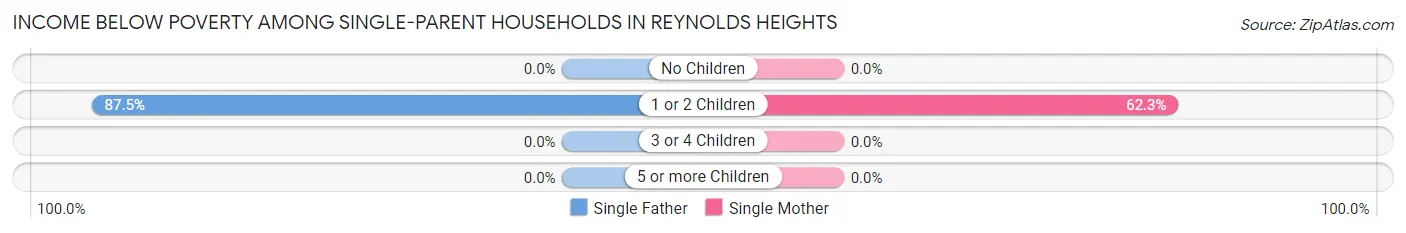
| Children | Single Father | Single Mother |
| No Children | 0 (0.0%) | 0 (0.0%) |
| 1 or 2 Children | 42 (87.5%) | 86 (62.3%) |
| 3 or 4 Children | 0 (0.0%) | 0 (0.0%) |
| 5 or more Children | 0 (0.0%) | 0 (0.0%) |
| Total | 42 (52.5%) | 86 (49.4%) |
Income Below Poverty Among Married-Couple vs Single-Parent Households in Reynolds Heights
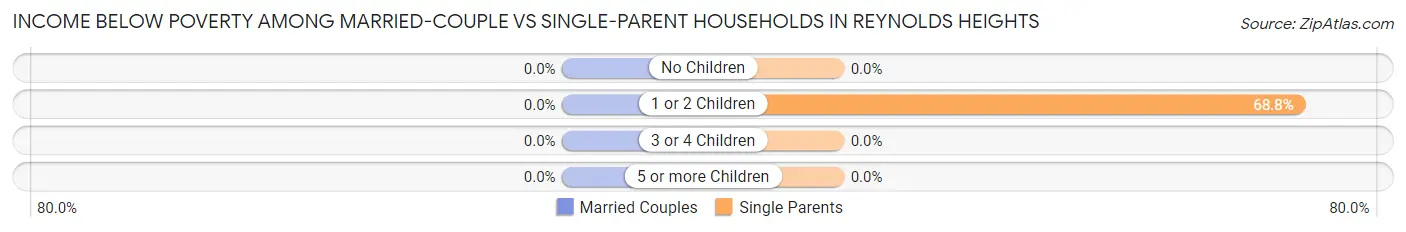
| Children | Married-Couple Families | Single-Parent Households |
| No Children | 0 (0.0%) | 0 (0.0%) |
| 1 or 2 Children | 0 (0.0%) | 128 (68.8%) |
| 3 or 4 Children | 0 (0.0%) | 0 (0.0%) |
| 5 or more Children | 0 (0.0%) | 0 (0.0%) |
| Total | 0 (0.0%) | 128 (50.4%) |
Race in Reynolds Heights
The most populous races in Reynolds Heights are White / Caucasian (1,703 | 86.1%), Two or more Races (208 | 10.5%), and Asian (66 | 3.3%).
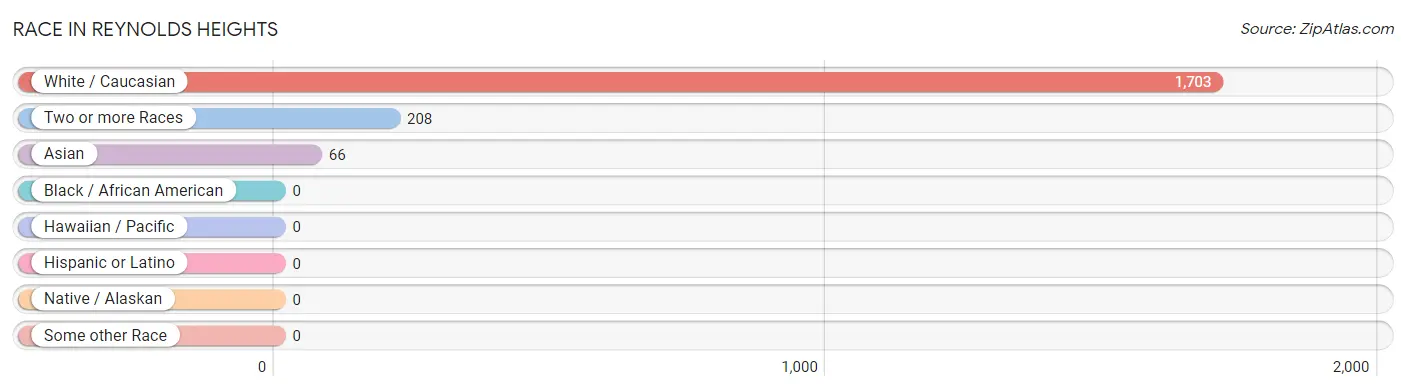
| Race | # Population | % Population |
| Asian | 66 | 3.3% |
| Black / African American | 0 | 0.0% |
| Hawaiian / Pacific | 0 | 0.0% |
| Hispanic or Latino | 0 | 0.0% |
| Native / Alaskan | 0 | 0.0% |
| White / Caucasian | 1,703 | 86.1% |
| Two or more Races | 208 | 10.5% |
| Some other Race | 0 | 0.0% |
| Total | 1,977 | 100.0% |
Ancestry in Reynolds Heights
The most populous ancestries reported in Reynolds Heights are German (451 | 22.8%), Irish (326 | 16.5%), Italian (312 | 15.8%), American (273 | 13.8%), and Polish (200 | 10.1%), together accounting for 79.0% of all Reynolds Heights residents.
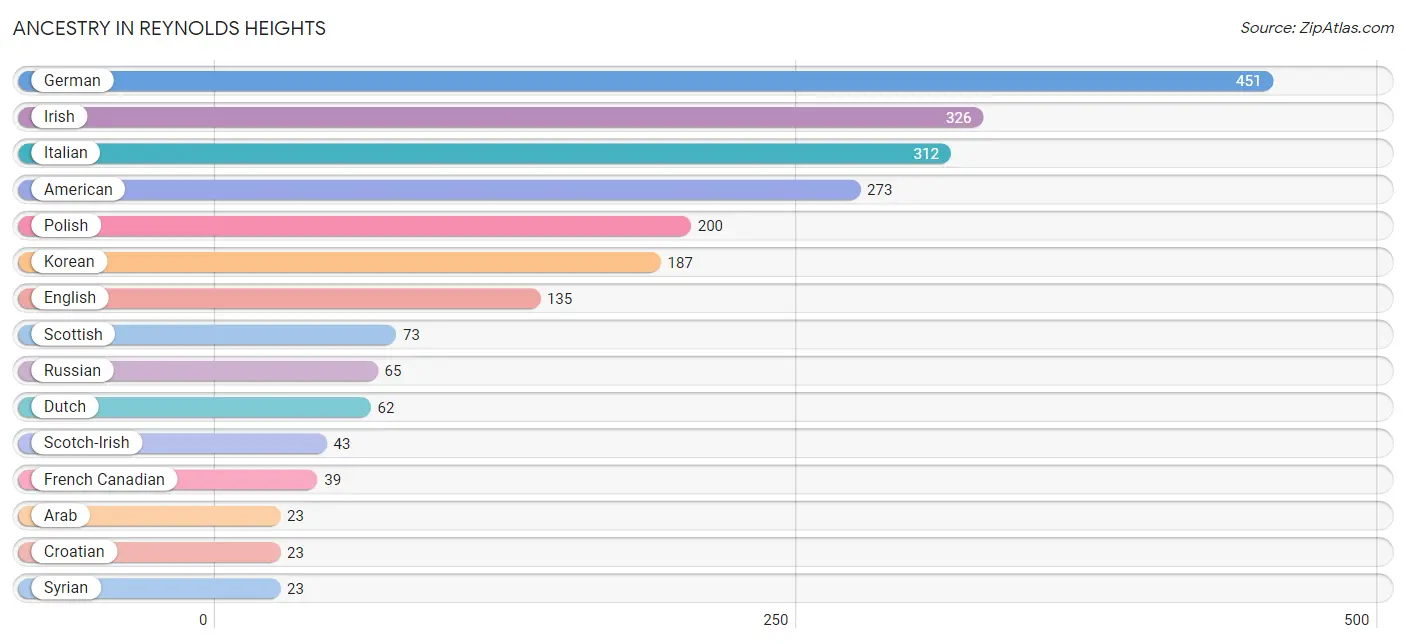
| Ancestry | # Population | % Population |
| American | 273 | 13.8% |
| Arab | 23 | 1.2% |
| Austrian | 5 | 0.3% |
| Croatian | 23 | 1.2% |
| Dutch | 62 | 3.1% |
| English | 135 | 6.8% |
| French Canadian | 39 | 2.0% |
| German | 451 | 22.8% |
| Irish | 326 | 16.5% |
| Italian | 312 | 15.8% |
| Korean | 187 | 9.5% |
| Norwegian | 7 | 0.4% |
| Polish | 200 | 10.1% |
| Russian | 65 | 3.3% |
| Scotch-Irish | 43 | 2.2% |
| Scottish | 73 | 3.7% |
| Slovak | 8 | 0.4% |
| Swedish | 15 | 0.8% |
| Swiss | 16 | 0.8% |
| Syrian | 23 | 1.2% |
| Welsh | 12 | 0.6% | View All 21 Rows |
Immigrants in Reynolds Heights
The most numerous immigrant groups reported in Reynolds Heights came from Asia (66 | 3.3%), Philippines (66 | 3.3%), South Eastern Asia (66 | 3.3%), Eastern Europe (8 | 0.4%), and Europe (8 | 0.4%), together accounting for 10.8% of all Reynolds Heights residents.
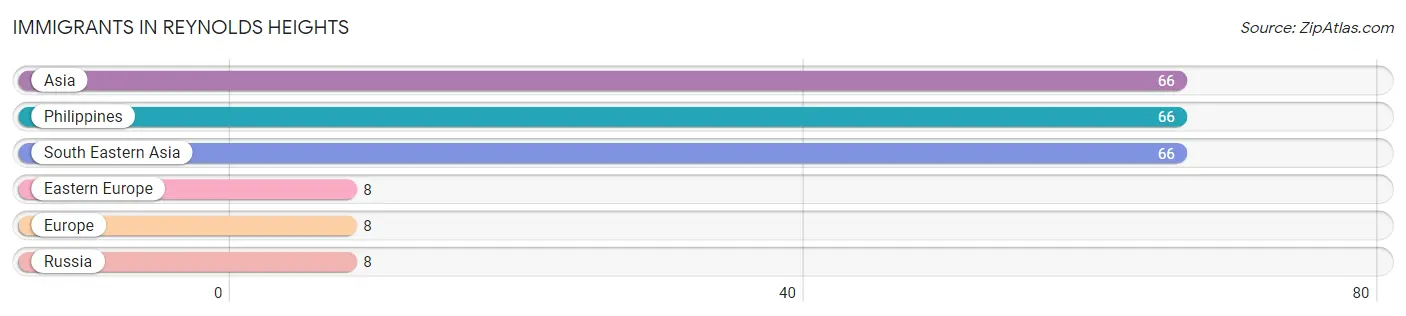
| Immigration Origin | # Population | % Population |
| Asia | 66 | 3.3% |
| Eastern Europe | 8 | 0.4% |
| Europe | 8 | 0.4% |
| Philippines | 66 | 3.3% |
| Russia | 8 | 0.4% |
| South Eastern Asia | 66 | 3.3% | View All 6 Rows |
Sex and Age in Reynolds Heights
Sex and Age in Reynolds Heights
The most populous age groups in Reynolds Heights are 55 to 59 Years (159 | 16.0%) for men and 60 to 64 Years (155 | 15.7%) for women.
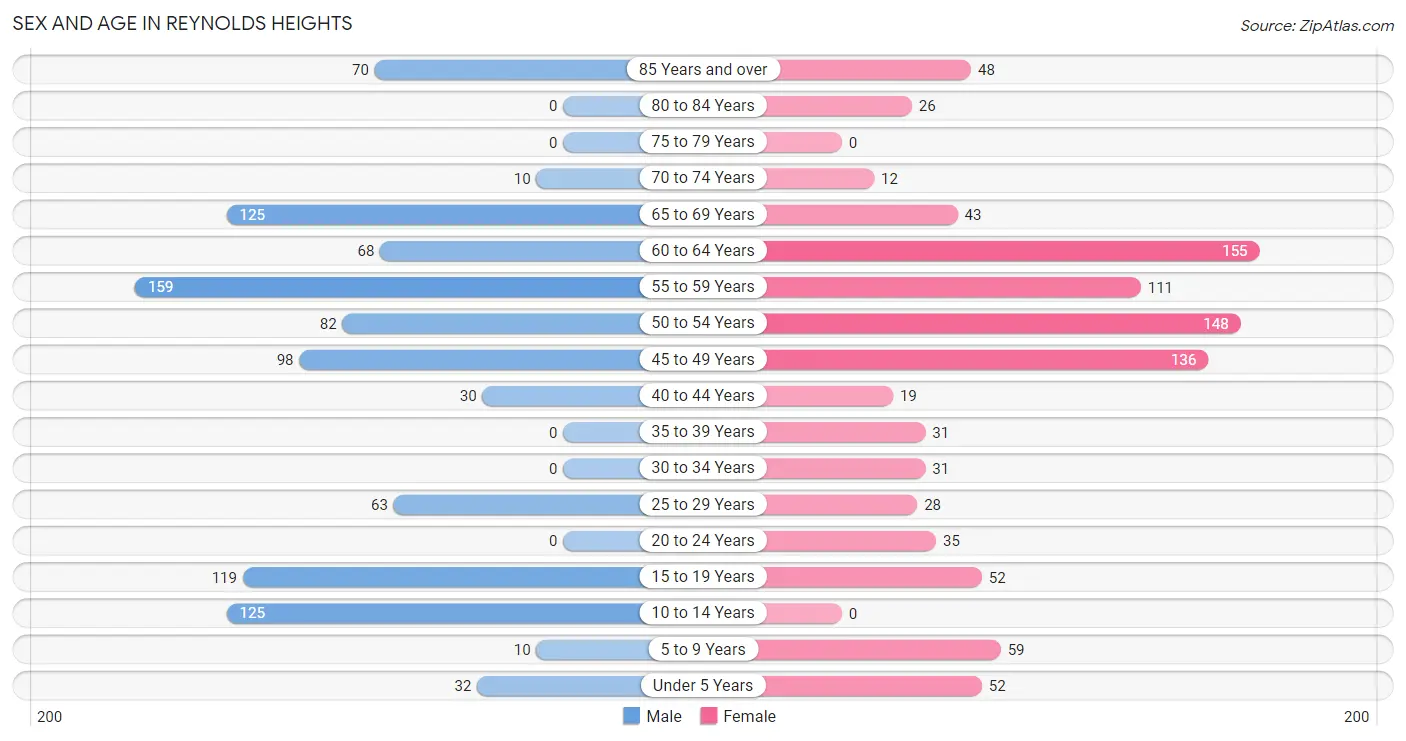
| Age Bracket | Male | Female |
| Under 5 Years | 32 (3.2%) | 52 (5.3%) |
| 5 to 9 Years | 10 (1.0%) | 59 (6.0%) |
| 10 to 14 Years | 125 (12.6%) | 0 (0.0%) |
| 15 to 19 Years | 119 (12.0%) | 52 (5.3%) |
| 20 to 24 Years | 0 (0.0%) | 35 (3.5%) |
| 25 to 29 Years | 63 (6.4%) | 28 (2.8%) |
| 30 to 34 Years | 0 (0.0%) | 31 (3.1%) |
| 35 to 39 Years | 0 (0.0%) | 31 (3.1%) |
| 40 to 44 Years | 30 (3.0%) | 19 (1.9%) |
| 45 to 49 Years | 98 (9.9%) | 136 (13.8%) |
| 50 to 54 Years | 82 (8.3%) | 148 (15.0%) |
| 55 to 59 Years | 159 (16.0%) | 111 (11.3%) |
| 60 to 64 Years | 68 (6.9%) | 155 (15.7%) |
| 65 to 69 Years | 125 (12.6%) | 43 (4.4%) |
| 70 to 74 Years | 10 (1.0%) | 12 (1.2%) |
| 75 to 79 Years | 0 (0.0%) | 0 (0.0%) |
| 80 to 84 Years | 0 (0.0%) | 26 (2.6%) |
| 85 Years and over | 70 (7.1%) | 48 (4.9%) |
| Total | 991 (100.0%) | 986 (100.0%) |
Families and Households in Reynolds Heights
Median Family Size in Reynolds Heights
The median family size in Reynolds Heights is 2.70 persons per family, with married-couple families (351 | 58.0%) accounting for the largest median family size of 3.03 persons per family. On the other hand, single male/father families (80 | 13.2%) represent the smallest median family size with 2.06 persons per family.
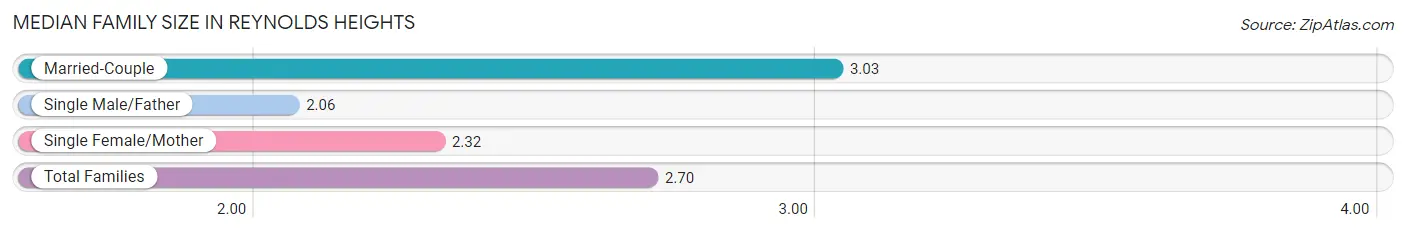
| Family Type | # Families | Family Size |
| Married-Couple | 351 (58.0%) | 3.03 |
| Single Male/Father | 80 (13.2%) | 2.06 |
| Single Female/Mother | 174 (28.8%) | 2.32 |
| Total Families | 605 (100.0%) | 2.70 |
Median Household Size in Reynolds Heights
The median household size in Reynolds Heights is 2.33 persons per household, with married-couple households (351 | 41.5%) accounting for the largest median household size of 3.03 persons per household. non-family households (240 | 28.4%) represent the smallest median household size with 1.34 persons per household.
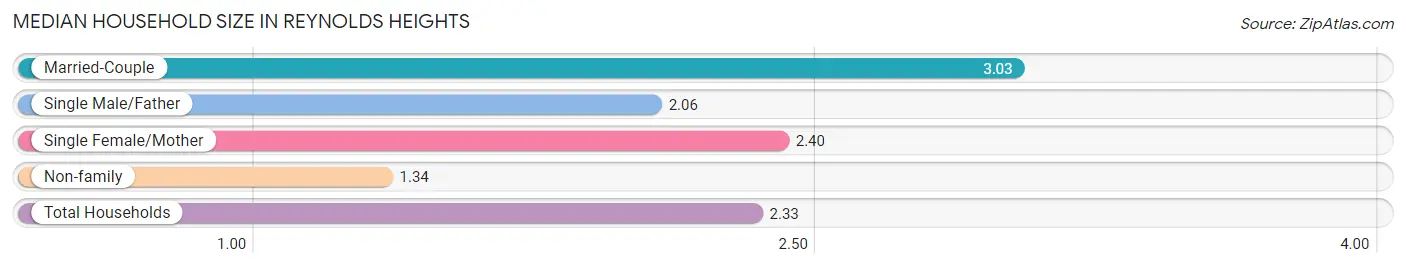
| Household Type | # Households | Household Size |
| Married-Couple | 351 (41.5%) | 3.03 |
| Single Male/Father | 80 (9.5%) | 2.06 |
| Single Female/Mother | 174 (20.6%) | 2.40 |
| Non-family | 240 (28.4%) | 1.34 |
| Total Households | 845 (100.0%) | 2.33 |
Household Size by Marriage Status in Reynolds Heights
Out of a total of 845 households in Reynolds Heights, 605 (71.6%) are family households, while 240 (28.4%) are nonfamily households. The most numerous type of family households are 2-person households, comprising 318, and the most common type of nonfamily households are 1-person households, comprising 168.
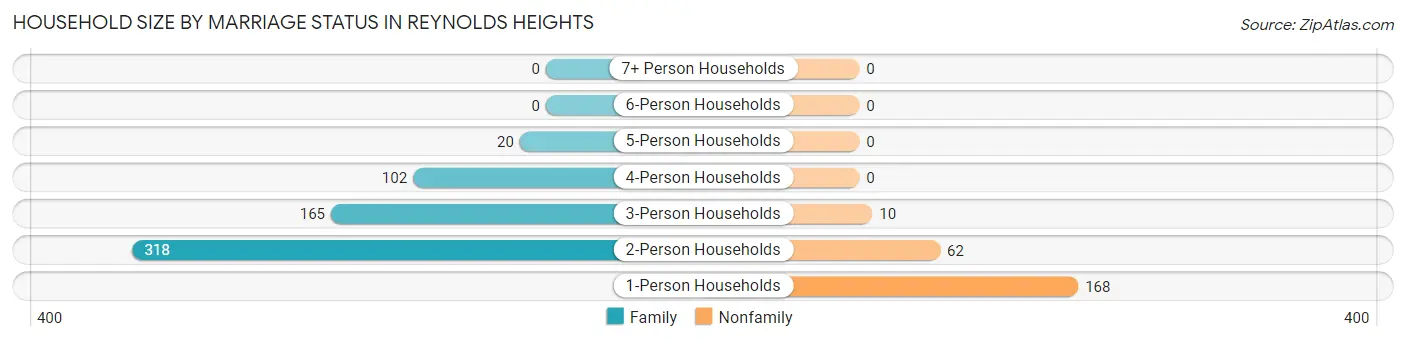
| Household Size | Family Households | Nonfamily Households |
| 1-Person Households | - | 168 (19.9%) |
| 2-Person Households | 318 (37.6%) | 62 (7.3%) |
| 3-Person Households | 165 (19.5%) | 10 (1.2%) |
| 4-Person Households | 102 (12.1%) | 0 (0.0%) |
| 5-Person Households | 20 (2.4%) | 0 (0.0%) |
| 6-Person Households | 0 (0.0%) | 0 (0.0%) |
| 7+ Person Households | 0 (0.0%) | 0 (0.0%) |
| Total | 605 (71.6%) | 240 (28.4%) |
Female Fertility in Reynolds Heights
Fertility by Age in Reynolds Heights
Average fertility rate in Reynolds Heights is 120.0 births per 1,000 women. Women in the age bracket of 20 to 34 years have the highest fertility rate with 479.0 births per 1,000 women. Women in the age bracket of 20 to 34 years acount for 100.0% of all women with births.
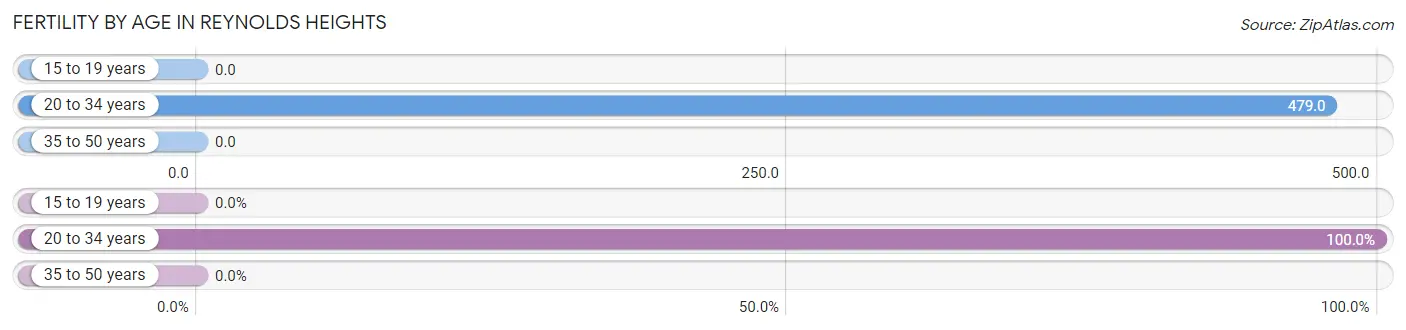
| Age Bracket | Women with Births | Births / 1,000 Women |
| 15 to 19 years | 0 (0.0%) | 0.0 |
| 20 to 34 years | 45 (100.0%) | 479.0 |
| 35 to 50 years | 0 (0.0%) | 0.0 |
| Total | 45 (100.0%) | 120.0 |
Fertility by Age by Marriage Status in Reynolds Heights
62.2% of women with births (45) in Reynolds Heights are married. The highest percentage of unmarried women with births falls into 20 to 34 years age bracket with 37.8% of them unmarried at the time of birth, while the lowest percentage of unmarried women with births belong to 20 to 34 years age bracket with 37.8% of them unmarried.
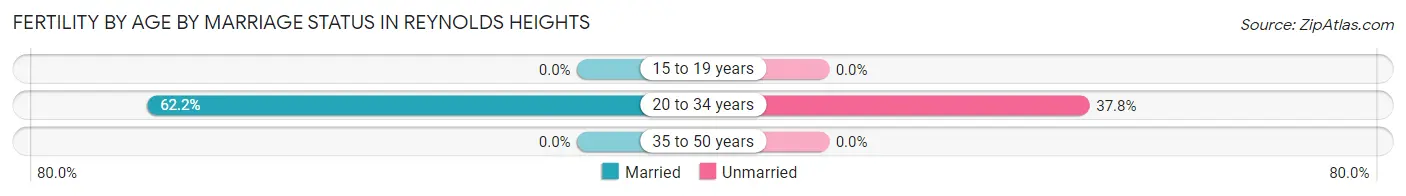
| Age Bracket | Married | Unmarried |
| 15 to 19 years | 0 (0.0%) | 0 (0.0%) |
| 20 to 34 years | 28 (62.2%) | 17 (37.8%) |
| 35 to 50 years | 0 (0.0%) | 0 (0.0%) |
| Total | 28 (62.2%) | 17 (37.8%) |
Fertility by Education in Reynolds Heights
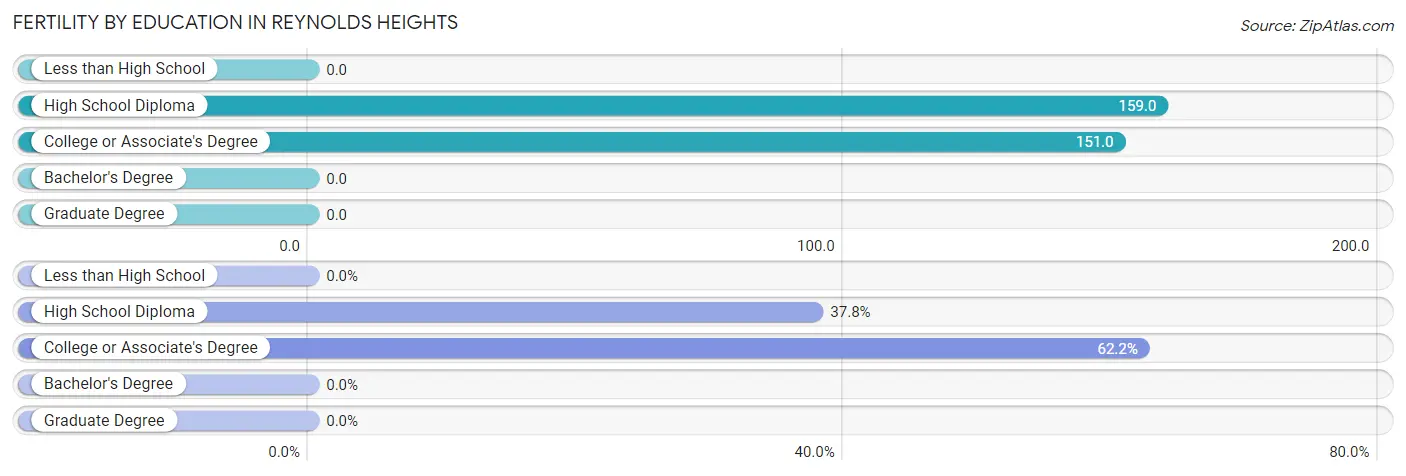
| Educational Attainment | Women with Births | Births / 1,000 Women |
| Less than High School | 0 (0.0%) | 0.0 |
| High School Diploma | 17 (37.8%) | 159.0 |
| College or Associate's Degree | 28 (62.2%) | 151.0 |
| Bachelor's Degree | 0 (0.0%) | 0.0 |
| Graduate Degree | 0 (0.0%) | 0.0 |
| Total | 45 (100.0%) | 120.0 |
Fertility by Education by Marriage Status in Reynolds Heights
37.8% of women with births in Reynolds Heights are unmarried. Women with the educational attainment of college or associate's degree are most likely to be married with 100.0% of them married at childbirth, while women with the educational attainment of high school diploma are least likely to be married with 100.0% of them unmarried at childbirth.
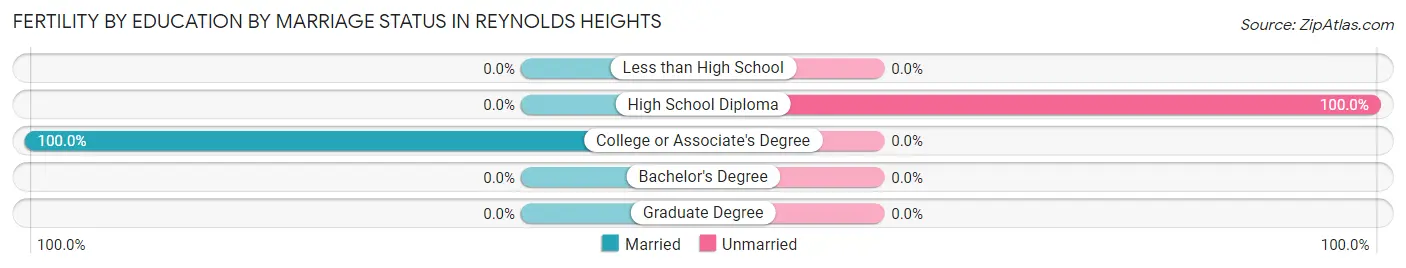
| Educational Attainment | Married | Unmarried |
| Less than High School | 0 (0.0%) | 0 (0.0%) |
| High School Diploma | 0 (0.0%) | 17 (100.0%) |
| College or Associate's Degree | 28 (100.0%) | 0 (0.0%) |
| Bachelor's Degree | 0 (0.0%) | 0 (0.0%) |
| Graduate Degree | 0 (0.0%) | 0 (0.0%) |
| Total | 28 (62.2%) | 17 (37.8%) |
Employment Characteristics in Reynolds Heights
Employment by Class of Employer in Reynolds Heights
Among the 932 employed individuals in Reynolds Heights, private company employees (737 | 79.1%), not-for-profit organizations (81 | 8.7%), and federal government employees (66 | 7.1%) make up the most common classes of employment.
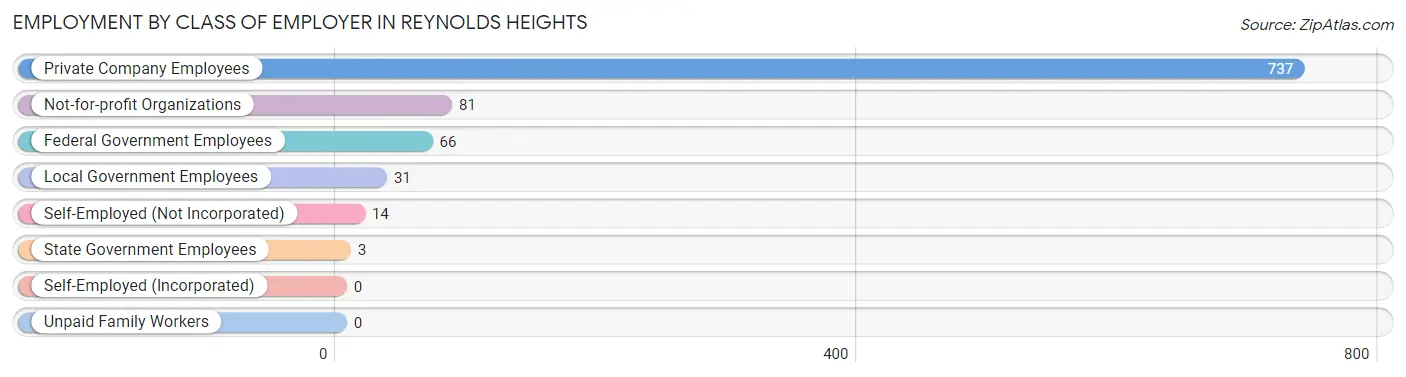
| Employer Class | # Employees | % Employees |
| Private Company Employees | 737 | 79.1% |
| Self-Employed (Incorporated) | 0 | 0.0% |
| Self-Employed (Not Incorporated) | 14 | 1.5% |
| Not-for-profit Organizations | 81 | 8.7% |
| Local Government Employees | 31 | 3.3% |
| State Government Employees | 3 | 0.3% |
| Federal Government Employees | 66 | 7.1% |
| Unpaid Family Workers | 0 | 0.0% |
| Total | 932 | 100.0% |
Employment Status by Age in Reynolds Heights
According to the labor force statistics for Reynolds Heights, out of the total population over 16 years of age (1,625), 60.2% or 978 individuals are in the labor force, with 4.2% or 41 of them unemployed. The age group with the highest labor force participation rate is 25 to 29 years, with 100.0% or 91 individuals in the labor force. Within the labor force, the 25 to 29 years age range has the highest percentage of unemployed individuals, with 31.9% or 29 of them being unemployed.
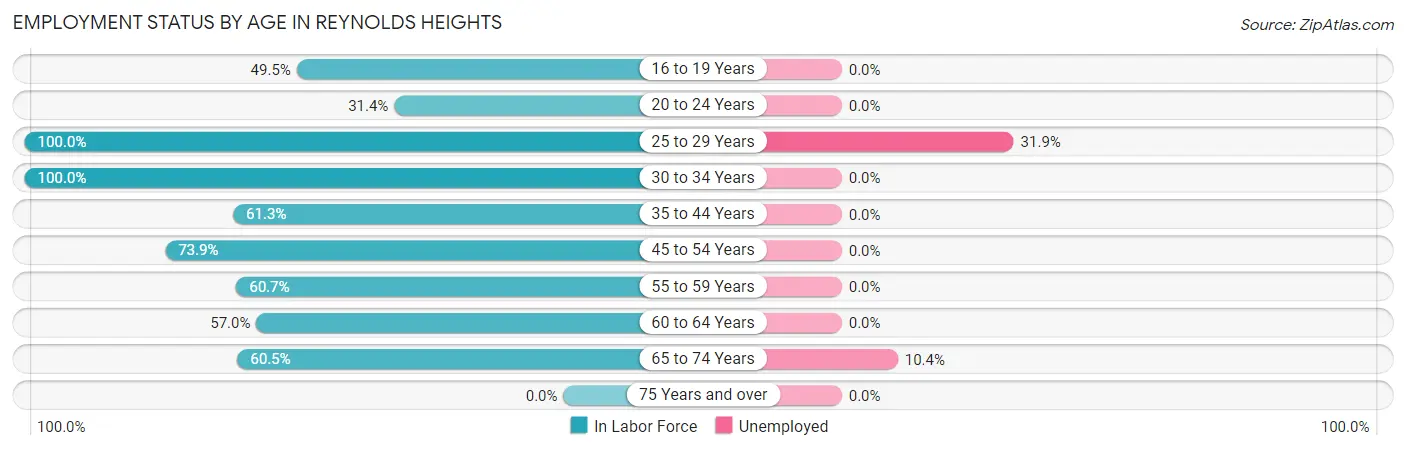
| Age Bracket | In Labor Force | Unemployed |
| 16 to 19 Years | 48 (49.5%) | 0 (0.0%) |
| 20 to 24 Years | 11 (31.4%) | 0 (0.0%) |
| 25 to 29 Years | 91 (100.0%) | 29 (31.9%) |
| 30 to 34 Years | 31 (100.0%) | 0 (0.0%) |
| 35 to 44 Years | 49 (61.3%) | 0 (0.0%) |
| 45 to 54 Years | 343 (73.9%) | 0 (0.0%) |
| 55 to 59 Years | 164 (60.7%) | 0 (0.0%) |
| 60 to 64 Years | 127 (57.0%) | 0 (0.0%) |
| 65 to 74 Years | 115 (60.5%) | 12 (10.4%) |
| 75 Years and over | 0 (0.0%) | 0 (0.0%) |
| Total | 978 (60.2%) | 41 (4.2%) |
Employment Status by Educational Attainment in Reynolds Heights
According to labor force statistics for Reynolds Heights, 69.5% of individuals (806) out of the total population between 25 and 64 years of age (1,159) are in the labor force, with 3.6% or 29 of them being unemployed. The group with the highest labor force participation rate are those with the educational attainment of bachelor's degree or higher, with 90.3% or 93 individuals in the labor force. Within the labor force, individuals with college / associate degree education have the highest percentage of unemployment, with 7.0% or 29 of them being unemployed.
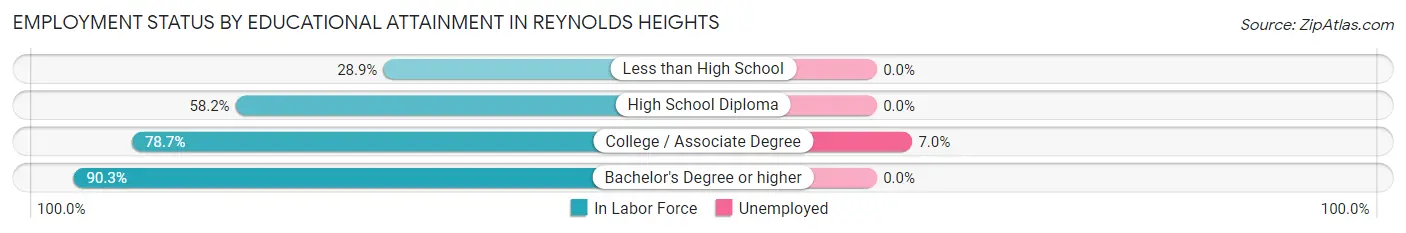
| Educational Attainment | In Labor Force | Unemployed |
| Less than High School | 11 (28.9%) | 0 (0.0%) |
| High School Diploma | 286 (58.2%) | 0 (0.0%) |
| College / Associate Degree | 415 (78.7%) | 37 (7.0%) |
| Bachelor's Degree or higher | 93 (90.3%) | 0 (0.0%) |
| Total | 806 (69.5%) | 42 (3.6%) |
Employment Occupations by Sex in Reynolds Heights
Management, Business, Science and Arts Occupations
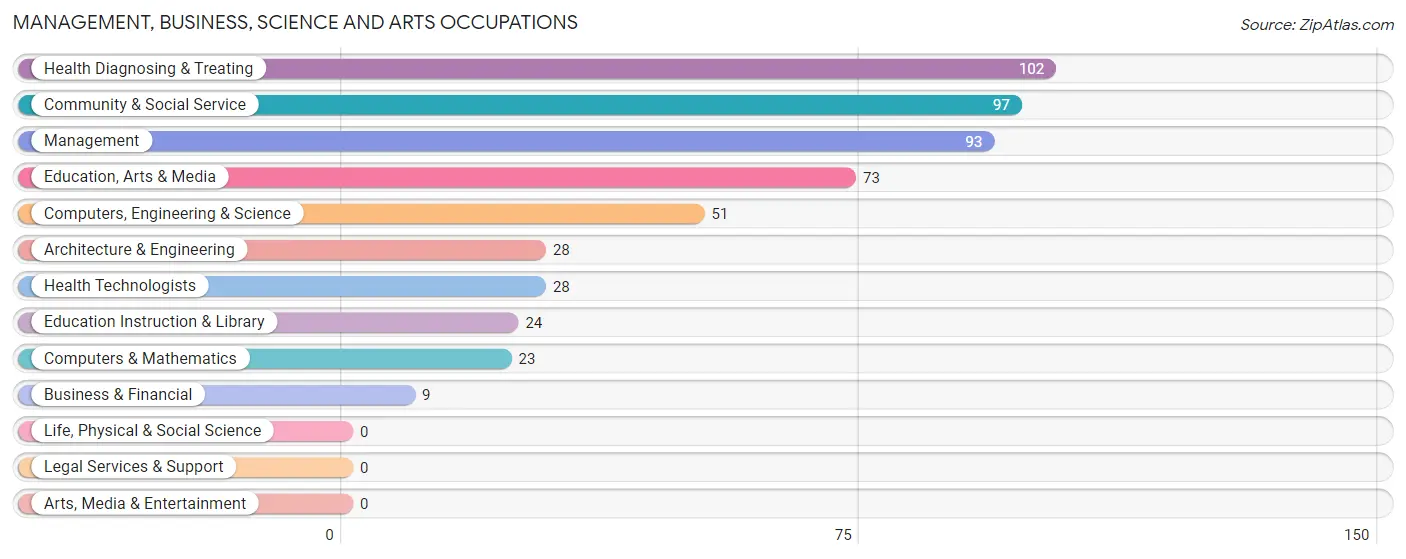
The most common Management, Business, Science and Arts occupations in Reynolds Heights are Health Diagnosing & Treating (102 | 10.9%), Community & Social Service (97 | 10.3%), Management (93 | 9.9%), Education, Arts & Media (73 | 7.8%), and Computers, Engineering & Science (51 | 5.4%).
Management, Business, Science and Arts Occupations by Sex
Within the Management, Business, Science and Arts occupations in Reynolds Heights, the most male-oriented occupations are Computers, Engineering & Science (100.0%), Computers & Mathematics (100.0%), and Architecture & Engineering (100.0%), while the most female-oriented occupations are Business & Financial (100.0%), Health Diagnosing & Treating (100.0%), and Health Technologists (100.0%).
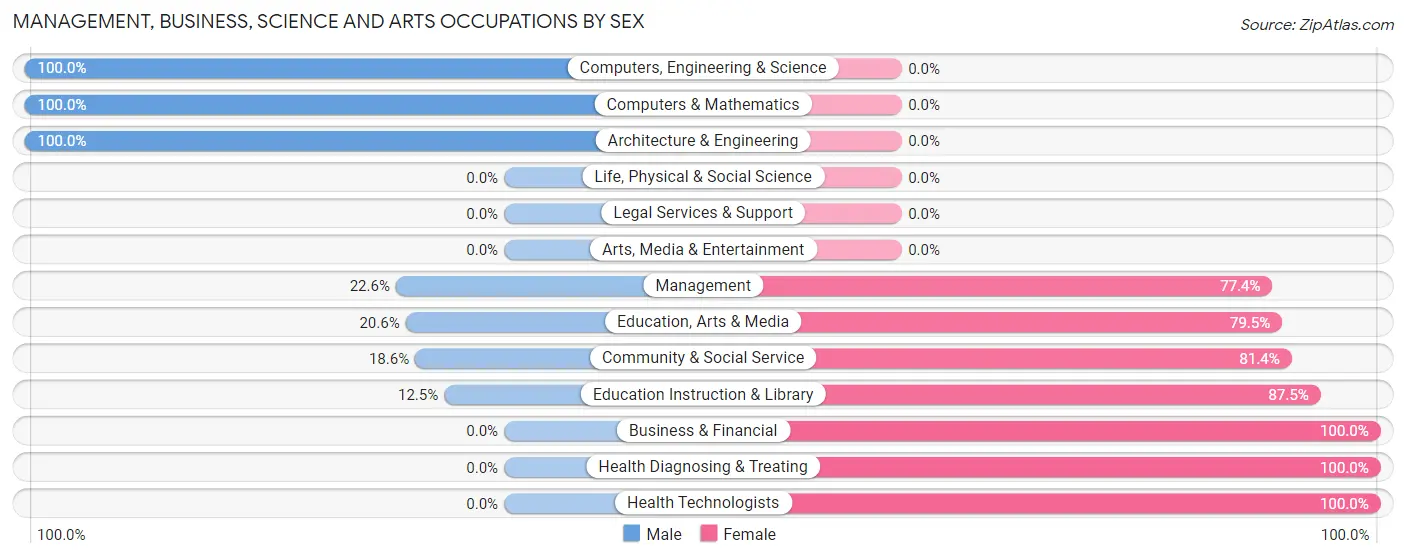
| Occupation | Male | Female |
| Management | 21 (22.6%) | 72 (77.4%) |
| Business & Financial | 0 (0.0%) | 9 (100.0%) |
| Computers, Engineering & Science | 51 (100.0%) | 0 (0.0%) |
| Computers & Mathematics | 23 (100.0%) | 0 (0.0%) |
| Architecture & Engineering | 28 (100.0%) | 0 (0.0%) |
| Life, Physical & Social Science | 0 (0.0%) | 0 (0.0%) |
| Community & Social Service | 18 (18.6%) | 79 (81.4%) |
| Education, Arts & Media | 15 (20.5%) | 58 (79.4%) |
| Legal Services & Support | 0 (0.0%) | 0 (0.0%) |
| Education Instruction & Library | 3 (12.5%) | 21 (87.5%) |
| Arts, Media & Entertainment | 0 (0.0%) | 0 (0.0%) |
| Health Diagnosing & Treating | 0 (0.0%) | 102 (100.0%) |
| Health Technologists | 0 (0.0%) | 28 (100.0%) |
| Total (Category) | 90 (25.6%) | 262 (74.4%) |
| Total (Overall) | 399 (42.5%) | 539 (57.5%) |
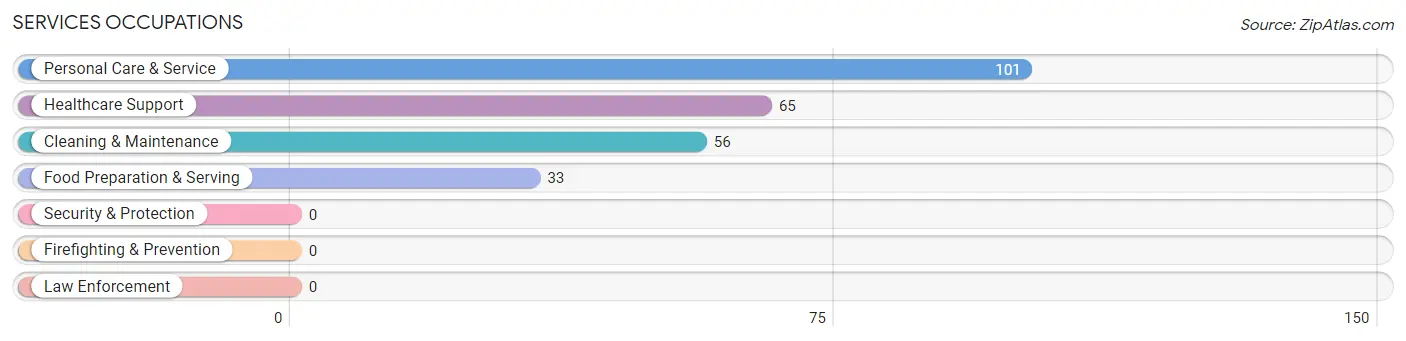
Services Occupations
The most common Services occupations in Reynolds Heights are Personal Care & Service (101 | 10.8%), Healthcare Support (65 | 6.9%), Cleaning & Maintenance (56 | 6.0%), and Food Preparation & Serving (33 | 3.5%).
Services Occupations by Sex
Within the Services occupations in Reynolds Heights, the most male-oriented occupations are Food Preparation & Serving (54.5%), and Cleaning & Maintenance (46.4%), while the most female-oriented occupations are Healthcare Support (100.0%), Personal Care & Service (100.0%), and Cleaning & Maintenance (53.6%).
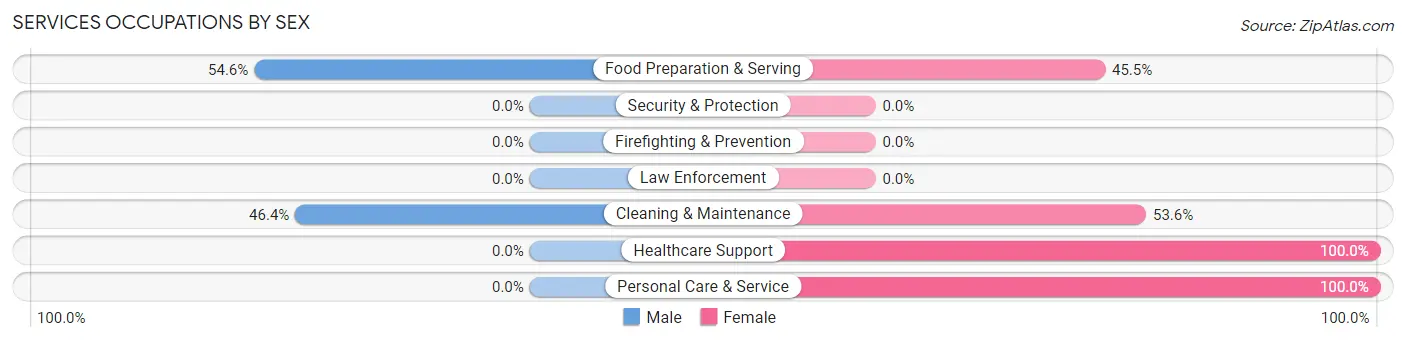
| Occupation | Male | Female |
| Healthcare Support | 0 (0.0%) | 65 (100.0%) |
| Security & Protection | 0 (0.0%) | 0 (0.0%) |
| Firefighting & Prevention | 0 (0.0%) | 0 (0.0%) |
| Law Enforcement | 0 (0.0%) | 0 (0.0%) |
| Food Preparation & Serving | 18 (54.5%) | 15 (45.5%) |
| Cleaning & Maintenance | 26 (46.4%) | 30 (53.6%) |
| Personal Care & Service | 0 (0.0%) | 101 (100.0%) |
| Total (Category) | 44 (17.2%) | 211 (82.8%) |
| Total (Overall) | 399 (42.5%) | 539 (57.5%) |
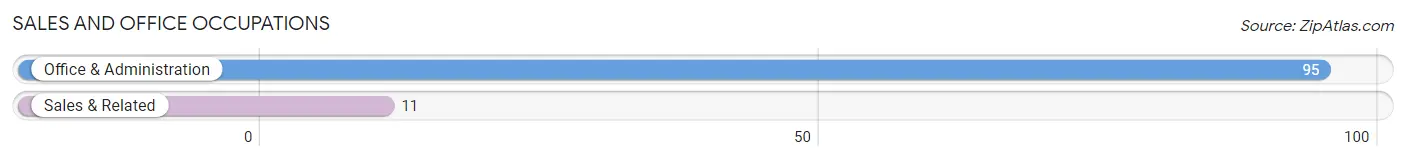
Sales and Office Occupations
The most common Sales and Office occupations in Reynolds Heights are Office & Administration (95 | 10.1%), and Sales & Related (11 | 1.2%).
Sales and Office Occupations by Sex
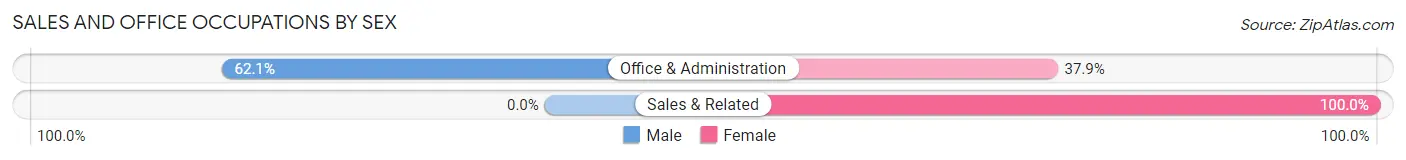
| Occupation | Male | Female |
| Sales & Related | 0 (0.0%) | 11 (100.0%) |
| Office & Administration | 59 (62.1%) | 36 (37.9%) |
| Total (Category) | 59 (55.7%) | 47 (44.3%) |
| Total (Overall) | 399 (42.5%) | 539 (57.5%) |
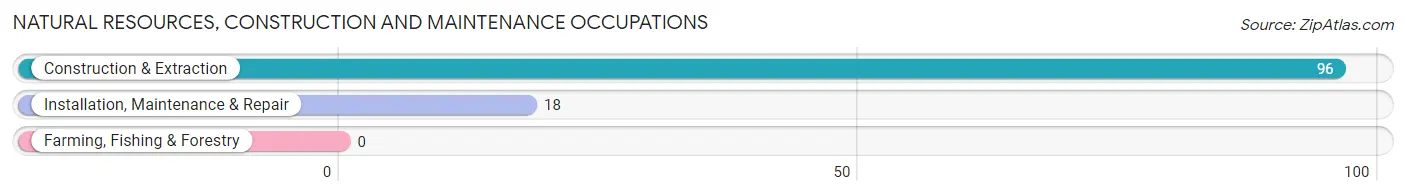
Natural Resources, Construction and Maintenance Occupations
The most common Natural Resources, Construction and Maintenance occupations in Reynolds Heights are Construction & Extraction (96 | 10.2%), and Installation, Maintenance & Repair (18 | 1.9%).
Natural Resources, Construction and Maintenance Occupations by Sex
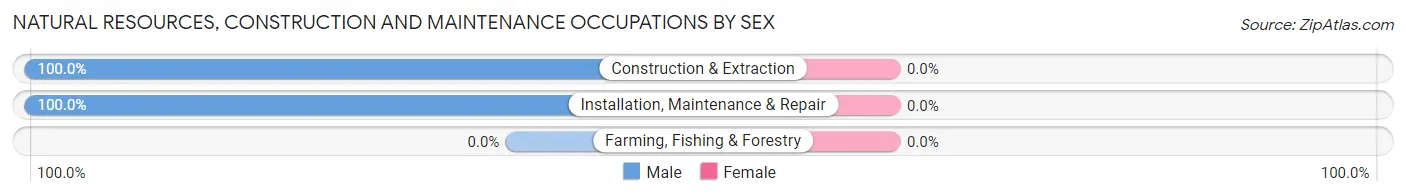
| Occupation | Male | Female |
| Farming, Fishing & Forestry | 0 (0.0%) | 0 (0.0%) |
| Construction & Extraction | 96 (100.0%) | 0 (0.0%) |
| Installation, Maintenance & Repair | 18 (100.0%) | 0 (0.0%) |
| Total (Category) | 114 (100.0%) | 0 (0.0%) |
| Total (Overall) | 399 (42.5%) | 539 (57.5%) |
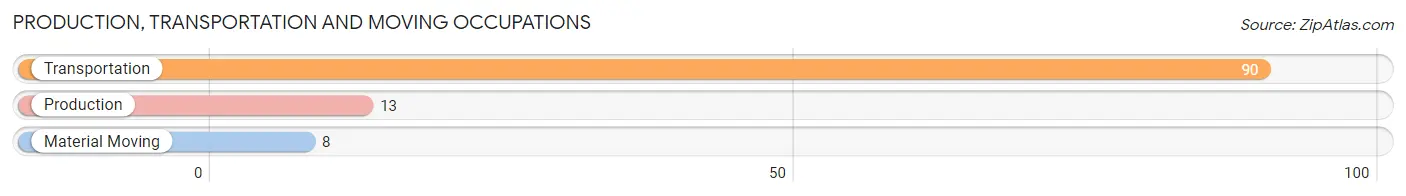
Production, Transportation and Moving Occupations
The most common Production, Transportation and Moving occupations in Reynolds Heights are Transportation (90 | 9.6%), Production (13 | 1.4%), and Material Moving (8 | 0.9%).
Production, Transportation and Moving Occupations by Sex
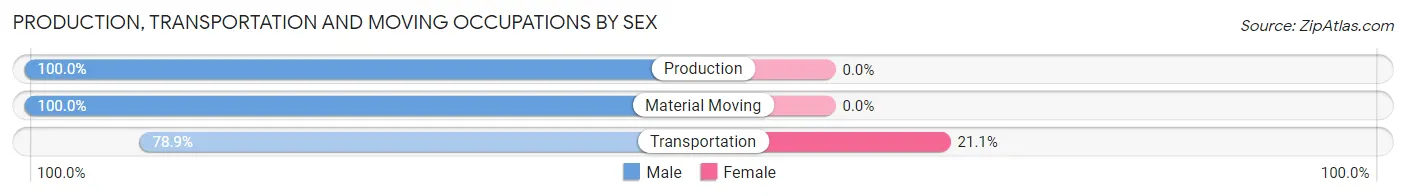
| Occupation | Male | Female |
| Production | 13 (100.0%) | 0 (0.0%) |
| Transportation | 71 (78.9%) | 19 (21.1%) |
| Material Moving | 8 (100.0%) | 0 (0.0%) |
| Total (Category) | 92 (82.9%) | 19 (17.1%) |
| Total (Overall) | 399 (42.5%) | 539 (57.5%) |
Employment Industries by Sex in Reynolds Heights
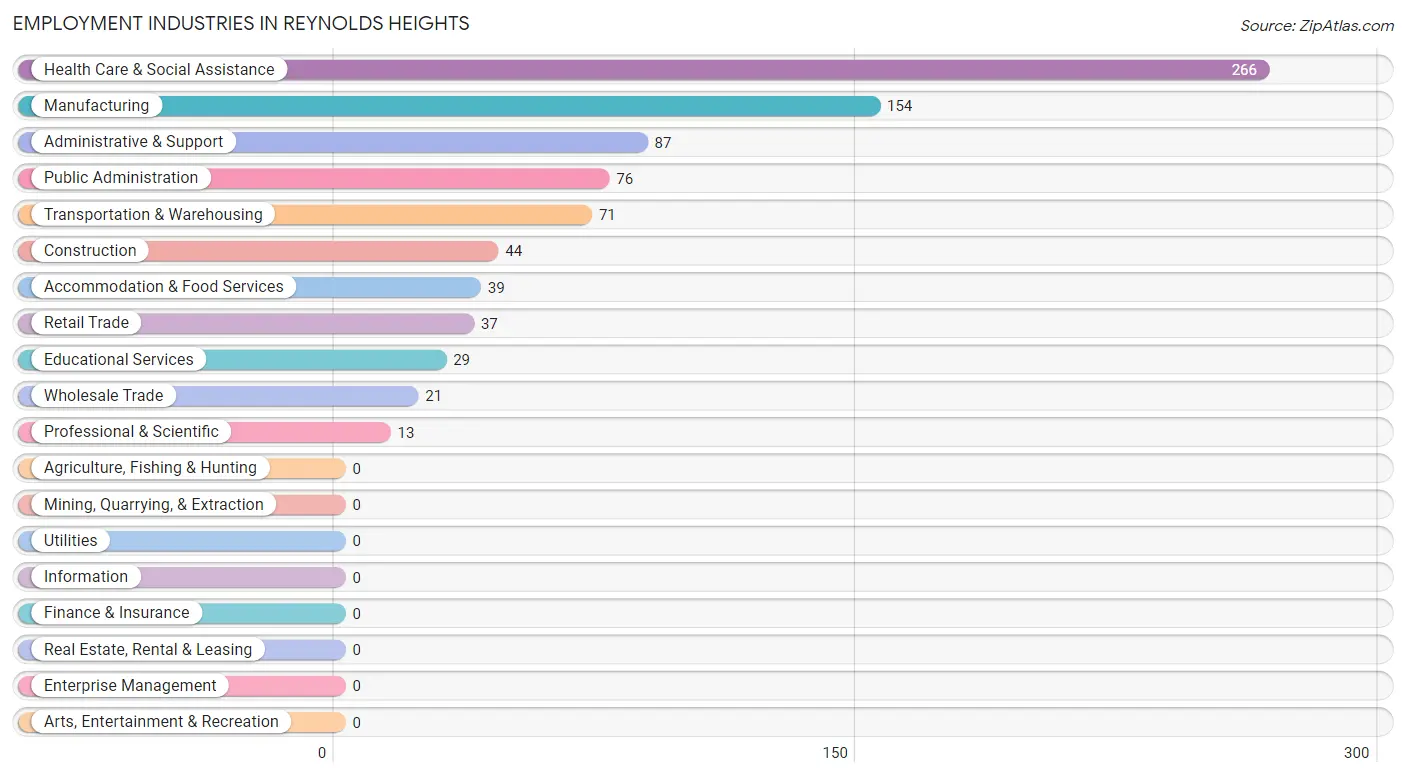
Employment Industries in Reynolds Heights
The major employment industries in Reynolds Heights include Health Care & Social Assistance (266 | 28.4%), Manufacturing (154 | 16.4%), Administrative & Support (87 | 9.3%), Public Administration (76 | 8.1%), and Transportation & Warehousing (71 | 7.6%).
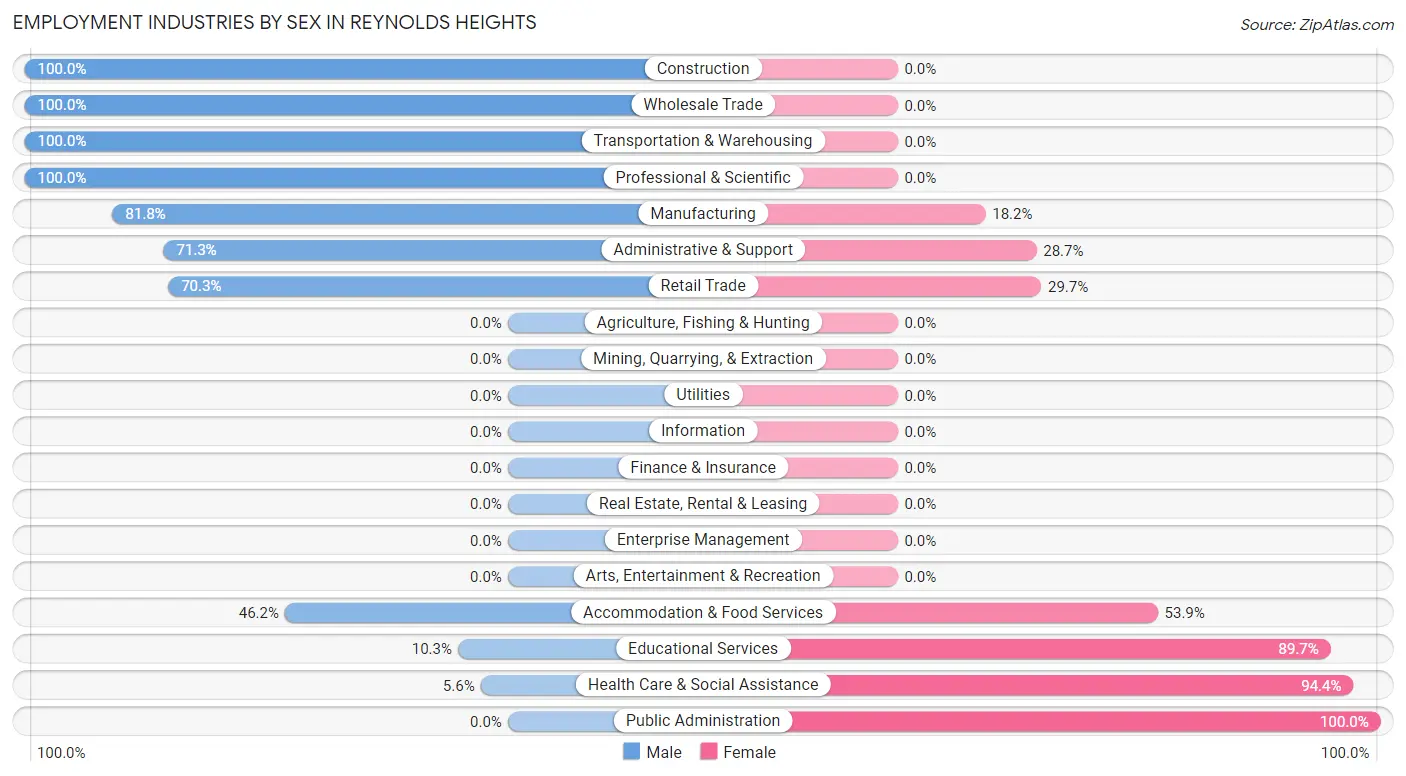
Employment Industries by Sex in Reynolds Heights
The Reynolds Heights industries that see more men than women are Construction (100.0%), Wholesale Trade (100.0%), and Transportation & Warehousing (100.0%), whereas the industries that tend to have a higher number of women are Public Administration (100.0%), Health Care & Social Assistance (94.4%), and Educational Services (89.7%).
| Industry | Male | Female |
| Agriculture, Fishing & Hunting | 0 (0.0%) | 0 (0.0%) |
| Mining, Quarrying, & Extraction | 0 (0.0%) | 0 (0.0%) |
| Construction | 44 (100.0%) | 0 (0.0%) |
| Manufacturing | 126 (81.8%) | 28 (18.2%) |
| Wholesale Trade | 21 (100.0%) | 0 (0.0%) |
| Retail Trade | 26 (70.3%) | 11 (29.7%) |
| Transportation & Warehousing | 71 (100.0%) | 0 (0.0%) |
| Utilities | 0 (0.0%) | 0 (0.0%) |
| Information | 0 (0.0%) | 0 (0.0%) |
| Finance & Insurance | 0 (0.0%) | 0 (0.0%) |
| Real Estate, Rental & Leasing | 0 (0.0%) | 0 (0.0%) |
| Professional & Scientific | 13 (100.0%) | 0 (0.0%) |
| Enterprise Management | 0 (0.0%) | 0 (0.0%) |
| Administrative & Support | 62 (71.3%) | 25 (28.7%) |
| Educational Services | 3 (10.3%) | 26 (89.7%) |
| Health Care & Social Assistance | 15 (5.6%) | 251 (94.4%) |
| Arts, Entertainment & Recreation | 0 (0.0%) | 0 (0.0%) |
| Accommodation & Food Services | 18 (46.2%) | 21 (53.8%) |
| Public Administration | 0 (0.0%) | 76 (100.0%) |
| Total | 399 (42.5%) | 539 (57.5%) |
Education in Reynolds Heights
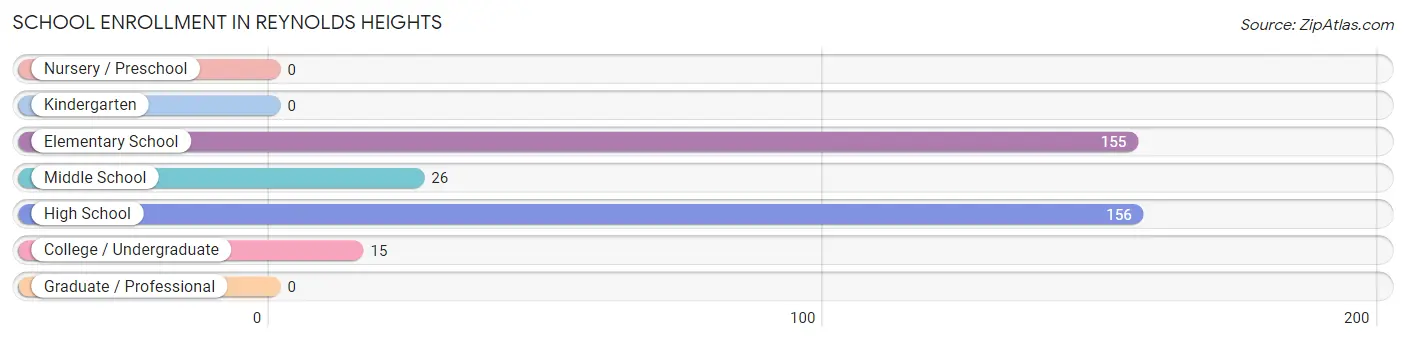
School Enrollment in Reynolds Heights
The most common levels of schooling among the 352 students in Reynolds Heights are high school (156 | 44.3%), elementary school (155 | 44.0%), and middle school (26 | 7.4%).
| School Level | # Students | % Students |
| Nursery / Preschool | 0 | 0.0% |
| Kindergarten | 0 | 0.0% |
| Elementary School | 155 | 44.0% |
| Middle School | 26 | 7.4% |
| High School | 156 | 44.3% |
| College / Undergraduate | 15 | 4.3% |
| Graduate / Professional | 0 | 0.0% |
| Total | 352 | 100.0% |
School Enrollment by Age by Funding Source in Reynolds Heights
Out of a total of 352 students who are enrolled in schools in Reynolds Heights, 24 (6.8%) attend a private institution, while the remaining 328 (93.2%) are enrolled in public schools. The age group of 15 to 17 year olds has the highest likelihood of being enrolled in private schools, with 24 (18.8% in the age bracket) enrolled. Conversely, the age group of 5 to 9 year old has the lowest likelihood of being enrolled in a private school, with 56 (100.0% in the age bracket) attending a public institution.
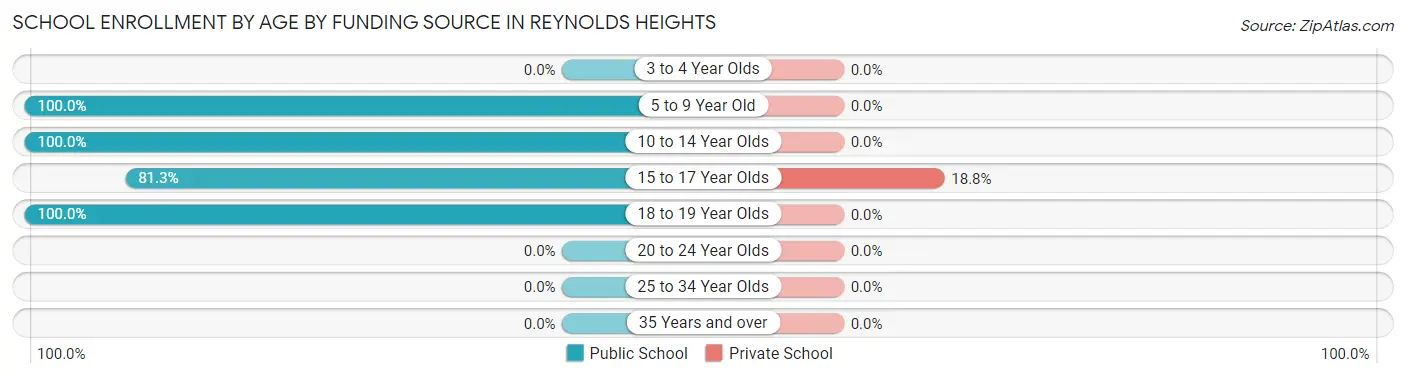
| Age Bracket | Public School | Private School |
| 3 to 4 Year Olds | 0 (0.0%) | 0 (0.0%) |
| 5 to 9 Year Old | 56 (100.0%) | 0 (0.0%) |
| 10 to 14 Year Olds | 125 (100.0%) | 0 (0.0%) |
| 15 to 17 Year Olds | 104 (81.2%) | 24 (18.8%) |
| 18 to 19 Year Olds | 43 (100.0%) | 0 (0.0%) |
| 20 to 24 Year Olds | 0 (0.0%) | 0 (0.0%) |
| 25 to 34 Year Olds | 0 (0.0%) | 0 (0.0%) |
| 35 Years and over | 0 (0.0%) | 0 (0.0%) |
| Total | 328 (93.2%) | 24 (6.8%) |
Educational Attainment by Field of Study in Reynolds Heights
Social sciences (64 | 52.5%), education (21 | 17.2%), science & technology (14 | 11.5%), liberal arts & history (10 | 8.2%), and arts & humanities (10 | 8.2%) are the most common fields of study among 122 individuals in Reynolds Heights who have obtained a bachelor's degree or higher.
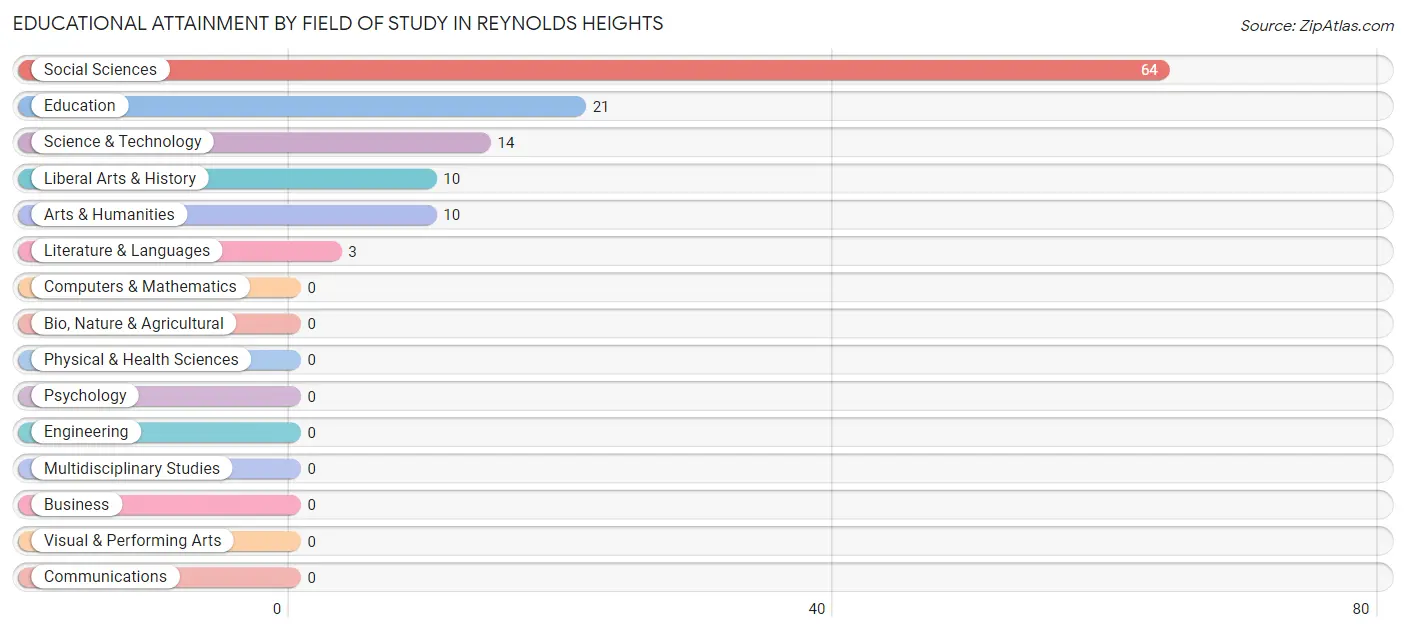
| Field of Study | # Graduates | % Graduates |
| Computers & Mathematics | 0 | 0.0% |
| Bio, Nature & Agricultural | 0 | 0.0% |
| Physical & Health Sciences | 0 | 0.0% |
| Psychology | 0 | 0.0% |
| Social Sciences | 64 | 52.5% |
| Engineering | 0 | 0.0% |
| Multidisciplinary Studies | 0 | 0.0% |
| Science & Technology | 14 | 11.5% |
| Business | 0 | 0.0% |
| Education | 21 | 17.2% |
| Literature & Languages | 3 | 2.5% |
| Liberal Arts & History | 10 | 8.2% |
| Visual & Performing Arts | 0 | 0.0% |
| Communications | 0 | 0.0% |
| Arts & Humanities | 10 | 8.2% |
| Total | 122 | 100.0% |
Transportation & Commute in Reynolds Heights
Vehicle Availability by Sex in Reynolds Heights
The most prevalent vehicle ownership categories in Reynolds Heights are males with 2 vehicles (221, accounting for 55.8%) and females with 2 vehicles (163, making up 41.5%).
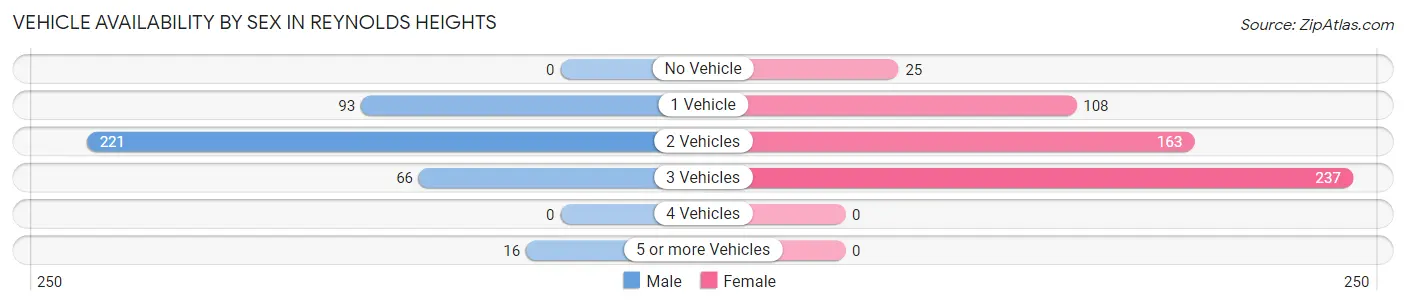
| Vehicles Available | Male | Female |
| No Vehicle | 0 (0.0%) | 25 (4.7%) |
| 1 Vehicle | 93 (23.5%) | 108 (20.3%) |
| 2 Vehicles | 221 (55.8%) | 163 (30.6%) |
| 3 Vehicles | 66 (16.7%) | 237 (44.5%) |
| 4 Vehicles | 0 (0.0%) | 0 (0.0%) |
| 5 or more Vehicles | 16 (4.0%) | 0 (0.0%) |
| Total | 396 (100.0%) | 533 (100.0%) |
Commute Time in Reynolds Heights
The most frequently occuring commute durations in Reynolds Heights are 15 to 19 minutes (418 commuters, 48.3%), 10 to 14 minutes (136 commuters, 15.7%), and 20 to 24 minutes (94 commuters, 10.8%).
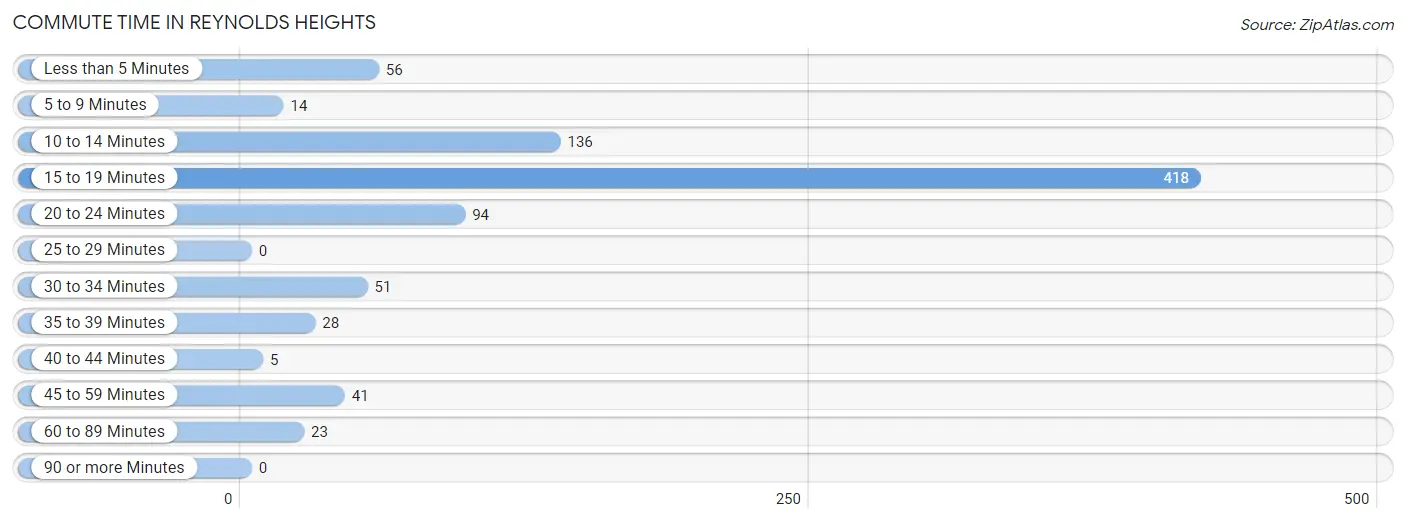
| Commute Time | # Commuters | % Commuters |
| Less than 5 Minutes | 56 | 6.5% |
| 5 to 9 Minutes | 14 | 1.6% |
| 10 to 14 Minutes | 136 | 15.7% |
| 15 to 19 Minutes | 418 | 48.3% |
| 20 to 24 Minutes | 94 | 10.8% |
| 25 to 29 Minutes | 0 | 0.0% |
| 30 to 34 Minutes | 51 | 5.9% |
| 35 to 39 Minutes | 28 | 3.2% |
| 40 to 44 Minutes | 5 | 0.6% |
| 45 to 59 Minutes | 41 | 4.7% |
| 60 to 89 Minutes | 23 | 2.7% |
| 90 or more Minutes | 0 | 0.0% |
Commute Time by Sex in Reynolds Heights
The most common commute times in Reynolds Heights are 15 to 19 minutes (143 commuters, 35.8%) for males and 15 to 19 minutes (275 commuters, 58.9%) for females.
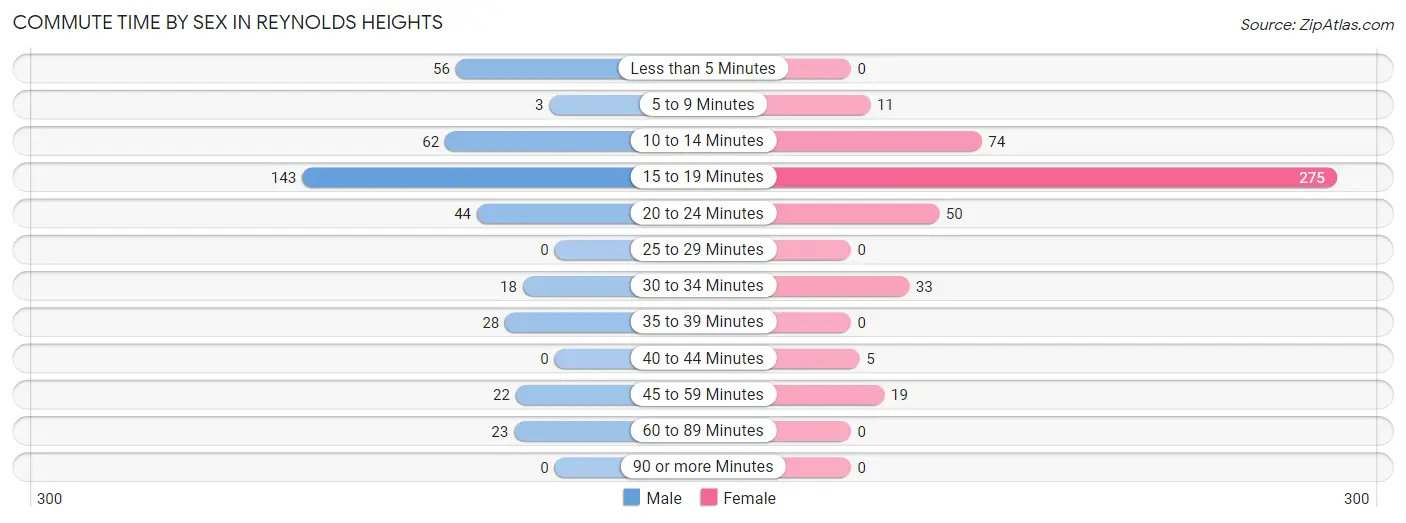
| Commute Time | Male | Female |
| Less than 5 Minutes | 56 (14.0%) | 0 (0.0%) |
| 5 to 9 Minutes | 3 (0.7%) | 11 (2.4%) |
| 10 to 14 Minutes | 62 (15.5%) | 74 (15.9%) |
| 15 to 19 Minutes | 143 (35.8%) | 275 (58.9%) |
| 20 to 24 Minutes | 44 (11.0%) | 50 (10.7%) |
| 25 to 29 Minutes | 0 (0.0%) | 0 (0.0%) |
| 30 to 34 Minutes | 18 (4.5%) | 33 (7.1%) |
| 35 to 39 Minutes | 28 (7.0%) | 0 (0.0%) |
| 40 to 44 Minutes | 0 (0.0%) | 5 (1.1%) |
| 45 to 59 Minutes | 22 (5.5%) | 19 (4.1%) |
| 60 to 89 Minutes | 23 (5.8%) | 0 (0.0%) |
| 90 or more Minutes | 0 (0.0%) | 0 (0.0%) |
Time of Departure to Work by Sex in Reynolds Heights
The most frequent times of departure to work in Reynolds Heights are 6:30 AM to 6:59 AM (115, 28.8%) for males and 8:30 AM to 8:59 AM (189, 40.5%) for females.
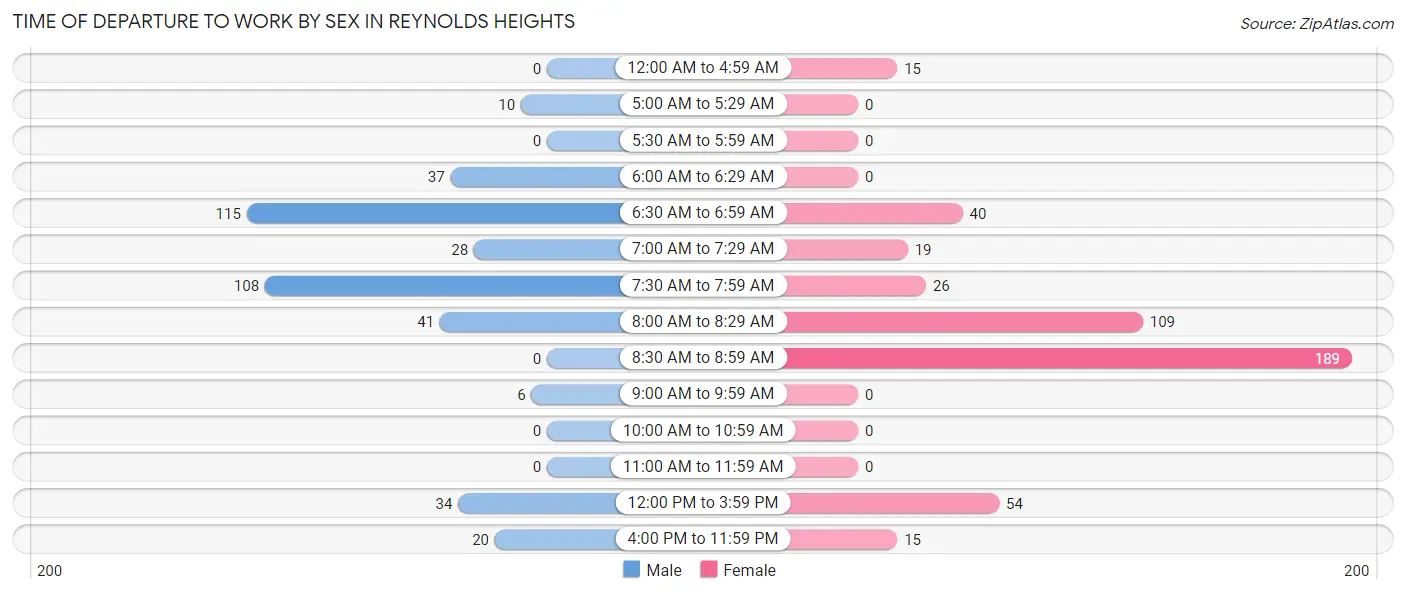
| Time of Departure | Male | Female |
| 12:00 AM to 4:59 AM | 0 (0.0%) | 15 (3.2%) |
| 5:00 AM to 5:29 AM | 10 (2.5%) | 0 (0.0%) |
| 5:30 AM to 5:59 AM | 0 (0.0%) | 0 (0.0%) |
| 6:00 AM to 6:29 AM | 37 (9.3%) | 0 (0.0%) |
| 6:30 AM to 6:59 AM | 115 (28.8%) | 40 (8.6%) |
| 7:00 AM to 7:29 AM | 28 (7.0%) | 19 (4.1%) |
| 7:30 AM to 7:59 AM | 108 (27.1%) | 26 (5.6%) |
| 8:00 AM to 8:29 AM | 41 (10.3%) | 109 (23.3%) |
| 8:30 AM to 8:59 AM | 0 (0.0%) | 189 (40.5%) |
| 9:00 AM to 9:59 AM | 6 (1.5%) | 0 (0.0%) |
| 10:00 AM to 10:59 AM | 0 (0.0%) | 0 (0.0%) |
| 11:00 AM to 11:59 AM | 0 (0.0%) | 0 (0.0%) |
| 12:00 PM to 3:59 PM | 34 (8.5%) | 54 (11.6%) |
| 4:00 PM to 11:59 PM | 20 (5.0%) | 15 (3.2%) |
| Total | 399 (100.0%) | 467 (100.0%) |
Housing Occupancy in Reynolds Heights
Occupancy by Ownership in Reynolds Heights
Of the total 845 dwellings in Reynolds Heights, owner-occupied units account for 525 (62.1%), while renter-occupied units make up 320 (37.9%).
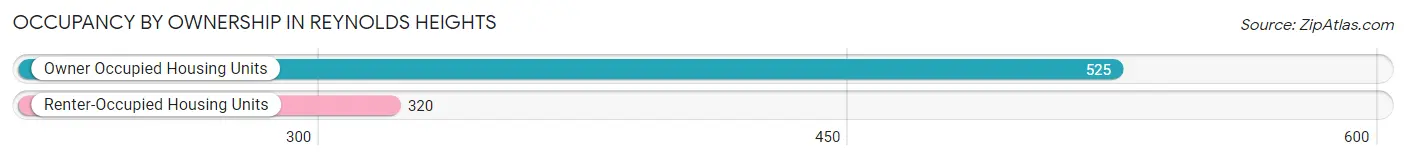
| Occupancy | # Housing Units | % Housing Units |
| Owner Occupied Housing Units | 525 | 62.1% |
| Renter-Occupied Housing Units | 320 | 37.9% |
| Total Occupied Housing Units | 845 | 100.0% |
Occupancy by Household Size in Reynolds Heights
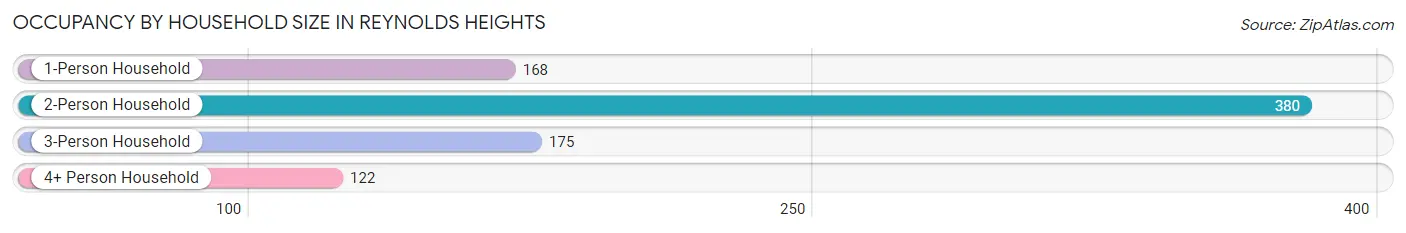
| Household Size | # Housing Units | % Housing Units |
| 1-Person Household | 168 | 19.9% |
| 2-Person Household | 380 | 45.0% |
| 3-Person Household | 175 | 20.7% |
| 4+ Person Household | 122 | 14.4% |
| Total Housing Units | 845 | 100.0% |
Occupancy by Ownership by Household Size in Reynolds Heights
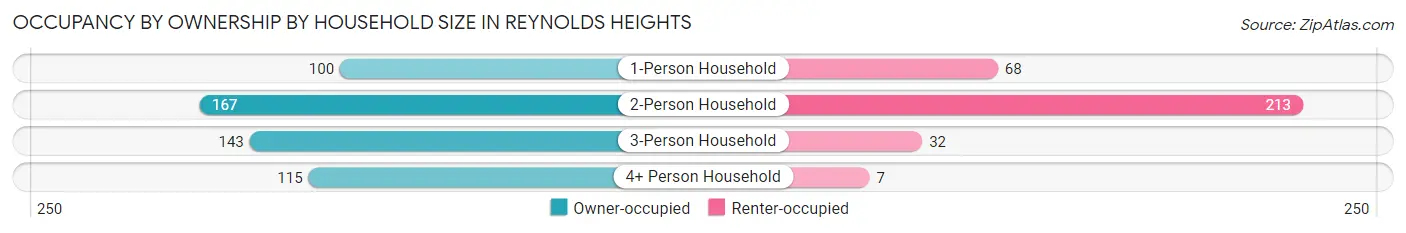
| Household Size | Owner-occupied | Renter-occupied |
| 1-Person Household | 100 (59.5%) | 68 (40.5%) |
| 2-Person Household | 167 (44.0%) | 213 (56.0%) |
| 3-Person Household | 143 (81.7%) | 32 (18.3%) |
| 4+ Person Household | 115 (94.3%) | 7 (5.7%) |
| Total Housing Units | 525 (62.1%) | 320 (37.9%) |
Occupancy by Educational Attainment in Reynolds Heights
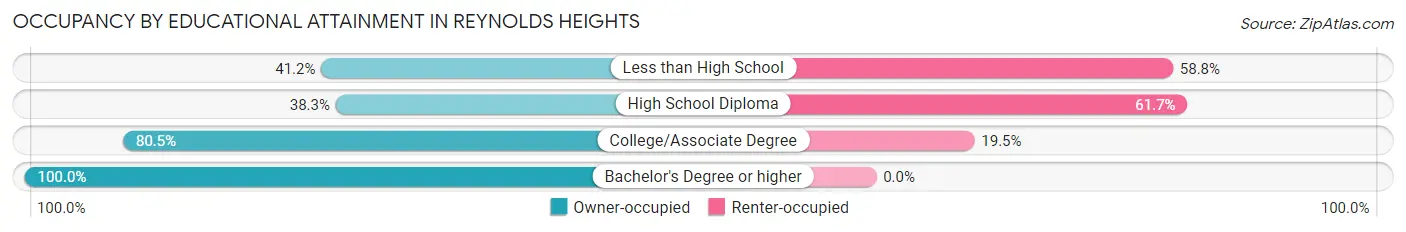
| Household Size | Owner-occupied | Renter-occupied |
| Less than High School | 56 (41.2%) | 80 (58.8%) |
| High School Diploma | 108 (38.3%) | 174 (61.7%) |
| College/Associate Degree | 273 (80.5%) | 66 (19.5%) |
| Bachelor's Degree or higher | 88 (100.0%) | 0 (0.0%) |
Occupancy by Age of Householder in Reynolds Heights
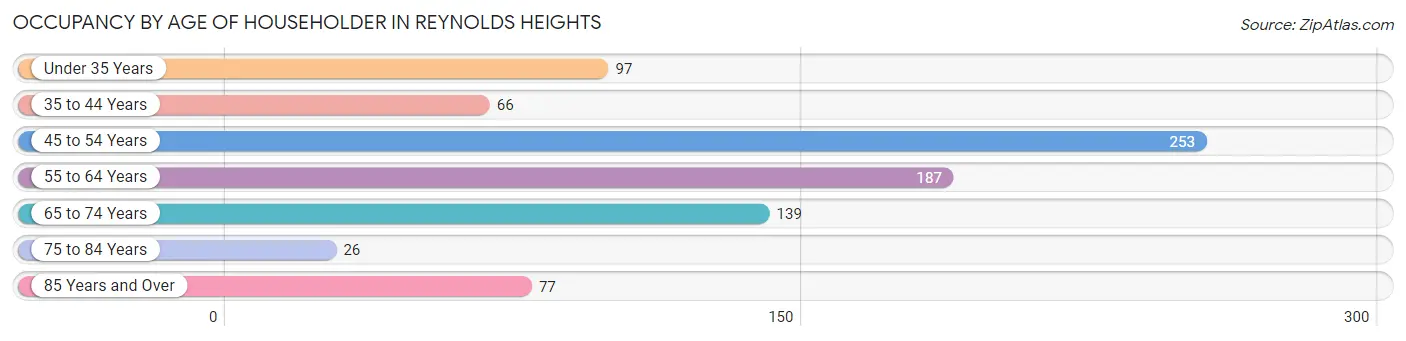
| Age Bracket | # Households | % Households |
| Under 35 Years | 97 | 11.5% |
| 35 to 44 Years | 66 | 7.8% |
| 45 to 54 Years | 253 | 29.9% |
| 55 to 64 Years | 187 | 22.1% |
| 65 to 74 Years | 139 | 16.5% |
| 75 to 84 Years | 26 | 3.1% |
| 85 Years and Over | 77 | 9.1% |
| Total | 845 | 100.0% |
Housing Finances in Reynolds Heights
Median Income by Occupancy in Reynolds Heights
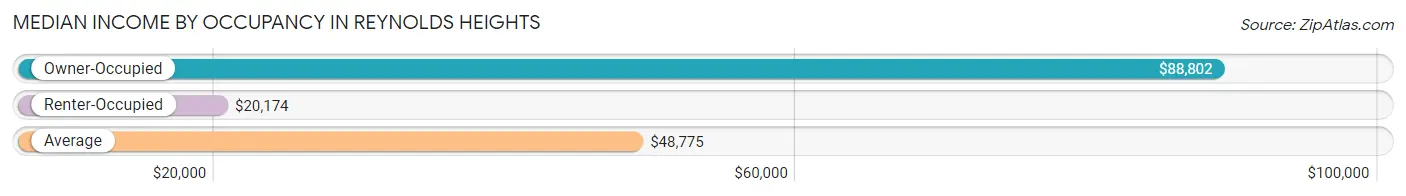
| Occupancy Type | # Households | Median Income |
| Owner-Occupied | 525 (62.1%) | $88,802 |
| Renter-Occupied | 320 (37.9%) | $20,174 |
| Average | 845 (100.0%) | $48,775 |
Occupancy by Householder Income Bracket in Reynolds Heights
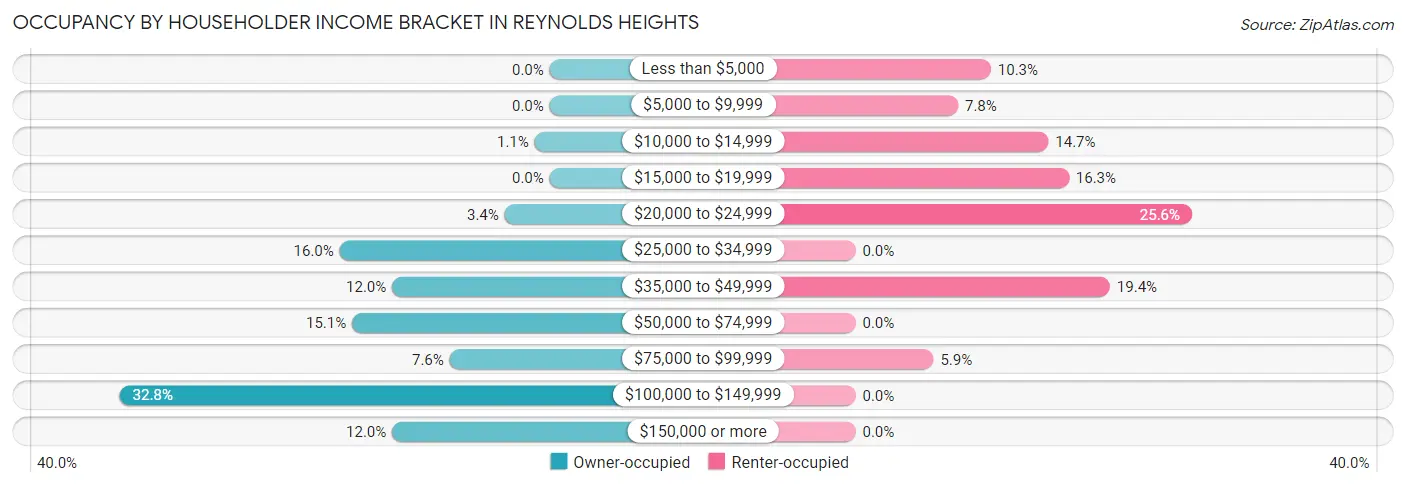
| Income Bracket | Owner-occupied | Renter-occupied |
| Less than $5,000 | 0 (0.0%) | 33 (10.3%) |
| $5,000 to $9,999 | 0 (0.0%) | 25 (7.8%) |
| $10,000 to $14,999 | 6 (1.1%) | 47 (14.7%) |
| $15,000 to $19,999 | 0 (0.0%) | 52 (16.3%) |
| $20,000 to $24,999 | 18 (3.4%) | 82 (25.6%) |
| $25,000 to $34,999 | 84 (16.0%) | 0 (0.0%) |
| $35,000 to $49,999 | 63 (12.0%) | 62 (19.4%) |
| $50,000 to $74,999 | 79 (15.0%) | 0 (0.0%) |
| $75,000 to $99,999 | 40 (7.6%) | 19 (5.9%) |
| $100,000 to $149,999 | 172 (32.8%) | 0 (0.0%) |
| $150,000 or more | 63 (12.0%) | 0 (0.0%) |
| Total | 525 (100.0%) | 320 (100.0%) |
Monthly Housing Cost Tiers in Reynolds Heights
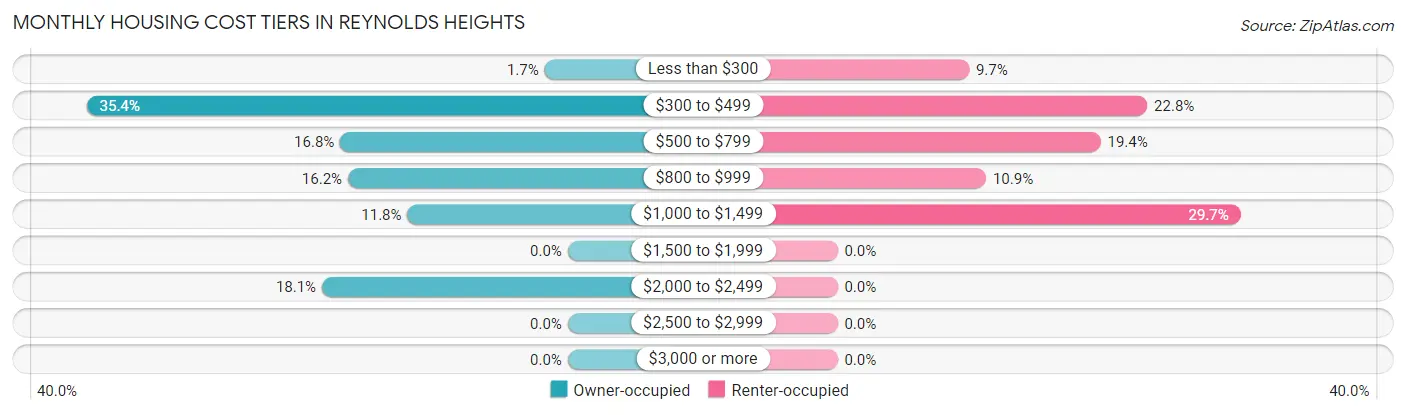
| Monthly Cost | Owner-occupied | Renter-occupied |
| Less than $300 | 9 (1.7%) | 31 (9.7%) |
| $300 to $499 | 186 (35.4%) | 73 (22.8%) |
| $500 to $799 | 88 (16.8%) | 62 (19.4%) |
| $800 to $999 | 85 (16.2%) | 35 (10.9%) |
| $1,000 to $1,499 | 62 (11.8%) | 95 (29.7%) |
| $1,500 to $1,999 | 0 (0.0%) | 0 (0.0%) |
| $2,000 to $2,499 | 95 (18.1%) | 0 (0.0%) |
| $2,500 to $2,999 | 0 (0.0%) | 0 (0.0%) |
| $3,000 or more | 0 (0.0%) | 0 (0.0%) |
| Total | 525 (100.0%) | 320 (100.0%) |
Physical Housing Characteristics in Reynolds Heights
Housing Structures in Reynolds Heights
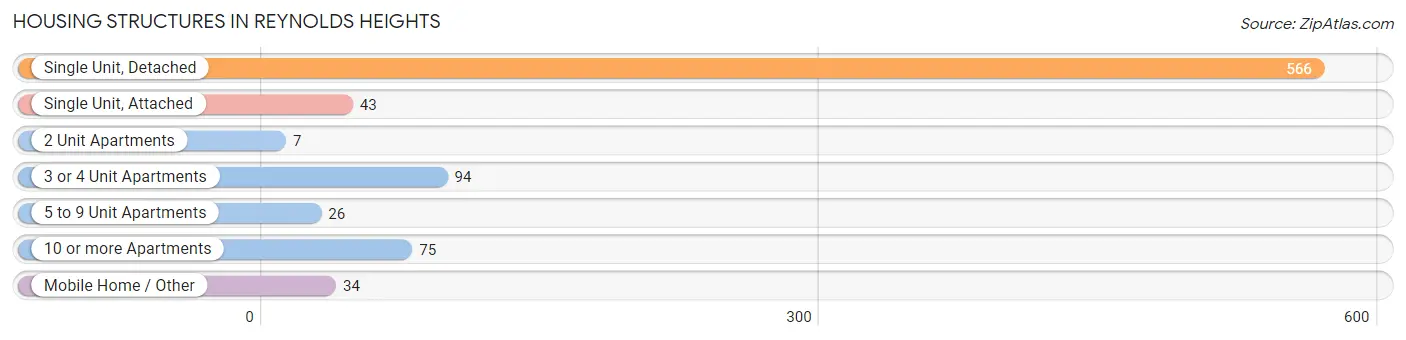
| Structure Type | # Housing Units | % Housing Units |
| Single Unit, Detached | 566 | 67.0% |
| Single Unit, Attached | 43 | 5.1% |
| 2 Unit Apartments | 7 | 0.8% |
| 3 or 4 Unit Apartments | 94 | 11.1% |
| 5 to 9 Unit Apartments | 26 | 3.1% |
| 10 or more Apartments | 75 | 8.9% |
| Mobile Home / Other | 34 | 4.0% |
| Total | 845 | 100.0% |
Housing Structures by Occupancy in Reynolds Heights
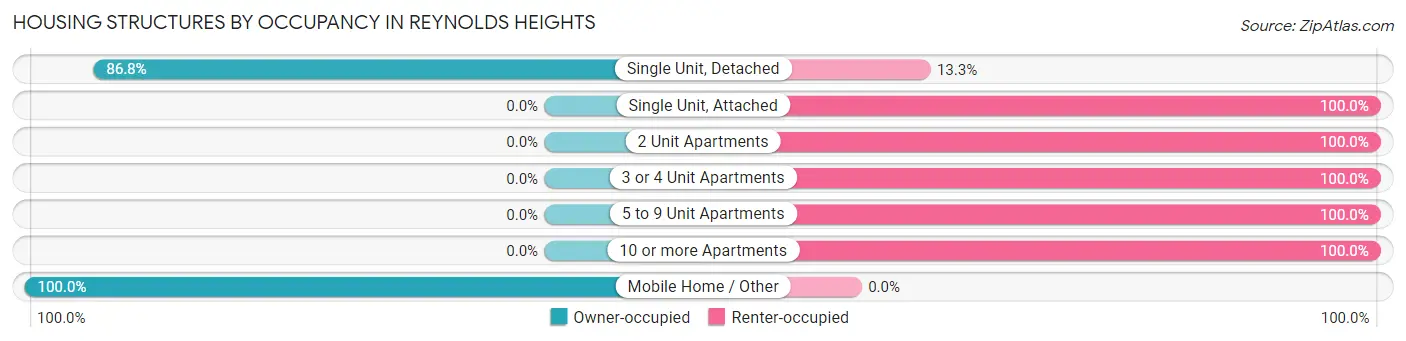
| Structure Type | Owner-occupied | Renter-occupied |
| Single Unit, Detached | 491 (86.8%) | 75 (13.3%) |
| Single Unit, Attached | 0 (0.0%) | 43 (100.0%) |
| 2 Unit Apartments | 0 (0.0%) | 7 (100.0%) |
| 3 or 4 Unit Apartments | 0 (0.0%) | 94 (100.0%) |
| 5 to 9 Unit Apartments | 0 (0.0%) | 26 (100.0%) |
| 10 or more Apartments | 0 (0.0%) | 75 (100.0%) |
| Mobile Home / Other | 34 (100.0%) | 0 (0.0%) |
| Total | 525 (62.1%) | 320 (37.9%) |
Housing Structures by Number of Rooms in Reynolds Heights
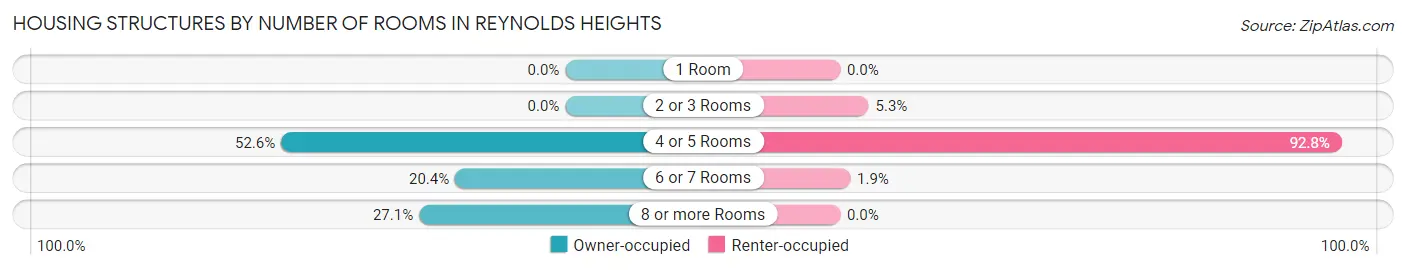
| Number of Rooms | Owner-occupied | Renter-occupied |
| 1 Room | 0 (0.0%) | 0 (0.0%) |
| 2 or 3 Rooms | 0 (0.0%) | 17 (5.3%) |
| 4 or 5 Rooms | 276 (52.6%) | 297 (92.8%) |
| 6 or 7 Rooms | 107 (20.4%) | 6 (1.9%) |
| 8 or more Rooms | 142 (27.1%) | 0 (0.0%) |
| Total | 525 (100.0%) | 320 (100.0%) |
Housing Structure by Heating Type in Reynolds Heights
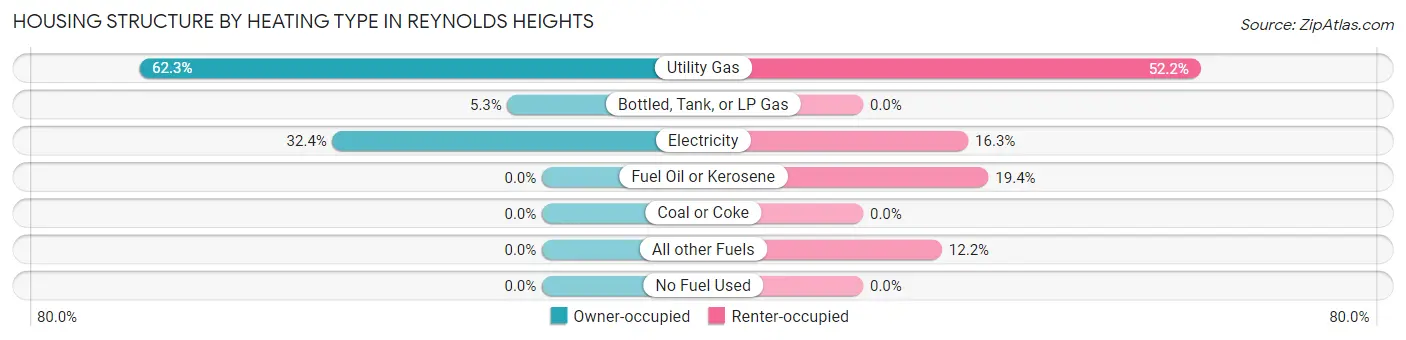
| Heating Type | Owner-occupied | Renter-occupied |
| Utility Gas | 327 (62.3%) | 167 (52.2%) |
| Bottled, Tank, or LP Gas | 28 (5.3%) | 0 (0.0%) |
| Electricity | 170 (32.4%) | 52 (16.3%) |
| Fuel Oil or Kerosene | 0 (0.0%) | 62 (19.4%) |
| Coal or Coke | 0 (0.0%) | 0 (0.0%) |
| All other Fuels | 0 (0.0%) | 39 (12.2%) |
| No Fuel Used | 0 (0.0%) | 0 (0.0%) |
| Total | 525 (100.0%) | 320 (100.0%) |
Household Vehicle Usage in Reynolds Heights
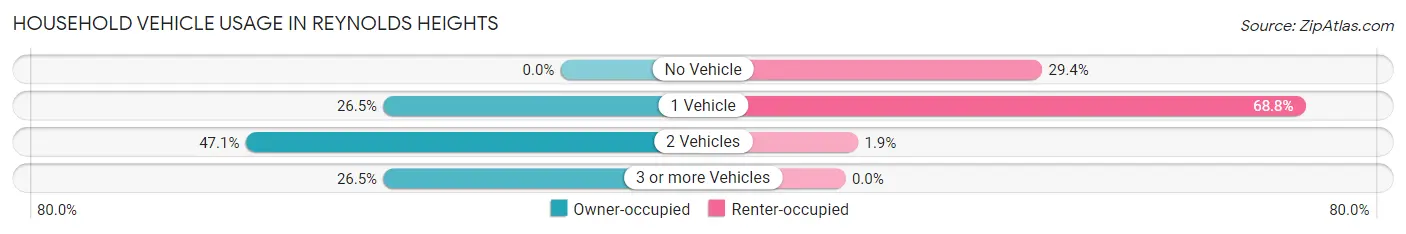
| Vehicles per Household | Owner-occupied | Renter-occupied |
| No Vehicle | 0 (0.0%) | 94 (29.4%) |
| 1 Vehicle | 139 (26.5%) | 220 (68.8%) |
| 2 Vehicles | 247 (47.0%) | 6 (1.9%) |
| 3 or more Vehicles | 139 (26.5%) | 0 (0.0%) |
| Total | 525 (100.0%) | 320 (100.0%) |
Real Estate & Mortgages in Reynolds Heights
Real Estate and Mortgage Overview in Reynolds Heights
| Characteristic | Without Mortgage | With Mortgage |
| Housing Units | 229 | 296 |
| Median Property Value | $114,400 | $139,500 |
| Median Household Income | - | - |
| Monthly Housing Costs | $444 | $0 |
| Real Estate Taxes | $1,538 | $0 |
Property Value by Mortgage Status in Reynolds Heights
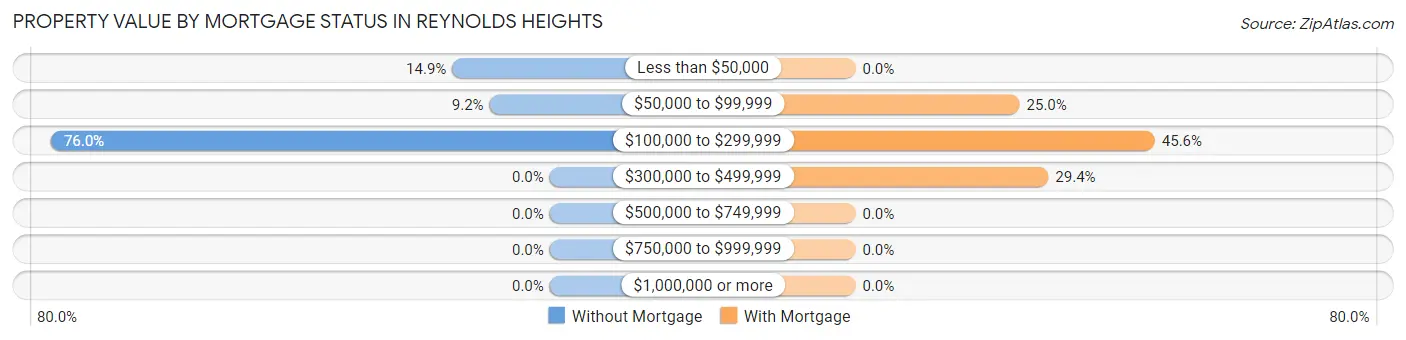
| Property Value | Without Mortgage | With Mortgage |
| Less than $50,000 | 34 (14.8%) | 0 (0.0%) |
| $50,000 to $99,999 | 21 (9.2%) | 74 (25.0%) |
| $100,000 to $299,999 | 174 (76.0%) | 135 (45.6%) |
| $300,000 to $499,999 | 0 (0.0%) | 87 (29.4%) |
| $500,000 to $749,999 | 0 (0.0%) | 0 (0.0%) |
| $750,000 to $999,999 | 0 (0.0%) | 0 (0.0%) |
| $1,000,000 or more | 0 (0.0%) | 0 (0.0%) |
| Total | 229 (100.0%) | 296 (100.0%) |
Household Income by Mortgage Status in Reynolds Heights
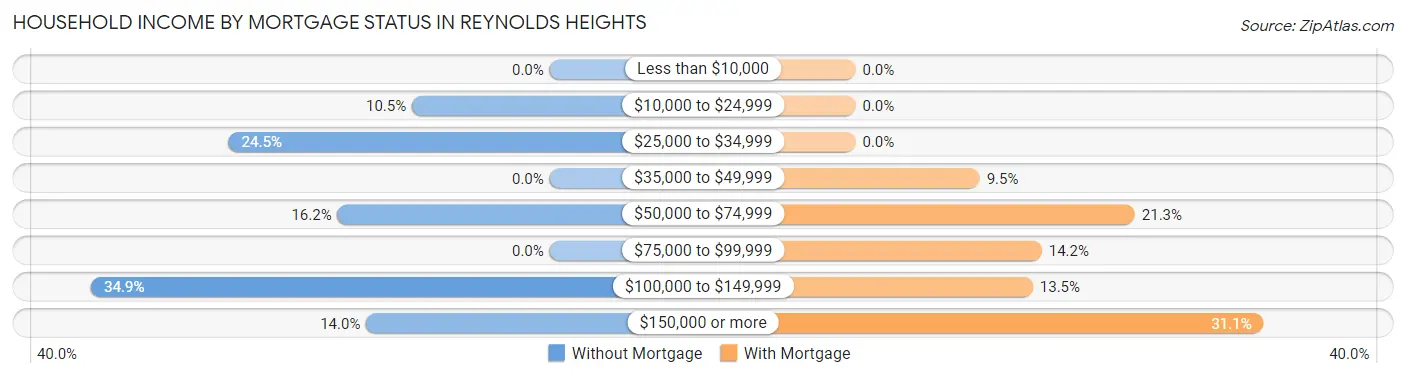
| Household Income | Without Mortgage | With Mortgage |
| Less than $10,000 | 0 (0.0%) | 0 (0.0%) |
| $10,000 to $24,999 | 24 (10.5%) | 0 (0.0%) |
| $25,000 to $34,999 | 56 (24.4%) | 0 (0.0%) |
| $35,000 to $49,999 | 0 (0.0%) | 28 (9.5%) |
| $50,000 to $74,999 | 37 (16.2%) | 63 (21.3%) |
| $75,000 to $99,999 | 0 (0.0%) | 42 (14.2%) |
| $100,000 to $149,999 | 80 (34.9%) | 40 (13.5%) |
| $150,000 or more | 32 (14.0%) | 92 (31.1%) |
| Total | 229 (100.0%) | 296 (100.0%) |
Property Value to Household Income Ratio in Reynolds Heights
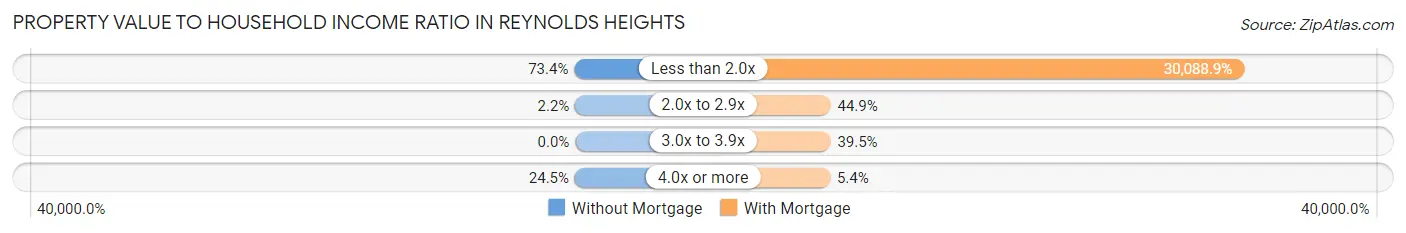
| Value-to-Income Ratio | Without Mortgage | With Mortgage |
| Less than 2.0x | 168 (73.4%) | 89,063 (30,088.9%) |
| 2.0x to 2.9x | 5 (2.2%) | 133 (44.9%) |
| 3.0x to 3.9x | 0 (0.0%) | 117 (39.5%) |
| 4.0x or more | 56 (24.4%) | 16 (5.4%) |
| Total | 229 (100.0%) | 296 (100.0%) |
Real Estate Taxes by Mortgage Status in Reynolds Heights
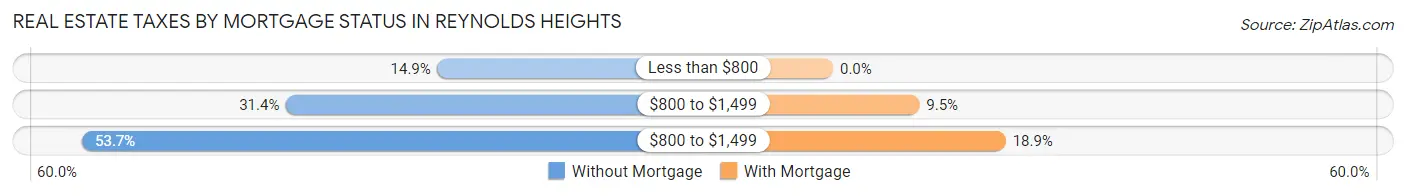
| Property Taxes | Without Mortgage | With Mortgage |
| Less than $800 | 34 (14.8%) | 0 (0.0%) |
| $800 to $1,499 | 72 (31.4%) | 28 (9.5%) |
| $800 to $1,499 | 123 (53.7%) | 56 (18.9%) |
| Total | 229 (100.0%) | 296 (100.0%) |
Health & Disability in Reynolds Heights
Health Insurance Coverage by Age in Reynolds Heights
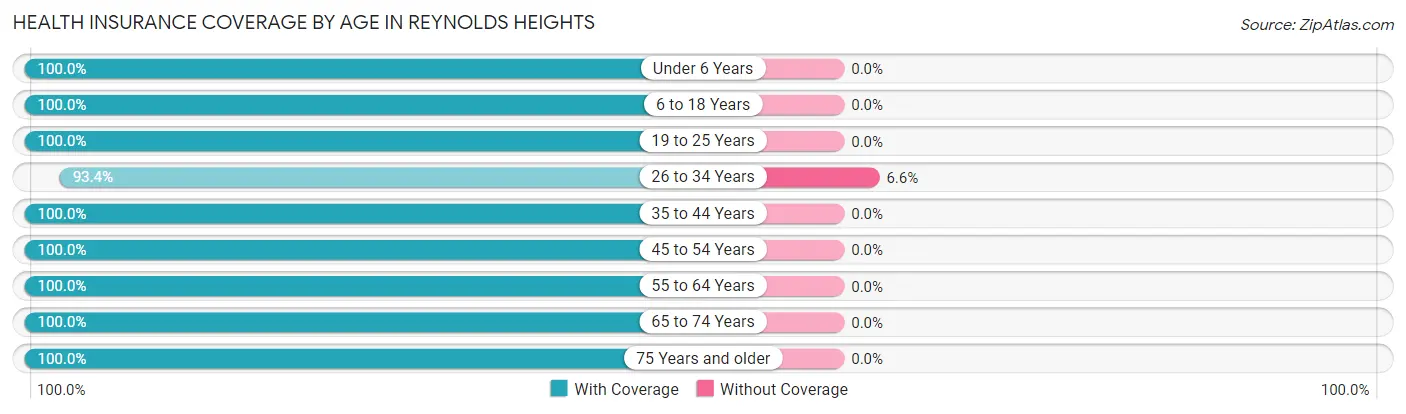
| Age Bracket | With Coverage | Without Coverage |
| Under 6 Years | 97 (100.0%) | 0 (0.0%) |
| 6 to 18 Years | 337 (100.0%) | 0 (0.0%) |
| 19 to 25 Years | 50 (100.0%) | 0 (0.0%) |
| 26 to 34 Years | 114 (93.4%) | 8 (6.6%) |
| 35 to 44 Years | 80 (100.0%) | 0 (0.0%) |
| 45 to 54 Years | 464 (100.0%) | 0 (0.0%) |
| 55 to 64 Years | 493 (100.0%) | 0 (0.0%) |
| 65 to 74 Years | 190 (100.0%) | 0 (0.0%) |
| 75 Years and older | 144 (100.0%) | 0 (0.0%) |
| Total | 1,969 (99.6%) | 8 (0.4%) |
Health Insurance Coverage by Citizenship Status in Reynolds Heights
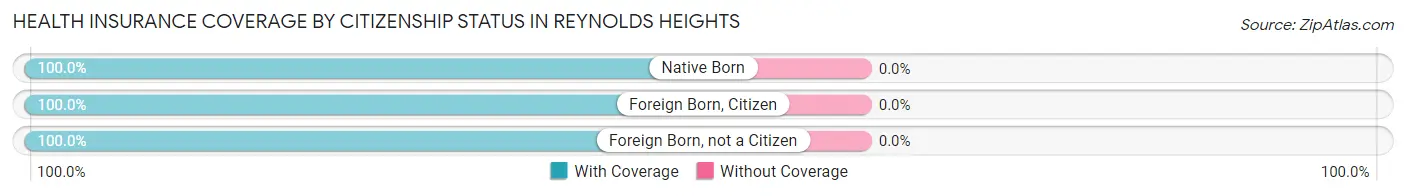
| Citizenship Status | With Coverage | Without Coverage |
| Native Born | 97 (100.0%) | 0 (0.0%) |
| Foreign Born, Citizen | 337 (100.0%) | 0 (0.0%) |
| Foreign Born, not a Citizen | 50 (100.0%) | 0 (0.0%) |
Health Insurance Coverage by Household Income in Reynolds Heights
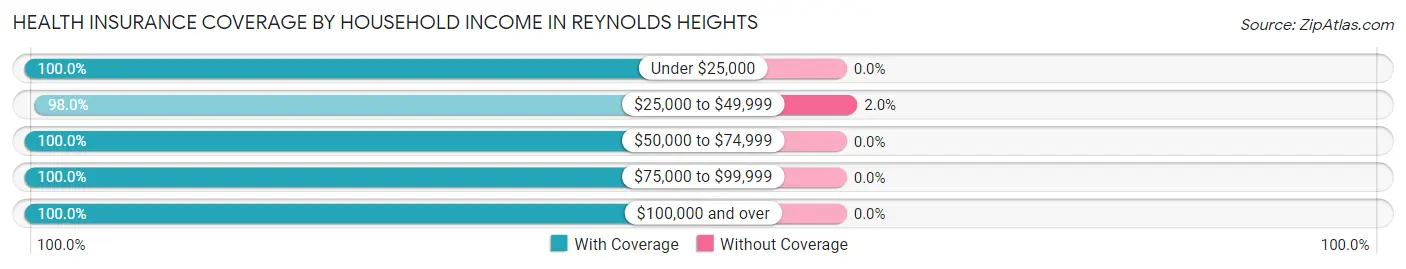
| Household Income | With Coverage | Without Coverage |
| Under $25,000 | 478 (100.0%) | 0 (0.0%) |
| $25,000 to $49,999 | 396 (98.0%) | 8 (2.0%) |
| $50,000 to $74,999 | 206 (100.0%) | 0 (0.0%) |
| $75,000 to $99,999 | 132 (100.0%) | 0 (0.0%) |
| $100,000 and over | 746 (100.0%) | 0 (0.0%) |
Public vs Private Health Insurance Coverage by Age in Reynolds Heights
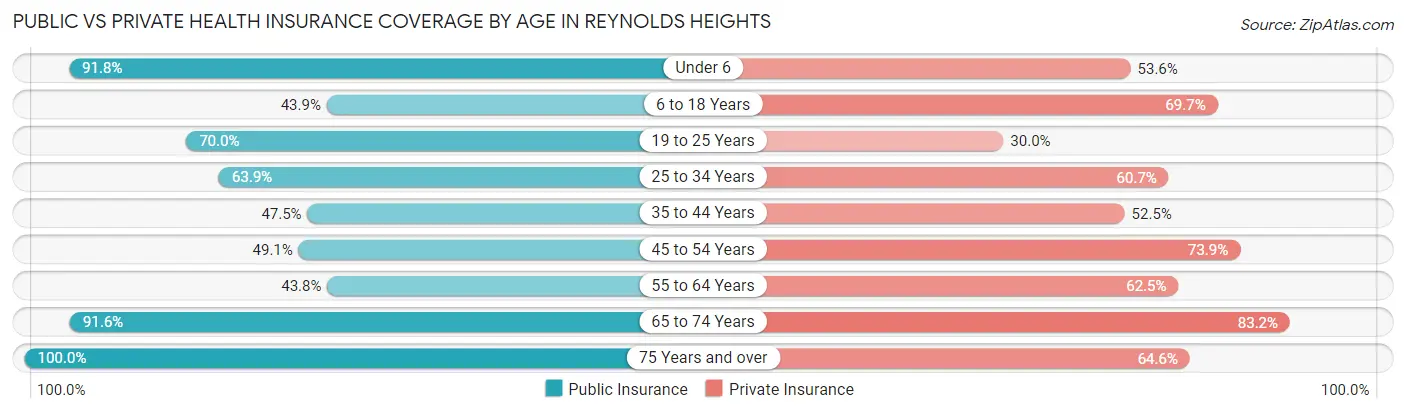
| Age Bracket | Public Insurance | Private Insurance |
| Under 6 | 89 (91.7%) | 52 (53.6%) |
| 6 to 18 Years | 148 (43.9%) | 235 (69.7%) |
| 19 to 25 Years | 35 (70.0%) | 15 (30.0%) |
| 25 to 34 Years | 78 (63.9%) | 74 (60.7%) |
| 35 to 44 Years | 38 (47.5%) | 42 (52.5%) |
| 45 to 54 Years | 228 (49.1%) | 343 (73.9%) |
| 55 to 64 Years | 216 (43.8%) | 308 (62.5%) |
| 65 to 74 Years | 174 (91.6%) | 158 (83.2%) |
| 75 Years and over | 144 (100.0%) | 93 (64.6%) |
| Total | 1,150 (58.2%) | 1,320 (66.8%) |
Disability Status by Sex by Age in Reynolds Heights
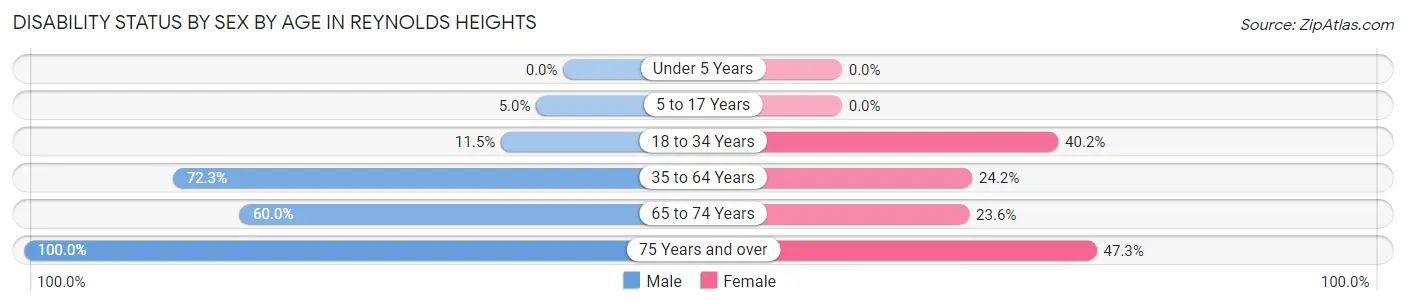
| Age Bracket | Male | Female |
| Under 5 Years | 0 (0.0%) | 0 (0.0%) |
| 5 to 17 Years | 12 (5.0%) | 0 (0.0%) |
| 18 to 34 Years | 9 (11.5%) | 49 (40.2%) |
| 35 to 64 Years | 316 (72.3%) | 145 (24.2%) |
| 65 to 74 Years | 81 (60.0%) | 13 (23.6%) |
| 75 Years and over | 70 (100.0%) | 35 (47.3%) |
Disability Class by Sex by Age in Reynolds Heights
Disability Class: Hearing Difficulty
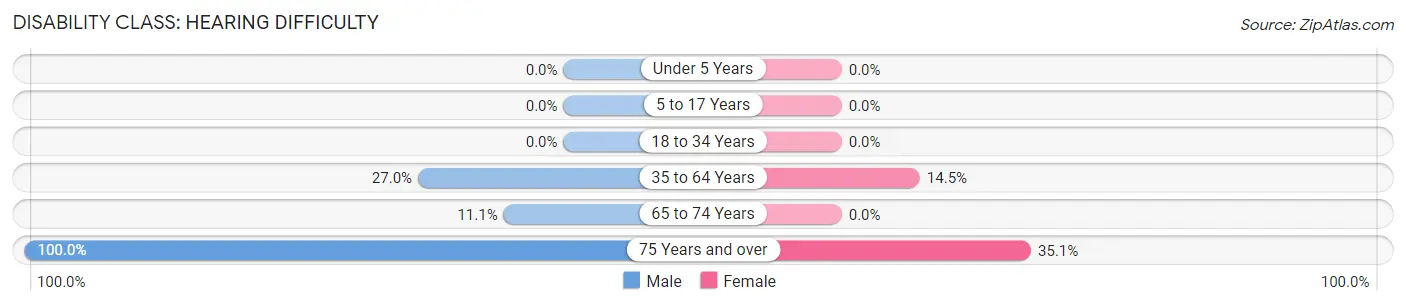
| Age Bracket | Male | Female |
| Under 5 Years | 0 (0.0%) | 0 (0.0%) |
| 5 to 17 Years | 0 (0.0%) | 0 (0.0%) |
| 18 to 34 Years | 0 (0.0%) | 0 (0.0%) |
| 35 to 64 Years | 118 (27.0%) | 87 (14.5%) |
| 65 to 74 Years | 15 (11.1%) | 0 (0.0%) |
| 75 Years and over | 70 (100.0%) | 26 (35.1%) |
Disability Class: Vision Difficulty
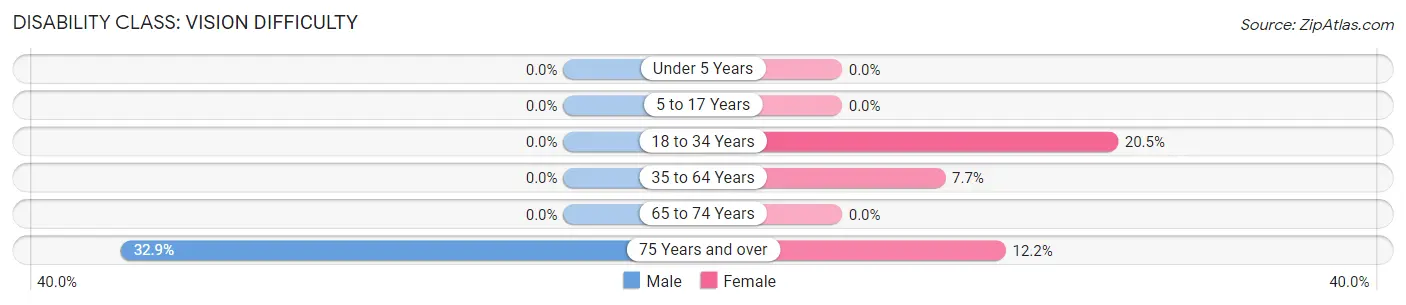
| Age Bracket | Male | Female |
| Under 5 Years | 0 (0.0%) | 0 (0.0%) |
| 5 to 17 Years | 0 (0.0%) | 0 (0.0%) |
| 18 to 34 Years | 0 (0.0%) | 25 (20.5%) |
| 35 to 64 Years | 0 (0.0%) | 46 (7.7%) |
| 65 to 74 Years | 0 (0.0%) | 0 (0.0%) |
| 75 Years and over | 23 (32.9%) | 9 (12.2%) |
Disability Class: Cognitive Difficulty
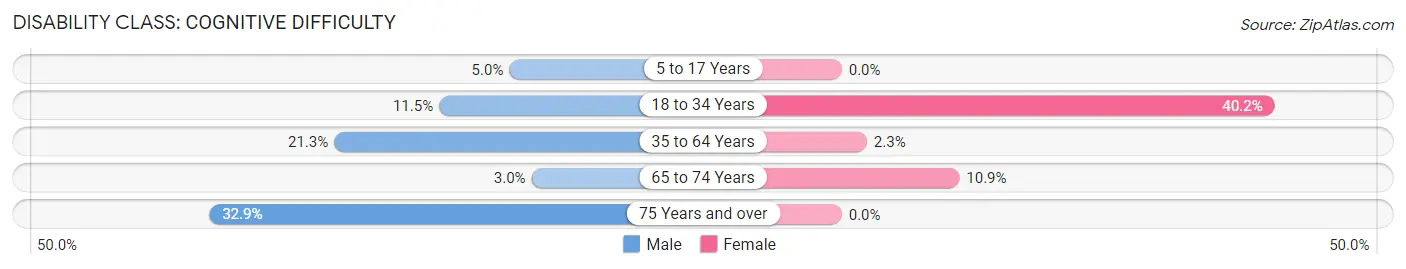
| Age Bracket | Male | Female |
| 5 to 17 Years | 12 (5.0%) | 0 (0.0%) |
| 18 to 34 Years | 9 (11.5%) | 49 (40.2%) |
| 35 to 64 Years | 93 (21.3%) | 14 (2.3%) |
| 65 to 74 Years | 4 (3.0%) | 6 (10.9%) |
| 75 Years and over | 23 (32.9%) | 0 (0.0%) |
Disability Class: Ambulatory Difficulty
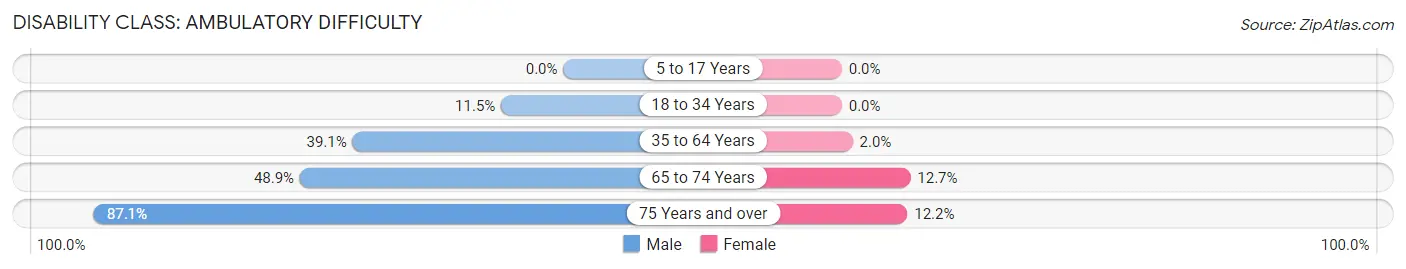
| Age Bracket | Male | Female |
| 5 to 17 Years | 0 (0.0%) | 0 (0.0%) |
| 18 to 34 Years | 9 (11.5%) | 0 (0.0%) |
| 35 to 64 Years | 171 (39.1%) | 12 (2.0%) |
| 65 to 74 Years | 66 (48.9%) | 7 (12.7%) |
| 75 Years and over | 61 (87.1%) | 9 (12.2%) |
Disability Class: Self-Care Difficulty
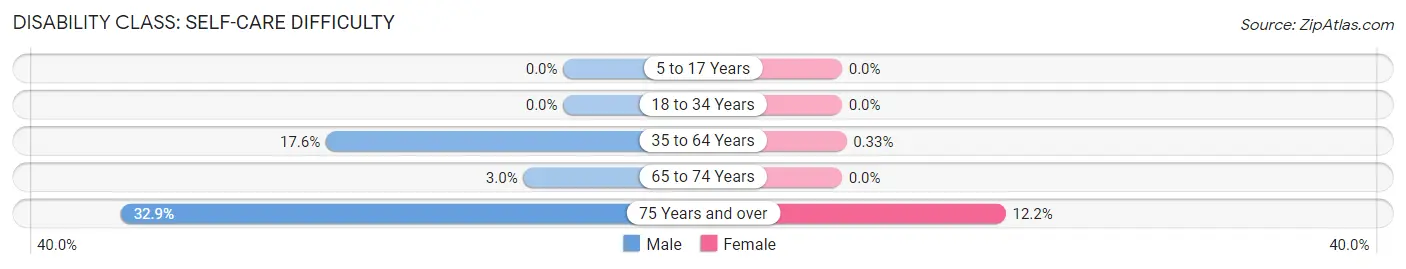
| Age Bracket | Male | Female |
| 5 to 17 Years | 0 (0.0%) | 0 (0.0%) |
| 18 to 34 Years | 0 (0.0%) | 0 (0.0%) |
| 35 to 64 Years | 77 (17.6%) | 2 (0.3%) |
| 65 to 74 Years | 4 (3.0%) | 0 (0.0%) |
| 75 Years and over | 23 (32.9%) | 9 (12.2%) |
Technology Access in Reynolds Heights
Computing Device Access in Reynolds Heights
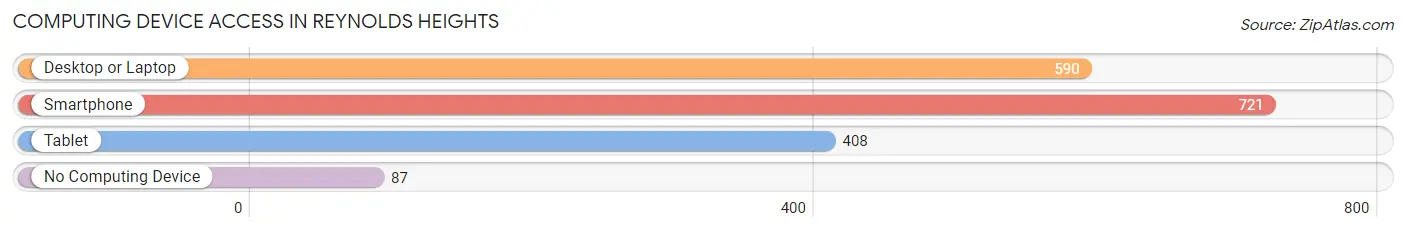
| Device Type | # Households | % Households |
| Desktop or Laptop | 590 | 69.8% |
| Smartphone | 721 | 85.3% |
| Tablet | 408 | 48.3% |
| No Computing Device | 87 | 10.3% |
| Total | 845 | 100.0% |
Internet Access in Reynolds Heights
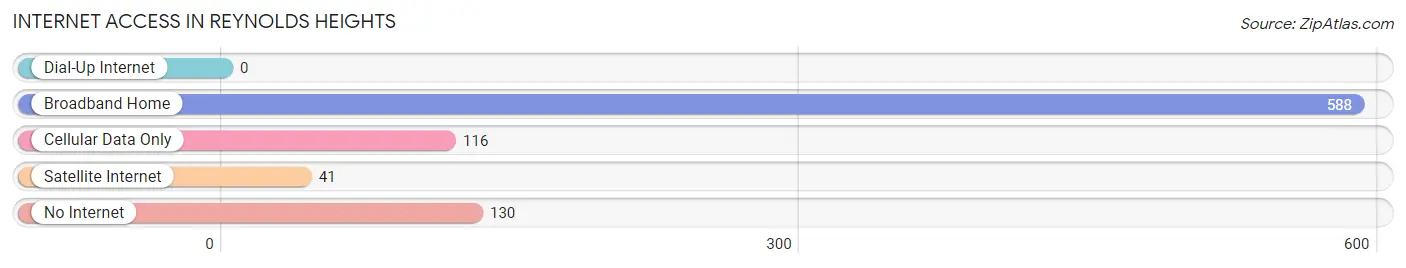
| Internet Type | # Households | % Households |
| Dial-Up Internet | 0 | 0.0% |
| Broadband Home | 588 | 69.6% |
| Cellular Data Only | 116 | 13.7% |
| Satellite Internet | 41 | 4.9% |
| No Internet | 130 | 15.4% |
| Total | 845 | 100.0% |
Reynolds Heights Summary
Reynolds Heights is a borough located in Allegheny County, Pennsylvania. It is a small community of approximately 1,500 people, located just outside of Pittsburgh. The borough was founded in 1876 and is named after the Reynolds family, who were early settlers in the area.
Geography
Reynolds Heights is located in the Allegheny Plateau region of Pennsylvania. It is situated in the southwestern corner of Allegheny County, just north of the city of Pittsburgh. The borough is bordered by the boroughs of West View and Ross Township to the north, and the city of Pittsburgh to the south. The borough is located in a valley, with the Allegheny River to the east and the Ohio River to the west. The borough is approximately 4.5 square miles in size, with a population density of about 330 people per square mile.
Economy
Reynolds Heights is primarily a residential community, with most of its residents employed in the nearby city of Pittsburgh. The borough does have a few small businesses, including a few restaurants, a grocery store, and a few small retail stores. The borough also has a few industrial businesses, including a steel mill and a paper mill.
Demographics
As of the 2010 census, the population of Reynolds Heights was 1,521. The racial makeup of the borough was 94.3% White, 2.2% African American, 0.3% Native American, 0.7% Asian, 0.1% Pacific Islander, and 2.4% from other races. Hispanic or Latino of any race were 1.2% of the population.
The median household income in Reynolds Heights was $45,938, and the median family income was $51,964. About 8.3% of families and 10.2% of the population were below the poverty line, including 14.2% of those under age 18 and 6.2% of those age 65 or over.
History
Reynolds Heights was founded in 1876 by the Reynolds family, who were early settlers in the area. The borough was originally known as Reynoldsville, but the name was changed to Reynolds Heights in 1891. The borough was incorporated in 1895.
In the early 1900s, the borough was a thriving industrial center, with several steel mills and paper mills located in the area. The borough also had a few small businesses, including a few restaurants, a grocery store, and a few small retail stores.
In the 1950s, the borough began to decline as the steel and paper mills closed down. The borough's population also began to decline, as many of the residents moved away to find work in other areas.
Today, Reynolds Heights is primarily a residential community, with most of its residents employed in the nearby city of Pittsburgh. The borough does have a few small businesses, including a few restaurants, a grocery store, and a few small retail stores. The borough also has a few industrial businesses, including a steel mill and a paper mill.
Common Questions
What is Per Capita Income in Reynolds Heights?
Per Capita income in Reynolds Heights is $29,138.
What is the Median Family Income in Reynolds Heights?
Median Family Income in Reynolds Heights is $70,417.
What is the Median Household income in Reynolds Heights?
Median Household Income in Reynolds Heights is $48,775.
What is Income or Wage Gap in Reynolds Heights?
Income or Wage Gap in Reynolds Heights is 10.8%.
Women in Reynolds Heights earn 89.2 cents for every dollar earned by a man.
What is Inequality or Gini Index in Reynolds Heights?
Inequality or Gini Index in Reynolds Heights is 0.44.
What is the Total Population of Reynolds Heights?
Total Population of Reynolds Heights is 1,977.
What is the Total Male Population of Reynolds Heights?
Total Male Population of Reynolds Heights is 991.
What is the Total Female Population of Reynolds Heights?
Total Female Population of Reynolds Heights is 986.
What is the Ratio of Males per 100 Females in Reynolds Heights?
There are 100.51 Males per 100 Females in Reynolds Heights.
What is the Ratio of Females per 100 Males in Reynolds Heights?
There are 99.50 Females per 100 Males in Reynolds Heights.
What is the Median Population Age in Reynolds Heights?
Median Population Age in Reynolds Heights is 50.6 Years.
What is the Average Family Size in Reynolds Heights
Average Family Size in Reynolds Heights is 2.7 People.
What is the Average Household Size in Reynolds Heights
Average Household Size in Reynolds Heights is 2.3 People.
How Large is the Labor Force in Reynolds Heights?
There are 978 People in the Labor Forcein in Reynolds Heights.
What is the Percentage of People in the Labor Force in Reynolds Heights?
60.2% of People are in the Labor Force in Reynolds Heights.
What is the Unemployment Rate in Reynolds Heights?
Unemployment Rate in Reynolds Heights is 4.2%.