Montoursville borough, PA Map & Demographics
Montoursville borough Overview
$34,605
PER CAPITA INCOME
$90,842
AVG FAMILY INCOME
$63,899
AVG HOUSEHOLD INCOME
30.0%
WAGE / INCOME GAP [ % ]
70.0¢/ $1
WAGE / INCOME GAP [ $ ]
0.40
INEQUALITY / GINI INDEX
4,724
TOTAL POPULATION
2,403
MALE POPULATION
2,321
FEMALE POPULATION
103.53
MALES / 100 FEMALES
96.59
FEMALES / 100 MALES
44.1
MEDIAN AGE
3.0
AVG FAMILY SIZE
2.3
AVG HOUSEHOLD SIZE
2,361
LABOR FORCE [ PEOPLE ]
60.7%
PERCENT IN LABOR FORCE
4.4%
UNEMPLOYMENT RATE
Income in Montoursville borough
Income Overview in Montoursville borough
Per Capita Income in Montoursville borough is $34,605, while median incomes of families and households are $90,842 and $63,899 respectively.
| Characteristic | Number | Measure |
| Per Capita Income | 4,724 | $34,605 |
| Median Family Income | 1,276 | $90,842 |
| Mean Family Income | 1,276 | $103,834 |
| Median Household Income | 2,089 | $63,899 |
| Mean Household Income | 2,089 | $77,336 |
| Income Deficit | 1,276 | $0 |
| Wage / Income Gap (%) | 4,724 | 30.02% |
| Wage / Income Gap ($) | 4,724 | 69.98¢ per $1 |
| Gini / Inequality Index | 4,724 | 0.40 |
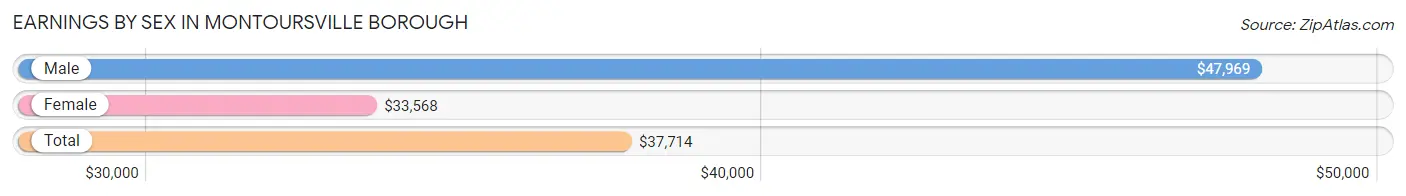
Earnings by Sex in Montoursville borough
Average Earnings in Montoursville borough are $37,714, $47,969 for men and $33,568 for women, a difference of 30.0%.
| Sex | Number | Average Earnings |
| Male | 1,314 (53.0%) | $47,969 |
| Female | 1,163 (46.9%) | $33,568 |
| Total | 2,477 (100.0%) | $37,714 |
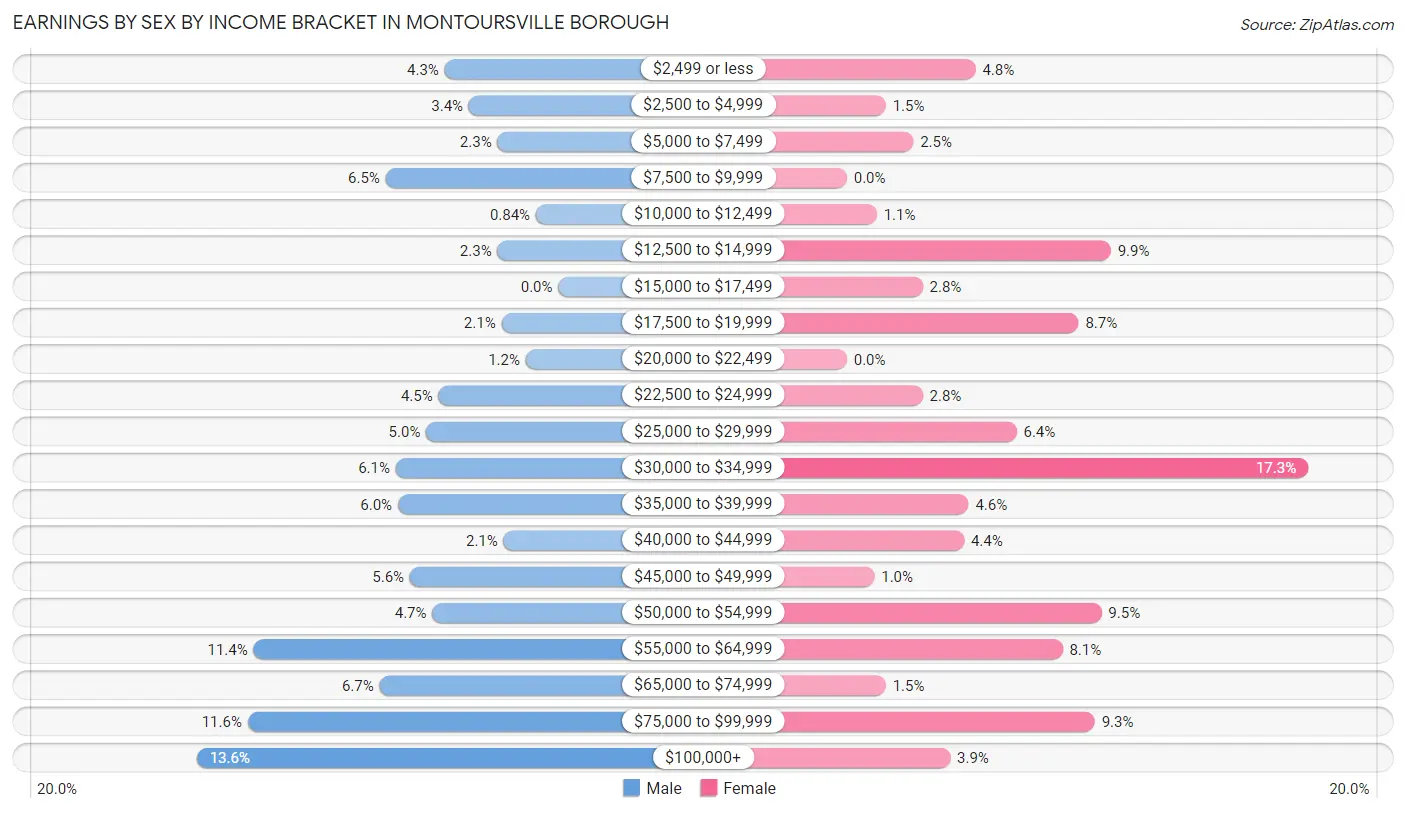
Earnings by Sex by Income Bracket in Montoursville borough
The most common earnings brackets in Montoursville borough are $100,000+ for men (178 | 13.6%) and $30,000 to $34,999 for women (201 | 17.3%).
| Income | Male | Female |
| $2,499 or less | 56 (4.3%) | 56 (4.8%) |
| $2,500 to $4,999 | 44 (3.4%) | 17 (1.5%) |
| $5,000 to $7,499 | 30 (2.3%) | 29 (2.5%) |
| $7,500 to $9,999 | 85 (6.5%) | 0 (0.0%) |
| $10,000 to $12,499 | 11 (0.8%) | 13 (1.1%) |
| $12,500 to $14,999 | 30 (2.3%) | 115 (9.9%) |
| $15,000 to $17,499 | 0 (0.0%) | 33 (2.8%) |
| $17,500 to $19,999 | 28 (2.1%) | 101 (8.7%) |
| $20,000 to $22,499 | 16 (1.2%) | 0 (0.0%) |
| $22,500 to $24,999 | 59 (4.5%) | 33 (2.8%) |
| $25,000 to $29,999 | 65 (5.0%) | 74 (6.4%) |
| $30,000 to $34,999 | 80 (6.1%) | 201 (17.3%) |
| $35,000 to $39,999 | 79 (6.0%) | 53 (4.6%) |
| $40,000 to $44,999 | 27 (2.1%) | 51 (4.4%) |
| $45,000 to $49,999 | 73 (5.6%) | 12 (1.0%) |
| $50,000 to $54,999 | 62 (4.7%) | 111 (9.5%) |
| $55,000 to $64,999 | 150 (11.4%) | 94 (8.1%) |
| $65,000 to $74,999 | 88 (6.7%) | 17 (1.5%) |
| $75,000 to $99,999 | 153 (11.6%) | 108 (9.3%) |
| $100,000+ | 178 (13.6%) | 45 (3.9%) |
| Total | 1,314 (100.0%) | 1,163 (100.0%) |
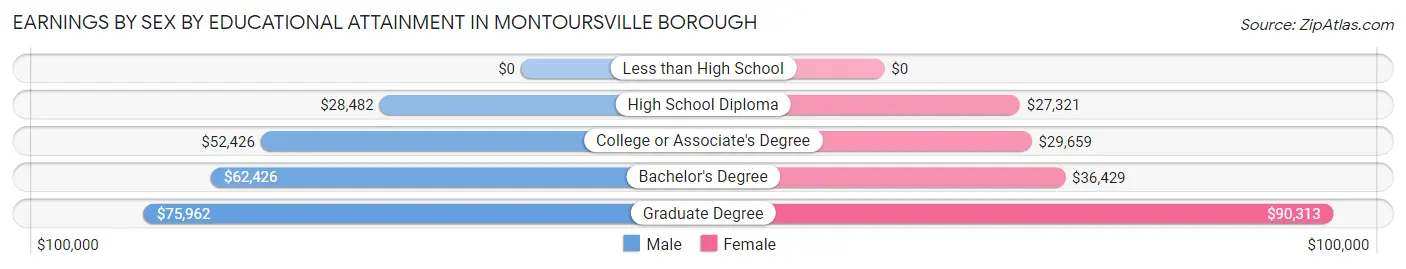
Earnings by Sex by Educational Attainment in Montoursville borough
Average earnings in Montoursville borough are $53,287 for men and $34,637 for women, a difference of 35.0%. Men with an educational attainment of graduate degree enjoy the highest average annual earnings of $75,962, while those with high school diploma education earn the least with $28,482. Women with an educational attainment of graduate degree earn the most with the average annual earnings of $90,313, while those with high school diploma education have the smallest earnings of $27,321.
| Educational Attainment | Male Income | Female Income |
| Less than High School | - | - |
| High School Diploma | $28,482 | $27,321 |
| College or Associate's Degree | $52,426 | $29,659 |
| Bachelor's Degree | $62,426 | $36,429 |
| Graduate Degree | $75,962 | $90,313 |
| Total | $53,287 | $34,637 |
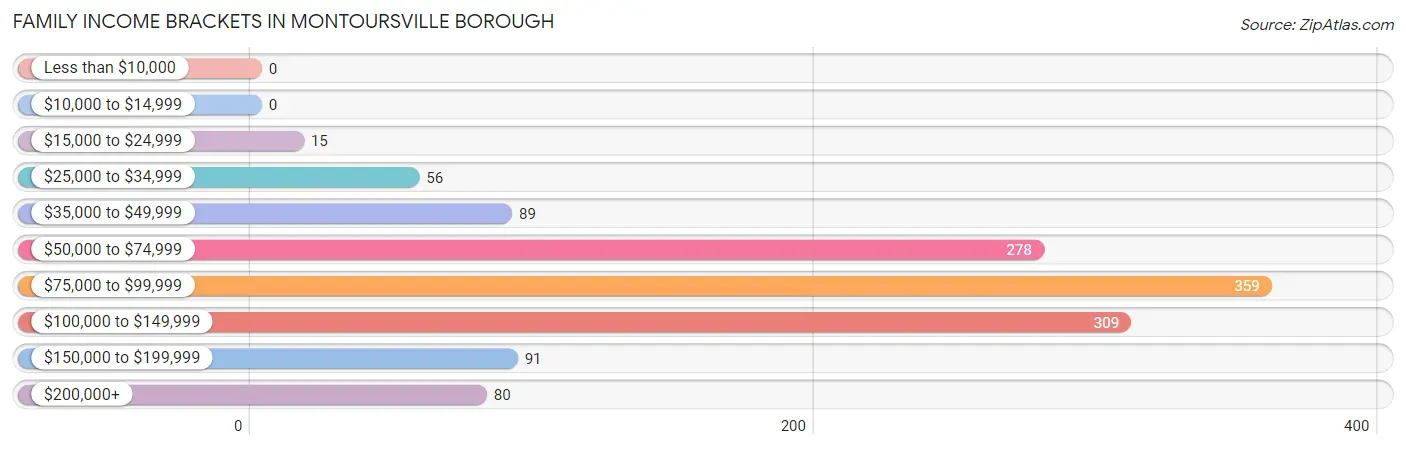
Family Income in Montoursville borough
Family Income Brackets in Montoursville borough
According to the Montoursville borough family income data, there are 359 families falling into the $75,000 to $99,999 income range, which is the most common income bracket and makes up 28.1% of all families.
| Income Bracket | # Families | % Families |
| Less than $10,000 | 0 | 0.0% |
| $10,000 to $14,999 | 0 | 0.0% |
| $15,000 to $24,999 | 15 | 1.2% |
| $25,000 to $34,999 | 56 | 4.4% |
| $35,000 to $49,999 | 89 | 7.0% |
| $50,000 to $74,999 | 278 | 21.8% |
| $75,000 to $99,999 | 359 | 28.1% |
| $100,000 to $149,999 | 309 | 24.2% |
| $150,000 to $199,999 | 91 | 7.1% |
| $200,000+ | 80 | 6.3% |
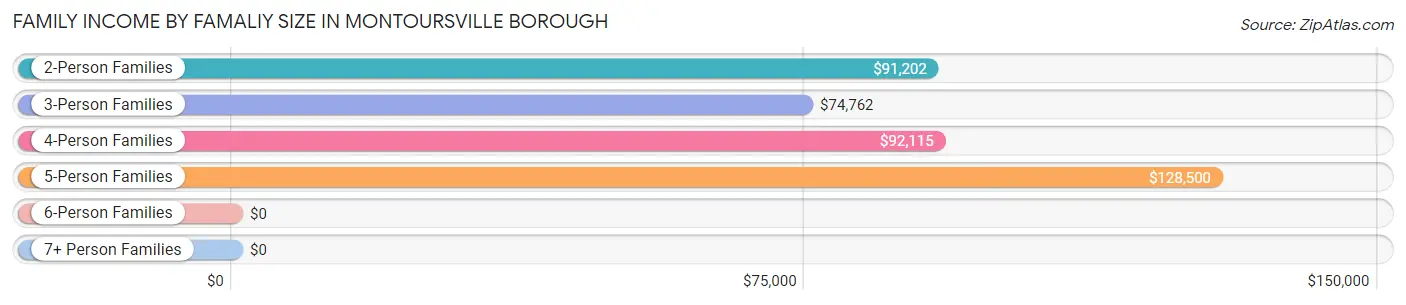
Family Income by Famaliy Size in Montoursville borough
5-person families (158 | 12.4%) account for the highest median family income in Montoursville borough with $128,500 per family, while 2-person families (633 | 49.6%) have the highest median income of $45,601 per family member.
| Income Bracket | # Families | Median Income |
| 2-Person Families | 633 (49.6%) | $91,202 |
| 3-Person Families | 304 (23.8%) | $74,762 |
| 4-Person Families | 148 (11.6%) | $92,115 |
| 5-Person Families | 158 (12.4%) | $128,500 |
| 6-Person Families | 33 (2.6%) | $0 |
| 7+ Person Families | 0 (0.0%) | $0 |
| Total | 1,276 (100.0%) | $90,842 |
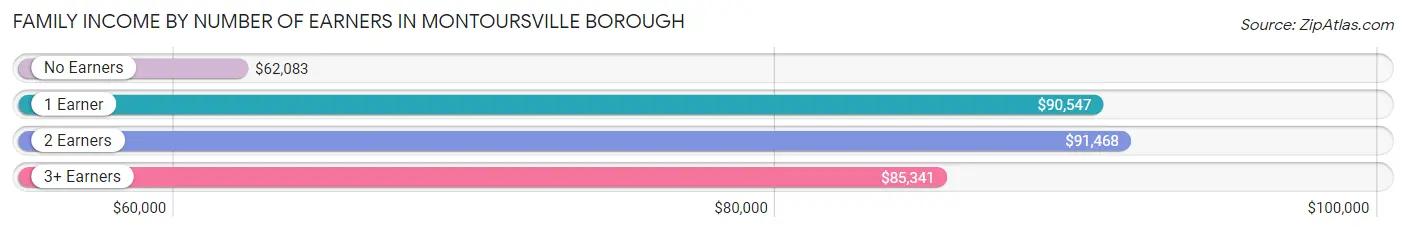
Family Income by Number of Earners in Montoursville borough
The median family income in Montoursville borough is $90,842, with families comprising 2 earners (680) having the highest median family income of $91,468, while families with no earners (171) have the lowest median family income of $62,083, accounting for 53.3% and 13.4% of families, respectively.
| Number of Earners | # Families | Median Income |
| No Earners | 171 (13.4%) | $62,083 |
| 1 Earner | 300 (23.5%) | $90,547 |
| 2 Earners | 680 (53.3%) | $91,468 |
| 3+ Earners | 125 (9.8%) | $85,341 |
| Total | 1,276 (100.0%) | $90,842 |
Household Income in Montoursville borough
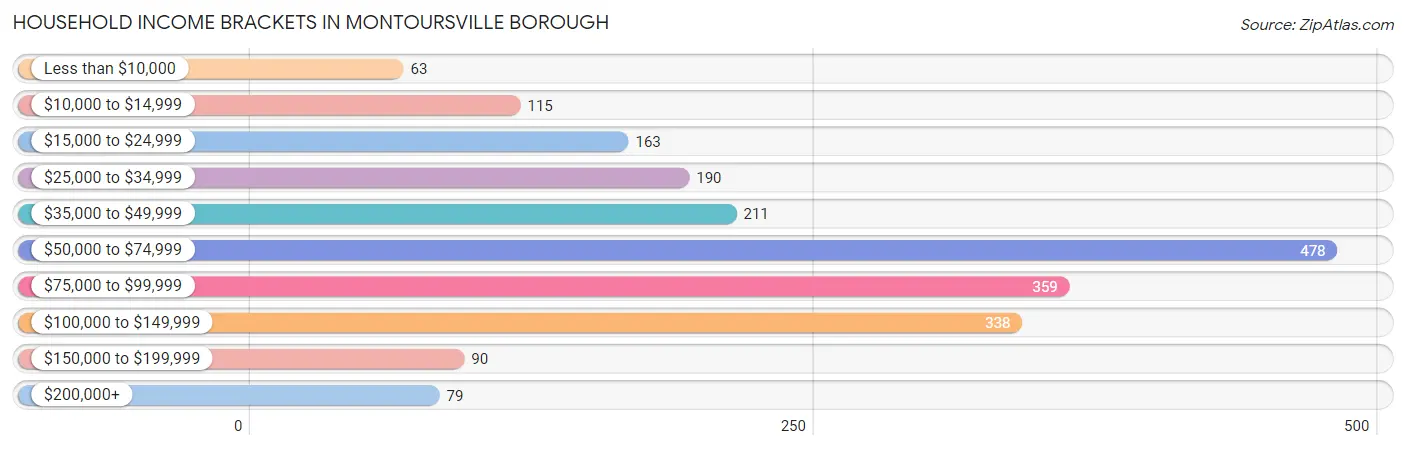
Household Income Brackets in Montoursville borough
With 478 households falling in the category, the $50,000 to $74,999 income range is the most frequent in Montoursville borough, accounting for 22.9% of all households. In contrast, only 63 households (3.0%) fall into the less than $10,000 income bracket, making it the least populous group.
| Income Bracket | # Households | % Households |
| Less than $10,000 | 63 | 3.0% |
| $10,000 to $14,999 | 115 | 5.5% |
| $15,000 to $24,999 | 163 | 7.8% |
| $25,000 to $34,999 | 190 | 9.1% |
| $35,000 to $49,999 | 211 | 10.1% |
| $50,000 to $74,999 | 478 | 22.9% |
| $75,000 to $99,999 | 359 | 17.2% |
| $100,000 to $149,999 | 338 | 16.2% |
| $150,000 to $199,999 | 90 | 4.3% |
| $200,000+ | 79 | 3.8% |
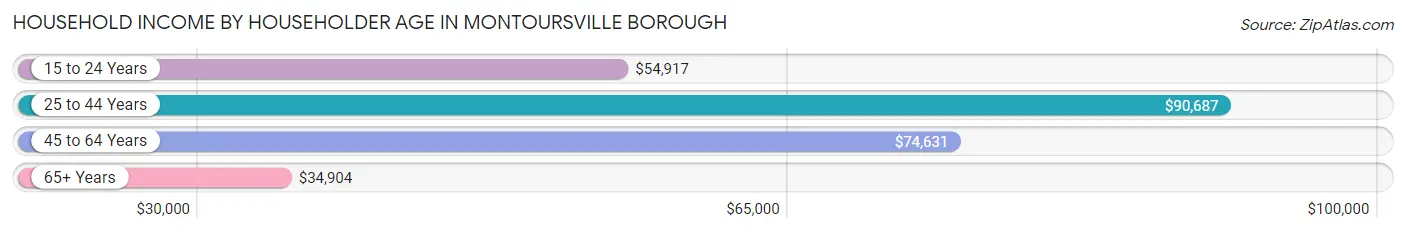
Household Income by Householder Age in Montoursville borough
The median household income in Montoursville borough is $63,899, with the highest median household income of $90,687 found in the 25 to 44 years age bracket for the primary householder. A total of 473 households (22.6%) fall into this category. Meanwhile, the 65+ years age bracket for the primary householder has the lowest median household income of $34,904, with 718 households (34.4%) in this group.
| Income Bracket | # Households | Median Income |
| 15 to 24 Years | 59 (2.8%) | $54,917 |
| 25 to 44 Years | 473 (22.6%) | $90,687 |
| 45 to 64 Years | 839 (40.2%) | $74,631 |
| 65+ Years | 718 (34.4%) | $34,904 |
| Total | 2,089 (100.0%) | $63,899 |
Poverty in Montoursville borough
Income Below Poverty by Sex and Age in Montoursville borough
With 6.4% poverty level for males and 8.1% for females among the residents of Montoursville borough, 75 year old and over males and 6 to 11 year old females are the most vulnerable to poverty, with 57 males (24.6%) and 46 females (56.8%) in their respective age groups living below the poverty level.
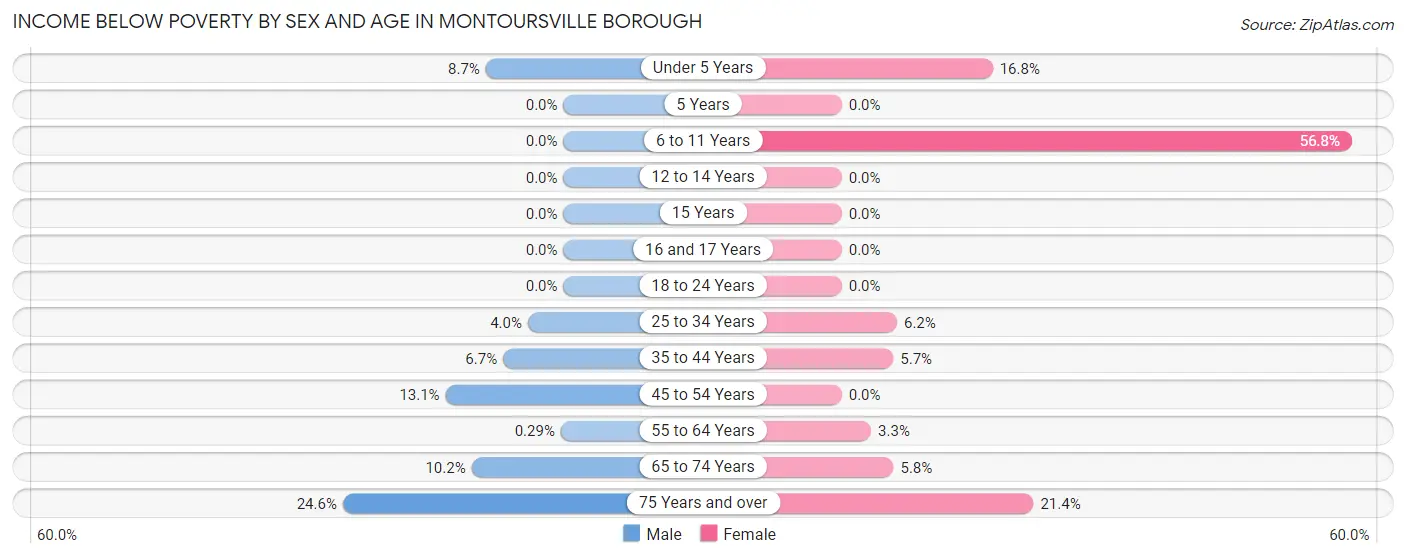
| Age Bracket | Male | Female |
| Under 5 Years | 16 (8.6%) | 19 (16.8%) |
| 5 Years | 0 (0.0%) | 0 (0.0%) |
| 6 to 11 Years | 0 (0.0%) | 46 (56.8%) |
| 12 to 14 Years | 0 (0.0%) | 0 (0.0%) |
| 15 Years | 0 (0.0%) | 0 (0.0%) |
| 16 and 17 Years | 0 (0.0%) | 0 (0.0%) |
| 18 to 24 Years | 0 (0.0%) | 0 (0.0%) |
| 25 to 34 Years | 11 (4.0%) | 15 (6.1%) |
| 35 to 44 Years | 16 (6.7%) | 14 (5.7%) |
| 45 to 54 Years | 34 (13.1%) | 0 (0.0%) |
| 55 to 64 Years | 1 (0.3%) | 14 (3.3%) |
| 65 to 74 Years | 18 (10.2%) | 19 (5.8%) |
| 75 Years and over | 57 (24.6%) | 57 (21.3%) |
| Total | 153 (6.4%) | 184 (8.1%) |
Income Above Poverty by Sex and Age in Montoursville borough
According to the poverty statistics in Montoursville borough, males aged 5 years and females aged 12 to 14 years are the age groups that are most secure financially, with 100.0% of males and 100.0% of females in these age groups living above the poverty line.
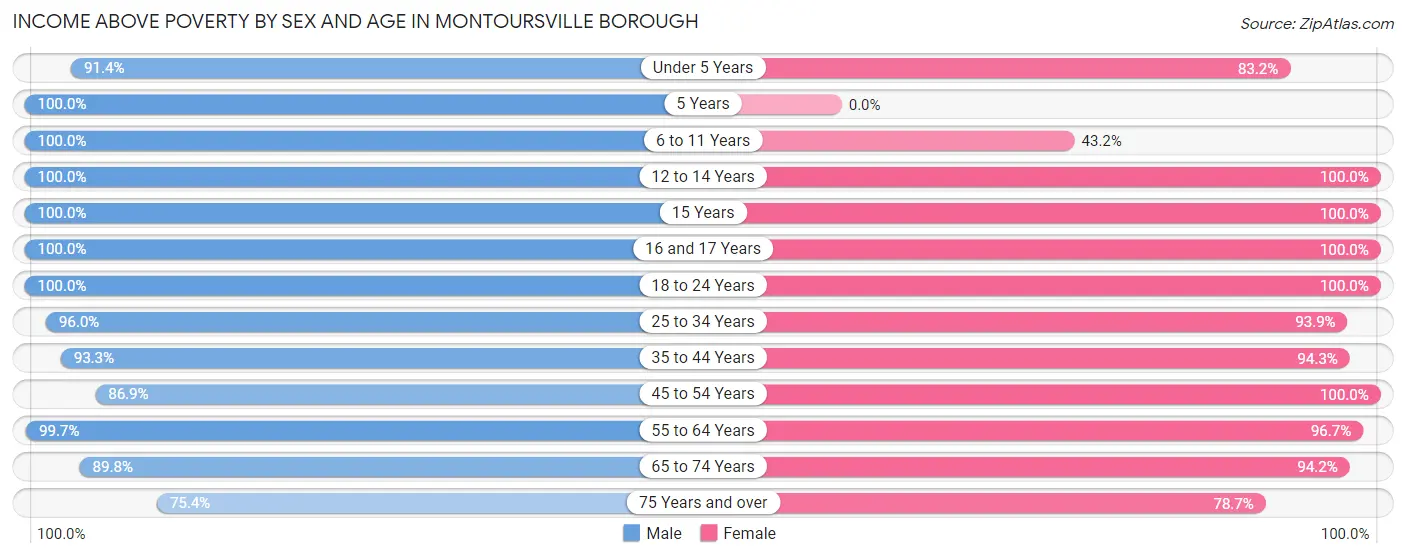
| Age Bracket | Male | Female |
| Under 5 Years | 169 (91.3%) | 94 (83.2%) |
| 5 Years | 68 (100.0%) | 0 (0.0%) |
| 6 to 11 Years | 112 (100.0%) | 35 (43.2%) |
| 12 to 14 Years | 143 (100.0%) | 57 (100.0%) |
| 15 Years | 15 (100.0%) | 17 (100.0%) |
| 16 and 17 Years | 162 (100.0%) | 92 (100.0%) |
| 18 to 24 Years | 194 (100.0%) | 147 (100.0%) |
| 25 to 34 Years | 267 (96.0%) | 229 (93.9%) |
| 35 to 44 Years | 222 (93.3%) | 230 (94.3%) |
| 45 to 54 Years | 225 (86.9%) | 257 (100.0%) |
| 55 to 64 Years | 340 (99.7%) | 414 (96.7%) |
| 65 to 74 Years | 158 (89.8%) | 311 (94.2%) |
| 75 Years and over | 175 (75.4%) | 210 (78.6%) |
| Total | 2,250 (93.6%) | 2,093 (91.9%) |
Income Below Poverty Among Married-Couple Families in Montoursville borough
The poverty statistics for married-couple families in Montoursville borough show that 1.5% or 16 of the total 1,033 families live below the poverty line. Families with 3 or 4 children have the highest poverty rate of 12.3%, comprising of 16 families. On the other hand, families with no children have the lowest poverty rate of 0.0%, which includes 0 families.
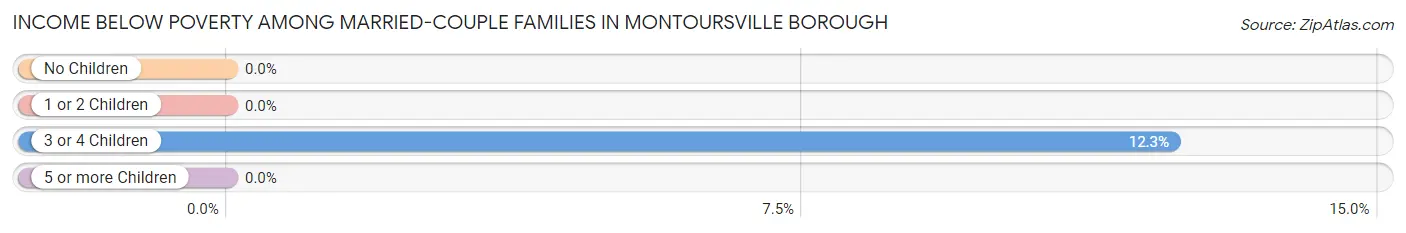
| Children | Above Poverty | Below Poverty |
| No Children | 667 (100.0%) | 0 (0.0%) |
| 1 or 2 Children | 236 (100.0%) | 0 (0.0%) |
| 3 or 4 Children | 114 (87.7%) | 16 (12.3%) |
| 5 or more Children | 0 (0.0%) | 0 (0.0%) |
| Total | 1,017 (98.5%) | 16 (1.5%) |
Income Below Poverty Among Single-Parent Households in Montoursville borough
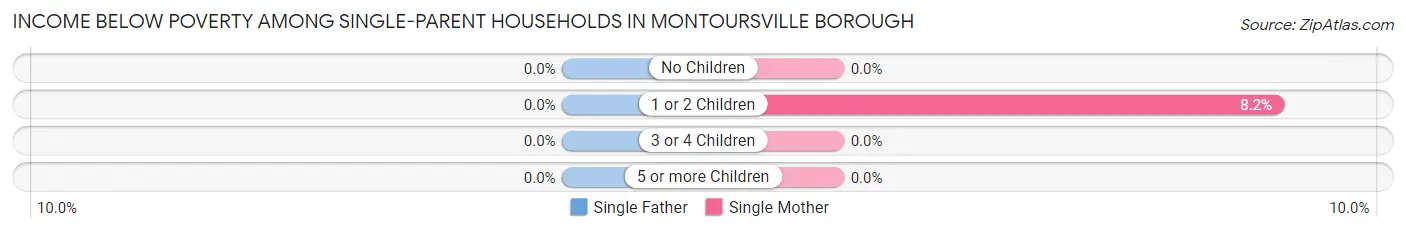
| Children | Single Father | Single Mother |
| No Children | 0 (0.0%) | 0 (0.0%) |
| 1 or 2 Children | 0 (0.0%) | 15 (8.2%) |
| 3 or 4 Children | 0 (0.0%) | 0 (0.0%) |
| 5 or more Children | 0 (0.0%) | 0 (0.0%) |
| Total | 0 (0.0%) | 15 (6.2%) |
Income Below Poverty Among Married-Couple vs Single-Parent Households in Montoursville borough
The poverty data for Montoursville borough shows that 16 of the married-couple family households (1.5%) and 15 of the single-parent households (6.2%) are living below the poverty level. Within the married-couple family households, those with 3 or 4 children have the highest poverty rate, with 16 households (12.3%) falling below the poverty line. Among the single-parent households, those with 1 or 2 children have the highest poverty rate, with 15 household (8.2%) living below poverty.
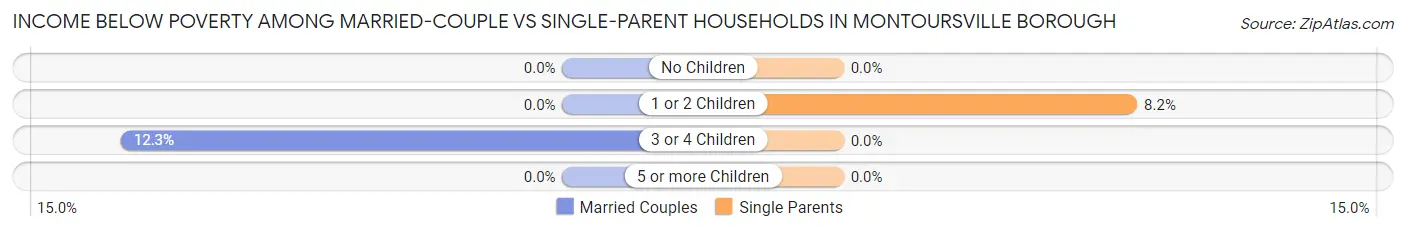
| Children | Married-Couple Families | Single-Parent Households |
| No Children | 0 (0.0%) | 0 (0.0%) |
| 1 or 2 Children | 0 (0.0%) | 15 (8.2%) |
| 3 or 4 Children | 16 (12.3%) | 0 (0.0%) |
| 5 or more Children | 0 (0.0%) | 0 (0.0%) |
| Total | 16 (1.5%) | 15 (6.2%) |
Race in Montoursville borough
The most populous races in Montoursville borough are White / Caucasian (4,638 | 98.2%), Hispanic or Latino (82 | 1.7%), and Two or more Races (67 | 1.4%).
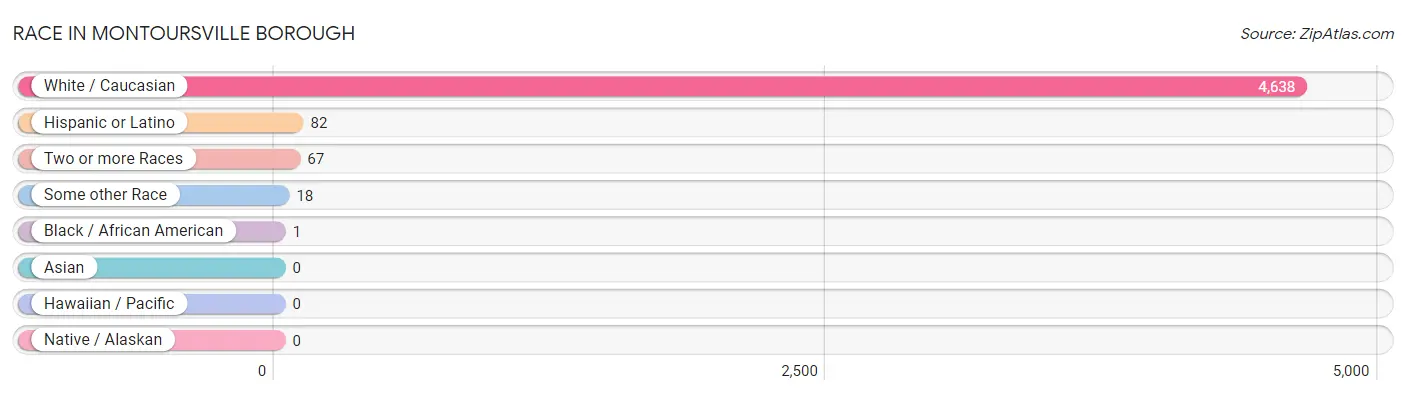
| Race | # Population | % Population |
| Asian | 0 | 0.0% |
| Black / African American | 1 | 0.0% |
| Hawaiian / Pacific | 0 | 0.0% |
| Hispanic or Latino | 82 | 1.7% |
| Native / Alaskan | 0 | 0.0% |
| White / Caucasian | 4,638 | 98.2% |
| Two or more Races | 67 | 1.4% |
| Some other Race | 18 | 0.4% |
| Total | 4,724 | 100.0% |
Ancestry in Montoursville borough
The most populous ancestries reported in Montoursville borough are German (1,346 | 28.5%), Irish (952 | 20.2%), American (829 | 17.5%), Italian (443 | 9.4%), and English (404 | 8.6%), together accounting for 84.1% of all Montoursville borough residents.
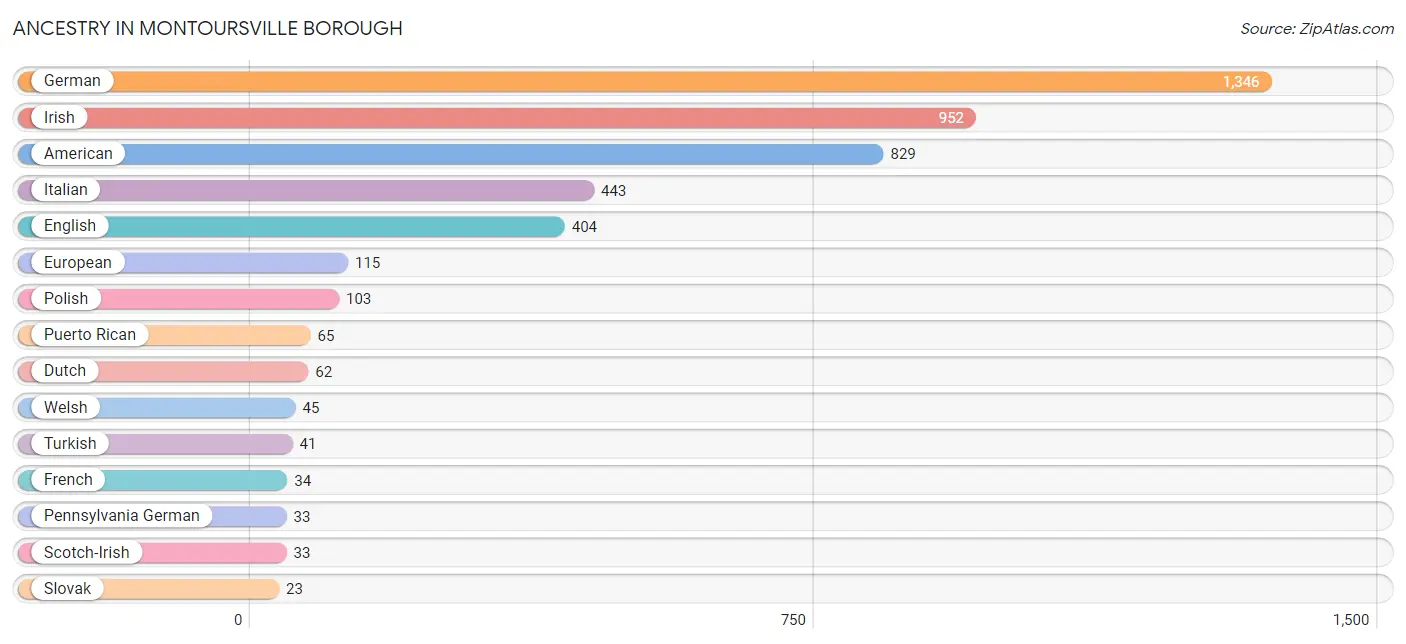
| Ancestry | # Population | % Population |
| American | 829 | 17.5% |
| British | 20 | 0.4% |
| Dutch | 62 | 1.3% |
| English | 404 | 8.6% |
| European | 115 | 2.4% |
| French | 34 | 0.7% |
| German | 1,346 | 28.5% |
| Irish | 952 | 20.2% |
| Italian | 443 | 9.4% |
| Lithuanian | 15 | 0.3% |
| Pakistani | 18 | 0.4% |
| Pennsylvania German | 33 | 0.7% |
| Polish | 103 | 2.2% |
| Puerto Rican | 65 | 1.4% |
| Russian | 14 | 0.3% |
| Scotch-Irish | 33 | 0.7% |
| Slovak | 23 | 0.5% |
| Spaniard | 17 | 0.4% |
| Swiss | 15 | 0.3% |
| Turkish | 41 | 0.9% |
| Ukrainian | 20 | 0.4% |
| Welsh | 45 | 0.9% | View All 22 Rows |
Immigrants in Montoursville borough
The most numerous immigrant groups reported in Montoursville borough came from Asia (41 | 0.9%), Turkey (41 | 0.9%), and Western Asia (41 | 0.9%), together accounting for 2.6% of all Montoursville borough residents.
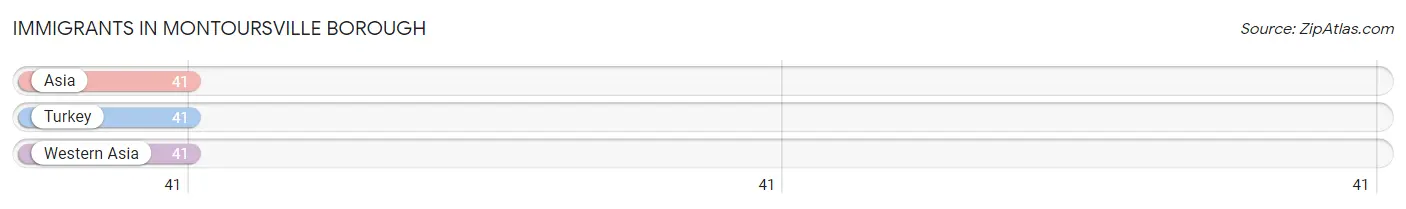
| Immigration Origin | # Population | % Population |
| Asia | 41 | 0.9% |
| Turkey | 41 | 0.9% |
| Western Asia | 41 | 0.9% | View All 3 Rows |
Sex and Age in Montoursville borough
Sex and Age in Montoursville borough
The most populous age groups in Montoursville borough are 10 to 14 Years (215 | 8.9%) for men and 60 to 64 Years (269 | 11.6%) for women.
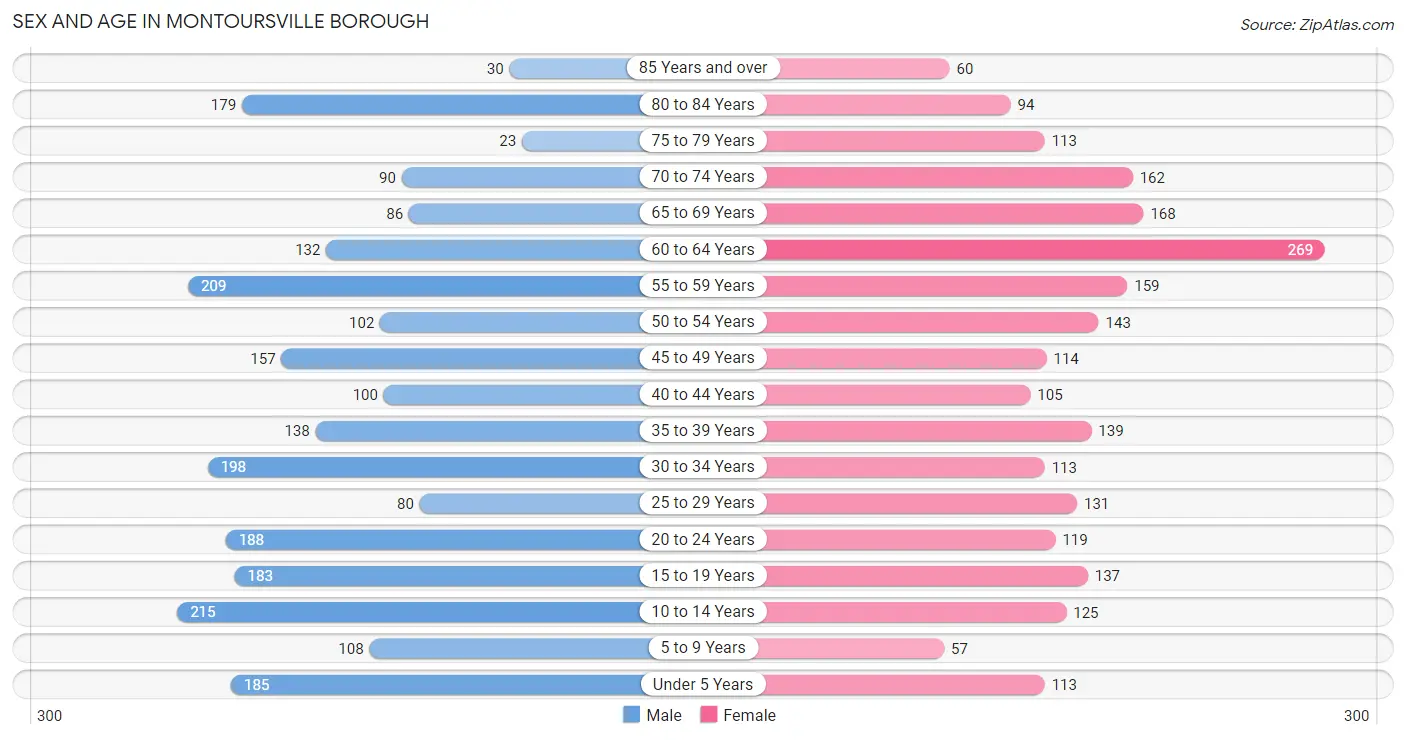
| Age Bracket | Male | Female |
| Under 5 Years | 185 (7.7%) | 113 (4.9%) |
| 5 to 9 Years | 108 (4.5%) | 57 (2.5%) |
| 10 to 14 Years | 215 (8.9%) | 125 (5.4%) |
| 15 to 19 Years | 183 (7.6%) | 137 (5.9%) |
| 20 to 24 Years | 188 (7.8%) | 119 (5.1%) |
| 25 to 29 Years | 80 (3.3%) | 131 (5.6%) |
| 30 to 34 Years | 198 (8.2%) | 113 (4.9%) |
| 35 to 39 Years | 138 (5.7%) | 139 (6.0%) |
| 40 to 44 Years | 100 (4.2%) | 105 (4.5%) |
| 45 to 49 Years | 157 (6.5%) | 114 (4.9%) |
| 50 to 54 Years | 102 (4.2%) | 143 (6.2%) |
| 55 to 59 Years | 209 (8.7%) | 159 (6.9%) |
| 60 to 64 Years | 132 (5.5%) | 269 (11.6%) |
| 65 to 69 Years | 86 (3.6%) | 168 (7.2%) |
| 70 to 74 Years | 90 (3.7%) | 162 (7.0%) |
| 75 to 79 Years | 23 (1.0%) | 113 (4.9%) |
| 80 to 84 Years | 179 (7.4%) | 94 (4.1%) |
| 85 Years and over | 30 (1.3%) | 60 (2.6%) |
| Total | 2,403 (100.0%) | 2,321 (100.0%) |
Families and Households in Montoursville borough
Median Family Size in Montoursville borough
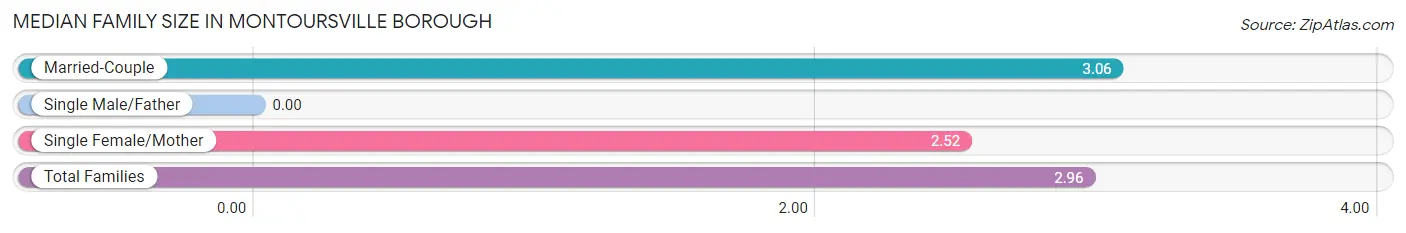
| Family Type | # Families | Family Size |
| Married-Couple | 1,033 (81.0%) | 3.06 |
| Single Male/Father | 0 (0.0%) | - |
| Single Female/Mother | 243 (19.0%) | 2.52 |
| Total Families | 1,276 (100.0%) | 2.96 |
Median Household Size in Montoursville borough
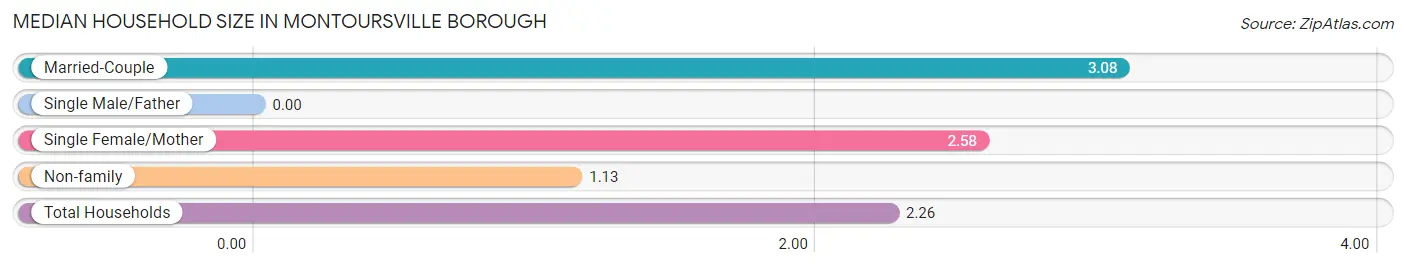
| Household Type | # Households | Household Size |
| Married-Couple | 1,033 (49.4%) | 3.08 |
| Single Male/Father | 0 (0.0%) | - |
| Single Female/Mother | 243 (11.6%) | 2.58 |
| Non-family | 813 (38.9%) | 1.13 |
| Total Households | 2,089 (100.0%) | 2.26 |
Household Size by Marriage Status in Montoursville borough
Out of a total of 2,089 households in Montoursville borough, 1,276 (61.1%) are family households, while 813 (38.9%) are nonfamily households. The most numerous type of family households are 2-person households, comprising 606, and the most common type of nonfamily households are 1-person households, comprising 763.
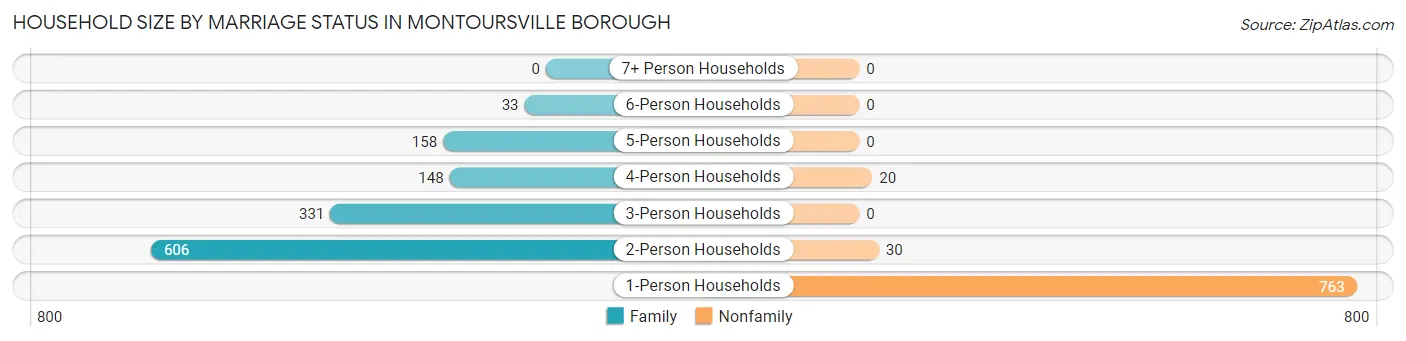
| Household Size | Family Households | Nonfamily Households |
| 1-Person Households | - | 763 (36.5%) |
| 2-Person Households | 606 (29.0%) | 30 (1.4%) |
| 3-Person Households | 331 (15.8%) | 0 (0.0%) |
| 4-Person Households | 148 (7.1%) | 20 (1.0%) |
| 5-Person Households | 158 (7.6%) | 0 (0.0%) |
| 6-Person Households | 33 (1.6%) | 0 (0.0%) |
| 7+ Person Households | 0 (0.0%) | 0 (0.0%) |
| Total | 1,276 (61.1%) | 813 (38.9%) |
Female Fertility in Montoursville borough
Fertility by Age in Montoursville borough
Average fertility rate in Montoursville borough is 51.0 births per 1,000 women. Women in the age bracket of 20 to 34 years have the highest fertility rate with 124.0 births per 1,000 women. Women in the age bracket of 20 to 34 years acount for 100.0% of all women with births.
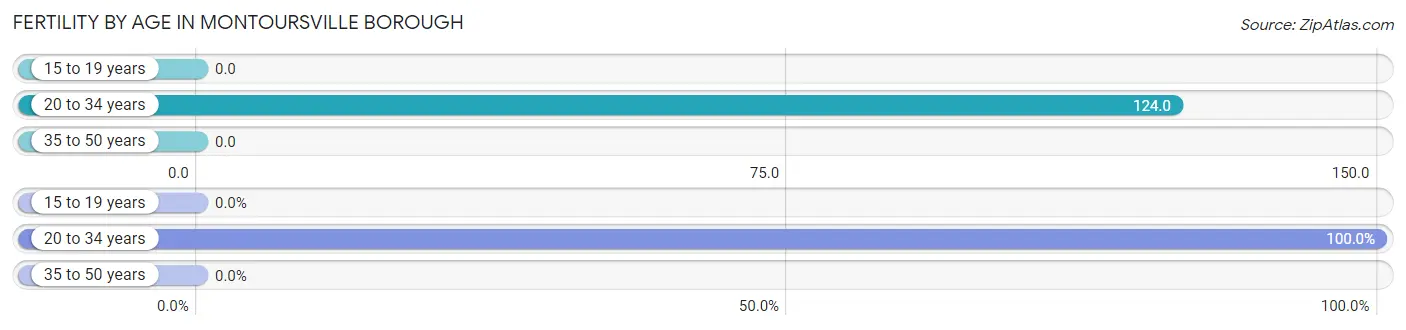
| Age Bracket | Women with Births | Births / 1,000 Women |
| 15 to 19 years | 0 (0.0%) | 0.0 |
| 20 to 34 years | 45 (100.0%) | 124.0 |
| 35 to 50 years | 0 (0.0%) | 0.0 |
| Total | 45 (100.0%) | 51.0 |
Fertility by Age by Marriage Status in Montoursville borough
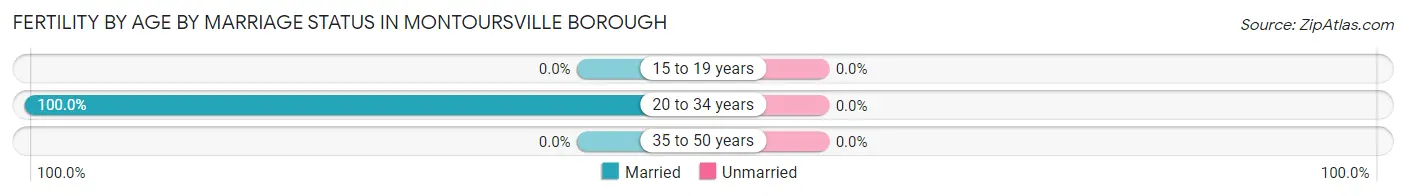
| Age Bracket | Married | Unmarried |
| 15 to 19 years | 0 (0.0%) | 0 (0.0%) |
| 20 to 34 years | 45 (100.0%) | 0 (0.0%) |
| 35 to 50 years | 0 (0.0%) | 0 (0.0%) |
| Total | 45 (100.0%) | 0 (0.0%) |
Fertility by Education in Montoursville borough
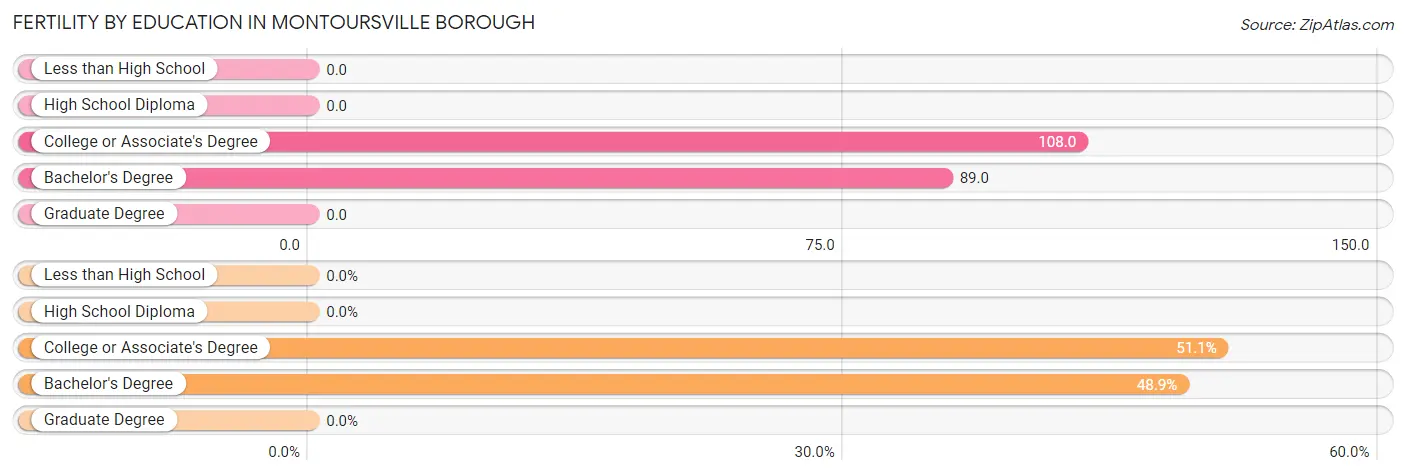
| Educational Attainment | Women with Births | Births / 1,000 Women |
| Less than High School | 0 (0.0%) | 0.0 |
| High School Diploma | 0 (0.0%) | 0.0 |
| College or Associate's Degree | 23 (51.1%) | 108.0 |
| Bachelor's Degree | 22 (48.9%) | 89.0 |
| Graduate Degree | 0 (0.0%) | 0.0 |
| Total | 45 (100.0%) | 51.0 |
Fertility by Education by Marriage Status in Montoursville borough
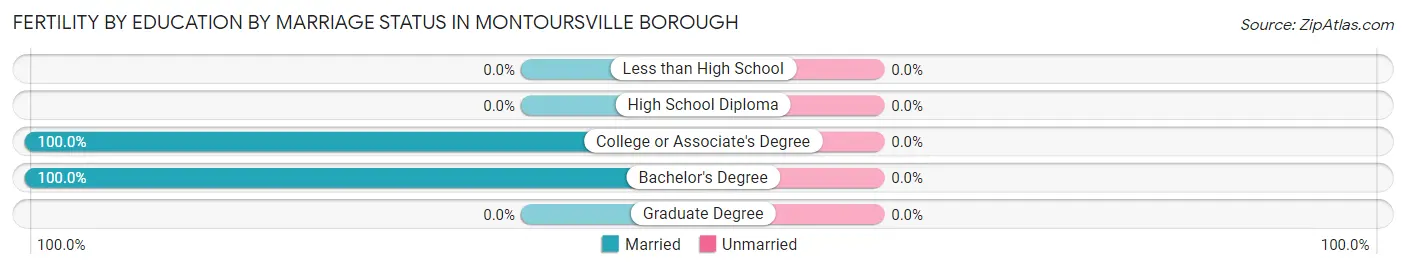
| Educational Attainment | Married | Unmarried |
| Less than High School | 0 (0.0%) | 0 (0.0%) |
| High School Diploma | 0 (0.0%) | 0 (0.0%) |
| College or Associate's Degree | 23 (100.0%) | 0 (0.0%) |
| Bachelor's Degree | 22 (100.0%) | 0 (0.0%) |
| Graduate Degree | 0 (0.0%) | 0 (0.0%) |
| Total | 45 (100.0%) | 0 (0.0%) |
Employment Characteristics in Montoursville borough
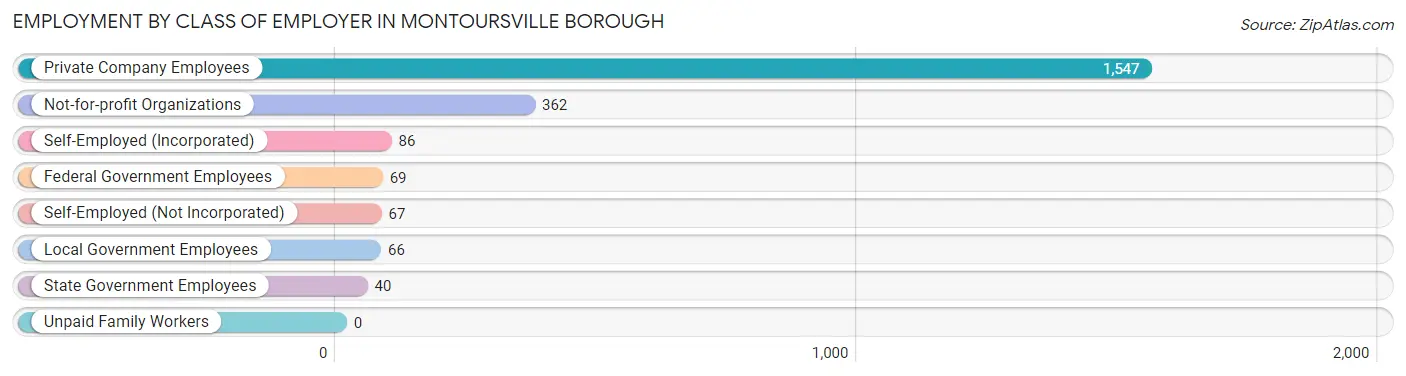
Employment by Class of Employer in Montoursville borough
Among the 2,237 employed individuals in Montoursville borough, private company employees (1,547 | 69.2%), not-for-profit organizations (362 | 16.2%), and self-employed (incorporated) (86 | 3.8%) make up the most common classes of employment.
| Employer Class | # Employees | % Employees |
| Private Company Employees | 1,547 | 69.2% |
| Self-Employed (Incorporated) | 86 | 3.8% |
| Self-Employed (Not Incorporated) | 67 | 3.0% |
| Not-for-profit Organizations | 362 | 16.2% |
| Local Government Employees | 66 | 2.9% |
| State Government Employees | 40 | 1.8% |
| Federal Government Employees | 69 | 3.1% |
| Unpaid Family Workers | 0 | 0.0% |
| Total | 2,237 | 100.0% |
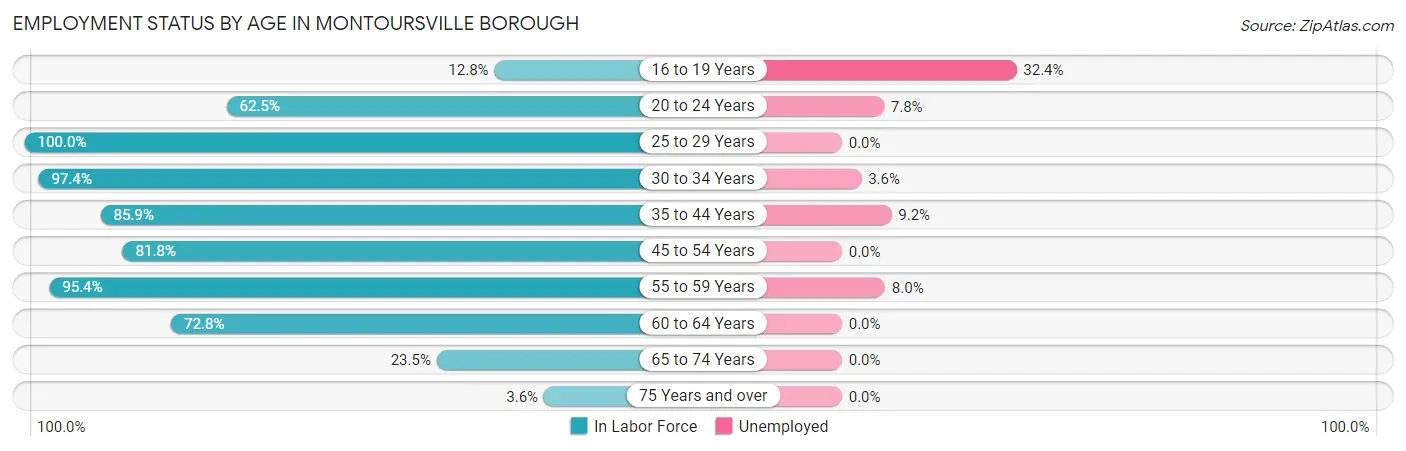
Employment Status by Age in Montoursville borough
According to the labor force statistics for Montoursville borough, out of the total population over 16 years of age (3,889), 60.7% or 2,361 individuals are in the labor force, with 4.4% or 104 of them unemployed. The age group with the highest labor force participation rate is 25 to 29 years, with 100.0% or 211 individuals in the labor force. Within the labor force, the 16 to 19 years age range has the highest percentage of unemployed individuals, with 32.4% or 12 of them being unemployed.
| Age Bracket | In Labor Force | Unemployed |
| 16 to 19 Years | 37 (12.8%) | 12 (32.4%) |
| 20 to 24 Years | 192 (62.5%) | 15 (7.8%) |
| 25 to 29 Years | 211 (100.0%) | 0 (0.0%) |
| 30 to 34 Years | 303 (97.4%) | 11 (3.6%) |
| 35 to 44 Years | 414 (85.9%) | 38 (9.2%) |
| 45 to 54 Years | 422 (81.8%) | 0 (0.0%) |
| 55 to 59 Years | 351 (95.4%) | 28 (8.0%) |
| 60 to 64 Years | 292 (72.8%) | 0 (0.0%) |
| 65 to 74 Years | 119 (23.5%) | 0 (0.0%) |
| 75 Years and over | 18 (3.6%) | 0 (0.0%) |
| Total | 2,361 (60.7%) | 104 (4.4%) |
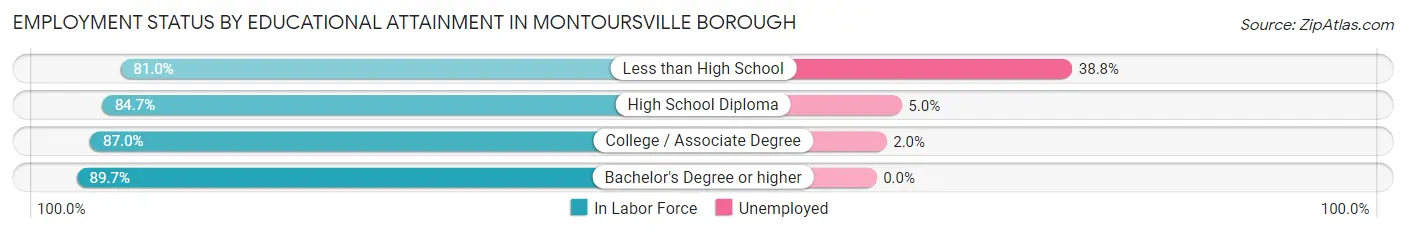
Employment Status by Educational Attainment in Montoursville borough
According to labor force statistics for Montoursville borough, 87.1% of individuals (1,994) out of the total population between 25 and 64 years of age (2,289) are in the labor force, with 3.9% or 78 of them being unemployed. The group with the highest labor force participation rate are those with the educational attainment of bachelor's degree or higher, with 89.7% or 783 individuals in the labor force. Within the labor force, individuals with less than high school education have the highest percentage of unemployment, with 38.8% or 38 of them being unemployed.
| Educational Attainment | In Labor Force | Unemployed |
| Less than High School | 98 (81.0%) | 47 (38.8%) |
| High School Diploma | 561 (84.7%) | 33 (5.0%) |
| College / Associate Degree | 551 (87.0%) | 13 (2.0%) |
| Bachelor's Degree or higher | 783 (89.7%) | 0 (0.0%) |
| Total | 1,994 (87.1%) | 89 (3.9%) |
Employment Occupations by Sex in Montoursville borough
Management, Business, Science and Arts Occupations
The most common Management, Business, Science and Arts occupations in Montoursville borough are Community & Social Service (288 | 12.8%), Management (268 | 11.9%), Education, Arts & Media (145 | 6.4%), Business & Financial (135 | 6.0%), and Education Instruction & Library (126 | 5.6%).
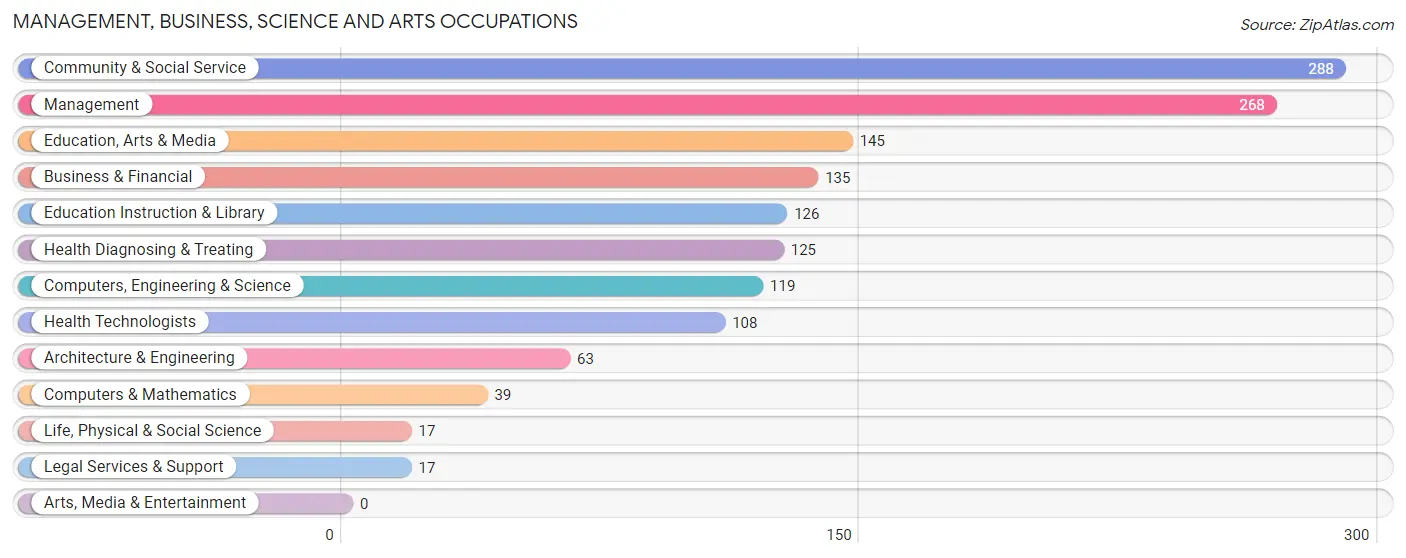
Management, Business, Science and Arts Occupations by Sex
Within the Management, Business, Science and Arts occupations in Montoursville borough, the most male-oriented occupations are Architecture & Engineering (100.0%), Life, Physical & Social Science (100.0%), and Computers, Engineering & Science (91.6%), while the most female-oriented occupations are Legal Services & Support (100.0%), Business & Financial (86.7%), and Health Diagnosing & Treating (85.6%).
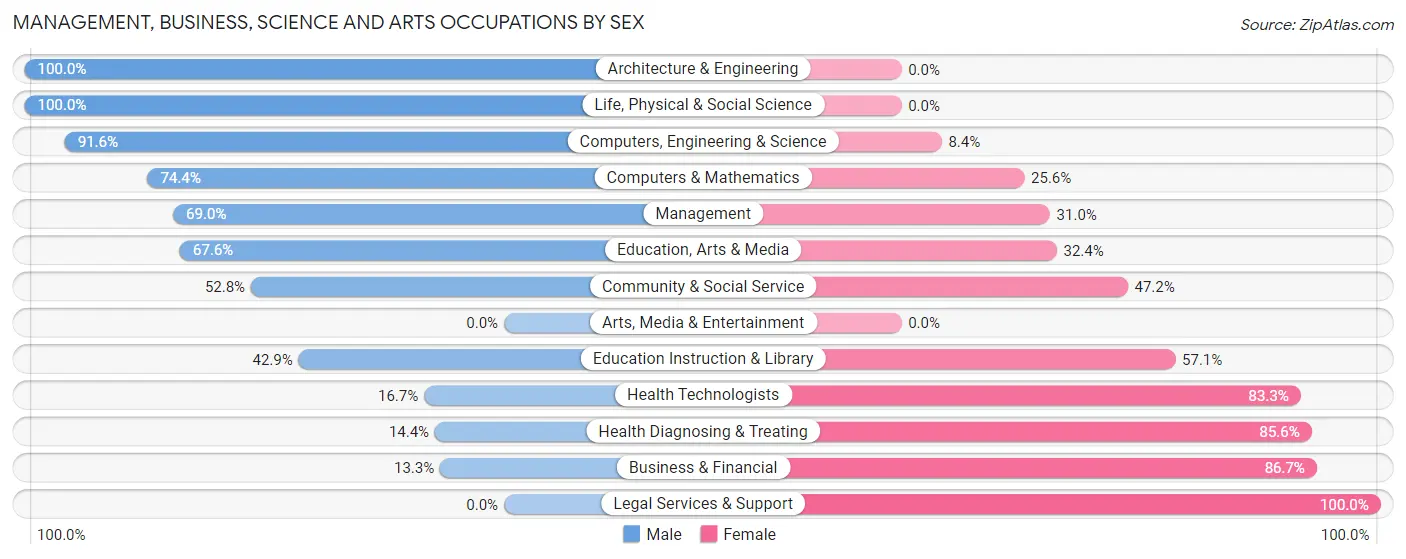
| Occupation | Male | Female |
| Management | 185 (69.0%) | 83 (31.0%) |
| Business & Financial | 18 (13.3%) | 117 (86.7%) |
| Computers, Engineering & Science | 109 (91.6%) | 10 (8.4%) |
| Computers & Mathematics | 29 (74.4%) | 10 (25.6%) |
| Architecture & Engineering | 63 (100.0%) | 0 (0.0%) |
| Life, Physical & Social Science | 17 (100.0%) | 0 (0.0%) |
| Community & Social Service | 152 (52.8%) | 136 (47.2%) |
| Education, Arts & Media | 98 (67.6%) | 47 (32.4%) |
| Legal Services & Support | 0 (0.0%) | 17 (100.0%) |
| Education Instruction & Library | 54 (42.9%) | 72 (57.1%) |
| Arts, Media & Entertainment | 0 (0.0%) | 0 (0.0%) |
| Health Diagnosing & Treating | 18 (14.4%) | 107 (85.6%) |
| Health Technologists | 18 (16.7%) | 90 (83.3%) |
| Total (Category) | 482 (51.5%) | 453 (48.4%) |
| Total (Overall) | 1,175 (52.1%) | 1,080 (47.9%) |
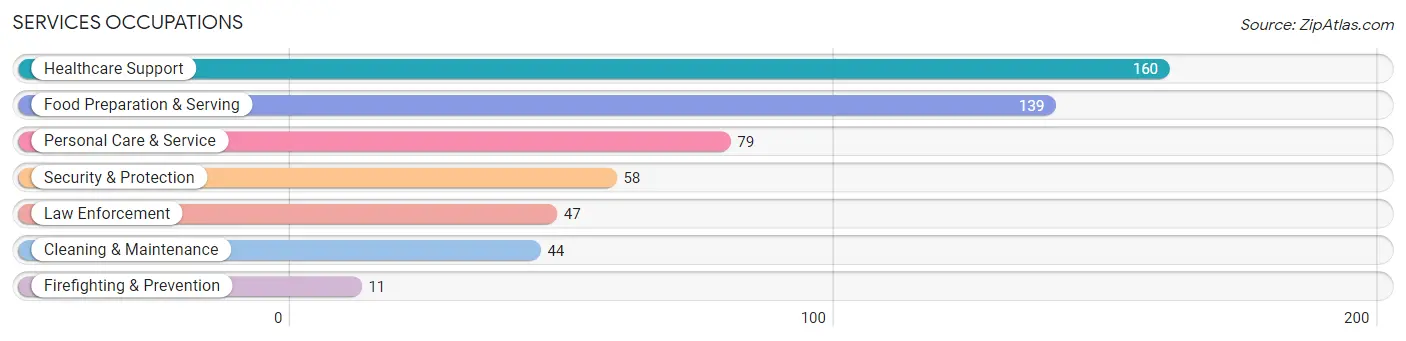
Services Occupations
The most common Services occupations in Montoursville borough are Healthcare Support (160 | 7.1%), Food Preparation & Serving (139 | 6.2%), Personal Care & Service (79 | 3.5%), Security & Protection (58 | 2.6%), and Law Enforcement (47 | 2.1%).
Services Occupations by Sex
Within the Services occupations in Montoursville borough, the most male-oriented occupations are Firefighting & Prevention (100.0%), Security & Protection (72.4%), and Cleaning & Maintenance (68.2%), while the most female-oriented occupations are Healthcare Support (91.9%), Personal Care & Service (77.2%), and Food Preparation & Serving (54.7%).
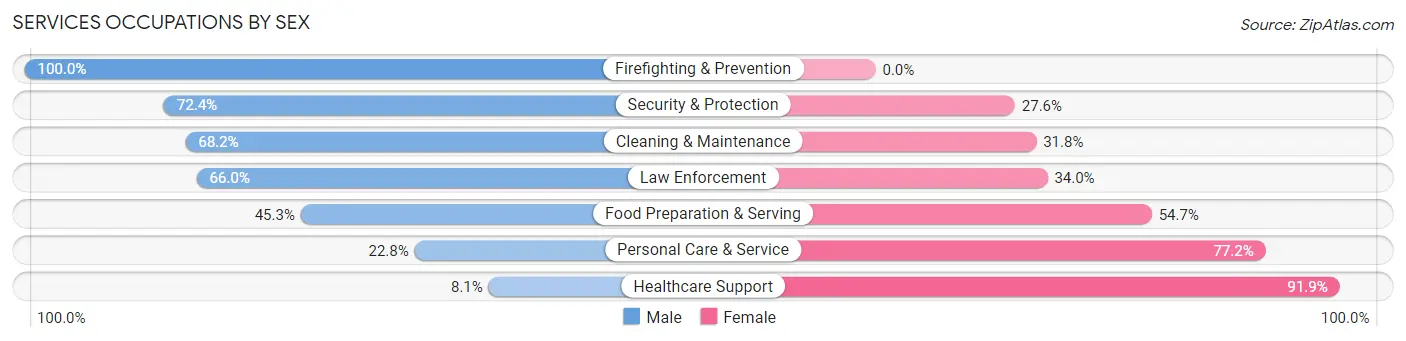
| Occupation | Male | Female |
| Healthcare Support | 13 (8.1%) | 147 (91.9%) |
| Security & Protection | 42 (72.4%) | 16 (27.6%) |
| Firefighting & Prevention | 11 (100.0%) | 0 (0.0%) |
| Law Enforcement | 31 (66.0%) | 16 (34.0%) |
| Food Preparation & Serving | 63 (45.3%) | 76 (54.7%) |
| Cleaning & Maintenance | 30 (68.2%) | 14 (31.8%) |
| Personal Care & Service | 18 (22.8%) | 61 (77.2%) |
| Total (Category) | 166 (34.6%) | 314 (65.4%) |
| Total (Overall) | 1,175 (52.1%) | 1,080 (47.9%) |
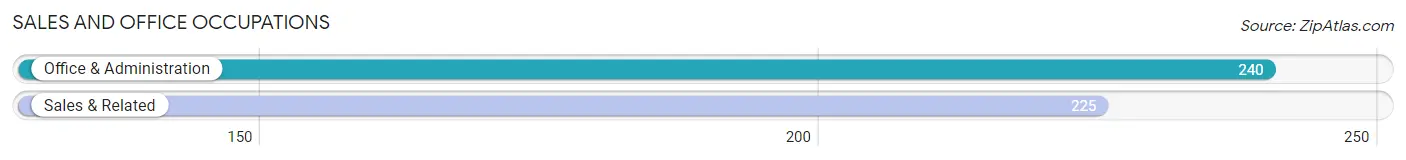
Sales and Office Occupations
The most common Sales and Office occupations in Montoursville borough are Office & Administration (240 | 10.6%), and Sales & Related (225 | 10.0%).
Sales and Office Occupations by Sex
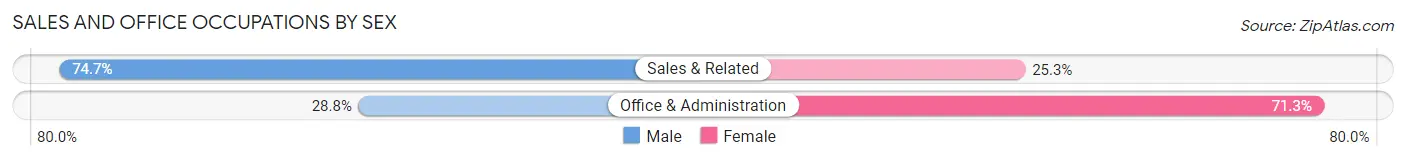
| Occupation | Male | Female |
| Sales & Related | 168 (74.7%) | 57 (25.3%) |
| Office & Administration | 69 (28.7%) | 171 (71.3%) |
| Total (Category) | 237 (51.0%) | 228 (49.0%) |
| Total (Overall) | 1,175 (52.1%) | 1,080 (47.9%) |
Natural Resources, Construction and Maintenance Occupations
The most common Natural Resources, Construction and Maintenance occupations in Montoursville borough are Construction & Extraction (114 | 5.1%), and Installation, Maintenance & Repair (15 | 0.7%).
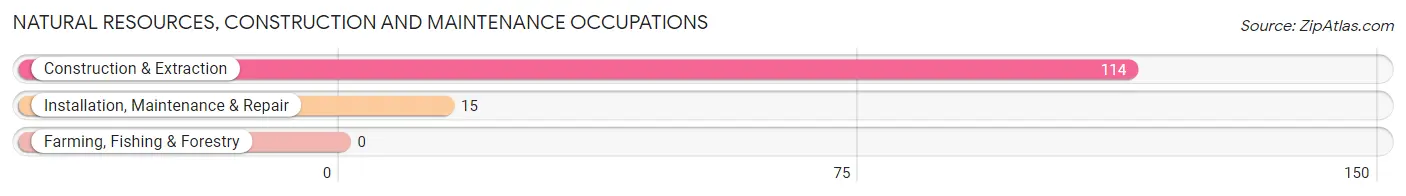
Natural Resources, Construction and Maintenance Occupations by Sex

| Occupation | Male | Female |
| Farming, Fishing & Forestry | 0 (0.0%) | 0 (0.0%) |
| Construction & Extraction | 102 (89.5%) | 12 (10.5%) |
| Installation, Maintenance & Repair | 15 (100.0%) | 0 (0.0%) |
| Total (Category) | 117 (90.7%) | 12 (9.3%) |
| Total (Overall) | 1,175 (52.1%) | 1,080 (47.9%) |
Production, Transportation and Moving Occupations
The most common Production, Transportation and Moving occupations in Montoursville borough are Production (135 | 6.0%), Material Moving (81 | 3.6%), and Transportation (30 | 1.3%).
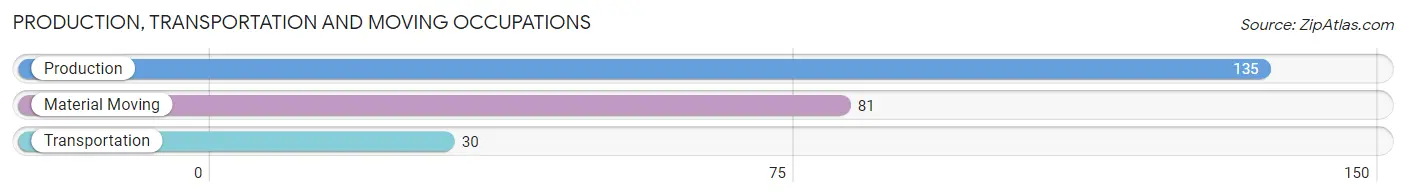
Production, Transportation and Moving Occupations by Sex
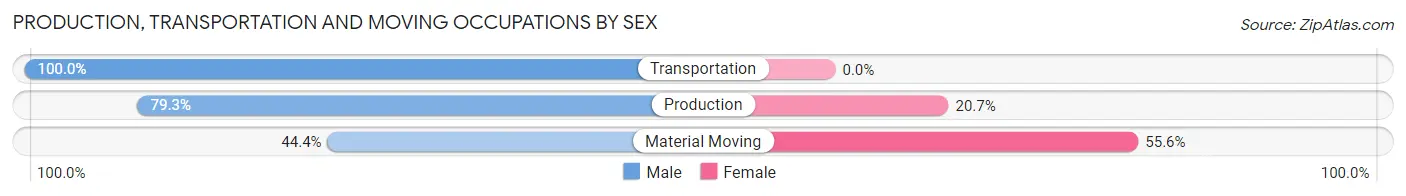
| Occupation | Male | Female |
| Production | 107 (79.3%) | 28 (20.7%) |
| Transportation | 30 (100.0%) | 0 (0.0%) |
| Material Moving | 36 (44.4%) | 45 (55.6%) |
| Total (Category) | 173 (70.3%) | 73 (29.7%) |
| Total (Overall) | 1,175 (52.1%) | 1,080 (47.9%) |
Employment Industries by Sex in Montoursville borough
Employment Industries in Montoursville borough
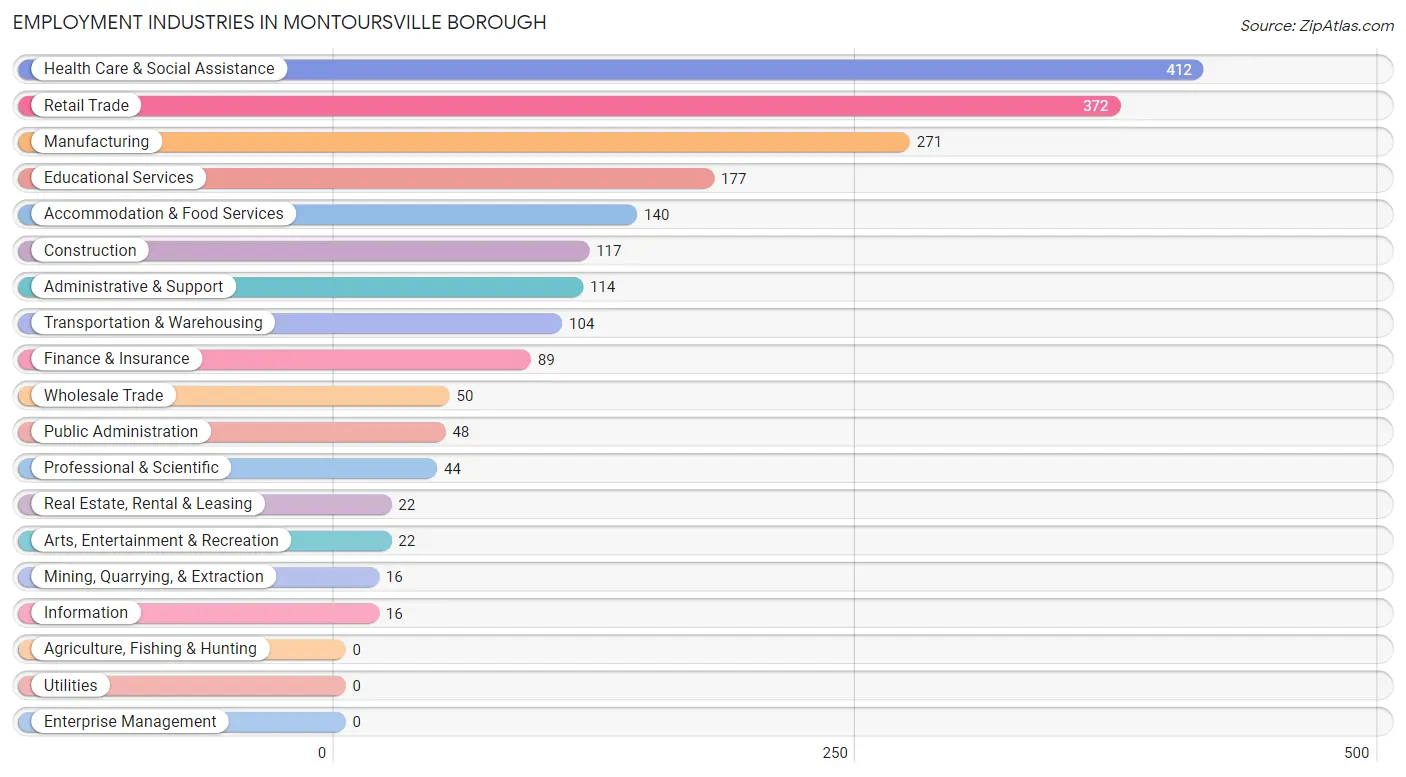
The major employment industries in Montoursville borough include Health Care & Social Assistance (412 | 18.3%), Retail Trade (372 | 16.5%), Manufacturing (271 | 12.0%), Educational Services (177 | 7.9%), and Accommodation & Food Services (140 | 6.2%).
Employment Industries by Sex in Montoursville borough
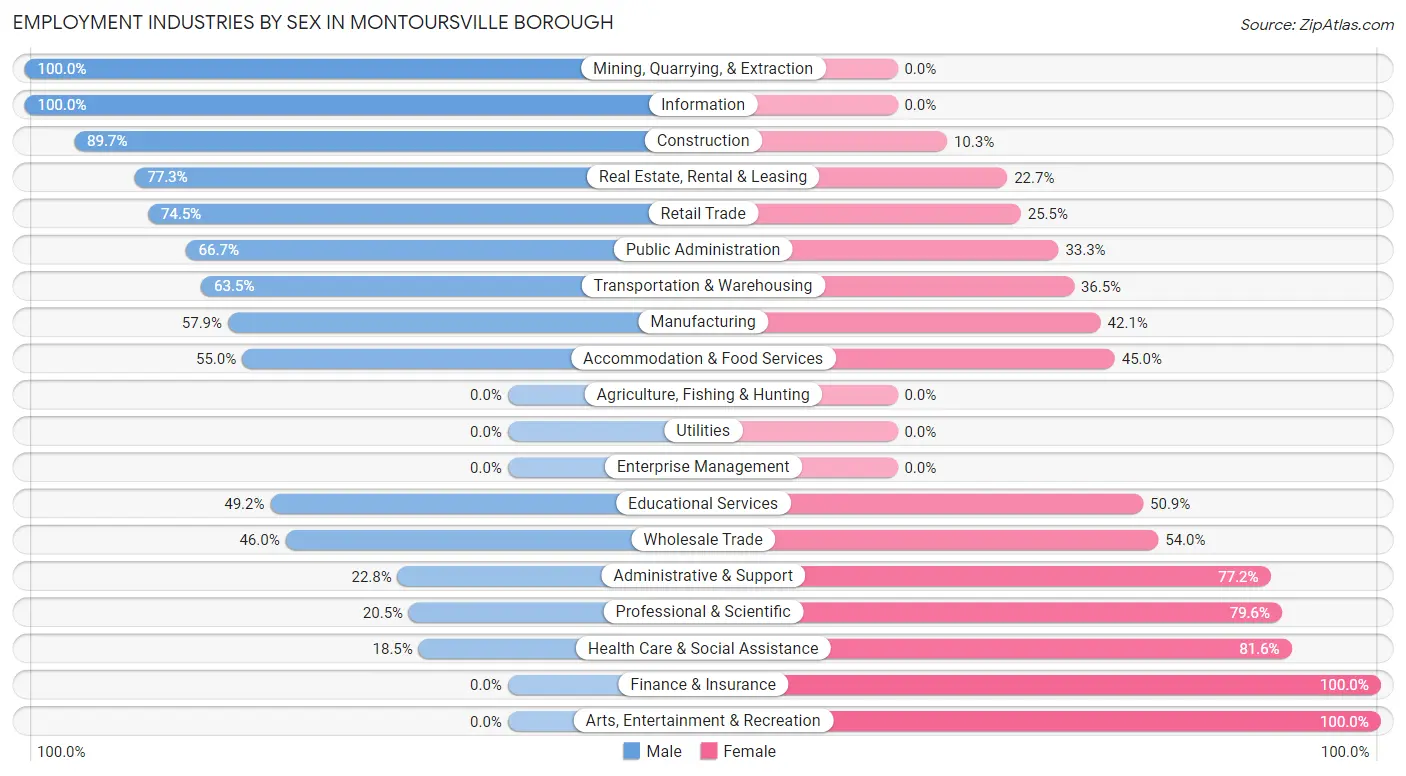
The Montoursville borough industries that see more men than women are Mining, Quarrying, & Extraction (100.0%), Information (100.0%), and Construction (89.7%), whereas the industries that tend to have a higher number of women are Finance & Insurance (100.0%), Arts, Entertainment & Recreation (100.0%), and Health Care & Social Assistance (81.6%).
| Industry | Male | Female |
| Agriculture, Fishing & Hunting | 0 (0.0%) | 0 (0.0%) |
| Mining, Quarrying, & Extraction | 16 (100.0%) | 0 (0.0%) |
| Construction | 105 (89.7%) | 12 (10.3%) |
| Manufacturing | 157 (57.9%) | 114 (42.1%) |
| Wholesale Trade | 23 (46.0%) | 27 (54.0%) |
| Retail Trade | 277 (74.5%) | 95 (25.5%) |
| Transportation & Warehousing | 66 (63.5%) | 38 (36.5%) |
| Utilities | 0 (0.0%) | 0 (0.0%) |
| Information | 16 (100.0%) | 0 (0.0%) |
| Finance & Insurance | 0 (0.0%) | 89 (100.0%) |
| Real Estate, Rental & Leasing | 17 (77.3%) | 5 (22.7%) |
| Professional & Scientific | 9 (20.4%) | 35 (79.5%) |
| Enterprise Management | 0 (0.0%) | 0 (0.0%) |
| Administrative & Support | 26 (22.8%) | 88 (77.2%) |
| Educational Services | 87 (49.1%) | 90 (50.8%) |
| Health Care & Social Assistance | 76 (18.4%) | 336 (81.6%) |
| Arts, Entertainment & Recreation | 0 (0.0%) | 22 (100.0%) |
| Accommodation & Food Services | 77 (55.0%) | 63 (45.0%) |
| Public Administration | 32 (66.7%) | 16 (33.3%) |
| Total | 1,175 (52.1%) | 1,080 (47.9%) |
Education in Montoursville borough
School Enrollment in Montoursville borough
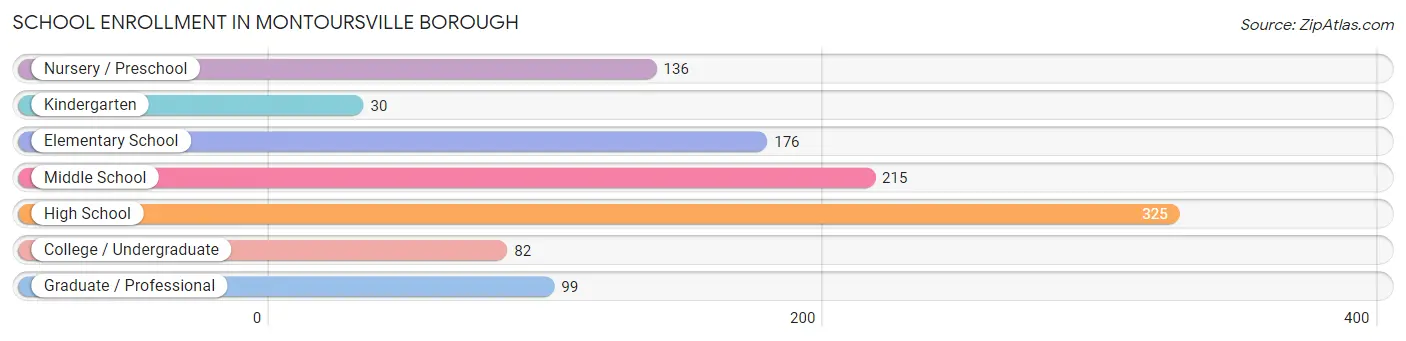
The most common levels of schooling among the 1,063 students in Montoursville borough are high school (325 | 30.6%), middle school (215 | 20.2%), and elementary school (176 | 16.6%).
| School Level | # Students | % Students |
| Nursery / Preschool | 136 | 12.8% |
| Kindergarten | 30 | 2.8% |
| Elementary School | 176 | 16.6% |
| Middle School | 215 | 20.2% |
| High School | 325 | 30.6% |
| College / Undergraduate | 82 | 7.7% |
| Graduate / Professional | 99 | 9.3% |
| Total | 1,063 | 100.0% |
School Enrollment by Age by Funding Source in Montoursville borough
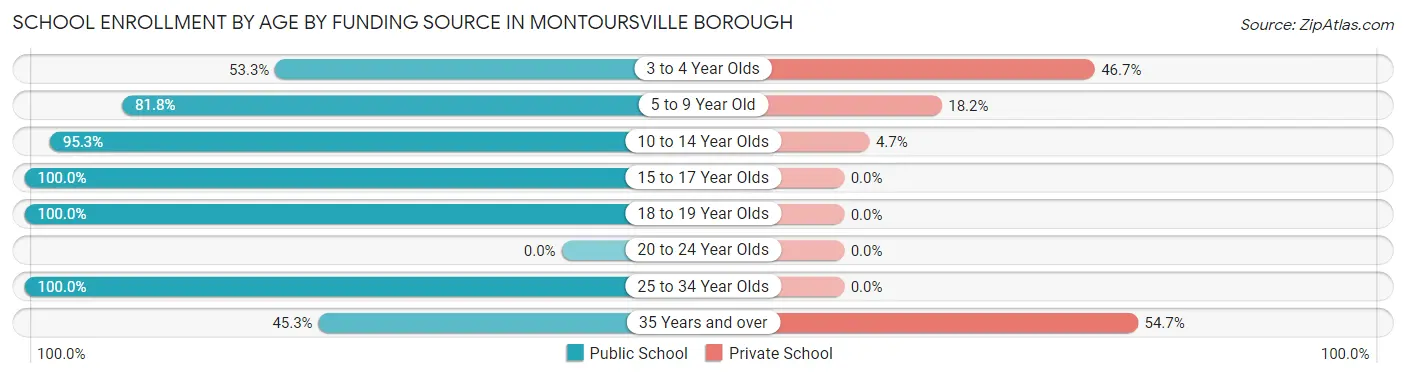
Out of a total of 1,063 students who are enrolled in schools in Montoursville borough, 169 (15.9%) attend a private institution, while the remaining 894 (84.1%) are enrolled in public schools. The age group of 35 years and over has the highest likelihood of being enrolled in private schools, with 81 (54.7% in the age bracket) enrolled. Conversely, the age group of 15 to 17 year olds has the lowest likelihood of being enrolled in a private school, with 269 (100.0% in the age bracket) attending a public institution.
| Age Bracket | Public School | Private School |
| 3 to 4 Year Olds | 48 (53.3%) | 42 (46.7%) |
| 5 to 9 Year Old | 135 (81.8%) | 30 (18.2%) |
| 10 to 14 Year Olds | 324 (95.3%) | 16 (4.7%) |
| 15 to 17 Year Olds | 269 (100.0%) | 0 (0.0%) |
| 18 to 19 Year Olds | 18 (100.0%) | 0 (0.0%) |
| 20 to 24 Year Olds | 0 (0.0%) | 0 (0.0%) |
| 25 to 34 Year Olds | 33 (100.0%) | 0 (0.0%) |
| 35 Years and over | 67 (45.3%) | 81 (54.7%) |
| Total | 894 (84.1%) | 169 (15.9%) |
Educational Attainment by Field of Study in Montoursville borough
Science & technology (286 | 25.0%), business (259 | 22.7%), education (170 | 14.9%), bio, nature & agricultural (124 | 10.8%), and social sciences (72 | 6.3%) are the most common fields of study among 1,143 individuals in Montoursville borough who have obtained a bachelor's degree or higher.
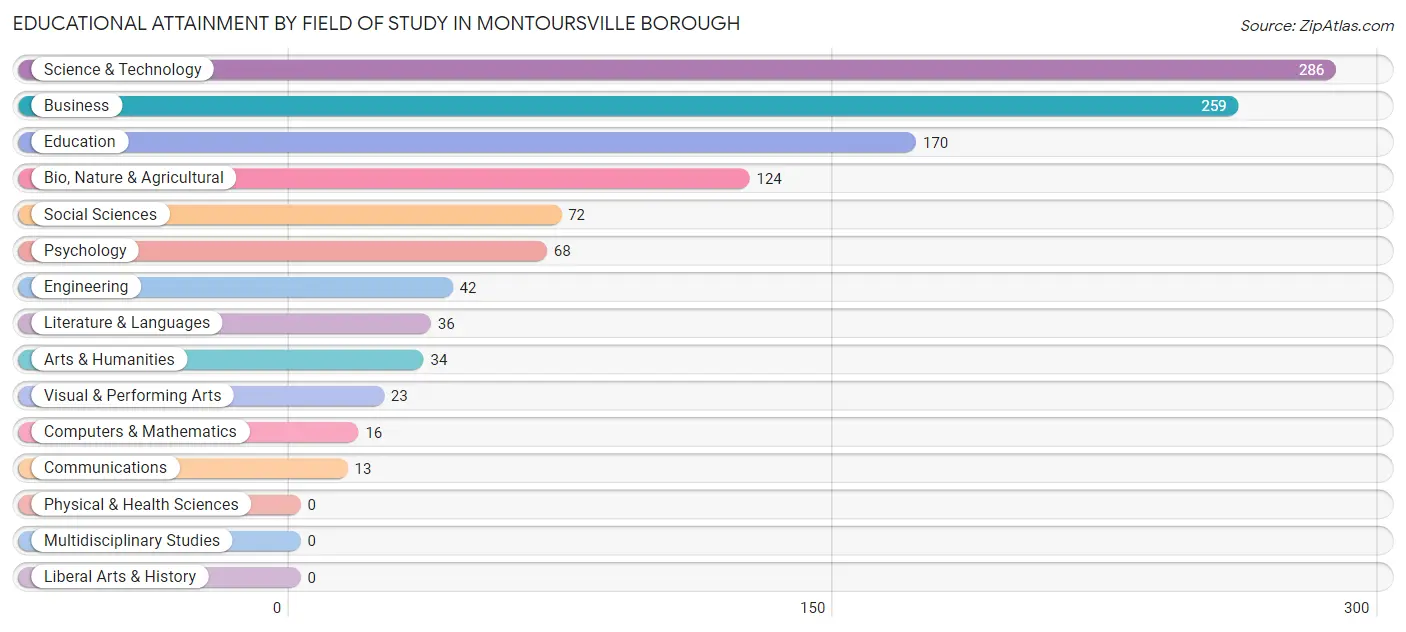
| Field of Study | # Graduates | % Graduates |
| Computers & Mathematics | 16 | 1.4% |
| Bio, Nature & Agricultural | 124 | 10.8% |
| Physical & Health Sciences | 0 | 0.0% |
| Psychology | 68 | 5.9% |
| Social Sciences | 72 | 6.3% |
| Engineering | 42 | 3.7% |
| Multidisciplinary Studies | 0 | 0.0% |
| Science & Technology | 286 | 25.0% |
| Business | 259 | 22.7% |
| Education | 170 | 14.9% |
| Literature & Languages | 36 | 3.2% |
| Liberal Arts & History | 0 | 0.0% |
| Visual & Performing Arts | 23 | 2.0% |
| Communications | 13 | 1.1% |
| Arts & Humanities | 34 | 3.0% |
| Total | 1,143 | 100.0% |
Transportation & Commute in Montoursville borough
Vehicle Availability by Sex in Montoursville borough
The most prevalent vehicle ownership categories in Montoursville borough are males with 2 vehicles (517, accounting for 44.7%) and females with 2 vehicles (385, making up 47.9%).
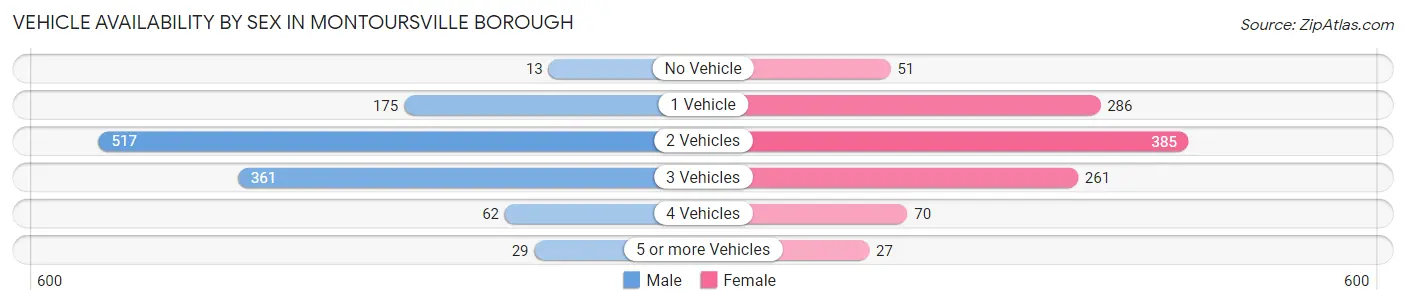
| Vehicles Available | Male | Female |
| No Vehicle | 13 (1.1%) | 51 (4.7%) |
| 1 Vehicle | 175 (15.1%) | 286 (26.5%) |
| 2 Vehicles | 517 (44.7%) | 385 (35.6%) |
| 3 Vehicles | 361 (31.2%) | 261 (24.2%) |
| 4 Vehicles | 62 (5.4%) | 70 (6.5%) |
| 5 or more Vehicles | 29 (2.5%) | 27 (2.5%) |
| Total | 1,157 (100.0%) | 1,080 (100.0%) |
Commute Time in Montoursville borough
The most frequently occuring commute durations in Montoursville borough are 10 to 14 minutes (457 commuters, 20.6%), 5 to 9 minutes (452 commuters, 20.4%), and 15 to 19 minutes (402 commuters, 18.1%).
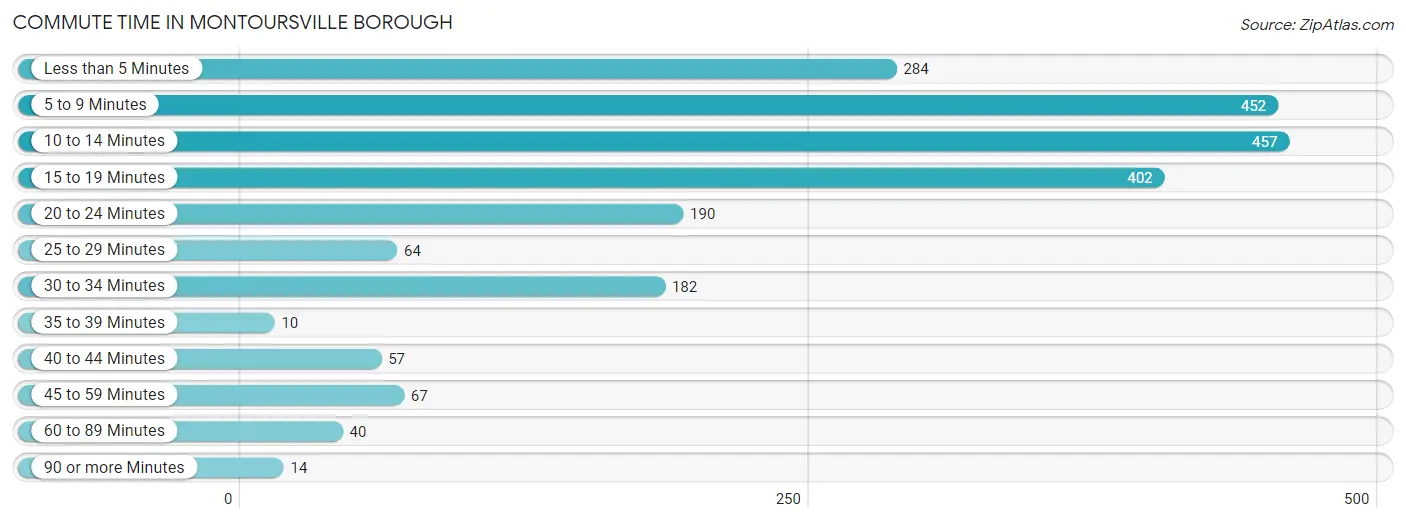
| Commute Time | # Commuters | % Commuters |
| Less than 5 Minutes | 284 | 12.8% |
| 5 to 9 Minutes | 452 | 20.4% |
| 10 to 14 Minutes | 457 | 20.6% |
| 15 to 19 Minutes | 402 | 18.1% |
| 20 to 24 Minutes | 190 | 8.6% |
| 25 to 29 Minutes | 64 | 2.9% |
| 30 to 34 Minutes | 182 | 8.2% |
| 35 to 39 Minutes | 10 | 0.4% |
| 40 to 44 Minutes | 57 | 2.6% |
| 45 to 59 Minutes | 67 | 3.0% |
| 60 to 89 Minutes | 40 | 1.8% |
| 90 or more Minutes | 14 | 0.6% |
Commute Time by Sex in Montoursville borough
The most common commute times in Montoursville borough are 5 to 9 minutes (243 commuters, 21.0%) for males and 10 to 14 minutes (248 commuters, 23.4%) for females.
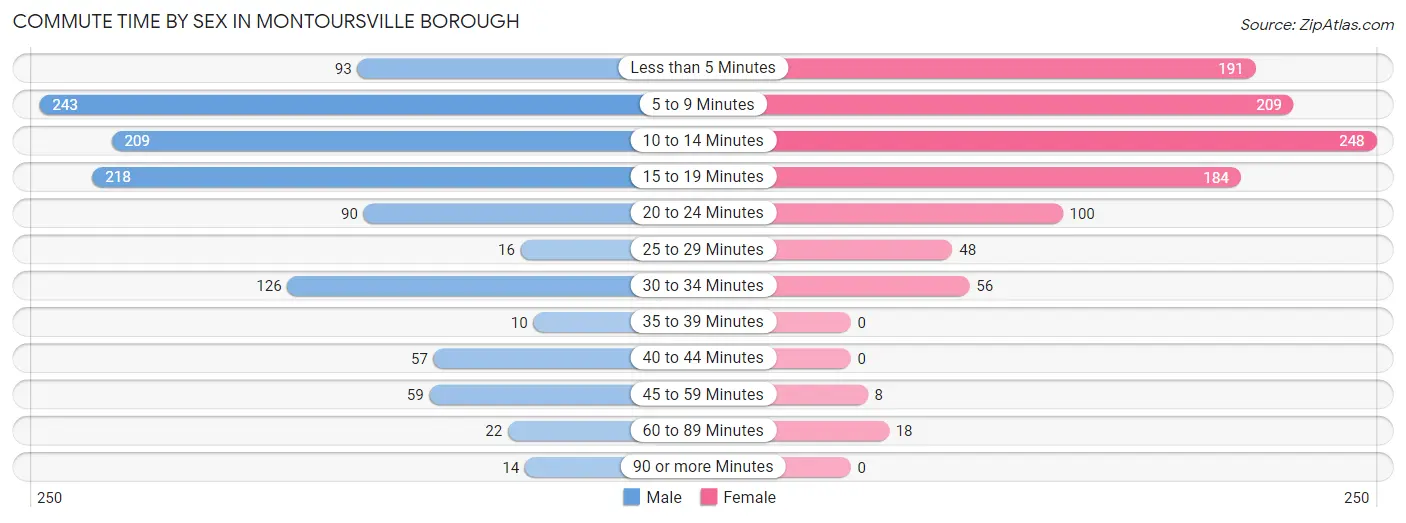
| Commute Time | Male | Female |
| Less than 5 Minutes | 93 (8.0%) | 191 (18.0%) |
| 5 to 9 Minutes | 243 (21.0%) | 209 (19.7%) |
| 10 to 14 Minutes | 209 (18.1%) | 248 (23.4%) |
| 15 to 19 Minutes | 218 (18.8%) | 184 (17.3%) |
| 20 to 24 Minutes | 90 (7.8%) | 100 (9.4%) |
| 25 to 29 Minutes | 16 (1.4%) | 48 (4.5%) |
| 30 to 34 Minutes | 126 (10.9%) | 56 (5.3%) |
| 35 to 39 Minutes | 10 (0.9%) | 0 (0.0%) |
| 40 to 44 Minutes | 57 (4.9%) | 0 (0.0%) |
| 45 to 59 Minutes | 59 (5.1%) | 8 (0.7%) |
| 60 to 89 Minutes | 22 (1.9%) | 18 (1.7%) |
| 90 or more Minutes | 14 (1.2%) | 0 (0.0%) |
Time of Departure to Work by Sex in Montoursville borough
The most frequent times of departure to work in Montoursville borough are 7:00 AM to 7:29 AM (212, 18.3%) for males and 8:30 AM to 8:59 AM (244, 23.0%) for females.
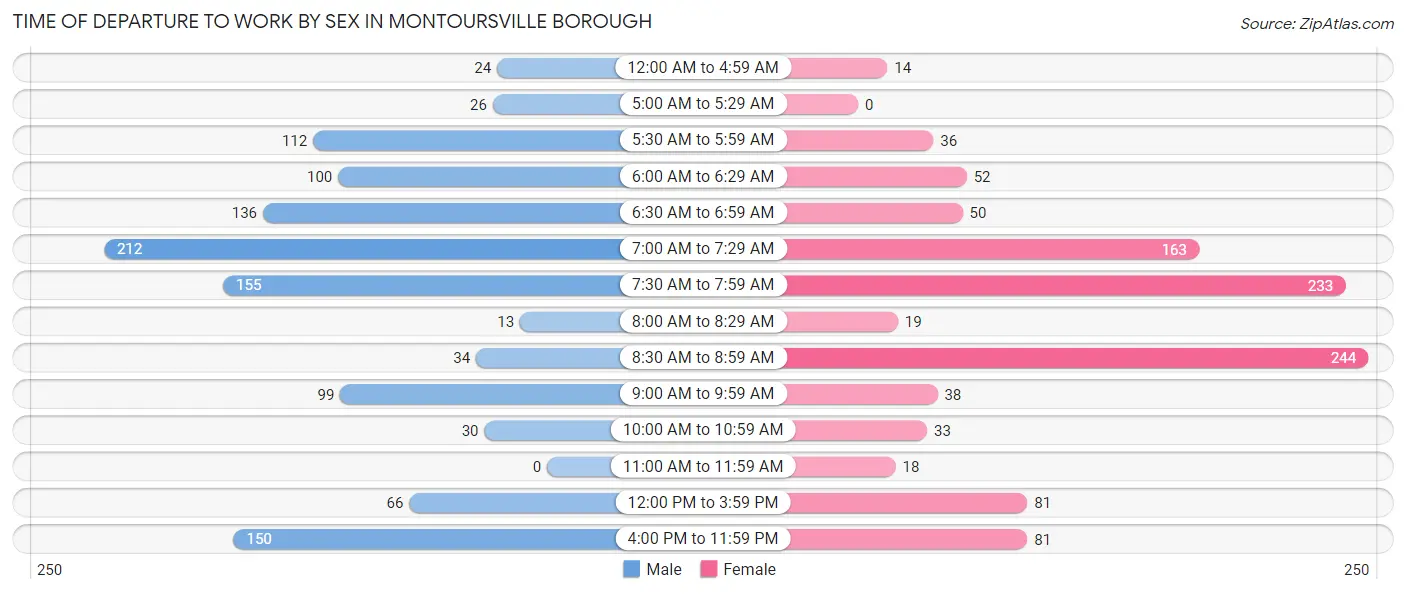
| Time of Departure | Male | Female |
| 12:00 AM to 4:59 AM | 24 (2.1%) | 14 (1.3%) |
| 5:00 AM to 5:29 AM | 26 (2.2%) | 0 (0.0%) |
| 5:30 AM to 5:59 AM | 112 (9.7%) | 36 (3.4%) |
| 6:00 AM to 6:29 AM | 100 (8.6%) | 52 (4.9%) |
| 6:30 AM to 6:59 AM | 136 (11.7%) | 50 (4.7%) |
| 7:00 AM to 7:29 AM | 212 (18.3%) | 163 (15.3%) |
| 7:30 AM to 7:59 AM | 155 (13.4%) | 233 (21.9%) |
| 8:00 AM to 8:29 AM | 13 (1.1%) | 19 (1.8%) |
| 8:30 AM to 8:59 AM | 34 (2.9%) | 244 (23.0%) |
| 9:00 AM to 9:59 AM | 99 (8.6%) | 38 (3.6%) |
| 10:00 AM to 10:59 AM | 30 (2.6%) | 33 (3.1%) |
| 11:00 AM to 11:59 AM | 0 (0.0%) | 18 (1.7%) |
| 12:00 PM to 3:59 PM | 66 (5.7%) | 81 (7.6%) |
| 4:00 PM to 11:59 PM | 150 (13.0%) | 81 (7.6%) |
| Total | 1,157 (100.0%) | 1,062 (100.0%) |
Housing Occupancy in Montoursville borough
Occupancy by Ownership in Montoursville borough
Of the total 2,089 dwellings in Montoursville borough, owner-occupied units account for 1,343 (64.3%), while renter-occupied units make up 746 (35.7%).
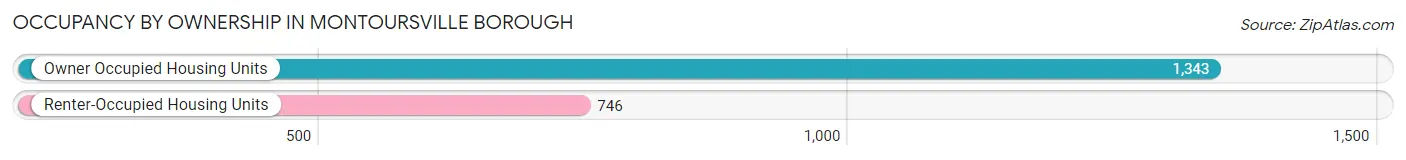
| Occupancy | # Housing Units | % Housing Units |
| Owner Occupied Housing Units | 1,343 | 64.3% |
| Renter-Occupied Housing Units | 746 | 35.7% |
| Total Occupied Housing Units | 2,089 | 100.0% |
Occupancy by Household Size in Montoursville borough
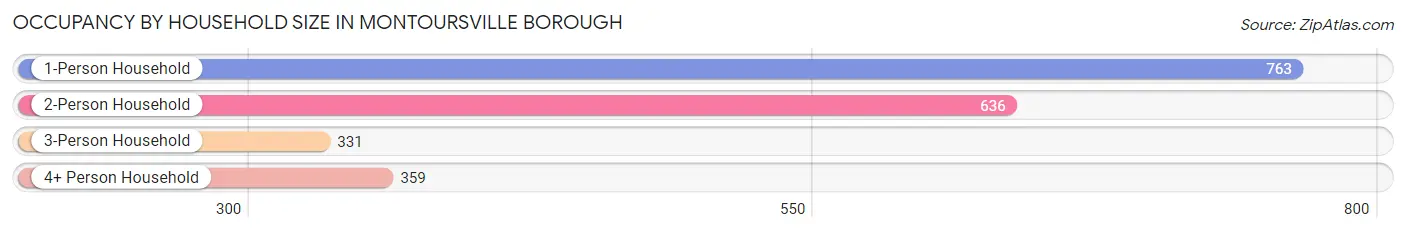
| Household Size | # Housing Units | % Housing Units |
| 1-Person Household | 763 | 36.5% |
| 2-Person Household | 636 | 30.4% |
| 3-Person Household | 331 | 15.8% |
| 4+ Person Household | 359 | 17.2% |
| Total Housing Units | 2,089 | 100.0% |
Occupancy by Ownership by Household Size in Montoursville borough
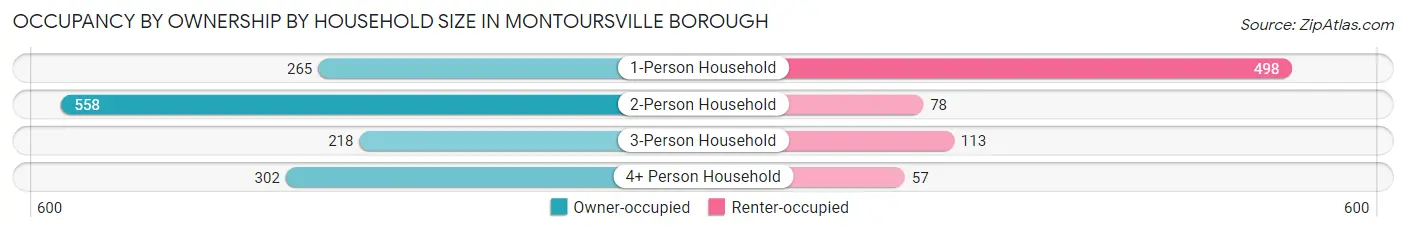
| Household Size | Owner-occupied | Renter-occupied |
| 1-Person Household | 265 (34.7%) | 498 (65.3%) |
| 2-Person Household | 558 (87.7%) | 78 (12.3%) |
| 3-Person Household | 218 (65.9%) | 113 (34.1%) |
| 4+ Person Household | 302 (84.1%) | 57 (15.9%) |
| Total Housing Units | 1,343 (64.3%) | 746 (35.7%) |
Occupancy by Educational Attainment in Montoursville borough
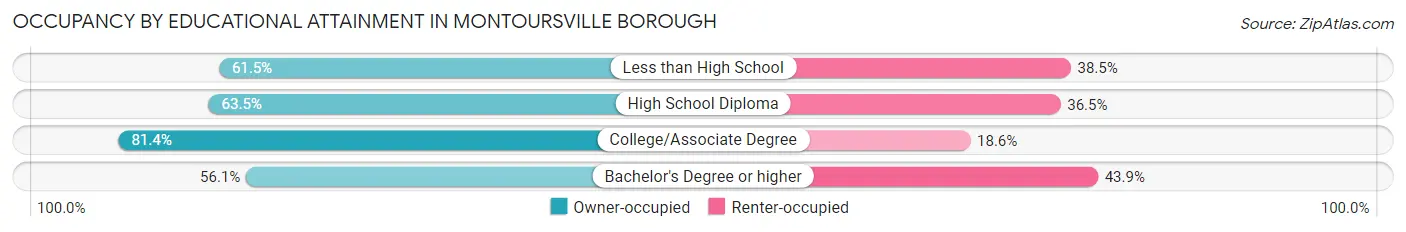
| Household Size | Owner-occupied | Renter-occupied |
| Less than High School | 59 (61.5%) | 37 (38.5%) |
| High School Diploma | 482 (63.5%) | 277 (36.5%) |
| College/Associate Degree | 354 (81.4%) | 81 (18.6%) |
| Bachelor's Degree or higher | 448 (56.1%) | 351 (43.9%) |
Occupancy by Age of Householder in Montoursville borough
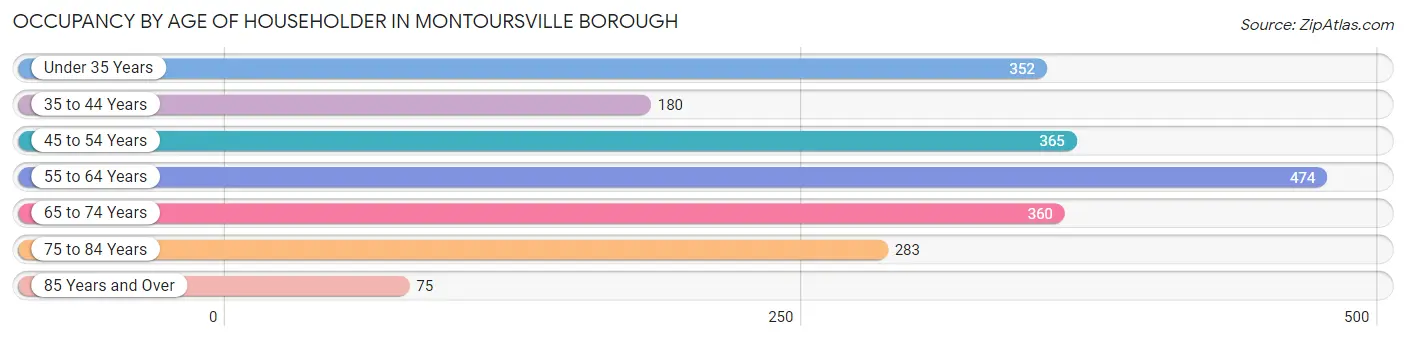
| Age Bracket | # Households | % Households |
| Under 35 Years | 352 | 16.9% |
| 35 to 44 Years | 180 | 8.6% |
| 45 to 54 Years | 365 | 17.5% |
| 55 to 64 Years | 474 | 22.7% |
| 65 to 74 Years | 360 | 17.2% |
| 75 to 84 Years | 283 | 13.6% |
| 85 Years and Over | 75 | 3.6% |
| Total | 2,089 | 100.0% |
Housing Finances in Montoursville borough
Median Income by Occupancy in Montoursville borough
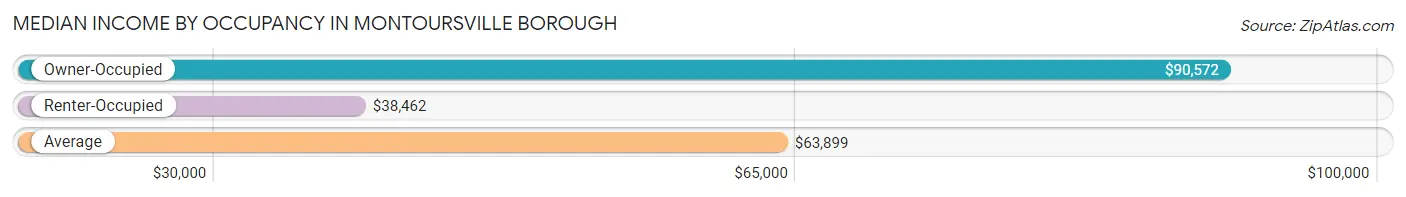
| Occupancy Type | # Households | Median Income |
| Owner-Occupied | 1,343 (64.3%) | $90,572 |
| Renter-Occupied | 746 (35.7%) | $38,462 |
| Average | 2,089 (100.0%) | $63,899 |
Occupancy by Householder Income Bracket in Montoursville borough
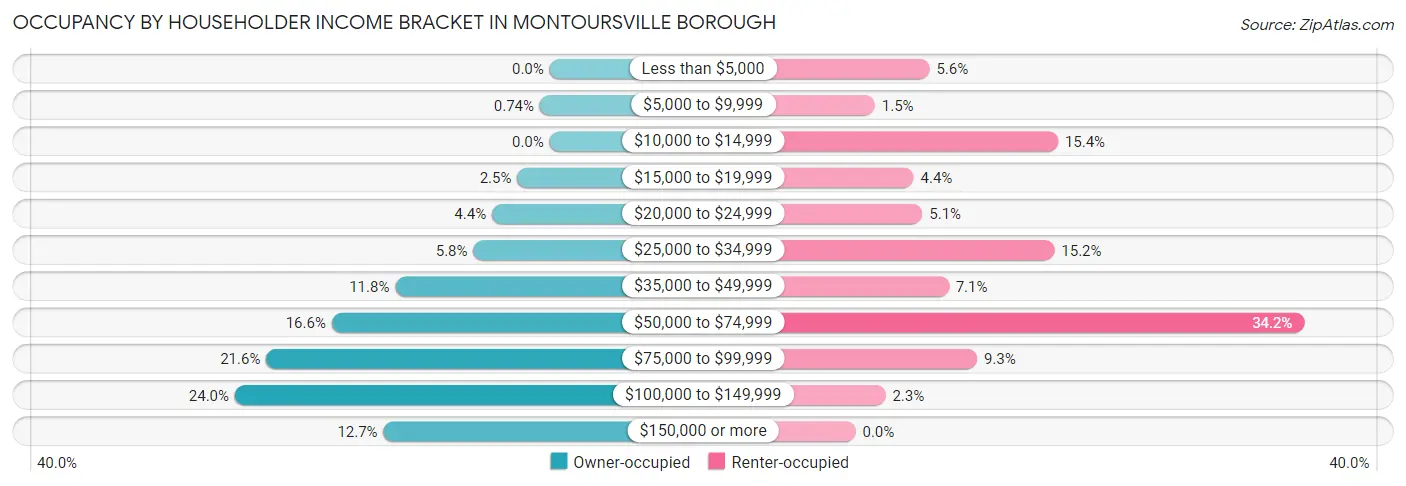
| Income Bracket | Owner-occupied | Renter-occupied |
| Less than $5,000 | 0 (0.0%) | 42 (5.6%) |
| $5,000 to $9,999 | 10 (0.7%) | 11 (1.5%) |
| $10,000 to $14,999 | 0 (0.0%) | 115 (15.4%) |
| $15,000 to $19,999 | 33 (2.5%) | 33 (4.4%) |
| $20,000 to $24,999 | 59 (4.4%) | 38 (5.1%) |
| $25,000 to $34,999 | 78 (5.8%) | 113 (15.1%) |
| $35,000 to $49,999 | 158 (11.8%) | 53 (7.1%) |
| $50,000 to $74,999 | 223 (16.6%) | 255 (34.2%) |
| $75,000 to $99,999 | 290 (21.6%) | 69 (9.2%) |
| $100,000 to $149,999 | 322 (24.0%) | 17 (2.3%) |
| $150,000 or more | 170 (12.7%) | 0 (0.0%) |
| Total | 1,343 (100.0%) | 746 (100.0%) |
Monthly Housing Cost Tiers in Montoursville borough
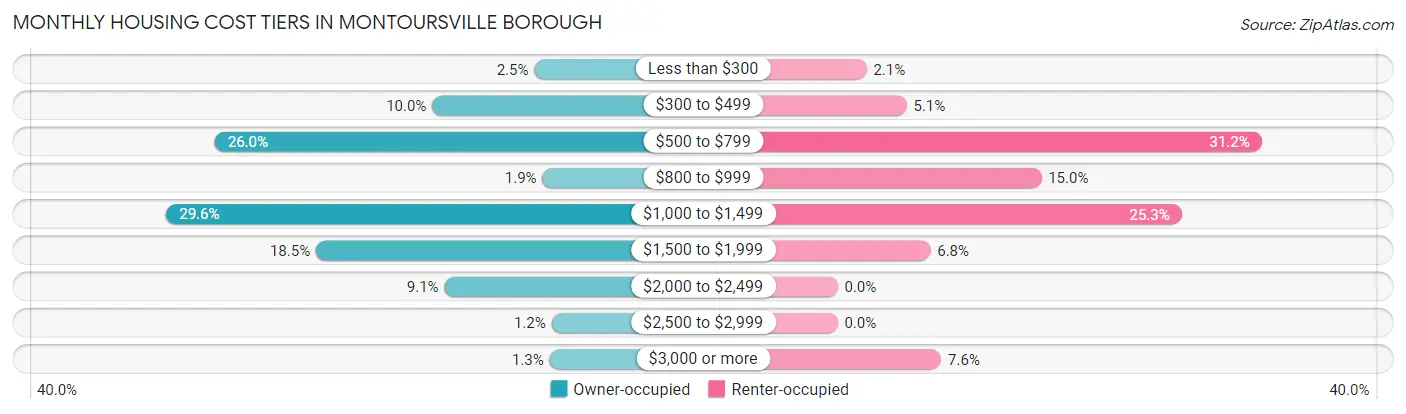
| Monthly Cost | Owner-occupied | Renter-occupied |
| Less than $300 | 33 (2.5%) | 16 (2.1%) |
| $300 to $499 | 134 (10.0%) | 38 (5.1%) |
| $500 to $799 | 349 (26.0%) | 233 (31.2%) |
| $800 to $999 | 25 (1.9%) | 112 (15.0%) |
| $1,000 to $1,499 | 397 (29.6%) | 189 (25.3%) |
| $1,500 to $1,999 | 249 (18.5%) | 51 (6.8%) |
| $2,000 to $2,499 | 122 (9.1%) | 0 (0.0%) |
| $2,500 to $2,999 | 16 (1.2%) | 0 (0.0%) |
| $3,000 or more | 18 (1.3%) | 57 (7.6%) |
| Total | 1,343 (100.0%) | 746 (100.0%) |
Physical Housing Characteristics in Montoursville borough
Housing Structures in Montoursville borough
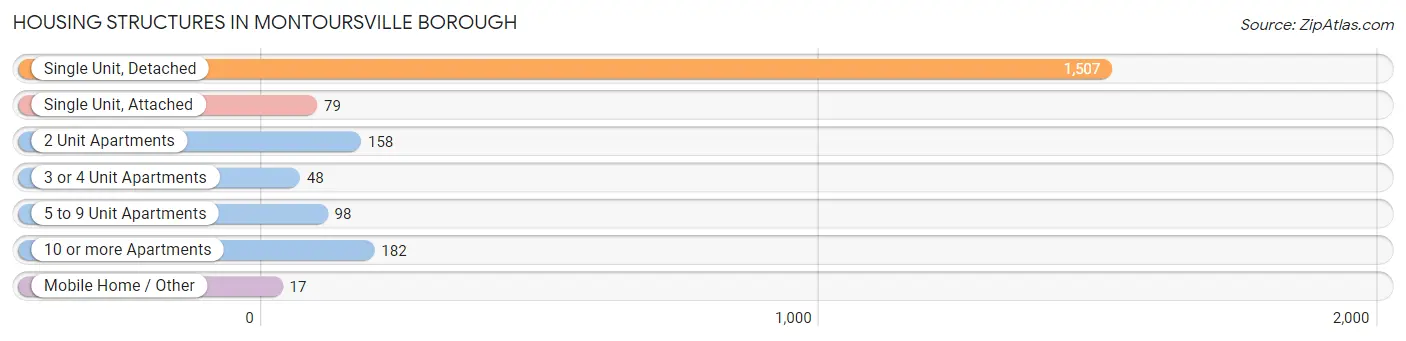
| Structure Type | # Housing Units | % Housing Units |
| Single Unit, Detached | 1,507 | 72.1% |
| Single Unit, Attached | 79 | 3.8% |
| 2 Unit Apartments | 158 | 7.6% |
| 3 or 4 Unit Apartments | 48 | 2.3% |
| 5 to 9 Unit Apartments | 98 | 4.7% |
| 10 or more Apartments | 182 | 8.7% |
| Mobile Home / Other | 17 | 0.8% |
| Total | 2,089 | 100.0% |
Housing Structures by Occupancy in Montoursville borough
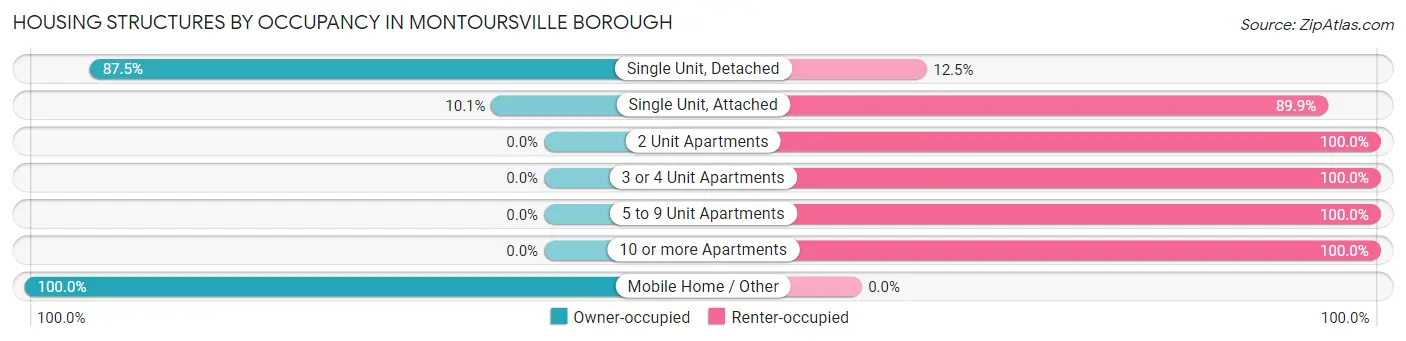
| Structure Type | Owner-occupied | Renter-occupied |
| Single Unit, Detached | 1,318 (87.5%) | 189 (12.5%) |
| Single Unit, Attached | 8 (10.1%) | 71 (89.9%) |
| 2 Unit Apartments | 0 (0.0%) | 158 (100.0%) |
| 3 or 4 Unit Apartments | 0 (0.0%) | 48 (100.0%) |
| 5 to 9 Unit Apartments | 0 (0.0%) | 98 (100.0%) |
| 10 or more Apartments | 0 (0.0%) | 182 (100.0%) |
| Mobile Home / Other | 17 (100.0%) | 0 (0.0%) |
| Total | 1,343 (64.3%) | 746 (35.7%) |
Housing Structures by Number of Rooms in Montoursville borough
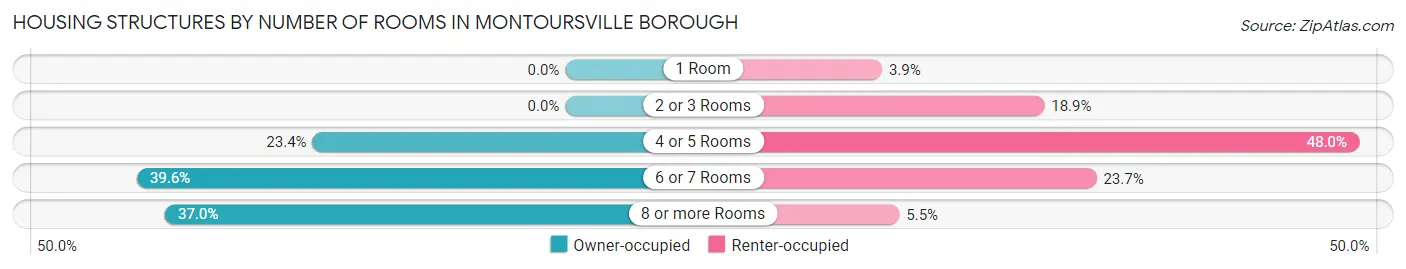
| Number of Rooms | Owner-occupied | Renter-occupied |
| 1 Room | 0 (0.0%) | 29 (3.9%) |
| 2 or 3 Rooms | 0 (0.0%) | 141 (18.9%) |
| 4 or 5 Rooms | 314 (23.4%) | 358 (48.0%) |
| 6 or 7 Rooms | 532 (39.6%) | 177 (23.7%) |
| 8 or more Rooms | 497 (37.0%) | 41 (5.5%) |
| Total | 1,343 (100.0%) | 746 (100.0%) |
Housing Structure by Heating Type in Montoursville borough
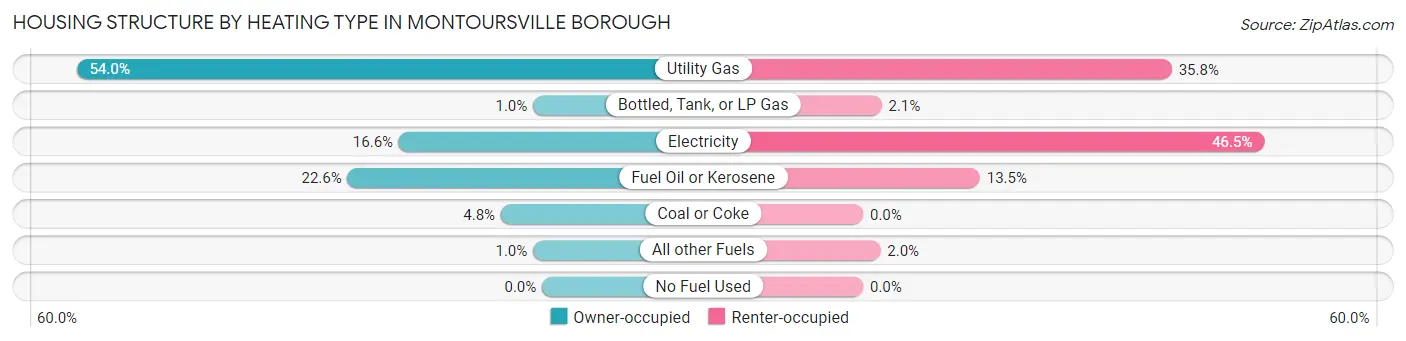
| Heating Type | Owner-occupied | Renter-occupied |
| Utility Gas | 725 (54.0%) | 267 (35.8%) |
| Bottled, Tank, or LP Gas | 14 (1.0%) | 16 (2.1%) |
| Electricity | 223 (16.6%) | 347 (46.5%) |
| Fuel Oil or Kerosene | 303 (22.6%) | 101 (13.5%) |
| Coal or Coke | 64 (4.8%) | 0 (0.0%) |
| All other Fuels | 14 (1.0%) | 15 (2.0%) |
| No Fuel Used | 0 (0.0%) | 0 (0.0%) |
| Total | 1,343 (100.0%) | 746 (100.0%) |
Household Vehicle Usage in Montoursville borough
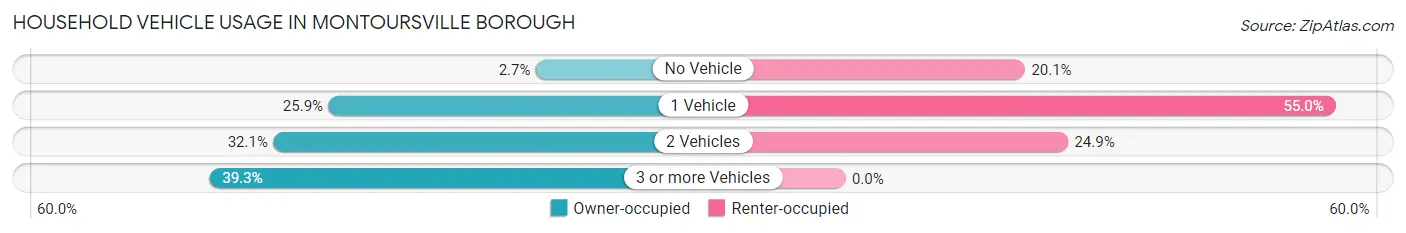
| Vehicles per Household | Owner-occupied | Renter-occupied |
| No Vehicle | 36 (2.7%) | 150 (20.1%) |
| 1 Vehicle | 348 (25.9%) | 410 (55.0%) |
| 2 Vehicles | 431 (32.1%) | 186 (24.9%) |
| 3 or more Vehicles | 528 (39.3%) | 0 (0.0%) |
| Total | 1,343 (100.0%) | 746 (100.0%) |
Real Estate & Mortgages in Montoursville borough
Real Estate and Mortgage Overview in Montoursville borough
| Characteristic | Without Mortgage | With Mortgage |
| Housing Units | 603 | 740 |
| Median Property Value | $186,400 | $188,200 |
| Median Household Income | $69,485 | $124 |
| Monthly Housing Costs | $560 | $0 |
| Real Estate Taxes | $2,962 | $18 |
Property Value by Mortgage Status in Montoursville borough
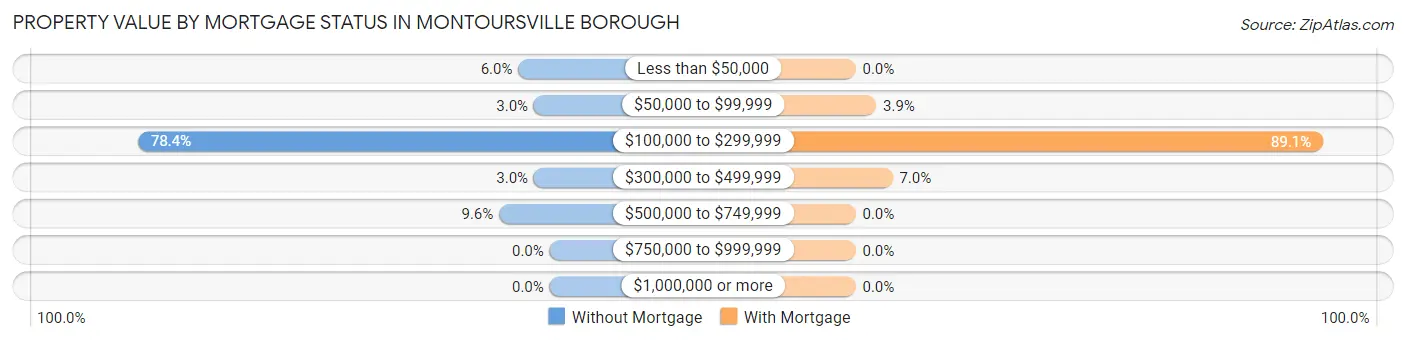
| Property Value | Without Mortgage | With Mortgage |
| Less than $50,000 | 36 (6.0%) | 0 (0.0%) |
| $50,000 to $99,999 | 18 (3.0%) | 29 (3.9%) |
| $100,000 to $299,999 | 473 (78.4%) | 659 (89.0%) |
| $300,000 to $499,999 | 18 (3.0%) | 52 (7.0%) |
| $500,000 to $749,999 | 58 (9.6%) | 0 (0.0%) |
| $750,000 to $999,999 | 0 (0.0%) | 0 (0.0%) |
| $1,000,000 or more | 0 (0.0%) | 0 (0.0%) |
| Total | 603 (100.0%) | 740 (100.0%) |
Household Income by Mortgage Status in Montoursville borough
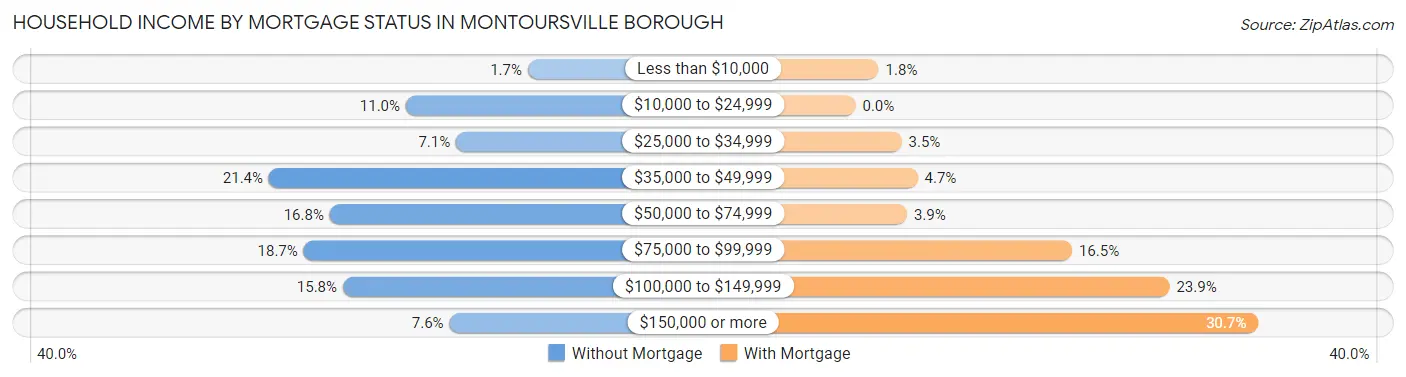
| Household Income | Without Mortgage | With Mortgage |
| Less than $10,000 | 10 (1.7%) | 13 (1.8%) |
| $10,000 to $24,999 | 66 (11.0%) | 0 (0.0%) |
| $25,000 to $34,999 | 43 (7.1%) | 26 (3.5%) |
| $35,000 to $49,999 | 129 (21.4%) | 35 (4.7%) |
| $50,000 to $74,999 | 101 (16.8%) | 29 (3.9%) |
| $75,000 to $99,999 | 113 (18.7%) | 122 (16.5%) |
| $100,000 to $149,999 | 95 (15.8%) | 177 (23.9%) |
| $150,000 or more | 46 (7.6%) | 227 (30.7%) |
| Total | 603 (100.0%) | 740 (100.0%) |
Property Value to Household Income Ratio in Montoursville borough
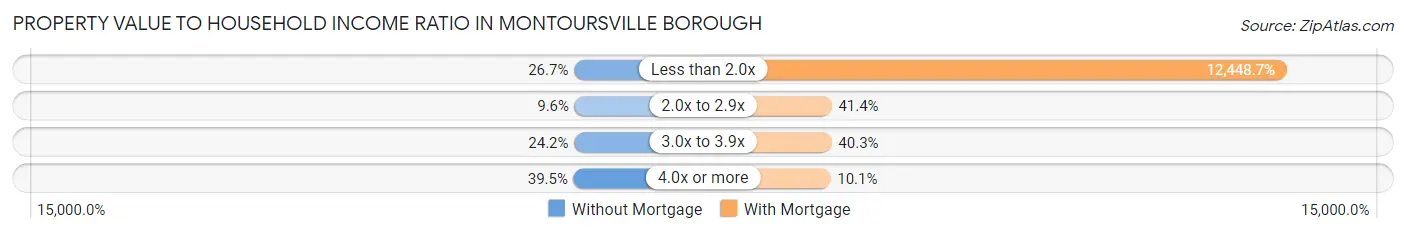
| Value-to-Income Ratio | Without Mortgage | With Mortgage |
| Less than 2.0x | 161 (26.7%) | 92,120 (12,448.7%) |
| 2.0x to 2.9x | 58 (9.6%) | 306 (41.3%) |
| 3.0x to 3.9x | 146 (24.2%) | 298 (40.3%) |
| 4.0x or more | 238 (39.5%) | 75 (10.1%) |
| Total | 603 (100.0%) | 740 (100.0%) |
Real Estate Taxes by Mortgage Status in Montoursville borough
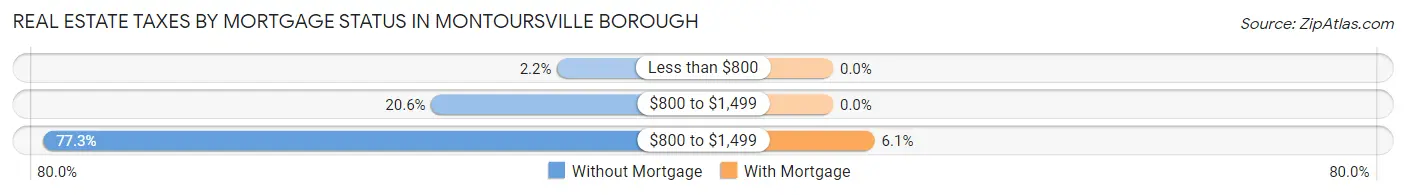
| Property Taxes | Without Mortgage | With Mortgage |
| Less than $800 | 13 (2.2%) | 0 (0.0%) |
| $800 to $1,499 | 124 (20.6%) | 0 (0.0%) |
| $800 to $1,499 | 466 (77.3%) | 45 (6.1%) |
| Total | 603 (100.0%) | 740 (100.0%) |
Health & Disability in Montoursville borough
Health Insurance Coverage by Age in Montoursville borough
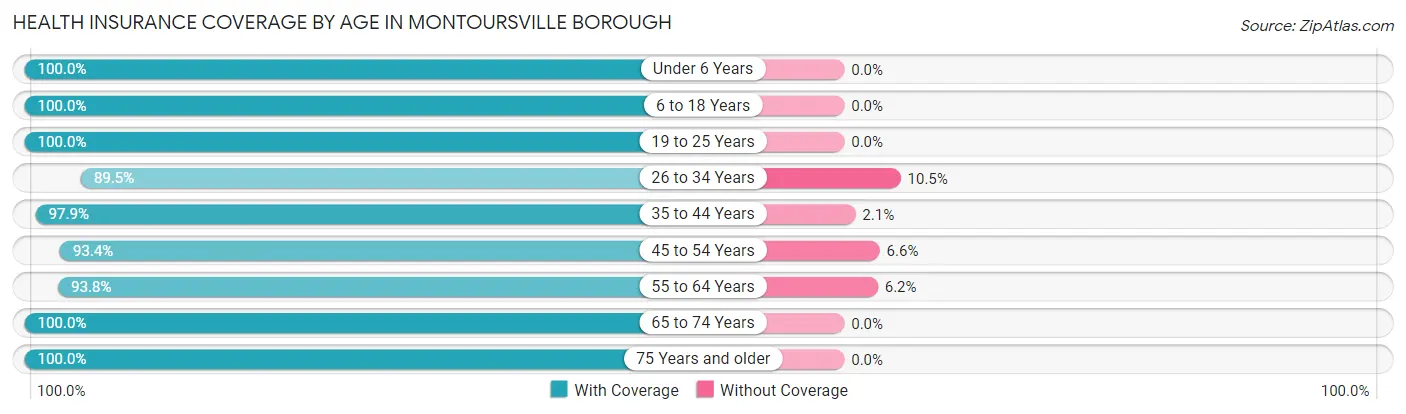
| Age Bracket | With Coverage | Without Coverage |
| Under 6 Years | 366 (100.0%) | 0 (0.0%) |
| 6 to 18 Years | 741 (100.0%) | 0 (0.0%) |
| 19 to 25 Years | 340 (100.0%) | 0 (0.0%) |
| 26 to 34 Years | 452 (89.5%) | 53 (10.5%) |
| 35 to 44 Years | 472 (97.9%) | 10 (2.1%) |
| 45 to 54 Years | 482 (93.4%) | 34 (6.6%) |
| 55 to 64 Years | 721 (93.8%) | 48 (6.2%) |
| 65 to 74 Years | 506 (100.0%) | 0 (0.0%) |
| 75 Years and older | 499 (100.0%) | 0 (0.0%) |
| Total | 4,579 (96.9%) | 145 (3.1%) |
Health Insurance Coverage by Citizenship Status in Montoursville borough
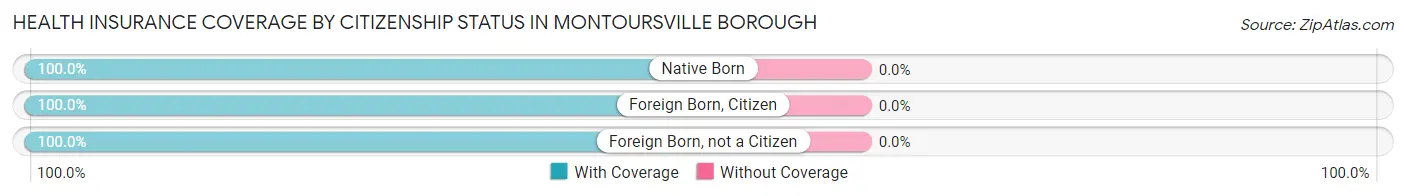
| Citizenship Status | With Coverage | Without Coverage |
| Native Born | 366 (100.0%) | 0 (0.0%) |
| Foreign Born, Citizen | 741 (100.0%) | 0 (0.0%) |
| Foreign Born, not a Citizen | 340 (100.0%) | 0 (0.0%) |
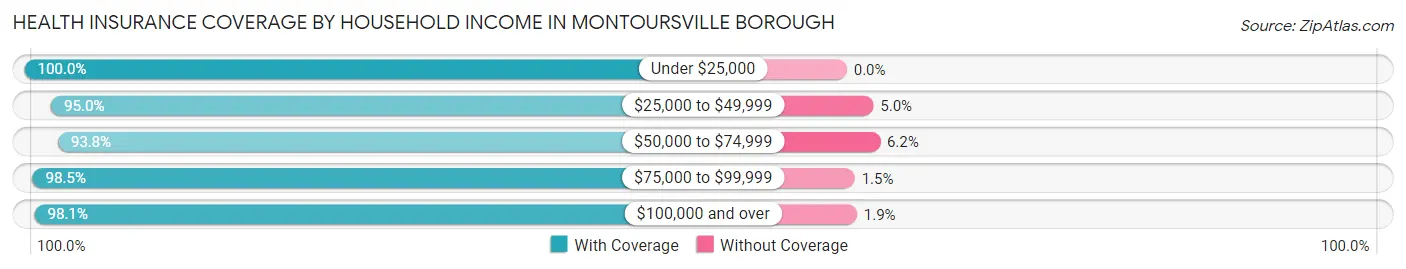
Health Insurance Coverage by Household Income in Montoursville borough
| Household Income | With Coverage | Without Coverage |
| Under $25,000 | 341 (100.0%) | 0 (0.0%) |
| $25,000 to $49,999 | 668 (95.0%) | 35 (5.0%) |
| $50,000 to $74,999 | 980 (93.8%) | 65 (6.2%) |
| $75,000 to $99,999 | 1,121 (98.5%) | 17 (1.5%) |
| $100,000 and over | 1,464 (98.1%) | 28 (1.9%) |
Public vs Private Health Insurance Coverage by Age in Montoursville borough
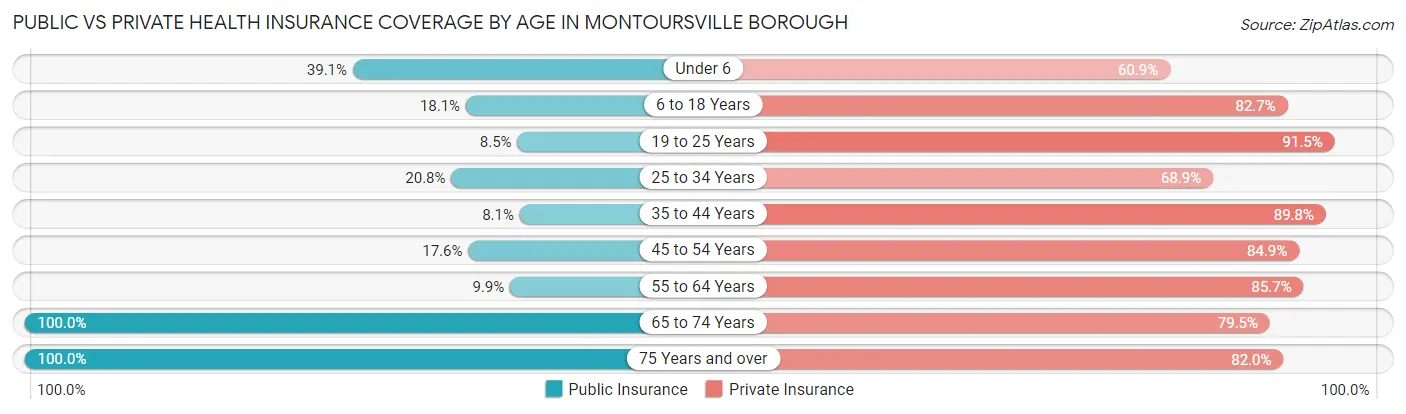
| Age Bracket | Public Insurance | Private Insurance |
| Under 6 | 143 (39.1%) | 223 (60.9%) |
| 6 to 18 Years | 134 (18.1%) | 613 (82.7%) |
| 19 to 25 Years | 29 (8.5%) | 311 (91.5%) |
| 25 to 34 Years | 105 (20.8%) | 348 (68.9%) |
| 35 to 44 Years | 39 (8.1%) | 433 (89.8%) |
| 45 to 54 Years | 91 (17.6%) | 438 (84.9%) |
| 55 to 64 Years | 76 (9.9%) | 659 (85.7%) |
| 65 to 74 Years | 506 (100.0%) | 402 (79.4%) |
| 75 Years and over | 499 (100.0%) | 409 (82.0%) |
| Total | 1,622 (34.3%) | 3,836 (81.2%) |
Disability Status by Sex by Age in Montoursville borough
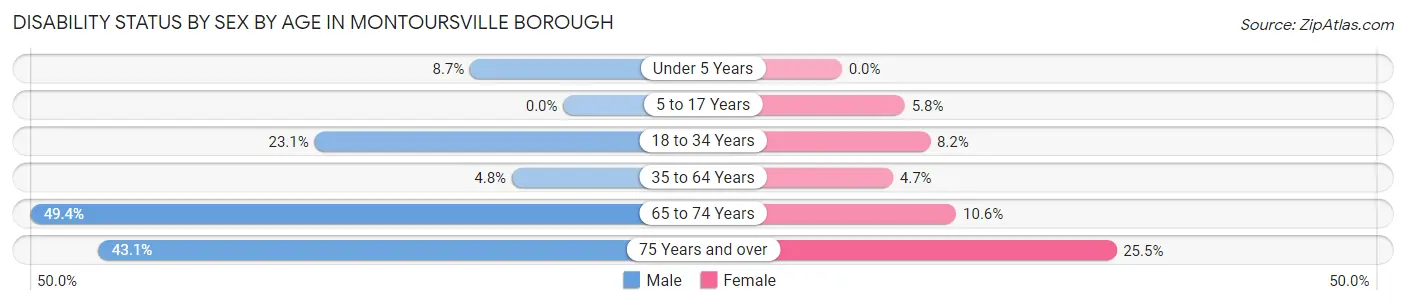
| Age Bracket | Male | Female |
| Under 5 Years | 16 (8.6%) | 0 (0.0%) |
| 5 to 17 Years | 0 (0.0%) | 17 (5.8%) |
| 18 to 34 Years | 109 (23.1%) | 32 (8.2%) |
| 35 to 64 Years | 40 (4.8%) | 44 (4.7%) |
| 65 to 74 Years | 87 (49.4%) | 35 (10.6%) |
| 75 Years and over | 100 (43.1%) | 68 (25.5%) |
Disability Class by Sex by Age in Montoursville borough
Disability Class: Hearing Difficulty
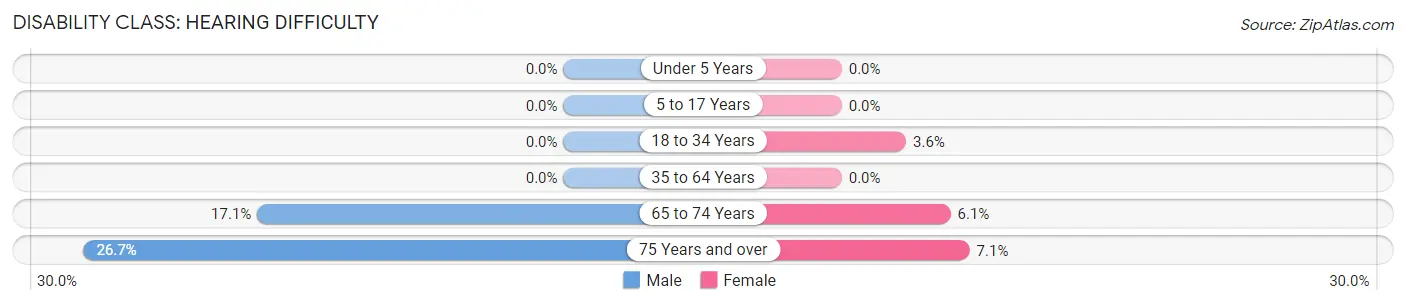
| Age Bracket | Male | Female |
| Under 5 Years | 0 (0.0%) | 0 (0.0%) |
| 5 to 17 Years | 0 (0.0%) | 0 (0.0%) |
| 18 to 34 Years | 0 (0.0%) | 14 (3.6%) |
| 35 to 64 Years | 0 (0.0%) | 0 (0.0%) |
| 65 to 74 Years | 30 (17.1%) | 20 (6.1%) |
| 75 Years and over | 62 (26.7%) | 19 (7.1%) |
Disability Class: Vision Difficulty
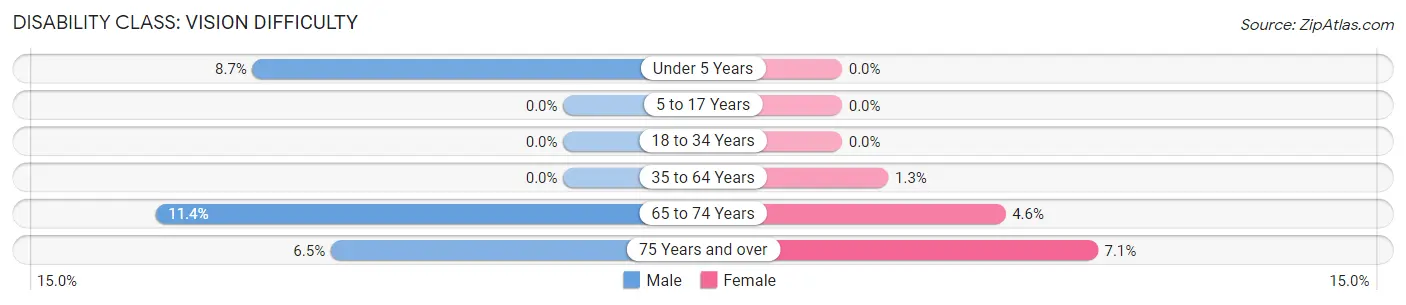
| Age Bracket | Male | Female |
| Under 5 Years | 16 (8.6%) | 0 (0.0%) |
| 5 to 17 Years | 0 (0.0%) | 0 (0.0%) |
| 18 to 34 Years | 0 (0.0%) | 0 (0.0%) |
| 35 to 64 Years | 0 (0.0%) | 12 (1.3%) |
| 65 to 74 Years | 20 (11.4%) | 15 (4.5%) |
| 75 Years and over | 15 (6.5%) | 19 (7.1%) |
Disability Class: Cognitive Difficulty
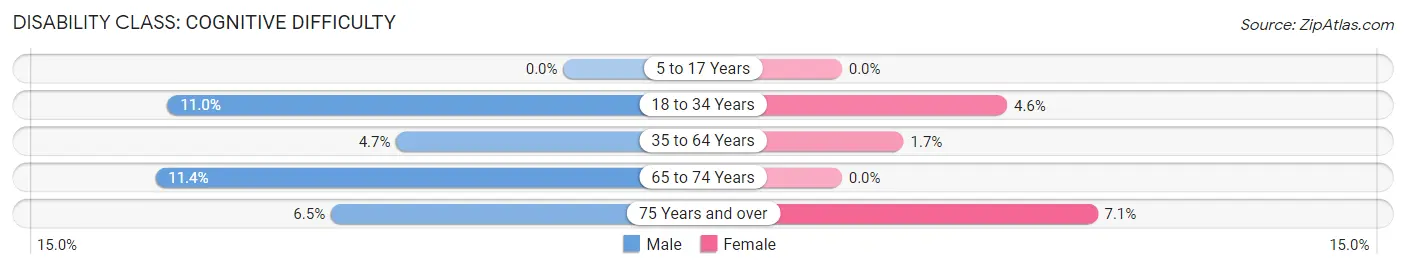
| Age Bracket | Male | Female |
| 5 to 17 Years | 0 (0.0%) | 0 (0.0%) |
| 18 to 34 Years | 52 (11.0%) | 18 (4.6%) |
| 35 to 64 Years | 39 (4.6%) | 16 (1.7%) |
| 65 to 74 Years | 20 (11.4%) | 0 (0.0%) |
| 75 Years and over | 15 (6.5%) | 19 (7.1%) |
Disability Class: Ambulatory Difficulty
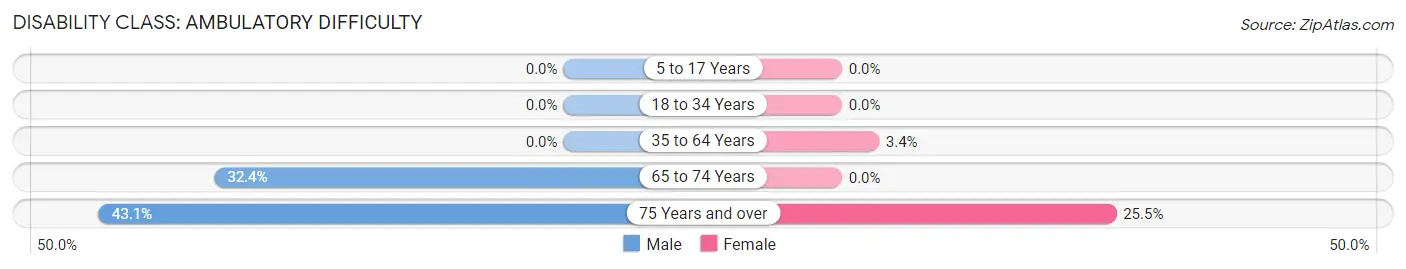
| Age Bracket | Male | Female |
| 5 to 17 Years | 0 (0.0%) | 0 (0.0%) |
| 18 to 34 Years | 0 (0.0%) | 0 (0.0%) |
| 35 to 64 Years | 0 (0.0%) | 32 (3.4%) |
| 65 to 74 Years | 57 (32.4%) | 0 (0.0%) |
| 75 Years and over | 100 (43.1%) | 68 (25.5%) |
Disability Class: Self-Care Difficulty
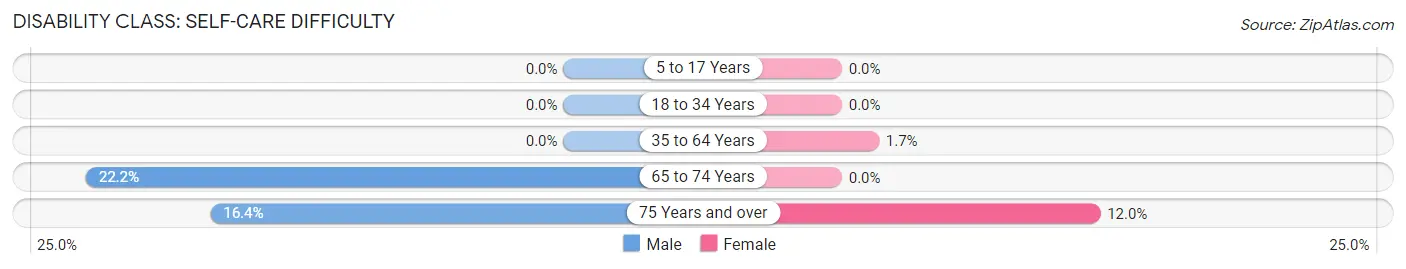
| Age Bracket | Male | Female |
| 5 to 17 Years | 0 (0.0%) | 0 (0.0%) |
| 18 to 34 Years | 0 (0.0%) | 0 (0.0%) |
| 35 to 64 Years | 0 (0.0%) | 16 (1.7%) |
| 65 to 74 Years | 39 (22.2%) | 0 (0.0%) |
| 75 Years and over | 38 (16.4%) | 32 (12.0%) |
Technology Access in Montoursville borough
Computing Device Access in Montoursville borough
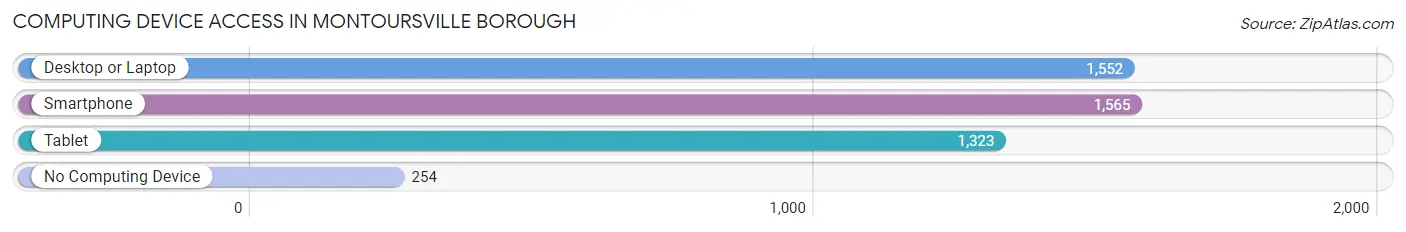
| Device Type | # Households | % Households |
| Desktop or Laptop | 1,552 | 74.3% |
| Smartphone | 1,565 | 74.9% |
| Tablet | 1,323 | 63.3% |
| No Computing Device | 254 | 12.2% |
| Total | 2,089 | 100.0% |
Internet Access in Montoursville borough
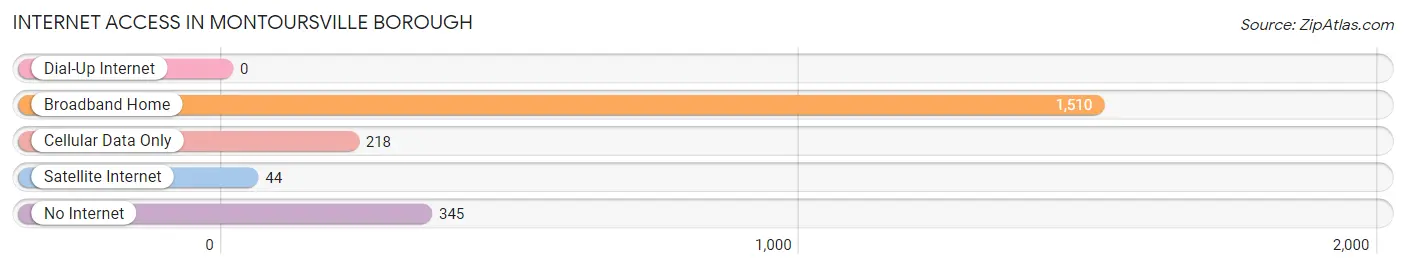
| Internet Type | # Households | % Households |
| Dial-Up Internet | 0 | 0.0% |
| Broadband Home | 1,510 | 72.3% |
| Cellular Data Only | 218 | 10.4% |
| Satellite Internet | 44 | 2.1% |
| No Internet | 345 | 16.5% |
| Total | 2,089 | 100.0% |
Montoursville borough Summary
Introduction
Montoursville Borough is a small borough located in Lycoming County, Pennsylvania. It is situated along the banks of the West Branch of the Susquehanna River and is part of the Williamsport, Pennsylvania Metropolitan Statistical Area. The borough was founded in 1814 and is home to a population of approximately 4,000 people.
History
Montoursville was founded in 1814 by John Montour, a French-Canadian fur trader. The borough was named after him and was originally part of Lycoming County. The first settlers in the area were mostly of German and English descent. The first post office was established in 1817 and the first school was built in 1820.
The borough was incorporated in 1854 and the first mayor was elected in 1855. The first newspaper, the Montoursville Gazette, was established in 1856. The borough was home to several industries, including a sawmill, a gristmill, a tannery, and a brickyard.
The borough was home to several Civil War veterans, including General William H. French, who served as a major general in the Union Army. The borough was also home to several prominent figures, including former Pennsylvania Governor William A. Stone and former U.S. Senator Joseph R. Grundy.
Geography
Montoursville is located in Lycoming County, Pennsylvania. It is situated along the banks of the West Branch of the Susquehanna River. The borough is located approximately 10 miles north of Williamsport, the county seat. The borough is bordered by the boroughs of South Williamsport and Duboistown to the south, the borough of Muncy to the east, and the townships of Wolf and Fairfield to the north and west, respectively.
The borough has a total area of 1.2 square miles, all of which is land. The terrain is mostly flat and the borough is located at an elevation of approximately 500 feet above sea level. The climate is humid continental, with cold winters and hot, humid summers.
Economy
The economy of Montoursville is largely based on manufacturing and services. The borough is home to several manufacturing companies, including a paper mill, a plastics manufacturer, and a metal fabrication company. The borough is also home to several retail stores, restaurants, and other businesses.
The borough is home to several educational institutions, including a public school district, a community college, and a technical school. The borough is also home to several churches and other religious organizations.
Demographics
As of the 2010 census, the population of Montoursville was 4,077. The racial makeup of the borough was 97.3% White, 0.7% African American, 0.2% Native American, 0.7% Asian, 0.1% Pacific Islander, 0.3% from other races, and 0.9% from two or more races. Hispanic or Latino of any race were 1.2% of the population.
The median household income in the borough was $45,938 and the median family income was $54,917. The per capita income was $21,945. About 8.3% of families and 10.2% of the population were below the poverty line, including 14.2% of those under age 18 and 6.2% of those age 65 or over.
Conclusion
Montoursville Borough is a small borough located in Lycoming County, Pennsylvania. It is situated along the banks of the West Branch of the Susquehanna River and is part of the Williamsport, Pennsylvania Metropolitan Statistical Area. The borough was founded in 1814 and is home to a population of approximately 4,000 people. The economy of the borough is largely based on manufacturing and services, and the borough is home to several educational institutions, churches, and other organizations. The population of the borough is predominantly White, with a small percentage of African American, Native American, Asian, and Pacific Islander residents. The median household income in the borough is $45,938 and the median family income is $54,917.
Common Questions
What is Per Capita Income in Montoursville borough?
Per Capita income in Montoursville borough is $34,605.
What is the Median Family Income in Montoursville borough?
Median Family Income in Montoursville borough is $90,842.
What is the Median Household income in Montoursville borough?
Median Household Income in Montoursville borough is $63,899.
What is Income or Wage Gap in Montoursville borough?
Income or Wage Gap in Montoursville borough is 30.0%.
Women in Montoursville borough earn 70.0 cents for every dollar earned by a man.
What is Inequality or Gini Index in Montoursville borough?
Inequality or Gini Index in Montoursville borough is 0.40.
What is the Total Population of Montoursville borough?
Total Population of Montoursville borough is 4,724.
What is the Total Male Population of Montoursville borough?
Total Male Population of Montoursville borough is 2,403.
What is the Total Female Population of Montoursville borough?
Total Female Population of Montoursville borough is 2,321.
What is the Ratio of Males per 100 Females in Montoursville borough?
There are 103.53 Males per 100 Females in Montoursville borough.
What is the Ratio of Females per 100 Males in Montoursville borough?
There are 96.59 Females per 100 Males in Montoursville borough.
What is the Median Population Age in Montoursville borough?
Median Population Age in Montoursville borough is 44.1 Years.
What is the Average Family Size in Montoursville borough
Average Family Size in Montoursville borough is 3.0 People.
What is the Average Household Size in Montoursville borough
Average Household Size in Montoursville borough is 2.3 People.
How Large is the Labor Force in Montoursville borough?
There are 2,361 People in the Labor Forcein in Montoursville borough.
What is the Percentage of People in the Labor Force in Montoursville borough?
60.7% of People are in the Labor Force in Montoursville borough.
What is the Unemployment Rate in Montoursville borough?
Unemployment Rate in Montoursville borough is 4.4%.