Bangor borough, PA Map & Demographics
Bangor borough Overview
$24,033
PER CAPITA INCOME
$62,980
AVG FAMILY INCOME
$51,578
AVG HOUSEHOLD INCOME
26.1%
WAGE / INCOME GAP [ % ]
73.9¢/ $1
WAGE / INCOME GAP [ $ ]
$9,955
FAMILY INCOME DEFICIT
0.40
INEQUALITY / GINI INDEX
5,172
TOTAL POPULATION
2,253
MALE POPULATION
2,919
FEMALE POPULATION
77.18
MALES / 100 FEMALES
129.56
FEMALES / 100 MALES
35.6
MEDIAN AGE
3.2
AVG FAMILY SIZE
2.6
AVG HOUSEHOLD SIZE
2,625
LABOR FORCE [ PEOPLE ]
65.6%
PERCENT IN LABOR FORCE
5.6%
UNEMPLOYMENT RATE
Income in Bangor borough
Income Overview in Bangor borough
Per Capita Income in Bangor borough is $24,033, while median incomes of families and households are $62,980 and $51,578 respectively.
| Characteristic | Number | Measure |
| Per Capita Income | 5,172 | $24,033 |
| Median Family Income | 1,313 | $62,980 |
| Mean Family Income | 1,313 | $71,163 |
| Median Household Income | 1,981 | $51,578 |
| Mean Household Income | 1,981 | $63,131 |
| Income Deficit | 1,313 | $9,955 |
| Wage / Income Gap (%) | 5,172 | 26.10% |
| Wage / Income Gap ($) | 5,172 | 73.90¢ per $1 |
| Gini / Inequality Index | 5,172 | 0.40 |
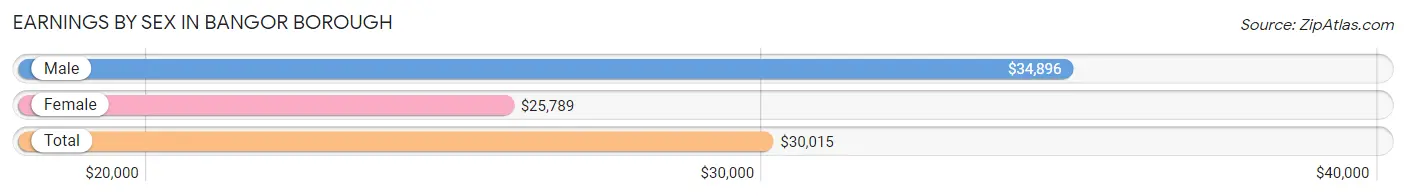
Earnings by Sex in Bangor borough
Average Earnings in Bangor borough are $30,015, $34,896 for men and $25,789 for women, a difference of 26.1%.
| Sex | Number | Average Earnings |
| Male | 1,298 (48.5%) | $34,896 |
| Female | 1,376 (51.5%) | $25,789 |
| Total | 2,674 (100.0%) | $30,015 |
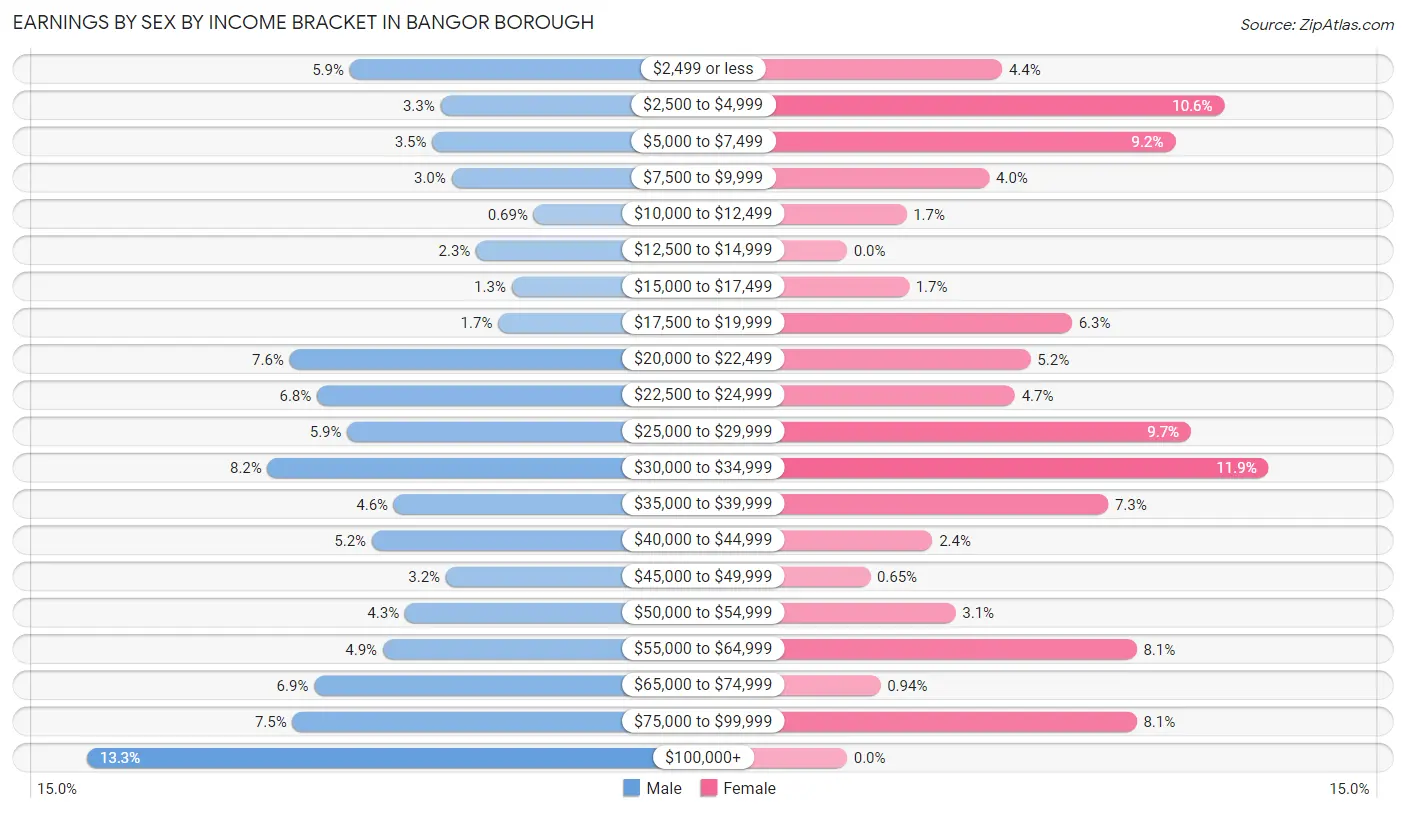
Earnings by Sex by Income Bracket in Bangor borough
The most common earnings brackets in Bangor borough are $100,000+ for men (172 | 13.3%) and $30,000 to $34,999 for women (163 | 11.8%).
| Income | Male | Female |
| $2,499 or less | 76 (5.9%) | 60 (4.4%) |
| $2,500 to $4,999 | 43 (3.3%) | 146 (10.6%) |
| $5,000 to $7,499 | 46 (3.5%) | 127 (9.2%) |
| $7,500 to $9,999 | 39 (3.0%) | 55 (4.0%) |
| $10,000 to $12,499 | 9 (0.7%) | 23 (1.7%) |
| $12,500 to $14,999 | 30 (2.3%) | 0 (0.0%) |
| $15,000 to $17,499 | 17 (1.3%) | 24 (1.7%) |
| $17,500 to $19,999 | 22 (1.7%) | 87 (6.3%) |
| $20,000 to $22,499 | 98 (7.5%) | 71 (5.2%) |
| $22,500 to $24,999 | 88 (6.8%) | 65 (4.7%) |
| $25,000 to $29,999 | 77 (5.9%) | 133 (9.7%) |
| $30,000 to $34,999 | 106 (8.2%) | 163 (11.8%) |
| $35,000 to $39,999 | 60 (4.6%) | 101 (7.3%) |
| $40,000 to $44,999 | 68 (5.2%) | 33 (2.4%) |
| $45,000 to $49,999 | 41 (3.2%) | 9 (0.6%) |
| $50,000 to $54,999 | 56 (4.3%) | 42 (3.0%) |
| $55,000 to $64,999 | 64 (4.9%) | 112 (8.1%) |
| $65,000 to $74,999 | 89 (6.9%) | 13 (0.9%) |
| $75,000 to $99,999 | 97 (7.5%) | 112 (8.1%) |
| $100,000+ | 172 (13.3%) | 0 (0.0%) |
| Total | 1,298 (100.0%) | 1,376 (100.0%) |
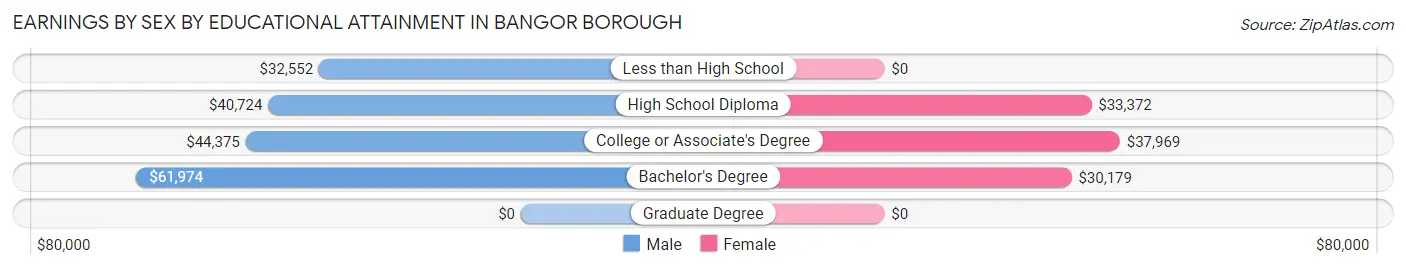
Earnings by Sex by Educational Attainment in Bangor borough
Average earnings in Bangor borough are $41,250 for men and $31,054 for women, a difference of 24.7%. Men with an educational attainment of bachelor's degree enjoy the highest average annual earnings of $61,974, while those with less than high school education earn the least with $32,552. Women with an educational attainment of college or associate's degree earn the most with the average annual earnings of $37,969, while those with bachelor's degree education have the smallest earnings of $30,179.
| Educational Attainment | Male Income | Female Income |
| Less than High School | $32,552 | $0 |
| High School Diploma | $40,724 | $33,372 |
| College or Associate's Degree | $44,375 | $37,969 |
| Bachelor's Degree | $61,974 | $30,179 |
| Graduate Degree | - | - |
| Total | $41,250 | $31,054 |
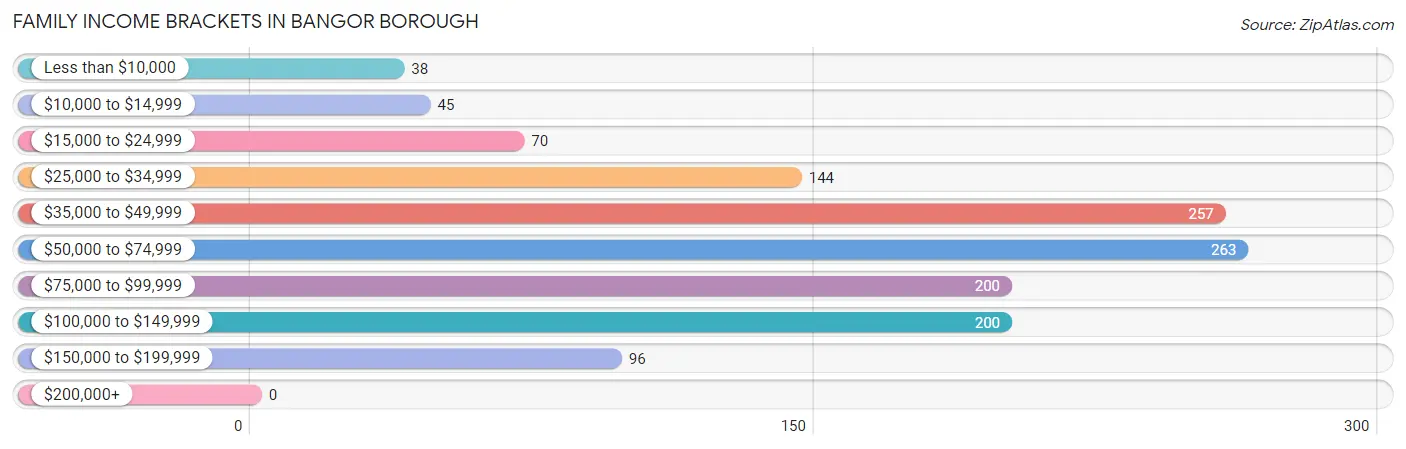
Family Income in Bangor borough
Family Income Brackets in Bangor borough
According to the Bangor borough family income data, there are 263 families falling into the $50,000 to $74,999 income range, which is the most common income bracket and makes up 20.0% of all families.
| Income Bracket | # Families | % Families |
| Less than $10,000 | 38 | 2.9% |
| $10,000 to $14,999 | 45 | 3.4% |
| $15,000 to $24,999 | 70 | 5.3% |
| $25,000 to $34,999 | 144 | 11.0% |
| $35,000 to $49,999 | 257 | 19.6% |
| $50,000 to $74,999 | 263 | 20.0% |
| $75,000 to $99,999 | 200 | 15.2% |
| $100,000 to $149,999 | 200 | 15.2% |
| $150,000 to $199,999 | 96 | 7.3% |
| $200,000+ | 0 | 0.0% |
Family Income by Famaliy Size in Bangor borough
6-person families (66 | 5.0%) account for the highest median family income in Bangor borough with $114,737 per family, while 3-person families (206 | 15.7%) have the highest median income of $29,318 per family member.
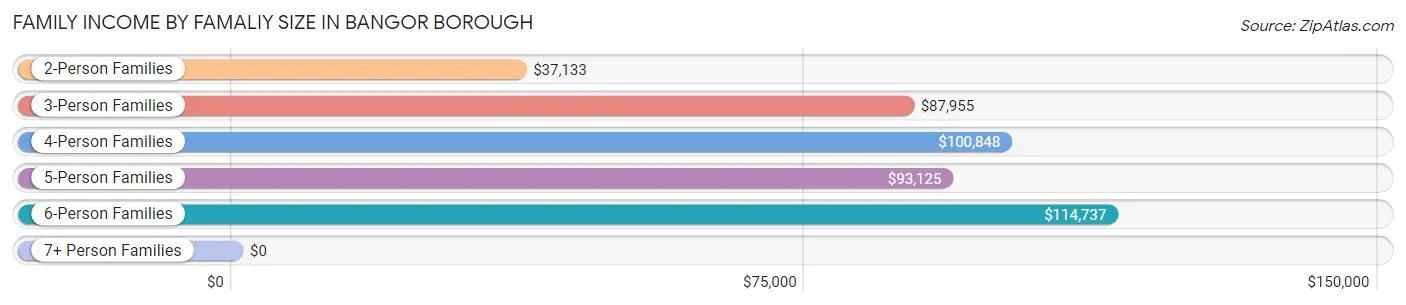
| Income Bracket | # Families | Median Income |
| 2-Person Families | 715 (54.5%) | $37,133 |
| 3-Person Families | 206 (15.7%) | $87,955 |
| 4-Person Families | 153 (11.7%) | $100,848 |
| 5-Person Families | 73 (5.6%) | $93,125 |
| 6-Person Families | 66 (5.0%) | $114,737 |
| 7+ Person Families | 100 (7.6%) | $0 |
| Total | 1,313 (100.0%) | $62,980 |
Family Income by Number of Earners in Bangor borough
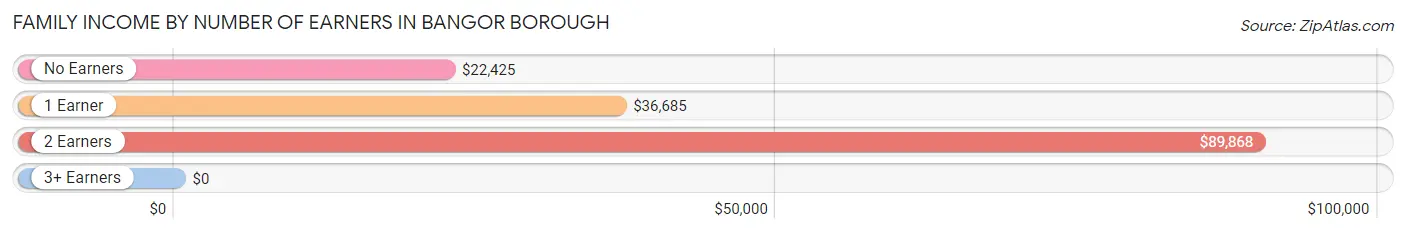
| Number of Earners | # Families | Median Income |
| No Earners | 261 (19.9%) | $22,425 |
| 1 Earner | 344 (26.2%) | $36,685 |
| 2 Earners | 578 (44.0%) | $89,868 |
| 3+ Earners | 130 (9.9%) | $0 |
| Total | 1,313 (100.0%) | $62,980 |
Household Income in Bangor borough
Household Income Brackets in Bangor borough
With 384 households falling in the category, the $50,000 to $74,999 income range is the most frequent in Bangor borough, accounting for 19.4% of all households. In contrast, only 14 households (0.7%) fall into the $200,000+ income bracket, making it the least populous group.
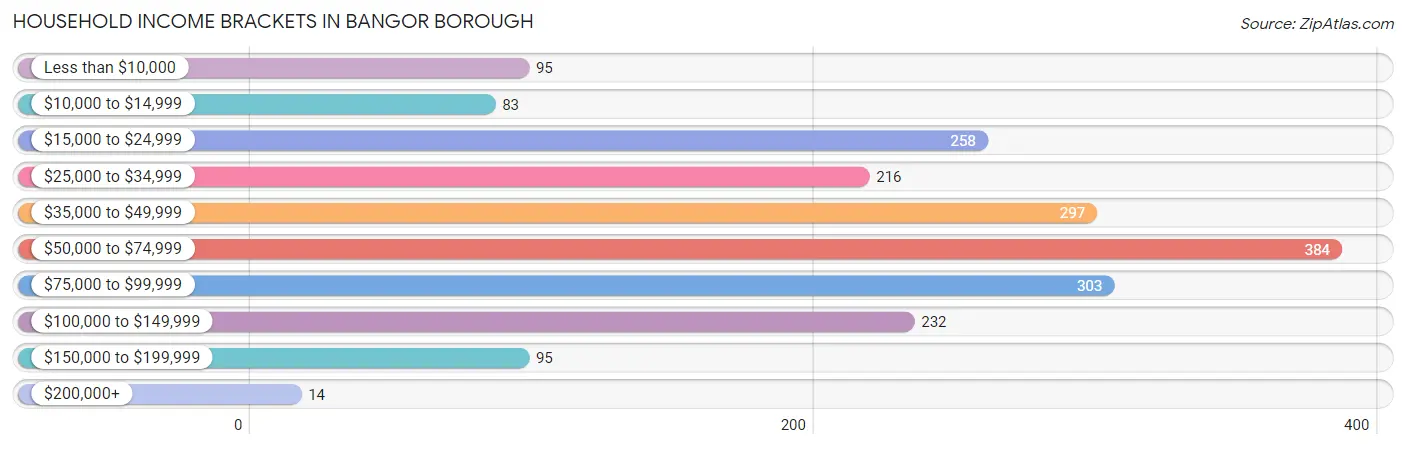
| Income Bracket | # Households | % Households |
| Less than $10,000 | 95 | 4.8% |
| $10,000 to $14,999 | 83 | 4.2% |
| $15,000 to $24,999 | 258 | 13.0% |
| $25,000 to $34,999 | 216 | 10.9% |
| $35,000 to $49,999 | 297 | 15.0% |
| $50,000 to $74,999 | 384 | 19.4% |
| $75,000 to $99,999 | 303 | 15.3% |
| $100,000 to $149,999 | 232 | 11.7% |
| $150,000 to $199,999 | 95 | 4.8% |
| $200,000+ | 14 | 0.7% |
Household Income by Householder Age in Bangor borough
The median household income in Bangor borough is $51,578, with the highest median household income of $64,136 found in the 25 to 44 years age bracket for the primary householder. A total of 738 households (37.2%) fall into this category. Meanwhile, the 65+ years age bracket for the primary householder has the lowest median household income of $28,917, with 546 households (27.6%) in this group.
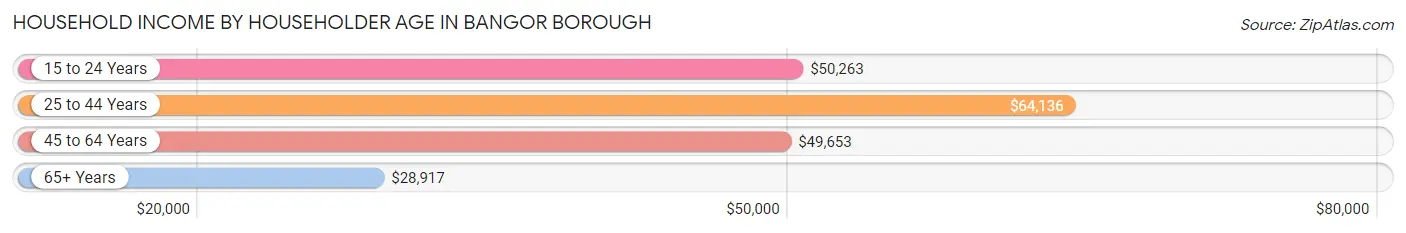
| Income Bracket | # Households | Median Income |
| 15 to 24 Years | 68 (3.4%) | $50,263 |
| 25 to 44 Years | 738 (37.2%) | $64,136 |
| 45 to 64 Years | 629 (31.8%) | $49,653 |
| 65+ Years | 546 (27.6%) | $28,917 |
| Total | 1,981 (100.0%) | $51,578 |
Poverty in Bangor borough
Income Below Poverty by Sex and Age in Bangor borough
With 7.8% poverty level for males and 11.6% for females among the residents of Bangor borough, 16 and 17 year old males and under 5 year old females are the most vulnerable to poverty, with 19 males (30.2%) and 35 females (45.5%) in their respective age groups living below the poverty level.
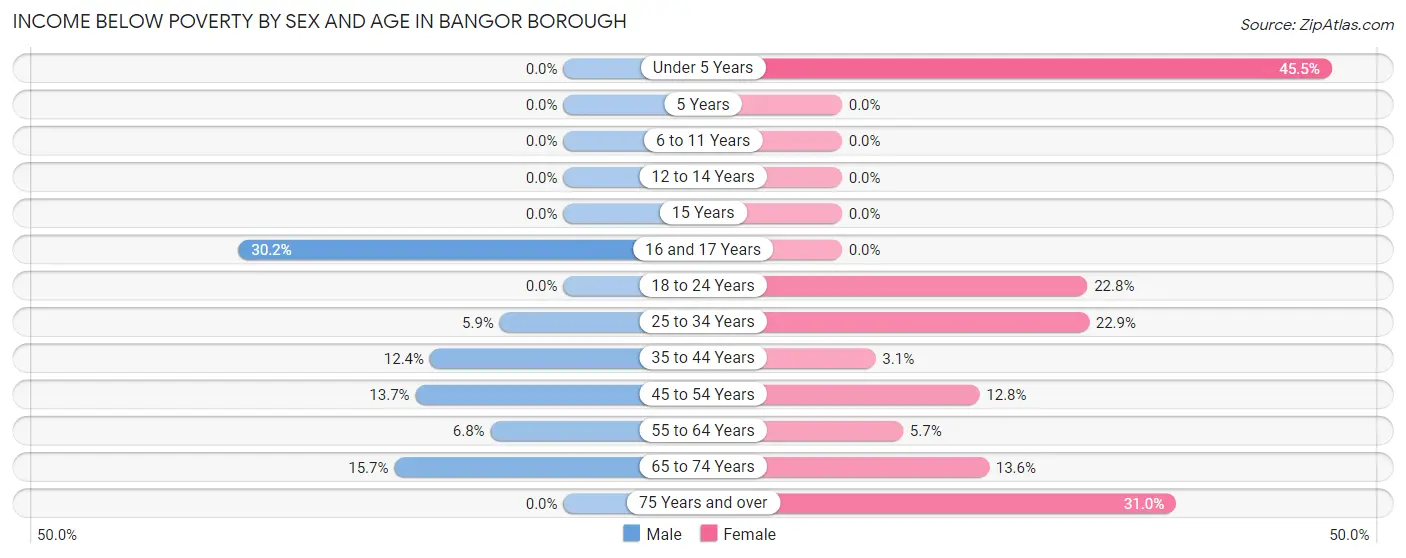
| Age Bracket | Male | Female |
| Under 5 Years | 0 (0.0%) | 35 (45.5%) |
| 5 Years | 0 (0.0%) | 0 (0.0%) |
| 6 to 11 Years | 0 (0.0%) | 0 (0.0%) |
| 12 to 14 Years | 0 (0.0%) | 0 (0.0%) |
| 15 Years | 0 (0.0%) | 0 (0.0%) |
| 16 and 17 Years | 19 (30.2%) | 0 (0.0%) |
| 18 to 24 Years | 0 (0.0%) | 95 (22.8%) |
| 25 to 34 Years | 15 (5.9%) | 55 (22.9%) |
| 35 to 44 Years | 44 (12.4%) | 14 (3.1%) |
| 45 to 54 Years | 46 (13.7%) | 30 (12.8%) |
| 55 to 64 Years | 17 (6.8%) | 16 (5.7%) |
| 65 to 74 Years | 32 (15.7%) | 30 (13.6%) |
| 75 Years and over | 0 (0.0%) | 58 (31.0%) |
| Total | 173 (7.8%) | 333 (11.6%) |
Income Above Poverty by Sex and Age in Bangor borough
According to the poverty statistics in Bangor borough, males aged under 5 years and females aged 5 years are the age groups that are most secure financially, with 100.0% of males and 100.0% of females in these age groups living above the poverty line.
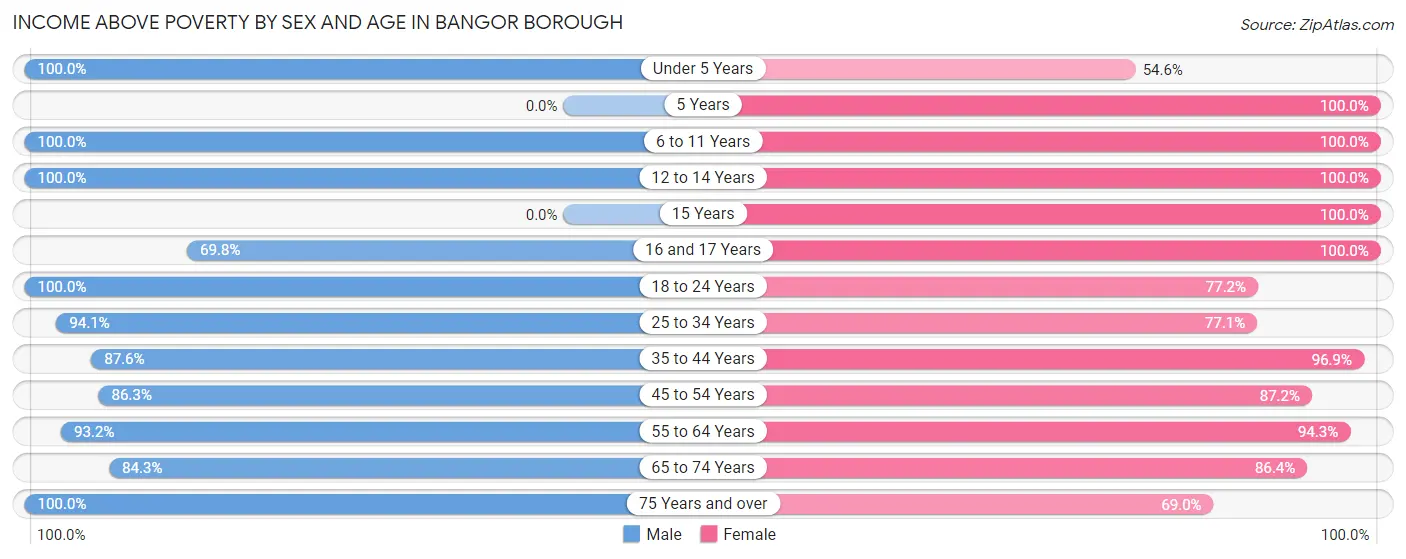
| Age Bracket | Male | Female |
| Under 5 Years | 109 (100.0%) | 42 (54.5%) |
| 5 Years | 0 (0.0%) | 15 (100.0%) |
| 6 to 11 Years | 149 (100.0%) | 260 (100.0%) |
| 12 to 14 Years | 156 (100.0%) | 182 (100.0%) |
| 15 Years | 0 (0.0%) | 151 (100.0%) |
| 16 and 17 Years | 44 (69.8%) | 155 (100.0%) |
| 18 to 24 Years | 260 (100.0%) | 322 (77.2%) |
| 25 to 34 Years | 239 (94.1%) | 185 (77.1%) |
| 35 to 44 Years | 311 (87.6%) | 435 (96.9%) |
| 45 to 54 Years | 289 (86.3%) | 205 (87.2%) |
| 55 to 64 Years | 234 (93.2%) | 266 (94.3%) |
| 65 to 74 Years | 172 (84.3%) | 190 (86.4%) |
| 75 Years and over | 94 (100.0%) | 129 (69.0%) |
| Total | 2,057 (92.2%) | 2,537 (88.4%) |
Income Below Poverty Among Married-Couple Families in Bangor borough
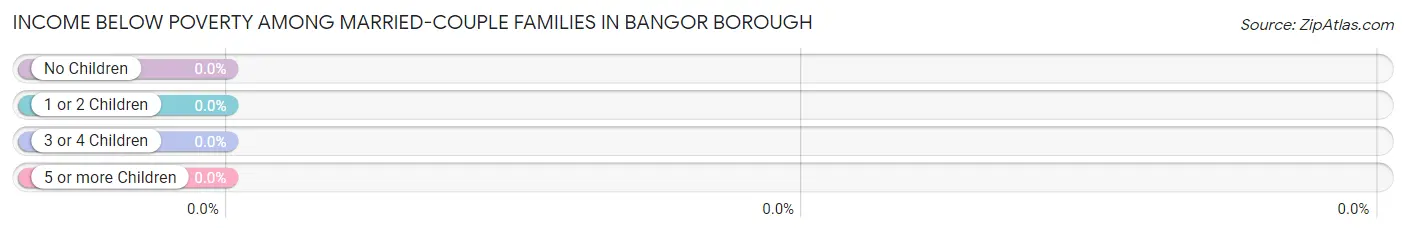
| Children | Above Poverty | Below Poverty |
| No Children | 442 (100.0%) | 0 (0.0%) |
| 1 or 2 Children | 154 (100.0%) | 0 (0.0%) |
| 3 or 4 Children | 89 (100.0%) | 0 (0.0%) |
| 5 or more Children | 100 (100.0%) | 0 (0.0%) |
| Total | 785 (100.0%) | 0 (0.0%) |
Income Below Poverty Among Single-Parent Households in Bangor borough
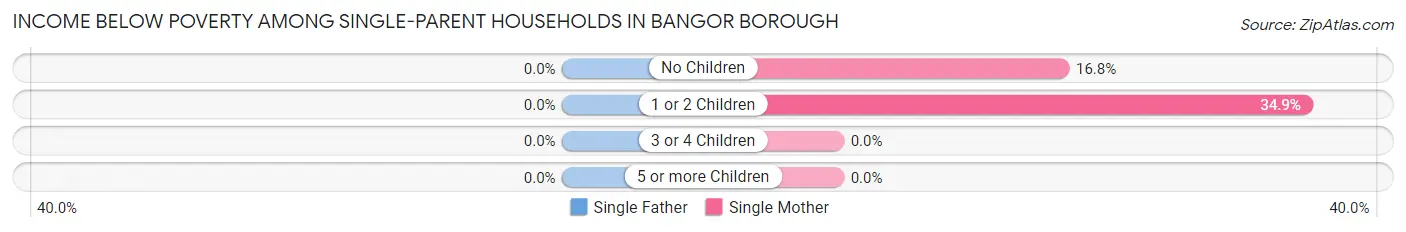
| Children | Single Father | Single Mother |
| No Children | 0 (0.0%) | 44 (16.8%) |
| 1 or 2 Children | 0 (0.0%) | 58 (34.9%) |
| 3 or 4 Children | 0 (0.0%) | 0 (0.0%) |
| 5 or more Children | 0 (0.0%) | 0 (0.0%) |
| Total | 0 (0.0%) | 102 (23.8%) |
Income Below Poverty Among Married-Couple vs Single-Parent Households in Bangor borough
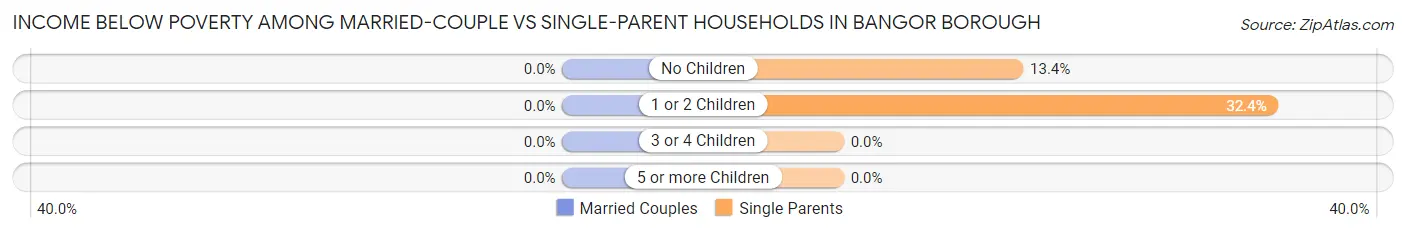
| Children | Married-Couple Families | Single-Parent Households |
| No Children | 0 (0.0%) | 44 (13.4%) |
| 1 or 2 Children | 0 (0.0%) | 58 (32.4%) |
| 3 or 4 Children | 0 (0.0%) | 0 (0.0%) |
| 5 or more Children | 0 (0.0%) | 0 (0.0%) |
| Total | 0 (0.0%) | 102 (19.3%) |
Race in Bangor borough
The most populous races in Bangor borough are White / Caucasian (4,521 | 87.4%), Hispanic or Latino (482 | 9.3%), and Two or more Races (420 | 8.1%).
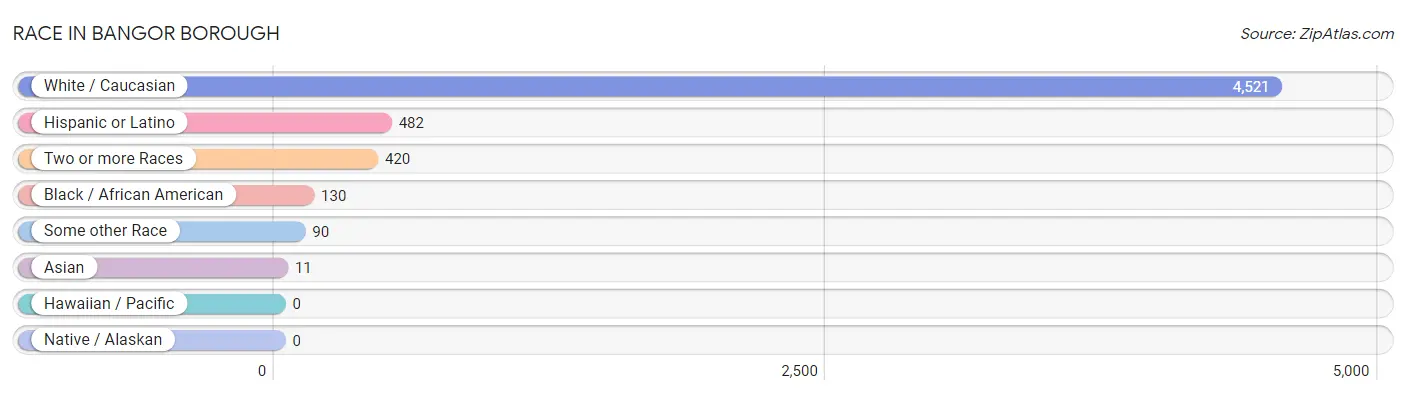
| Race | # Population | % Population |
| Asian | 11 | 0.2% |
| Black / African American | 130 | 2.5% |
| Hawaiian / Pacific | 0 | 0.0% |
| Hispanic or Latino | 482 | 9.3% |
| Native / Alaskan | 0 | 0.0% |
| White / Caucasian | 4,521 | 87.4% |
| Two or more Races | 420 | 8.1% |
| Some other Race | 90 | 1.7% |
| Total | 5,172 | 100.0% |
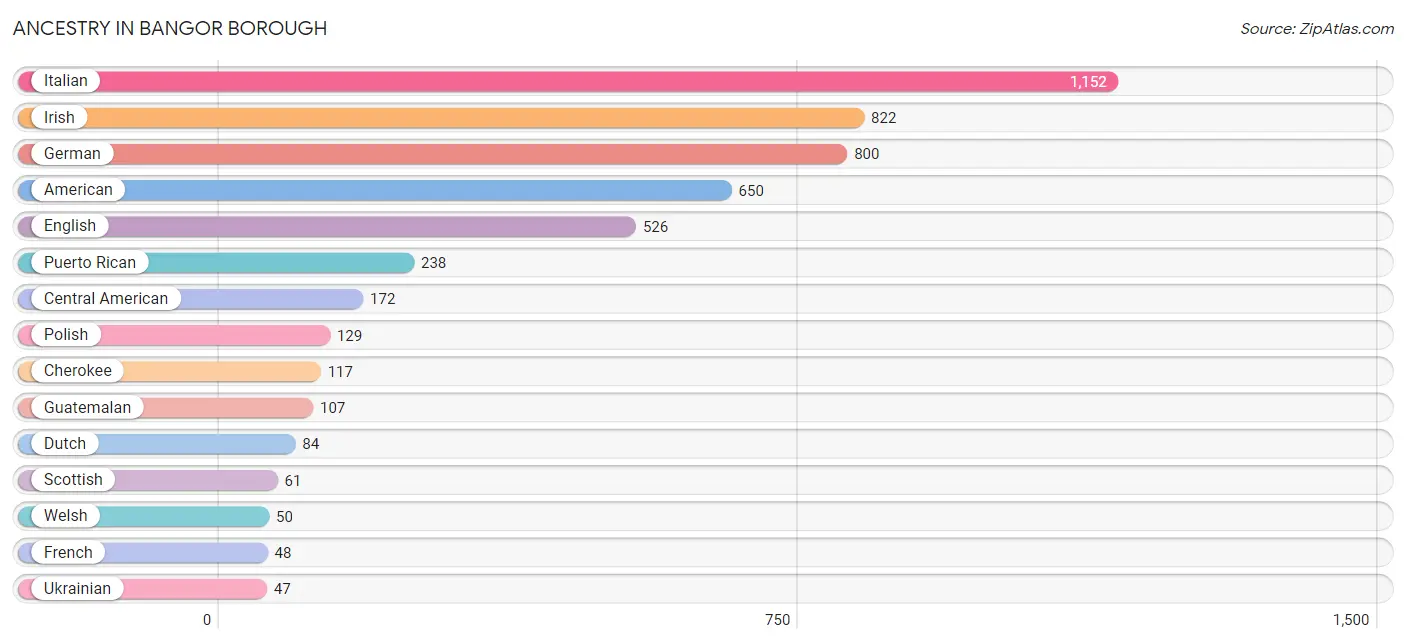
Ancestry in Bangor borough
The most populous ancestries reported in Bangor borough are Italian (1,152 | 22.3%), Irish (822 | 15.9%), German (800 | 15.5%), American (650 | 12.6%), and English (526 | 10.2%), together accounting for 76.4% of all Bangor borough residents.
| Ancestry | # Population | % Population |
| Albanian | 4 | 0.1% |
| American | 650 | 12.6% |
| Canadian | 28 | 0.5% |
| Central American | 172 | 3.3% |
| Cherokee | 117 | 2.3% |
| Danish | 12 | 0.2% |
| Dominican | 42 | 0.8% |
| Dutch | 84 | 1.6% |
| Eastern European | 4 | 0.1% |
| English | 526 | 10.2% |
| European | 12 | 0.2% |
| French | 48 | 0.9% |
| German | 800 | 15.5% |
| Guatemalan | 107 | 2.1% |
| Honduran | 19 | 0.4% |
| Hungarian | 13 | 0.3% |
| Irish | 822 | 15.9% |
| Italian | 1,152 | 22.3% |
| Mexican | 1 | 0.0% |
| Nicaraguan | 46 | 0.9% |
| Norwegian | 2 | 0.0% |
| Pennsylvania German | 20 | 0.4% |
| Polish | 129 | 2.5% |
| Puerto Rican | 238 | 4.6% |
| Russian | 16 | 0.3% |
| Scottish | 61 | 1.2% |
| Slovak | 40 | 0.8% |
| Spaniard | 29 | 0.6% |
| Swedish | 40 | 0.8% |
| Swiss | 29 | 0.6% |
| Thai | 11 | 0.2% |
| Ukrainian | 47 | 0.9% |
| Welsh | 50 | 1.0% | View All 33 Rows |
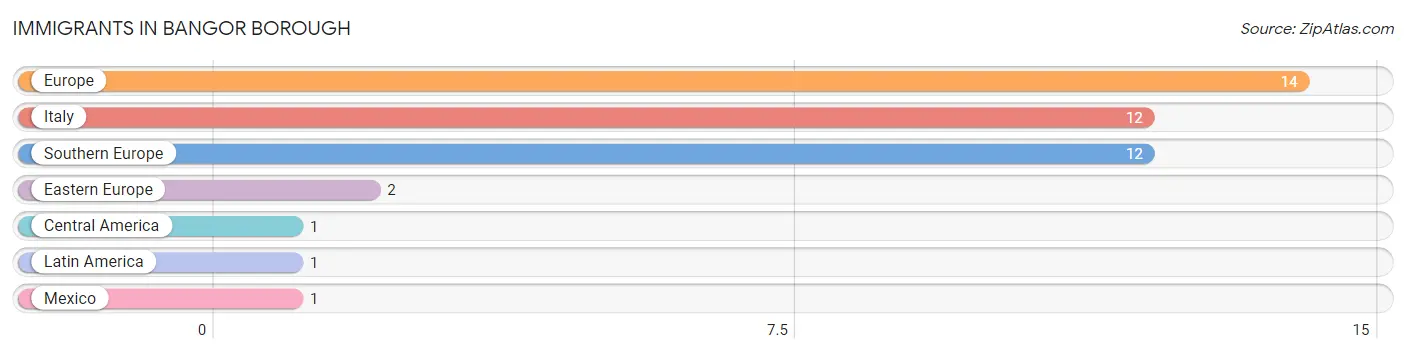
Immigrants in Bangor borough
The most numerous immigrant groups reported in Bangor borough came from Europe (14 | 0.3%), Italy (12 | 0.2%), Southern Europe (12 | 0.2%), Eastern Europe (2 | 0.0%), and Central America (1 | 0.0%), together accounting for 0.8% of all Bangor borough residents.
| Immigration Origin | # Population | % Population |
| Central America | 1 | 0.0% |
| Eastern Europe | 2 | 0.0% |
| Europe | 14 | 0.3% |
| Italy | 12 | 0.2% |
| Latin America | 1 | 0.0% |
| Mexico | 1 | 0.0% |
| Southern Europe | 12 | 0.2% | View All 7 Rows |
Sex and Age in Bangor borough
Sex and Age in Bangor borough
The most populous age groups in Bangor borough are 35 to 39 Years (269 | 11.9%) for men and 15 to 19 Years (374 | 12.8%) for women.

| Age Bracket | Male | Female |
| Under 5 Years | 132 (5.9%) | 104 (3.6%) |
| 5 to 9 Years | 106 (4.7%) | 255 (8.7%) |
| 10 to 14 Years | 199 (8.8%) | 224 (7.7%) |
| 15 to 19 Years | 208 (9.2%) | 374 (12.8%) |
| 20 to 24 Years | 115 (5.1%) | 349 (12.0%) |
| 25 to 29 Years | 138 (6.1%) | 158 (5.4%) |
| 30 to 34 Years | 116 (5.1%) | 82 (2.8%) |
| 35 to 39 Years | 269 (11.9%) | 169 (5.8%) |
| 40 to 44 Years | 86 (3.8%) | 280 (9.6%) |
| 45 to 49 Years | 187 (8.3%) | 137 (4.7%) |
| 50 to 54 Years | 148 (6.6%) | 98 (3.4%) |
| 55 to 59 Years | 87 (3.9%) | 107 (3.7%) |
| 60 to 64 Years | 164 (7.3%) | 175 (6.0%) |
| 65 to 69 Years | 128 (5.7%) | 122 (4.2%) |
| 70 to 74 Years | 76 (3.4%) | 98 (3.4%) |
| 75 to 79 Years | 65 (2.9%) | 138 (4.7%) |
| 80 to 84 Years | 18 (0.8%) | 36 (1.2%) |
| 85 Years and over | 11 (0.5%) | 13 (0.4%) |
| Total | 2,253 (100.0%) | 2,919 (100.0%) |
Families and Households in Bangor borough
Median Family Size in Bangor borough
The median family size in Bangor borough is 3.18 persons per family, with married-couple families (785 | 59.8%) accounting for the largest median family size of 3.69 persons per family. On the other hand, single female/mother families (428 | 32.6%) represent the smallest median family size with 2.40 persons per family.
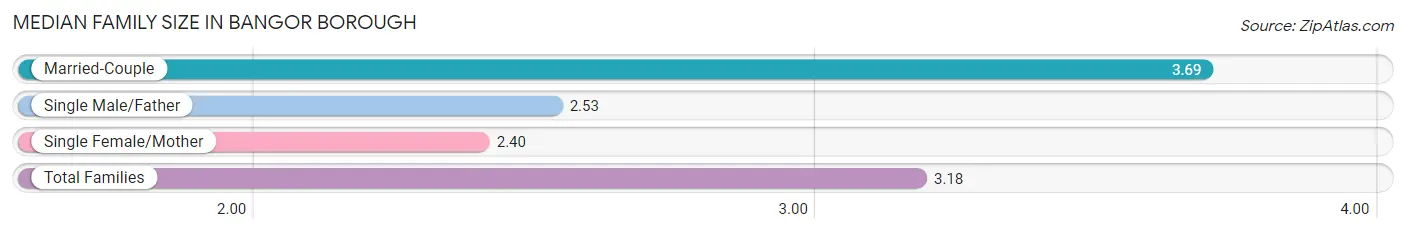
| Family Type | # Families | Family Size |
| Married-Couple | 785 (59.8%) | 3.69 |
| Single Male/Father | 100 (7.6%) | 2.53 |
| Single Female/Mother | 428 (32.6%) | 2.40 |
| Total Families | 1,313 (100.0%) | 3.18 |
Median Household Size in Bangor borough
The median household size in Bangor borough is 2.61 persons per household, with married-couple households (785 | 39.6%) accounting for the largest median household size of 3.77 persons per household. non-family households (668 | 33.7%) represent the smallest median household size with 1.16 persons per household.
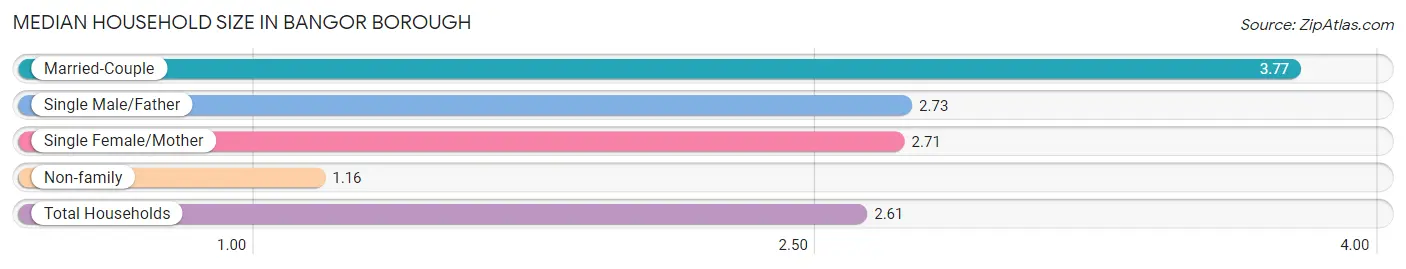
| Household Type | # Households | Household Size |
| Married-Couple | 785 (39.6%) | 3.77 |
| Single Male/Father | 100 (5.1%) | 2.73 |
| Single Female/Mother | 428 (21.6%) | 2.71 |
| Non-family | 668 (33.7%) | 1.16 |
| Total Households | 1,981 (100.0%) | 2.61 |
Household Size by Marriage Status in Bangor borough
Out of a total of 1,981 households in Bangor borough, 1,313 (66.3%) are family households, while 668 (33.7%) are nonfamily households. The most numerous type of family households are 2-person households, comprising 640, and the most common type of nonfamily households are 1-person households, comprising 580.
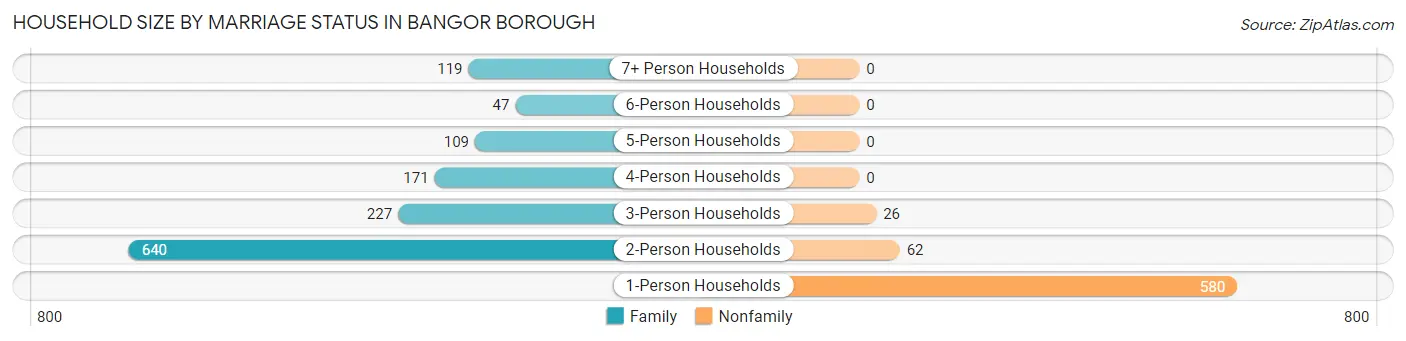
| Household Size | Family Households | Nonfamily Households |
| 1-Person Households | - | 580 (29.3%) |
| 2-Person Households | 640 (32.3%) | 62 (3.1%) |
| 3-Person Households | 227 (11.5%) | 26 (1.3%) |
| 4-Person Households | 171 (8.6%) | 0 (0.0%) |
| 5-Person Households | 109 (5.5%) | 0 (0.0%) |
| 6-Person Households | 47 (2.4%) | 0 (0.0%) |
| 7+ Person Households | 119 (6.0%) | 0 (0.0%) |
| Total | 1,313 (66.3%) | 668 (33.7%) |
Female Fertility in Bangor borough
Fertility by Age in Bangor borough
| Age Bracket | Women with Births | Births / 1,000 Women |
| 15 to 19 years | 0 (0.0%) | 0.0 |
| 20 to 34 years | 0 (0.0%) | 0.0 |
| 35 to 50 years | 0 (0.0%) | 0.0 |
| Total | 0 (0.0%) | 0.0 |
Fertility by Age by Marriage Status in Bangor borough
| Age Bracket | Married | Unmarried |
| 15 to 19 years | 0 (0.0%) | 0 (0.0%) |
| 20 to 34 years | 0 (0.0%) | 0 (0.0%) |
| 35 to 50 years | 0 (0.0%) | 0 (0.0%) |
| Total | 0 (0.0%) | 0 (0.0%) |
Fertility by Education in Bangor borough
| Educational Attainment | Women with Births | Births / 1,000 Women |
| Less than High School | 0 (0.0%) | 0.0 |
| High School Diploma | 0 (0.0%) | 0.0 |
| College or Associate's Degree | 0 (0.0%) | 0.0 |
| Bachelor's Degree | 0 (0.0%) | 0.0 |
| Graduate Degree | 0 (0.0%) | 0.0 |
| Total | 0 (0.0%) | 0.0 |
Fertility by Education by Marriage Status in Bangor borough
| Educational Attainment | Married | Unmarried |
| Less than High School | 0 (0.0%) | 0 (0.0%) |
| High School Diploma | 0 (0.0%) | 0 (0.0%) |
| College or Associate's Degree | 0 (0.0%) | 0 (0.0%) |
| Bachelor's Degree | 0 (0.0%) | 0 (0.0%) |
| Graduate Degree | 0 (0.0%) | 0 (0.0%) |
| Total | 0 (0.0%) | 0 (0.0%) |
Employment Characteristics in Bangor borough
Employment by Class of Employer in Bangor borough
Among the 2,418 employed individuals in Bangor borough, private company employees (1,922 | 79.5%), not-for-profit organizations (156 | 6.5%), and local government employees (135 | 5.6%) make up the most common classes of employment.
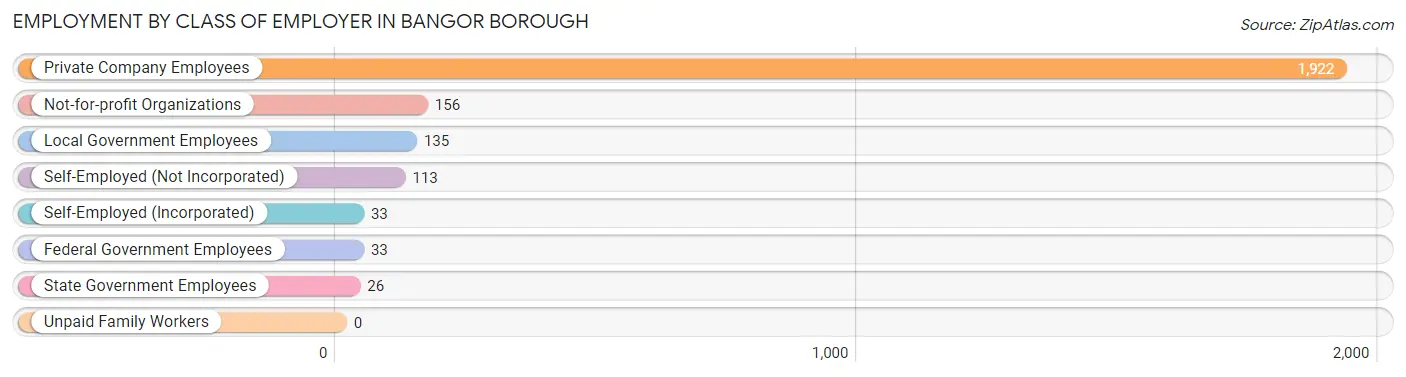
| Employer Class | # Employees | % Employees |
| Private Company Employees | 1,922 | 79.5% |
| Self-Employed (Incorporated) | 33 | 1.4% |
| Self-Employed (Not Incorporated) | 113 | 4.7% |
| Not-for-profit Organizations | 156 | 6.5% |
| Local Government Employees | 135 | 5.6% |
| State Government Employees | 26 | 1.1% |
| Federal Government Employees | 33 | 1.4% |
| Unpaid Family Workers | 0 | 0.0% |
| Total | 2,418 | 100.0% |
Employment Status by Age in Bangor borough
According to the labor force statistics for Bangor borough, out of the total population over 16 years of age (4,001), 65.6% or 2,625 individuals are in the labor force, with 5.6% or 147 of them unemployed. The age group with the highest labor force participation rate is 30 to 34 years, with 100.0% or 198 individuals in the labor force. Within the labor force, the 55 to 59 years age range has the highest percentage of unemployed individuals, with 15.0% or 28 of them being unemployed.
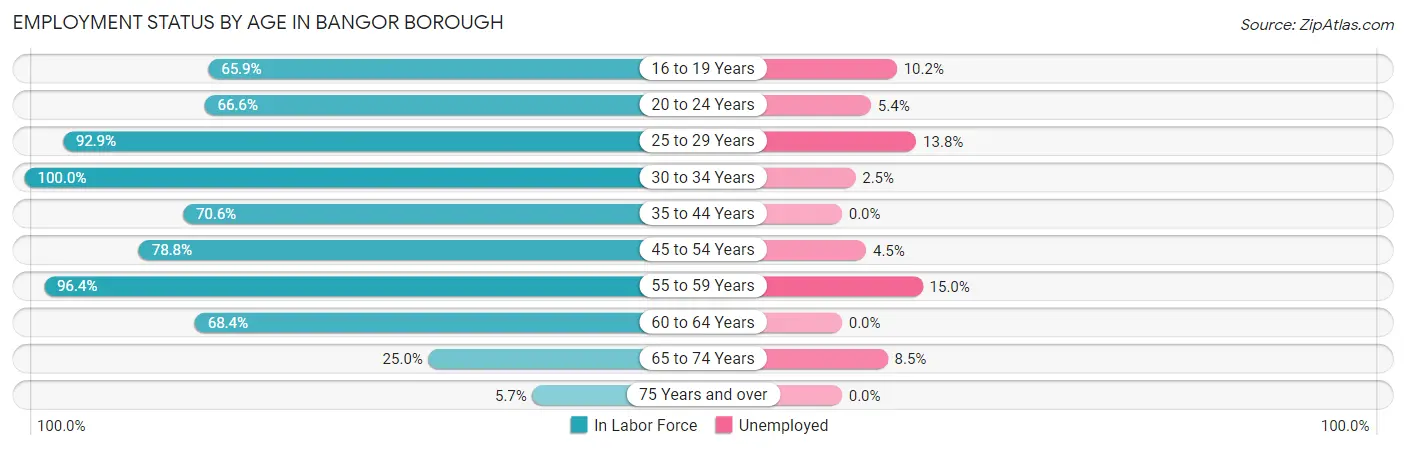
| Age Bracket | In Labor Force | Unemployed |
| 16 to 19 Years | 284 (65.9%) | 29 (10.2%) |
| 20 to 24 Years | 309 (66.6%) | 17 (5.4%) |
| 25 to 29 Years | 275 (92.9%) | 38 (13.8%) |
| 30 to 34 Years | 198 (100.0%) | 5 (2.5%) |
| 35 to 44 Years | 568 (70.6%) | 0 (0.0%) |
| 45 to 54 Years | 449 (78.8%) | 20 (4.5%) |
| 55 to 59 Years | 187 (96.4%) | 28 (15.0%) |
| 60 to 64 Years | 232 (68.4%) | 0 (0.0%) |
| 65 to 74 Years | 106 (25.0%) | 9 (8.5%) |
| 75 Years and over | 16 (5.7%) | 0 (0.0%) |
| Total | 2,625 (65.6%) | 147 (5.6%) |
Employment Status by Educational Attainment in Bangor borough
According to labor force statistics for Bangor borough, 79.5% of individuals (1,909) out of the total population between 25 and 64 years of age (2,401) are in the labor force, with 4.8% or 92 of them being unemployed. The group with the highest labor force participation rate are those with the educational attainment of less than high school, with 91.4% or 245 individuals in the labor force. Within the labor force, individuals with less than high school education have the highest percentage of unemployment, with 8.6% or 21 of them being unemployed.
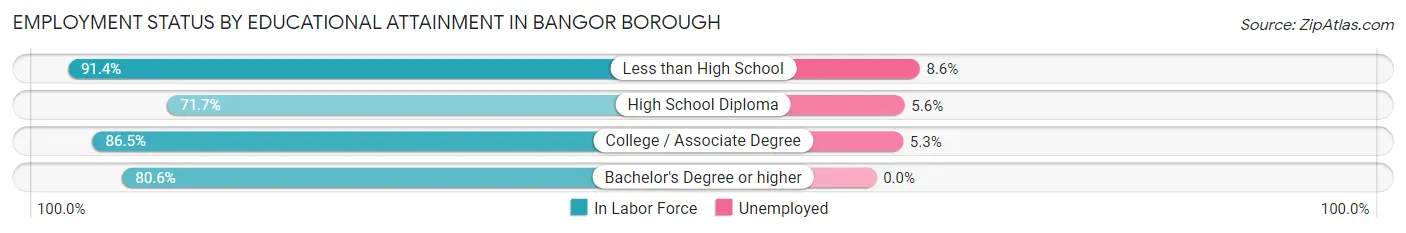
| Educational Attainment | In Labor Force | Unemployed |
| Less than High School | 245 (91.4%) | 23 (8.6%) |
| High School Diploma | 744 (71.7%) | 58 (5.6%) |
| College / Associate Degree | 533 (86.5%) | 33 (5.3%) |
| Bachelor's Degree or higher | 387 (80.6%) | 0 (0.0%) |
| Total | 1,909 (79.5%) | 115 (4.8%) |
Employment Occupations by Sex in Bangor borough
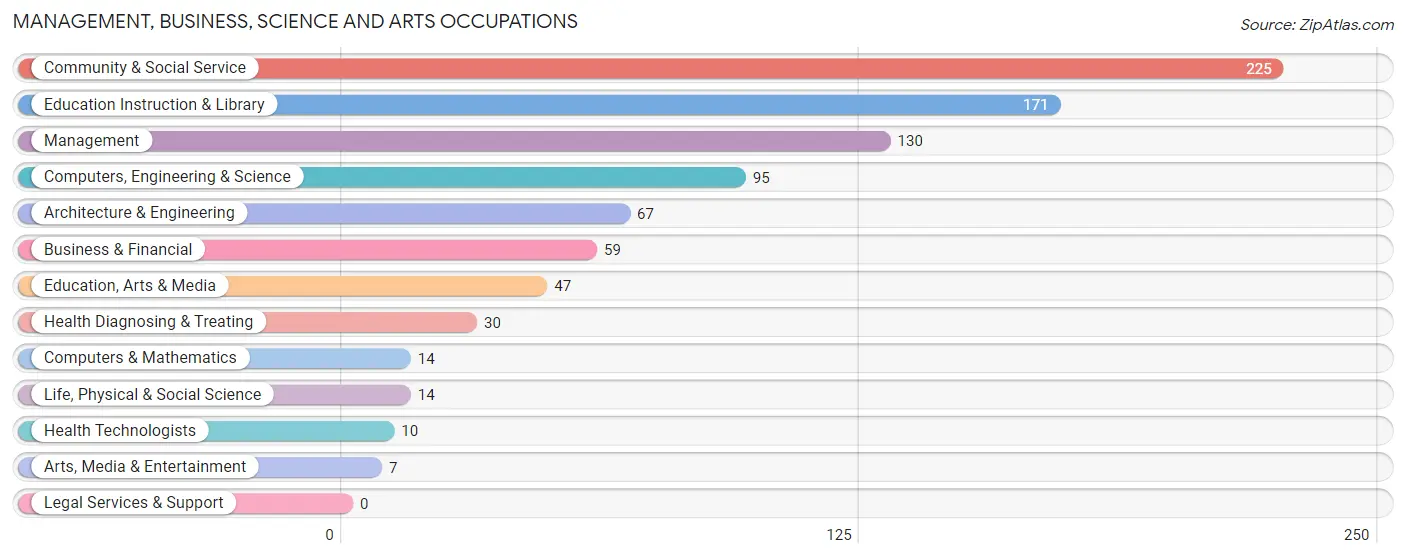
Management, Business, Science and Arts Occupations
The most common Management, Business, Science and Arts occupations in Bangor borough are Community & Social Service (225 | 9.1%), Education Instruction & Library (171 | 6.9%), Management (130 | 5.3%), Computers, Engineering & Science (95 | 3.8%), and Architecture & Engineering (67 | 2.7%).
Management, Business, Science and Arts Occupations by Sex
Within the Management, Business, Science and Arts occupations in Bangor borough, the most male-oriented occupations are Computers & Mathematics (100.0%), Life, Physical & Social Science (100.0%), and Management (68.5%), while the most female-oriented occupations are Education Instruction & Library (100.0%), Arts, Media & Entertainment (100.0%), and Health Diagnosing & Treating (100.0%).
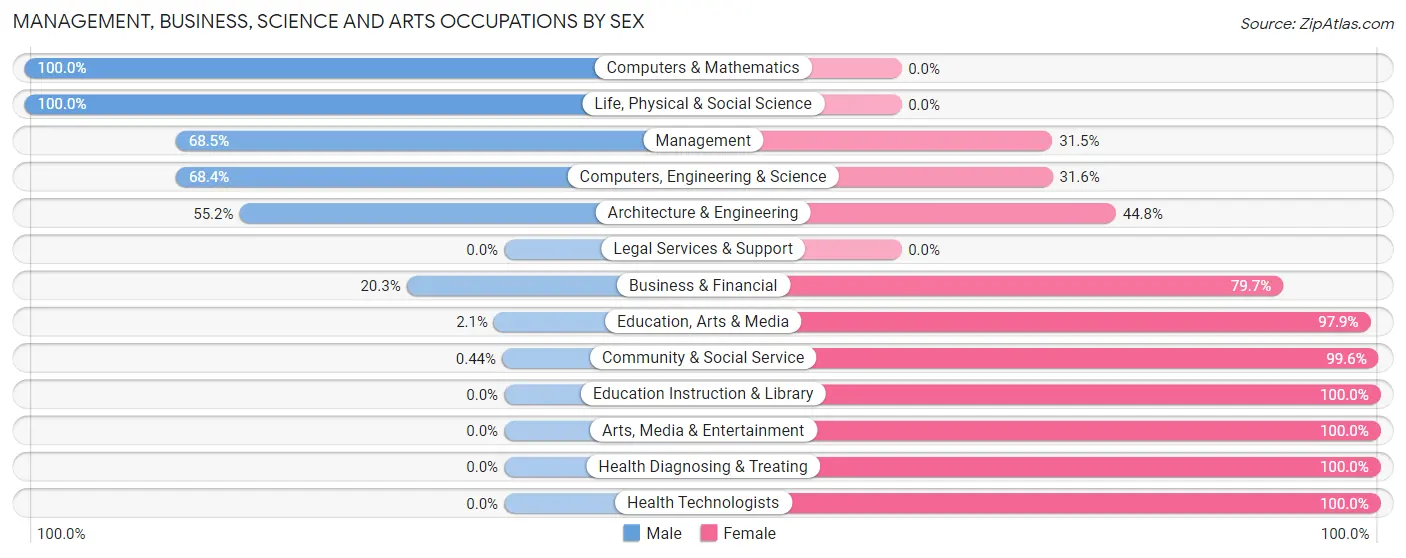
| Occupation | Male | Female |
| Management | 89 (68.5%) | 41 (31.5%) |
| Business & Financial | 12 (20.3%) | 47 (79.7%) |
| Computers, Engineering & Science | 65 (68.4%) | 30 (31.6%) |
| Computers & Mathematics | 14 (100.0%) | 0 (0.0%) |
| Architecture & Engineering | 37 (55.2%) | 30 (44.8%) |
| Life, Physical & Social Science | 14 (100.0%) | 0 (0.0%) |
| Community & Social Service | 1 (0.4%) | 224 (99.6%) |
| Education, Arts & Media | 1 (2.1%) | 46 (97.9%) |
| Legal Services & Support | 0 (0.0%) | 0 (0.0%) |
| Education Instruction & Library | 0 (0.0%) | 171 (100.0%) |
| Arts, Media & Entertainment | 0 (0.0%) | 7 (100.0%) |
| Health Diagnosing & Treating | 0 (0.0%) | 30 (100.0%) |
| Health Technologists | 0 (0.0%) | 10 (100.0%) |
| Total (Category) | 167 (31.0%) | 372 (69.0%) |
| Total (Overall) | 1,197 (48.6%) | 1,268 (51.4%) |
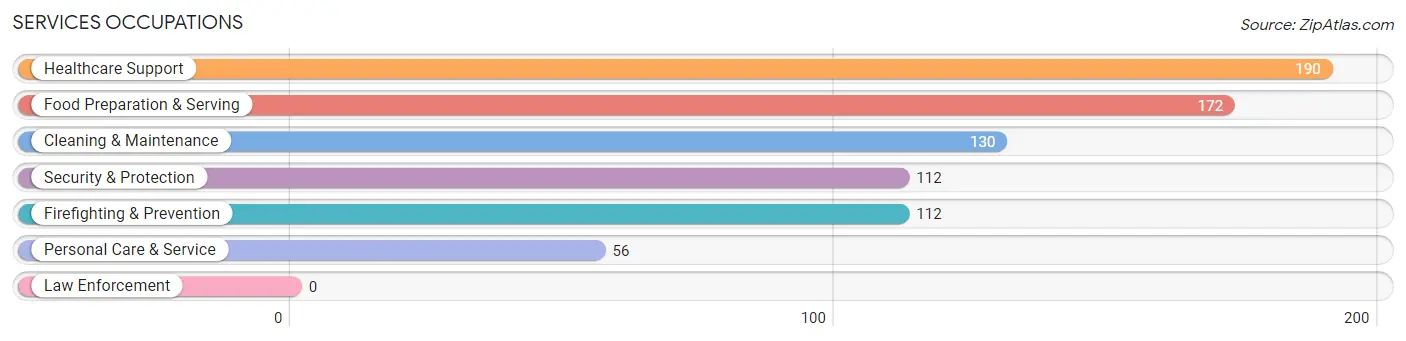
Services Occupations
The most common Services occupations in Bangor borough are Healthcare Support (190 | 7.7%), Food Preparation & Serving (172 | 7.0%), Cleaning & Maintenance (130 | 5.3%), Security & Protection (112 | 4.5%), and Firefighting & Prevention (112 | 4.5%).
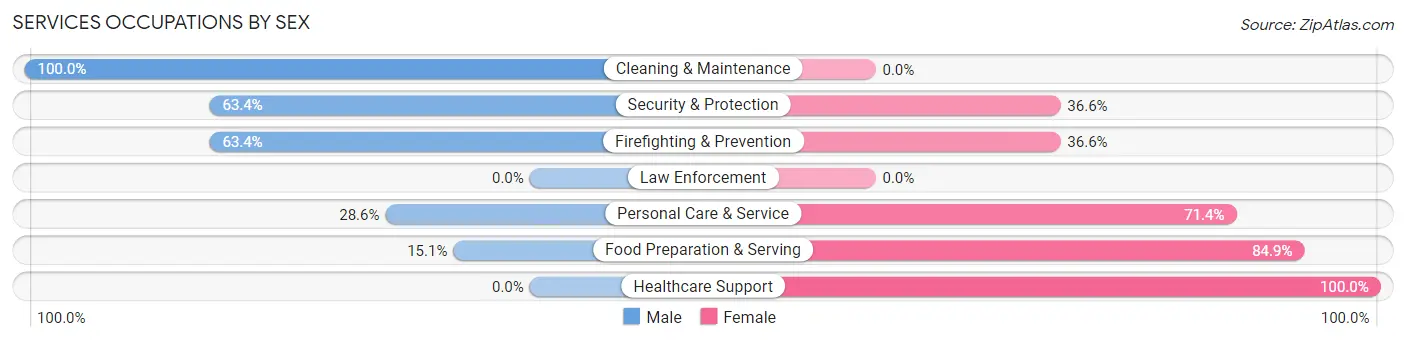
Services Occupations by Sex
Within the Services occupations in Bangor borough, the most male-oriented occupations are Cleaning & Maintenance (100.0%), Security & Protection (63.4%), and Firefighting & Prevention (63.4%), while the most female-oriented occupations are Healthcare Support (100.0%), Food Preparation & Serving (84.9%), and Personal Care & Service (71.4%).
| Occupation | Male | Female |
| Healthcare Support | 0 (0.0%) | 190 (100.0%) |
| Security & Protection | 71 (63.4%) | 41 (36.6%) |
| Firefighting & Prevention | 71 (63.4%) | 41 (36.6%) |
| Law Enforcement | 0 (0.0%) | 0 (0.0%) |
| Food Preparation & Serving | 26 (15.1%) | 146 (84.9%) |
| Cleaning & Maintenance | 130 (100.0%) | 0 (0.0%) |
| Personal Care & Service | 16 (28.6%) | 40 (71.4%) |
| Total (Category) | 243 (36.8%) | 417 (63.2%) |
| Total (Overall) | 1,197 (48.6%) | 1,268 (51.4%) |
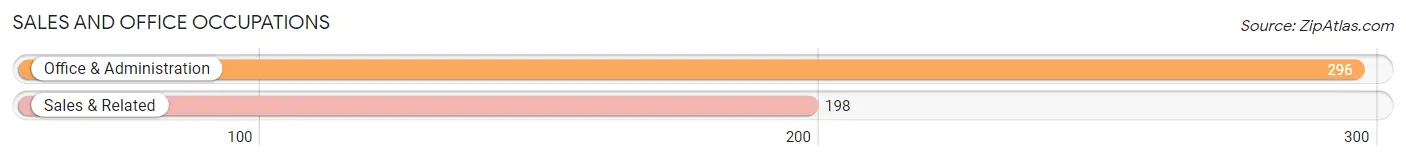
Sales and Office Occupations
The most common Sales and Office occupations in Bangor borough are Office & Administration (296 | 12.0%), and Sales & Related (198 | 8.0%).
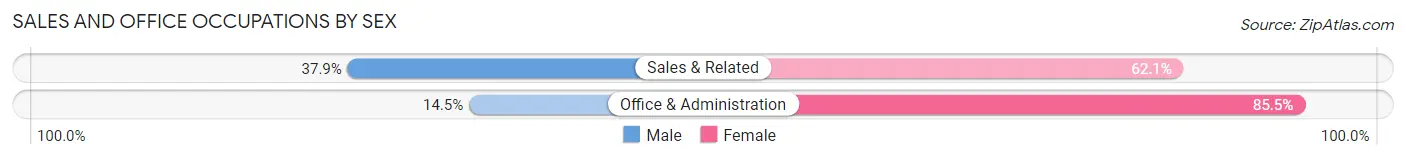
Sales and Office Occupations by Sex
| Occupation | Male | Female |
| Sales & Related | 75 (37.9%) | 123 (62.1%) |
| Office & Administration | 43 (14.5%) | 253 (85.5%) |
| Total (Category) | 118 (23.9%) | 376 (76.1%) |
| Total (Overall) | 1,197 (48.6%) | 1,268 (51.4%) |
Natural Resources, Construction and Maintenance Occupations
The most common Natural Resources, Construction and Maintenance occupations in Bangor borough are Construction & Extraction (177 | 7.2%), Installation, Maintenance & Repair (89 | 3.6%), and Farming, Fishing & Forestry (1 | 0.0%).
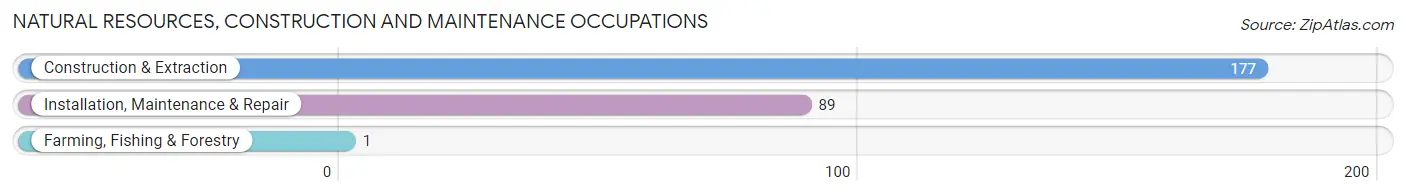
Natural Resources, Construction and Maintenance Occupations by Sex
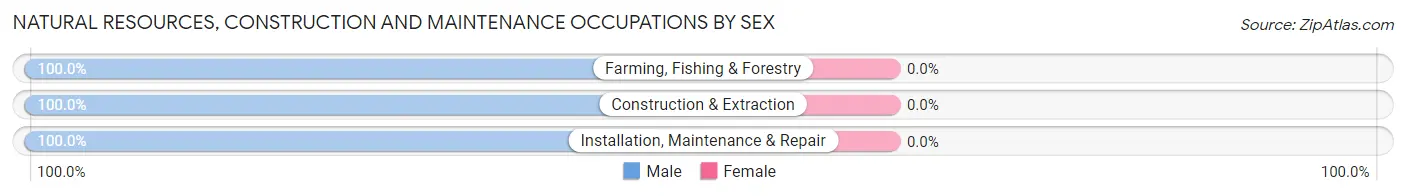
| Occupation | Male | Female |
| Farming, Fishing & Forestry | 1 (100.0%) | 0 (0.0%) |
| Construction & Extraction | 177 (100.0%) | 0 (0.0%) |
| Installation, Maintenance & Repair | 89 (100.0%) | 0 (0.0%) |
| Total (Category) | 267 (100.0%) | 0 (0.0%) |
| Total (Overall) | 1,197 (48.6%) | 1,268 (51.4%) |
Production, Transportation and Moving Occupations
The most common Production, Transportation and Moving occupations in Bangor borough are Production (205 | 8.3%), Material Moving (195 | 7.9%), and Transportation (105 | 4.3%).
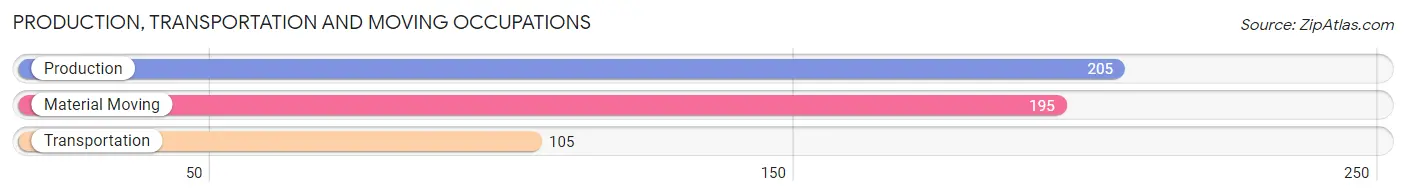
Production, Transportation and Moving Occupations by Sex
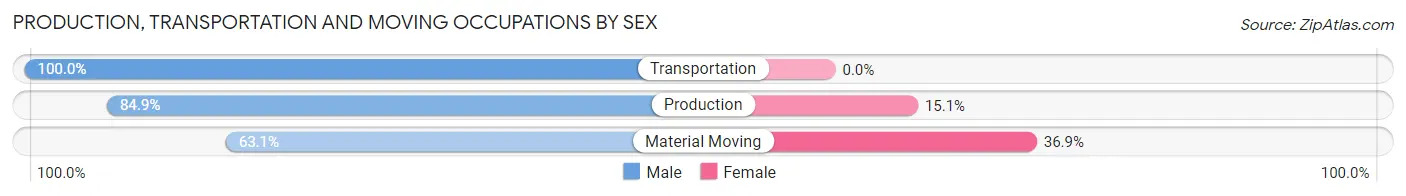
| Occupation | Male | Female |
| Production | 174 (84.9%) | 31 (15.1%) |
| Transportation | 105 (100.0%) | 0 (0.0%) |
| Material Moving | 123 (63.1%) | 72 (36.9%) |
| Total (Category) | 402 (79.6%) | 103 (20.4%) |
| Total (Overall) | 1,197 (48.6%) | 1,268 (51.4%) |
Employment Industries by Sex in Bangor borough
Employment Industries in Bangor borough
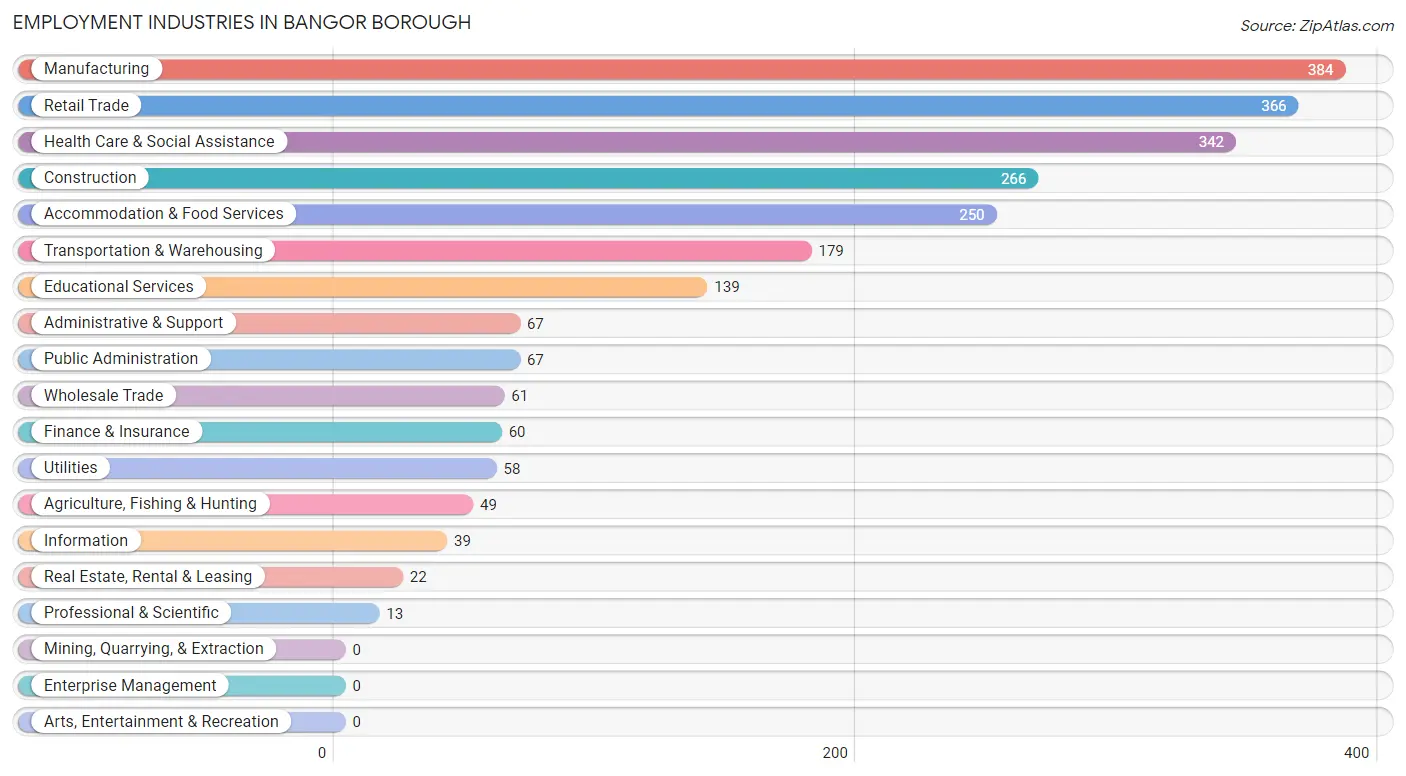
The major employment industries in Bangor borough include Manufacturing (384 | 15.6%), Retail Trade (366 | 14.8%), Health Care & Social Assistance (342 | 13.9%), Construction (266 | 10.8%), and Accommodation & Food Services (250 | 10.1%).
Employment Industries by Sex in Bangor borough
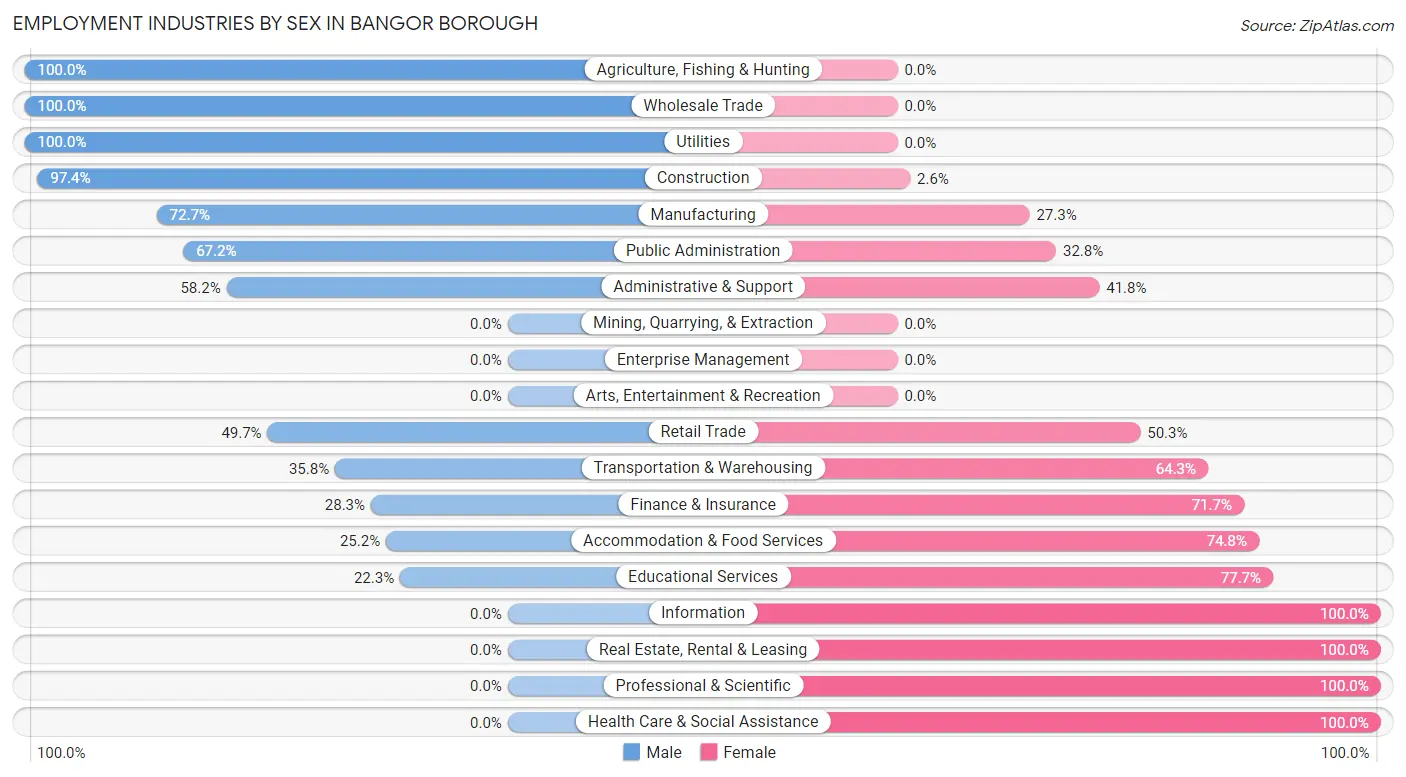
The Bangor borough industries that see more men than women are Agriculture, Fishing & Hunting (100.0%), Wholesale Trade (100.0%), and Utilities (100.0%), whereas the industries that tend to have a higher number of women are Information (100.0%), Real Estate, Rental & Leasing (100.0%), and Professional & Scientific (100.0%).
| Industry | Male | Female |
| Agriculture, Fishing & Hunting | 49 (100.0%) | 0 (0.0%) |
| Mining, Quarrying, & Extraction | 0 (0.0%) | 0 (0.0%) |
| Construction | 259 (97.4%) | 7 (2.6%) |
| Manufacturing | 279 (72.7%) | 105 (27.3%) |
| Wholesale Trade | 61 (100.0%) | 0 (0.0%) |
| Retail Trade | 182 (49.7%) | 184 (50.3%) |
| Transportation & Warehousing | 64 (35.7%) | 115 (64.2%) |
| Utilities | 58 (100.0%) | 0 (0.0%) |
| Information | 0 (0.0%) | 39 (100.0%) |
| Finance & Insurance | 17 (28.3%) | 43 (71.7%) |
| Real Estate, Rental & Leasing | 0 (0.0%) | 22 (100.0%) |
| Professional & Scientific | 0 (0.0%) | 13 (100.0%) |
| Enterprise Management | 0 (0.0%) | 0 (0.0%) |
| Administrative & Support | 39 (58.2%) | 28 (41.8%) |
| Educational Services | 31 (22.3%) | 108 (77.7%) |
| Health Care & Social Assistance | 0 (0.0%) | 342 (100.0%) |
| Arts, Entertainment & Recreation | 0 (0.0%) | 0 (0.0%) |
| Accommodation & Food Services | 63 (25.2%) | 187 (74.8%) |
| Public Administration | 45 (67.2%) | 22 (32.8%) |
| Total | 1,197 (48.6%) | 1,268 (51.4%) |
Education in Bangor borough
School Enrollment in Bangor borough
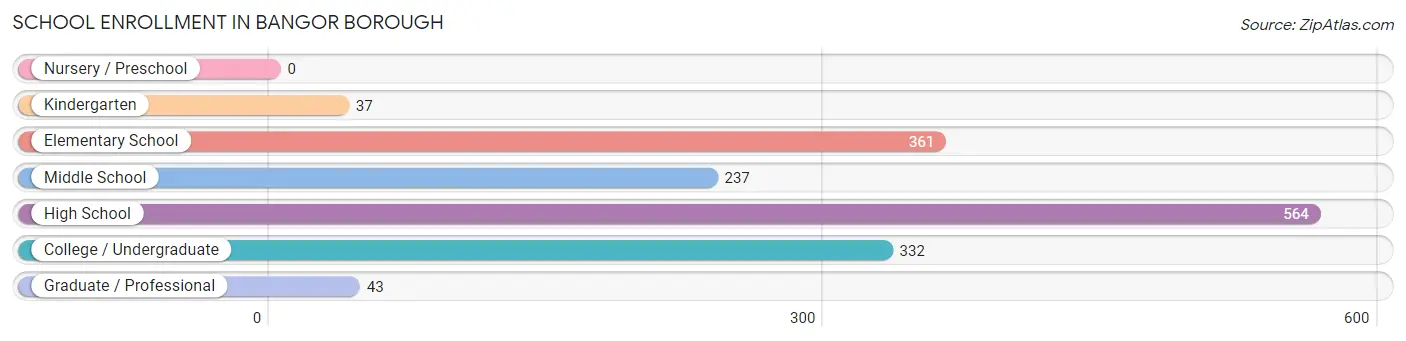
The most common levels of schooling among the 1,574 students in Bangor borough are high school (564 | 35.8%), elementary school (361 | 22.9%), and college / undergraduate (332 | 21.1%).
| School Level | # Students | % Students |
| Nursery / Preschool | 0 | 0.0% |
| Kindergarten | 37 | 2.4% |
| Elementary School | 361 | 22.9% |
| Middle School | 237 | 15.1% |
| High School | 564 | 35.8% |
| College / Undergraduate | 332 | 21.1% |
| Graduate / Professional | 43 | 2.7% |
| Total | 1,574 | 100.0% |
School Enrollment by Age by Funding Source in Bangor borough
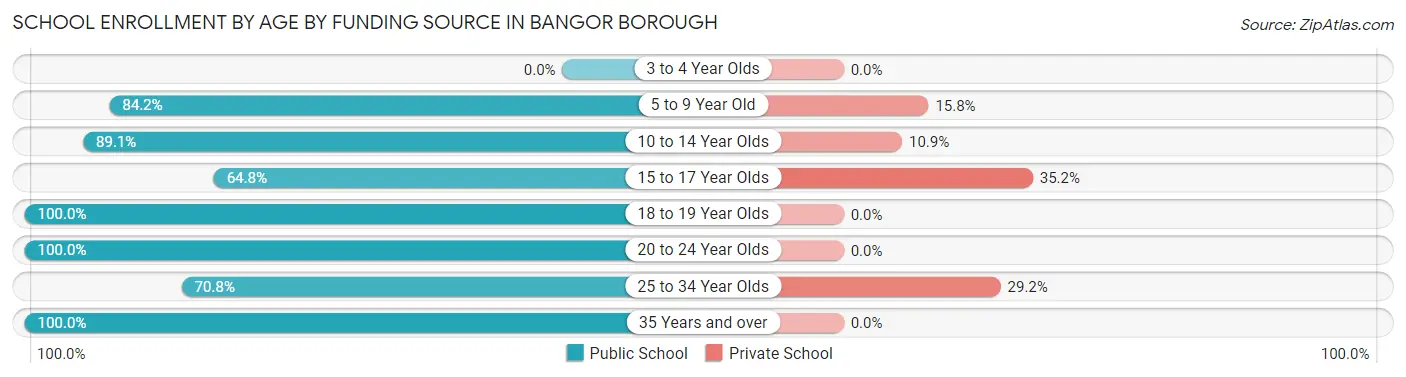
Out of a total of 1,574 students who are enrolled in schools in Bangor borough, 252 (16.0%) attend a private institution, while the remaining 1,322 (84.0%) are enrolled in public schools. The age group of 15 to 17 year olds has the highest likelihood of being enrolled in private schools, with 130 (35.2% in the age bracket) enrolled. Conversely, the age group of 18 to 19 year olds has the lowest likelihood of being enrolled in a private school, with 142 (100.0% in the age bracket) attending a public institution.
| Age Bracket | Public School | Private School |
| 3 to 4 Year Olds | 0 (0.0%) | 0 (0.0%) |
| 5 to 9 Year Old | 304 (84.2%) | 57 (15.8%) |
| 10 to 14 Year Olds | 377 (89.1%) | 46 (10.9%) |
| 15 to 17 Year Olds | 239 (64.8%) | 130 (35.2%) |
| 18 to 19 Year Olds | 142 (100.0%) | 0 (0.0%) |
| 20 to 24 Year Olds | 186 (100.0%) | 0 (0.0%) |
| 25 to 34 Year Olds | 46 (70.8%) | 19 (29.2%) |
| 35 Years and over | 28 (100.0%) | 0 (0.0%) |
| Total | 1,322 (84.0%) | 252 (16.0%) |
Educational Attainment by Field of Study in Bangor borough
Education (171 | 26.1%), business (104 | 15.9%), arts & humanities (82 | 12.5%), engineering (78 | 11.9%), and liberal arts & history (68 | 10.4%) are the most common fields of study among 655 individuals in Bangor borough who have obtained a bachelor's degree or higher.
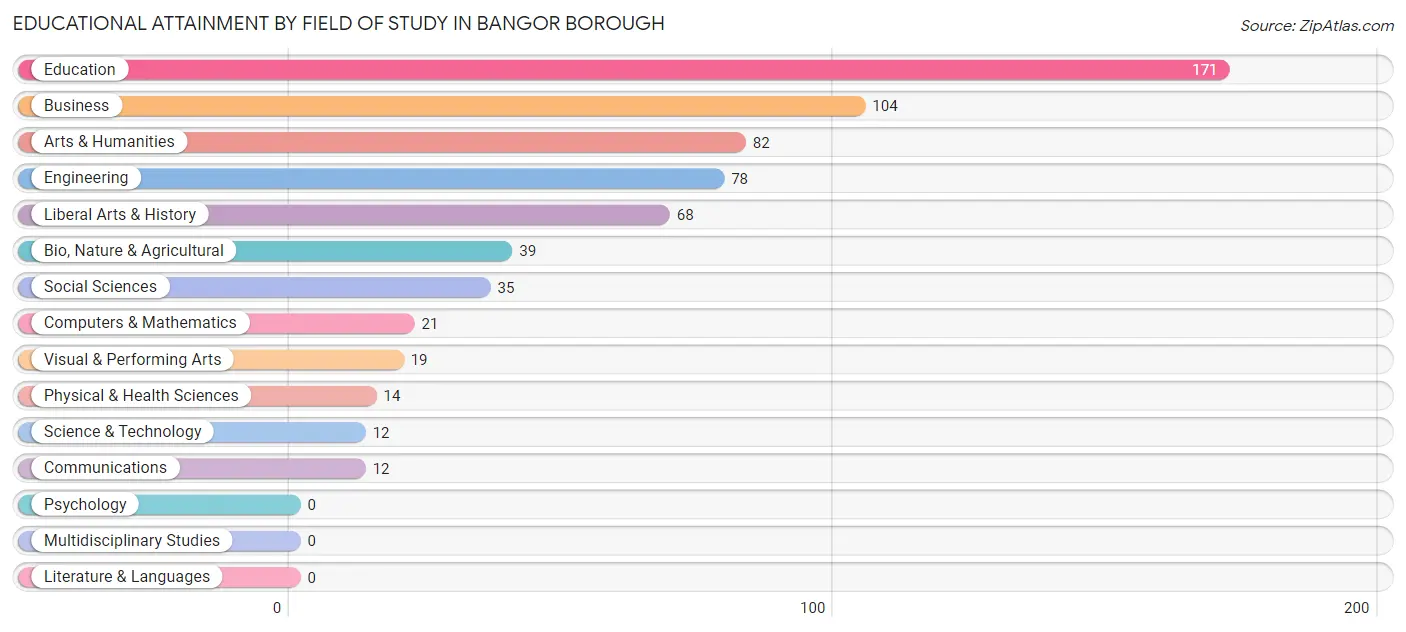
| Field of Study | # Graduates | % Graduates |
| Computers & Mathematics | 21 | 3.2% |
| Bio, Nature & Agricultural | 39 | 5.9% |
| Physical & Health Sciences | 14 | 2.1% |
| Psychology | 0 | 0.0% |
| Social Sciences | 35 | 5.3% |
| Engineering | 78 | 11.9% |
| Multidisciplinary Studies | 0 | 0.0% |
| Science & Technology | 12 | 1.8% |
| Business | 104 | 15.9% |
| Education | 171 | 26.1% |
| Literature & Languages | 0 | 0.0% |
| Liberal Arts & History | 68 | 10.4% |
| Visual & Performing Arts | 19 | 2.9% |
| Communications | 12 | 1.8% |
| Arts & Humanities | 82 | 12.5% |
| Total | 655 | 100.0% |
Transportation & Commute in Bangor borough
Vehicle Availability by Sex in Bangor borough
The most prevalent vehicle ownership categories in Bangor borough are males with 2 vehicles (471, accounting for 39.7%) and females with 2 vehicles (455, making up 38.3%).
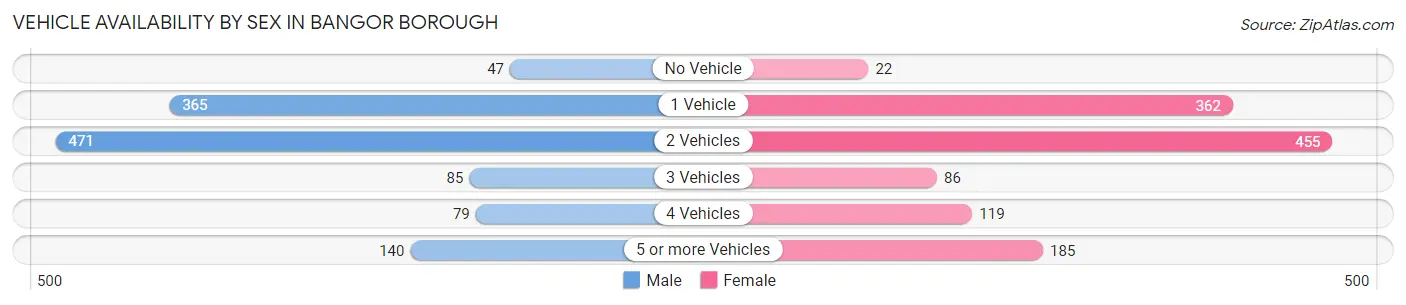
| Vehicles Available | Male | Female |
| No Vehicle | 47 (4.0%) | 22 (1.8%) |
| 1 Vehicle | 365 (30.7%) | 362 (29.4%) |
| 2 Vehicles | 471 (39.7%) | 455 (37.0%) |
| 3 Vehicles | 85 (7.2%) | 86 (7.0%) |
| 4 Vehicles | 79 (6.7%) | 119 (9.7%) |
| 5 or more Vehicles | 140 (11.8%) | 185 (15.0%) |
| Total | 1,187 (100.0%) | 1,229 (100.0%) |
Commute Time in Bangor borough
The most frequently occuring commute durations in Bangor borough are 10 to 14 minutes (365 commuters, 15.5%), 20 to 24 minutes (356 commuters, 15.1%), and 30 to 34 minutes (330 commuters, 14.0%).
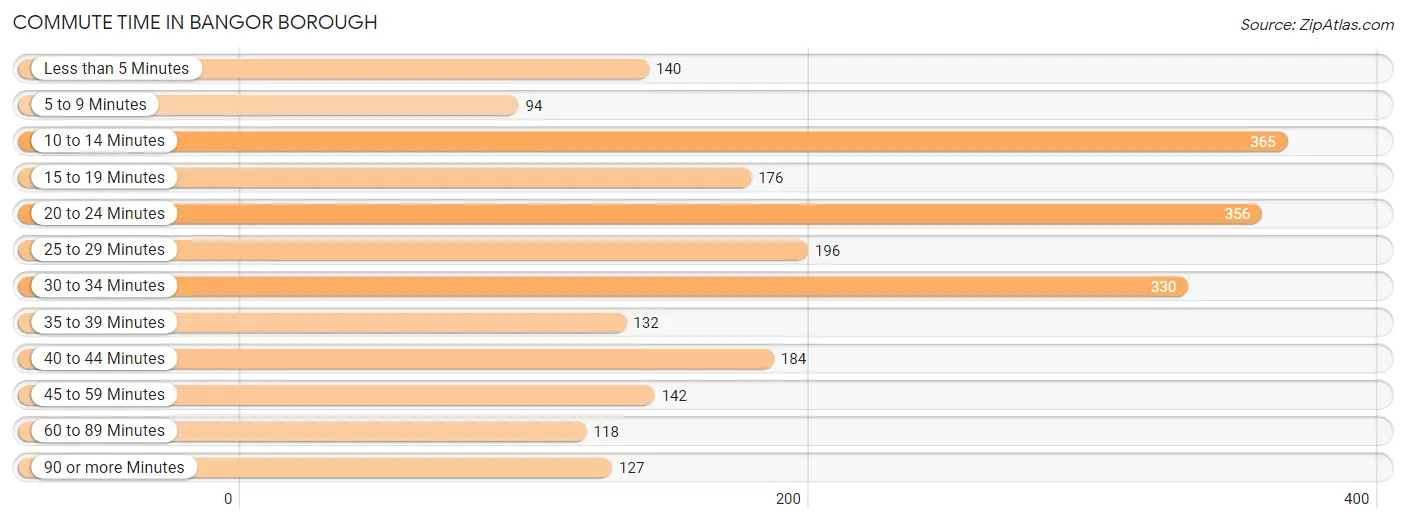
| Commute Time | # Commuters | % Commuters |
| Less than 5 Minutes | 140 | 5.9% |
| 5 to 9 Minutes | 94 | 4.0% |
| 10 to 14 Minutes | 365 | 15.5% |
| 15 to 19 Minutes | 176 | 7.5% |
| 20 to 24 Minutes | 356 | 15.1% |
| 25 to 29 Minutes | 196 | 8.3% |
| 30 to 34 Minutes | 330 | 14.0% |
| 35 to 39 Minutes | 132 | 5.6% |
| 40 to 44 Minutes | 184 | 7.8% |
| 45 to 59 Minutes | 142 | 6.0% |
| 60 to 89 Minutes | 118 | 5.0% |
| 90 or more Minutes | 127 | 5.4% |
Commute Time by Sex in Bangor borough
The most common commute times in Bangor borough are 20 to 24 minutes (159 commuters, 13.9%) for males and 10 to 14 minutes (295 commuters, 24.2%) for females.
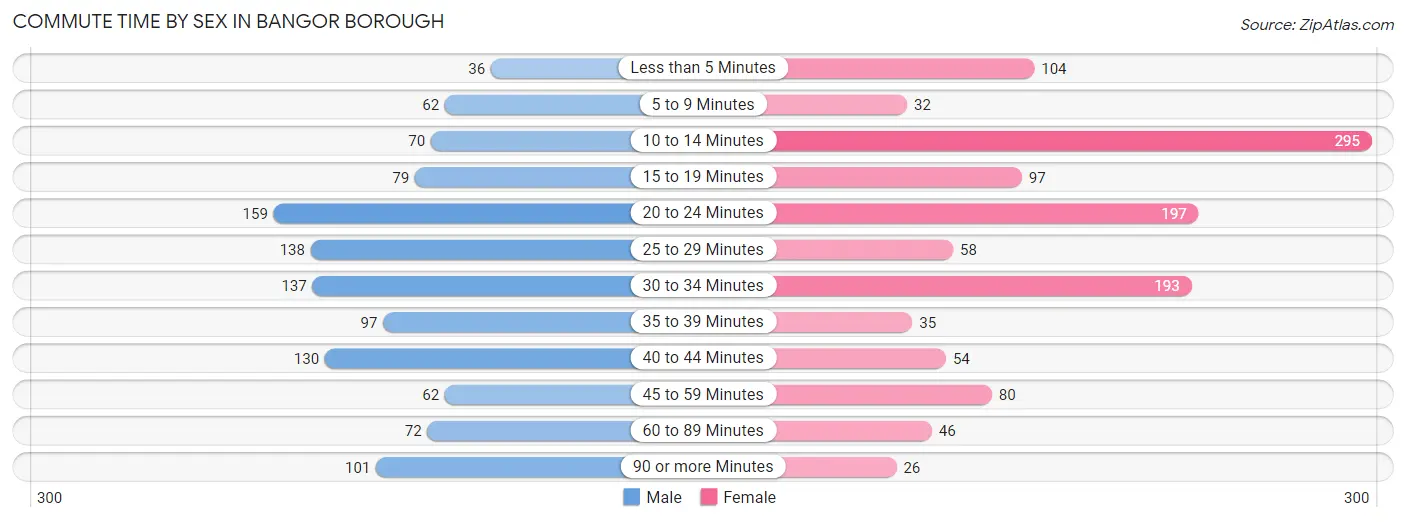
| Commute Time | Male | Female |
| Less than 5 Minutes | 36 (3.2%) | 104 (8.6%) |
| 5 to 9 Minutes | 62 (5.4%) | 32 (2.6%) |
| 10 to 14 Minutes | 70 (6.1%) | 295 (24.2%) |
| 15 to 19 Minutes | 79 (6.9%) | 97 (8.0%) |
| 20 to 24 Minutes | 159 (13.9%) | 197 (16.2%) |
| 25 to 29 Minutes | 138 (12.1%) | 58 (4.8%) |
| 30 to 34 Minutes | 137 (12.0%) | 193 (15.9%) |
| 35 to 39 Minutes | 97 (8.5%) | 35 (2.9%) |
| 40 to 44 Minutes | 130 (11.4%) | 54 (4.4%) |
| 45 to 59 Minutes | 62 (5.4%) | 80 (6.6%) |
| 60 to 89 Minutes | 72 (6.3%) | 46 (3.8%) |
| 90 or more Minutes | 101 (8.8%) | 26 (2.1%) |
Time of Departure to Work by Sex in Bangor borough
The most frequent times of departure to work in Bangor borough are 7:00 AM to 7:29 AM (242, 21.2%) for males and 8:00 AM to 8:29 AM (332, 27.3%) for females.
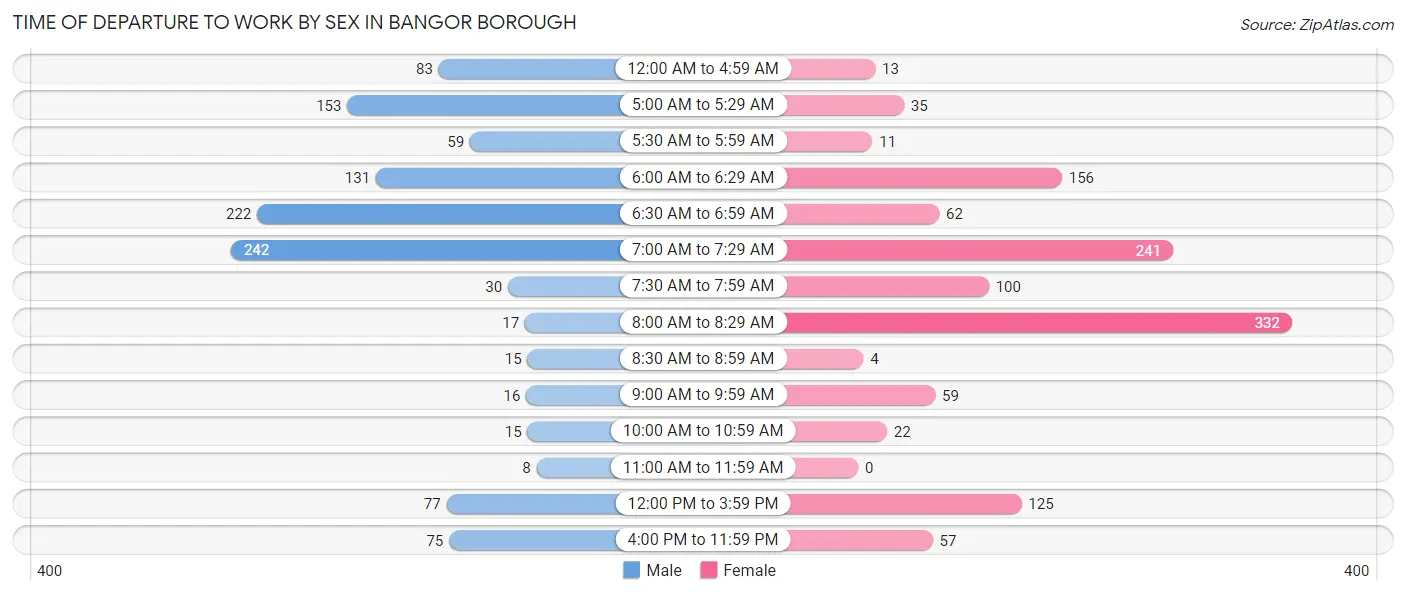
| Time of Departure | Male | Female |
| 12:00 AM to 4:59 AM | 83 (7.3%) | 13 (1.1%) |
| 5:00 AM to 5:29 AM | 153 (13.4%) | 35 (2.9%) |
| 5:30 AM to 5:59 AM | 59 (5.2%) | 11 (0.9%) |
| 6:00 AM to 6:29 AM | 131 (11.5%) | 156 (12.8%) |
| 6:30 AM to 6:59 AM | 222 (19.4%) | 62 (5.1%) |
| 7:00 AM to 7:29 AM | 242 (21.2%) | 241 (19.8%) |
| 7:30 AM to 7:59 AM | 30 (2.6%) | 100 (8.2%) |
| 8:00 AM to 8:29 AM | 17 (1.5%) | 332 (27.3%) |
| 8:30 AM to 8:59 AM | 15 (1.3%) | 4 (0.3%) |
| 9:00 AM to 9:59 AM | 16 (1.4%) | 59 (4.9%) |
| 10:00 AM to 10:59 AM | 15 (1.3%) | 22 (1.8%) |
| 11:00 AM to 11:59 AM | 8 (0.7%) | 0 (0.0%) |
| 12:00 PM to 3:59 PM | 77 (6.7%) | 125 (10.3%) |
| 4:00 PM to 11:59 PM | 75 (6.6%) | 57 (4.7%) |
| Total | 1,143 (100.0%) | 1,217 (100.0%) |
Housing Occupancy in Bangor borough
Occupancy by Ownership in Bangor borough
Of the total 1,981 dwellings in Bangor borough, owner-occupied units account for 1,234 (62.3%), while renter-occupied units make up 747 (37.7%).
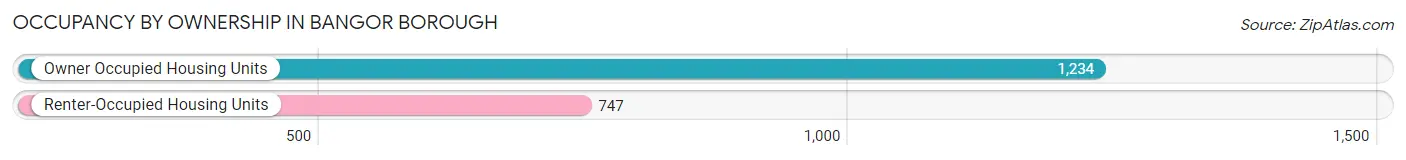
| Occupancy | # Housing Units | % Housing Units |
| Owner Occupied Housing Units | 1,234 | 62.3% |
| Renter-Occupied Housing Units | 747 | 37.7% |
| Total Occupied Housing Units | 1,981 | 100.0% |
Occupancy by Household Size in Bangor borough
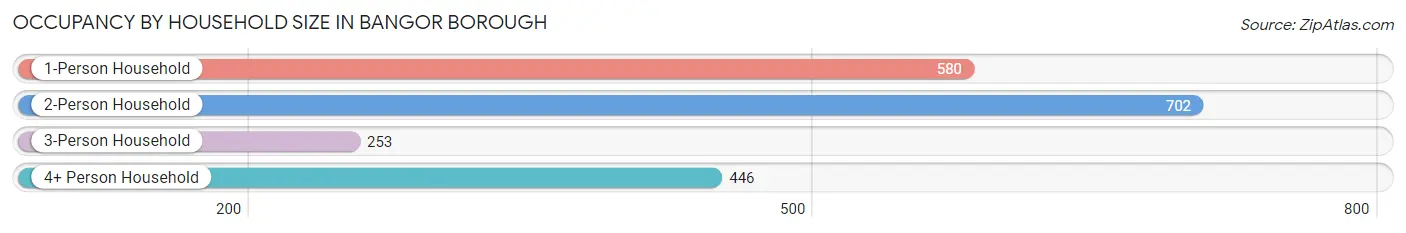
| Household Size | # Housing Units | % Housing Units |
| 1-Person Household | 580 | 29.3% |
| 2-Person Household | 702 | 35.4% |
| 3-Person Household | 253 | 12.8% |
| 4+ Person Household | 446 | 22.5% |
| Total Housing Units | 1,981 | 100.0% |
Occupancy by Ownership by Household Size in Bangor borough
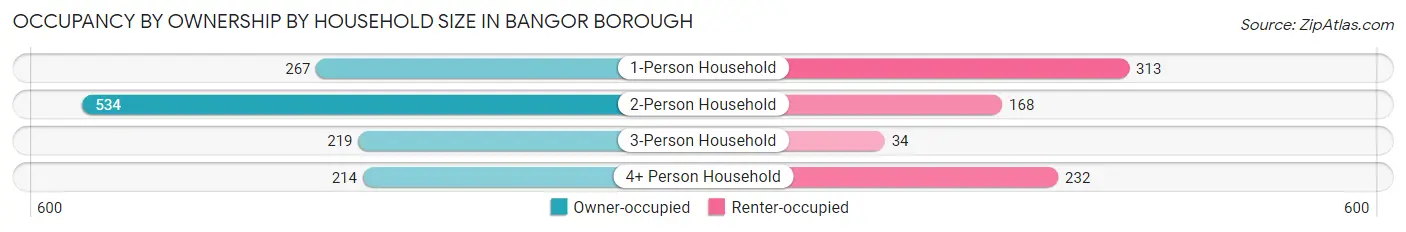
| Household Size | Owner-occupied | Renter-occupied |
| 1-Person Household | 267 (46.0%) | 313 (54.0%) |
| 2-Person Household | 534 (76.1%) | 168 (23.9%) |
| 3-Person Household | 219 (86.6%) | 34 (13.4%) |
| 4+ Person Household | 214 (48.0%) | 232 (52.0%) |
| Total Housing Units | 1,234 (62.3%) | 747 (37.7%) |
Occupancy by Educational Attainment in Bangor borough
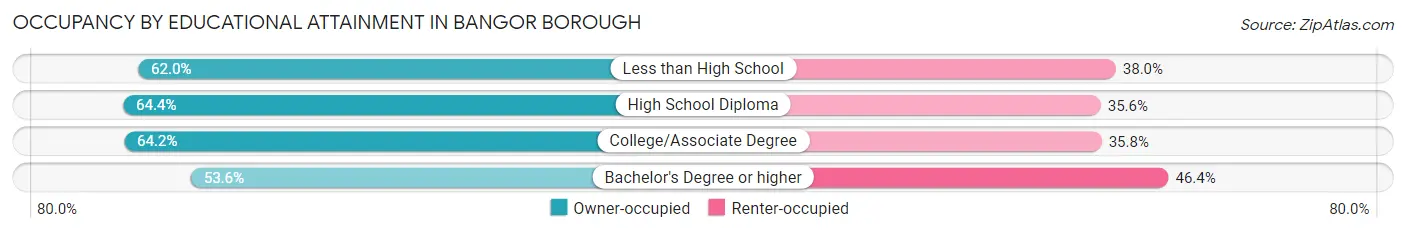
| Household Size | Owner-occupied | Renter-occupied |
| Less than High School | 163 (62.0%) | 100 (38.0%) |
| High School Diploma | 542 (64.4%) | 300 (35.6%) |
| College/Associate Degree | 359 (64.2%) | 200 (35.8%) |
| Bachelor's Degree or higher | 170 (53.6%) | 147 (46.4%) |
Occupancy by Age of Householder in Bangor borough
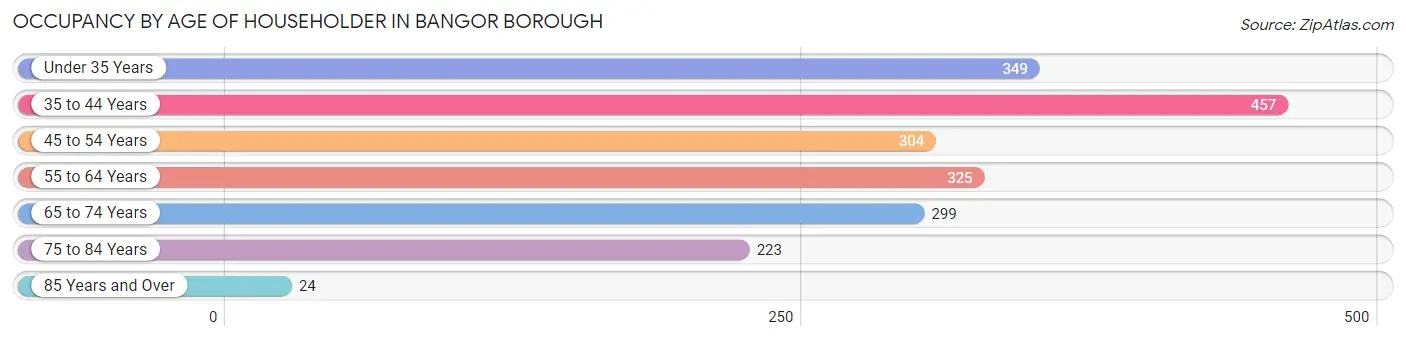
| Age Bracket | # Households | % Households |
| Under 35 Years | 349 | 17.6% |
| 35 to 44 Years | 457 | 23.1% |
| 45 to 54 Years | 304 | 15.3% |
| 55 to 64 Years | 325 | 16.4% |
| 65 to 74 Years | 299 | 15.1% |
| 75 to 84 Years | 223 | 11.3% |
| 85 Years and Over | 24 | 1.2% |
| Total | 1,981 | 100.0% |
Housing Finances in Bangor borough
Median Income by Occupancy in Bangor borough
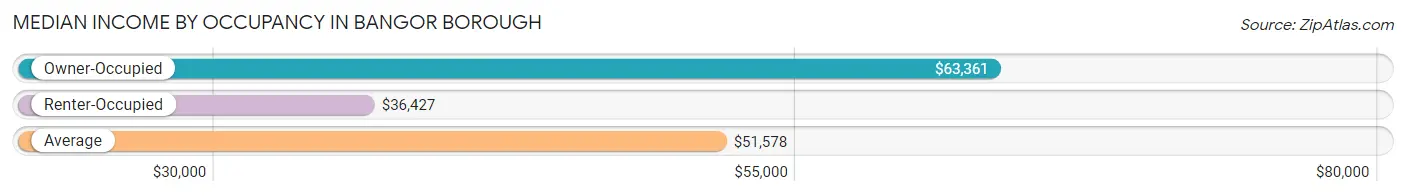
| Occupancy Type | # Households | Median Income |
| Owner-Occupied | 1,234 (62.3%) | $63,361 |
| Renter-Occupied | 747 (37.7%) | $36,427 |
| Average | 1,981 (100.0%) | $51,578 |
Occupancy by Householder Income Bracket in Bangor borough
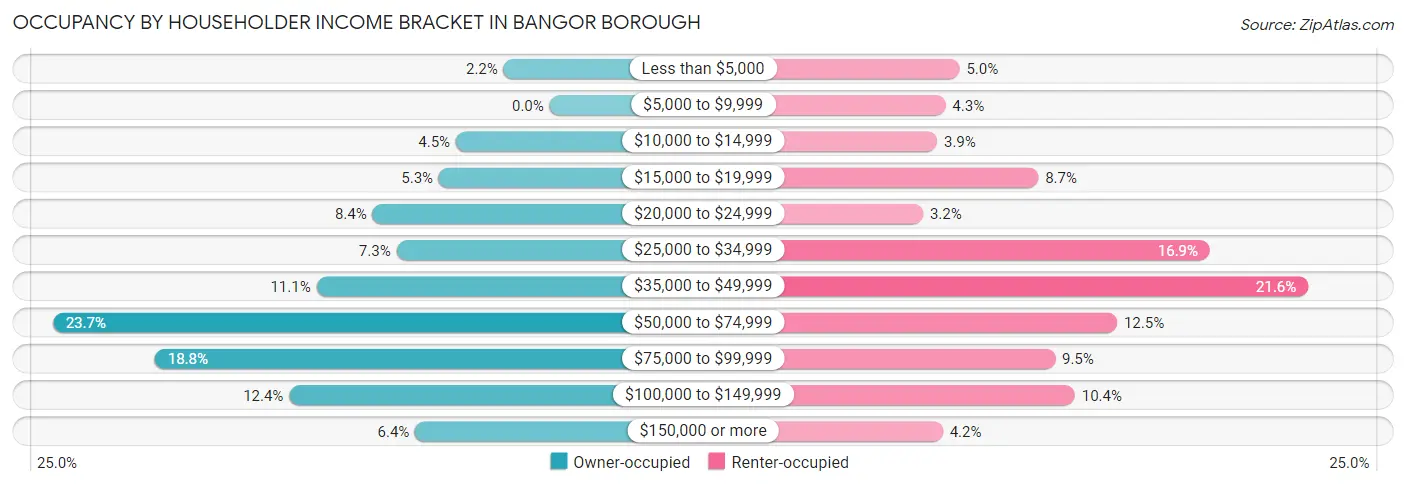
| Income Bracket | Owner-occupied | Renter-occupied |
| Less than $5,000 | 27 (2.2%) | 37 (5.0%) |
| $5,000 to $9,999 | 0 (0.0%) | 32 (4.3%) |
| $10,000 to $14,999 | 55 (4.5%) | 29 (3.9%) |
| $15,000 to $19,999 | 65 (5.3%) | 65 (8.7%) |
| $20,000 to $24,999 | 104 (8.4%) | 24 (3.2%) |
| $25,000 to $34,999 | 90 (7.3%) | 126 (16.9%) |
| $35,000 to $49,999 | 137 (11.1%) | 161 (21.5%) |
| $50,000 to $74,999 | 292 (23.7%) | 93 (12.4%) |
| $75,000 to $99,999 | 232 (18.8%) | 71 (9.5%) |
| $100,000 to $149,999 | 153 (12.4%) | 78 (10.4%) |
| $150,000 or more | 79 (6.4%) | 31 (4.2%) |
| Total | 1,234 (100.0%) | 747 (100.0%) |
Monthly Housing Cost Tiers in Bangor borough
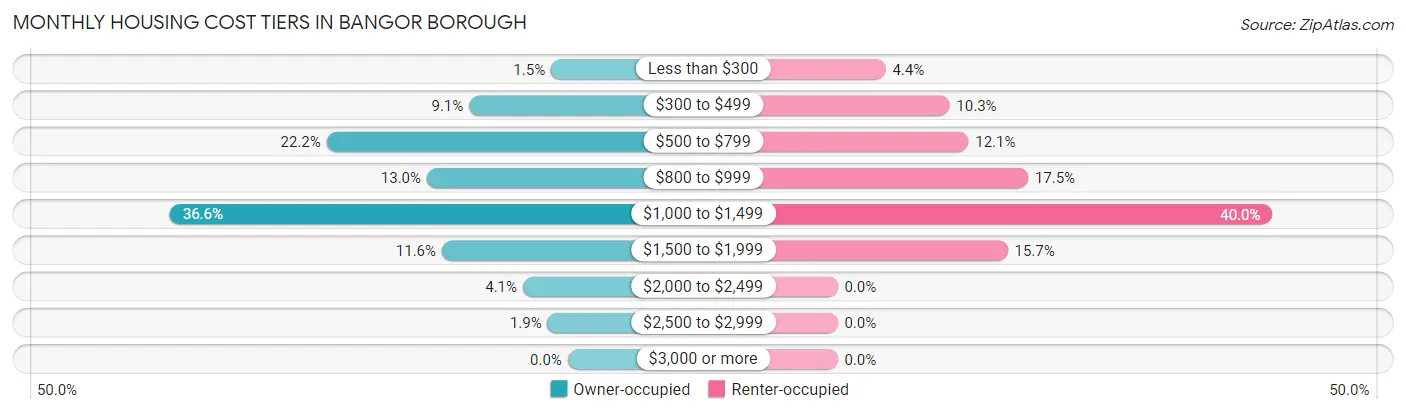
| Monthly Cost | Owner-occupied | Renter-occupied |
| Less than $300 | 19 (1.5%) | 33 (4.4%) |
| $300 to $499 | 112 (9.1%) | 77 (10.3%) |
| $500 to $799 | 274 (22.2%) | 90 (12.0%) |
| $800 to $999 | 160 (13.0%) | 131 (17.5%) |
| $1,000 to $1,499 | 452 (36.6%) | 299 (40.0%) |
| $1,500 to $1,999 | 143 (11.6%) | 117 (15.7%) |
| $2,000 to $2,499 | 51 (4.1%) | 0 (0.0%) |
| $2,500 to $2,999 | 23 (1.9%) | 0 (0.0%) |
| $3,000 or more | 0 (0.0%) | 0 (0.0%) |
| Total | 1,234 (100.0%) | 747 (100.0%) |
Physical Housing Characteristics in Bangor borough
Housing Structures in Bangor borough
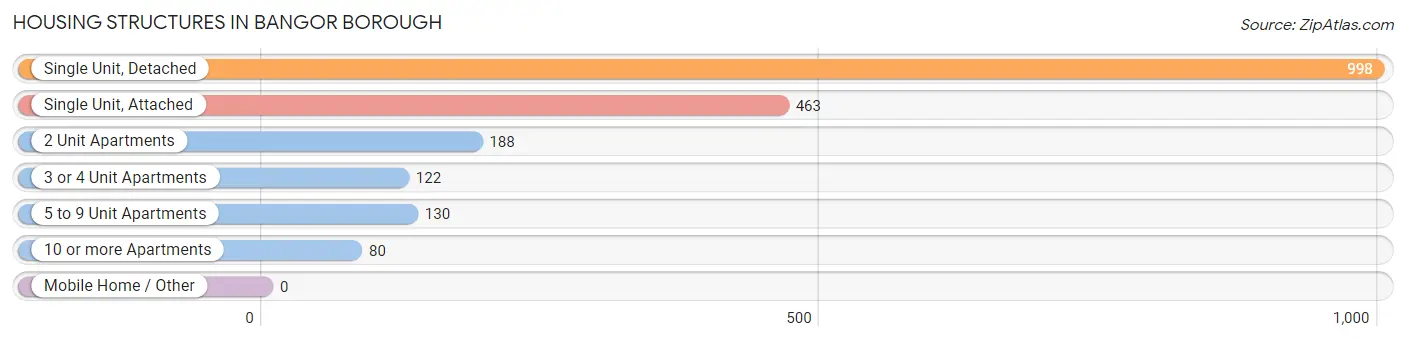
| Structure Type | # Housing Units | % Housing Units |
| Single Unit, Detached | 998 | 50.4% |
| Single Unit, Attached | 463 | 23.4% |
| 2 Unit Apartments | 188 | 9.5% |
| 3 or 4 Unit Apartments | 122 | 6.2% |
| 5 to 9 Unit Apartments | 130 | 6.6% |
| 10 or more Apartments | 80 | 4.0% |
| Mobile Home / Other | 0 | 0.0% |
| Total | 1,981 | 100.0% |
Housing Structures by Occupancy in Bangor borough
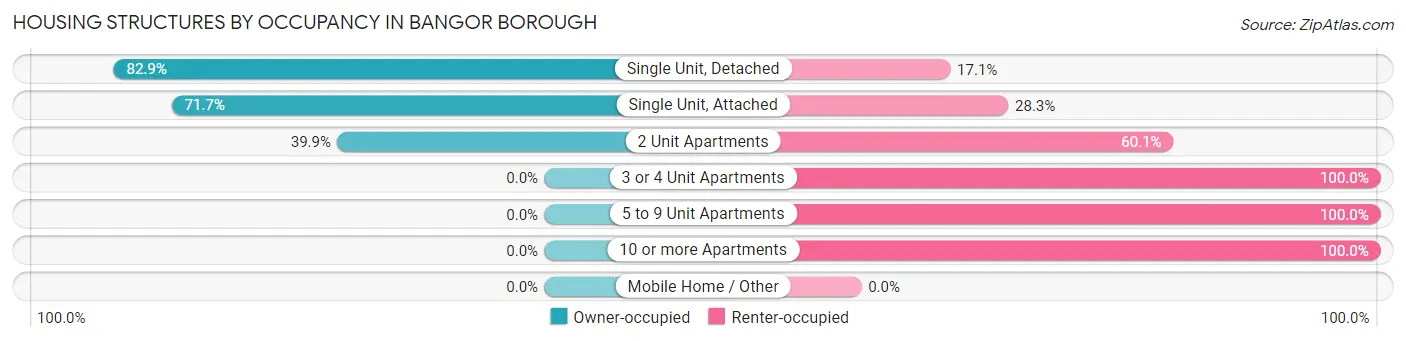
| Structure Type | Owner-occupied | Renter-occupied |
| Single Unit, Detached | 827 (82.9%) | 171 (17.1%) |
| Single Unit, Attached | 332 (71.7%) | 131 (28.3%) |
| 2 Unit Apartments | 75 (39.9%) | 113 (60.1%) |
| 3 or 4 Unit Apartments | 0 (0.0%) | 122 (100.0%) |
| 5 to 9 Unit Apartments | 0 (0.0%) | 130 (100.0%) |
| 10 or more Apartments | 0 (0.0%) | 80 (100.0%) |
| Mobile Home / Other | 0 (0.0%) | 0 (0.0%) |
| Total | 1,234 (62.3%) | 747 (37.7%) |
Housing Structures by Number of Rooms in Bangor borough
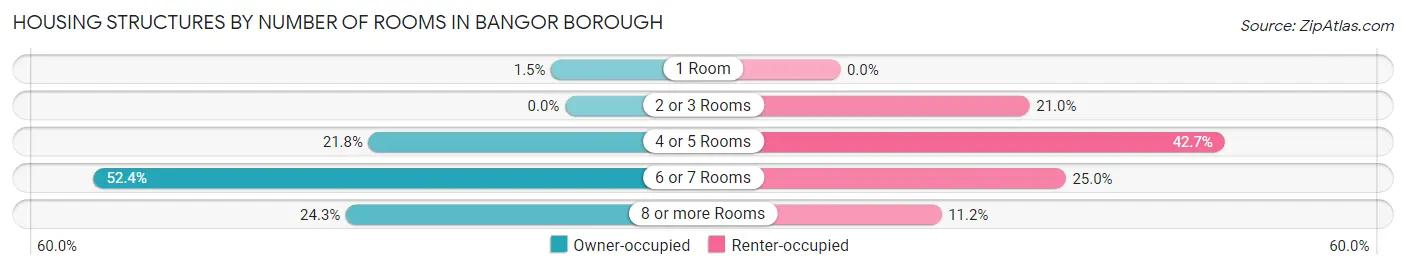
| Number of Rooms | Owner-occupied | Renter-occupied |
| 1 Room | 19 (1.5%) | 0 (0.0%) |
| 2 or 3 Rooms | 0 (0.0%) | 157 (21.0%) |
| 4 or 5 Rooms | 269 (21.8%) | 319 (42.7%) |
| 6 or 7 Rooms | 646 (52.3%) | 187 (25.0%) |
| 8 or more Rooms | 300 (24.3%) | 84 (11.2%) |
| Total | 1,234 (100.0%) | 747 (100.0%) |
Housing Structure by Heating Type in Bangor borough
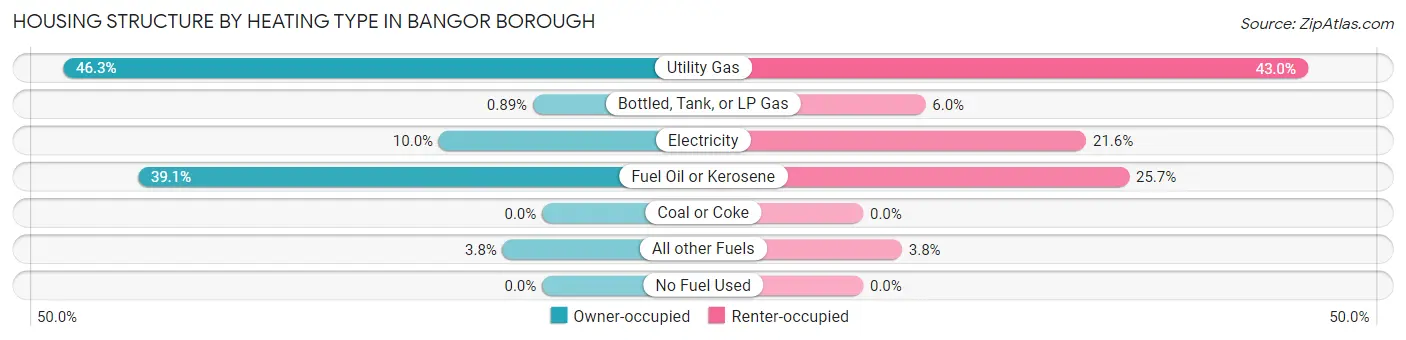
| Heating Type | Owner-occupied | Renter-occupied |
| Utility Gas | 571 (46.3%) | 321 (43.0%) |
| Bottled, Tank, or LP Gas | 11 (0.9%) | 45 (6.0%) |
| Electricity | 123 (10.0%) | 161 (21.5%) |
| Fuel Oil or Kerosene | 482 (39.1%) | 192 (25.7%) |
| Coal or Coke | 0 (0.0%) | 0 (0.0%) |
| All other Fuels | 47 (3.8%) | 28 (3.7%) |
| No Fuel Used | 0 (0.0%) | 0 (0.0%) |
| Total | 1,234 (100.0%) | 747 (100.0%) |
Household Vehicle Usage in Bangor borough
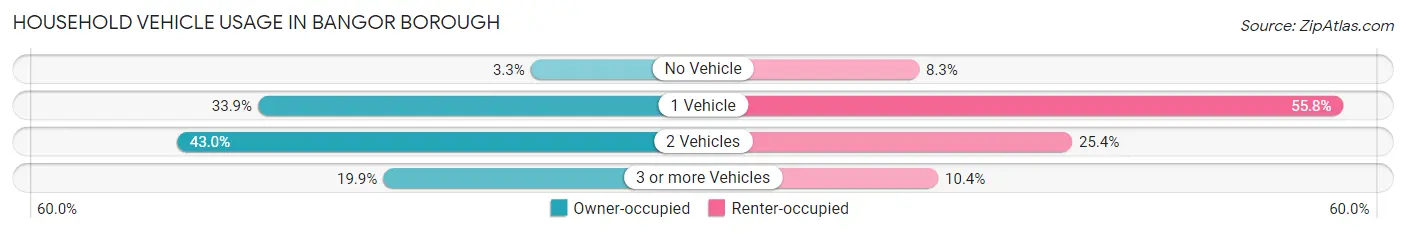
| Vehicles per Household | Owner-occupied | Renter-occupied |
| No Vehicle | 41 (3.3%) | 62 (8.3%) |
| 1 Vehicle | 418 (33.9%) | 417 (55.8%) |
| 2 Vehicles | 530 (42.9%) | 190 (25.4%) |
| 3 or more Vehicles | 245 (19.9%) | 78 (10.4%) |
| Total | 1,234 (100.0%) | 747 (100.0%) |
Real Estate & Mortgages in Bangor borough
Real Estate and Mortgage Overview in Bangor borough
| Characteristic | Without Mortgage | With Mortgage |
| Housing Units | 434 | 800 |
| Median Property Value | $193,300 | $151,600 |
| Median Household Income | $56,364 | $57 |
| Monthly Housing Costs | $643 | $0 |
| Real Estate Taxes | $3,267 | $61 |
Property Value by Mortgage Status in Bangor borough
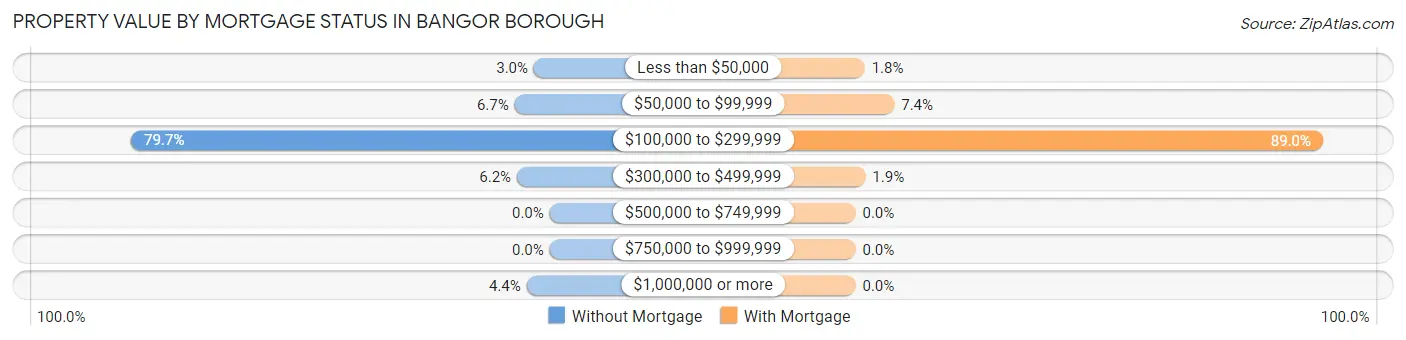
| Property Value | Without Mortgage | With Mortgage |
| Less than $50,000 | 13 (3.0%) | 14 (1.8%) |
| $50,000 to $99,999 | 29 (6.7%) | 59 (7.4%) |
| $100,000 to $299,999 | 346 (79.7%) | 712 (89.0%) |
| $300,000 to $499,999 | 27 (6.2%) | 15 (1.9%) |
| $500,000 to $749,999 | 0 (0.0%) | 0 (0.0%) |
| $750,000 to $999,999 | 0 (0.0%) | 0 (0.0%) |
| $1,000,000 or more | 19 (4.4%) | 0 (0.0%) |
| Total | 434 (100.0%) | 800 (100.0%) |
Household Income by Mortgage Status in Bangor borough
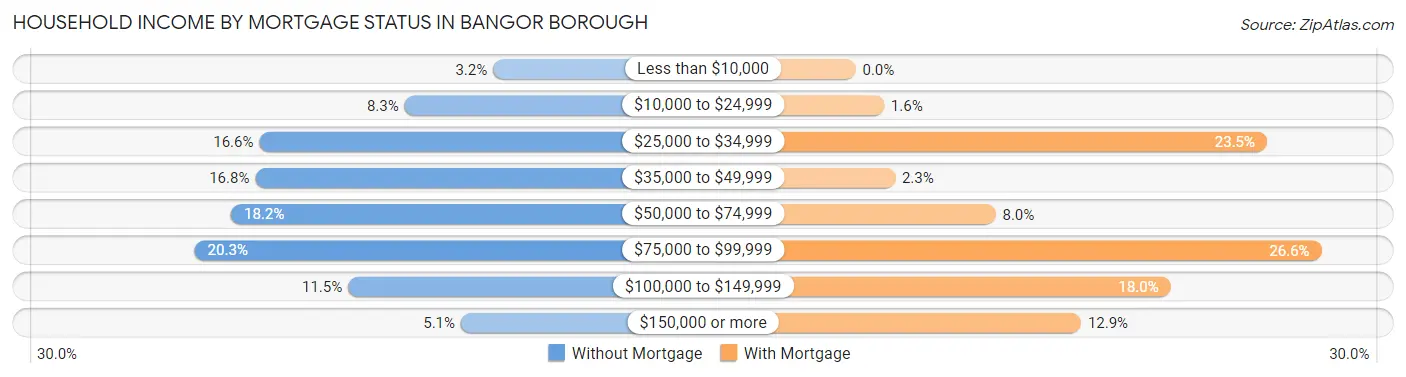
| Household Income | Without Mortgage | With Mortgage |
| Less than $10,000 | 14 (3.2%) | 0 (0.0%) |
| $10,000 to $24,999 | 36 (8.3%) | 13 (1.6%) |
| $25,000 to $34,999 | 72 (16.6%) | 188 (23.5%) |
| $35,000 to $49,999 | 73 (16.8%) | 18 (2.2%) |
| $50,000 to $74,999 | 79 (18.2%) | 64 (8.0%) |
| $75,000 to $99,999 | 88 (20.3%) | 213 (26.6%) |
| $100,000 to $149,999 | 50 (11.5%) | 144 (18.0%) |
| $150,000 or more | 22 (5.1%) | 103 (12.9%) |
| Total | 434 (100.0%) | 800 (100.0%) |
Property Value to Household Income Ratio in Bangor borough
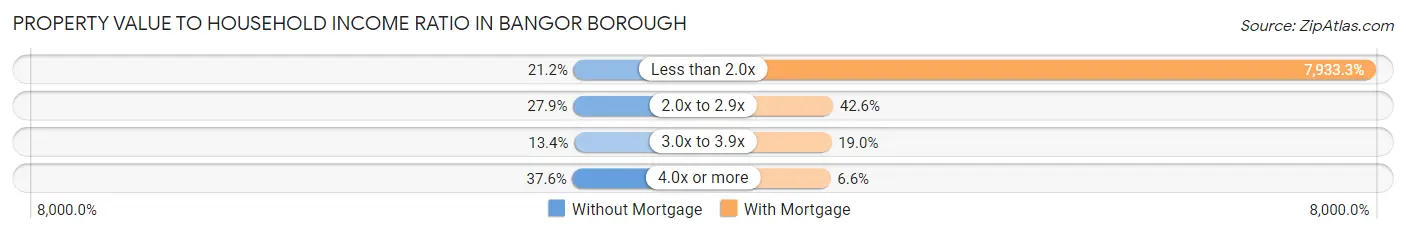
| Value-to-Income Ratio | Without Mortgage | With Mortgage |
| Less than 2.0x | 92 (21.2%) | 63,466 (7,933.2%) |
| 2.0x to 2.9x | 121 (27.9%) | 341 (42.6%) |
| 3.0x to 3.9x | 58 (13.4%) | 152 (19.0%) |
| 4.0x or more | 163 (37.6%) | 53 (6.6%) |
| Total | 434 (100.0%) | 800 (100.0%) |
Real Estate Taxes by Mortgage Status in Bangor borough
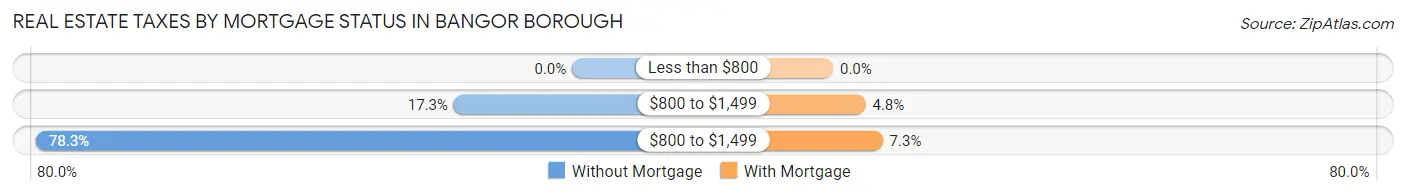
| Property Taxes | Without Mortgage | With Mortgage |
| Less than $800 | 0 (0.0%) | 0 (0.0%) |
| $800 to $1,499 | 75 (17.3%) | 38 (4.8%) |
| $800 to $1,499 | 340 (78.3%) | 58 (7.2%) |
| Total | 434 (100.0%) | 800 (100.0%) |
Health & Disability in Bangor borough
Health Insurance Coverage by Age in Bangor borough
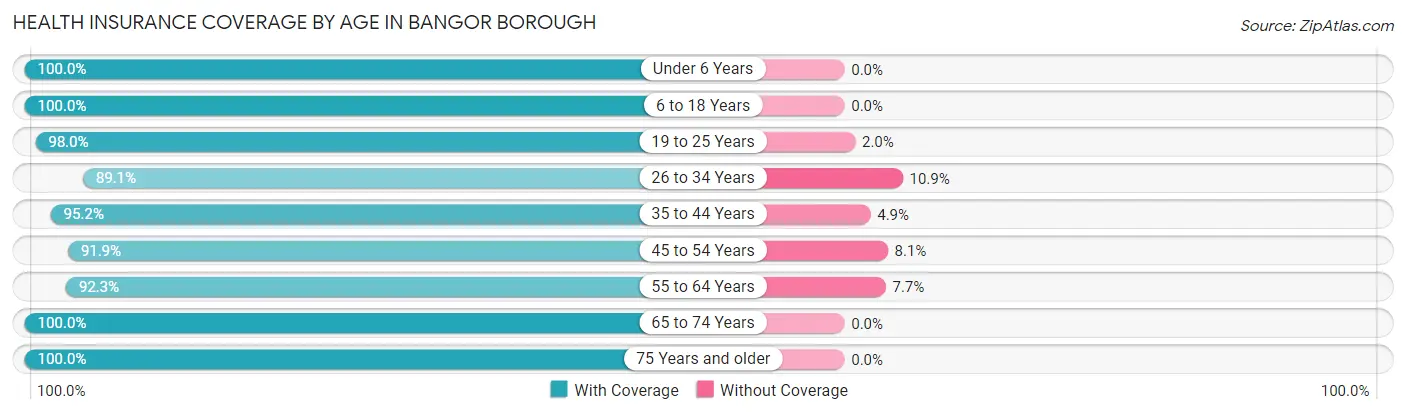
| Age Bracket | With Coverage | Without Coverage |
| Under 6 Years | 251 (100.0%) | 0 (0.0%) |
| 6 to 18 Years | 1,243 (100.0%) | 0 (0.0%) |
| 19 to 25 Years | 589 (98.0%) | 12 (2.0%) |
| 26 to 34 Years | 402 (89.1%) | 49 (10.9%) |
| 35 to 44 Years | 765 (95.2%) | 39 (4.9%) |
| 45 to 54 Years | 524 (91.9%) | 46 (8.1%) |
| 55 to 64 Years | 492 (92.3%) | 41 (7.7%) |
| 65 to 74 Years | 424 (100.0%) | 0 (0.0%) |
| 75 Years and older | 281 (100.0%) | 0 (0.0%) |
| Total | 4,971 (96.4%) | 187 (3.6%) |
Health Insurance Coverage by Citizenship Status in Bangor borough
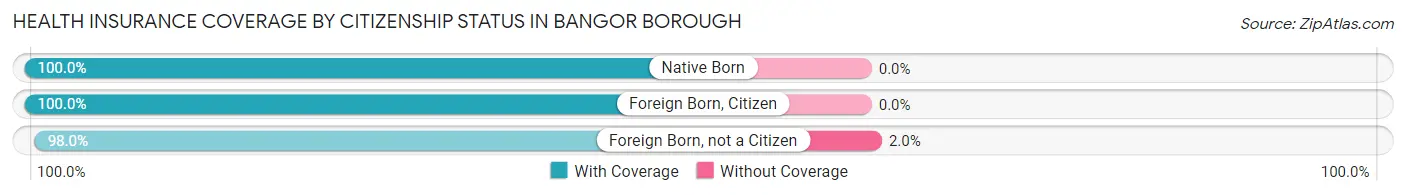
| Citizenship Status | With Coverage | Without Coverage |
| Native Born | 251 (100.0%) | 0 (0.0%) |
| Foreign Born, Citizen | 1,243 (100.0%) | 0 (0.0%) |
| Foreign Born, not a Citizen | 589 (98.0%) | 12 (2.0%) |
Health Insurance Coverage by Household Income in Bangor borough
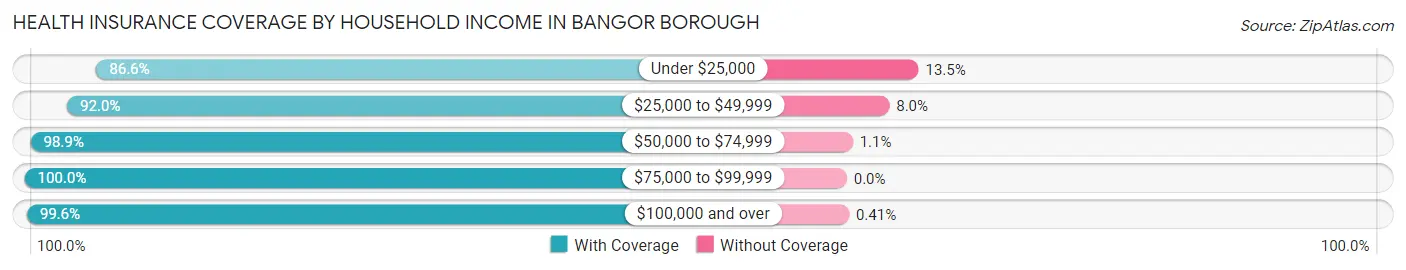
| Household Income | With Coverage | Without Coverage |
| Under $25,000 | 547 (86.6%) | 85 (13.5%) |
| $25,000 to $49,999 | 913 (92.0%) | 79 (8.0%) |
| $50,000 to $74,999 | 1,511 (98.9%) | 17 (1.1%) |
| $75,000 to $99,999 | 774 (100.0%) | 0 (0.0%) |
| $100,000 and over | 1,223 (99.6%) | 5 (0.4%) |
Public vs Private Health Insurance Coverage by Age in Bangor borough
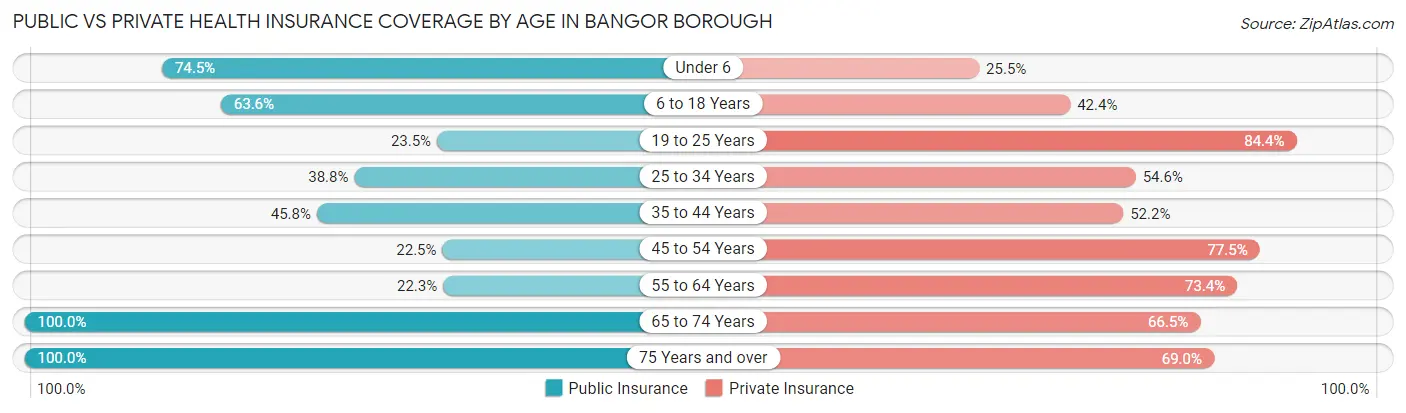
| Age Bracket | Public Insurance | Private Insurance |
| Under 6 | 187 (74.5%) | 64 (25.5%) |
| 6 to 18 Years | 790 (63.6%) | 527 (42.4%) |
| 19 to 25 Years | 141 (23.5%) | 507 (84.4%) |
| 25 to 34 Years | 175 (38.8%) | 246 (54.5%) |
| 35 to 44 Years | 368 (45.8%) | 420 (52.2%) |
| 45 to 54 Years | 128 (22.5%) | 442 (77.5%) |
| 55 to 64 Years | 119 (22.3%) | 391 (73.4%) |
| 65 to 74 Years | 424 (100.0%) | 282 (66.5%) |
| 75 Years and over | 281 (100.0%) | 194 (69.0%) |
| Total | 2,613 (50.7%) | 3,073 (59.6%) |
Disability Status by Sex by Age in Bangor borough
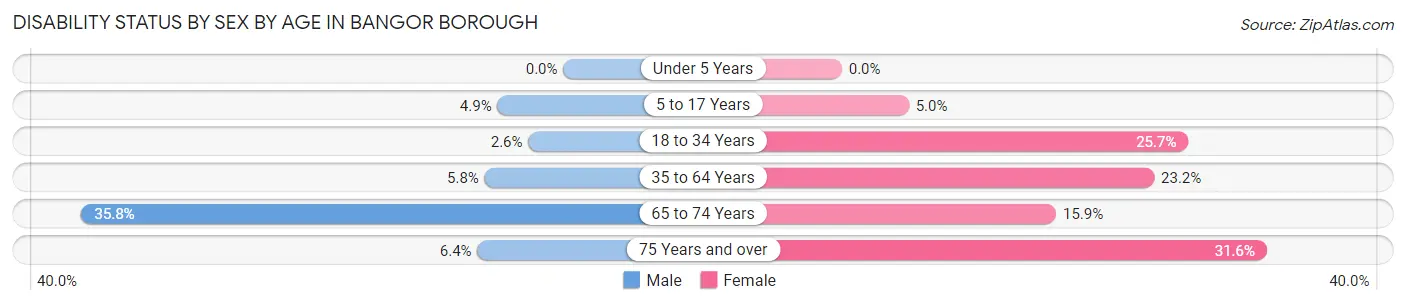
| Age Bracket | Male | Female |
| Under 5 Years | 0 (0.0%) | 0 (0.0%) |
| 5 to 17 Years | 18 (4.9%) | 39 (5.0%) |
| 18 to 34 Years | 13 (2.6%) | 169 (25.7%) |
| 35 to 64 Years | 55 (5.8%) | 224 (23.2%) |
| 65 to 74 Years | 73 (35.8%) | 35 (15.9%) |
| 75 Years and over | 6 (6.4%) | 59 (31.6%) |
Disability Class by Sex by Age in Bangor borough
Disability Class: Hearing Difficulty
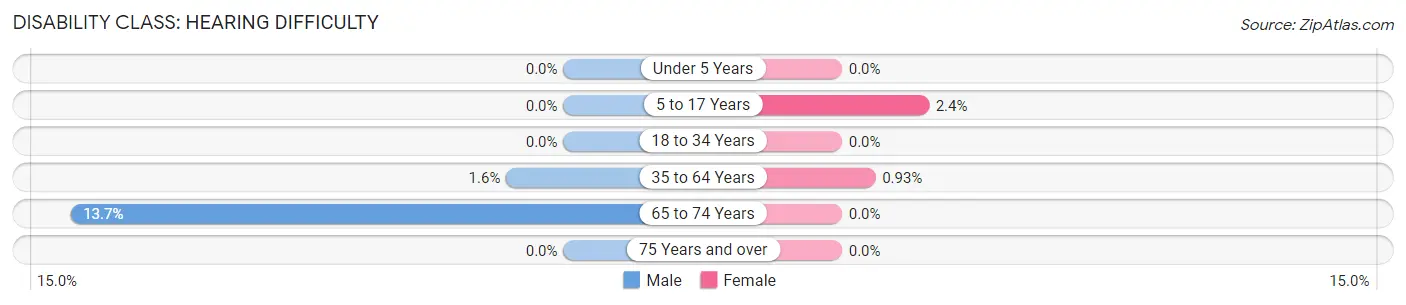
| Age Bracket | Male | Female |
| Under 5 Years | 0 (0.0%) | 0 (0.0%) |
| 5 to 17 Years | 0 (0.0%) | 19 (2.4%) |
| 18 to 34 Years | 0 (0.0%) | 0 (0.0%) |
| 35 to 64 Years | 15 (1.6%) | 9 (0.9%) |
| 65 to 74 Years | 28 (13.7%) | 0 (0.0%) |
| 75 Years and over | 0 (0.0%) | 0 (0.0%) |
Disability Class: Vision Difficulty
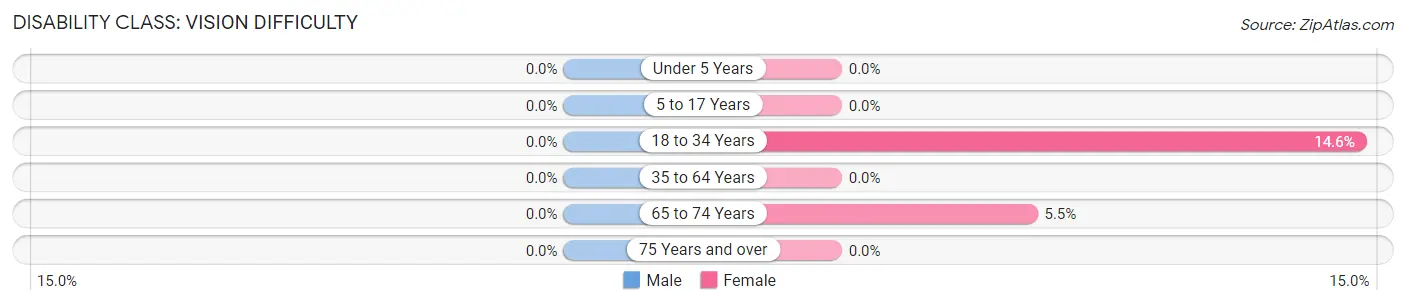
| Age Bracket | Male | Female |
| Under 5 Years | 0 (0.0%) | 0 (0.0%) |
| 5 to 17 Years | 0 (0.0%) | 0 (0.0%) |
| 18 to 34 Years | 0 (0.0%) | 96 (14.6%) |
| 35 to 64 Years | 0 (0.0%) | 0 (0.0%) |
| 65 to 74 Years | 0 (0.0%) | 12 (5.4%) |
| 75 Years and over | 0 (0.0%) | 0 (0.0%) |
Disability Class: Cognitive Difficulty
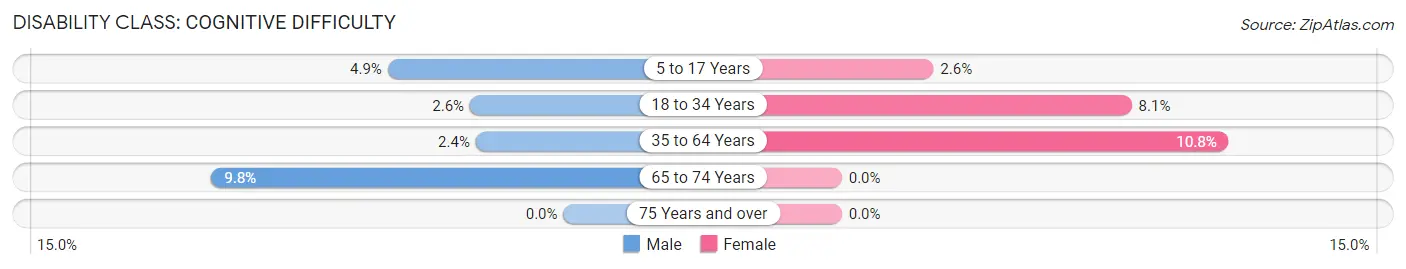
| Age Bracket | Male | Female |
| 5 to 17 Years | 18 (4.9%) | 20 (2.5%) |
| 18 to 34 Years | 13 (2.6%) | 53 (8.1%) |
| 35 to 64 Years | 23 (2.4%) | 104 (10.8%) |
| 65 to 74 Years | 20 (9.8%) | 0 (0.0%) |
| 75 Years and over | 0 (0.0%) | 0 (0.0%) |
Disability Class: Ambulatory Difficulty
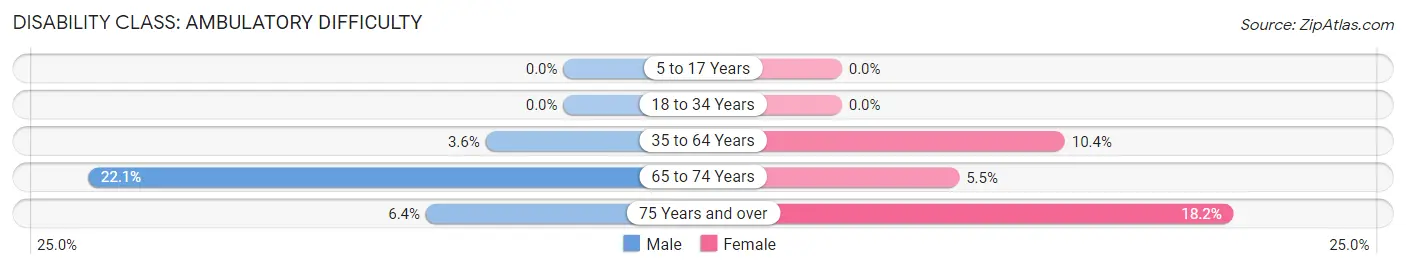
| Age Bracket | Male | Female |
| 5 to 17 Years | 0 (0.0%) | 0 (0.0%) |
| 18 to 34 Years | 0 (0.0%) | 0 (0.0%) |
| 35 to 64 Years | 34 (3.6%) | 100 (10.3%) |
| 65 to 74 Years | 45 (22.1%) | 12 (5.4%) |
| 75 Years and over | 6 (6.4%) | 34 (18.2%) |
Disability Class: Self-Care Difficulty
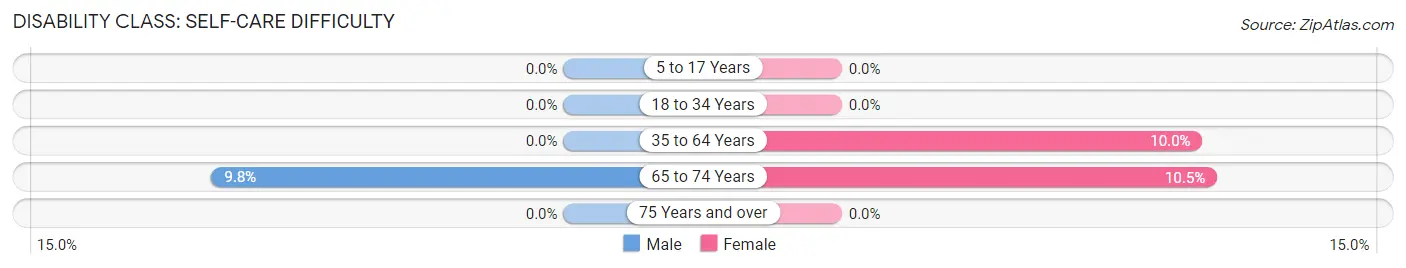
| Age Bracket | Male | Female |
| 5 to 17 Years | 0 (0.0%) | 0 (0.0%) |
| 18 to 34 Years | 0 (0.0%) | 0 (0.0%) |
| 35 to 64 Years | 0 (0.0%) | 97 (10.0%) |
| 65 to 74 Years | 20 (9.8%) | 23 (10.4%) |
| 75 Years and over | 0 (0.0%) | 0 (0.0%) |
Technology Access in Bangor borough
Computing Device Access in Bangor borough
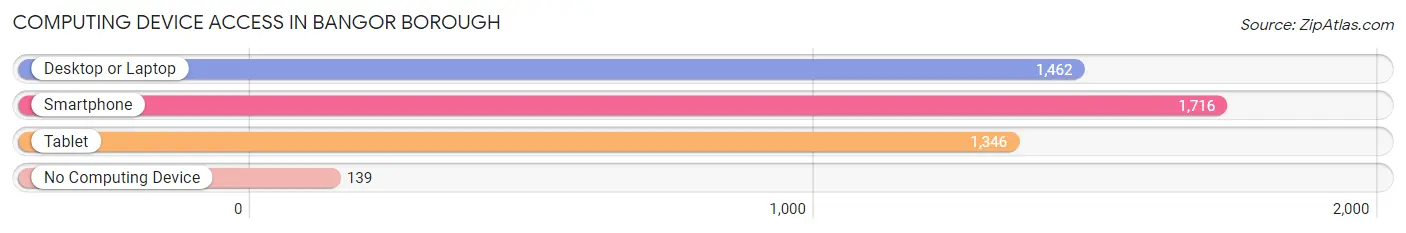
| Device Type | # Households | % Households |
| Desktop or Laptop | 1,462 | 73.8% |
| Smartphone | 1,716 | 86.6% |
| Tablet | 1,346 | 67.9% |
| No Computing Device | 139 | 7.0% |
| Total | 1,981 | 100.0% |
Internet Access in Bangor borough
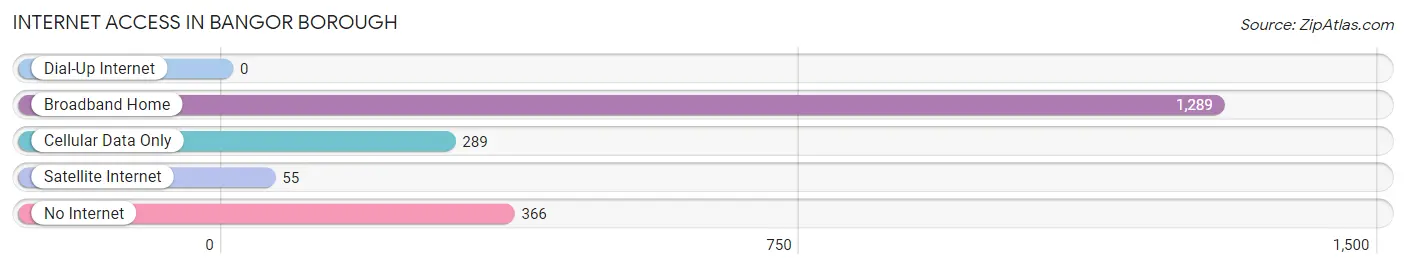
| Internet Type | # Households | % Households |
| Dial-Up Internet | 0 | 0.0% |
| Broadband Home | 1,289 | 65.1% |
| Cellular Data Only | 289 | 14.6% |
| Satellite Internet | 55 | 2.8% |
| No Internet | 366 | 18.5% |
| Total | 1,981 | 100.0% |
Bangor borough Summary
Bangor Borough is a borough located in Northampton County, Pennsylvania. It is situated in the Lehigh Valley region of the state, and is part of the Allentown-Bethlehem-Easton metropolitan area. The population of Bangor Borough was 5,945 at the 2010 census.
History
Bangor Borough was first settled in 1760 by a group of German immigrants. The town was originally known as “Hoffman’s Ferry”, named after the ferry service that operated across the Delaware River. In 1818, the town was renamed “Bangor” after the city of Bangor, Maine. The town was officially incorporated as a borough in 1891.
Geography
Bangor Borough is located at 40°45'17" North, 75°14'45" West (40.754722, -75.245833). According to the United States Census Bureau, the borough has a total area of 1.2 square miles, all of it land.
Economy
Bangor Borough’s economy is largely based on manufacturing and retail. The borough is home to several factories, including a paper mill, a plastics plant, and a metal fabrication plant. There are also several retail stores in the borough, including a grocery store, a hardware store, and a variety of specialty shops.
Demographics
As of the 2010 census, there were 5,945 people, 2,521 households, and 1,541 families residing in the borough. The population density was 4,955.8 people per square mile. The racial makeup of the borough was 94.2% White, 1.3% African American, 0.2% Native American, 0.7% Asian, 0.1% Pacific Islander, 1.7% from other races, and 1.9% from two or more races. Hispanic or Latino of any race were 4.3% of the population.
There were 2,521 households, out of which 28.2% had children under the age of 18 living with them, 43.2% were married couples living together, 13.2% had a female householder with no husband present, and 37.7% were non-families. 32.2% of all households were made up of individuals, and 14.7% had someone living alone who was 65 years of age or older. The average household size was 2.35 and the average family size was 2.96.
In the borough, the population was spread out, with 23.2% under the age of 18, 8.2% from 18 to 24, 28.7% from 25 to 44, 22.2% from 45 to 64, and 17.7% who were 65 years of age or older. The median age was 38 years. For every 100 females, there were 91.2 males. For every 100 females age 18 and over, there were 87.3 males.
The median income for a household in the borough was $37,917, and the median income for a family was $45,938. Males had a median income of $35,938 versus $25,917 for females. The per capita income for the borough was $19,945. About 6.2% of families and 8.3% of the population were below the poverty line, including 11.2% of those under age 18 and 8.2% of those age 65 or over.
Common Questions
What is Per Capita Income in Bangor borough?
Per Capita income in Bangor borough is $24,033.
What is the Median Family Income in Bangor borough?
Median Family Income in Bangor borough is $62,980.
What is the Median Household income in Bangor borough?
Median Household Income in Bangor borough is $51,578.
What is Income or Wage Gap in Bangor borough?
Income or Wage Gap in Bangor borough is 26.1%.
Women in Bangor borough earn 73.9 cents for every dollar earned by a man.
What is Family Income Deficit in Bangor borough?
Family Income Deficit in Bangor borough is $9,955.
Families that are below poverty line in Bangor borough earn $9,955 less on average than the poverty threshold level.
What is Inequality or Gini Index in Bangor borough?
Inequality or Gini Index in Bangor borough is 0.40.
What is the Total Population of Bangor borough?
Total Population of Bangor borough is 5,172.
What is the Total Male Population of Bangor borough?
Total Male Population of Bangor borough is 2,253.
What is the Total Female Population of Bangor borough?
Total Female Population of Bangor borough is 2,919.
What is the Ratio of Males per 100 Females in Bangor borough?
There are 77.18 Males per 100 Females in Bangor borough.
What is the Ratio of Females per 100 Males in Bangor borough?
There are 129.56 Females per 100 Males in Bangor borough.
What is the Median Population Age in Bangor borough?
Median Population Age in Bangor borough is 35.6 Years.
What is the Average Family Size in Bangor borough
Average Family Size in Bangor borough is 3.2 People.
What is the Average Household Size in Bangor borough
Average Household Size in Bangor borough is 2.6 People.
How Large is the Labor Force in Bangor borough?
There are 2,625 People in the Labor Forcein in Bangor borough.
What is the Percentage of People in the Labor Force in Bangor borough?
65.6% of People are in the Labor Force in Bangor borough.
What is the Unemployment Rate in Bangor borough?
Unemployment Rate in Bangor borough is 5.6%.