Mars borough, PA Map & Demographics
Mars borough Overview
$35,688
PER CAPITA INCOME
$82,045
AVG FAMILY INCOME
$57,700
AVG HOUSEHOLD INCOME
23.0%
WAGE / INCOME GAP [ % ]
77.0¢/ $1
WAGE / INCOME GAP [ $ ]
0.42
INEQUALITY / GINI INDEX
1,169
TOTAL POPULATION
512
MALE POPULATION
657
FEMALE POPULATION
77.93
MALES / 100 FEMALES
128.32
FEMALES / 100 MALES
58.2
MEDIAN AGE
2.7
AVG FAMILY SIZE
1.9
AVG HOUSEHOLD SIZE
595
LABOR FORCE [ PEOPLE ]
54.4%
PERCENT IN LABOR FORCE
2.7%
UNEMPLOYMENT RATE
Income in Mars borough
Income Overview in Mars borough
Per Capita Income in Mars borough is $35,688, while median incomes of families and households are $82,045 and $57,700 respectively.
| Characteristic | Number | Measure |
| Per Capita Income | 1,169 | $35,688 |
| Median Family Income | 238 | $82,045 |
| Mean Family Income | 238 | $103,178 |
| Median Household Income | 574 | $57,700 |
| Mean Household Income | 574 | $68,649 |
| Income Deficit | 238 | $0 |
| Wage / Income Gap (%) | 1,169 | 23.04% |
| Wage / Income Gap ($) | 1,169 | 76.96¢ per $1 |
| Gini / Inequality Index | 1,169 | 0.42 |
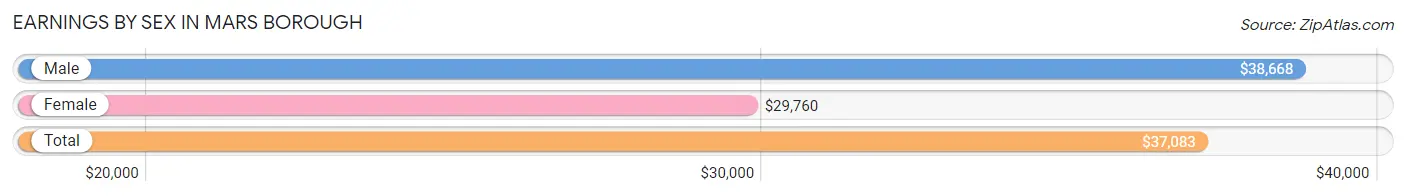
Earnings by Sex in Mars borough
Average Earnings in Mars borough are $37,083, $38,668 for men and $29,760 for women, a difference of 23.0%.
| Sex | Number | Average Earnings |
| Male | 357 (56.0%) | $38,668 |
| Female | 281 (44.0%) | $29,760 |
| Total | 638 (100.0%) | $37,083 |
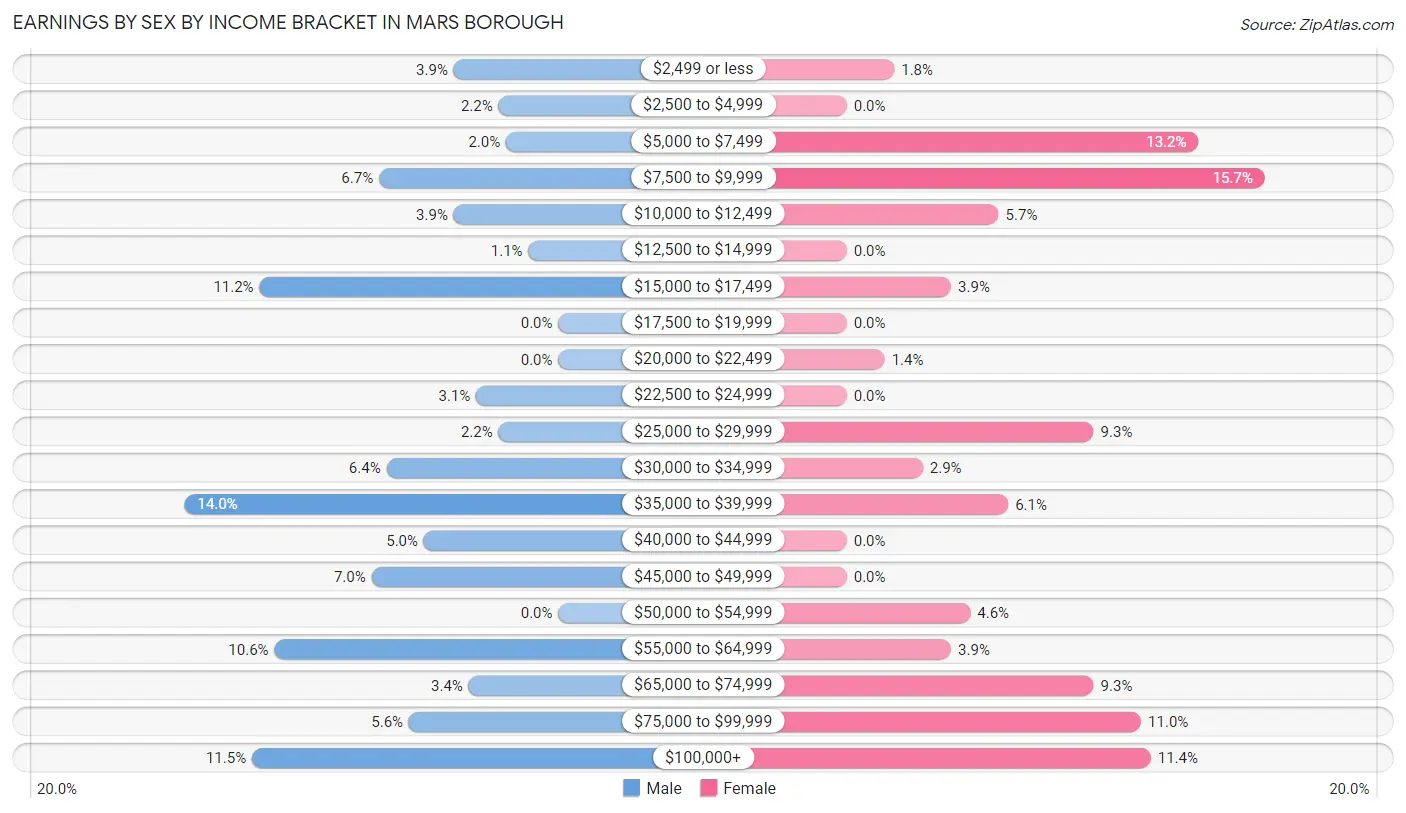
Earnings by Sex by Income Bracket in Mars borough
The most common earnings brackets in Mars borough are $35,000 to $39,999 for men (50 | 14.0%) and $7,500 to $9,999 for women (44 | 15.7%).
| Income | Male | Female |
| $2,499 or less | 14 (3.9%) | 5 (1.8%) |
| $2,500 to $4,999 | 8 (2.2%) | 0 (0.0%) |
| $5,000 to $7,499 | 7 (2.0%) | 37 (13.2%) |
| $7,500 to $9,999 | 24 (6.7%) | 44 (15.7%) |
| $10,000 to $12,499 | 14 (3.9%) | 16 (5.7%) |
| $12,500 to $14,999 | 4 (1.1%) | 0 (0.0%) |
| $15,000 to $17,499 | 40 (11.2%) | 11 (3.9%) |
| $17,500 to $19,999 | 0 (0.0%) | 0 (0.0%) |
| $20,000 to $22,499 | 0 (0.0%) | 4 (1.4%) |
| $22,500 to $24,999 | 11 (3.1%) | 0 (0.0%) |
| $25,000 to $29,999 | 8 (2.2%) | 26 (9.2%) |
| $30,000 to $34,999 | 23 (6.4%) | 8 (2.9%) |
| $35,000 to $39,999 | 50 (14.0%) | 17 (6.0%) |
| $40,000 to $44,999 | 18 (5.0%) | 0 (0.0%) |
| $45,000 to $49,999 | 25 (7.0%) | 0 (0.0%) |
| $50,000 to $54,999 | 0 (0.0%) | 13 (4.6%) |
| $55,000 to $64,999 | 38 (10.6%) | 11 (3.9%) |
| $65,000 to $74,999 | 12 (3.4%) | 26 (9.2%) |
| $75,000 to $99,999 | 20 (5.6%) | 31 (11.0%) |
| $100,000+ | 41 (11.5%) | 32 (11.4%) |
| Total | 357 (100.0%) | 281 (100.0%) |
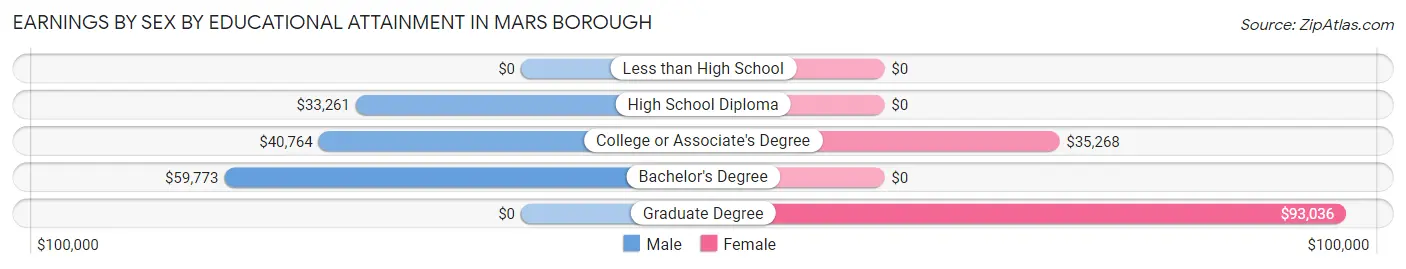
Earnings by Sex by Educational Attainment in Mars borough
Average earnings in Mars borough are $41,250 for men and $36,161 for women, a difference of 12.3%. Men with an educational attainment of bachelor's degree enjoy the highest average annual earnings of $59,773, while those with high school diploma education earn the least with $33,261. Women with an educational attainment of graduate degree earn the most with the average annual earnings of $93,036, while those with college or associate's degree education have the smallest earnings of $35,268.
| Educational Attainment | Male Income | Female Income |
| Less than High School | - | - |
| High School Diploma | $33,261 | $0 |
| College or Associate's Degree | $40,764 | $35,268 |
| Bachelor's Degree | $59,773 | $0 |
| Graduate Degree | - | - |
| Total | $41,250 | $36,161 |
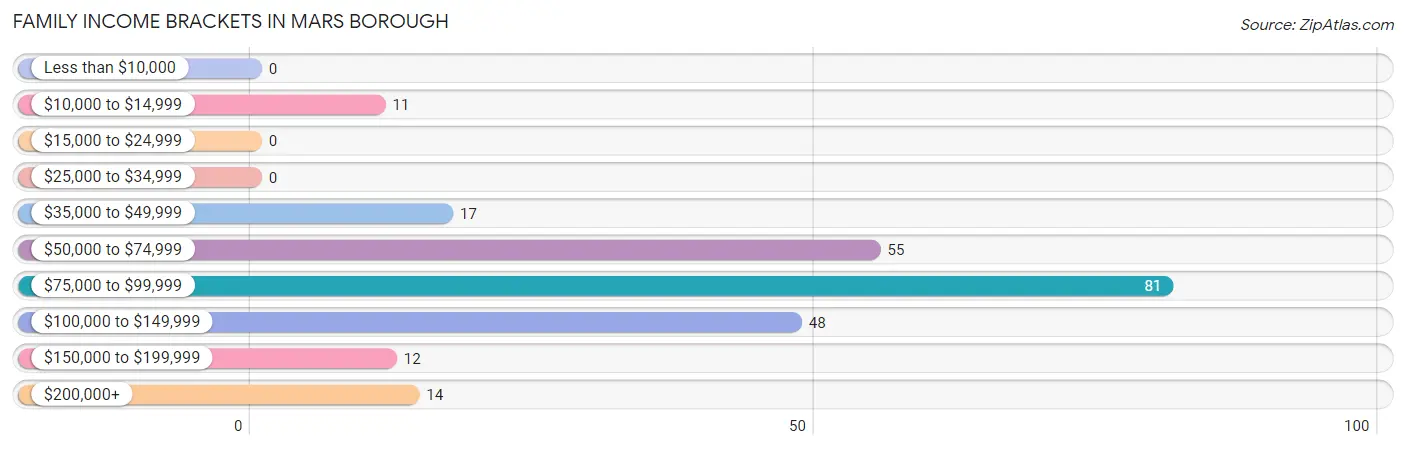
Family Income in Mars borough
Family Income Brackets in Mars borough
According to the Mars borough family income data, there are 81 families falling into the $75,000 to $99,999 income range, which is the most common income bracket and makes up 34.0% of all families.
| Income Bracket | # Families | % Families |
| Less than $10,000 | 0 | 0.0% |
| $10,000 to $14,999 | 11 | 4.6% |
| $15,000 to $24,999 | 0 | 0.0% |
| $25,000 to $34,999 | 0 | 0.0% |
| $35,000 to $49,999 | 17 | 7.1% |
| $50,000 to $74,999 | 55 | 23.1% |
| $75,000 to $99,999 | 81 | 34.0% |
| $100,000 to $149,999 | 48 | 20.2% |
| $150,000 to $199,999 | 12 | 5.0% |
| $200,000+ | 14 | 5.9% |
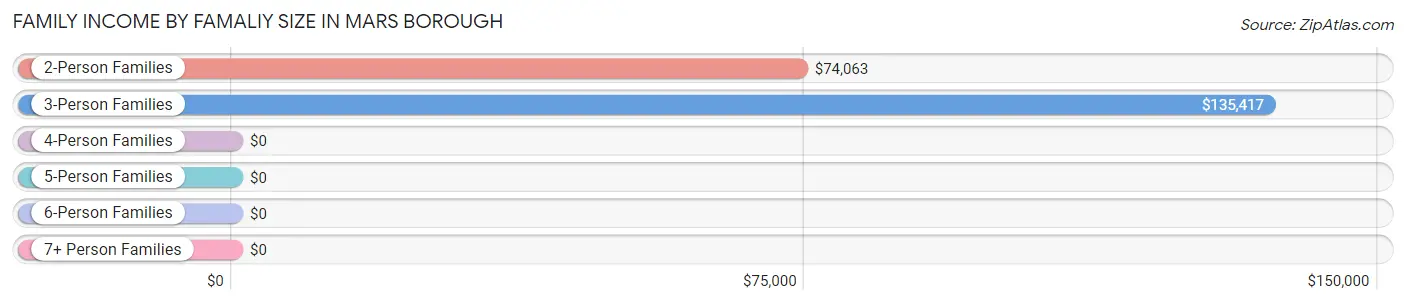
Family Income by Famaliy Size in Mars borough
3-person families (82 | 34.4%) account for the highest median family income in Mars borough with $135,417 per family, while 3-person families (82 | 34.4%) have the highest median income of $45,139 per family member.
| Income Bracket | # Families | Median Income |
| 2-Person Families | 129 (54.2%) | $74,063 |
| 3-Person Families | 82 (34.4%) | $135,417 |
| 4-Person Families | 10 (4.2%) | $0 |
| 5-Person Families | 6 (2.5%) | $0 |
| 6-Person Families | 11 (4.6%) | $0 |
| 7+ Person Families | 0 (0.0%) | $0 |
| Total | 238 (100.0%) | $82,045 |
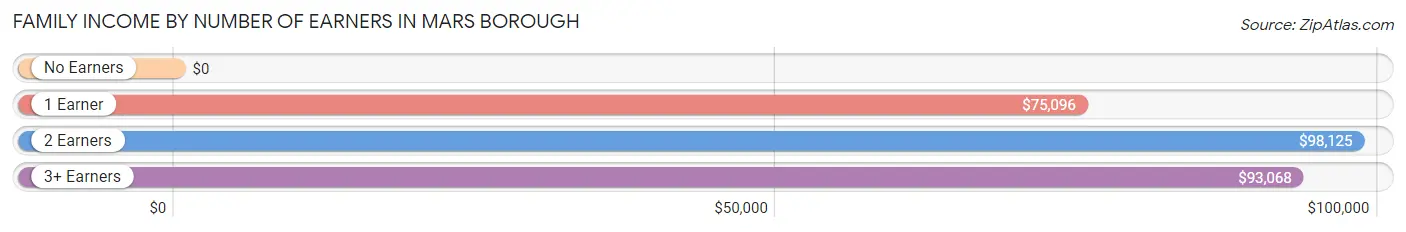
Family Income by Number of Earners in Mars borough
| Number of Earners | # Families | Median Income |
| No Earners | 24 (10.1%) | $0 |
| 1 Earner | 55 (23.1%) | $75,096 |
| 2 Earners | 130 (54.6%) | $98,125 |
| 3+ Earners | 29 (12.2%) | $93,068 |
| Total | 238 (100.0%) | $82,045 |
Household Income in Mars borough
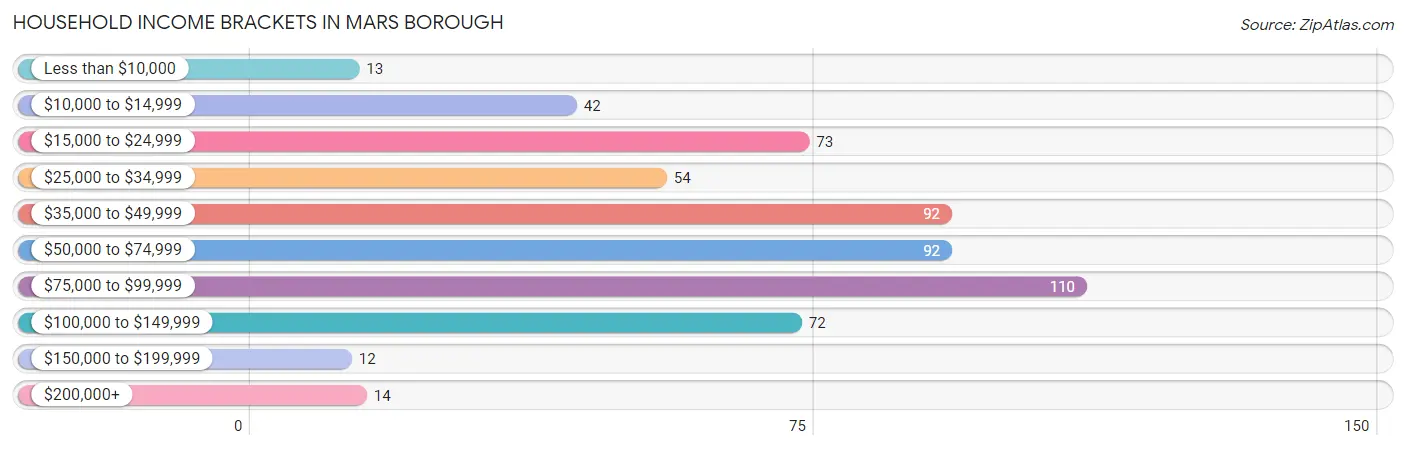
Household Income Brackets in Mars borough
With 110 households falling in the category, the $75,000 to $99,999 income range is the most frequent in Mars borough, accounting for 19.2% of all households. In contrast, only 12 households (2.1%) fall into the $150,000 to $199,999 income bracket, making it the least populous group.
| Income Bracket | # Households | % Households |
| Less than $10,000 | 13 | 2.3% |
| $10,000 to $14,999 | 42 | 7.3% |
| $15,000 to $24,999 | 73 | 12.7% |
| $25,000 to $34,999 | 54 | 9.4% |
| $35,000 to $49,999 | 92 | 16.0% |
| $50,000 to $74,999 | 92 | 16.0% |
| $75,000 to $99,999 | 110 | 19.2% |
| $100,000 to $149,999 | 72 | 12.5% |
| $150,000 to $199,999 | 12 | 2.1% |
| $200,000+ | 14 | 2.4% |
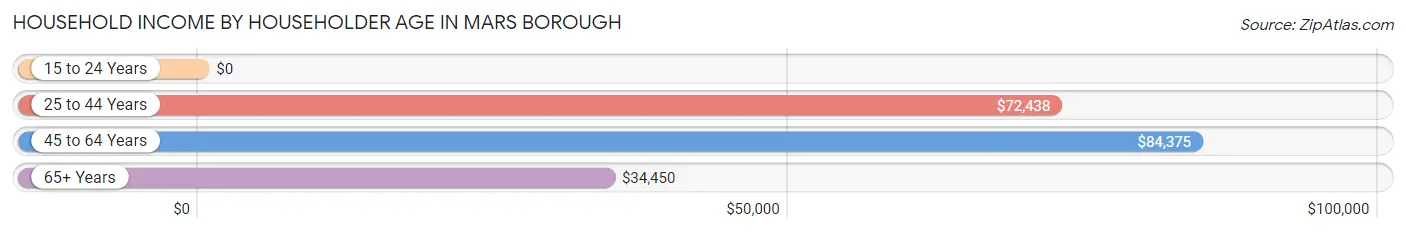
Household Income by Householder Age in Mars borough
The median household income in Mars borough is $57,700, with the highest median household income of $84,375 found in the 45 to 64 years age bracket for the primary householder. A total of 229 households (39.9%) fall into this category. Meanwhile, the 15 to 24 years age bracket for the primary householder has the lowest median household income of $0, with 17 households (3.0%) in this group.
| Income Bracket | # Households | Median Income |
| 15 to 24 Years | 17 (3.0%) | $0 |
| 25 to 44 Years | 85 (14.8%) | $72,438 |
| 45 to 64 Years | 229 (39.9%) | $84,375 |
| 65+ Years | 243 (42.3%) | $34,450 |
| Total | 574 (100.0%) | $57,700 |
Poverty in Mars borough
Income Below Poverty by Sex and Age in Mars borough
With 4.9% poverty level for males and 10.9% for females among the residents of Mars borough, 35 to 44 year old males and 15 year old females are the most vulnerable to poverty, with 15 males (39.5%) and 8 females (100.0%) in their respective age groups living below the poverty level.
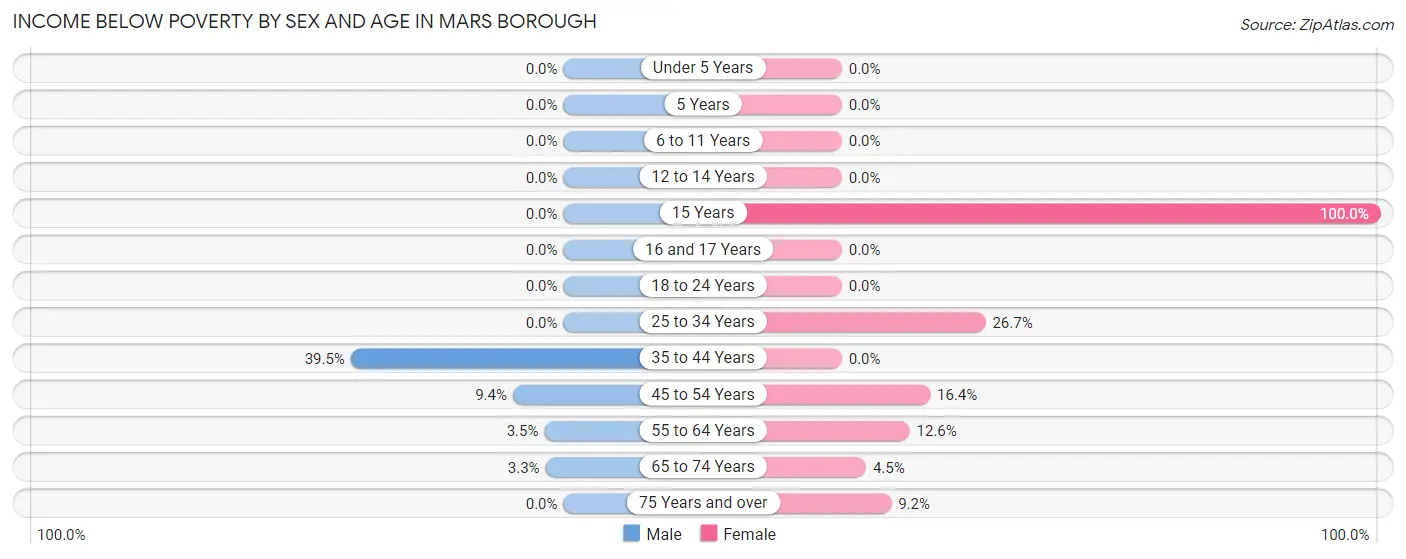
| Age Bracket | Male | Female |
| Under 5 Years | 0 (0.0%) | 0 (0.0%) |
| 5 Years | 0 (0.0%) | 0 (0.0%) |
| 6 to 11 Years | 0 (0.0%) | 0 (0.0%) |
| 12 to 14 Years | 0 (0.0%) | 0 (0.0%) |
| 15 Years | 0 (0.0%) | 8 (100.0%) |
| 16 and 17 Years | 0 (0.0%) | 0 (0.0%) |
| 18 to 24 Years | 0 (0.0%) | 0 (0.0%) |
| 25 to 34 Years | 0 (0.0%) | 12 (26.7%) |
| 35 to 44 Years | 15 (39.5%) | 0 (0.0%) |
| 45 to 54 Years | 3 (9.4%) | 10 (16.4%) |
| 55 to 64 Years | 4 (3.5%) | 17 (12.6%) |
| 65 to 74 Years | 2 (3.3%) | 4 (4.5%) |
| 75 Years and over | 0 (0.0%) | 11 (9.2%) |
| Total | 24 (4.9%) | 62 (10.9%) |
Income Above Poverty by Sex and Age in Mars borough
According to the poverty statistics in Mars borough, males aged under 5 years and females aged under 5 years are the age groups that are most secure financially, with 100.0% of males and 100.0% of females in these age groups living above the poverty line.
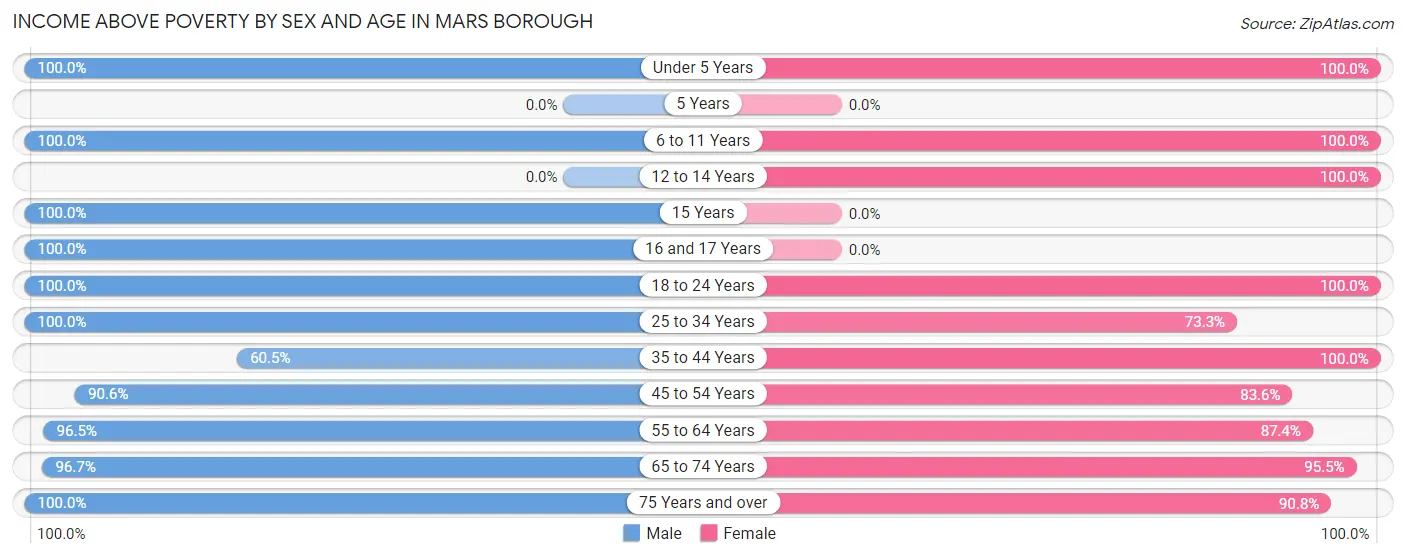
| Age Bracket | Male | Female |
| Under 5 Years | 7 (100.0%) | 13 (100.0%) |
| 5 Years | 0 (0.0%) | 0 (0.0%) |
| 6 to 11 Years | 5 (100.0%) | 16 (100.0%) |
| 12 to 14 Years | 0 (0.0%) | 5 (100.0%) |
| 15 Years | 11 (100.0%) | 0 (0.0%) |
| 16 and 17 Years | 22 (100.0%) | 0 (0.0%) |
| 18 to 24 Years | 70 (100.0%) | 49 (100.0%) |
| 25 to 34 Years | 91 (100.0%) | 33 (73.3%) |
| 35 to 44 Years | 23 (60.5%) | 28 (100.0%) |
| 45 to 54 Years | 29 (90.6%) | 51 (83.6%) |
| 55 to 64 Years | 109 (96.5%) | 118 (87.4%) |
| 65 to 74 Years | 58 (96.7%) | 85 (95.5%) |
| 75 Years and over | 45 (100.0%) | 109 (90.8%) |
| Total | 470 (95.1%) | 507 (89.1%) |
Income Below Poverty Among Married-Couple Families in Mars borough
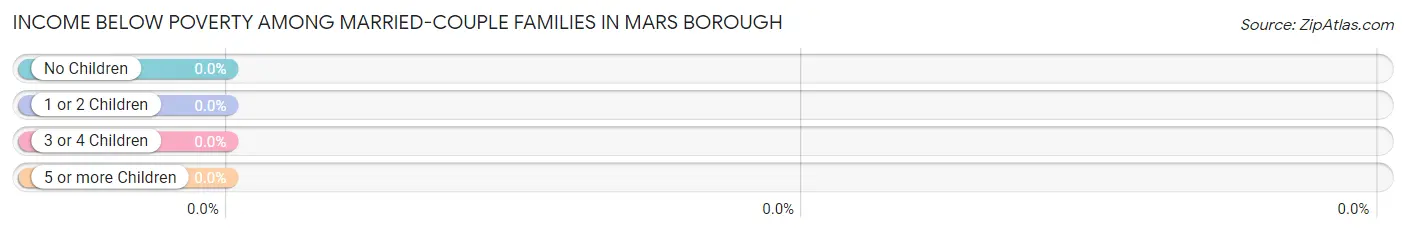
| Children | Above Poverty | Below Poverty |
| No Children | 113 (100.0%) | 0 (0.0%) |
| 1 or 2 Children | 41 (100.0%) | 0 (0.0%) |
| 3 or 4 Children | 0 (0.0%) | 0 (0.0%) |
| 5 or more Children | 0 (0.0%) | 0 (0.0%) |
| Total | 154 (100.0%) | 0 (0.0%) |
Income Below Poverty Among Single-Parent Households in Mars borough
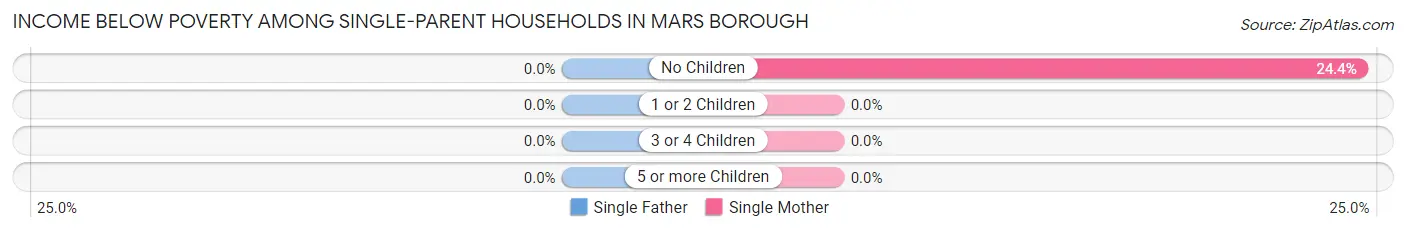
| Children | Single Father | Single Mother |
| No Children | 0 (0.0%) | 11 (24.4%) |
| 1 or 2 Children | 0 (0.0%) | 0 (0.0%) |
| 3 or 4 Children | 0 (0.0%) | 0 (0.0%) |
| 5 or more Children | 0 (0.0%) | 0 (0.0%) |
| Total | 0 (0.0%) | 11 (17.5%) |
Income Below Poverty Among Married-Couple vs Single-Parent Households in Mars borough
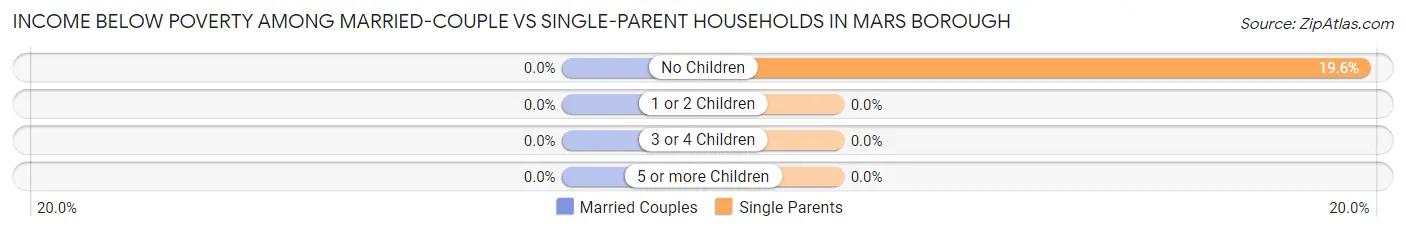
| Children | Married-Couple Families | Single-Parent Households |
| No Children | 0 (0.0%) | 11 (19.6%) |
| 1 or 2 Children | 0 (0.0%) | 0 (0.0%) |
| 3 or 4 Children | 0 (0.0%) | 0 (0.0%) |
| 5 or more Children | 0 (0.0%) | 0 (0.0%) |
| Total | 0 (0.0%) | 11 (13.1%) |
Race in Mars borough
The most populous races in Mars borough are White / Caucasian (1,091 | 93.3%), Hispanic or Latino (83 | 7.1%), and Two or more Races (72 | 6.2%).
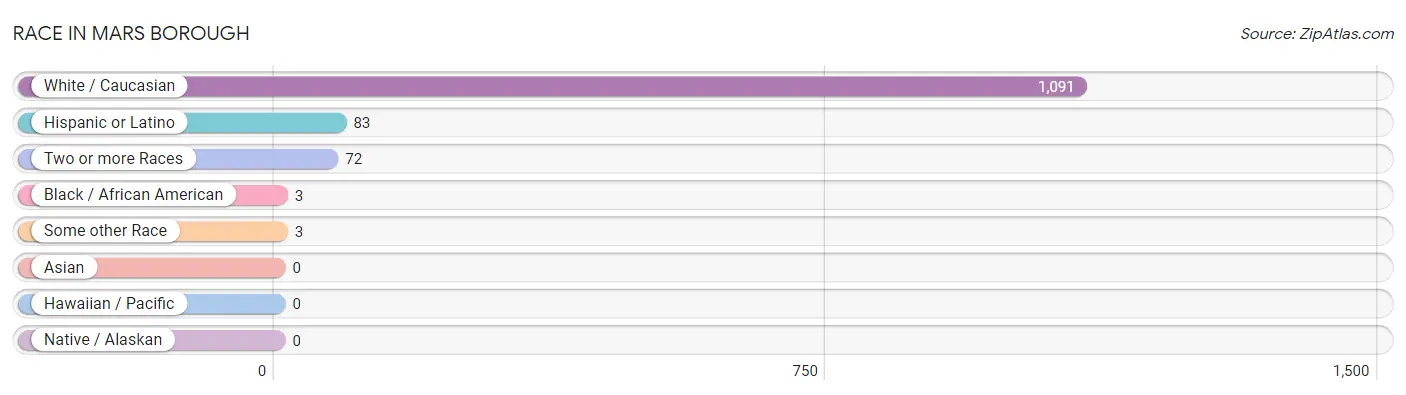
| Race | # Population | % Population |
| Asian | 0 | 0.0% |
| Black / African American | 3 | 0.3% |
| Hawaiian / Pacific | 0 | 0.0% |
| Hispanic or Latino | 83 | 7.1% |
| Native / Alaskan | 0 | 0.0% |
| White / Caucasian | 1,091 | 93.3% |
| Two or more Races | 72 | 6.2% |
| Some other Race | 3 | 0.3% |
| Total | 1,169 | 100.0% |
Ancestry in Mars borough
The most populous ancestries reported in Mars borough are German (384 | 32.9%), Irish (201 | 17.2%), English (199 | 17.0%), Italian (189 | 16.2%), and Polish (86 | 7.4%), together accounting for 90.6% of all Mars borough residents.
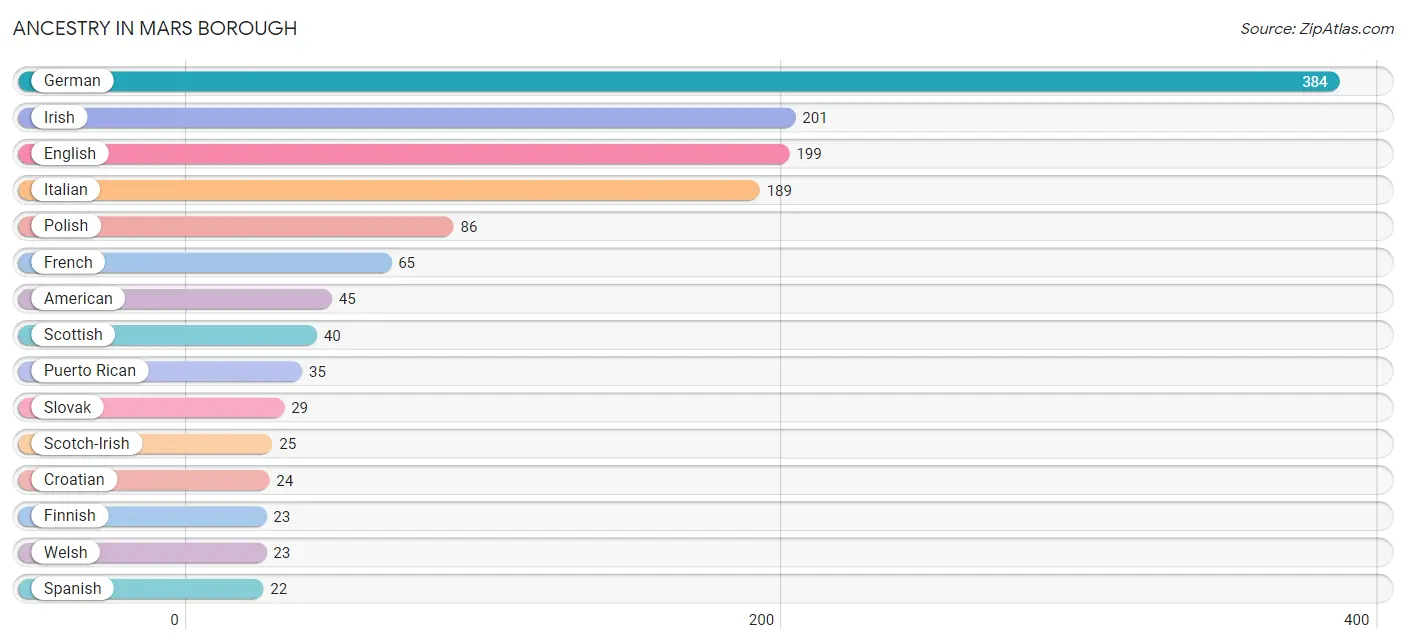
| Ancestry | # Population | % Population |
| American | 45 | 3.8% |
| Central American | 5 | 0.4% |
| Croatian | 24 | 2.1% |
| Czechoslovakian | 20 | 1.7% |
| Dutch | 10 | 0.9% |
| English | 199 | 17.0% |
| European | 5 | 0.4% |
| Finnish | 23 | 2.0% |
| French | 65 | 5.6% |
| German | 384 | 32.9% |
| Irish | 201 | 17.2% |
| Italian | 189 | 16.2% |
| Lithuanian | 12 | 1.0% |
| Mexican | 21 | 1.8% |
| Panamanian | 5 | 0.4% |
| Polish | 86 | 7.4% |
| Puerto Rican | 35 | 3.0% |
| Scotch-Irish | 25 | 2.1% |
| Scottish | 40 | 3.4% |
| Slovak | 29 | 2.5% |
| Spanish | 22 | 1.9% |
| Swedish | 3 | 0.3% |
| Thai | 5 | 0.4% |
| Welsh | 23 | 2.0% | View All 24 Rows |
Immigrants in Mars borough
The most numerous immigrant groups reported in Mars borough came from Central America (5 | 0.4%), Latin America (5 | 0.4%), and Panama (5 | 0.4%), together accounting for 1.3% of all Mars borough residents.
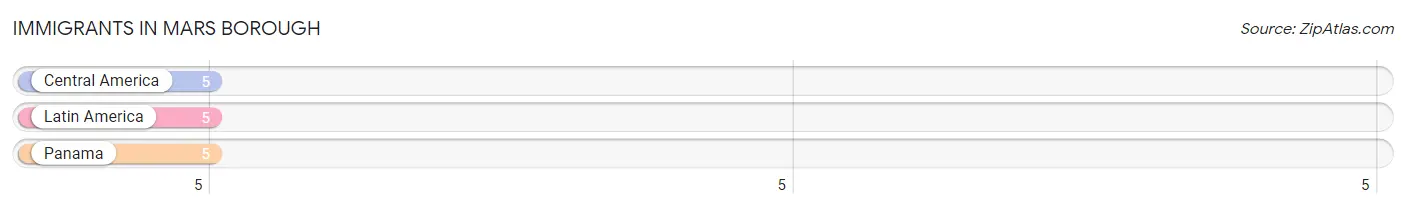
| Immigration Origin | # Population | % Population |
| Central America | 5 | 0.4% |
| Latin America | 5 | 0.4% |
| Panama | 5 | 0.4% | View All 3 Rows |
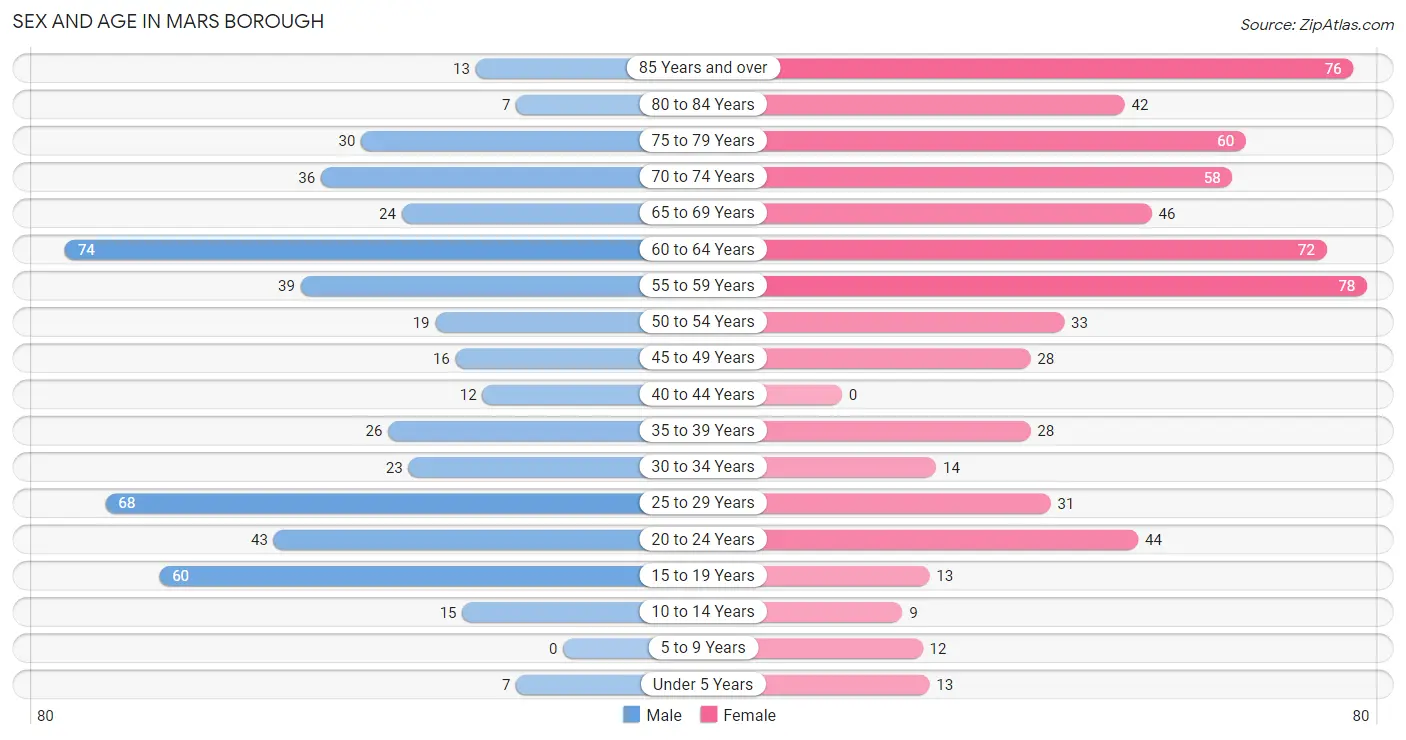
Sex and Age in Mars borough
Sex and Age in Mars borough
The most populous age groups in Mars borough are 60 to 64 Years (74 | 14.4%) for men and 55 to 59 Years (78 | 11.9%) for women.
| Age Bracket | Male | Female |
| Under 5 Years | 7 (1.4%) | 13 (2.0%) |
| 5 to 9 Years | 0 (0.0%) | 12 (1.8%) |
| 10 to 14 Years | 15 (2.9%) | 9 (1.4%) |
| 15 to 19 Years | 60 (11.7%) | 13 (2.0%) |
| 20 to 24 Years | 43 (8.4%) | 44 (6.7%) |
| 25 to 29 Years | 68 (13.3%) | 31 (4.7%) |
| 30 to 34 Years | 23 (4.5%) | 14 (2.1%) |
| 35 to 39 Years | 26 (5.1%) | 28 (4.3%) |
| 40 to 44 Years | 12 (2.3%) | 0 (0.0%) |
| 45 to 49 Years | 16 (3.1%) | 28 (4.3%) |
| 50 to 54 Years | 19 (3.7%) | 33 (5.0%) |
| 55 to 59 Years | 39 (7.6%) | 78 (11.9%) |
| 60 to 64 Years | 74 (14.4%) | 72 (11.0%) |
| 65 to 69 Years | 24 (4.7%) | 46 (7.0%) |
| 70 to 74 Years | 36 (7.0%) | 58 (8.8%) |
| 75 to 79 Years | 30 (5.9%) | 60 (9.1%) |
| 80 to 84 Years | 7 (1.4%) | 42 (6.4%) |
| 85 Years and over | 13 (2.5%) | 76 (11.6%) |
| Total | 512 (100.0%) | 657 (100.0%) |
Families and Households in Mars borough
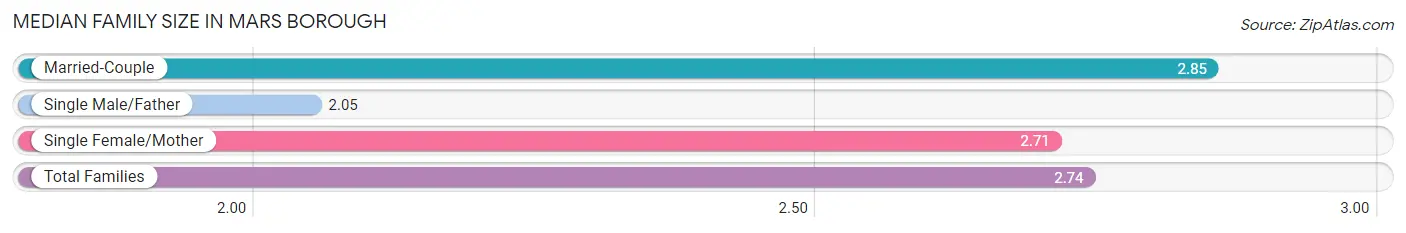
Median Family Size in Mars borough
The median family size in Mars borough is 2.74 persons per family, with married-couple families (154 | 64.7%) accounting for the largest median family size of 2.85 persons per family. On the other hand, single male/father families (21 | 8.8%) represent the smallest median family size with 2.05 persons per family.
| Family Type | # Families | Family Size |
| Married-Couple | 154 (64.7%) | 2.85 |
| Single Male/Father | 21 (8.8%) | 2.05 |
| Single Female/Mother | 63 (26.5%) | 2.71 |
| Total Families | 238 (100.0%) | 2.74 |
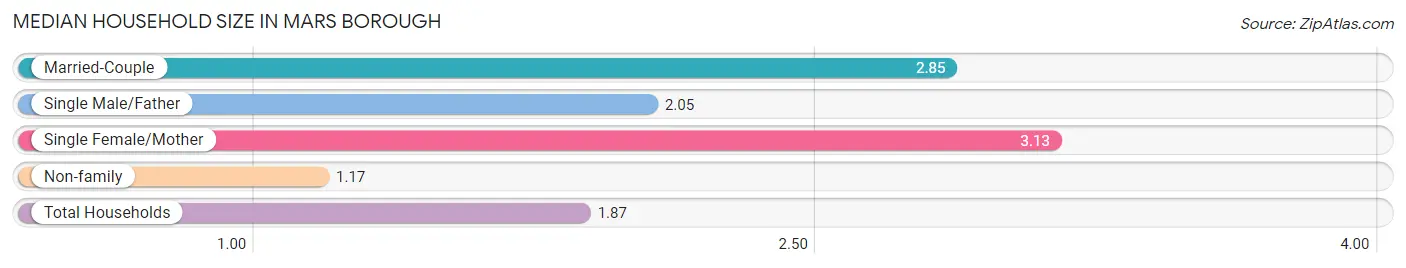
Median Household Size in Mars borough
The median household size in Mars borough is 1.87 persons per household, with single female/mother households (63 | 11.0%) accounting for the largest median household size of 3.13 persons per household. non-family households (336 | 58.5%) represent the smallest median household size with 1.17 persons per household.
| Household Type | # Households | Household Size |
| Married-Couple | 154 (26.8%) | 2.85 |
| Single Male/Father | 21 (3.7%) | 2.05 |
| Single Female/Mother | 63 (11.0%) | 3.13 |
| Non-family | 336 (58.5%) | 1.17 |
| Total Households | 574 (100.0%) | 1.87 |
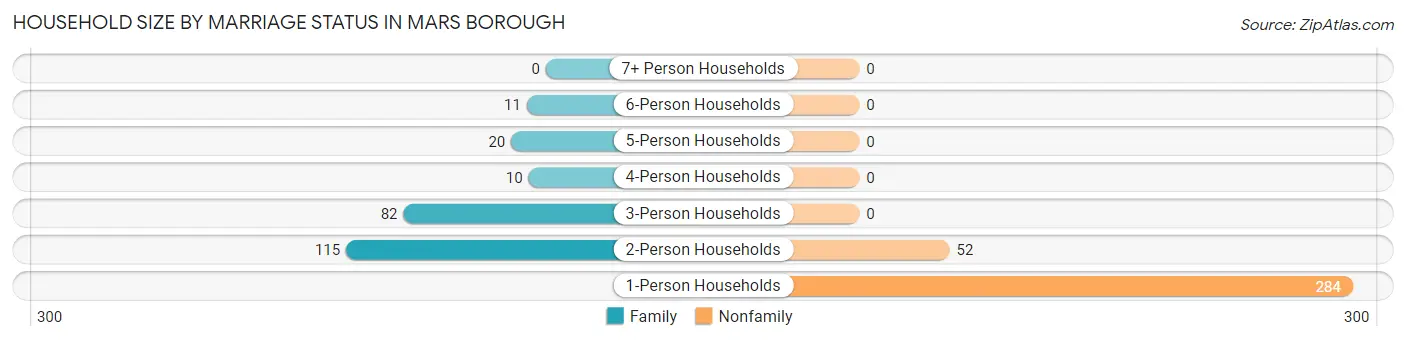
Household Size by Marriage Status in Mars borough
Out of a total of 574 households in Mars borough, 238 (41.5%) are family households, while 336 (58.5%) are nonfamily households. The most numerous type of family households are 2-person households, comprising 115, and the most common type of nonfamily households are 1-person households, comprising 284.
| Household Size | Family Households | Nonfamily Households |
| 1-Person Households | - | 284 (49.5%) |
| 2-Person Households | 115 (20.0%) | 52 (9.1%) |
| 3-Person Households | 82 (14.3%) | 0 (0.0%) |
| 4-Person Households | 10 (1.7%) | 0 (0.0%) |
| 5-Person Households | 20 (3.5%) | 0 (0.0%) |
| 6-Person Households | 11 (1.9%) | 0 (0.0%) |
| 7+ Person Households | 0 (0.0%) | 0 (0.0%) |
| Total | 238 (41.5%) | 336 (58.5%) |
Female Fertility in Mars borough
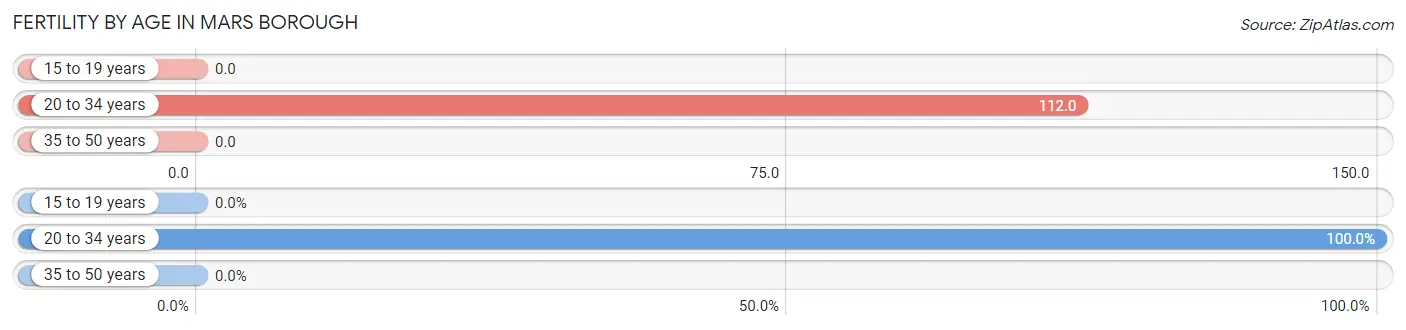
Fertility by Age in Mars borough
Average fertility rate in Mars borough is 63.0 births per 1,000 women. Women in the age bracket of 20 to 34 years have the highest fertility rate with 112.0 births per 1,000 women. Women in the age bracket of 20 to 34 years acount for 100.0% of all women with births.
| Age Bracket | Women with Births | Births / 1,000 Women |
| 15 to 19 years | 0 (0.0%) | 0.0 |
| 20 to 34 years | 10 (100.0%) | 112.0 |
| 35 to 50 years | 0 (0.0%) | 0.0 |
| Total | 10 (100.0%) | 63.0 |
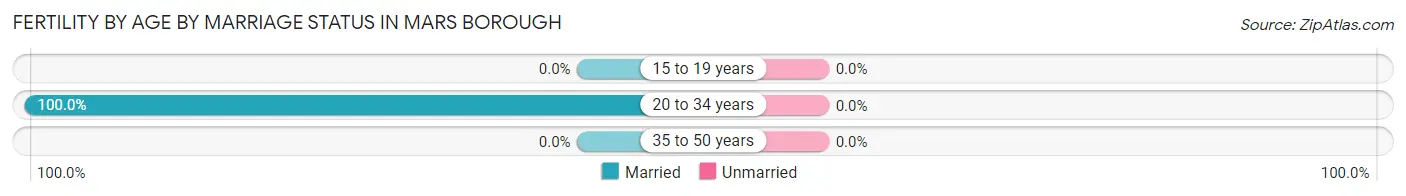
Fertility by Age by Marriage Status in Mars borough
| Age Bracket | Married | Unmarried |
| 15 to 19 years | 0 (0.0%) | 0 (0.0%) |
| 20 to 34 years | 10 (100.0%) | 0 (0.0%) |
| 35 to 50 years | 0 (0.0%) | 0 (0.0%) |
| Total | 10 (100.0%) | 0 (0.0%) |
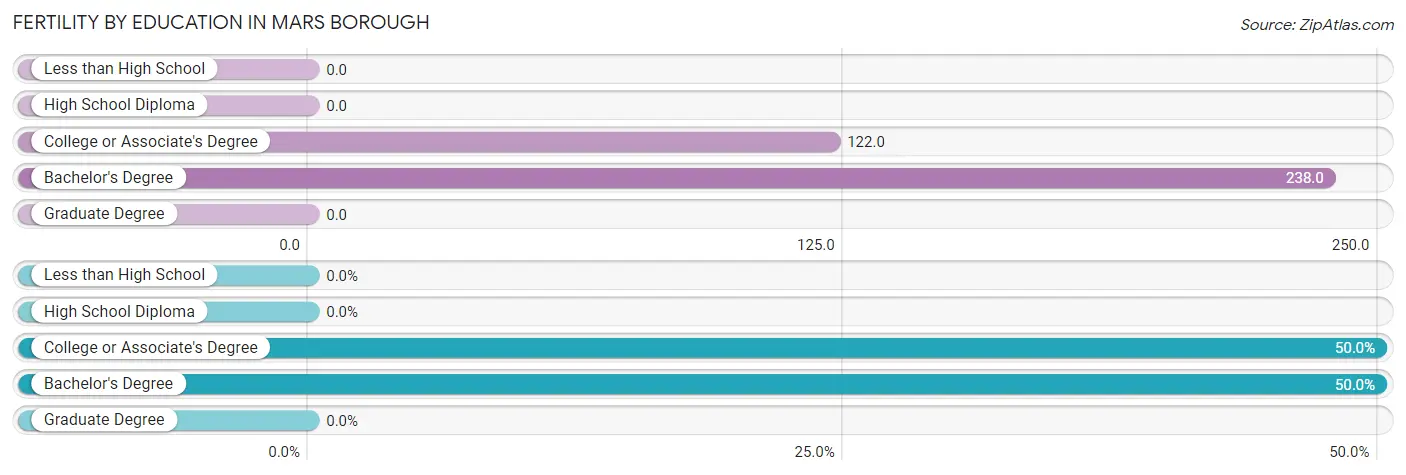
Fertility by Education in Mars borough
| Educational Attainment | Women with Births | Births / 1,000 Women |
| Less than High School | 0 (0.0%) | 0.0 |
| High School Diploma | 0 (0.0%) | 0.0 |
| College or Associate's Degree | 5 (50.0%) | 122.0 |
| Bachelor's Degree | 5 (50.0%) | 238.0 |
| Graduate Degree | 0 (0.0%) | 0.0 |
| Total | 10 (100.0%) | 63.0 |
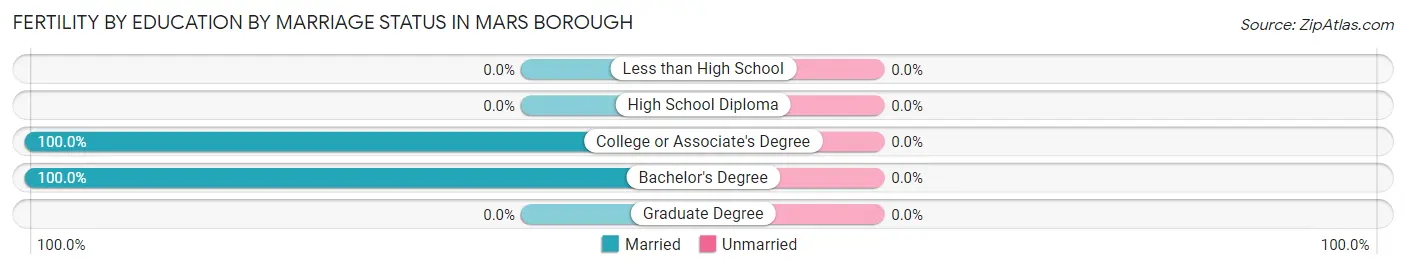
Fertility by Education by Marriage Status in Mars borough
| Educational Attainment | Married | Unmarried |
| Less than High School | 0 (0.0%) | 0 (0.0%) |
| High School Diploma | 0 (0.0%) | 0 (0.0%) |
| College or Associate's Degree | 5 (100.0%) | 0 (0.0%) |
| Bachelor's Degree | 5 (100.0%) | 0 (0.0%) |
| Graduate Degree | 0 (0.0%) | 0 (0.0%) |
| Total | 10 (100.0%) | 0 (0.0%) |
Employment Characteristics in Mars borough
Employment by Class of Employer in Mars borough
Among the 574 employed individuals in Mars borough, private company employees (419 | 73.0%), not-for-profit organizations (65 | 11.3%), and self-employed (not incorporated) (46 | 8.0%) make up the most common classes of employment.
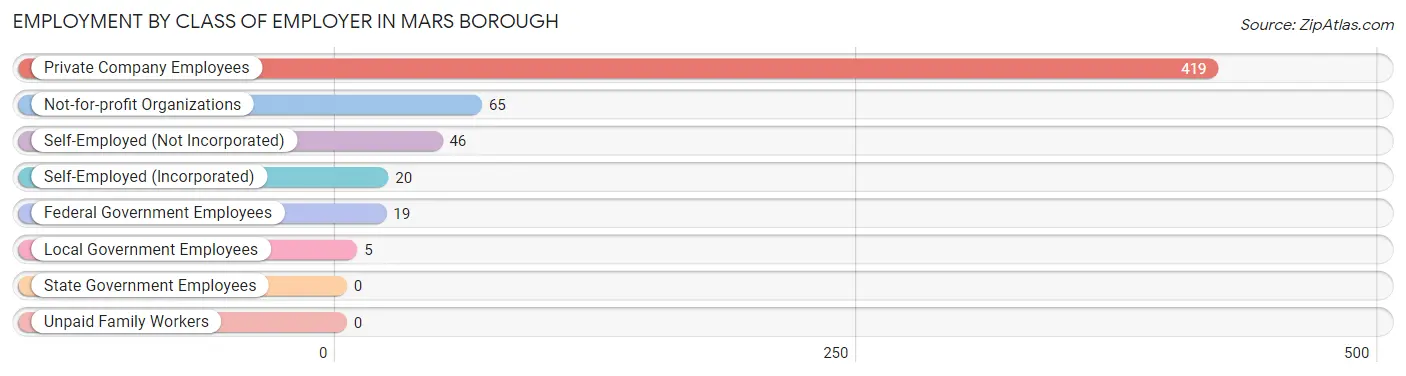
| Employer Class | # Employees | % Employees |
| Private Company Employees | 419 | 73.0% |
| Self-Employed (Incorporated) | 20 | 3.5% |
| Self-Employed (Not Incorporated) | 46 | 8.0% |
| Not-for-profit Organizations | 65 | 11.3% |
| Local Government Employees | 5 | 0.9% |
| State Government Employees | 0 | 0.0% |
| Federal Government Employees | 19 | 3.3% |
| Unpaid Family Workers | 0 | 0.0% |
| Total | 574 | 100.0% |
Employment Status by Age in Mars borough
According to the labor force statistics for Mars borough, out of the total population over 16 years of age (1,094), 54.4% or 595 individuals are in the labor force, with 2.7% or 16 of them unemployed. The age group with the highest labor force participation rate is 25 to 29 years, with 100.0% or 99 individuals in the labor force. Within the labor force, the 45 to 54 years age range has the highest percentage of unemployed individuals, with 12.8% or 10 of them being unemployed.
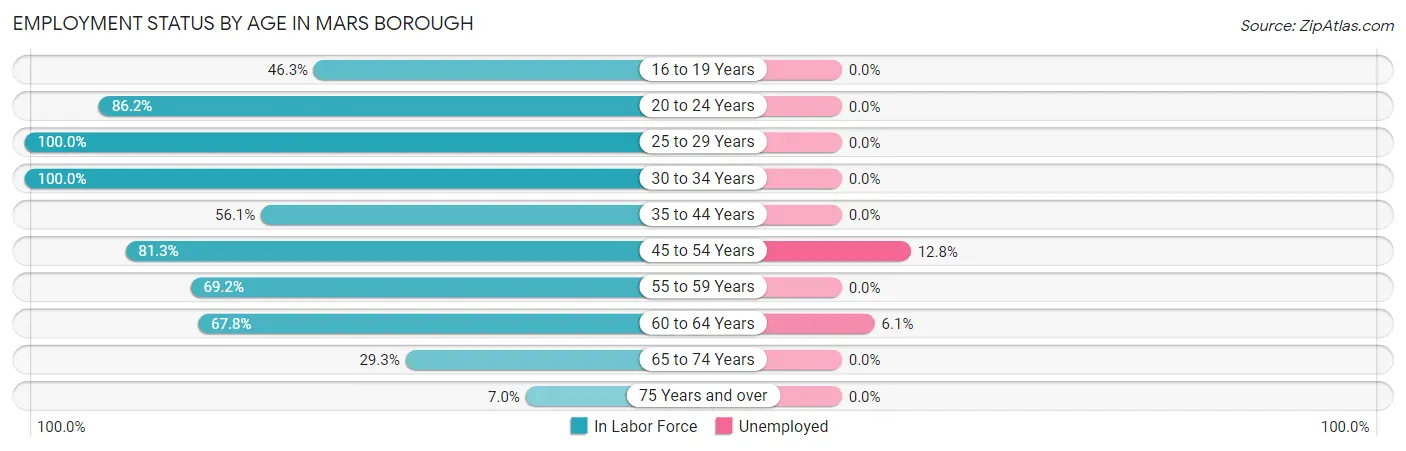
| Age Bracket | In Labor Force | Unemployed |
| 16 to 19 Years | 25 (46.3%) | 0 (0.0%) |
| 20 to 24 Years | 75 (86.2%) | 0 (0.0%) |
| 25 to 29 Years | 99 (100.0%) | 0 (0.0%) |
| 30 to 34 Years | 37 (100.0%) | 0 (0.0%) |
| 35 to 44 Years | 37 (56.1%) | 0 (0.0%) |
| 45 to 54 Years | 78 (81.3%) | 10 (12.8%) |
| 55 to 59 Years | 81 (69.2%) | 0 (0.0%) |
| 60 to 64 Years | 99 (67.8%) | 6 (6.1%) |
| 65 to 74 Years | 48 (29.3%) | 0 (0.0%) |
| 75 Years and over | 16 (7.0%) | 0 (0.0%) |
| Total | 595 (54.4%) | 16 (2.7%) |
Employment Status by Educational Attainment in Mars borough
According to labor force statistics for Mars borough, 76.8% of individuals (431) out of the total population between 25 and 64 years of age (561) are in the labor force, with 3.7% or 16 of them being unemployed. The group with the highest labor force participation rate are those with the educational attainment of bachelor's degree or higher, with 87.2% or 177 individuals in the labor force. Within the labor force, individuals with college / associate degree education have the highest percentage of unemployment, with 8.7% or 16 of them being unemployed.
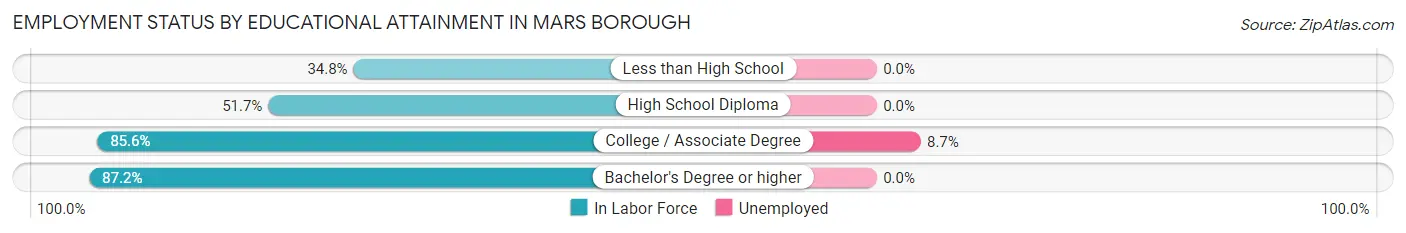
| Educational Attainment | In Labor Force | Unemployed |
| Less than High School | 8 (34.8%) | 0 (0.0%) |
| High School Diploma | 62 (51.7%) | 0 (0.0%) |
| College / Associate Degree | 184 (85.6%) | 19 (8.7%) |
| Bachelor's Degree or higher | 177 (87.2%) | 0 (0.0%) |
| Total | 431 (76.8%) | 21 (3.7%) |
Employment Occupations by Sex in Mars borough
Management, Business, Science and Arts Occupations
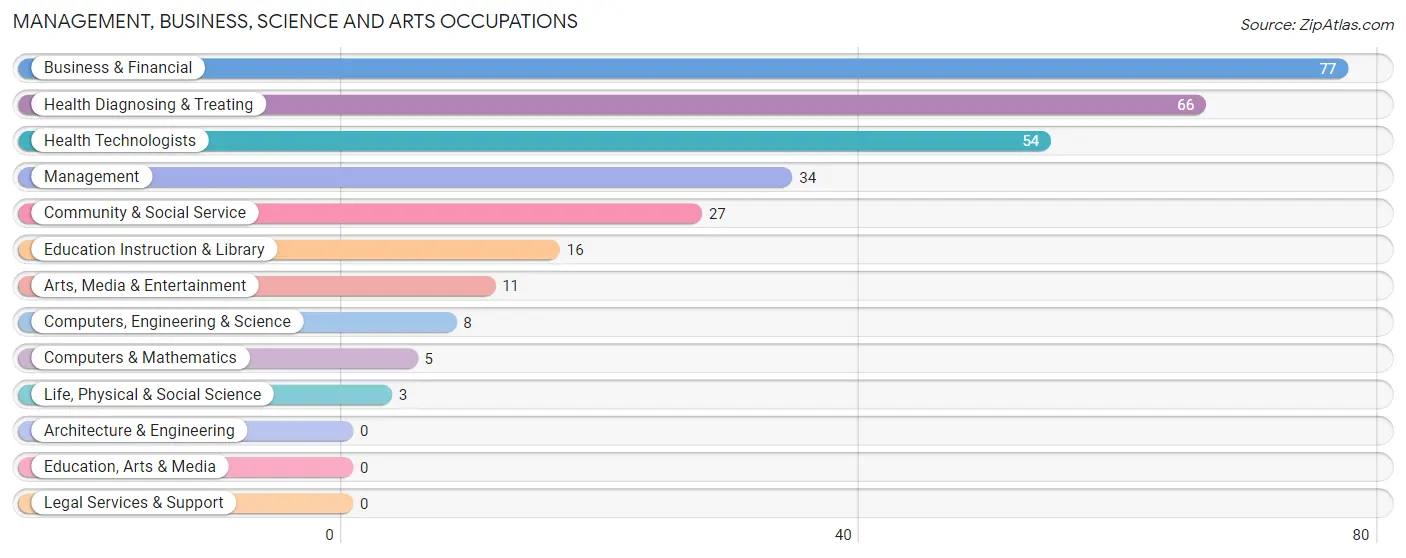
The most common Management, Business, Science and Arts occupations in Mars borough are Business & Financial (77 | 13.3%), Health Diagnosing & Treating (66 | 11.4%), Health Technologists (54 | 9.3%), Management (34 | 5.9%), and Community & Social Service (27 | 4.7%).
Management, Business, Science and Arts Occupations by Sex
Within the Management, Business, Science and Arts occupations in Mars borough, the most male-oriented occupations are Computers, Engineering & Science (100.0%), Computers & Mathematics (100.0%), and Life, Physical & Social Science (100.0%), while the most female-oriented occupations are Education Instruction & Library (100.0%), Health Diagnosing & Treating (86.4%), and Health Technologists (83.3%).
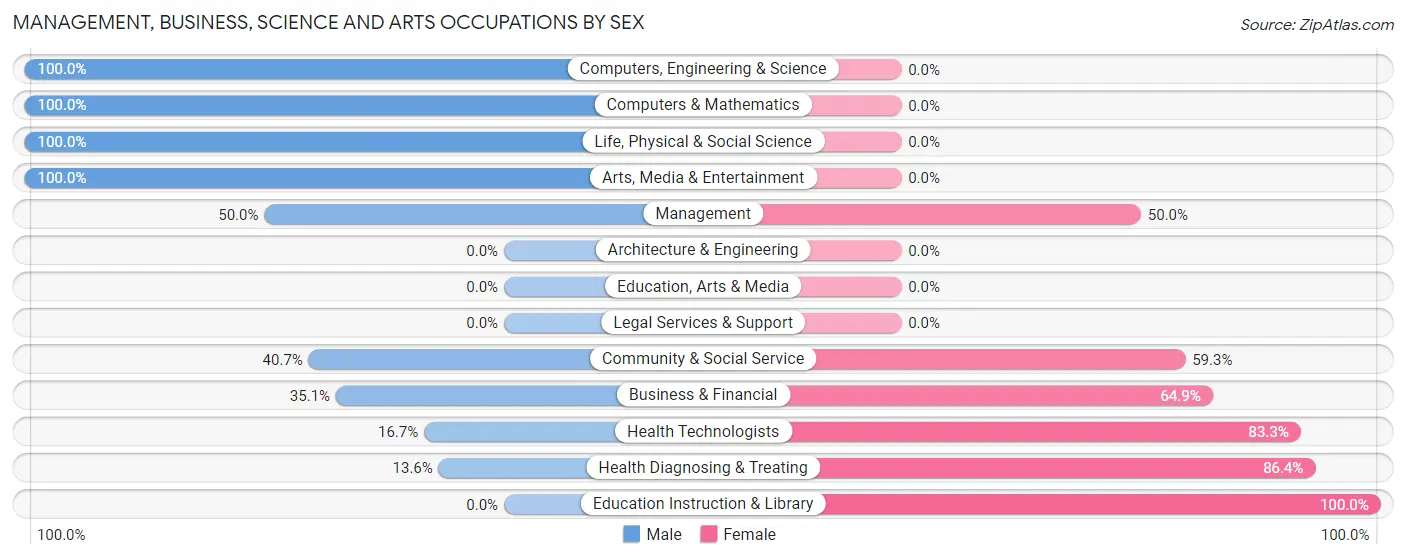
| Occupation | Male | Female |
| Management | 17 (50.0%) | 17 (50.0%) |
| Business & Financial | 27 (35.1%) | 50 (64.9%) |
| Computers, Engineering & Science | 8 (100.0%) | 0 (0.0%) |
| Computers & Mathematics | 5 (100.0%) | 0 (0.0%) |
| Architecture & Engineering | 0 (0.0%) | 0 (0.0%) |
| Life, Physical & Social Science | 3 (100.0%) | 0 (0.0%) |
| Community & Social Service | 11 (40.7%) | 16 (59.3%) |
| Education, Arts & Media | 0 (0.0%) | 0 (0.0%) |
| Legal Services & Support | 0 (0.0%) | 0 (0.0%) |
| Education Instruction & Library | 0 (0.0%) | 16 (100.0%) |
| Arts, Media & Entertainment | 11 (100.0%) | 0 (0.0%) |
| Health Diagnosing & Treating | 9 (13.6%) | 57 (86.4%) |
| Health Technologists | 9 (16.7%) | 45 (83.3%) |
| Total (Category) | 72 (34.0%) | 140 (66.0%) |
| Total (Overall) | 326 (56.3%) | 253 (43.7%) |
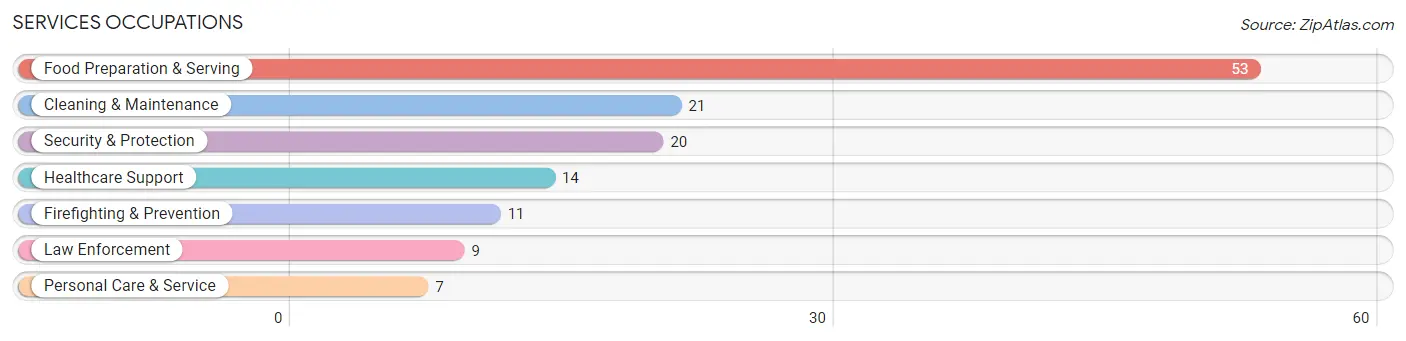
Services Occupations
The most common Services occupations in Mars borough are Food Preparation & Serving (53 | 9.1%), Cleaning & Maintenance (21 | 3.6%), Security & Protection (20 | 3.5%), Healthcare Support (14 | 2.4%), and Firefighting & Prevention (11 | 1.9%).
Services Occupations by Sex
Within the Services occupations in Mars borough, the most male-oriented occupations are Healthcare Support (100.0%), Security & Protection (100.0%), and Firefighting & Prevention (100.0%), while the most female-oriented occupations are Personal Care & Service (100.0%), Food Preparation & Serving (73.6%), and Cleaning & Maintenance (19.1%).
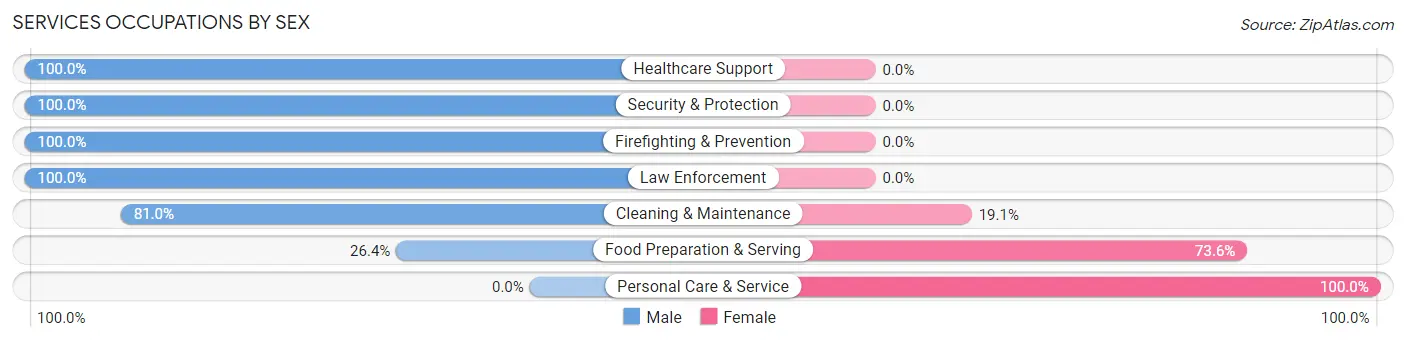
| Occupation | Male | Female |
| Healthcare Support | 14 (100.0%) | 0 (0.0%) |
| Security & Protection | 20 (100.0%) | 0 (0.0%) |
| Firefighting & Prevention | 11 (100.0%) | 0 (0.0%) |
| Law Enforcement | 9 (100.0%) | 0 (0.0%) |
| Food Preparation & Serving | 14 (26.4%) | 39 (73.6%) |
| Cleaning & Maintenance | 17 (80.9%) | 4 (19.1%) |
| Personal Care & Service | 0 (0.0%) | 7 (100.0%) |
| Total (Category) | 65 (56.5%) | 50 (43.5%) |
| Total (Overall) | 326 (56.3%) | 253 (43.7%) |
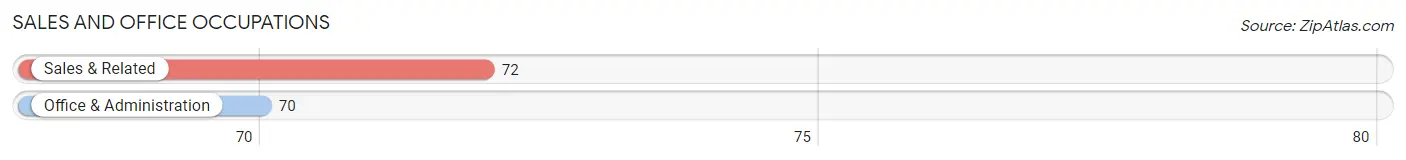
Sales and Office Occupations
The most common Sales and Office occupations in Mars borough are Sales & Related (72 | 12.4%), and Office & Administration (70 | 12.1%).
Sales and Office Occupations by Sex

| Occupation | Male | Female |
| Sales & Related | 38 (52.8%) | 34 (47.2%) |
| Office & Administration | 60 (85.7%) | 10 (14.3%) |
| Total (Category) | 98 (69.0%) | 44 (31.0%) |
| Total (Overall) | 326 (56.3%) | 253 (43.7%) |
Natural Resources, Construction and Maintenance Occupations
The most common Natural Resources, Construction and Maintenance occupations in Mars borough are Installation, Maintenance & Repair (28 | 4.8%), Construction & Extraction (16 | 2.8%), and Farming, Fishing & Forestry (7 | 1.2%).
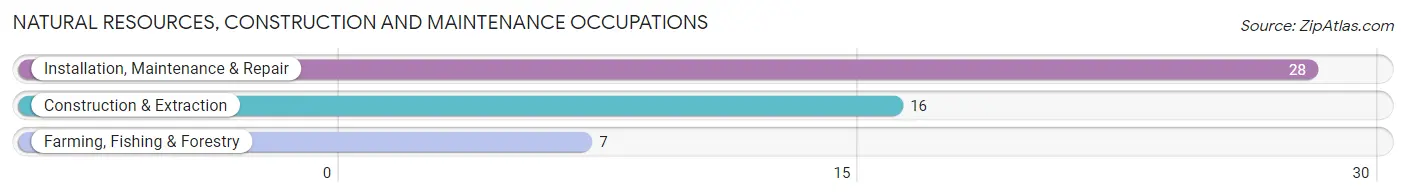
Natural Resources, Construction and Maintenance Occupations by Sex
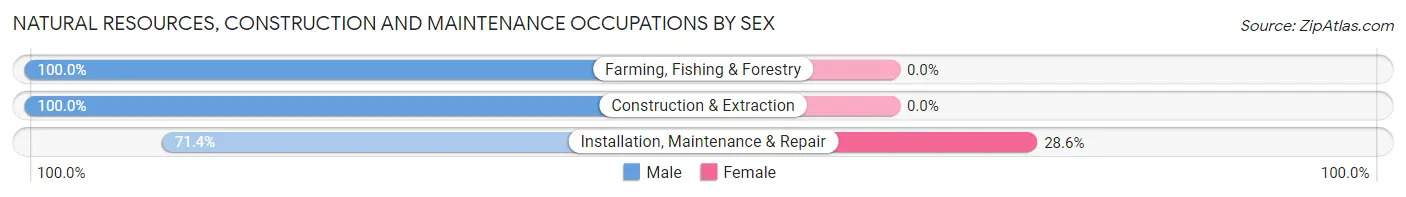
| Occupation | Male | Female |
| Farming, Fishing & Forestry | 7 (100.0%) | 0 (0.0%) |
| Construction & Extraction | 16 (100.0%) | 0 (0.0%) |
| Installation, Maintenance & Repair | 20 (71.4%) | 8 (28.6%) |
| Total (Category) | 43 (84.3%) | 8 (15.7%) |
| Total (Overall) | 326 (56.3%) | 253 (43.7%) |
Production, Transportation and Moving Occupations
The most common Production, Transportation and Moving occupations in Mars borough are Transportation (44 | 7.6%), and Production (15 | 2.6%).
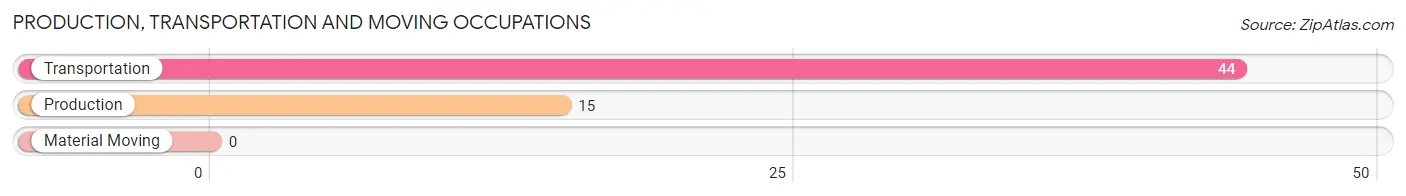
Production, Transportation and Moving Occupations by Sex
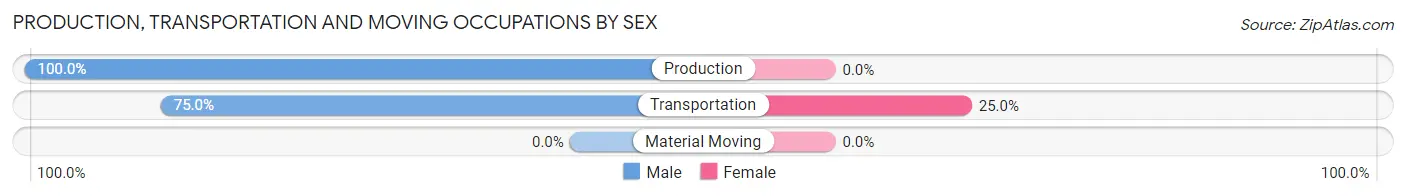
| Occupation | Male | Female |
| Production | 15 (100.0%) | 0 (0.0%) |
| Transportation | 33 (75.0%) | 11 (25.0%) |
| Material Moving | 0 (0.0%) | 0 (0.0%) |
| Total (Category) | 48 (81.4%) | 11 (18.6%) |
| Total (Overall) | 326 (56.3%) | 253 (43.7%) |
Employment Industries by Sex in Mars borough
Employment Industries in Mars borough
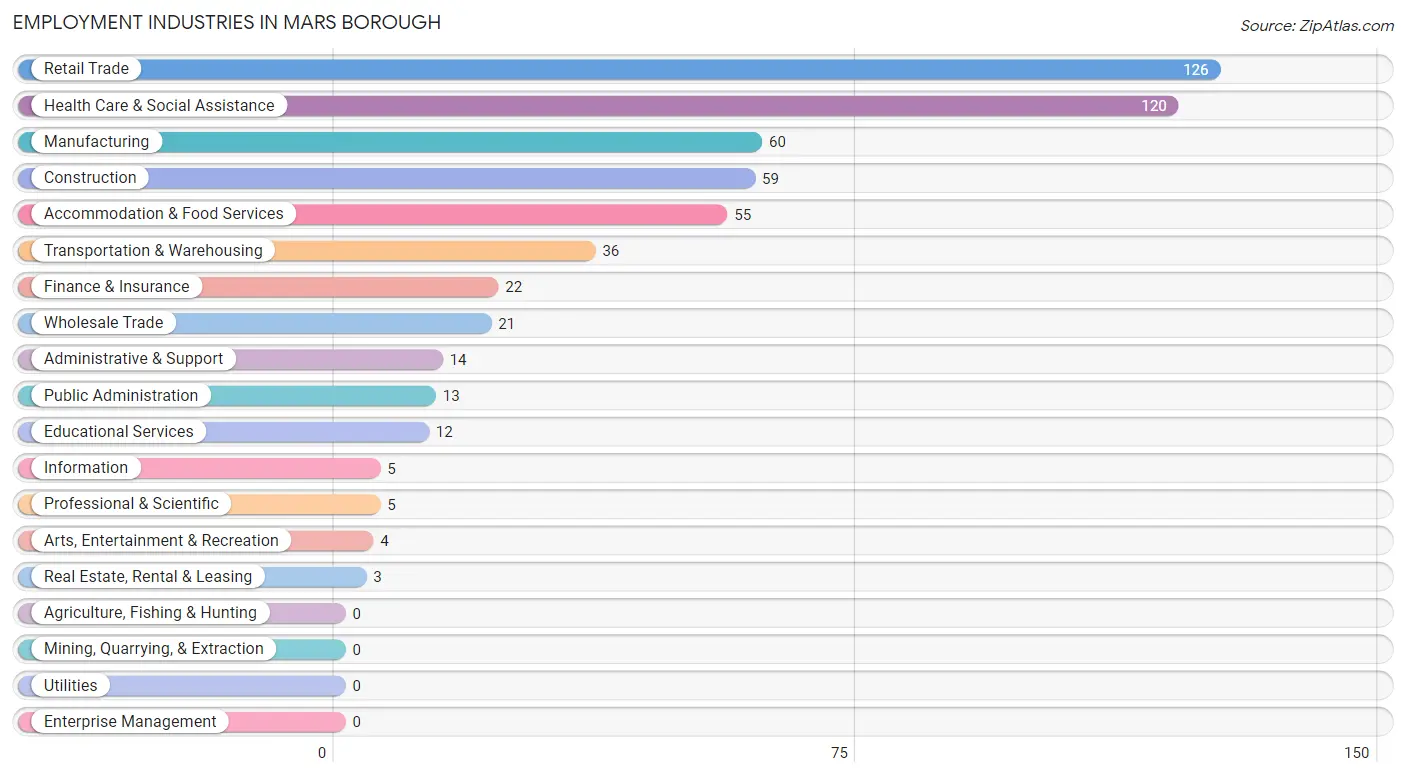
The major employment industries in Mars borough include Retail Trade (126 | 21.8%), Health Care & Social Assistance (120 | 20.7%), Manufacturing (60 | 10.4%), Construction (59 | 10.2%), and Accommodation & Food Services (55 | 9.5%).
Employment Industries by Sex in Mars borough
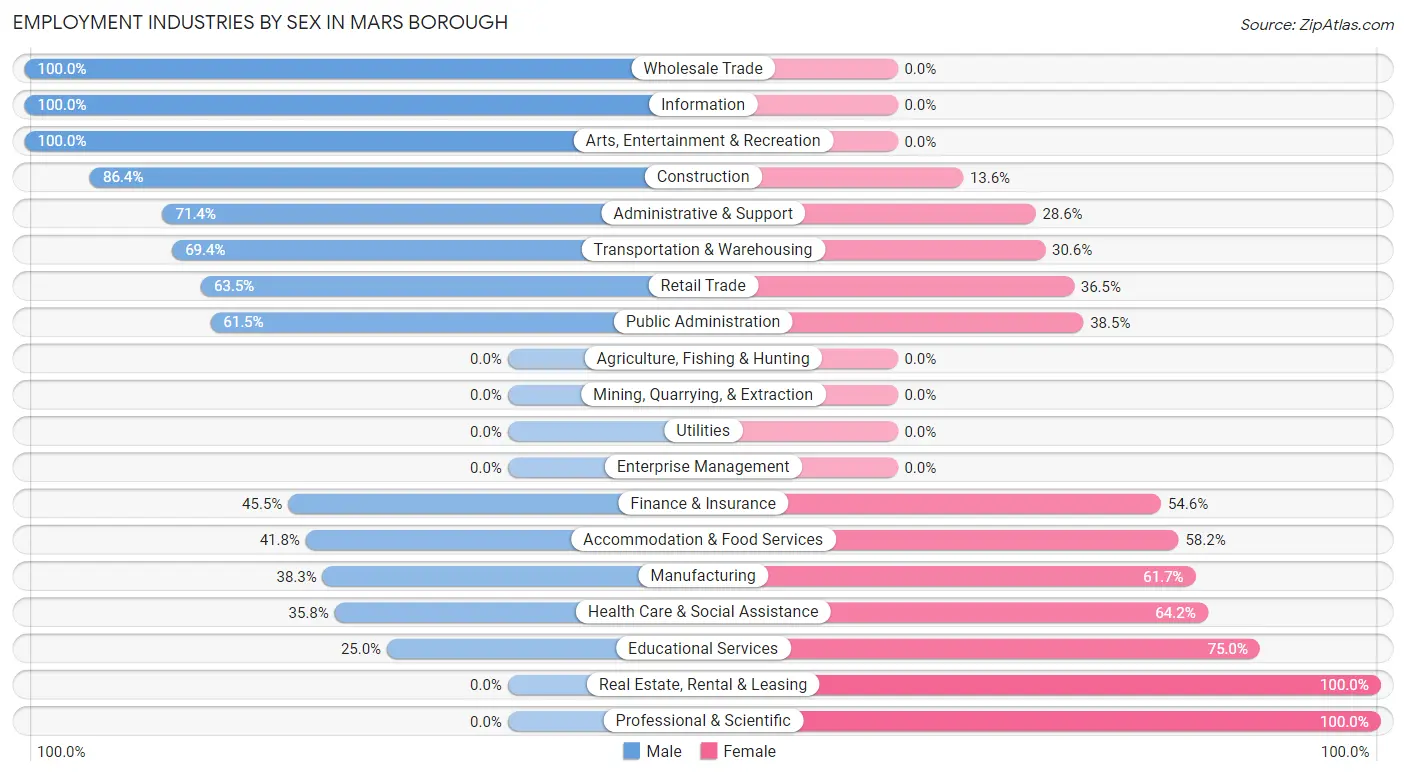
The Mars borough industries that see more men than women are Wholesale Trade (100.0%), Information (100.0%), and Arts, Entertainment & Recreation (100.0%), whereas the industries that tend to have a higher number of women are Real Estate, Rental & Leasing (100.0%), Professional & Scientific (100.0%), and Educational Services (75.0%).
| Industry | Male | Female |
| Agriculture, Fishing & Hunting | 0 (0.0%) | 0 (0.0%) |
| Mining, Quarrying, & Extraction | 0 (0.0%) | 0 (0.0%) |
| Construction | 51 (86.4%) | 8 (13.6%) |
| Manufacturing | 23 (38.3%) | 37 (61.7%) |
| Wholesale Trade | 21 (100.0%) | 0 (0.0%) |
| Retail Trade | 80 (63.5%) | 46 (36.5%) |
| Transportation & Warehousing | 25 (69.4%) | 11 (30.6%) |
| Utilities | 0 (0.0%) | 0 (0.0%) |
| Information | 5 (100.0%) | 0 (0.0%) |
| Finance & Insurance | 10 (45.5%) | 12 (54.5%) |
| Real Estate, Rental & Leasing | 0 (0.0%) | 3 (100.0%) |
| Professional & Scientific | 0 (0.0%) | 5 (100.0%) |
| Enterprise Management | 0 (0.0%) | 0 (0.0%) |
| Administrative & Support | 10 (71.4%) | 4 (28.6%) |
| Educational Services | 3 (25.0%) | 9 (75.0%) |
| Health Care & Social Assistance | 43 (35.8%) | 77 (64.2%) |
| Arts, Entertainment & Recreation | 4 (100.0%) | 0 (0.0%) |
| Accommodation & Food Services | 23 (41.8%) | 32 (58.2%) |
| Public Administration | 8 (61.5%) | 5 (38.5%) |
| Total | 326 (56.3%) | 253 (43.7%) |
Education in Mars borough
School Enrollment in Mars borough
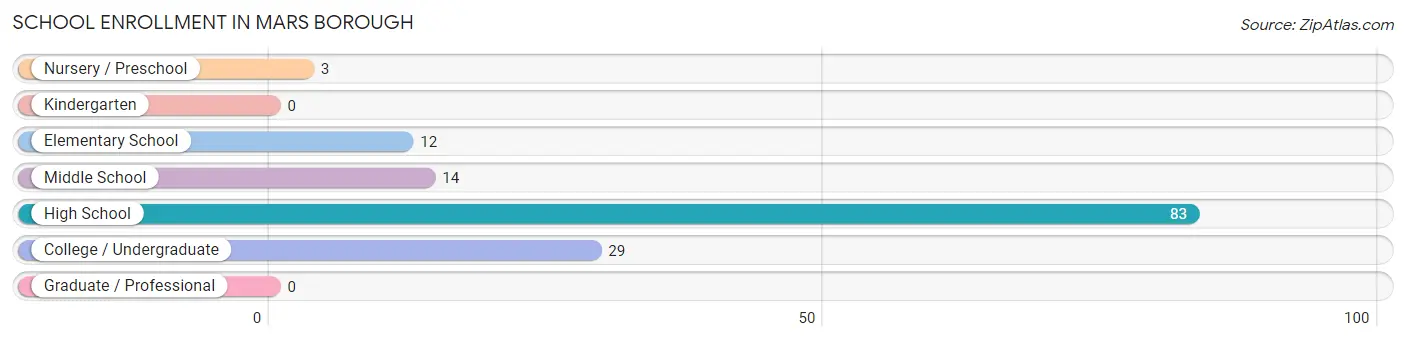
The most common levels of schooling among the 141 students in Mars borough are high school (83 | 58.9%), college / undergraduate (29 | 20.6%), and middle school (14 | 9.9%).
| School Level | # Students | % Students |
| Nursery / Preschool | 3 | 2.1% |
| Kindergarten | 0 | 0.0% |
| Elementary School | 12 | 8.5% |
| Middle School | 14 | 9.9% |
| High School | 83 | 58.9% |
| College / Undergraduate | 29 | 20.6% |
| Graduate / Professional | 0 | 0.0% |
| Total | 141 | 100.0% |
School Enrollment by Age by Funding Source in Mars borough
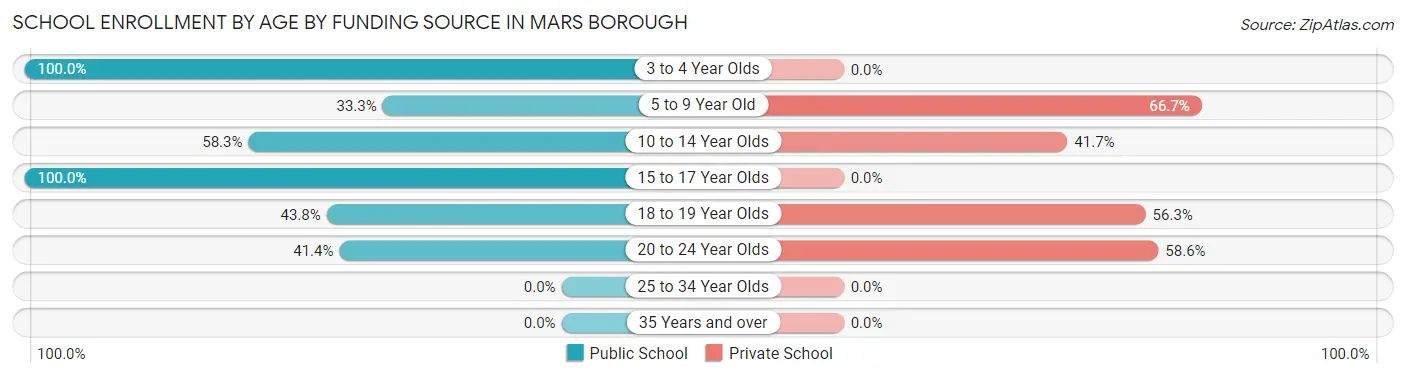
Out of a total of 141 students who are enrolled in schools in Mars borough, 53 (37.6%) attend a private institution, while the remaining 88 (62.4%) are enrolled in public schools. The age group of 5 to 9 year old has the highest likelihood of being enrolled in private schools, with 8 (66.7% in the age bracket) enrolled. Conversely, the age group of 3 to 4 year olds has the lowest likelihood of being enrolled in a private school, with 3 (100.0% in the age bracket) attending a public institution.
| Age Bracket | Public School | Private School |
| 3 to 4 Year Olds | 3 (100.0%) | 0 (0.0%) |
| 5 to 9 Year Old | 4 (33.3%) | 8 (66.7%) |
| 10 to 14 Year Olds | 14 (58.3%) | 10 (41.7%) |
| 15 to 17 Year Olds | 41 (100.0%) | 0 (0.0%) |
| 18 to 19 Year Olds | 14 (43.8%) | 18 (56.2%) |
| 20 to 24 Year Olds | 12 (41.4%) | 17 (58.6%) |
| 25 to 34 Year Olds | 0 (0.0%) | 0 (0.0%) |
| 35 Years and over | 0 (0.0%) | 0 (0.0%) |
| Total | 88 (62.4%) | 53 (37.6%) |
Educational Attainment by Field of Study in Mars borough
Business (59 | 25.1%), education (38 | 16.2%), social sciences (30 | 12.8%), science & technology (27 | 11.5%), and physical & health sciences (26 | 11.1%) are the most common fields of study among 235 individuals in Mars borough who have obtained a bachelor's degree or higher.
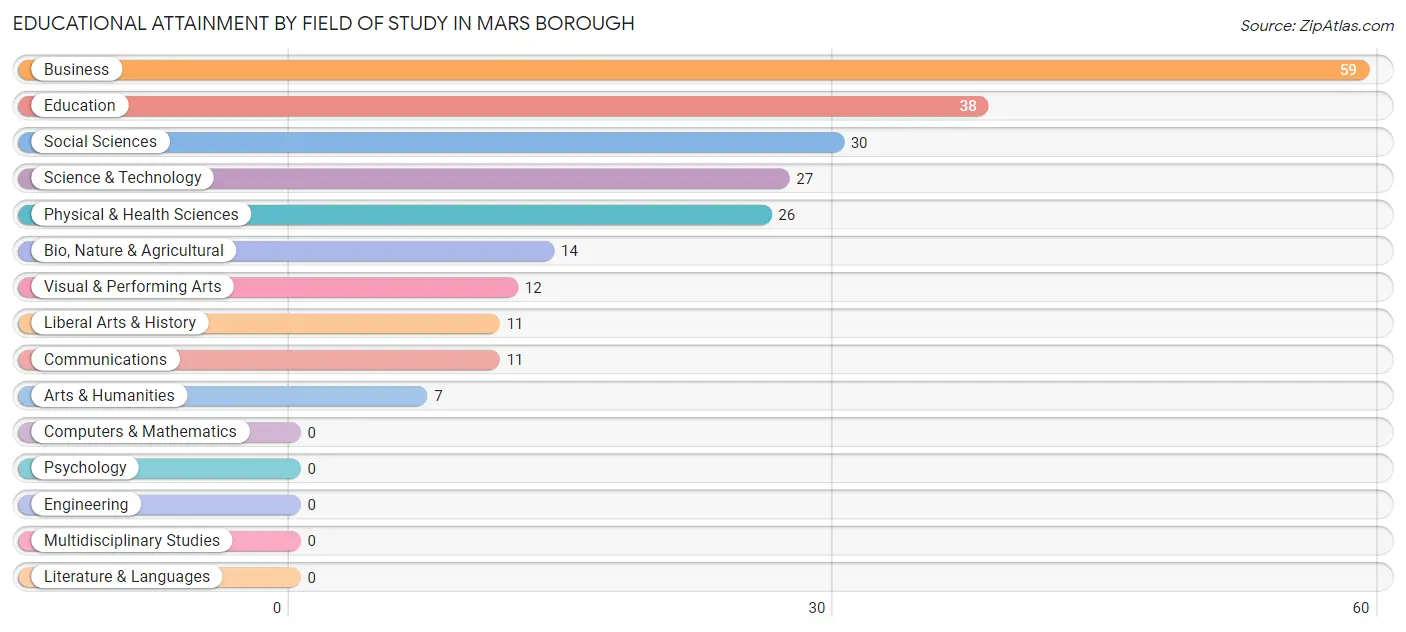
| Field of Study | # Graduates | % Graduates |
| Computers & Mathematics | 0 | 0.0% |
| Bio, Nature & Agricultural | 14 | 6.0% |
| Physical & Health Sciences | 26 | 11.1% |
| Psychology | 0 | 0.0% |
| Social Sciences | 30 | 12.8% |
| Engineering | 0 | 0.0% |
| Multidisciplinary Studies | 0 | 0.0% |
| Science & Technology | 27 | 11.5% |
| Business | 59 | 25.1% |
| Education | 38 | 16.2% |
| Literature & Languages | 0 | 0.0% |
| Liberal Arts & History | 11 | 4.7% |
| Visual & Performing Arts | 12 | 5.1% |
| Communications | 11 | 4.7% |
| Arts & Humanities | 7 | 3.0% |
| Total | 235 | 100.0% |
Transportation & Commute in Mars borough
Vehicle Availability by Sex in Mars borough
The most prevalent vehicle ownership categories in Mars borough are males with 2 vehicles (197, accounting for 60.4%) and females with 2 vehicles (98, making up 79.4%).
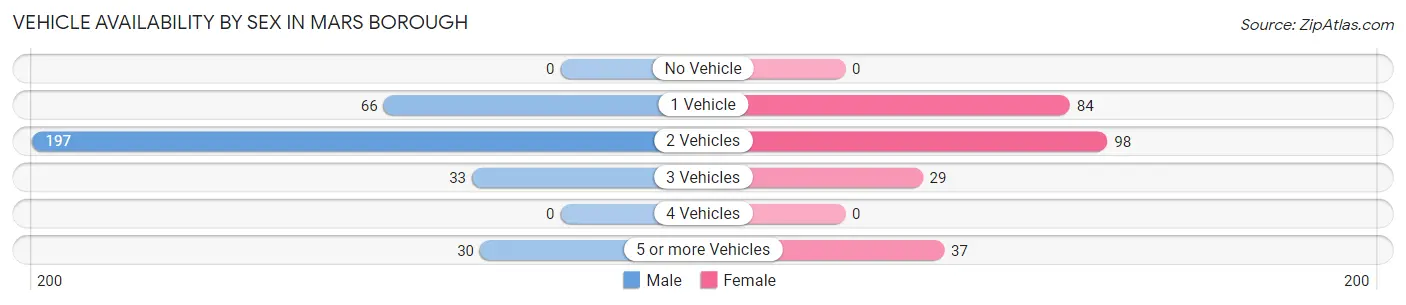
| Vehicles Available | Male | Female |
| No Vehicle | 0 (0.0%) | 0 (0.0%) |
| 1 Vehicle | 66 (20.3%) | 84 (33.9%) |
| 2 Vehicles | 197 (60.4%) | 98 (39.5%) |
| 3 Vehicles | 33 (10.1%) | 29 (11.7%) |
| 4 Vehicles | 0 (0.0%) | 0 (0.0%) |
| 5 or more Vehicles | 30 (9.2%) | 37 (14.9%) |
| Total | 326 (100.0%) | 248 (100.0%) |
Commute Time in Mars borough
The most frequently occuring commute durations in Mars borough are 5 to 9 minutes (118 commuters, 22.2%), 30 to 34 minutes (77 commuters, 14.5%), and less than 5 minutes (69 commuters, 13.0%).
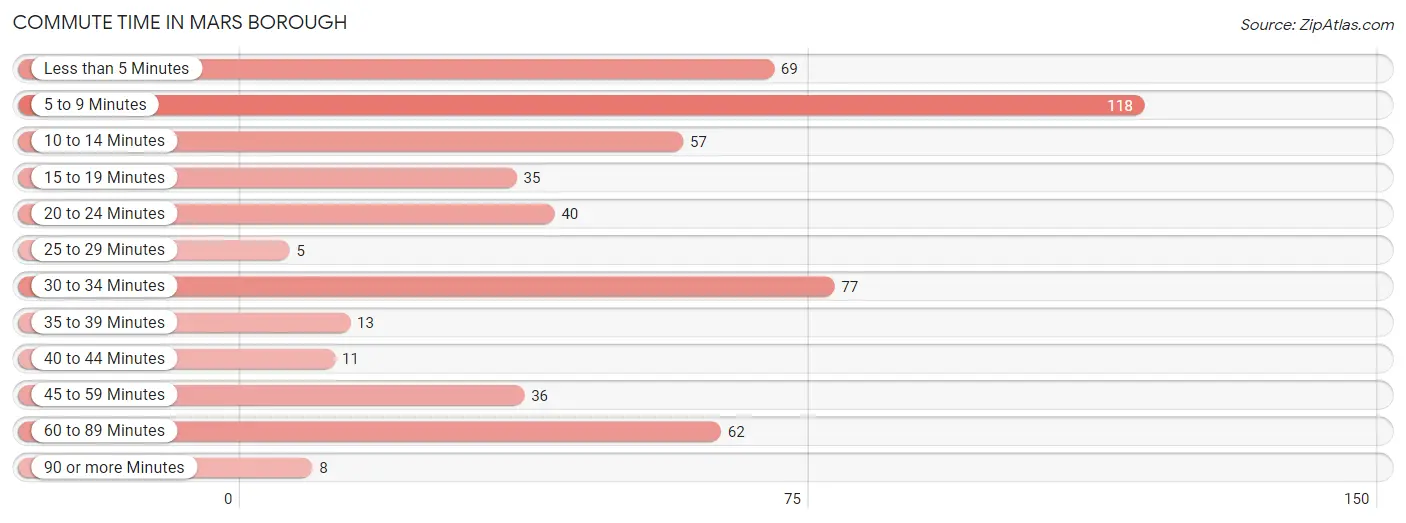
| Commute Time | # Commuters | % Commuters |
| Less than 5 Minutes | 69 | 13.0% |
| 5 to 9 Minutes | 118 | 22.2% |
| 10 to 14 Minutes | 57 | 10.7% |
| 15 to 19 Minutes | 35 | 6.6% |
| 20 to 24 Minutes | 40 | 7.5% |
| 25 to 29 Minutes | 5 | 0.9% |
| 30 to 34 Minutes | 77 | 14.5% |
| 35 to 39 Minutes | 13 | 2.5% |
| 40 to 44 Minutes | 11 | 2.1% |
| 45 to 59 Minutes | 36 | 6.8% |
| 60 to 89 Minutes | 62 | 11.7% |
| 90 or more Minutes | 8 | 1.5% |
Commute Time by Sex in Mars borough
The most common commute times in Mars borough are 30 to 34 minutes (67 commuters, 22.0%) for males and 5 to 9 minutes (67 commuters, 29.5%) for females.
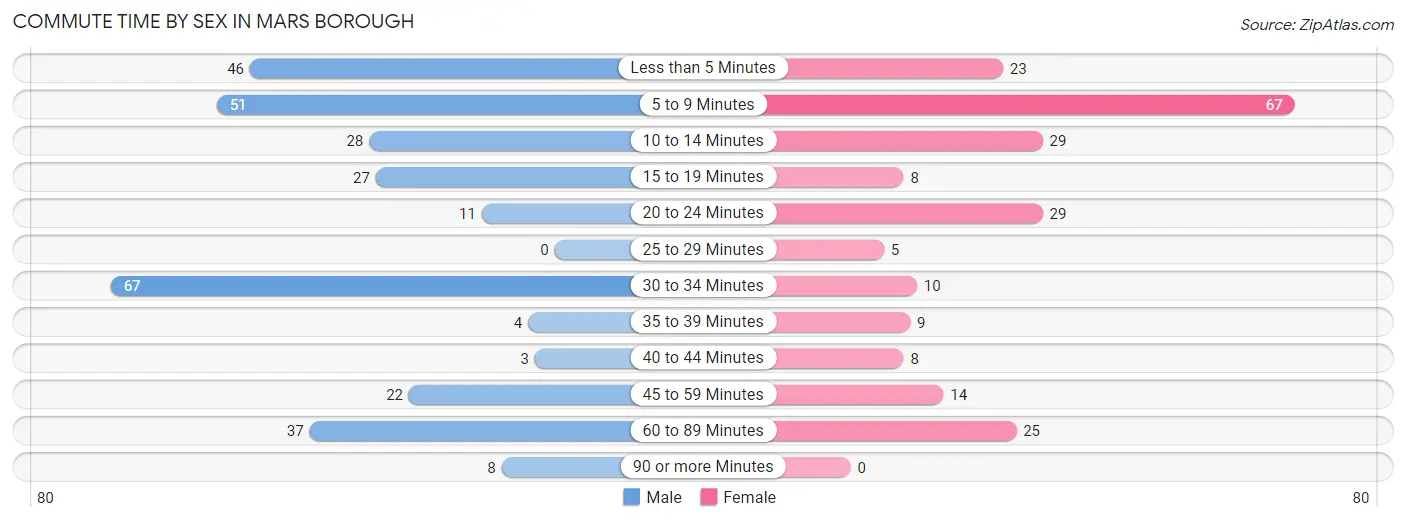
| Commute Time | Male | Female |
| Less than 5 Minutes | 46 (15.1%) | 23 (10.1%) |
| 5 to 9 Minutes | 51 (16.8%) | 67 (29.5%) |
| 10 to 14 Minutes | 28 (9.2%) | 29 (12.8%) |
| 15 to 19 Minutes | 27 (8.9%) | 8 (3.5%) |
| 20 to 24 Minutes | 11 (3.6%) | 29 (12.8%) |
| 25 to 29 Minutes | 0 (0.0%) | 5 (2.2%) |
| 30 to 34 Minutes | 67 (22.0%) | 10 (4.4%) |
| 35 to 39 Minutes | 4 (1.3%) | 9 (4.0%) |
| 40 to 44 Minutes | 3 (1.0%) | 8 (3.5%) |
| 45 to 59 Minutes | 22 (7.2%) | 14 (6.2%) |
| 60 to 89 Minutes | 37 (12.2%) | 25 (11.0%) |
| 90 or more Minutes | 8 (2.6%) | 0 (0.0%) |
Time of Departure to Work by Sex in Mars borough
The most frequent times of departure to work in Mars borough are 12:00 AM to 4:59 AM (33, 10.9%) for males and 8:30 AM to 8:59 AM (40, 17.6%) for females.
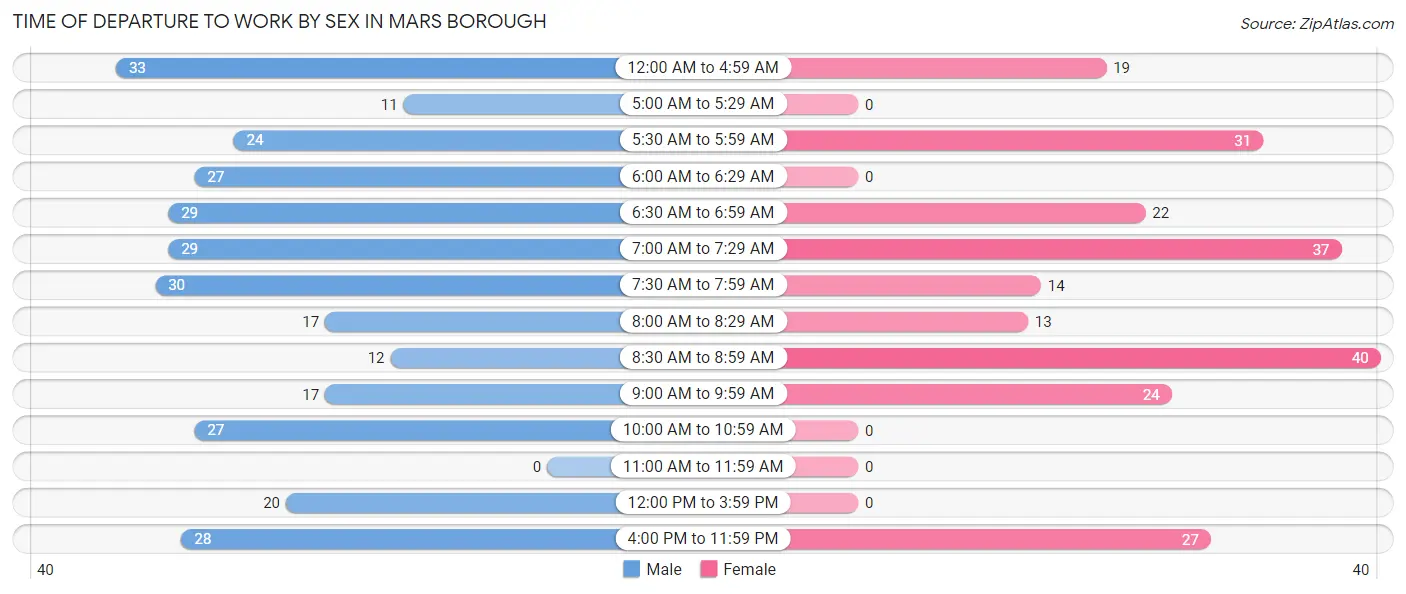
| Time of Departure | Male | Female |
| 12:00 AM to 4:59 AM | 33 (10.9%) | 19 (8.4%) |
| 5:00 AM to 5:29 AM | 11 (3.6%) | 0 (0.0%) |
| 5:30 AM to 5:59 AM | 24 (7.9%) | 31 (13.7%) |
| 6:00 AM to 6:29 AM | 27 (8.9%) | 0 (0.0%) |
| 6:30 AM to 6:59 AM | 29 (9.5%) | 22 (9.7%) |
| 7:00 AM to 7:29 AM | 29 (9.5%) | 37 (16.3%) |
| 7:30 AM to 7:59 AM | 30 (9.9%) | 14 (6.2%) |
| 8:00 AM to 8:29 AM | 17 (5.6%) | 13 (5.7%) |
| 8:30 AM to 8:59 AM | 12 (4.0%) | 40 (17.6%) |
| 9:00 AM to 9:59 AM | 17 (5.6%) | 24 (10.6%) |
| 10:00 AM to 10:59 AM | 27 (8.9%) | 0 (0.0%) |
| 11:00 AM to 11:59 AM | 0 (0.0%) | 0 (0.0%) |
| 12:00 PM to 3:59 PM | 20 (6.6%) | 0 (0.0%) |
| 4:00 PM to 11:59 PM | 28 (9.2%) | 27 (11.9%) |
| Total | 304 (100.0%) | 227 (100.0%) |
Housing Occupancy in Mars borough
Occupancy by Ownership in Mars borough
Of the total 574 dwellings in Mars borough, owner-occupied units account for 304 (53.0%), while renter-occupied units make up 270 (47.0%).
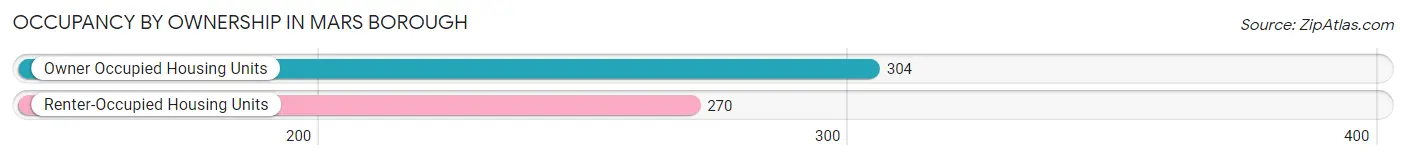
| Occupancy | # Housing Units | % Housing Units |
| Owner Occupied Housing Units | 304 | 53.0% |
| Renter-Occupied Housing Units | 270 | 47.0% |
| Total Occupied Housing Units | 574 | 100.0% |
Occupancy by Household Size in Mars borough
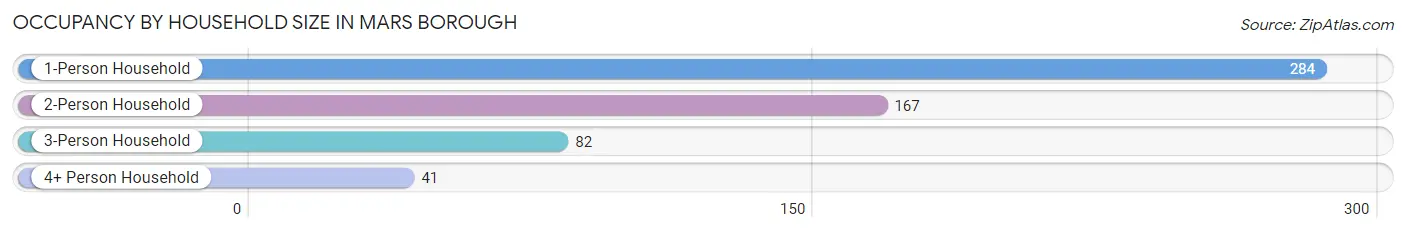
| Household Size | # Housing Units | % Housing Units |
| 1-Person Household | 284 | 49.5% |
| 2-Person Household | 167 | 29.1% |
| 3-Person Household | 82 | 14.3% |
| 4+ Person Household | 41 | 7.1% |
| Total Housing Units | 574 | 100.0% |
Occupancy by Ownership by Household Size in Mars borough
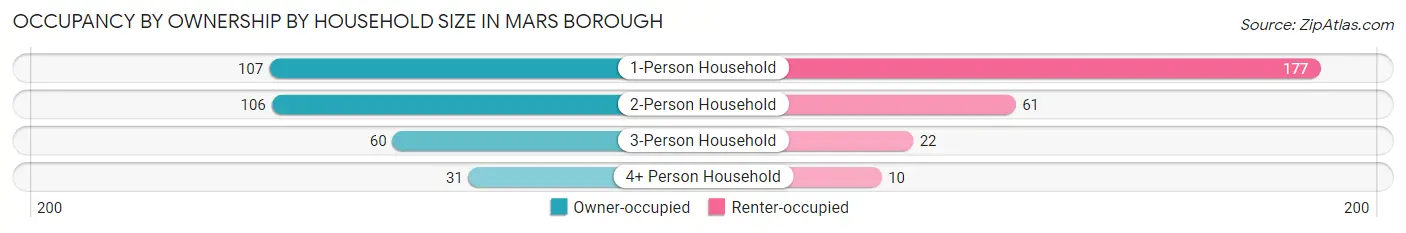
| Household Size | Owner-occupied | Renter-occupied |
| 1-Person Household | 107 (37.7%) | 177 (62.3%) |
| 2-Person Household | 106 (63.5%) | 61 (36.5%) |
| 3-Person Household | 60 (73.2%) | 22 (26.8%) |
| 4+ Person Household | 31 (75.6%) | 10 (24.4%) |
| Total Housing Units | 304 (53.0%) | 270 (47.0%) |
Occupancy by Educational Attainment in Mars borough
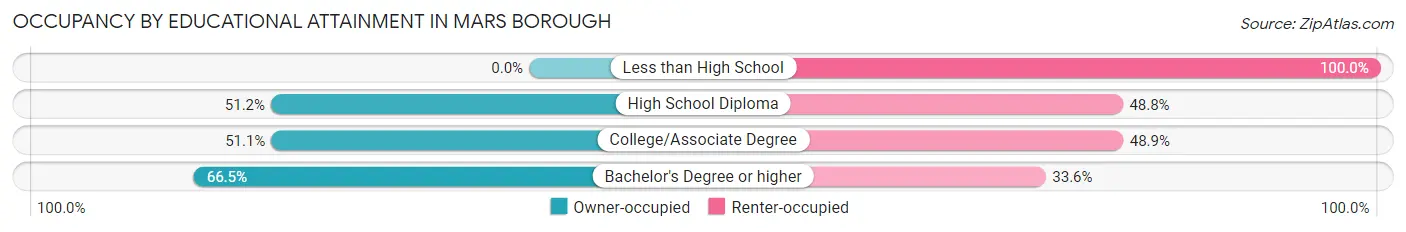
| Household Size | Owner-occupied | Renter-occupied |
| Less than High School | 0 (0.0%) | 26 (100.0%) |
| High School Diploma | 109 (51.2%) | 104 (48.8%) |
| College/Associate Degree | 92 (51.1%) | 88 (48.9%) |
| Bachelor's Degree or higher | 103 (66.4%) | 52 (33.6%) |
Occupancy by Age of Householder in Mars borough
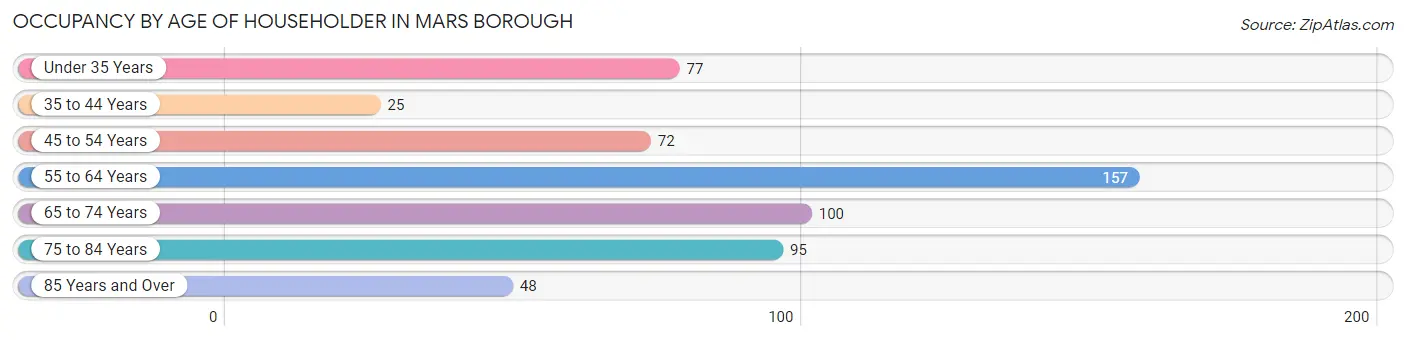
| Age Bracket | # Households | % Households |
| Under 35 Years | 77 | 13.4% |
| 35 to 44 Years | 25 | 4.4% |
| 45 to 54 Years | 72 | 12.5% |
| 55 to 64 Years | 157 | 27.4% |
| 65 to 74 Years | 100 | 17.4% |
| 75 to 84 Years | 95 | 16.6% |
| 85 Years and Over | 48 | 8.4% |
| Total | 574 | 100.0% |
Housing Finances in Mars borough
Median Income by Occupancy in Mars borough
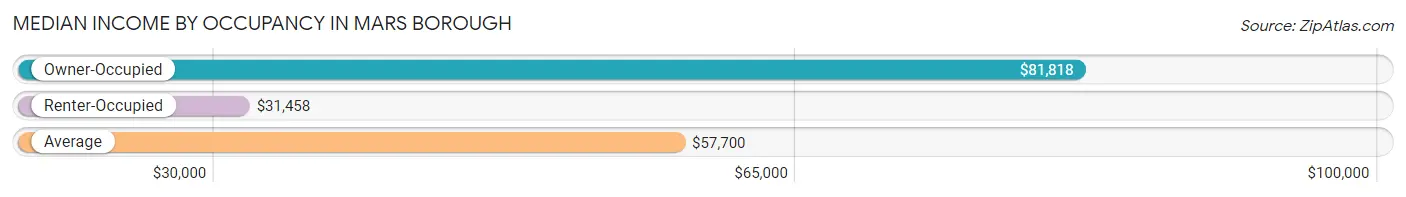
| Occupancy Type | # Households | Median Income |
| Owner-Occupied | 304 (53.0%) | $81,818 |
| Renter-Occupied | 270 (47.0%) | $31,458 |
| Average | 574 (100.0%) | $57,700 |
Occupancy by Householder Income Bracket in Mars borough
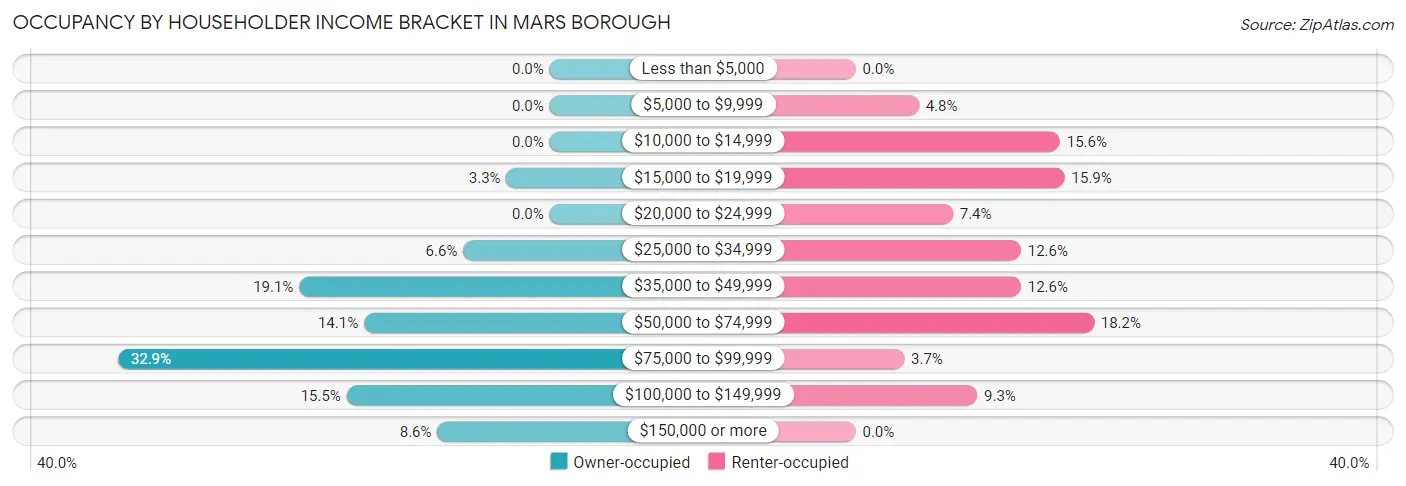
| Income Bracket | Owner-occupied | Renter-occupied |
| Less than $5,000 | 0 (0.0%) | 0 (0.0%) |
| $5,000 to $9,999 | 0 (0.0%) | 13 (4.8%) |
| $10,000 to $14,999 | 0 (0.0%) | 42 (15.6%) |
| $15,000 to $19,999 | 10 (3.3%) | 43 (15.9%) |
| $20,000 to $24,999 | 0 (0.0%) | 20 (7.4%) |
| $25,000 to $34,999 | 20 (6.6%) | 34 (12.6%) |
| $35,000 to $49,999 | 58 (19.1%) | 34 (12.6%) |
| $50,000 to $74,999 | 43 (14.1%) | 49 (18.1%) |
| $75,000 to $99,999 | 100 (32.9%) | 10 (3.7%) |
| $100,000 to $149,999 | 47 (15.5%) | 25 (9.3%) |
| $150,000 or more | 26 (8.6%) | 0 (0.0%) |
| Total | 304 (100.0%) | 270 (100.0%) |
Monthly Housing Cost Tiers in Mars borough
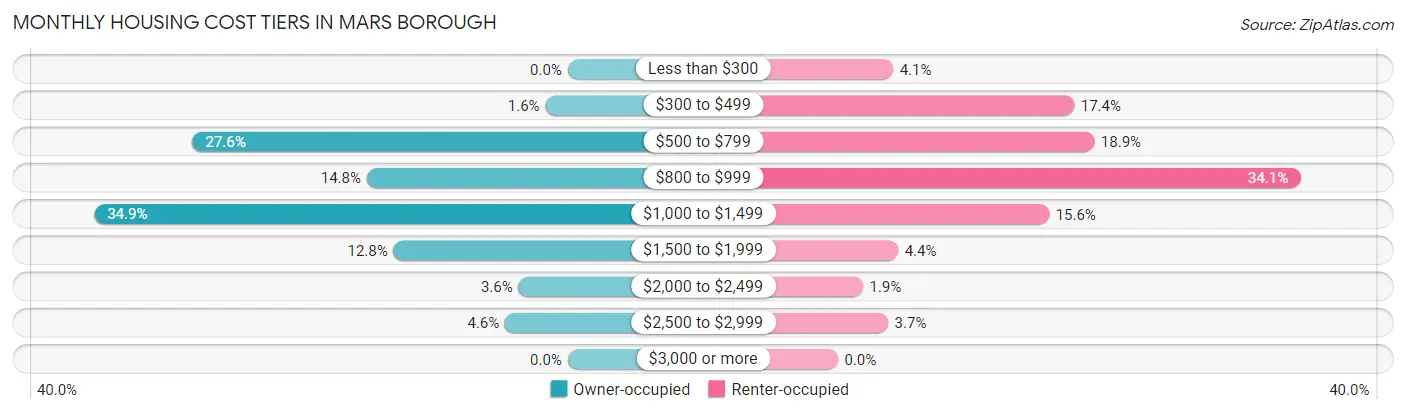
| Monthly Cost | Owner-occupied | Renter-occupied |
| Less than $300 | 0 (0.0%) | 11 (4.1%) |
| $300 to $499 | 5 (1.6%) | 47 (17.4%) |
| $500 to $799 | 84 (27.6%) | 51 (18.9%) |
| $800 to $999 | 45 (14.8%) | 92 (34.1%) |
| $1,000 to $1,499 | 106 (34.9%) | 42 (15.6%) |
| $1,500 to $1,999 | 39 (12.8%) | 12 (4.4%) |
| $2,000 to $2,499 | 11 (3.6%) | 5 (1.8%) |
| $2,500 to $2,999 | 14 (4.6%) | 10 (3.7%) |
| $3,000 or more | 0 (0.0%) | 0 (0.0%) |
| Total | 304 (100.0%) | 270 (100.0%) |
Physical Housing Characteristics in Mars borough
Housing Structures in Mars borough
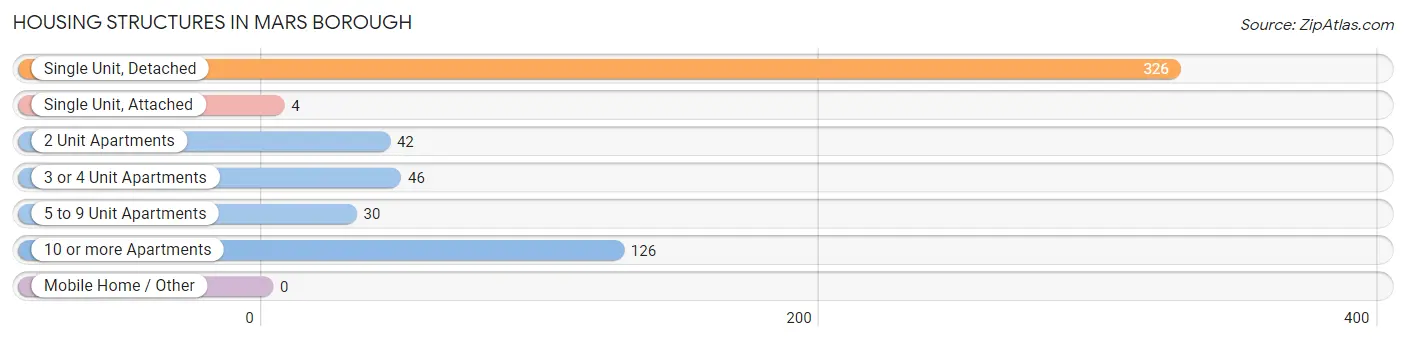
| Structure Type | # Housing Units | % Housing Units |
| Single Unit, Detached | 326 | 56.8% |
| Single Unit, Attached | 4 | 0.7% |
| 2 Unit Apartments | 42 | 7.3% |
| 3 or 4 Unit Apartments | 46 | 8.0% |
| 5 to 9 Unit Apartments | 30 | 5.2% |
| 10 or more Apartments | 126 | 22.0% |
| Mobile Home / Other | 0 | 0.0% |
| Total | 574 | 100.0% |
Housing Structures by Occupancy in Mars borough
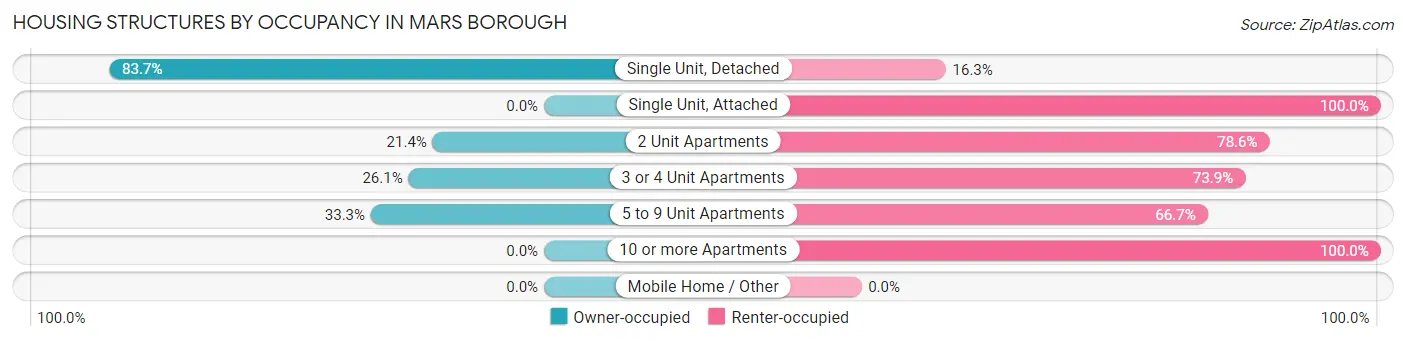
| Structure Type | Owner-occupied | Renter-occupied |
| Single Unit, Detached | 273 (83.7%) | 53 (16.3%) |
| Single Unit, Attached | 0 (0.0%) | 4 (100.0%) |
| 2 Unit Apartments | 9 (21.4%) | 33 (78.6%) |
| 3 or 4 Unit Apartments | 12 (26.1%) | 34 (73.9%) |
| 5 to 9 Unit Apartments | 10 (33.3%) | 20 (66.7%) |
| 10 or more Apartments | 0 (0.0%) | 126 (100.0%) |
| Mobile Home / Other | 0 (0.0%) | 0 (0.0%) |
| Total | 304 (53.0%) | 270 (47.0%) |
Housing Structures by Number of Rooms in Mars borough
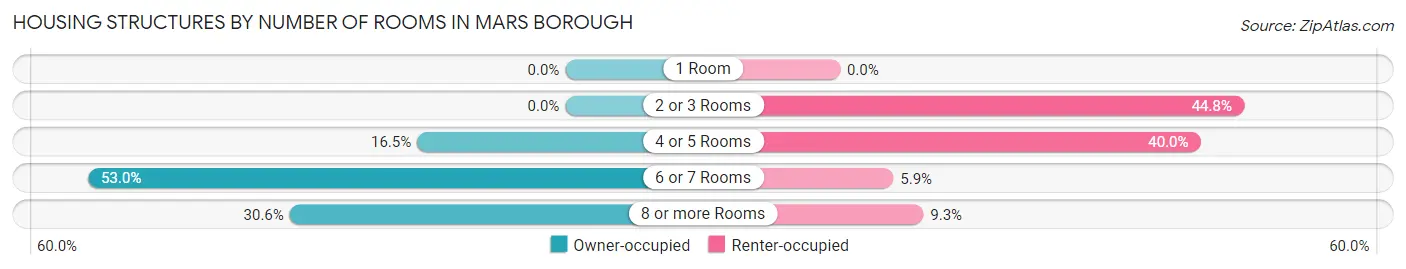
| Number of Rooms | Owner-occupied | Renter-occupied |
| 1 Room | 0 (0.0%) | 0 (0.0%) |
| 2 or 3 Rooms | 0 (0.0%) | 121 (44.8%) |
| 4 or 5 Rooms | 50 (16.5%) | 108 (40.0%) |
| 6 or 7 Rooms | 161 (53.0%) | 16 (5.9%) |
| 8 or more Rooms | 93 (30.6%) | 25 (9.3%) |
| Total | 304 (100.0%) | 270 (100.0%) |
Housing Structure by Heating Type in Mars borough
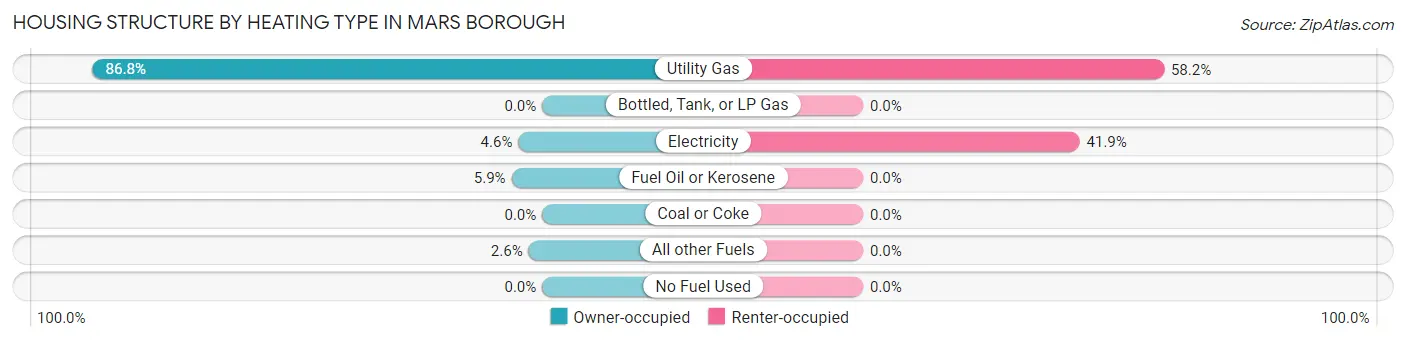
| Heating Type | Owner-occupied | Renter-occupied |
| Utility Gas | 264 (86.8%) | 157 (58.2%) |
| Bottled, Tank, or LP Gas | 0 (0.0%) | 0 (0.0%) |
| Electricity | 14 (4.6%) | 113 (41.8%) |
| Fuel Oil or Kerosene | 18 (5.9%) | 0 (0.0%) |
| Coal or Coke | 0 (0.0%) | 0 (0.0%) |
| All other Fuels | 8 (2.6%) | 0 (0.0%) |
| No Fuel Used | 0 (0.0%) | 0 (0.0%) |
| Total | 304 (100.0%) | 270 (100.0%) |
Household Vehicle Usage in Mars borough
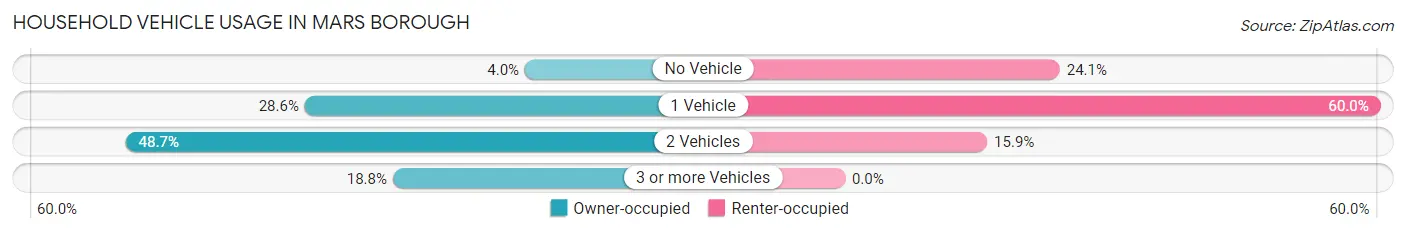
| Vehicles per Household | Owner-occupied | Renter-occupied |
| No Vehicle | 12 (4.0%) | 65 (24.1%) |
| 1 Vehicle | 87 (28.6%) | 162 (60.0%) |
| 2 Vehicles | 148 (48.7%) | 43 (15.9%) |
| 3 or more Vehicles | 57 (18.8%) | 0 (0.0%) |
| Total | 304 (100.0%) | 270 (100.0%) |
Real Estate & Mortgages in Mars borough
Real Estate and Mortgage Overview in Mars borough
| Characteristic | Without Mortgage | With Mortgage |
| Housing Units | 122 | 182 |
| Median Property Value | $295,700 | $259,300 |
| Median Household Income | $57,667 | $26 |
| Monthly Housing Costs | $782 | $0 |
| Real Estate Taxes | $2,833 | $0 |
Property Value by Mortgage Status in Mars borough
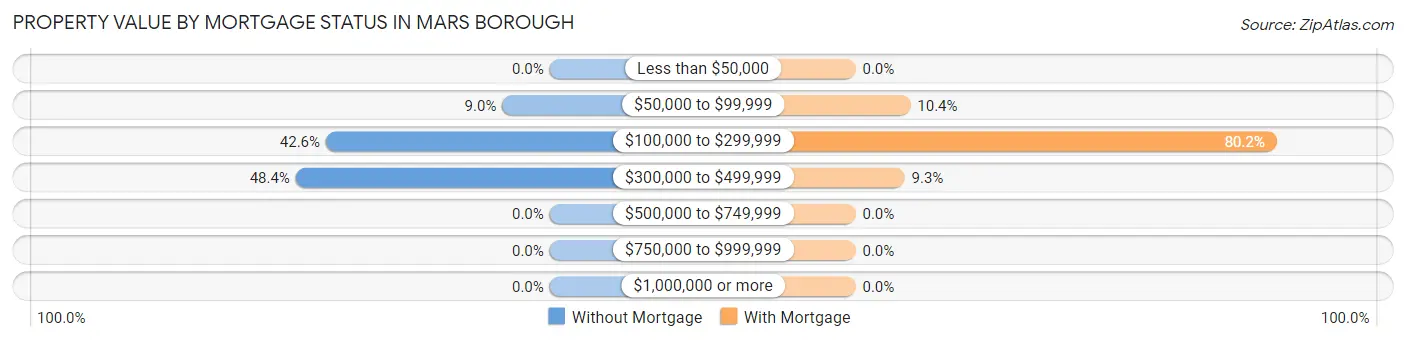
| Property Value | Without Mortgage | With Mortgage |
| Less than $50,000 | 0 (0.0%) | 0 (0.0%) |
| $50,000 to $99,999 | 11 (9.0%) | 19 (10.4%) |
| $100,000 to $299,999 | 52 (42.6%) | 146 (80.2%) |
| $300,000 to $499,999 | 59 (48.4%) | 17 (9.3%) |
| $500,000 to $749,999 | 0 (0.0%) | 0 (0.0%) |
| $750,000 to $999,999 | 0 (0.0%) | 0 (0.0%) |
| $1,000,000 or more | 0 (0.0%) | 0 (0.0%) |
| Total | 122 (100.0%) | 182 (100.0%) |
Household Income by Mortgage Status in Mars borough
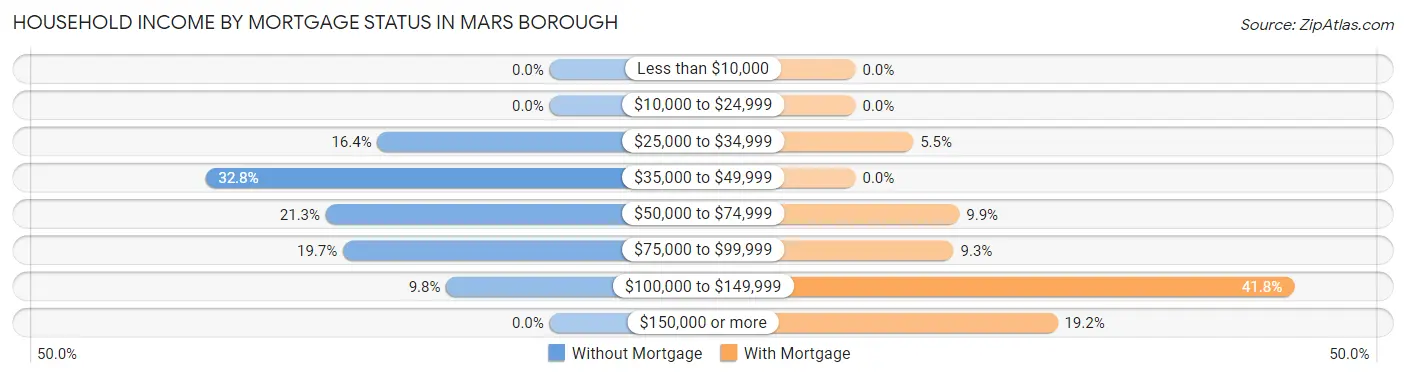
| Household Income | Without Mortgage | With Mortgage |
| Less than $10,000 | 0 (0.0%) | 0 (0.0%) |
| $10,000 to $24,999 | 0 (0.0%) | 0 (0.0%) |
| $25,000 to $34,999 | 20 (16.4%) | 10 (5.5%) |
| $35,000 to $49,999 | 40 (32.8%) | 0 (0.0%) |
| $50,000 to $74,999 | 26 (21.3%) | 18 (9.9%) |
| $75,000 to $99,999 | 24 (19.7%) | 17 (9.3%) |
| $100,000 to $149,999 | 12 (9.8%) | 76 (41.8%) |
| $150,000 or more | 0 (0.0%) | 35 (19.2%) |
| Total | 122 (100.0%) | 182 (100.0%) |
Property Value to Household Income Ratio in Mars borough
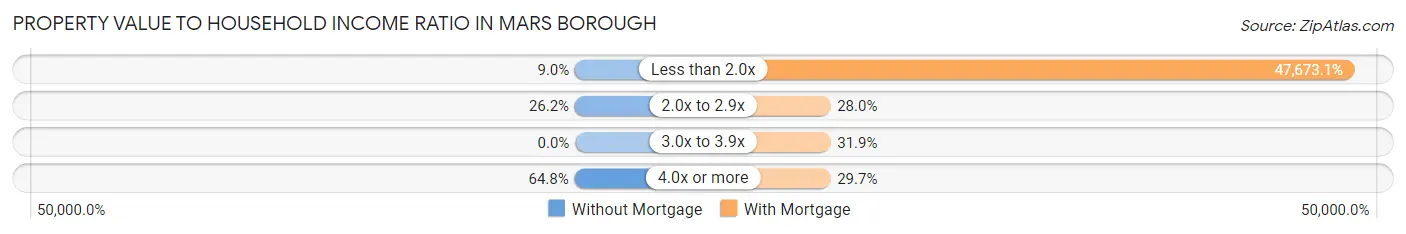
| Value-to-Income Ratio | Without Mortgage | With Mortgage |
| Less than 2.0x | 11 (9.0%) | 86,765 (47,673.1%) |
| 2.0x to 2.9x | 32 (26.2%) | 51 (28.0%) |
| 3.0x to 3.9x | 0 (0.0%) | 58 (31.9%) |
| 4.0x or more | 79 (64.7%) | 54 (29.7%) |
| Total | 122 (100.0%) | 182 (100.0%) |
Real Estate Taxes by Mortgage Status in Mars borough
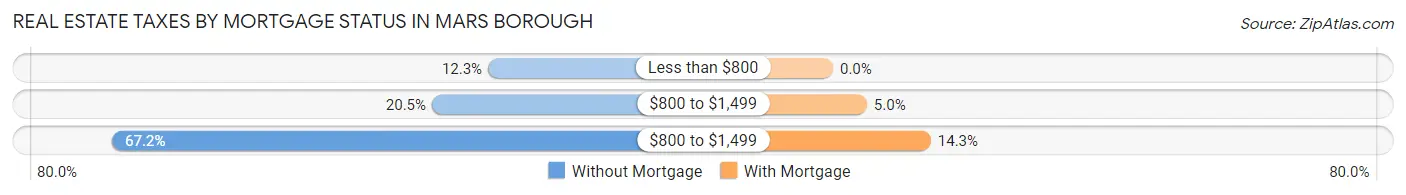
| Property Taxes | Without Mortgage | With Mortgage |
| Less than $800 | 15 (12.3%) | 0 (0.0%) |
| $800 to $1,499 | 25 (20.5%) | 9 (5.0%) |
| $800 to $1,499 | 82 (67.2%) | 26 (14.3%) |
| Total | 122 (100.0%) | 182 (100.0%) |
Health & Disability in Mars borough
Health Insurance Coverage by Age in Mars borough
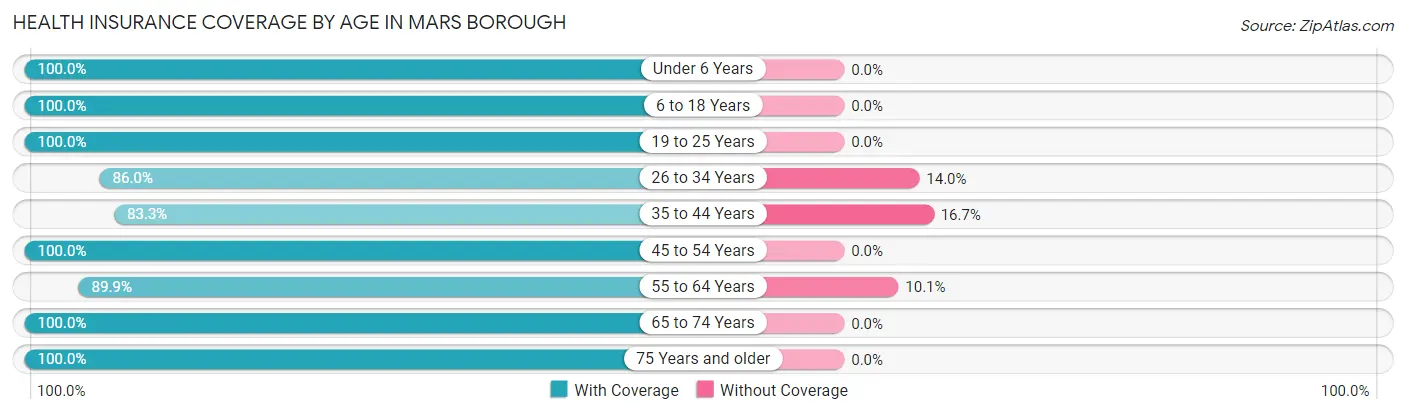
| Age Bracket | With Coverage | Without Coverage |
| Under 6 Years | 20 (100.0%) | 0 (0.0%) |
| 6 to 18 Years | 109 (100.0%) | 0 (0.0%) |
| 19 to 25 Years | 123 (100.0%) | 0 (0.0%) |
| 26 to 34 Years | 86 (86.0%) | 14 (14.0%) |
| 35 to 44 Years | 55 (83.3%) | 11 (16.7%) |
| 45 to 54 Years | 93 (100.0%) | 0 (0.0%) |
| 55 to 64 Years | 223 (89.9%) | 25 (10.1%) |
| 65 to 74 Years | 149 (100.0%) | 0 (0.0%) |
| 75 Years and older | 165 (100.0%) | 0 (0.0%) |
| Total | 1,023 (95.3%) | 50 (4.7%) |
Health Insurance Coverage by Citizenship Status in Mars borough
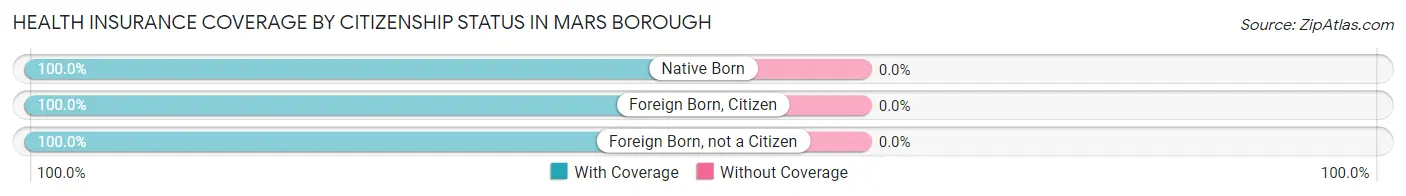
| Citizenship Status | With Coverage | Without Coverage |
| Native Born | 20 (100.0%) | 0 (0.0%) |
| Foreign Born, Citizen | 109 (100.0%) | 0 (0.0%) |
| Foreign Born, not a Citizen | 123 (100.0%) | 0 (0.0%) |
Health Insurance Coverage by Household Income in Mars borough
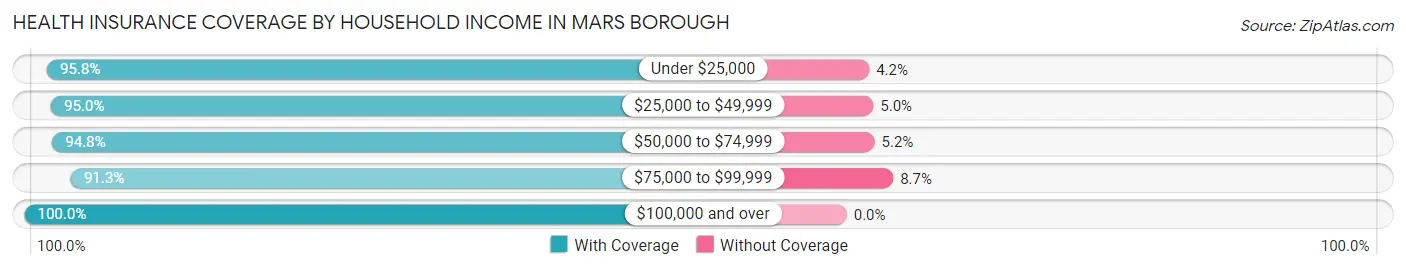
| Household Income | With Coverage | Without Coverage |
| Under $25,000 | 137 (95.8%) | 6 (4.2%) |
| $25,000 to $49,999 | 172 (95.0%) | 9 (5.0%) |
| $50,000 to $74,999 | 200 (94.8%) | 11 (5.2%) |
| $75,000 to $99,999 | 252 (91.3%) | 24 (8.7%) |
| $100,000 and over | 262 (100.0%) | 0 (0.0%) |
Public vs Private Health Insurance Coverage by Age in Mars borough
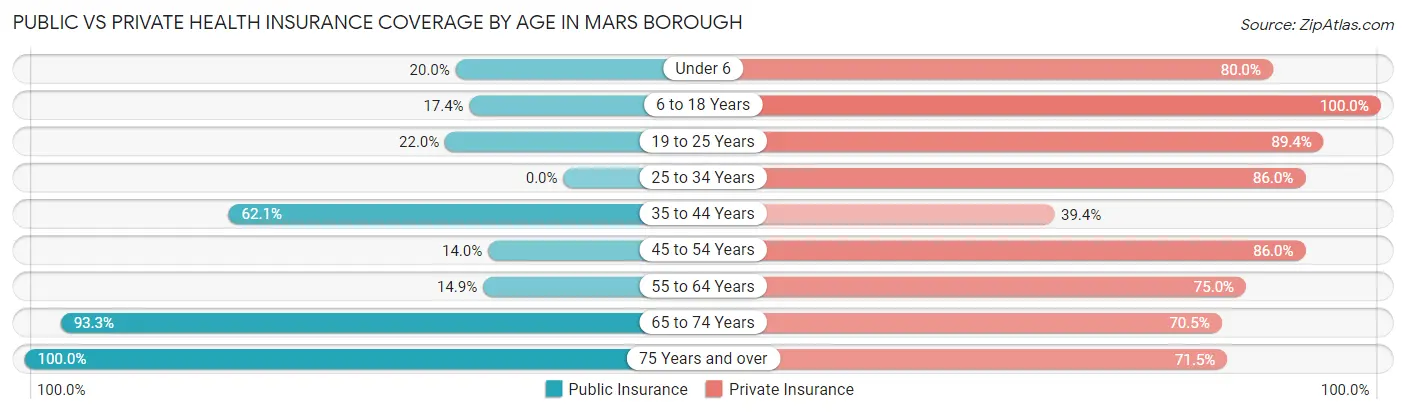
| Age Bracket | Public Insurance | Private Insurance |
| Under 6 | 4 (20.0%) | 16 (80.0%) |
| 6 to 18 Years | 19 (17.4%) | 109 (100.0%) |
| 19 to 25 Years | 27 (22.0%) | 110 (89.4%) |
| 25 to 34 Years | 0 (0.0%) | 86 (86.0%) |
| 35 to 44 Years | 41 (62.1%) | 26 (39.4%) |
| 45 to 54 Years | 13 (14.0%) | 80 (86.0%) |
| 55 to 64 Years | 37 (14.9%) | 186 (75.0%) |
| 65 to 74 Years | 139 (93.3%) | 105 (70.5%) |
| 75 Years and over | 165 (100.0%) | 118 (71.5%) |
| Total | 445 (41.5%) | 836 (77.9%) |
Disability Status by Sex by Age in Mars borough
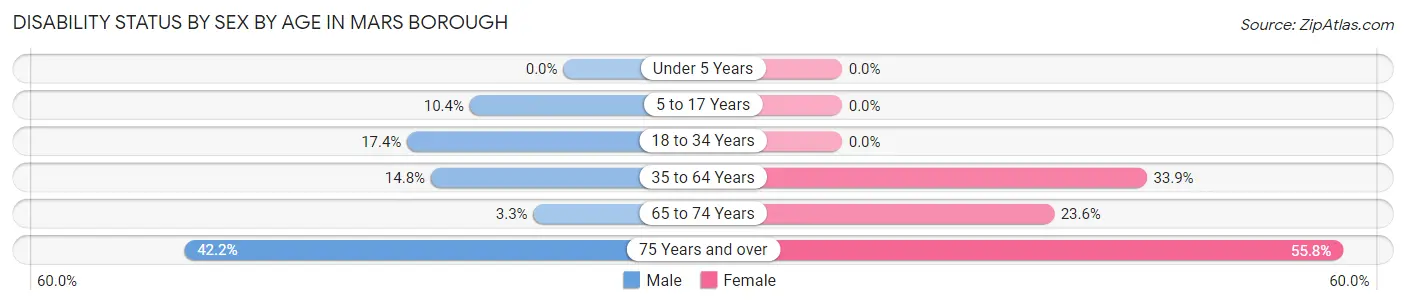
| Age Bracket | Male | Female |
| Under 5 Years | 0 (0.0%) | 0 (0.0%) |
| 5 to 17 Years | 5 (10.4%) | 0 (0.0%) |
| 18 to 34 Years | 28 (17.4%) | 0 (0.0%) |
| 35 to 64 Years | 27 (14.7%) | 76 (33.9%) |
| 65 to 74 Years | 2 (3.3%) | 21 (23.6%) |
| 75 Years and over | 19 (42.2%) | 67 (55.8%) |
Disability Class by Sex by Age in Mars borough
Disability Class: Hearing Difficulty
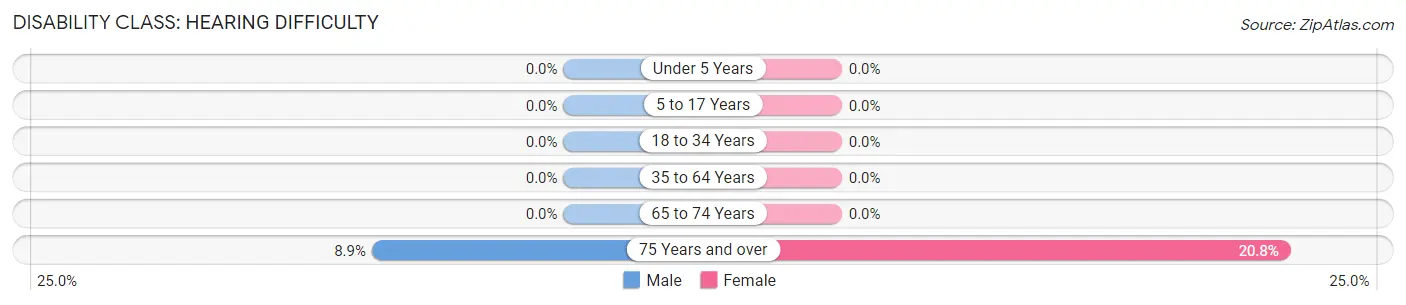
| Age Bracket | Male | Female |
| Under 5 Years | 0 (0.0%) | 0 (0.0%) |
| 5 to 17 Years | 0 (0.0%) | 0 (0.0%) |
| 18 to 34 Years | 0 (0.0%) | 0 (0.0%) |
| 35 to 64 Years | 0 (0.0%) | 0 (0.0%) |
| 65 to 74 Years | 0 (0.0%) | 0 (0.0%) |
| 75 Years and over | 4 (8.9%) | 25 (20.8%) |
Disability Class: Vision Difficulty
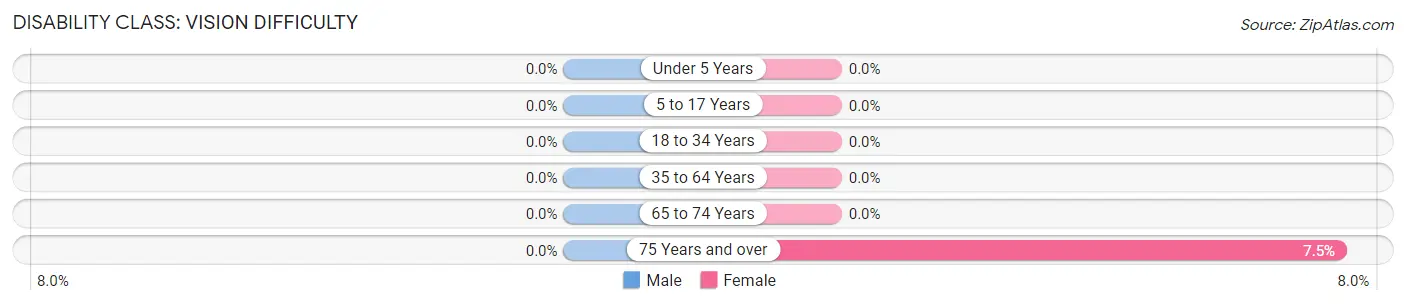
| Age Bracket | Male | Female |
| Under 5 Years | 0 (0.0%) | 0 (0.0%) |
| 5 to 17 Years | 0 (0.0%) | 0 (0.0%) |
| 18 to 34 Years | 0 (0.0%) | 0 (0.0%) |
| 35 to 64 Years | 0 (0.0%) | 0 (0.0%) |
| 65 to 74 Years | 0 (0.0%) | 0 (0.0%) |
| 75 Years and over | 0 (0.0%) | 9 (7.5%) |
Disability Class: Cognitive Difficulty
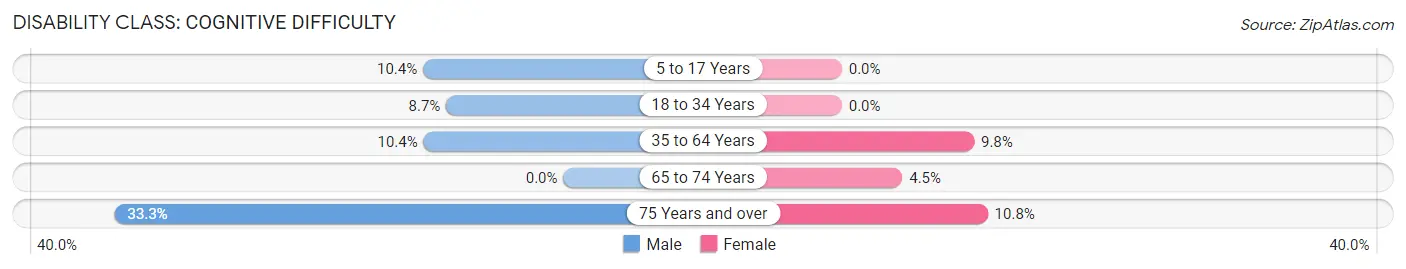
| Age Bracket | Male | Female |
| 5 to 17 Years | 5 (10.4%) | 0 (0.0%) |
| 18 to 34 Years | 14 (8.7%) | 0 (0.0%) |
| 35 to 64 Years | 19 (10.4%) | 22 (9.8%) |
| 65 to 74 Years | 0 (0.0%) | 4 (4.5%) |
| 75 Years and over | 15 (33.3%) | 13 (10.8%) |
Disability Class: Ambulatory Difficulty
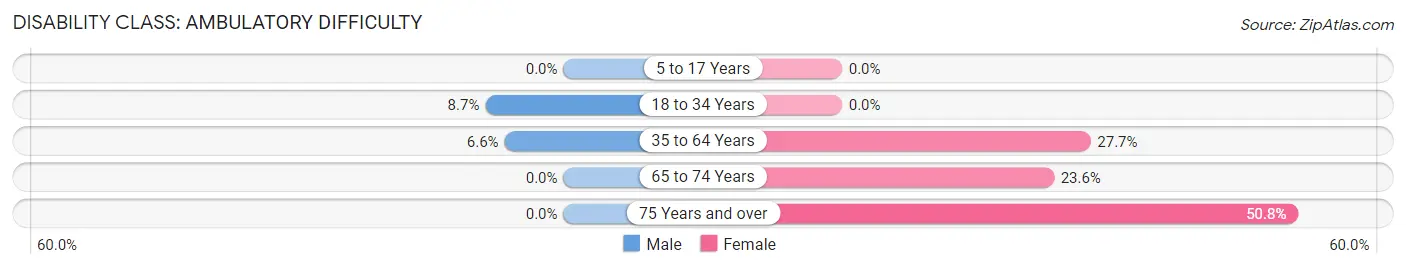
| Age Bracket | Male | Female |
| 5 to 17 Years | 0 (0.0%) | 0 (0.0%) |
| 18 to 34 Years | 14 (8.7%) | 0 (0.0%) |
| 35 to 64 Years | 12 (6.6%) | 62 (27.7%) |
| 65 to 74 Years | 0 (0.0%) | 21 (23.6%) |
| 75 Years and over | 0 (0.0%) | 61 (50.8%) |
Disability Class: Self-Care Difficulty
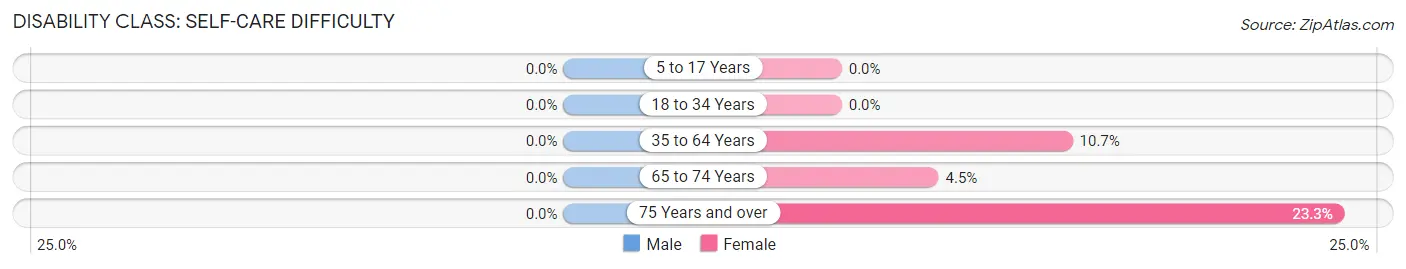
| Age Bracket | Male | Female |
| 5 to 17 Years | 0 (0.0%) | 0 (0.0%) |
| 18 to 34 Years | 0 (0.0%) | 0 (0.0%) |
| 35 to 64 Years | 0 (0.0%) | 24 (10.7%) |
| 65 to 74 Years | 0 (0.0%) | 4 (4.5%) |
| 75 Years and over | 0 (0.0%) | 28 (23.3%) |
Technology Access in Mars borough
Computing Device Access in Mars borough
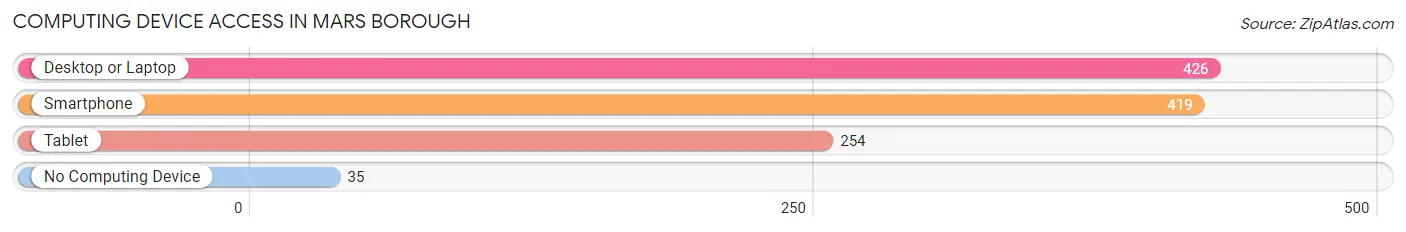
| Device Type | # Households | % Households |
| Desktop or Laptop | 426 | 74.2% |
| Smartphone | 419 | 73.0% |
| Tablet | 254 | 44.3% |
| No Computing Device | 35 | 6.1% |
| Total | 574 | 100.0% |
Internet Access in Mars borough
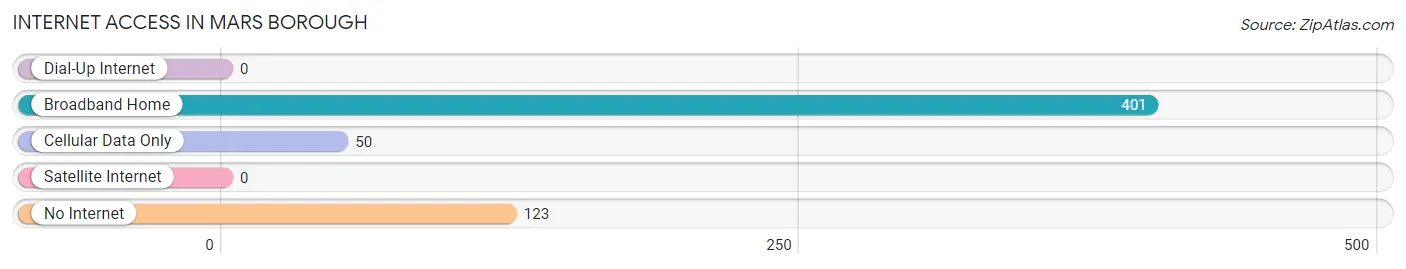
| Internet Type | # Households | % Households |
| Dial-Up Internet | 0 | 0.0% |
| Broadband Home | 401 | 69.9% |
| Cellular Data Only | 50 | 8.7% |
| Satellite Internet | 0 | 0.0% |
| No Internet | 123 | 21.4% |
| Total | 574 | 100.0% |
Mars borough Summary
Mars Borough is a small borough located in Butler County, Pennsylvania. It is situated approximately 25 miles north of Pittsburgh and is part of the Pittsburgh metropolitan area. The borough was incorporated in 1876 and has a population of approximately 3,000 people.
Geography
Mars Borough is located in the western part of Butler County, Pennsylvania. It is situated on the banks of the Connoquenessing Creek, which flows through the borough. The borough is bordered by Adams Township to the north, Middlesex Township to the east, Cranberry Township to the south, and Jackson Township to the west. The borough covers an area of 1.3 square miles and is located at an elevation of 890 feet above sea level.
The climate in Mars Borough is classified as humid continental, with hot summers and cold winters. The average annual temperature is around 50 degrees Fahrenheit, with an average high of around 75 degrees in the summer and an average low of around 25 degrees in the winter. The average annual precipitation is around 40 inches.
History
Mars Borough was first settled in the early 1800s by a group of settlers from Scotland. The borough was originally known as “Mars Hill” and was incorporated in 1876. The borough was named after the Roman god of war, Mars.
The borough was primarily an agricultural community until the late 19th century, when the railroad was built through the area. This allowed for the development of industry in the area, and the borough quickly grew in population.
In the early 20th century, the borough was home to several factories, including a steel mill, a glass factory, and a paper mill. These factories provided employment for many of the borough’s residents.
Economy
The economy of Mars Borough is primarily based on manufacturing and services. The borough is home to several factories, including a steel mill, a glass factory, and a paper mill. These factories provide employment for many of the borough’s residents.
The borough is also home to several retail stores, restaurants, and other businesses. The borough is served by several major highways, including Interstate 79 and the Pennsylvania Turnpike.
Demographics
As of the 2010 census, the population of Mars Borough was 3,039. The racial makeup of the borough was 97.3% White, 0.7% African American, 0.2% Native American, 0.7% Asian, and 0.9% from other races. Hispanic or Latino of any race were 1.2% of the population.
The median household income in the borough was $50,945, and the median family income was $60,945. The per capita income was $25,945. About 4.3% of families and 5.7% of the population were below the poverty line.
The population of Mars Borough is primarily composed of families. The median age of the borough’s residents is 43.3 years. The largest age group is 45-64, which makes up 33.2% of the population. The second largest age group is 25-44, which makes up 28.2% of the population. The third largest age group is 65 and over, which makes up 17.2% of the population.
Common Questions
What is Per Capita Income in Mars borough?
Per Capita income in Mars borough is $35,688.
What is the Median Family Income in Mars borough?
Median Family Income in Mars borough is $82,045.
What is the Median Household income in Mars borough?
Median Household Income in Mars borough is $57,700.
What is Income or Wage Gap in Mars borough?
Income or Wage Gap in Mars borough is 23.0%.
Women in Mars borough earn 77.0 cents for every dollar earned by a man.
What is Inequality or Gini Index in Mars borough?
Inequality or Gini Index in Mars borough is 0.42.
What is the Total Population of Mars borough?
Total Population of Mars borough is 1,169.
What is the Total Male Population of Mars borough?
Total Male Population of Mars borough is 512.
What is the Total Female Population of Mars borough?
Total Female Population of Mars borough is 657.
What is the Ratio of Males per 100 Females in Mars borough?
There are 77.93 Males per 100 Females in Mars borough.
What is the Ratio of Females per 100 Males in Mars borough?
There are 128.32 Females per 100 Males in Mars borough.
What is the Median Population Age in Mars borough?
Median Population Age in Mars borough is 58.2 Years.
What is the Average Family Size in Mars borough
Average Family Size in Mars borough is 2.7 People.
What is the Average Household Size in Mars borough
Average Household Size in Mars borough is 1.9 People.
How Large is the Labor Force in Mars borough?
There are 595 People in the Labor Forcein in Mars borough.
What is the Percentage of People in the Labor Force in Mars borough?
54.4% of People are in the Labor Force in Mars borough.
What is the Unemployment Rate in Mars borough?
Unemployment Rate in Mars borough is 2.7%.