Quarryville borough, PA Map & Demographics
Quarryville borough Overview
$32,122
PER CAPITA INCOME
$90,579
AVG FAMILY INCOME
$81,667
AVG HOUSEHOLD INCOME
41.1%
WAGE / INCOME GAP [ % ]
58.9¢/ $1
WAGE / INCOME GAP [ $ ]
0.38
INEQUALITY / GINI INDEX
2,833
TOTAL POPULATION
1,396
MALE POPULATION
1,437
FEMALE POPULATION
97.15
MALES / 100 FEMALES
102.94
FEMALES / 100 MALES
36.2
MEDIAN AGE
3.1
AVG FAMILY SIZE
2.8
AVG HOUSEHOLD SIZE
1,353
LABOR FORCE [ PEOPLE ]
64.9%
PERCENT IN LABOR FORCE
3.5%
UNEMPLOYMENT RATE
Income in Quarryville borough
Income Overview in Quarryville borough
Per Capita Income in Quarryville borough is $32,122, while median incomes of families and households are $90,579 and $81,667 respectively.
| Characteristic | Number | Measure |
| Per Capita Income | 2,833 | $32,122 |
| Median Family Income | 785 | $90,579 |
| Mean Family Income | 785 | $98,768 |
| Median Household Income | 1,032 | $81,667 |
| Mean Household Income | 1,032 | $86,153 |
| Income Deficit | 785 | $0 |
| Wage / Income Gap (%) | 2,833 | 41.07% |
| Wage / Income Gap ($) | 2,833 | 58.93¢ per $1 |
| Gini / Inequality Index | 2,833 | 0.38 |
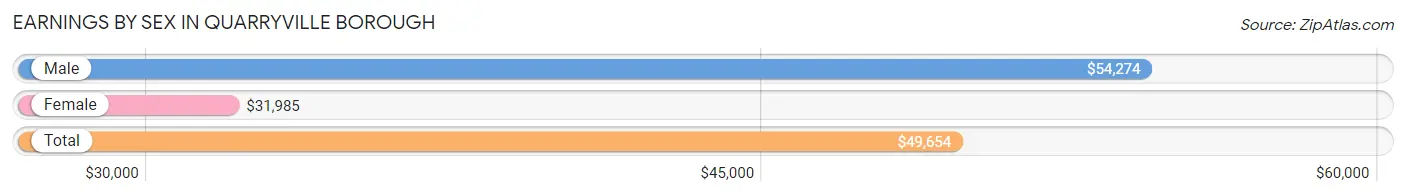
Earnings by Sex in Quarryville borough
Average Earnings in Quarryville borough are $49,654, $54,274 for men and $31,985 for women, a difference of 41.1%.
| Sex | Number | Average Earnings |
| Male | 718 (50.7%) | $54,274 |
| Female | 697 (49.3%) | $31,985 |
| Total | 1,415 (100.0%) | $49,654 |
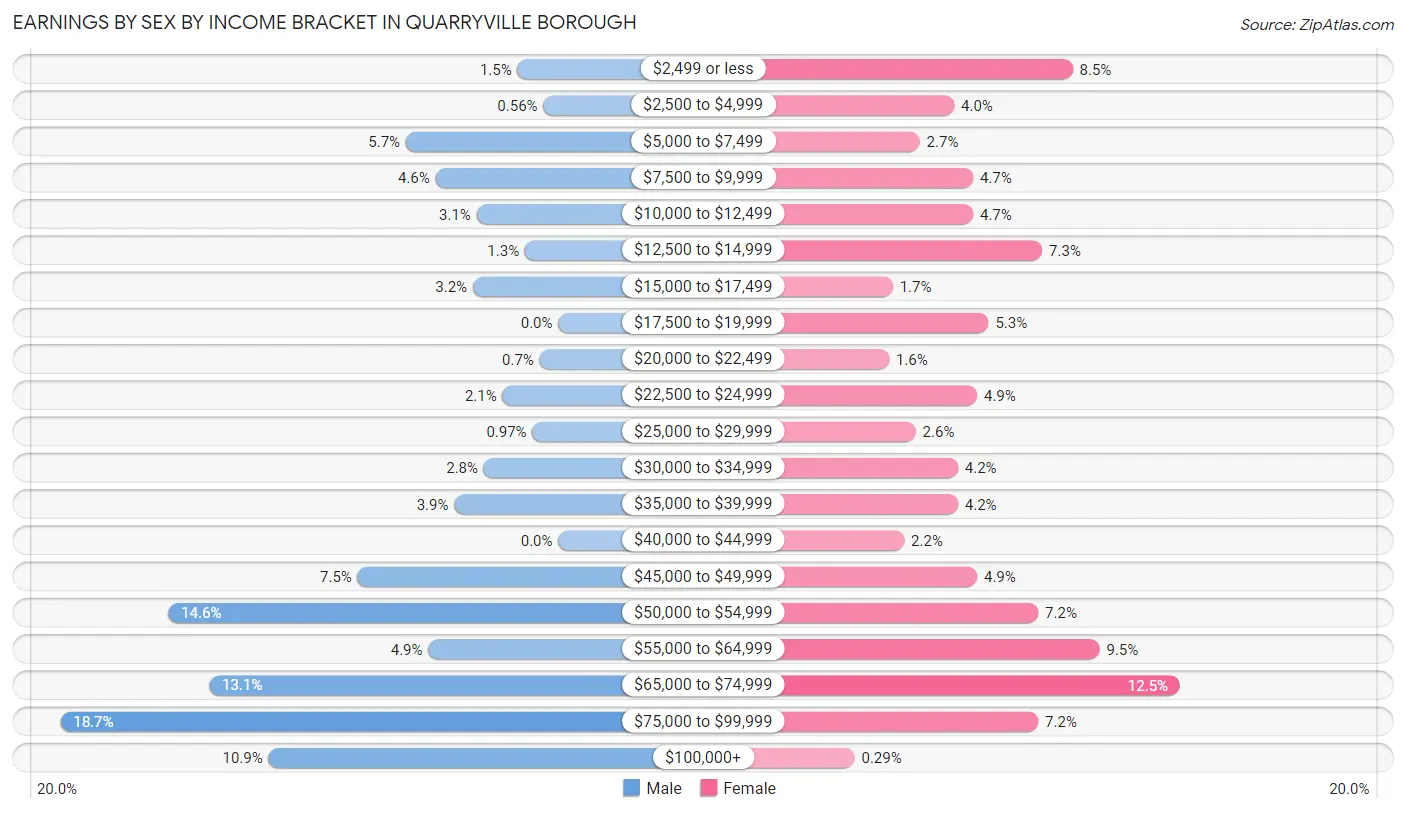
Earnings by Sex by Income Bracket in Quarryville borough
The most common earnings brackets in Quarryville borough are $75,000 to $99,999 for men (134 | 18.7%) and $65,000 to $74,999 for women (87 | 12.5%).
| Income | Male | Female |
| $2,499 or less | 11 (1.5%) | 59 (8.5%) |
| $2,500 to $4,999 | 4 (0.6%) | 28 (4.0%) |
| $5,000 to $7,499 | 41 (5.7%) | 19 (2.7%) |
| $7,500 to $9,999 | 33 (4.6%) | 33 (4.7%) |
| $10,000 to $12,499 | 22 (3.1%) | 33 (4.7%) |
| $12,500 to $14,999 | 9 (1.3%) | 51 (7.3%) |
| $15,000 to $17,499 | 23 (3.2%) | 12 (1.7%) |
| $17,500 to $19,999 | 0 (0.0%) | 37 (5.3%) |
| $20,000 to $22,499 | 5 (0.7%) | 11 (1.6%) |
| $22,500 to $24,999 | 15 (2.1%) | 34 (4.9%) |
| $25,000 to $29,999 | 7 (1.0%) | 18 (2.6%) |
| $30,000 to $34,999 | 20 (2.8%) | 29 (4.2%) |
| $35,000 to $39,999 | 28 (3.9%) | 29 (4.2%) |
| $40,000 to $44,999 | 0 (0.0%) | 15 (2.1%) |
| $45,000 to $49,999 | 54 (7.5%) | 34 (4.9%) |
| $50,000 to $54,999 | 105 (14.6%) | 50 (7.2%) |
| $55,000 to $64,999 | 35 (4.9%) | 66 (9.5%) |
| $65,000 to $74,999 | 94 (13.1%) | 87 (12.5%) |
| $75,000 to $99,999 | 134 (18.7%) | 50 (7.2%) |
| $100,000+ | 78 (10.9%) | 2 (0.3%) |
| Total | 718 (100.0%) | 697 (100.0%) |
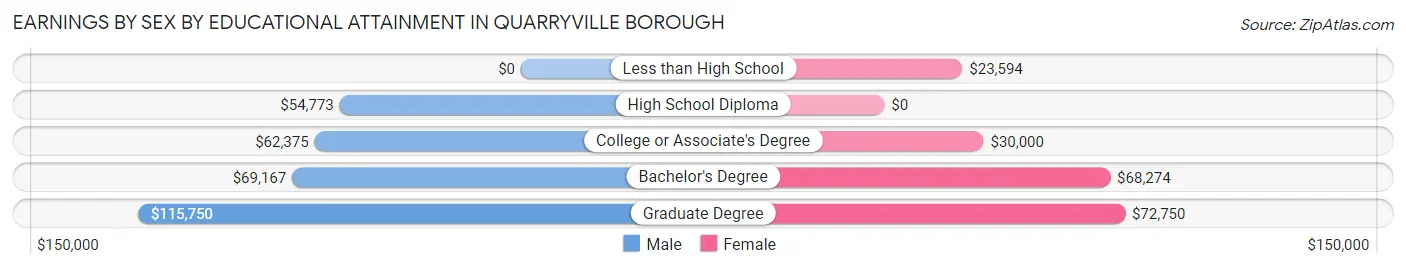
Earnings by Sex by Educational Attainment in Quarryville borough
Average earnings in Quarryville borough are $63,056 for men and $39,565 for women, a difference of 37.2%. Men with an educational attainment of graduate degree enjoy the highest average annual earnings of $115,750, while those with high school diploma education earn the least with $54,773. Women with an educational attainment of graduate degree earn the most with the average annual earnings of $72,750, while those with less than high school education have the smallest earnings of $23,594.
| Educational Attainment | Male Income | Female Income |
| Less than High School | - | - |
| High School Diploma | $54,773 | $0 |
| College or Associate's Degree | $62,375 | $30,000 |
| Bachelor's Degree | $69,167 | $68,274 |
| Graduate Degree | $115,750 | $72,750 |
| Total | $63,056 | $39,565 |
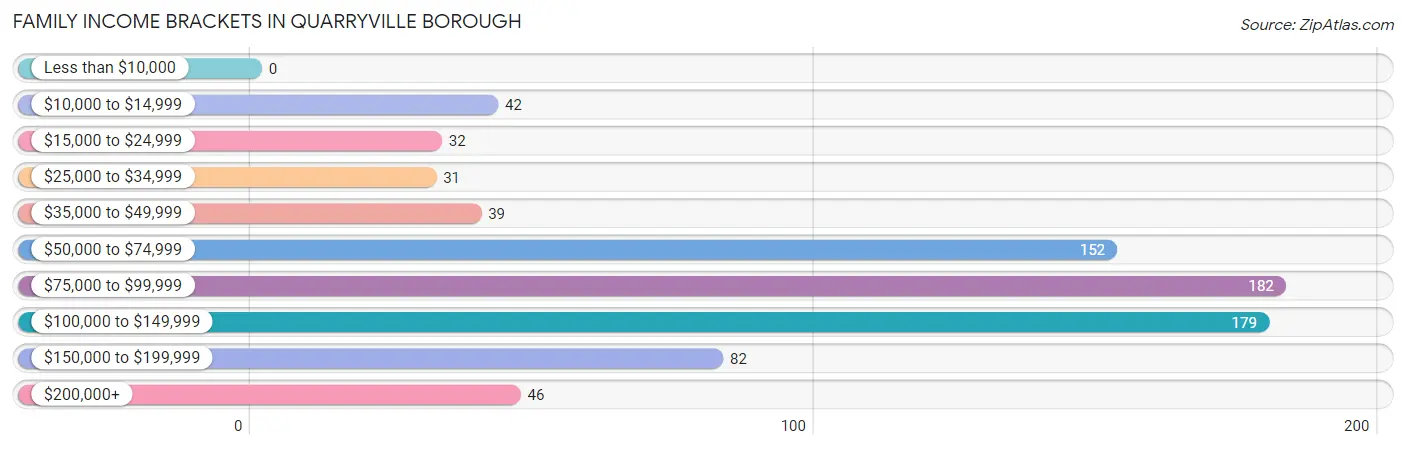
Family Income in Quarryville borough
Family Income Brackets in Quarryville borough
According to the Quarryville borough family income data, there are 182 families falling into the $75,000 to $99,999 income range, which is the most common income bracket and makes up 23.2% of all families.
| Income Bracket | # Families | % Families |
| Less than $10,000 | 0 | 0.0% |
| $10,000 to $14,999 | 42 | 5.4% |
| $15,000 to $24,999 | 32 | 4.1% |
| $25,000 to $34,999 | 31 | 3.9% |
| $35,000 to $49,999 | 39 | 5.0% |
| $50,000 to $74,999 | 152 | 19.4% |
| $75,000 to $99,999 | 182 | 23.2% |
| $100,000 to $149,999 | 179 | 22.8% |
| $150,000 to $199,999 | 82 | 10.4% |
| $200,000+ | 46 | 5.9% |
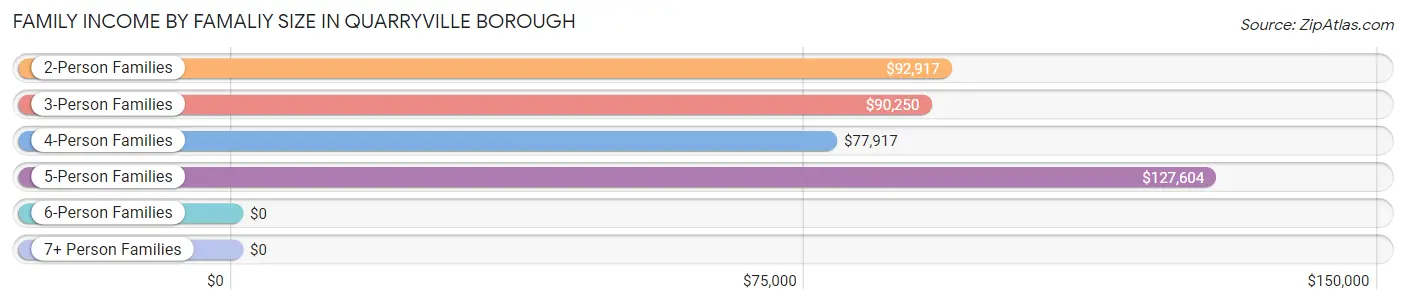
Family Income by Famaliy Size in Quarryville borough
5-person families (101 | 12.9%) account for the highest median family income in Quarryville borough with $127,604 per family, while 2-person families (406 | 51.7%) have the highest median income of $46,458 per family member.
| Income Bracket | # Families | Median Income |
| 2-Person Families | 406 (51.7%) | $92,917 |
| 3-Person Families | 129 (16.4%) | $90,250 |
| 4-Person Families | 114 (14.5%) | $77,917 |
| 5-Person Families | 101 (12.9%) | $127,604 |
| 6-Person Families | 35 (4.5%) | $0 |
| 7+ Person Families | 0 (0.0%) | $0 |
| Total | 785 (100.0%) | $90,579 |
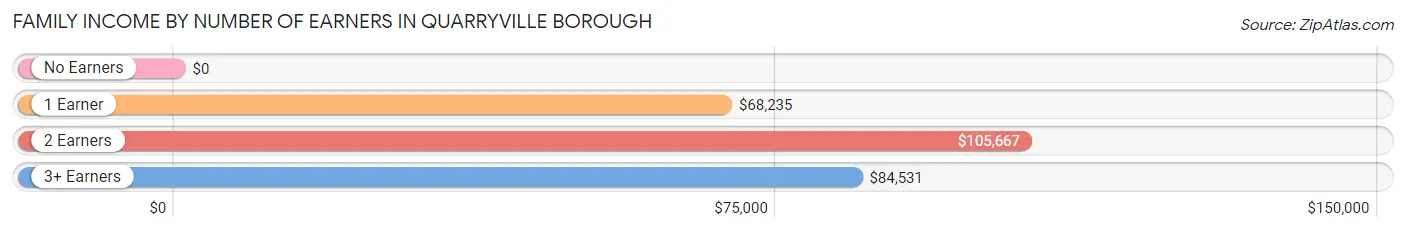
Family Income by Number of Earners in Quarryville borough
| Number of Earners | # Families | Median Income |
| No Earners | 110 (14.0%) | $0 |
| 1 Earner | 254 (32.4%) | $68,235 |
| 2 Earners | 346 (44.1%) | $105,667 |
| 3+ Earners | 75 (9.6%) | $84,531 |
| Total | 785 (100.0%) | $90,579 |
Household Income in Quarryville borough
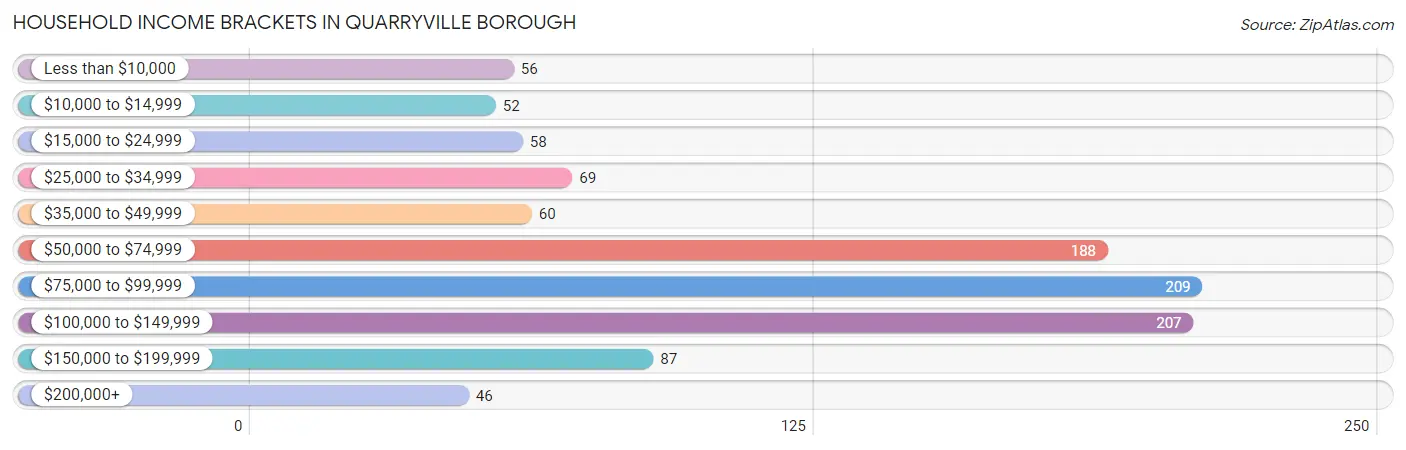
Household Income Brackets in Quarryville borough
With 209 households falling in the category, the $75,000 to $99,999 income range is the most frequent in Quarryville borough, accounting for 20.3% of all households. In contrast, only 46 households (4.5%) fall into the $200,000+ income bracket, making it the least populous group.
| Income Bracket | # Households | % Households |
| Less than $10,000 | 56 | 5.4% |
| $10,000 to $14,999 | 52 | 5.0% |
| $15,000 to $24,999 | 58 | 5.6% |
| $25,000 to $34,999 | 69 | 6.7% |
| $35,000 to $49,999 | 60 | 5.8% |
| $50,000 to $74,999 | 188 | 18.2% |
| $75,000 to $99,999 | 209 | 20.3% |
| $100,000 to $149,999 | 207 | 20.1% |
| $150,000 to $199,999 | 87 | 8.4% |
| $200,000+ | 46 | 4.5% |
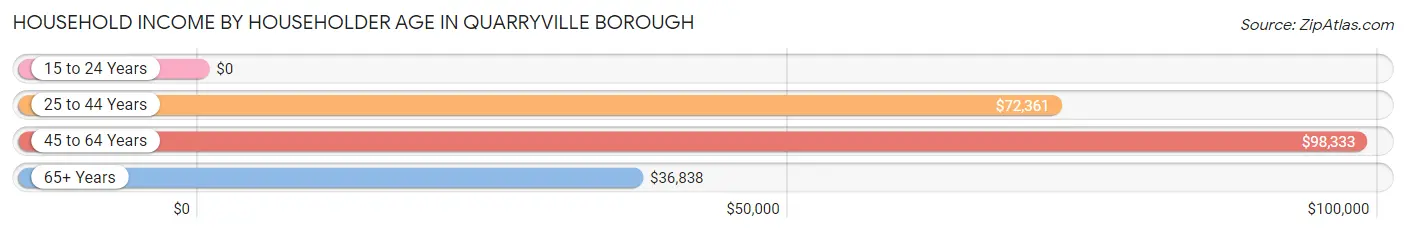
Household Income by Householder Age in Quarryville borough
The median household income in Quarryville borough is $81,667, with the highest median household income of $98,333 found in the 45 to 64 years age bracket for the primary householder. A total of 380 households (36.8%) fall into this category. Meanwhile, the 15 to 24 years age bracket for the primary householder has the lowest median household income of $0, with 8 households (0.8%) in this group.
| Income Bracket | # Households | Median Income |
| 15 to 24 Years | 8 (0.8%) | $0 |
| 25 to 44 Years | 373 (36.1%) | $72,361 |
| 45 to 64 Years | 380 (36.8%) | $98,333 |
| 65+ Years | 271 (26.3%) | $36,838 |
| Total | 1,032 (100.0%) | $81,667 |
Poverty in Quarryville borough
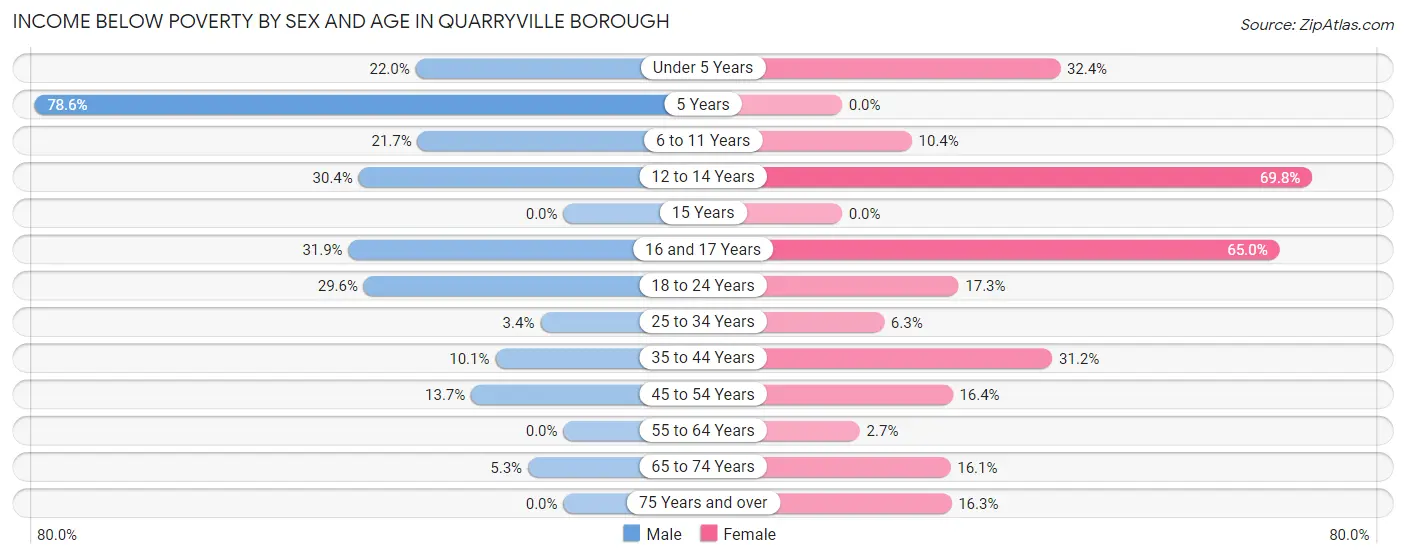
Income Below Poverty by Sex and Age in Quarryville borough
With 13.8% poverty level for males and 20.1% for females among the residents of Quarryville borough, 5 year old males and 12 to 14 year old females are the most vulnerable to poverty, with 22 males (78.6%) and 44 females (69.8%) in their respective age groups living below the poverty level.
| Age Bracket | Male | Female |
| Under 5 Years | 27 (22.0%) | 23 (32.4%) |
| 5 Years | 22 (78.6%) | 0 (0.0%) |
| 6 to 11 Years | 21 (21.6%) | 14 (10.4%) |
| 12 to 14 Years | 38 (30.4%) | 44 (69.8%) |
| 15 Years | 0 (0.0%) | 0 (0.0%) |
| 16 and 17 Years | 15 (31.9%) | 26 (65.0%) |
| 18 to 24 Years | 24 (29.6%) | 18 (17.3%) |
| 25 to 34 Years | 6 (3.4%) | 10 (6.2%) |
| 35 to 44 Years | 9 (10.1%) | 84 (31.2%) |
| 45 to 54 Years | 20 (13.7%) | 23 (16.4%) |
| 55 to 64 Years | 0 (0.0%) | 5 (2.6%) |
| 65 to 74 Years | 5 (5.3%) | 29 (16.1%) |
| 75 Years and over | 0 (0.0%) | 13 (16.3%) |
| Total | 187 (13.8%) | 289 (20.1%) |
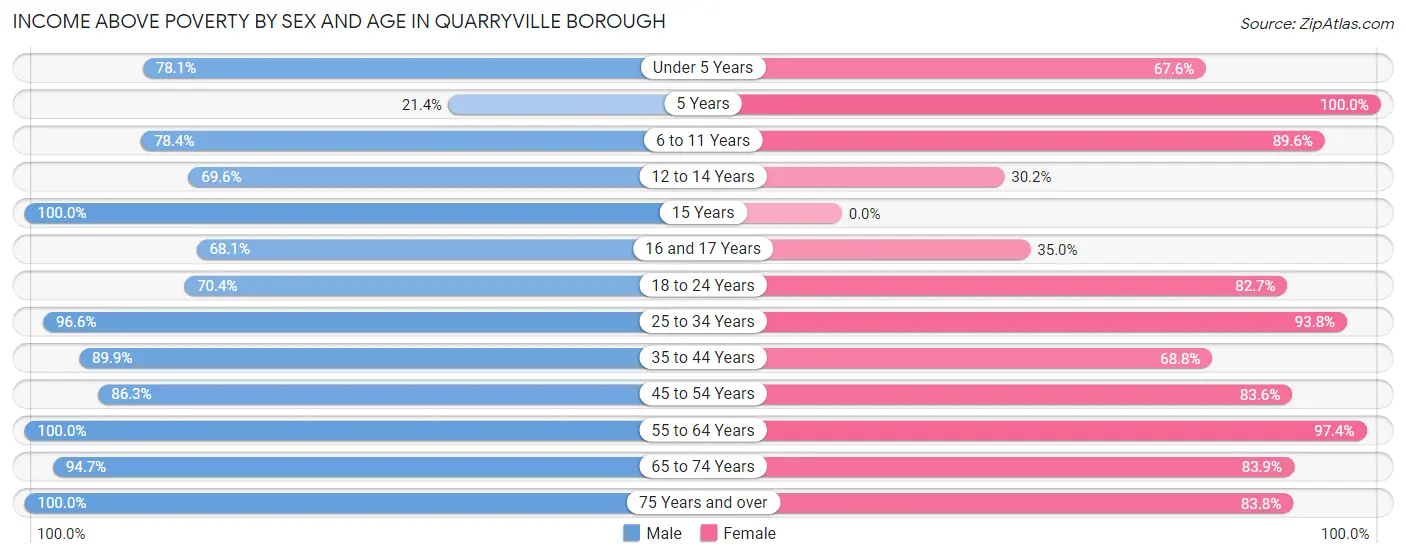
Income Above Poverty by Sex and Age in Quarryville borough
According to the poverty statistics in Quarryville borough, males aged 15 years and females aged 5 years are the age groups that are most secure financially, with 100.0% of males and 100.0% of females in these age groups living above the poverty line.
| Age Bracket | Male | Female |
| Under 5 Years | 96 (78.0%) | 48 (67.6%) |
| 5 Years | 6 (21.4%) | 6 (100.0%) |
| 6 to 11 Years | 76 (78.3%) | 121 (89.6%) |
| 12 to 14 Years | 87 (69.6%) | 19 (30.2%) |
| 15 Years | 57 (100.0%) | 0 (0.0%) |
| 16 and 17 Years | 32 (68.1%) | 14 (35.0%) |
| 18 to 24 Years | 57 (70.4%) | 86 (82.7%) |
| 25 to 34 Years | 169 (96.6%) | 150 (93.8%) |
| 35 to 44 Years | 80 (89.9%) | 185 (68.8%) |
| 45 to 54 Years | 126 (86.3%) | 117 (83.6%) |
| 55 to 64 Years | 200 (100.0%) | 184 (97.4%) |
| 65 to 74 Years | 90 (94.7%) | 151 (83.9%) |
| 75 Years and over | 89 (100.0%) | 67 (83.8%) |
| Total | 1,165 (86.2%) | 1,148 (79.9%) |
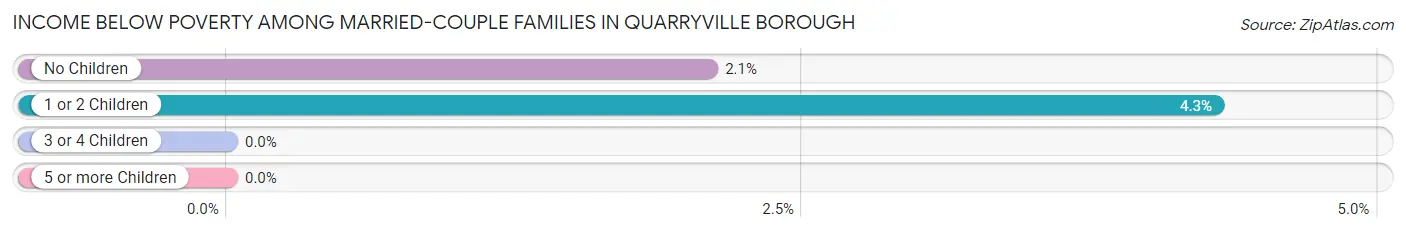
Income Below Poverty Among Married-Couple Families in Quarryville borough
The poverty statistics for married-couple families in Quarryville borough show that 2.4% or 14 of the total 576 families live below the poverty line. Families with 1 or 2 children have the highest poverty rate of 4.3%, comprising of 6 families. On the other hand, families with 3 or 4 children have the lowest poverty rate of 0.0%, which includes 0 families.
| Children | Above Poverty | Below Poverty |
| No Children | 375 (97.9%) | 8 (2.1%) |
| 1 or 2 Children | 134 (95.7%) | 6 (4.3%) |
| 3 or 4 Children | 53 (100.0%) | 0 (0.0%) |
| 5 or more Children | 0 (0.0%) | 0 (0.0%) |
| Total | 562 (97.6%) | 14 (2.4%) |
Income Below Poverty Among Single-Parent Households in Quarryville borough
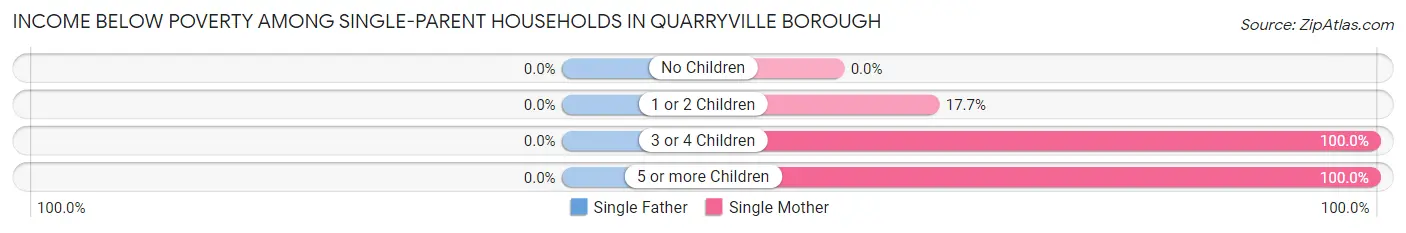
| Children | Single Father | Single Mother |
| No Children | 0 (0.0%) | 0 (0.0%) |
| 1 or 2 Children | 0 (0.0%) | 17 (17.7%) |
| 3 or 4 Children | 0 (0.0%) | 22 (100.0%) |
| 5 or more Children | 0 (0.0%) | 16 (100.0%) |
| Total | 0 (0.0%) | 55 (34.0%) |
Income Below Poverty Among Married-Couple vs Single-Parent Households in Quarryville borough
The poverty data for Quarryville borough shows that 14 of the married-couple family households (2.4%) and 55 of the single-parent households (26.3%) are living below the poverty level. Within the married-couple family households, those with 1 or 2 children have the highest poverty rate, with 6 households (4.3%) falling below the poverty line. Among the single-parent households, those with 3 or 4 children have the highest poverty rate, with 22 household (100.0%) living below poverty.
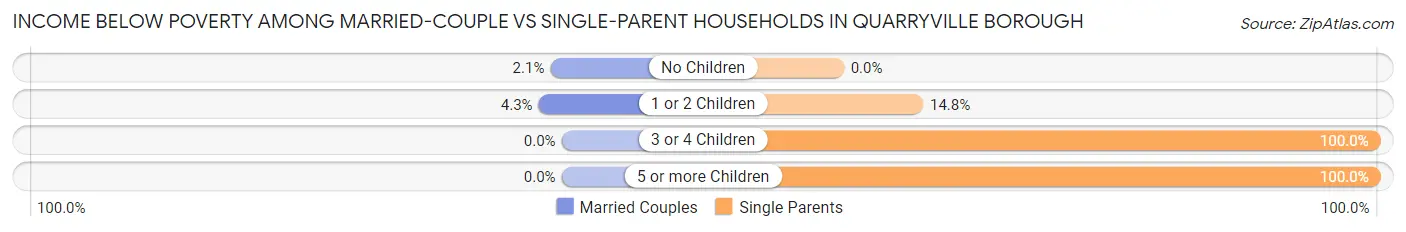
| Children | Married-Couple Families | Single-Parent Households |
| No Children | 8 (2.1%) | 0 (0.0%) |
| 1 or 2 Children | 6 (4.3%) | 17 (14.8%) |
| 3 or 4 Children | 0 (0.0%) | 22 (100.0%) |
| 5 or more Children | 0 (0.0%) | 16 (100.0%) |
| Total | 14 (2.4%) | 55 (26.3%) |
Race in Quarryville borough
The most populous races in Quarryville borough are White / Caucasian (2,334 | 82.4%), Hispanic or Latino (237 | 8.4%), and Asian (172 | 6.1%).
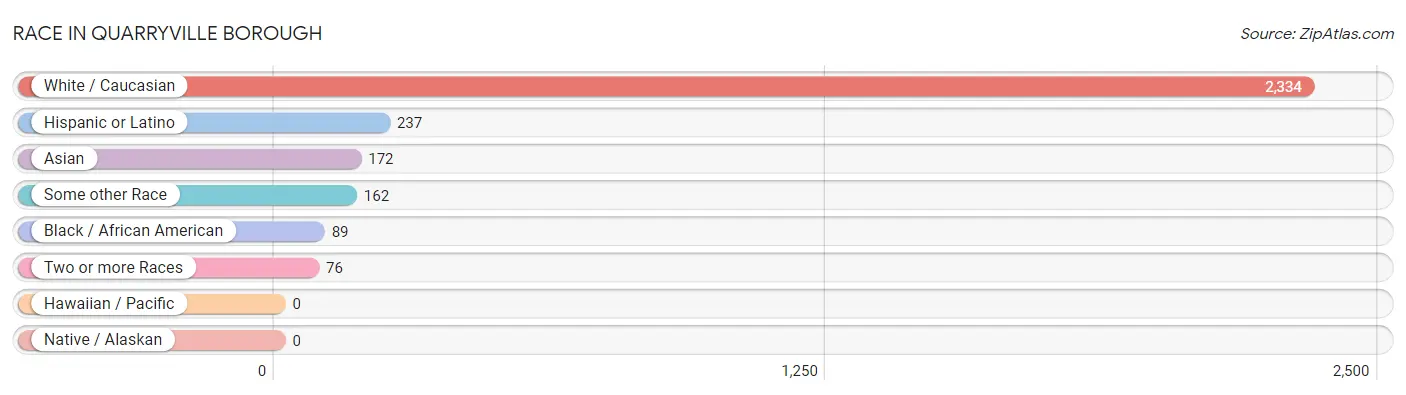
| Race | # Population | % Population |
| Asian | 172 | 6.1% |
| Black / African American | 89 | 3.1% |
| Hawaiian / Pacific | 0 | 0.0% |
| Hispanic or Latino | 237 | 8.4% |
| Native / Alaskan | 0 | 0.0% |
| White / Caucasian | 2,334 | 82.4% |
| Two or more Races | 76 | 2.7% |
| Some other Race | 162 | 5.7% |
| Total | 2,833 | 100.0% |
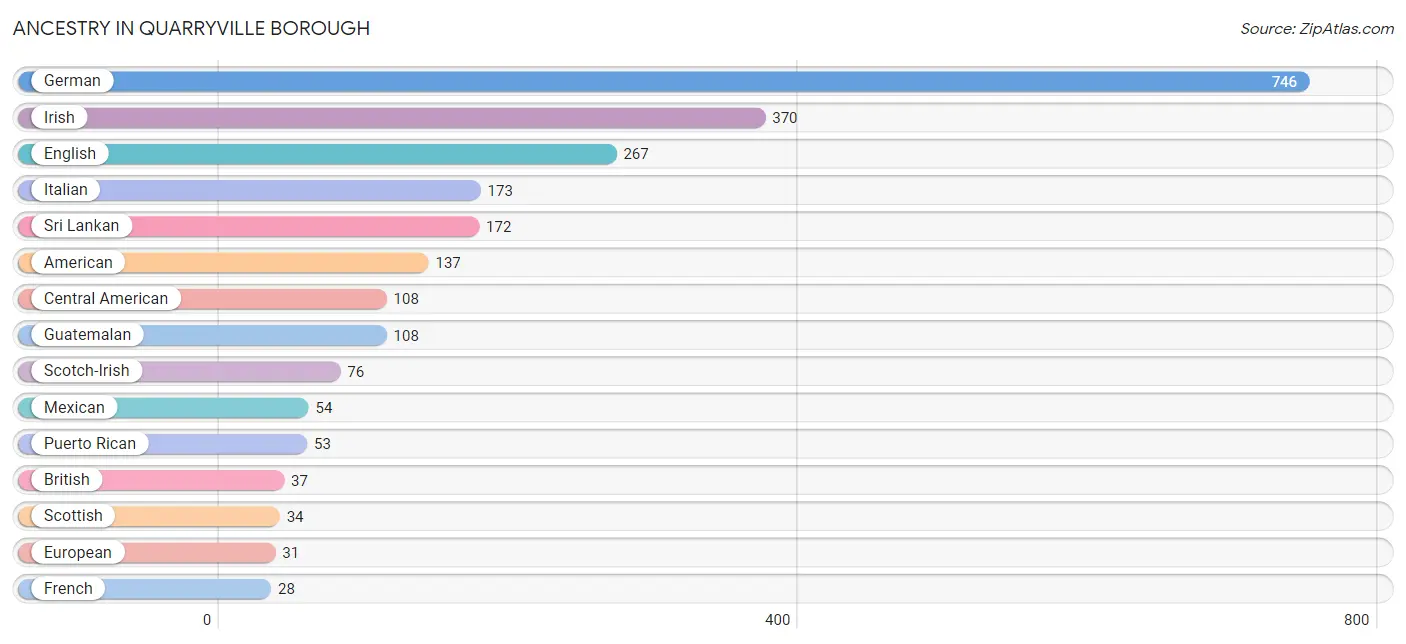
Ancestry in Quarryville borough
The most populous ancestries reported in Quarryville borough are German (746 | 26.3%), Irish (370 | 13.1%), English (267 | 9.4%), Italian (173 | 6.1%), and Sri Lankan (172 | 6.1%), together accounting for 61.0% of all Quarryville borough residents.
| Ancestry | # Population | % Population |
| American | 137 | 4.8% |
| British | 37 | 1.3% |
| Central American | 108 | 3.8% |
| Czech | 7 | 0.3% |
| Danish | 10 | 0.4% |
| Dutch | 15 | 0.5% |
| English | 267 | 9.4% |
| European | 31 | 1.1% |
| Finnish | 6 | 0.2% |
| French | 28 | 1.0% |
| French Canadian | 11 | 0.4% |
| German | 746 | 26.3% |
| Guatemalan | 108 | 3.8% |
| Hungarian | 13 | 0.5% |
| Irish | 370 | 13.1% |
| Italian | 173 | 6.1% |
| Lithuanian | 7 | 0.3% |
| Mexican | 54 | 1.9% |
| Norwegian | 22 | 0.8% |
| Polish | 16 | 0.6% |
| Puerto Rican | 53 | 1.9% |
| Russian | 2 | 0.1% |
| Scandinavian | 6 | 0.2% |
| Scotch-Irish | 76 | 2.7% |
| Scottish | 34 | 1.2% |
| Sri Lankan | 172 | 6.1% |
| Swiss | 21 | 0.7% |
| Thai | 6 | 0.2% |
| Ukrainian | 12 | 0.4% |
| Welsh | 25 | 0.9% | View All 30 Rows |
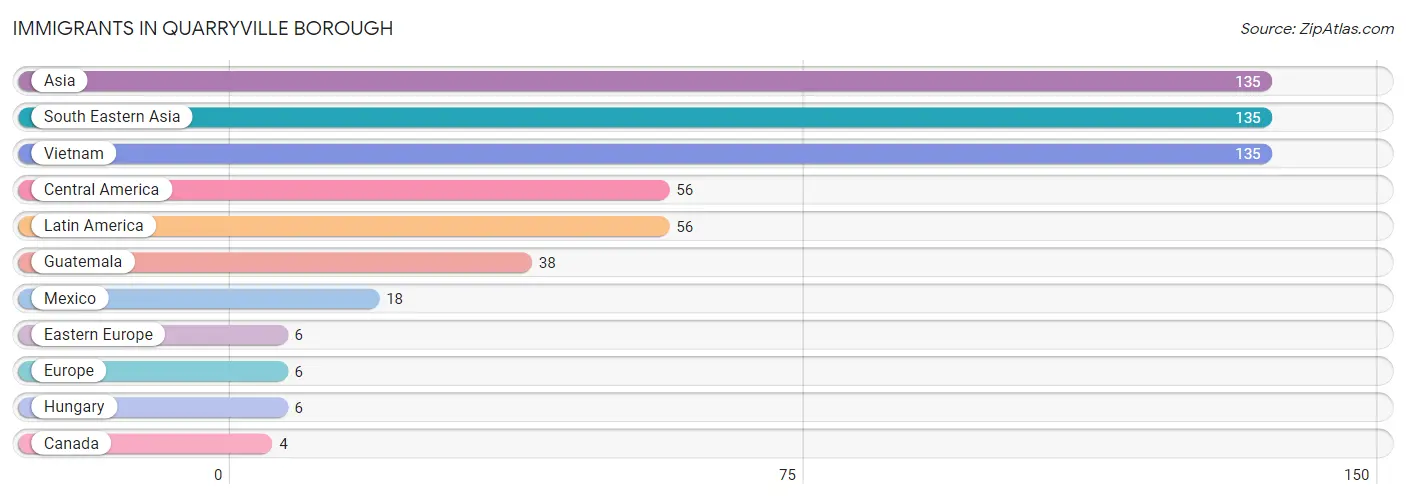
Immigrants in Quarryville borough
The most numerous immigrant groups reported in Quarryville borough came from Asia (135 | 4.8%), South Eastern Asia (135 | 4.8%), Vietnam (135 | 4.8%), Central America (56 | 2.0%), and Latin America (56 | 2.0%), together accounting for 18.3% of all Quarryville borough residents.
| Immigration Origin | # Population | % Population |
| Asia | 135 | 4.8% |
| Canada | 4 | 0.1% |
| Central America | 56 | 2.0% |
| Eastern Europe | 6 | 0.2% |
| Europe | 6 | 0.2% |
| Guatemala | 38 | 1.3% |
| Hungary | 6 | 0.2% |
| Latin America | 56 | 2.0% |
| Mexico | 18 | 0.6% |
| South Eastern Asia | 135 | 4.8% |
| Vietnam | 135 | 4.8% | View All 11 Rows |
Sex and Age in Quarryville borough
Sex and Age in Quarryville borough
The most populous age groups in Quarryville borough are 10 to 14 Years (157 | 11.3%) for men and 10 to 14 Years (153 | 10.6%) for women.
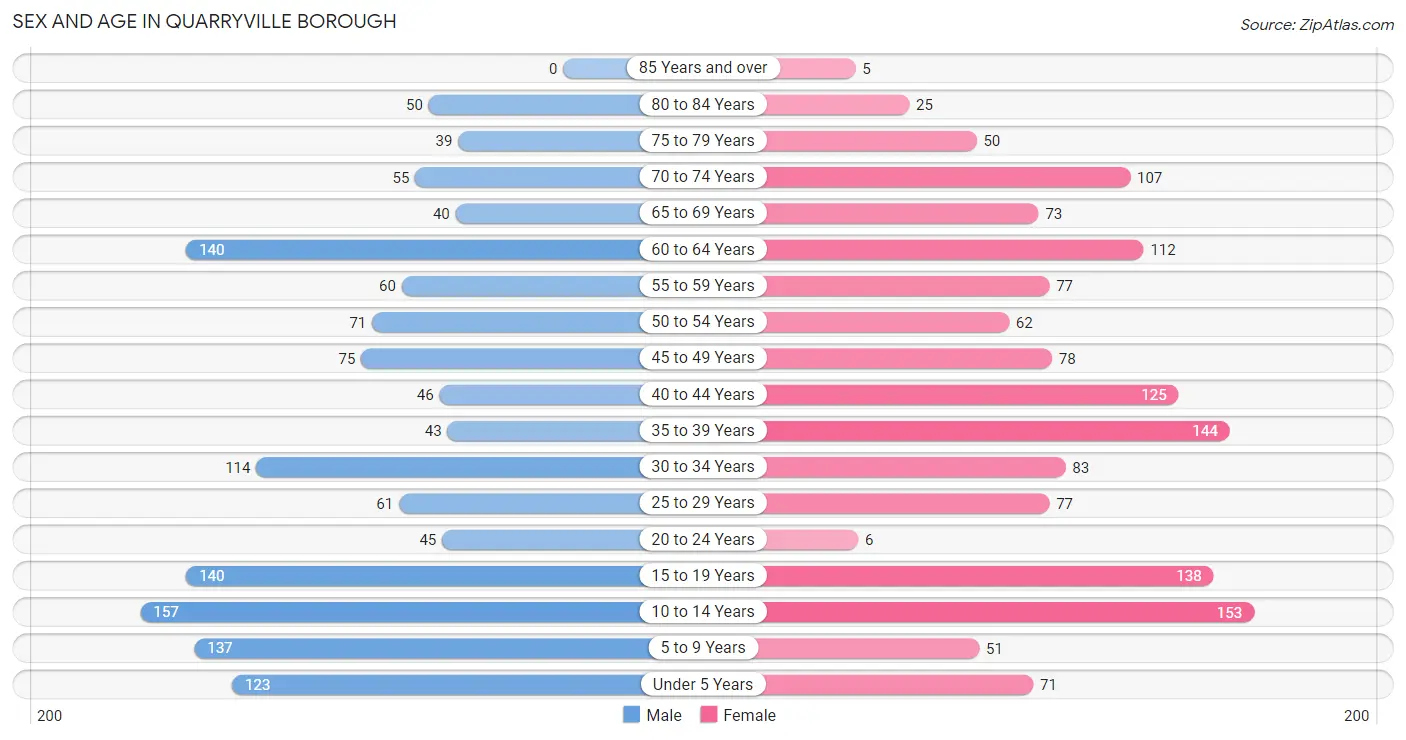
| Age Bracket | Male | Female |
| Under 5 Years | 123 (8.8%) | 71 (4.9%) |
| 5 to 9 Years | 137 (9.8%) | 51 (3.5%) |
| 10 to 14 Years | 157 (11.3%) | 153 (10.6%) |
| 15 to 19 Years | 140 (10.0%) | 138 (9.6%) |
| 20 to 24 Years | 45 (3.2%) | 6 (0.4%) |
| 25 to 29 Years | 61 (4.4%) | 77 (5.4%) |
| 30 to 34 Years | 114 (8.2%) | 83 (5.8%) |
| 35 to 39 Years | 43 (3.1%) | 144 (10.0%) |
| 40 to 44 Years | 46 (3.3%) | 125 (8.7%) |
| 45 to 49 Years | 75 (5.4%) | 78 (5.4%) |
| 50 to 54 Years | 71 (5.1%) | 62 (4.3%) |
| 55 to 59 Years | 60 (4.3%) | 77 (5.4%) |
| 60 to 64 Years | 140 (10.0%) | 112 (7.8%) |
| 65 to 69 Years | 40 (2.9%) | 73 (5.1%) |
| 70 to 74 Years | 55 (3.9%) | 107 (7.4%) |
| 75 to 79 Years | 39 (2.8%) | 50 (3.5%) |
| 80 to 84 Years | 50 (3.6%) | 25 (1.7%) |
| 85 Years and over | 0 (0.0%) | 5 (0.4%) |
| Total | 1,396 (100.0%) | 1,437 (100.0%) |
Families and Households in Quarryville borough
Median Family Size in Quarryville borough
The median family size in Quarryville borough is 3.11 persons per family, with single female/mother families (162 | 20.6%) accounting for the largest median family size of 3.99 persons per family. On the other hand, single male/father families (47 | 6.0%) represent the smallest median family size with 2.30 persons per family.
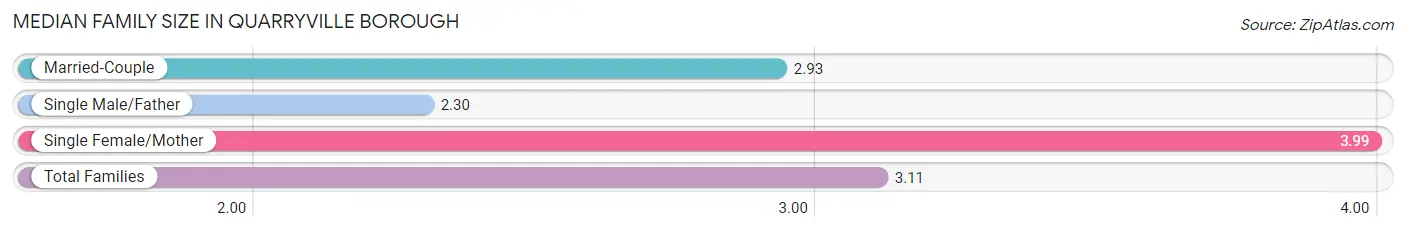
| Family Type | # Families | Family Size |
| Married-Couple | 576 (73.4%) | 2.93 |
| Single Male/Father | 47 (6.0%) | 2.30 |
| Single Female/Mother | 162 (20.6%) | 3.99 |
| Total Families | 785 (100.0%) | 3.11 |
Median Household Size in Quarryville borough
The median household size in Quarryville borough is 2.75 persons per household, with single female/mother households (162 | 15.7%) accounting for the largest median household size of 4.13 persons per household. non-family households (247 | 23.9%) represent the smallest median household size with 1.12 persons per household.
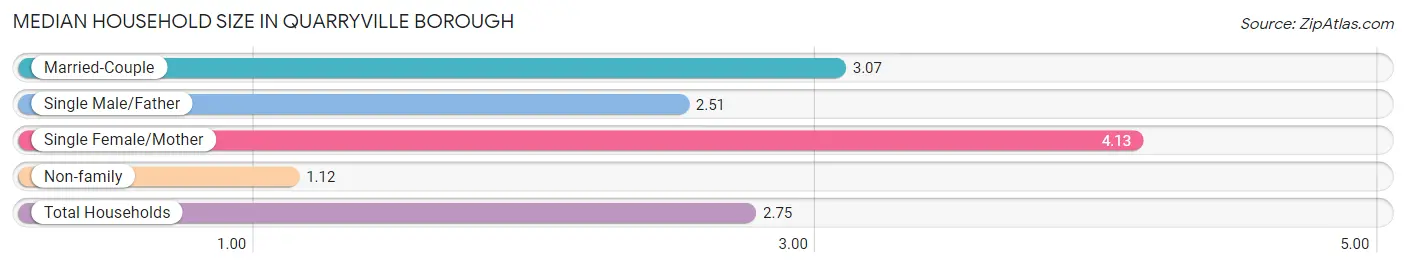
| Household Type | # Households | Household Size |
| Married-Couple | 576 (55.8%) | 3.07 |
| Single Male/Father | 47 (4.5%) | 2.51 |
| Single Female/Mother | 162 (15.7%) | 4.13 |
| Non-family | 247 (23.9%) | 1.12 |
| Total Households | 1,032 (100.0%) | 2.75 |
Household Size by Marriage Status in Quarryville borough
Out of a total of 1,032 households in Quarryville borough, 785 (76.1%) are family households, while 247 (23.9%) are nonfamily households. The most numerous type of family households are 2-person households, comprising 388, and the most common type of nonfamily households are 1-person households, comprising 230.
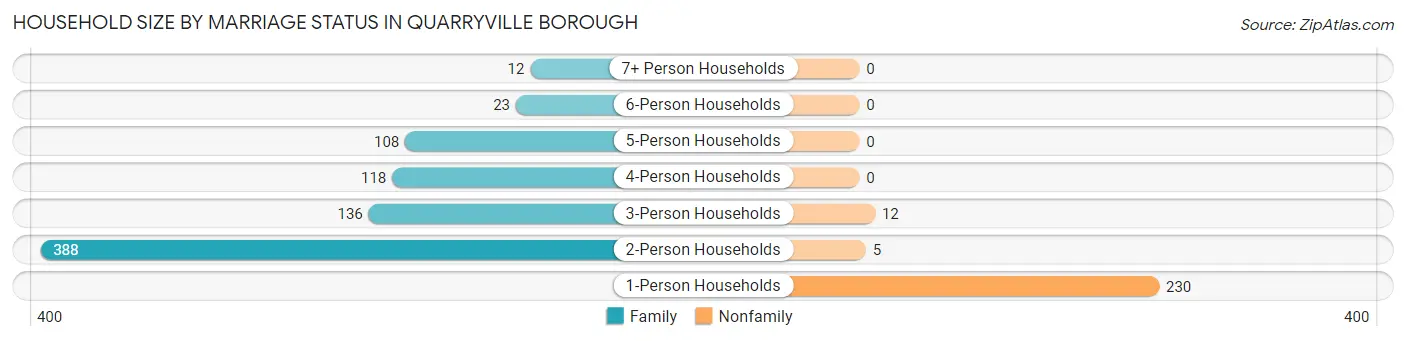
| Household Size | Family Households | Nonfamily Households |
| 1-Person Households | - | 230 (22.3%) |
| 2-Person Households | 388 (37.6%) | 5 (0.5%) |
| 3-Person Households | 136 (13.2%) | 12 (1.2%) |
| 4-Person Households | 118 (11.4%) | 0 (0.0%) |
| 5-Person Households | 108 (10.5%) | 0 (0.0%) |
| 6-Person Households | 23 (2.2%) | 0 (0.0%) |
| 7+ Person Households | 12 (1.2%) | 0 (0.0%) |
| Total | 785 (76.1%) | 247 (23.9%) |
Female Fertility in Quarryville borough
Fertility by Age in Quarryville borough
Average fertility rate in Quarryville borough is 18.0 births per 1,000 women. Women in the age bracket of 20 to 34 years have the highest fertility rate with 72.0 births per 1,000 women. Women in the age bracket of 20 to 34 years acount for 100.0% of all women with births.
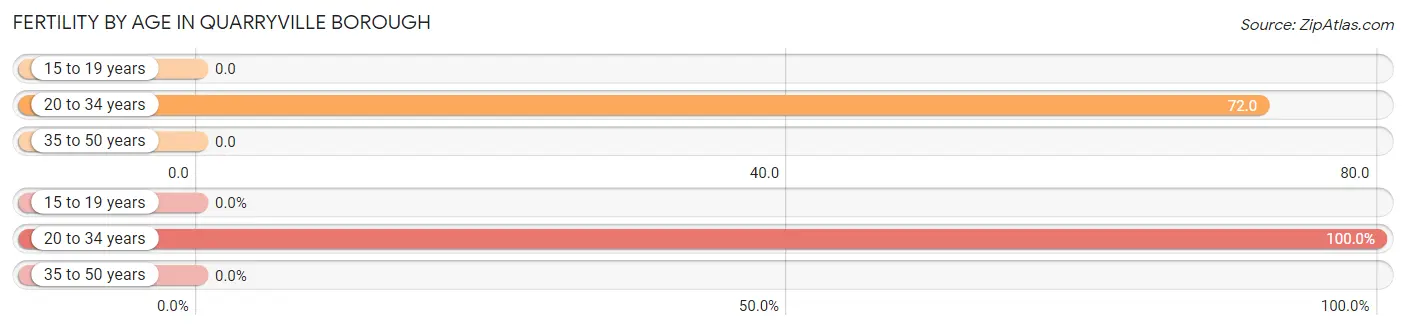
| Age Bracket | Women with Births | Births / 1,000 Women |
| 15 to 19 years | 0 (0.0%) | 0.0 |
| 20 to 34 years | 12 (100.0%) | 72.0 |
| 35 to 50 years | 0 (0.0%) | 0.0 |
| Total | 12 (100.0%) | 18.0 |
Fertility by Age by Marriage Status in Quarryville borough
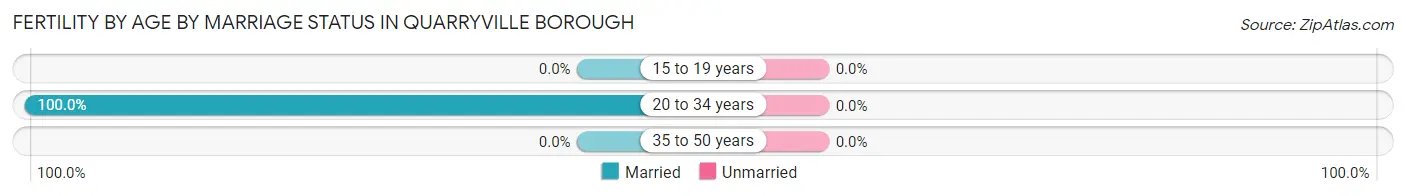
| Age Bracket | Married | Unmarried |
| 15 to 19 years | 0 (0.0%) | 0 (0.0%) |
| 20 to 34 years | 12 (100.0%) | 0 (0.0%) |
| 35 to 50 years | 0 (0.0%) | 0 (0.0%) |
| Total | 12 (100.0%) | 0 (0.0%) |
Fertility by Education in Quarryville borough
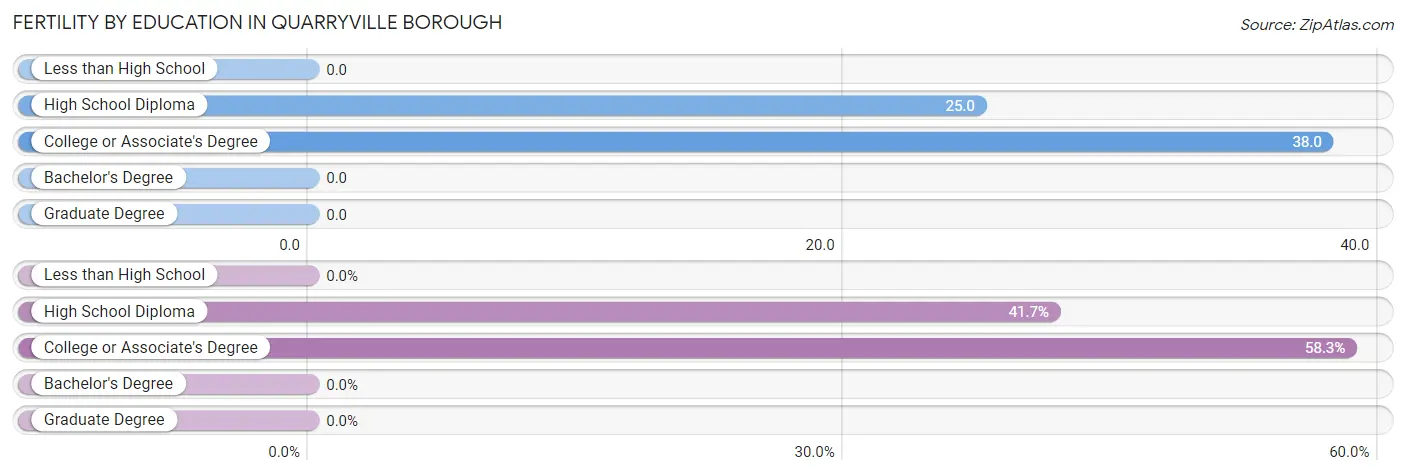
| Educational Attainment | Women with Births | Births / 1,000 Women |
| Less than High School | 0 (0.0%) | 0.0 |
| High School Diploma | 5 (41.7%) | 25.0 |
| College or Associate's Degree | 7 (58.3%) | 38.0 |
| Bachelor's Degree | 0 (0.0%) | 0.0 |
| Graduate Degree | 0 (0.0%) | 0.0 |
| Total | 12 (100.0%) | 18.0 |
Fertility by Education by Marriage Status in Quarryville borough
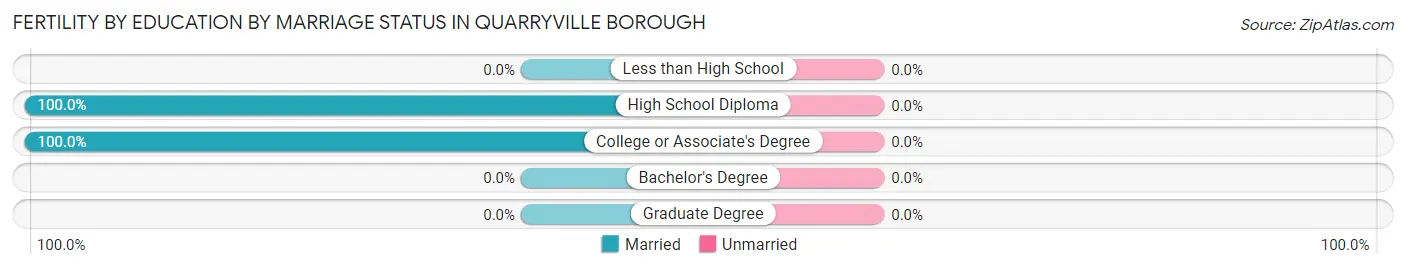
| Educational Attainment | Married | Unmarried |
| Less than High School | 0 (0.0%) | 0 (0.0%) |
| High School Diploma | 5 (100.0%) | 0 (0.0%) |
| College or Associate's Degree | 7 (100.0%) | 0 (0.0%) |
| Bachelor's Degree | 0 (0.0%) | 0 (0.0%) |
| Graduate Degree | 0 (0.0%) | 0 (0.0%) |
| Total | 12 (100.0%) | 0 (0.0%) |
Employment Characteristics in Quarryville borough
Employment by Class of Employer in Quarryville borough
Among the 1,284 employed individuals in Quarryville borough, private company employees (917 | 71.4%), not-for-profit organizations (133 | 10.4%), and local government employees (97 | 7.5%) make up the most common classes of employment.
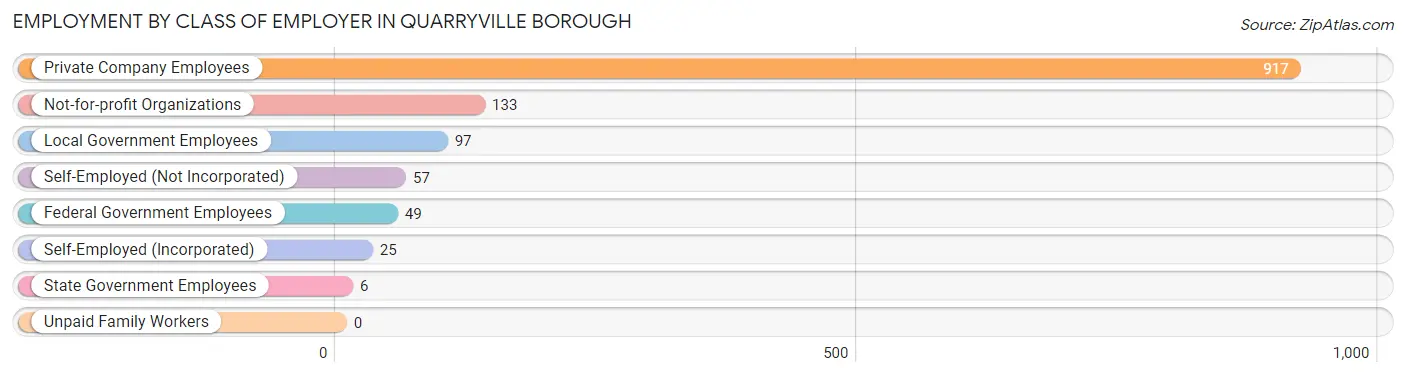
| Employer Class | # Employees | % Employees |
| Private Company Employees | 917 | 71.4% |
| Self-Employed (Incorporated) | 25 | 1.9% |
| Self-Employed (Not Incorporated) | 57 | 4.4% |
| Not-for-profit Organizations | 133 | 10.4% |
| Local Government Employees | 97 | 7.5% |
| State Government Employees | 6 | 0.5% |
| Federal Government Employees | 49 | 3.8% |
| Unpaid Family Workers | 0 | 0.0% |
| Total | 1,284 | 100.0% |
Employment Status by Age in Quarryville borough
According to the labor force statistics for Quarryville borough, out of the total population over 16 years of age (2,084), 64.9% or 1,353 individuals are in the labor force, with 3.5% or 47 of them unemployed. The age group with the highest labor force participation rate is 45 to 54 years, with 93.0% or 266 individuals in the labor force. Within the labor force, the 16 to 19 years age range has the highest percentage of unemployed individuals, with 20.3% or 30 of them being unemployed.
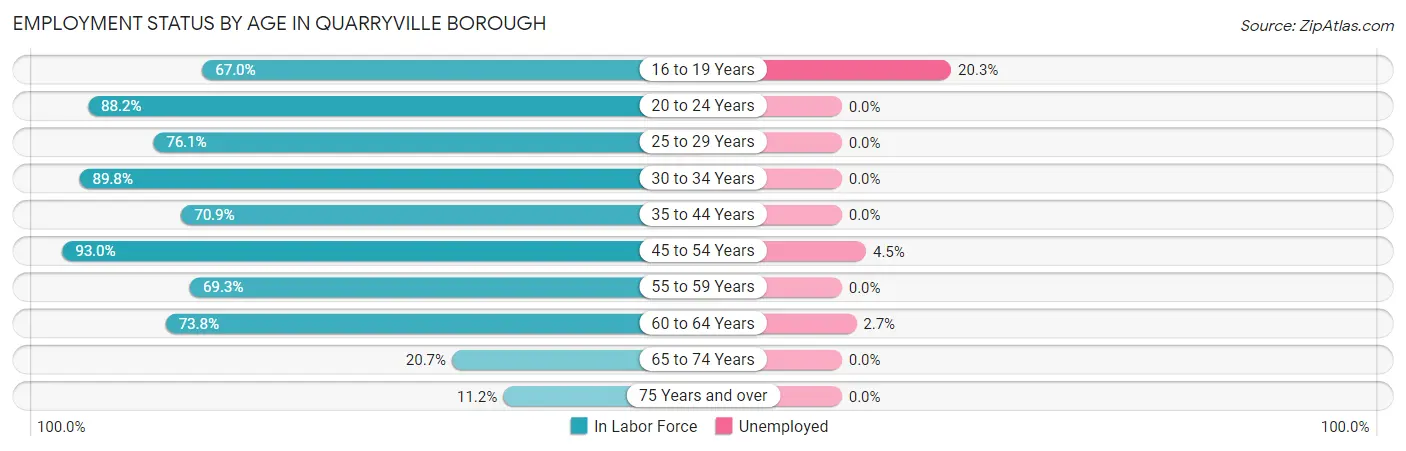
| Age Bracket | In Labor Force | Unemployed |
| 16 to 19 Years | 148 (67.0%) | 30 (20.3%) |
| 20 to 24 Years | 45 (88.2%) | 0 (0.0%) |
| 25 to 29 Years | 105 (76.1%) | 0 (0.0%) |
| 30 to 34 Years | 177 (89.8%) | 0 (0.0%) |
| 35 to 44 Years | 254 (70.9%) | 0 (0.0%) |
| 45 to 54 Years | 266 (93.0%) | 12 (4.5%) |
| 55 to 59 Years | 95 (69.3%) | 0 (0.0%) |
| 60 to 64 Years | 186 (73.8%) | 5 (2.7%) |
| 65 to 74 Years | 57 (20.7%) | 0 (0.0%) |
| 75 Years and over | 19 (11.2%) | 0 (0.0%) |
| Total | 1,353 (64.9%) | 47 (3.5%) |
Employment Status by Educational Attainment in Quarryville borough
According to labor force statistics for Quarryville borough, 79.2% of individuals (1,083) out of the total population between 25 and 64 years of age (1,368) are in the labor force, with 1.6% or 17 of them being unemployed. The group with the highest labor force participation rate are those with the educational attainment of college / associate degree, with 84.3% or 333 individuals in the labor force. Within the labor force, individuals with college / associate degree education have the highest percentage of unemployment, with 3.6% or 12 of them being unemployed.
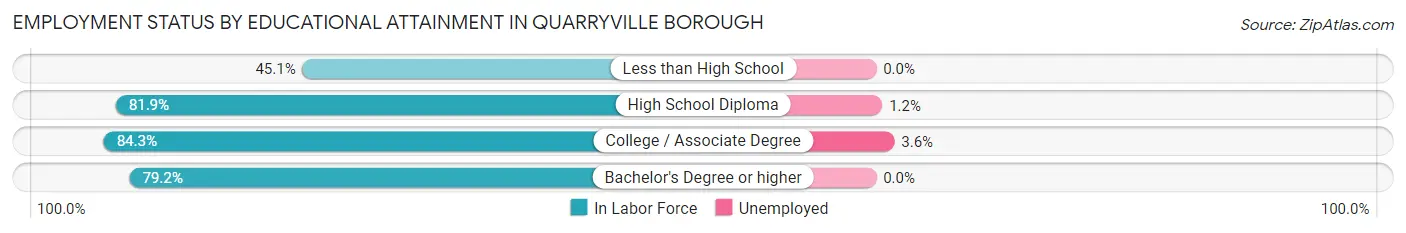
| Educational Attainment | In Labor Force | Unemployed |
| Less than High School | 46 (45.1%) | 0 (0.0%) |
| High School Diploma | 430 (81.9%) | 6 (1.2%) |
| College / Associate Degree | 333 (84.3%) | 14 (3.6%) |
| Bachelor's Degree or higher | 274 (79.2%) | 0 (0.0%) |
| Total | 1,083 (79.2%) | 22 (1.6%) |
Employment Occupations by Sex in Quarryville borough
Management, Business, Science and Arts Occupations
The most common Management, Business, Science and Arts occupations in Quarryville borough are Management (148 | 11.3%), Health Diagnosing & Treating (98 | 7.5%), Community & Social Service (86 | 6.6%), Education Instruction & Library (75 | 5.8%), and Business & Financial (44 | 3.4%).
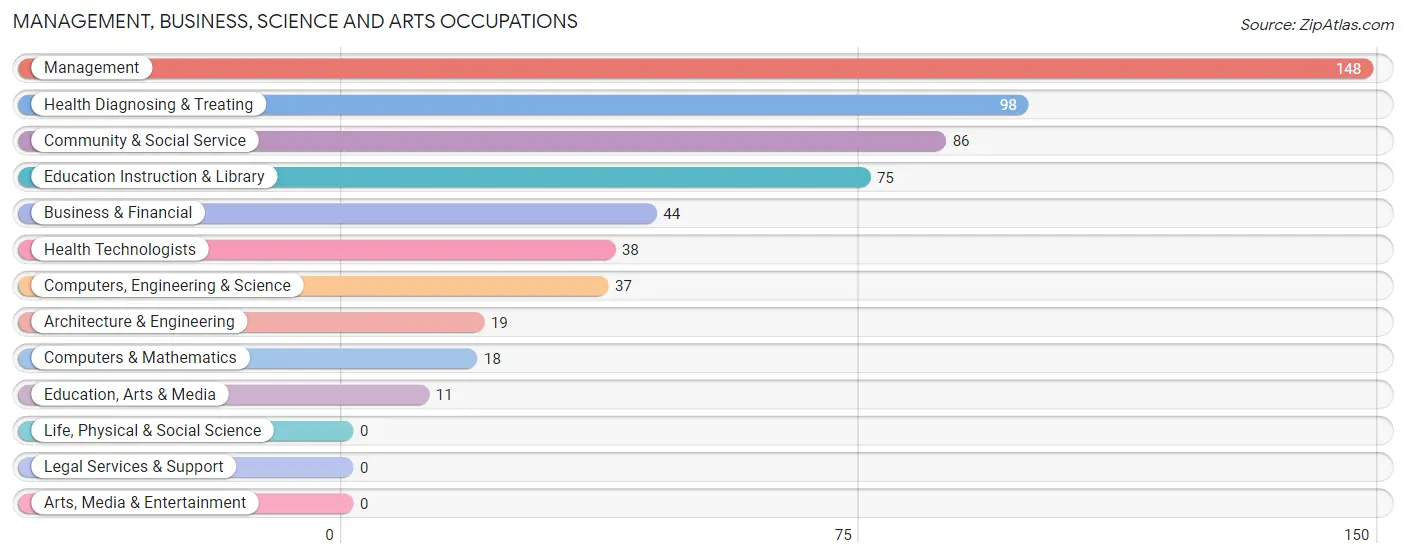
Management, Business, Science and Arts Occupations by Sex
Within the Management, Business, Science and Arts occupations in Quarryville borough, the most male-oriented occupations are Architecture & Engineering (100.0%), Education, Arts & Media (100.0%), and Computers, Engineering & Science (81.1%), while the most female-oriented occupations are Health Diagnosing & Treating (100.0%), Health Technologists (100.0%), and Education Instruction & Library (78.7%).
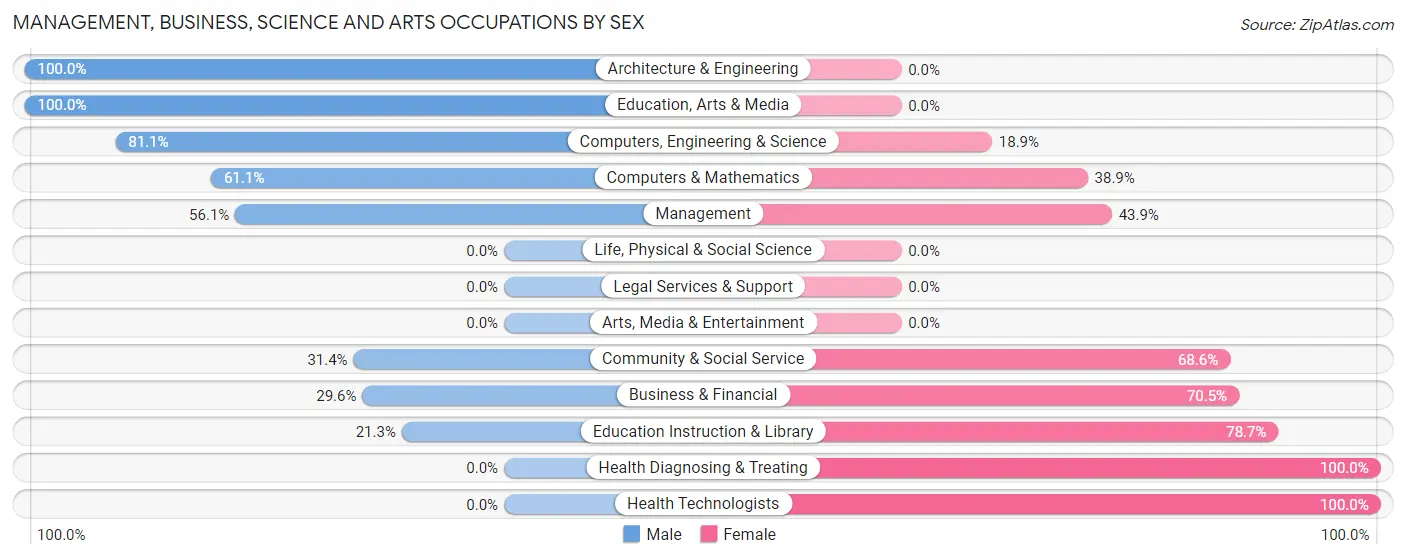
| Occupation | Male | Female |
| Management | 83 (56.1%) | 65 (43.9%) |
| Business & Financial | 13 (29.5%) | 31 (70.5%) |
| Computers, Engineering & Science | 30 (81.1%) | 7 (18.9%) |
| Computers & Mathematics | 11 (61.1%) | 7 (38.9%) |
| Architecture & Engineering | 19 (100.0%) | 0 (0.0%) |
| Life, Physical & Social Science | 0 (0.0%) | 0 (0.0%) |
| Community & Social Service | 27 (31.4%) | 59 (68.6%) |
| Education, Arts & Media | 11 (100.0%) | 0 (0.0%) |
| Legal Services & Support | 0 (0.0%) | 0 (0.0%) |
| Education Instruction & Library | 16 (21.3%) | 59 (78.7%) |
| Arts, Media & Entertainment | 0 (0.0%) | 0 (0.0%) |
| Health Diagnosing & Treating | 0 (0.0%) | 98 (100.0%) |
| Health Technologists | 0 (0.0%) | 38 (100.0%) |
| Total (Category) | 153 (37.0%) | 260 (62.9%) |
| Total (Overall) | 683 (52.3%) | 622 (47.7%) |
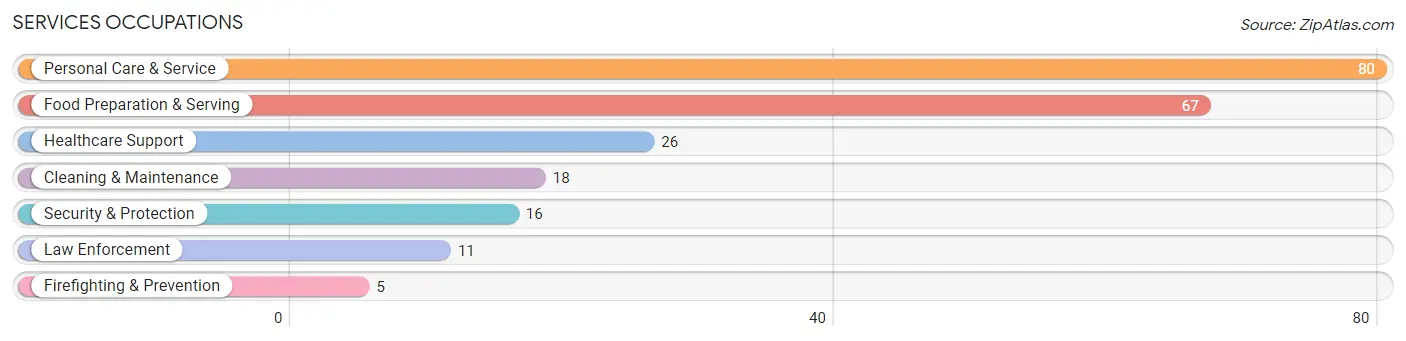
Services Occupations
The most common Services occupations in Quarryville borough are Personal Care & Service (80 | 6.1%), Food Preparation & Serving (67 | 5.1%), Healthcare Support (26 | 2.0%), Cleaning & Maintenance (18 | 1.4%), and Security & Protection (16 | 1.2%).
Services Occupations by Sex
Within the Services occupations in Quarryville borough, the most male-oriented occupations are Law Enforcement (100.0%), Cleaning & Maintenance (72.2%), and Security & Protection (68.8%), while the most female-oriented occupations are Healthcare Support (100.0%), Firefighting & Prevention (100.0%), and Food Preparation & Serving (68.7%).
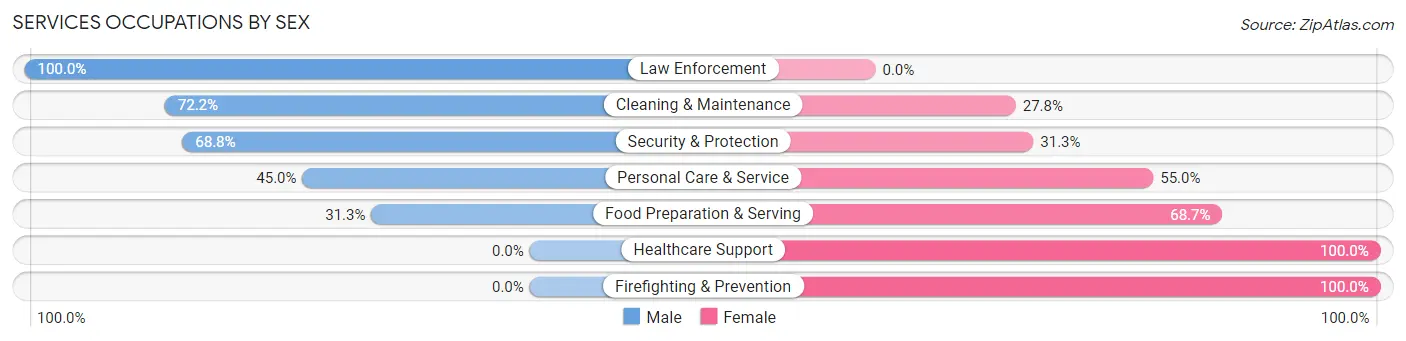
| Occupation | Male | Female |
| Healthcare Support | 0 (0.0%) | 26 (100.0%) |
| Security & Protection | 11 (68.8%) | 5 (31.2%) |
| Firefighting & Prevention | 0 (0.0%) | 5 (100.0%) |
| Law Enforcement | 11 (100.0%) | 0 (0.0%) |
| Food Preparation & Serving | 21 (31.3%) | 46 (68.7%) |
| Cleaning & Maintenance | 13 (72.2%) | 5 (27.8%) |
| Personal Care & Service | 36 (45.0%) | 44 (55.0%) |
| Total (Category) | 81 (39.1%) | 126 (60.9%) |
| Total (Overall) | 683 (52.3%) | 622 (47.7%) |
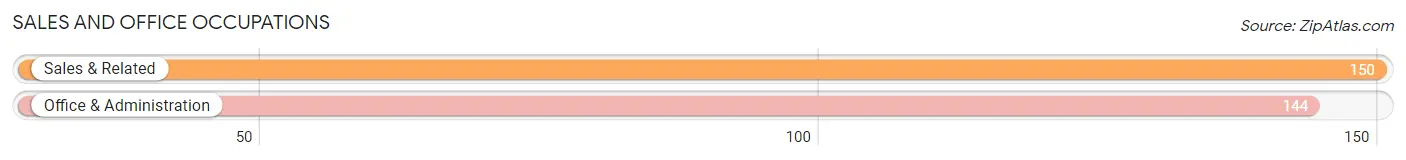
Sales and Office Occupations
The most common Sales and Office occupations in Quarryville borough are Sales & Related (150 | 11.5%), and Office & Administration (144 | 11.0%).
Sales and Office Occupations by Sex
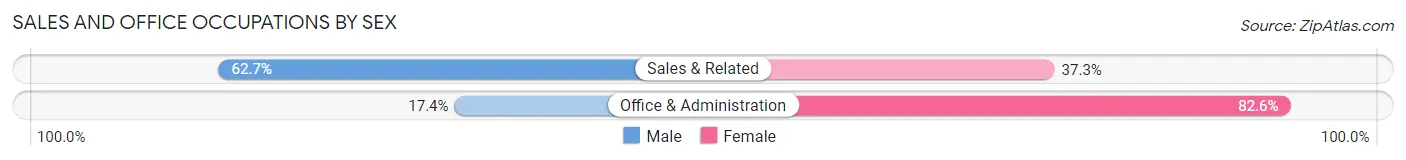
| Occupation | Male | Female |
| Sales & Related | 94 (62.7%) | 56 (37.3%) |
| Office & Administration | 25 (17.4%) | 119 (82.6%) |
| Total (Category) | 119 (40.5%) | 175 (59.5%) |
| Total (Overall) | 683 (52.3%) | 622 (47.7%) |
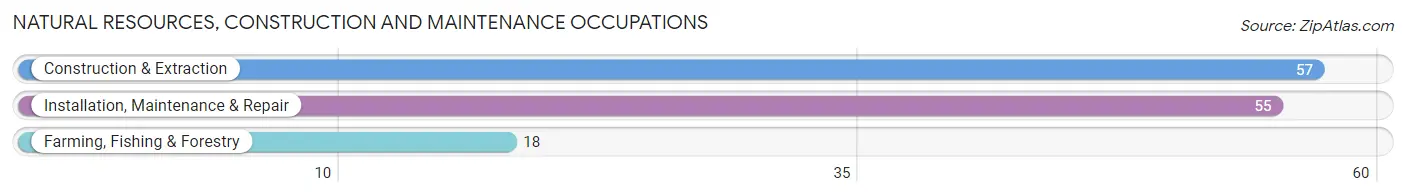
Natural Resources, Construction and Maintenance Occupations
The most common Natural Resources, Construction and Maintenance occupations in Quarryville borough are Construction & Extraction (57 | 4.4%), Installation, Maintenance & Repair (55 | 4.2%), and Farming, Fishing & Forestry (18 | 1.4%).
Natural Resources, Construction and Maintenance Occupations by Sex
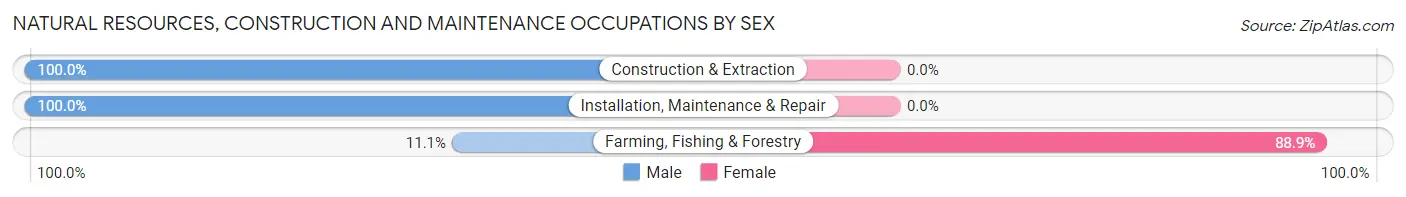
| Occupation | Male | Female |
| Farming, Fishing & Forestry | 2 (11.1%) | 16 (88.9%) |
| Construction & Extraction | 57 (100.0%) | 0 (0.0%) |
| Installation, Maintenance & Repair | 55 (100.0%) | 0 (0.0%) |
| Total (Category) | 114 (87.7%) | 16 (12.3%) |
| Total (Overall) | 683 (52.3%) | 622 (47.7%) |
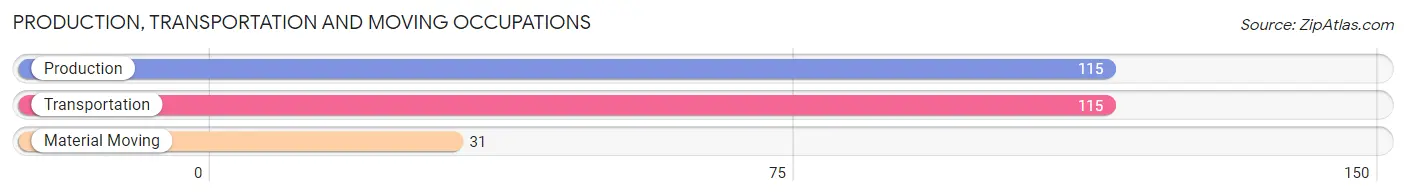
Production, Transportation and Moving Occupations
The most common Production, Transportation and Moving occupations in Quarryville borough are Production (115 | 8.8%), Transportation (115 | 8.8%), and Material Moving (31 | 2.4%).
Production, Transportation and Moving Occupations by Sex
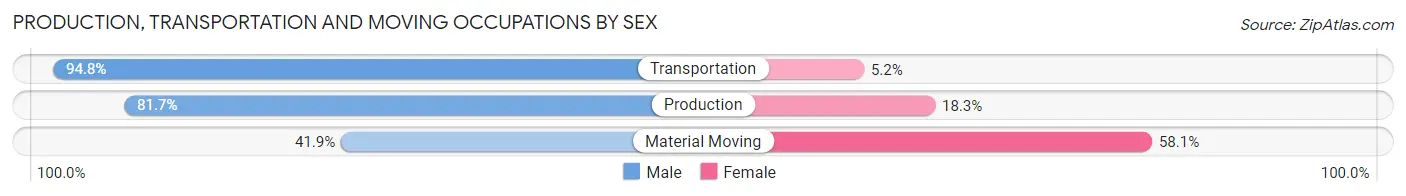
| Occupation | Male | Female |
| Production | 94 (81.7%) | 21 (18.3%) |
| Transportation | 109 (94.8%) | 6 (5.2%) |
| Material Moving | 13 (41.9%) | 18 (58.1%) |
| Total (Category) | 216 (82.8%) | 45 (17.2%) |
| Total (Overall) | 683 (52.3%) | 622 (47.7%) |
Employment Industries by Sex in Quarryville borough
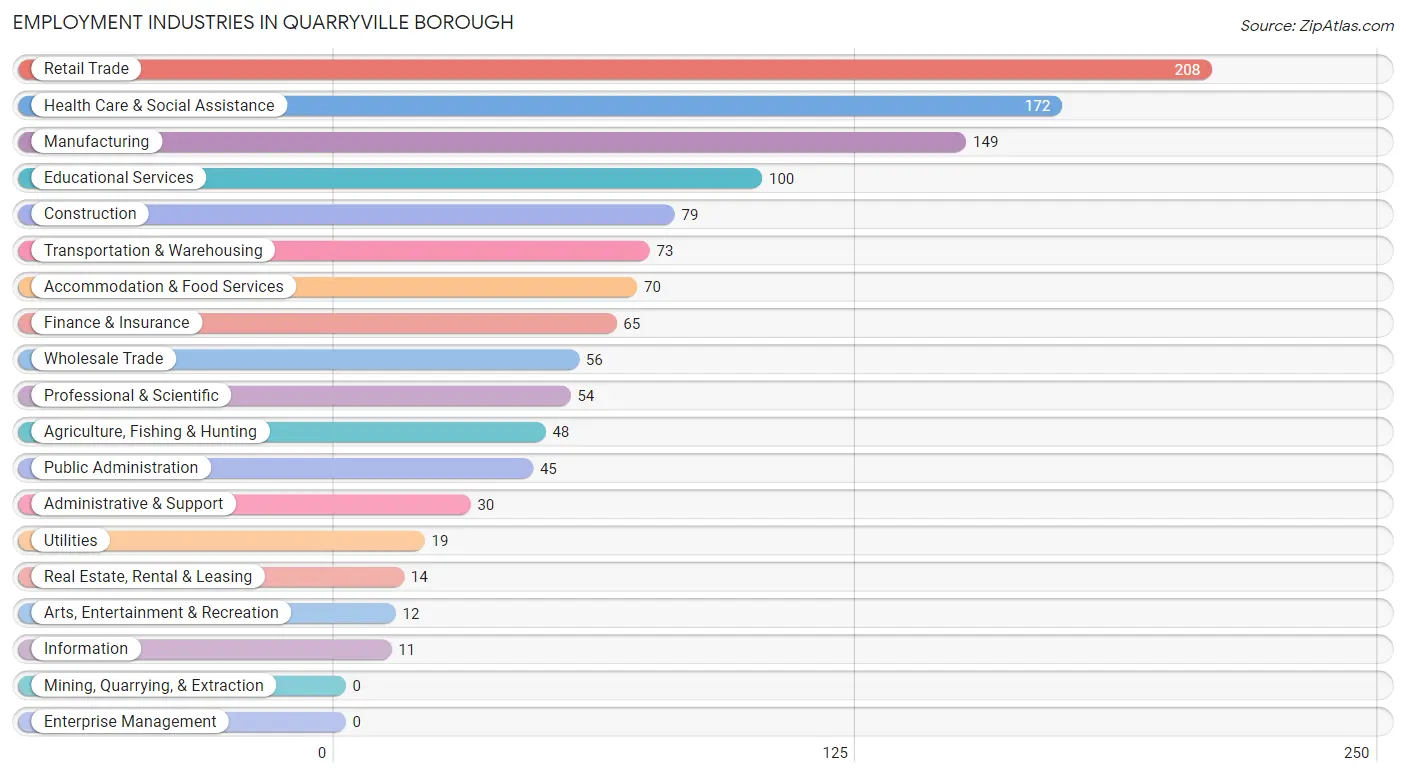
Employment Industries in Quarryville borough
The major employment industries in Quarryville borough include Retail Trade (208 | 15.9%), Health Care & Social Assistance (172 | 13.2%), Manufacturing (149 | 11.4%), Educational Services (100 | 7.7%), and Construction (79 | 6.0%).
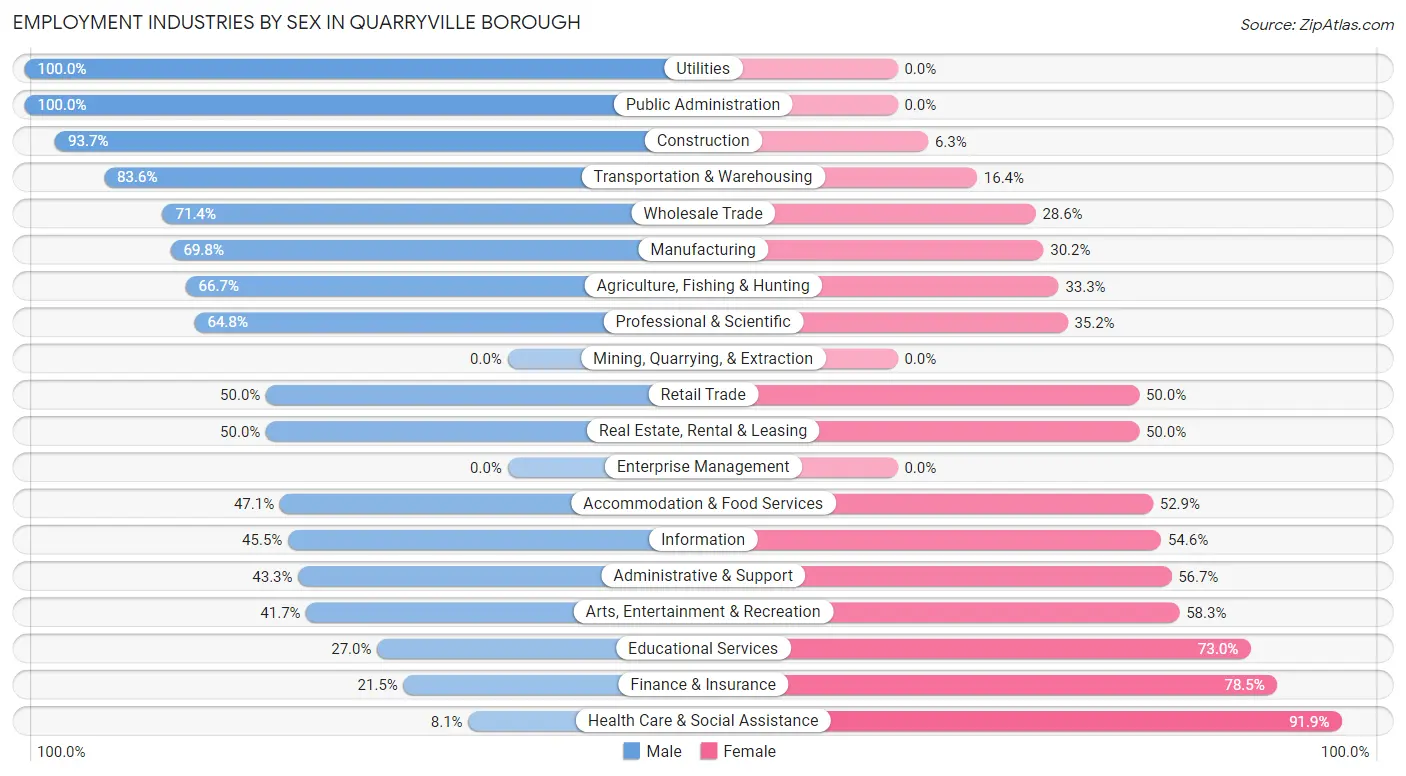
Employment Industries by Sex in Quarryville borough
The Quarryville borough industries that see more men than women are Utilities (100.0%), Public Administration (100.0%), and Construction (93.7%), whereas the industries that tend to have a higher number of women are Health Care & Social Assistance (91.9%), Finance & Insurance (78.5%), and Educational Services (73.0%).
| Industry | Male | Female |
| Agriculture, Fishing & Hunting | 32 (66.7%) | 16 (33.3%) |
| Mining, Quarrying, & Extraction | 0 (0.0%) | 0 (0.0%) |
| Construction | 74 (93.7%) | 5 (6.3%) |
| Manufacturing | 104 (69.8%) | 45 (30.2%) |
| Wholesale Trade | 40 (71.4%) | 16 (28.6%) |
| Retail Trade | 104 (50.0%) | 104 (50.0%) |
| Transportation & Warehousing | 61 (83.6%) | 12 (16.4%) |
| Utilities | 19 (100.0%) | 0 (0.0%) |
| Information | 5 (45.5%) | 6 (54.5%) |
| Finance & Insurance | 14 (21.5%) | 51 (78.5%) |
| Real Estate, Rental & Leasing | 7 (50.0%) | 7 (50.0%) |
| Professional & Scientific | 35 (64.8%) | 19 (35.2%) |
| Enterprise Management | 0 (0.0%) | 0 (0.0%) |
| Administrative & Support | 13 (43.3%) | 17 (56.7%) |
| Educational Services | 27 (27.0%) | 73 (73.0%) |
| Health Care & Social Assistance | 14 (8.1%) | 158 (91.9%) |
| Arts, Entertainment & Recreation | 5 (41.7%) | 7 (58.3%) |
| Accommodation & Food Services | 33 (47.1%) | 37 (52.9%) |
| Public Administration | 45 (100.0%) | 0 (0.0%) |
| Total | 683 (52.3%) | 622 (47.7%) |
Education in Quarryville borough
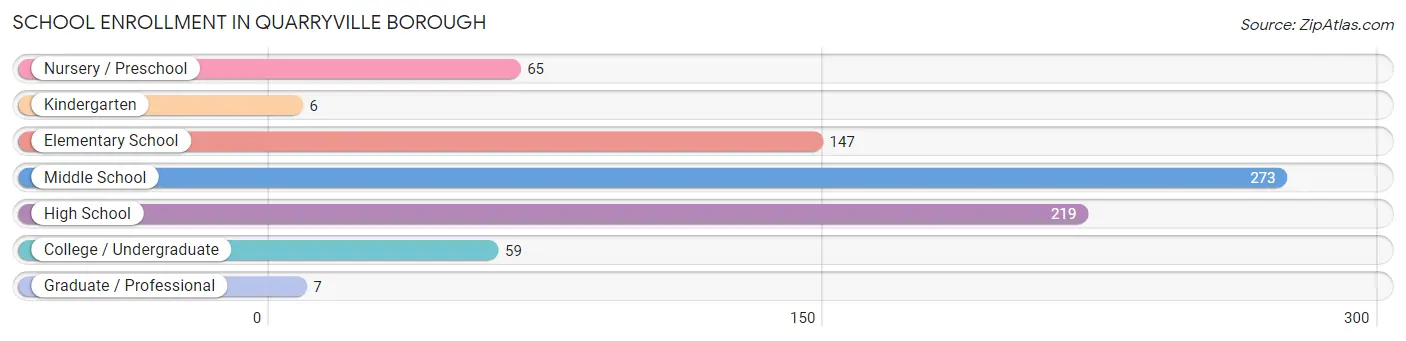
School Enrollment in Quarryville borough
The most common levels of schooling among the 776 students in Quarryville borough are middle school (273 | 35.2%), high school (219 | 28.2%), and elementary school (147 | 18.9%).
| School Level | # Students | % Students |
| Nursery / Preschool | 65 | 8.4% |
| Kindergarten | 6 | 0.8% |
| Elementary School | 147 | 18.9% |
| Middle School | 273 | 35.2% |
| High School | 219 | 28.2% |
| College / Undergraduate | 59 | 7.6% |
| Graduate / Professional | 7 | 0.9% |
| Total | 776 | 100.0% |
School Enrollment by Age by Funding Source in Quarryville borough
Out of a total of 776 students who are enrolled in schools in Quarryville borough, 135 (17.4%) attend a private institution, while the remaining 641 (82.6%) are enrolled in public schools. The age group of 3 to 4 year olds has the highest likelihood of being enrolled in private schools, with 31 (58.5% in the age bracket) enrolled. Conversely, the age group of 15 to 17 year olds has the lowest likelihood of being enrolled in a private school, with 144 (100.0% in the age bracket) attending a public institution.
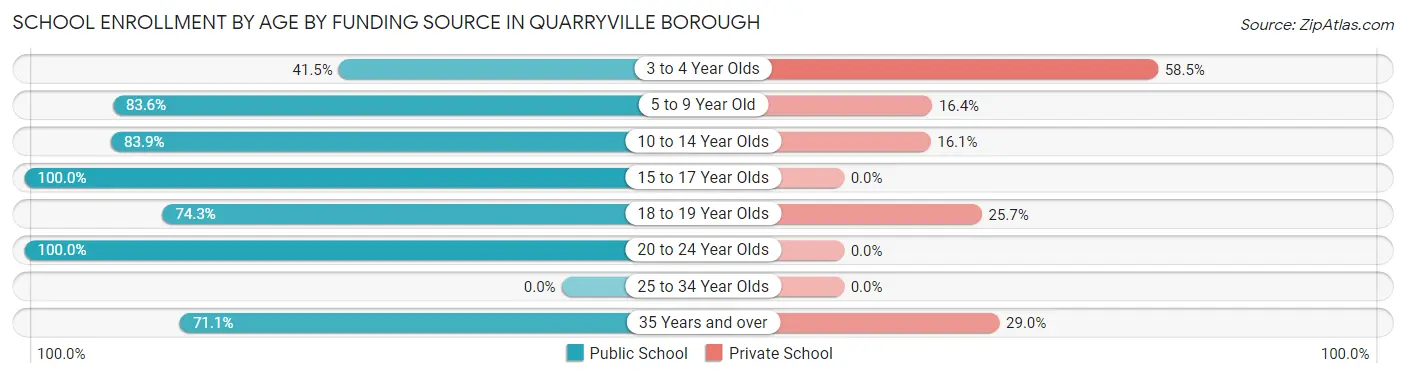
| Age Bracket | Public School | Private School |
| 3 to 4 Year Olds | 22 (41.5%) | 31 (58.5%) |
| 5 to 9 Year Old | 122 (83.6%) | 24 (16.4%) |
| 10 to 14 Year Olds | 260 (83.9%) | 50 (16.1%) |
| 15 to 17 Year Olds | 144 (100.0%) | 0 (0.0%) |
| 18 to 19 Year Olds | 55 (74.3%) | 19 (25.7%) |
| 20 to 24 Year Olds | 11 (100.0%) | 0 (0.0%) |
| 25 to 34 Year Olds | 0 (0.0%) | 0 (0.0%) |
| 35 Years and over | 27 (71.1%) | 11 (28.9%) |
| Total | 641 (82.6%) | 135 (17.4%) |
Educational Attainment by Field of Study in Quarryville borough
Education (131 | 27.2%), business (66 | 13.7%), bio, nature & agricultural (49 | 10.2%), liberal arts & history (41 | 8.5%), and science & technology (38 | 7.9%) are the most common fields of study among 481 individuals in Quarryville borough who have obtained a bachelor's degree or higher.
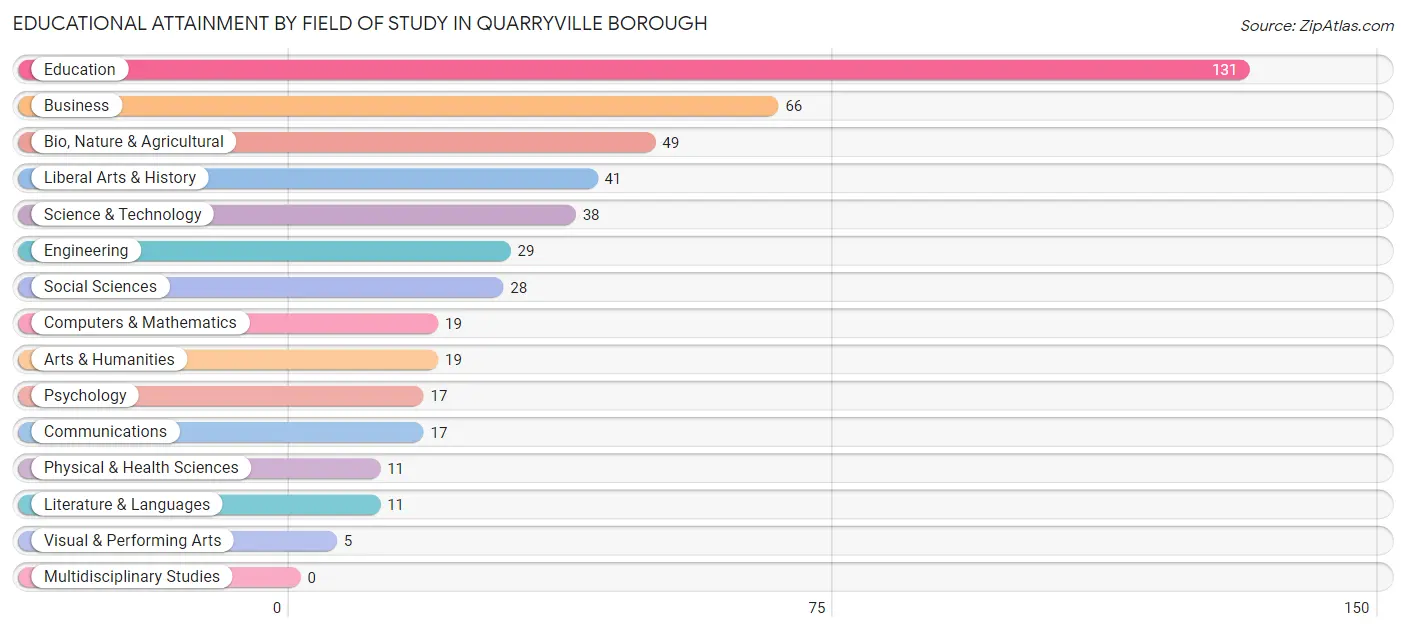
| Field of Study | # Graduates | % Graduates |
| Computers & Mathematics | 19 | 4.0% |
| Bio, Nature & Agricultural | 49 | 10.2% |
| Physical & Health Sciences | 11 | 2.3% |
| Psychology | 17 | 3.5% |
| Social Sciences | 28 | 5.8% |
| Engineering | 29 | 6.0% |
| Multidisciplinary Studies | 0 | 0.0% |
| Science & Technology | 38 | 7.9% |
| Business | 66 | 13.7% |
| Education | 131 | 27.2% |
| Literature & Languages | 11 | 2.3% |
| Liberal Arts & History | 41 | 8.5% |
| Visual & Performing Arts | 5 | 1.0% |
| Communications | 17 | 3.5% |
| Arts & Humanities | 19 | 4.0% |
| Total | 481 | 100.0% |
Transportation & Commute in Quarryville borough
Vehicle Availability by Sex in Quarryville borough
The most prevalent vehicle ownership categories in Quarryville borough are males with 2 vehicles (275, accounting for 41.2%) and females with 2 vehicles (265, making up 44.6%).
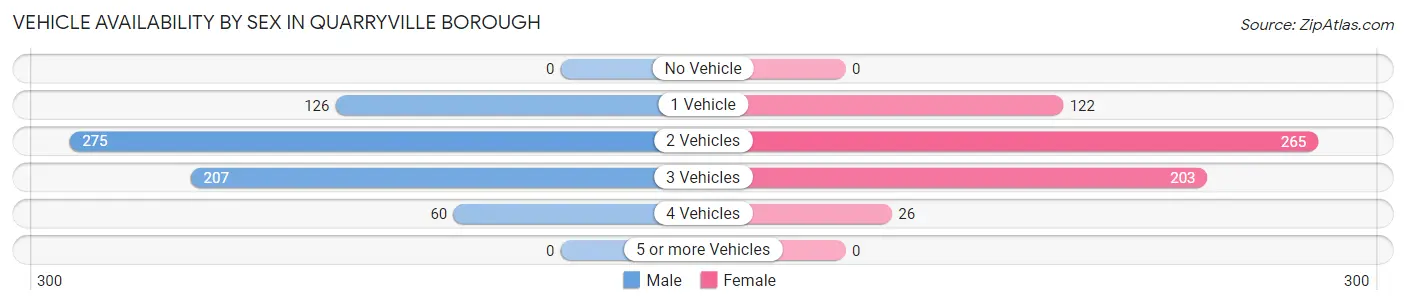
| Vehicles Available | Male | Female |
| No Vehicle | 0 (0.0%) | 0 (0.0%) |
| 1 Vehicle | 126 (18.9%) | 122 (19.8%) |
| 2 Vehicles | 275 (41.2%) | 265 (43.0%) |
| 3 Vehicles | 207 (31.0%) | 203 (33.0%) |
| 4 Vehicles | 60 (9.0%) | 26 (4.2%) |
| 5 or more Vehicles | 0 (0.0%) | 0 (0.0%) |
| Total | 668 (100.0%) | 616 (100.0%) |
Commute Time in Quarryville borough
The most frequently occuring commute durations in Quarryville borough are 5 to 9 minutes (221 commuters, 18.0%), 20 to 24 minutes (201 commuters, 16.4%), and 30 to 34 minutes (141 commuters, 11.5%).
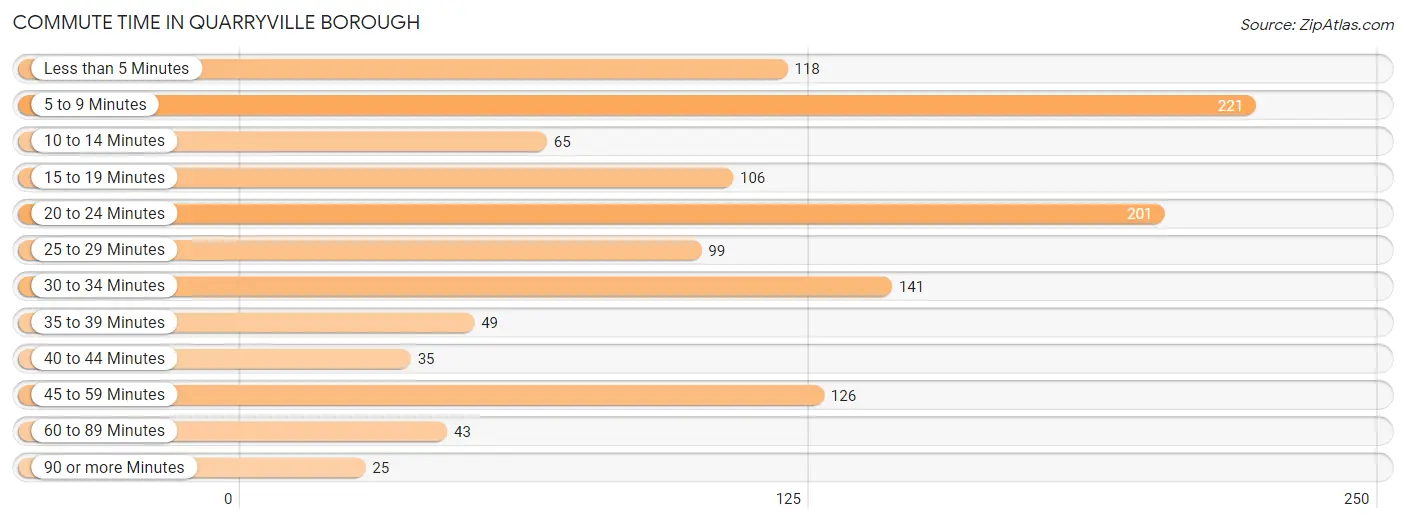
| Commute Time | # Commuters | % Commuters |
| Less than 5 Minutes | 118 | 9.6% |
| 5 to 9 Minutes | 221 | 18.0% |
| 10 to 14 Minutes | 65 | 5.3% |
| 15 to 19 Minutes | 106 | 8.6% |
| 20 to 24 Minutes | 201 | 16.4% |
| 25 to 29 Minutes | 99 | 8.1% |
| 30 to 34 Minutes | 141 | 11.5% |
| 35 to 39 Minutes | 49 | 4.0% |
| 40 to 44 Minutes | 35 | 2.9% |
| 45 to 59 Minutes | 126 | 10.2% |
| 60 to 89 Minutes | 43 | 3.5% |
| 90 or more Minutes | 25 | 2.0% |
Commute Time by Sex in Quarryville borough
The most common commute times in Quarryville borough are 20 to 24 minutes (115 commuters, 17.8%) for males and 5 to 9 minutes (151 commuters, 25.9%) for females.
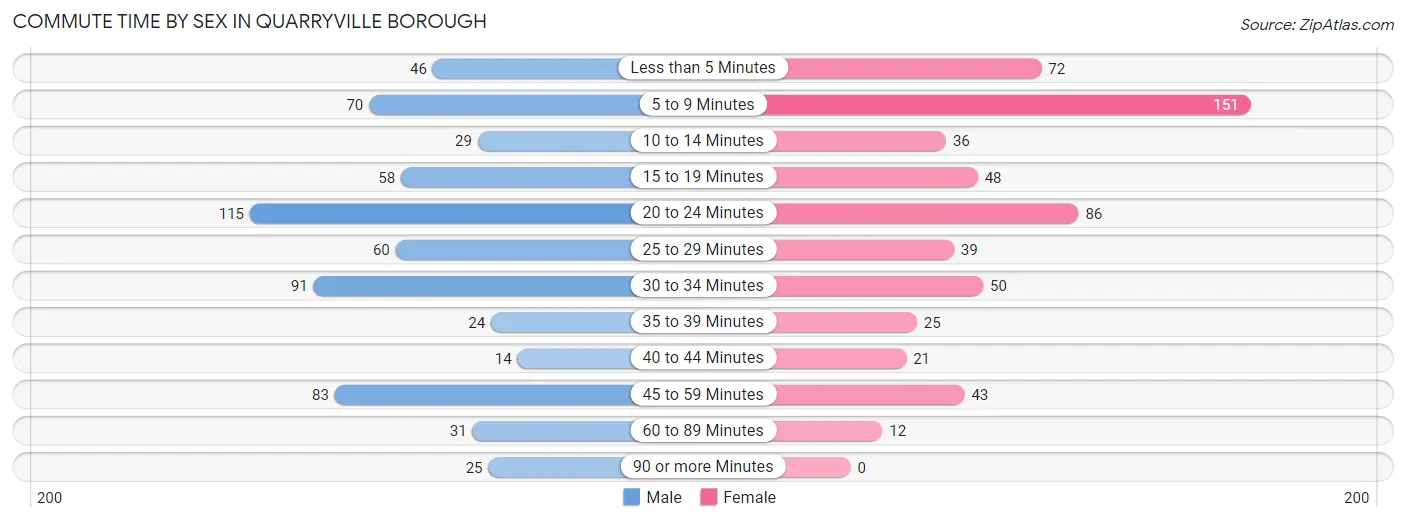
| Commute Time | Male | Female |
| Less than 5 Minutes | 46 (7.1%) | 72 (12.3%) |
| 5 to 9 Minutes | 70 (10.8%) | 151 (25.9%) |
| 10 to 14 Minutes | 29 (4.5%) | 36 (6.2%) |
| 15 to 19 Minutes | 58 (9.0%) | 48 (8.2%) |
| 20 to 24 Minutes | 115 (17.8%) | 86 (14.7%) |
| 25 to 29 Minutes | 60 (9.3%) | 39 (6.7%) |
| 30 to 34 Minutes | 91 (14.1%) | 50 (8.6%) |
| 35 to 39 Minutes | 24 (3.7%) | 25 (4.3%) |
| 40 to 44 Minutes | 14 (2.2%) | 21 (3.6%) |
| 45 to 59 Minutes | 83 (12.9%) | 43 (7.4%) |
| 60 to 89 Minutes | 31 (4.8%) | 12 (2.1%) |
| 90 or more Minutes | 25 (3.9%) | 0 (0.0%) |
Time of Departure to Work by Sex in Quarryville borough
The most frequent times of departure to work in Quarryville borough are 7:00 AM to 7:29 AM (109, 16.9%) for males and 7:00 AM to 7:29 AM (97, 16.6%) for females.
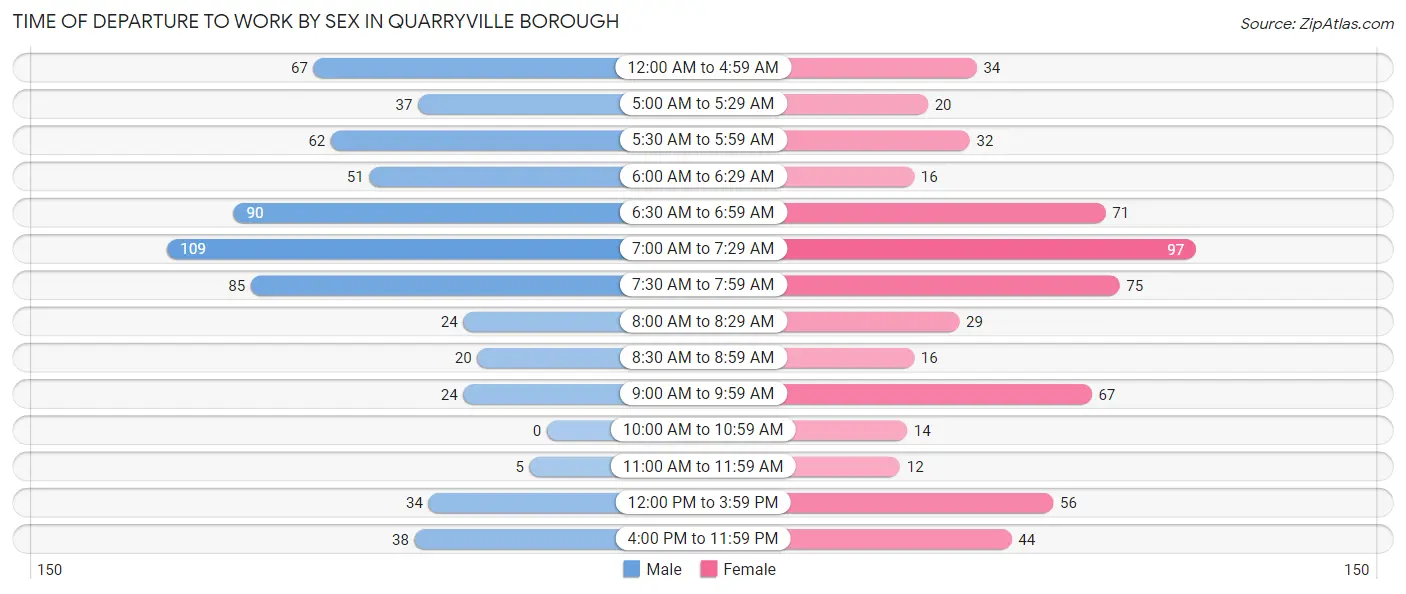
| Time of Departure | Male | Female |
| 12:00 AM to 4:59 AM | 67 (10.4%) | 34 (5.8%) |
| 5:00 AM to 5:29 AM | 37 (5.7%) | 20 (3.4%) |
| 5:30 AM to 5:59 AM | 62 (9.6%) | 32 (5.5%) |
| 6:00 AM to 6:29 AM | 51 (7.9%) | 16 (2.7%) |
| 6:30 AM to 6:59 AM | 90 (13.9%) | 71 (12.2%) |
| 7:00 AM to 7:29 AM | 109 (16.9%) | 97 (16.6%) |
| 7:30 AM to 7:59 AM | 85 (13.2%) | 75 (12.9%) |
| 8:00 AM to 8:29 AM | 24 (3.7%) | 29 (5.0%) |
| 8:30 AM to 8:59 AM | 20 (3.1%) | 16 (2.7%) |
| 9:00 AM to 9:59 AM | 24 (3.7%) | 67 (11.5%) |
| 10:00 AM to 10:59 AM | 0 (0.0%) | 14 (2.4%) |
| 11:00 AM to 11:59 AM | 5 (0.8%) | 12 (2.1%) |
| 12:00 PM to 3:59 PM | 34 (5.3%) | 56 (9.6%) |
| 4:00 PM to 11:59 PM | 38 (5.9%) | 44 (7.5%) |
| Total | 646 (100.0%) | 583 (100.0%) |
Housing Occupancy in Quarryville borough
Occupancy by Ownership in Quarryville borough
Of the total 1,032 dwellings in Quarryville borough, owner-occupied units account for 616 (59.7%), while renter-occupied units make up 416 (40.3%).
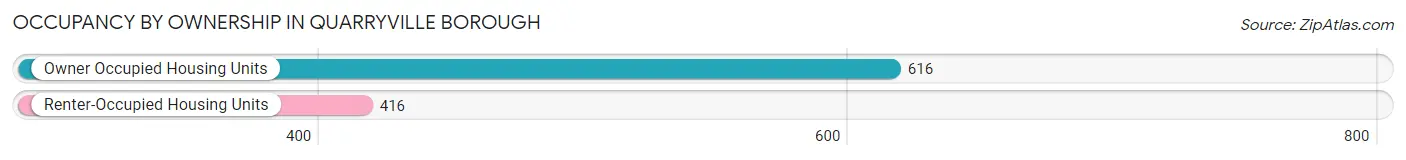
| Occupancy | # Housing Units | % Housing Units |
| Owner Occupied Housing Units | 616 | 59.7% |
| Renter-Occupied Housing Units | 416 | 40.3% |
| Total Occupied Housing Units | 1,032 | 100.0% |
Occupancy by Household Size in Quarryville borough
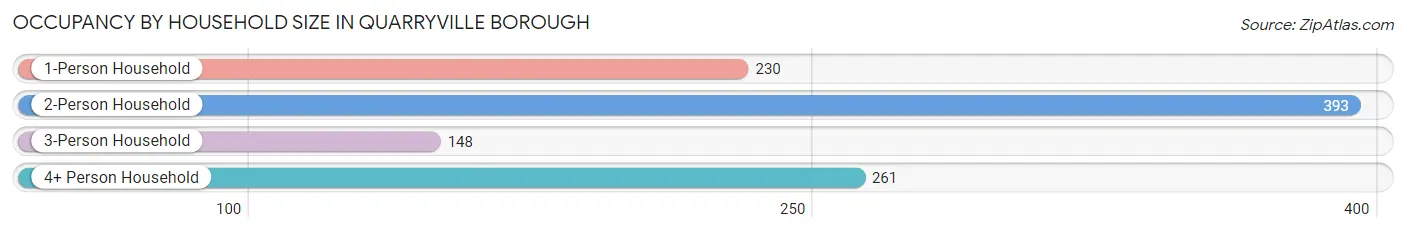
| Household Size | # Housing Units | % Housing Units |
| 1-Person Household | 230 | 22.3% |
| 2-Person Household | 393 | 38.1% |
| 3-Person Household | 148 | 14.3% |
| 4+ Person Household | 261 | 25.3% |
| Total Housing Units | 1,032 | 100.0% |
Occupancy by Ownership by Household Size in Quarryville borough
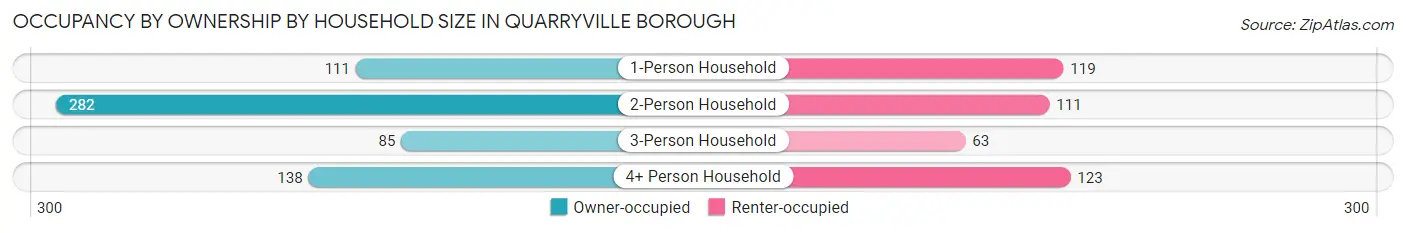
| Household Size | Owner-occupied | Renter-occupied |
| 1-Person Household | 111 (48.3%) | 119 (51.7%) |
| 2-Person Household | 282 (71.8%) | 111 (28.2%) |
| 3-Person Household | 85 (57.4%) | 63 (42.6%) |
| 4+ Person Household | 138 (52.9%) | 123 (47.1%) |
| Total Housing Units | 616 (59.7%) | 416 (40.3%) |
Occupancy by Educational Attainment in Quarryville borough
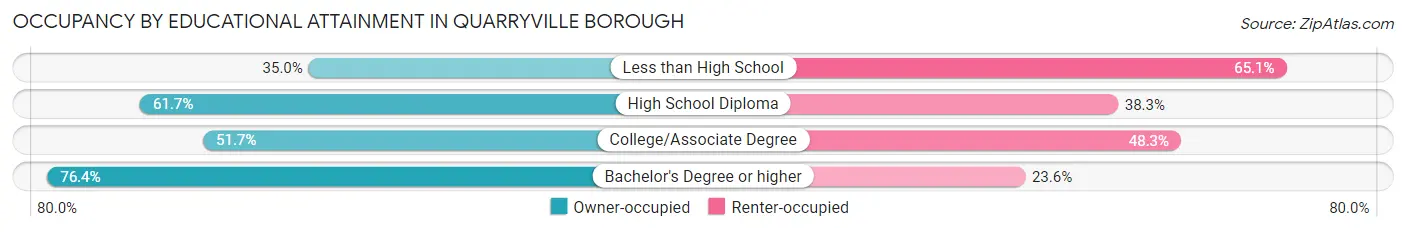
| Household Size | Owner-occupied | Renter-occupied |
| Less than High School | 36 (34.9%) | 67 (65.0%) |
| High School Diploma | 235 (61.7%) | 146 (38.3%) |
| College/Associate Degree | 154 (51.7%) | 144 (48.3%) |
| Bachelor's Degree or higher | 191 (76.4%) | 59 (23.6%) |
Occupancy by Age of Householder in Quarryville borough
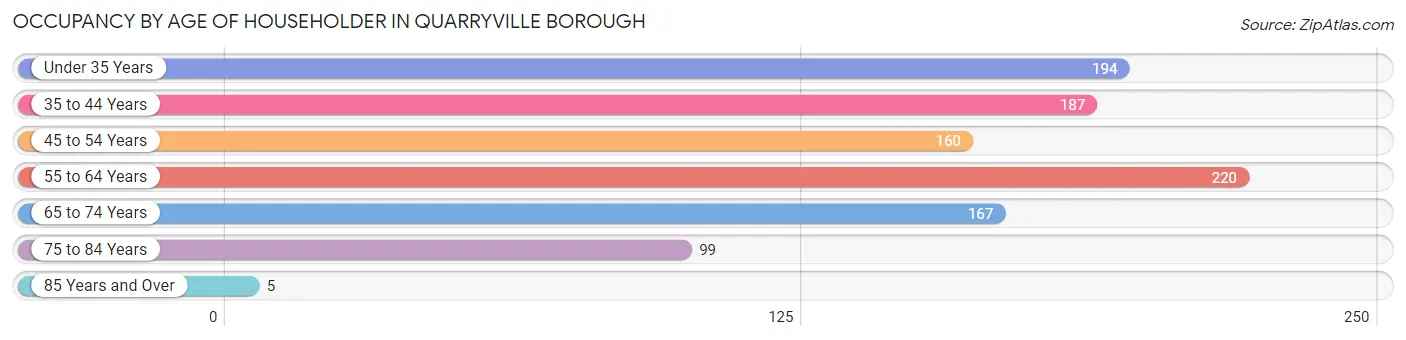
| Age Bracket | # Households | % Households |
| Under 35 Years | 194 | 18.8% |
| 35 to 44 Years | 187 | 18.1% |
| 45 to 54 Years | 160 | 15.5% |
| 55 to 64 Years | 220 | 21.3% |
| 65 to 74 Years | 167 | 16.2% |
| 75 to 84 Years | 99 | 9.6% |
| 85 Years and Over | 5 | 0.5% |
| Total | 1,032 | 100.0% |
Housing Finances in Quarryville borough
Median Income by Occupancy in Quarryville borough
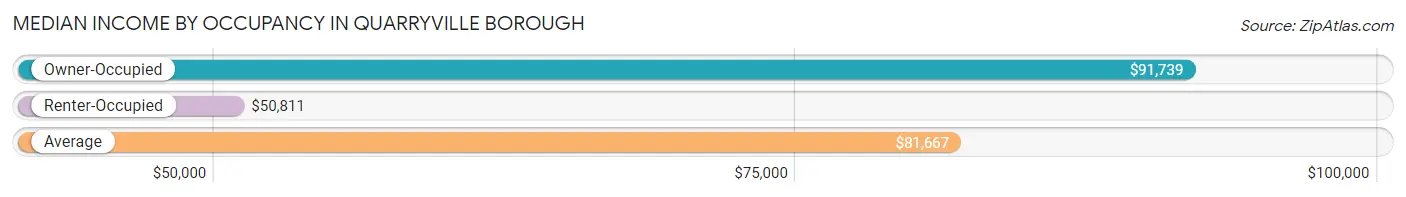
| Occupancy Type | # Households | Median Income |
| Owner-Occupied | 616 (59.7%) | $91,739 |
| Renter-Occupied | 416 (40.3%) | $50,811 |
| Average | 1,032 (100.0%) | $81,667 |
Occupancy by Householder Income Bracket in Quarryville borough
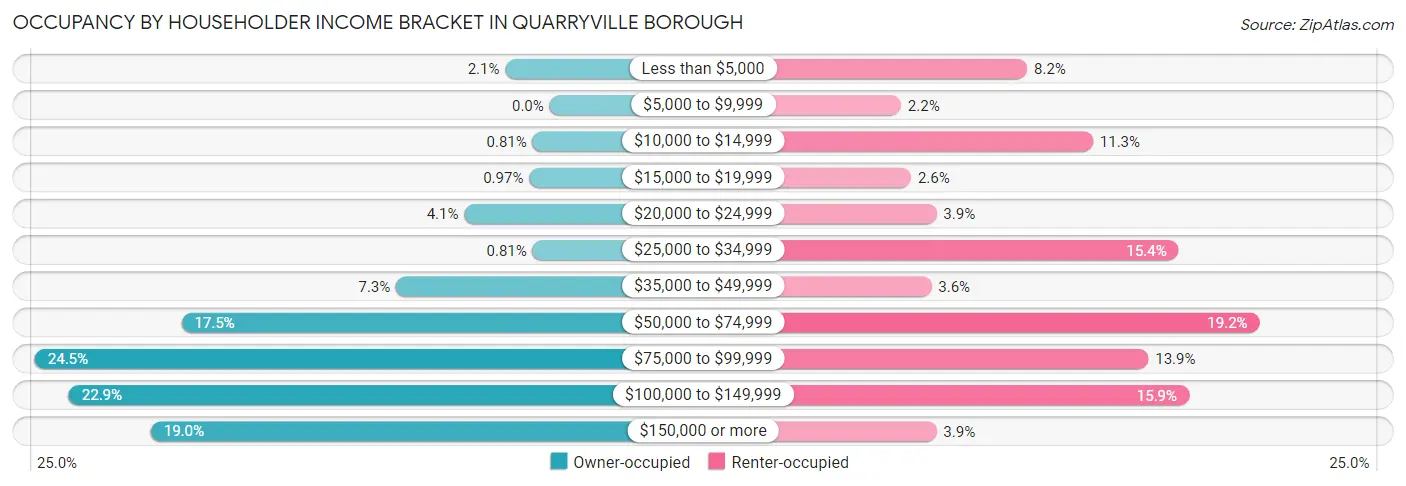
| Income Bracket | Owner-occupied | Renter-occupied |
| Less than $5,000 | 13 (2.1%) | 34 (8.2%) |
| $5,000 to $9,999 | 0 (0.0%) | 9 (2.2%) |
| $10,000 to $14,999 | 5 (0.8%) | 47 (11.3%) |
| $15,000 to $19,999 | 6 (1.0%) | 11 (2.6%) |
| $20,000 to $24,999 | 25 (4.1%) | 16 (3.8%) |
| $25,000 to $34,999 | 5 (0.8%) | 64 (15.4%) |
| $35,000 to $49,999 | 45 (7.3%) | 15 (3.6%) |
| $50,000 to $74,999 | 108 (17.5%) | 80 (19.2%) |
| $75,000 to $99,999 | 151 (24.5%) | 58 (13.9%) |
| $100,000 to $149,999 | 141 (22.9%) | 66 (15.9%) |
| $150,000 or more | 117 (19.0%) | 16 (3.8%) |
| Total | 616 (100.0%) | 416 (100.0%) |
Monthly Housing Cost Tiers in Quarryville borough
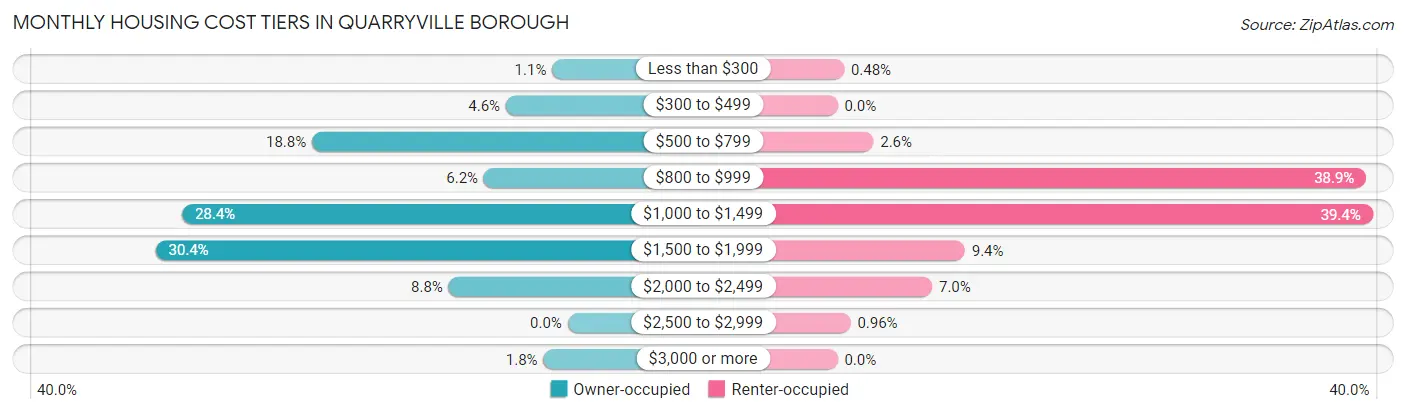
| Monthly Cost | Owner-occupied | Renter-occupied |
| Less than $300 | 7 (1.1%) | 2 (0.5%) |
| $300 to $499 | 28 (4.5%) | 0 (0.0%) |
| $500 to $799 | 116 (18.8%) | 11 (2.6%) |
| $800 to $999 | 38 (6.2%) | 162 (38.9%) |
| $1,000 to $1,499 | 175 (28.4%) | 164 (39.4%) |
| $1,500 to $1,999 | 187 (30.4%) | 39 (9.4%) |
| $2,000 to $2,499 | 54 (8.8%) | 29 (7.0%) |
| $2,500 to $2,999 | 0 (0.0%) | 4 (1.0%) |
| $3,000 or more | 11 (1.8%) | 0 (0.0%) |
| Total | 616 (100.0%) | 416 (100.0%) |
Physical Housing Characteristics in Quarryville borough
Housing Structures in Quarryville borough
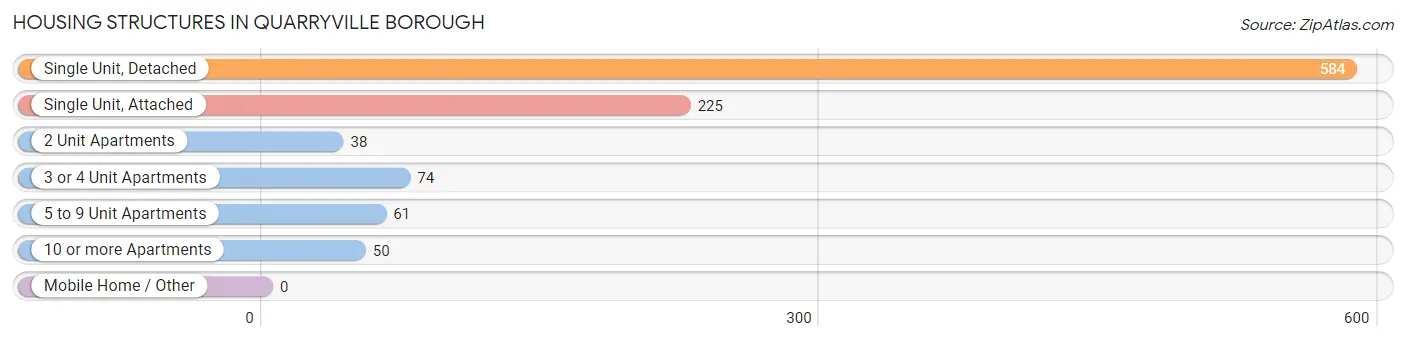
| Structure Type | # Housing Units | % Housing Units |
| Single Unit, Detached | 584 | 56.6% |
| Single Unit, Attached | 225 | 21.8% |
| 2 Unit Apartments | 38 | 3.7% |
| 3 or 4 Unit Apartments | 74 | 7.2% |
| 5 to 9 Unit Apartments | 61 | 5.9% |
| 10 or more Apartments | 50 | 4.8% |
| Mobile Home / Other | 0 | 0.0% |
| Total | 1,032 | 100.0% |
Housing Structures by Occupancy in Quarryville borough
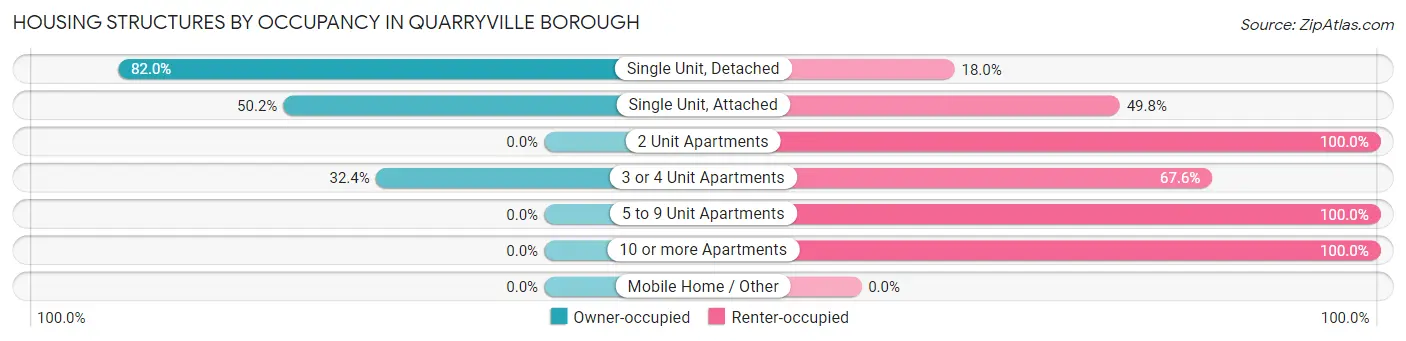
| Structure Type | Owner-occupied | Renter-occupied |
| Single Unit, Detached | 479 (82.0%) | 105 (18.0%) |
| Single Unit, Attached | 113 (50.2%) | 112 (49.8%) |
| 2 Unit Apartments | 0 (0.0%) | 38 (100.0%) |
| 3 or 4 Unit Apartments | 24 (32.4%) | 50 (67.6%) |
| 5 to 9 Unit Apartments | 0 (0.0%) | 61 (100.0%) |
| 10 or more Apartments | 0 (0.0%) | 50 (100.0%) |
| Mobile Home / Other | 0 (0.0%) | 0 (0.0%) |
| Total | 616 (59.7%) | 416 (40.3%) |
Housing Structures by Number of Rooms in Quarryville borough
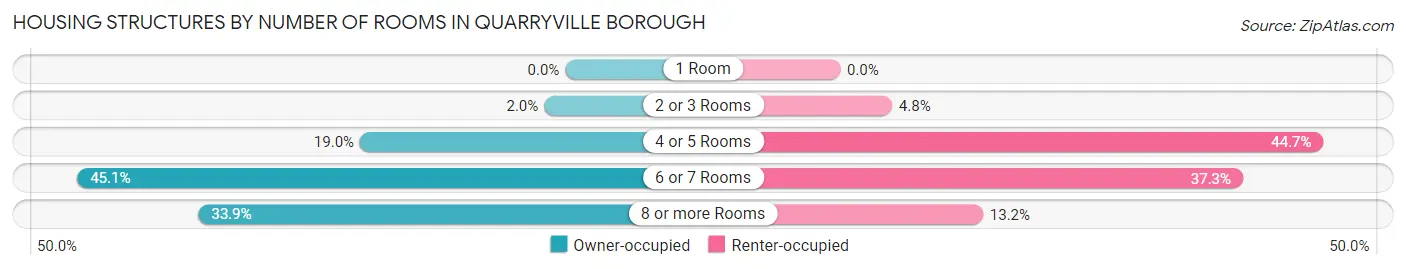
| Number of Rooms | Owner-occupied | Renter-occupied |
| 1 Room | 0 (0.0%) | 0 (0.0%) |
| 2 or 3 Rooms | 12 (1.9%) | 20 (4.8%) |
| 4 or 5 Rooms | 117 (19.0%) | 186 (44.7%) |
| 6 or 7 Rooms | 278 (45.1%) | 155 (37.3%) |
| 8 or more Rooms | 209 (33.9%) | 55 (13.2%) |
| Total | 616 (100.0%) | 416 (100.0%) |
Housing Structure by Heating Type in Quarryville borough
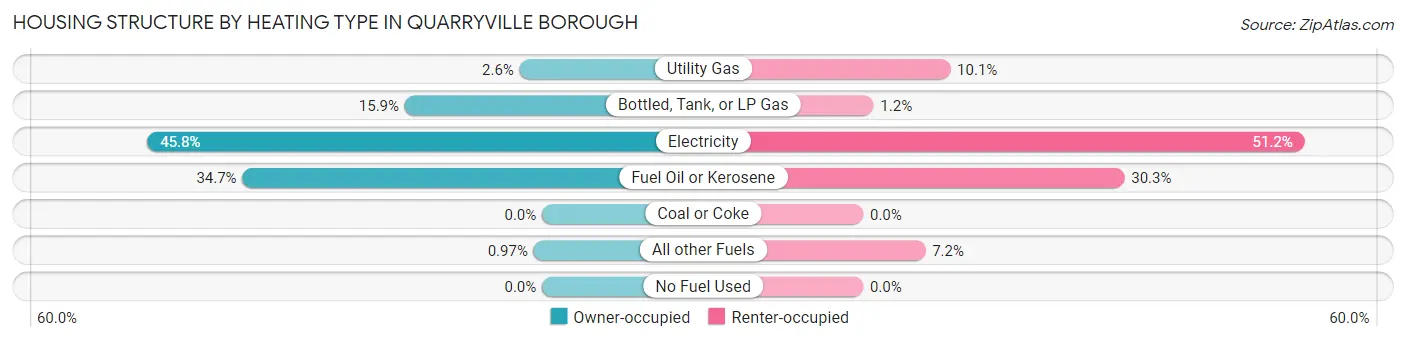
| Heating Type | Owner-occupied | Renter-occupied |
| Utility Gas | 16 (2.6%) | 42 (10.1%) |
| Bottled, Tank, or LP Gas | 98 (15.9%) | 5 (1.2%) |
| Electricity | 282 (45.8%) | 213 (51.2%) |
| Fuel Oil or Kerosene | 214 (34.7%) | 126 (30.3%) |
| Coal or Coke | 0 (0.0%) | 0 (0.0%) |
| All other Fuels | 6 (1.0%) | 30 (7.2%) |
| No Fuel Used | 0 (0.0%) | 0 (0.0%) |
| Total | 616 (100.0%) | 416 (100.0%) |
Household Vehicle Usage in Quarryville borough
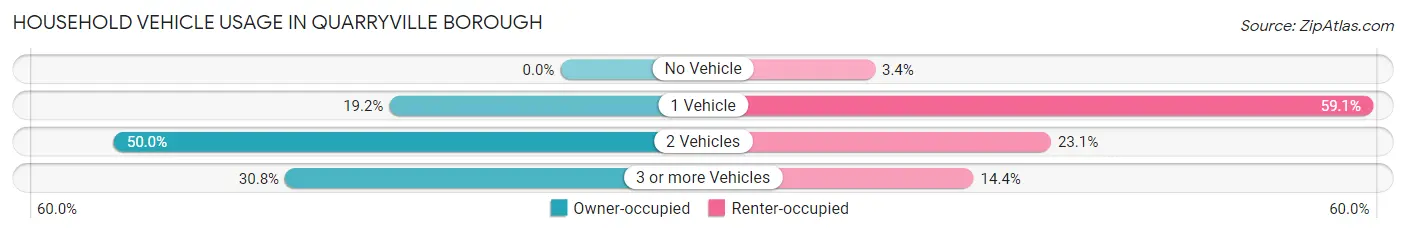
| Vehicles per Household | Owner-occupied | Renter-occupied |
| No Vehicle | 0 (0.0%) | 14 (3.4%) |
| 1 Vehicle | 118 (19.2%) | 246 (59.1%) |
| 2 Vehicles | 308 (50.0%) | 96 (23.1%) |
| 3 or more Vehicles | 190 (30.8%) | 60 (14.4%) |
| Total | 616 (100.0%) | 416 (100.0%) |
Real Estate & Mortgages in Quarryville borough
Real Estate and Mortgage Overview in Quarryville borough
| Characteristic | Without Mortgage | With Mortgage |
| Housing Units | 187 | 429 |
| Median Property Value | $265,000 | $230,500 |
| Median Household Income | $98,750 | $80 |
| Monthly Housing Costs | $611 | $11 |
| Real Estate Taxes | $3,429 | $7 |
Property Value by Mortgage Status in Quarryville borough
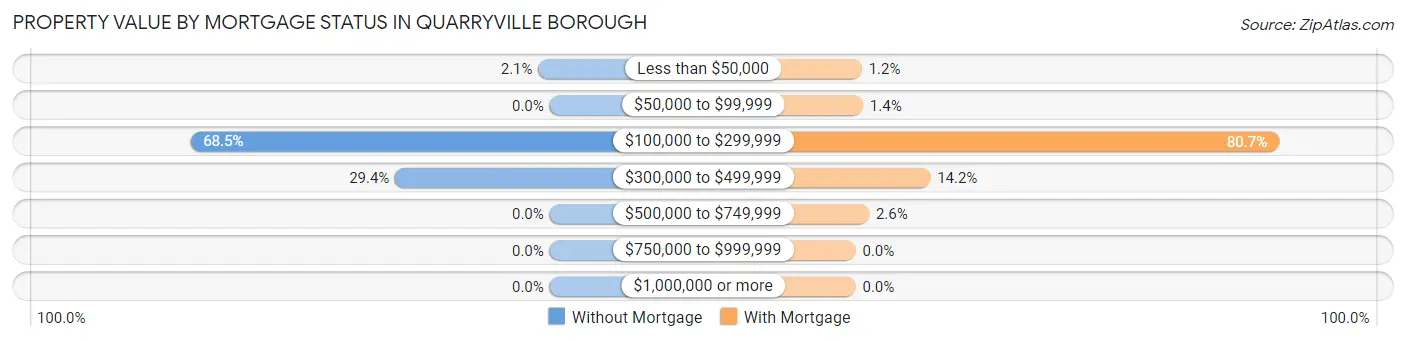
| Property Value | Without Mortgage | With Mortgage |
| Less than $50,000 | 4 (2.1%) | 5 (1.2%) |
| $50,000 to $99,999 | 0 (0.0%) | 6 (1.4%) |
| $100,000 to $299,999 | 128 (68.4%) | 346 (80.6%) |
| $300,000 to $499,999 | 55 (29.4%) | 61 (14.2%) |
| $500,000 to $749,999 | 0 (0.0%) | 11 (2.6%) |
| $750,000 to $999,999 | 0 (0.0%) | 0 (0.0%) |
| $1,000,000 or more | 0 (0.0%) | 0 (0.0%) |
| Total | 187 (100.0%) | 429 (100.0%) |
Household Income by Mortgage Status in Quarryville borough
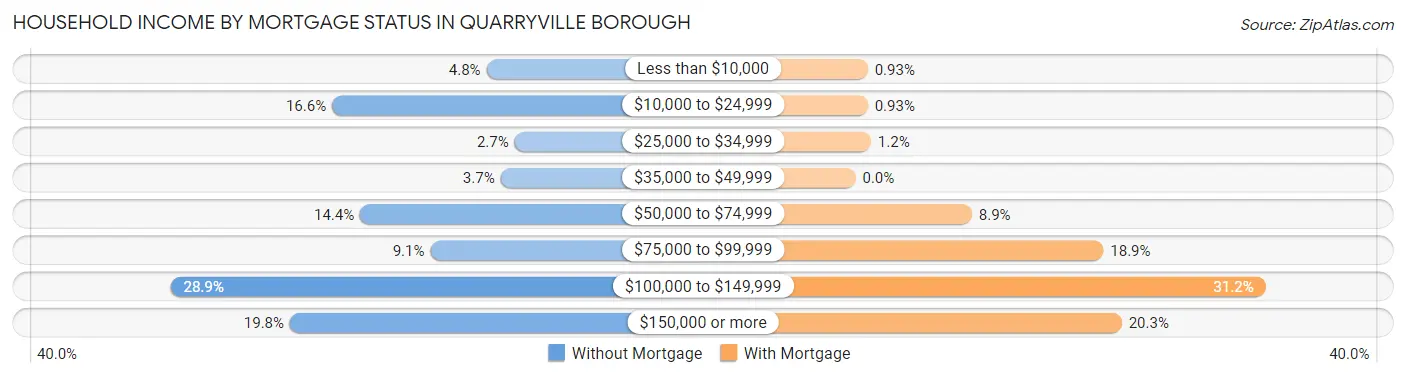
| Household Income | Without Mortgage | With Mortgage |
| Less than $10,000 | 9 (4.8%) | 4 (0.9%) |
| $10,000 to $24,999 | 31 (16.6%) | 4 (0.9%) |
| $25,000 to $34,999 | 5 (2.7%) | 5 (1.2%) |
| $35,000 to $49,999 | 7 (3.7%) | 0 (0.0%) |
| $50,000 to $74,999 | 27 (14.4%) | 38 (8.9%) |
| $75,000 to $99,999 | 17 (9.1%) | 81 (18.9%) |
| $100,000 to $149,999 | 54 (28.9%) | 134 (31.2%) |
| $150,000 or more | 37 (19.8%) | 87 (20.3%) |
| Total | 187 (100.0%) | 429 (100.0%) |
Property Value to Household Income Ratio in Quarryville borough
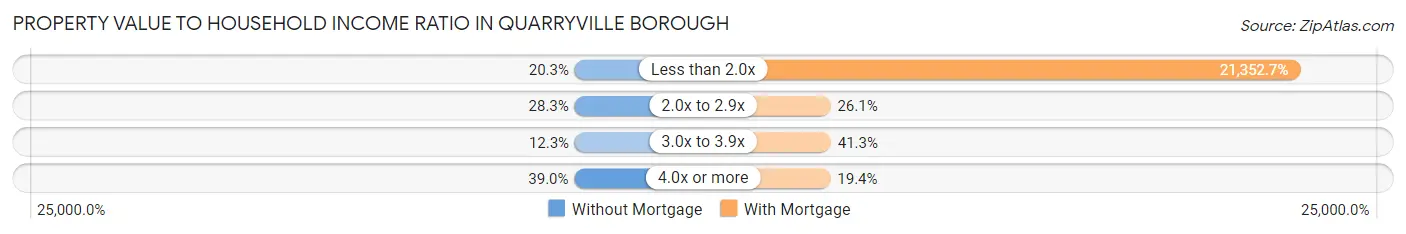
| Value-to-Income Ratio | Without Mortgage | With Mortgage |
| Less than 2.0x | 38 (20.3%) | 91,603 (21,352.7%) |
| 2.0x to 2.9x | 53 (28.3%) | 112 (26.1%) |
| 3.0x to 3.9x | 23 (12.3%) | 177 (41.3%) |
| 4.0x or more | 73 (39.0%) | 83 (19.4%) |
| Total | 187 (100.0%) | 429 (100.0%) |
Real Estate Taxes by Mortgage Status in Quarryville borough
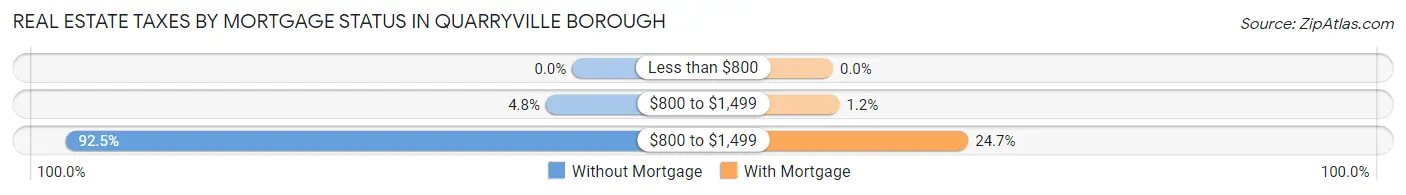
| Property Taxes | Without Mortgage | With Mortgage |
| Less than $800 | 0 (0.0%) | 0 (0.0%) |
| $800 to $1,499 | 9 (4.8%) | 5 (1.2%) |
| $800 to $1,499 | 173 (92.5%) | 106 (24.7%) |
| Total | 187 (100.0%) | 429 (100.0%) |
Health & Disability in Quarryville borough
Health Insurance Coverage by Age in Quarryville borough
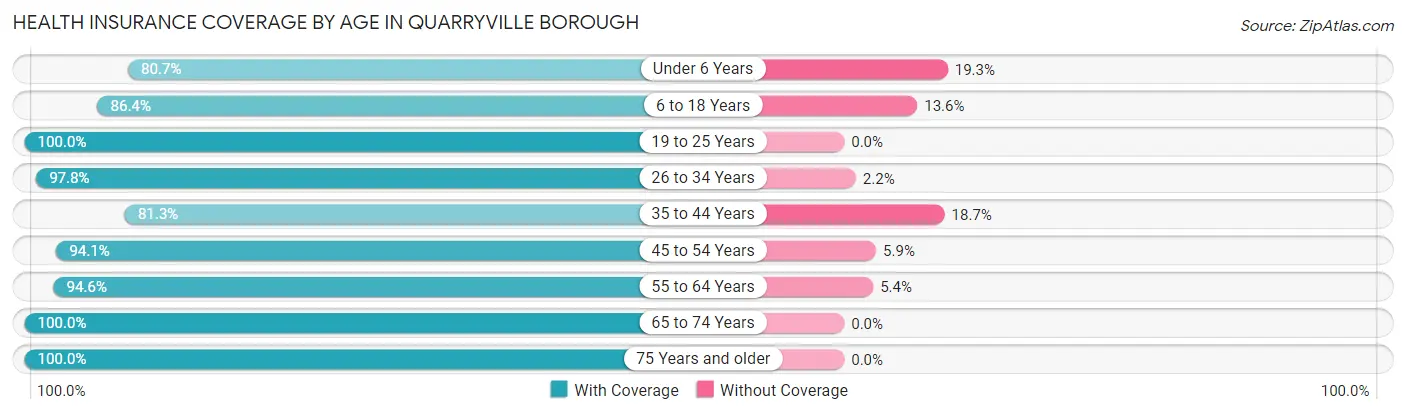
| Age Bracket | With Coverage | Without Coverage |
| Under 6 Years | 184 (80.7%) | 44 (19.3%) |
| 6 to 18 Years | 615 (86.4%) | 97 (13.6%) |
| 19 to 25 Years | 93 (100.0%) | 0 (0.0%) |
| 26 to 34 Years | 316 (97.8%) | 7 (2.2%) |
| 35 to 44 Years | 291 (81.3%) | 67 (18.7%) |
| 45 to 54 Years | 269 (94.1%) | 17 (5.9%) |
| 55 to 64 Years | 368 (94.6%) | 21 (5.4%) |
| 65 to 74 Years | 275 (100.0%) | 0 (0.0%) |
| 75 Years and older | 169 (100.0%) | 0 (0.0%) |
| Total | 2,580 (91.1%) | 253 (8.9%) |
Health Insurance Coverage by Citizenship Status in Quarryville borough
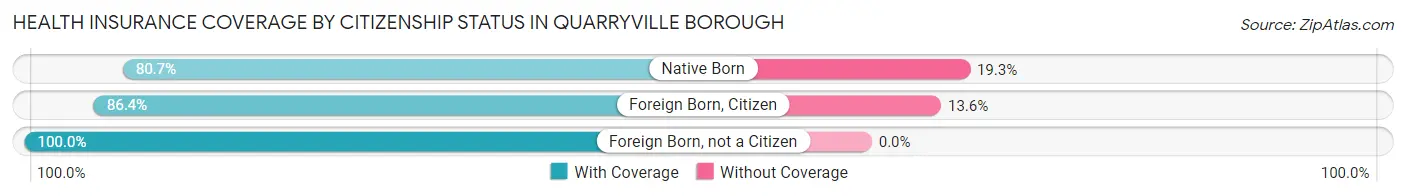
| Citizenship Status | With Coverage | Without Coverage |
| Native Born | 184 (80.7%) | 44 (19.3%) |
| Foreign Born, Citizen | 615 (86.4%) | 97 (13.6%) |
| Foreign Born, not a Citizen | 93 (100.0%) | 0 (0.0%) |
Health Insurance Coverage by Household Income in Quarryville borough
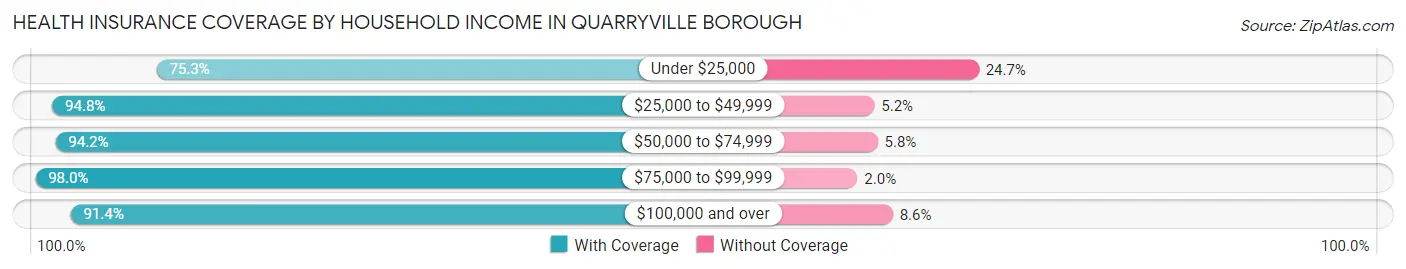
| Household Income | With Coverage | Without Coverage |
| Under $25,000 | 329 (75.3%) | 108 (24.7%) |
| $25,000 to $49,999 | 220 (94.8%) | 12 (5.2%) |
| $50,000 to $74,999 | 441 (94.2%) | 27 (5.8%) |
| $75,000 to $99,999 | 591 (98.0%) | 12 (2.0%) |
| $100,000 and over | 999 (91.4%) | 94 (8.6%) |
Public vs Private Health Insurance Coverage by Age in Quarryville borough
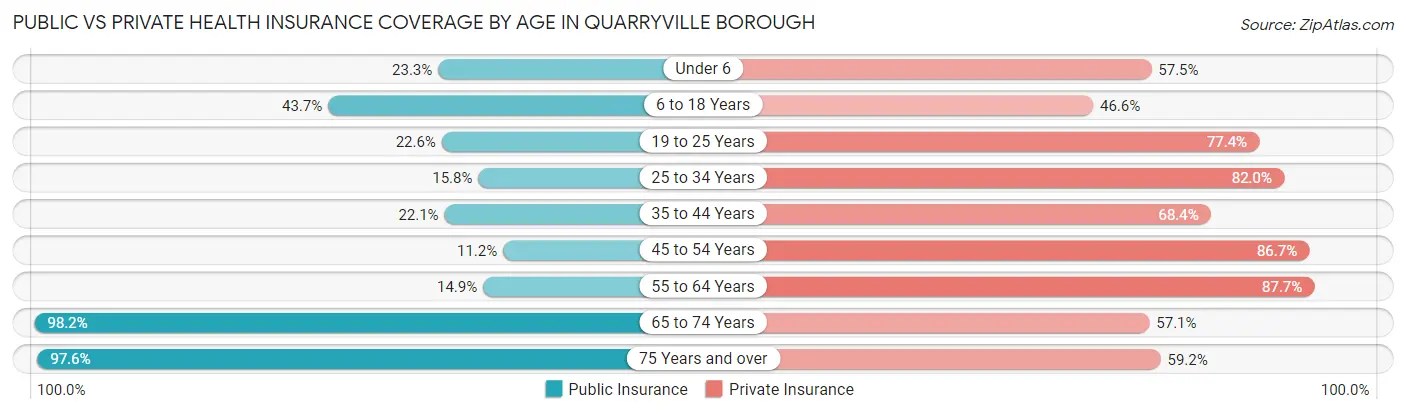
| Age Bracket | Public Insurance | Private Insurance |
| Under 6 | 53 (23.3%) | 131 (57.5%) |
| 6 to 18 Years | 311 (43.7%) | 332 (46.6%) |
| 19 to 25 Years | 21 (22.6%) | 72 (77.4%) |
| 25 to 34 Years | 51 (15.8%) | 265 (82.0%) |
| 35 to 44 Years | 79 (22.1%) | 245 (68.4%) |
| 45 to 54 Years | 32 (11.2%) | 248 (86.7%) |
| 55 to 64 Years | 58 (14.9%) | 341 (87.7%) |
| 65 to 74 Years | 270 (98.2%) | 157 (57.1%) |
| 75 Years and over | 165 (97.6%) | 100 (59.2%) |
| Total | 1,040 (36.7%) | 1,891 (66.7%) |
Disability Status by Sex by Age in Quarryville borough
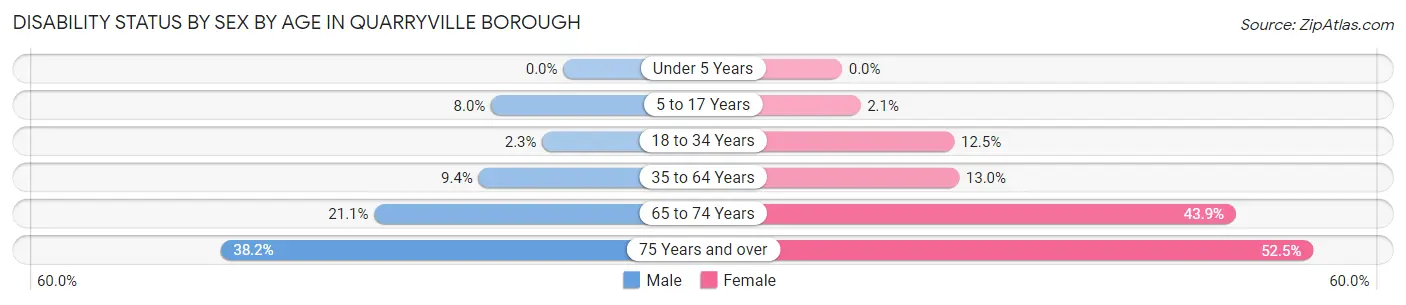
| Age Bracket | Male | Female |
| Under 5 Years | 0 (0.0%) | 0 (0.0%) |
| 5 to 17 Years | 32 (8.0%) | 5 (2.1%) |
| 18 to 34 Years | 6 (2.3%) | 33 (12.5%) |
| 35 to 64 Years | 41 (9.4%) | 78 (13.0%) |
| 65 to 74 Years | 20 (21.0%) | 79 (43.9%) |
| 75 Years and over | 34 (38.2%) | 42 (52.5%) |
Disability Class by Sex by Age in Quarryville borough
Disability Class: Hearing Difficulty
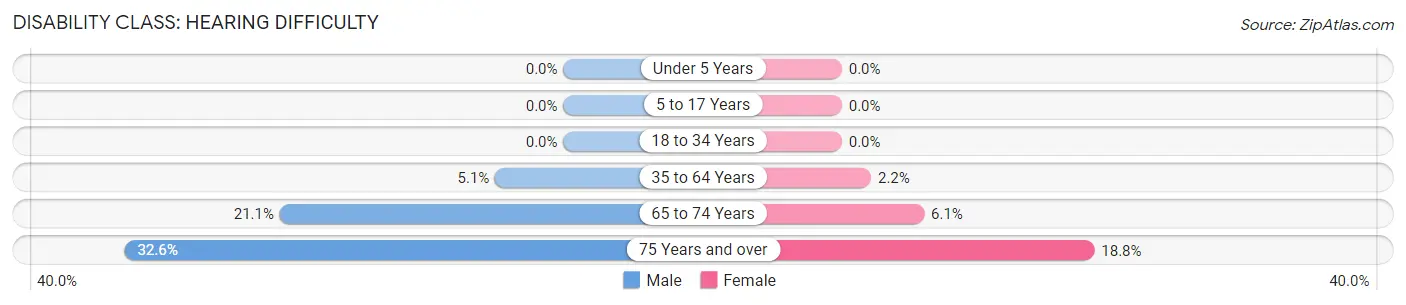
| Age Bracket | Male | Female |
| Under 5 Years | 0 (0.0%) | 0 (0.0%) |
| 5 to 17 Years | 0 (0.0%) | 0 (0.0%) |
| 18 to 34 Years | 0 (0.0%) | 0 (0.0%) |
| 35 to 64 Years | 22 (5.1%) | 13 (2.2%) |
| 65 to 74 Years | 20 (21.0%) | 11 (6.1%) |
| 75 Years and over | 29 (32.6%) | 15 (18.8%) |
Disability Class: Vision Difficulty
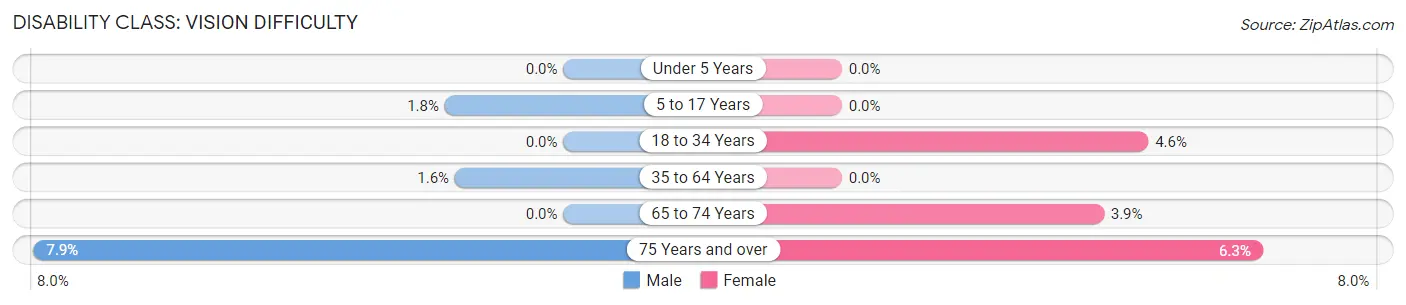
| Age Bracket | Male | Female |
| Under 5 Years | 0 (0.0%) | 0 (0.0%) |
| 5 to 17 Years | 7 (1.8%) | 0 (0.0%) |
| 18 to 34 Years | 0 (0.0%) | 12 (4.5%) |
| 35 to 64 Years | 7 (1.6%) | 0 (0.0%) |
| 65 to 74 Years | 0 (0.0%) | 7 (3.9%) |
| 75 Years and over | 7 (7.9%) | 5 (6.2%) |
Disability Class: Cognitive Difficulty
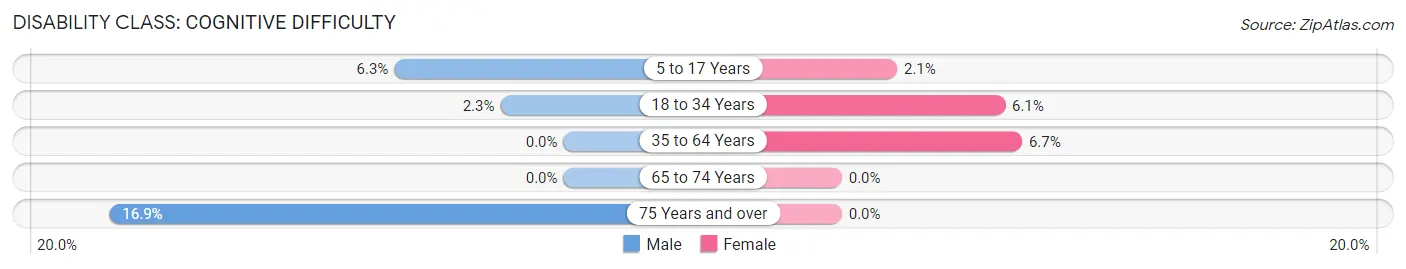
| Age Bracket | Male | Female |
| 5 to 17 Years | 25 (6.3%) | 5 (2.1%) |
| 18 to 34 Years | 6 (2.3%) | 16 (6.1%) |
| 35 to 64 Years | 0 (0.0%) | 40 (6.7%) |
| 65 to 74 Years | 0 (0.0%) | 0 (0.0%) |
| 75 Years and over | 15 (16.9%) | 0 (0.0%) |
Disability Class: Ambulatory Difficulty
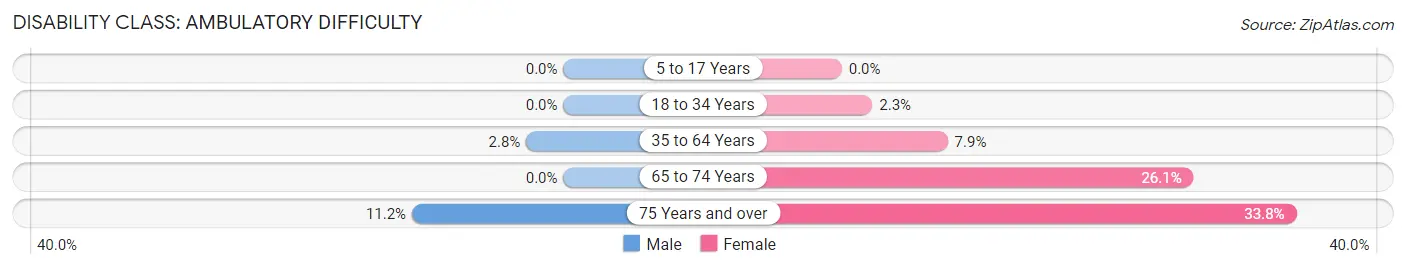
| Age Bracket | Male | Female |
| 5 to 17 Years | 0 (0.0%) | 0 (0.0%) |
| 18 to 34 Years | 0 (0.0%) | 6 (2.3%) |
| 35 to 64 Years | 12 (2.8%) | 47 (7.9%) |
| 65 to 74 Years | 0 (0.0%) | 47 (26.1%) |
| 75 Years and over | 10 (11.2%) | 27 (33.8%) |
Disability Class: Self-Care Difficulty
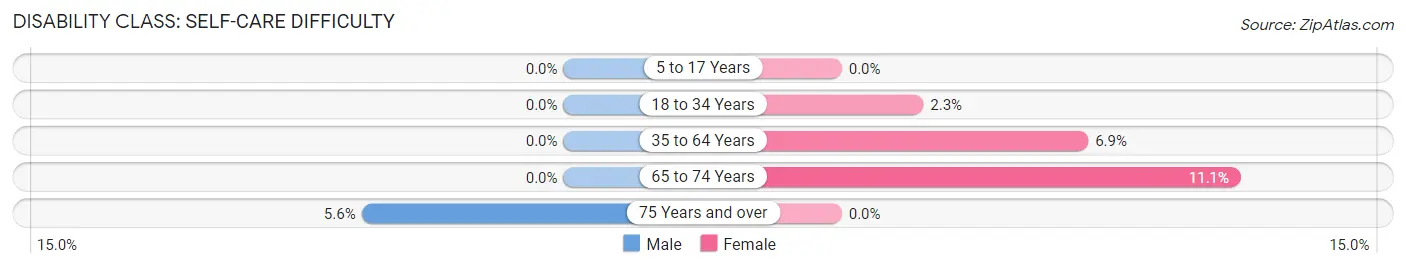
| Age Bracket | Male | Female |
| 5 to 17 Years | 0 (0.0%) | 0 (0.0%) |
| 18 to 34 Years | 0 (0.0%) | 6 (2.3%) |
| 35 to 64 Years | 0 (0.0%) | 41 (6.9%) |
| 65 to 74 Years | 0 (0.0%) | 20 (11.1%) |
| 75 Years and over | 5 (5.6%) | 0 (0.0%) |
Technology Access in Quarryville borough
Computing Device Access in Quarryville borough
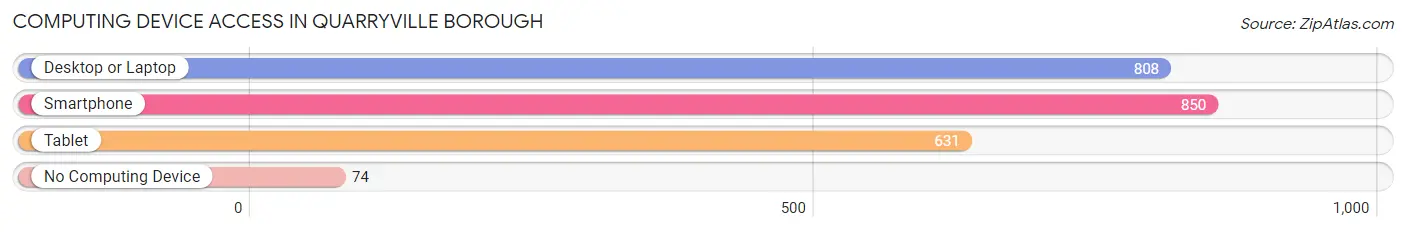
| Device Type | # Households | % Households |
| Desktop or Laptop | 808 | 78.3% |
| Smartphone | 850 | 82.4% |
| Tablet | 631 | 61.1% |
| No Computing Device | 74 | 7.2% |
| Total | 1,032 | 100.0% |
Internet Access in Quarryville borough
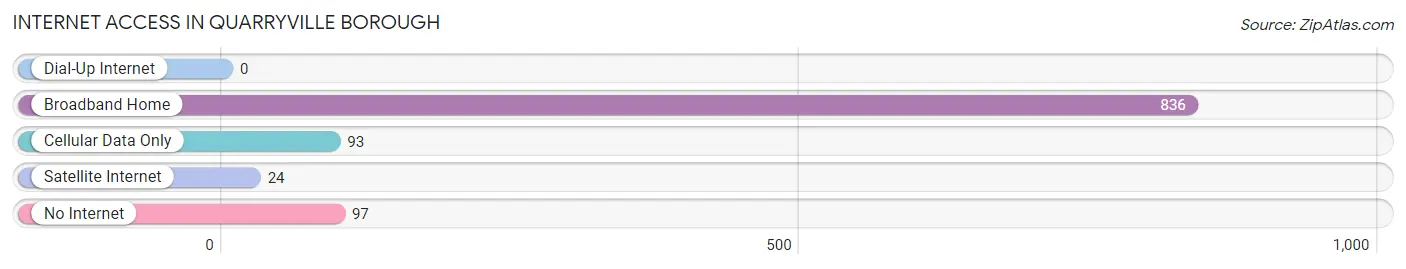
| Internet Type | # Households | % Households |
| Dial-Up Internet | 0 | 0.0% |
| Broadband Home | 836 | 81.0% |
| Cellular Data Only | 93 | 9.0% |
| Satellite Internet | 24 | 2.3% |
| No Internet | 97 | 9.4% |
| Total | 1,032 | 100.0% |
Quarryville borough Summary
Quarryville Borough is a small borough located in Lancaster County, Pennsylvania. It is situated in the southeastern corner of the county, approximately 20 miles southeast of the city of Lancaster. The borough is bordered by West Earl Township to the north, East Drumore Township to the east, Providence Township to the south, and West Lampeter Township to the west. As of the 2010 census, the population of Quarryville Borough was 1,845.
History
The area that is now Quarryville Borough was first settled in the late 1700s by German immigrants. The town was originally known as “Quarryville” due to the numerous limestone quarries in the area. The quarries provided the raw material for the construction of many of the buildings in the area, including the local churches and schools.
In 1845, the town was officially incorporated as a borough. The town was named after the limestone quarries that were located in the area. The quarries provided employment for many of the town’s residents and were a major source of income for the town.
In the late 1800s, the town experienced a period of growth and prosperity. The town was home to several businesses, including a flour mill, a sawmill, a brickyard, and a tannery. The town also had a railroad station, which connected it to the larger cities of Lancaster and Philadelphia.
Geography
Quarryville Borough is located in southeastern Lancaster County, approximately 20 miles southeast of the city of Lancaster. The borough is bordered by West Earl Township to the north, East Drumore Township to the east, Providence Township to the south, and West Lampeter Township to the west.
The borough is situated in the rolling hills of the Piedmont region of Pennsylvania. The terrain is mostly flat, with some areas of rolling hills. The borough is located in the Susquehanna River watershed. The borough is located in the humid continental climate zone, with hot, humid summers and cold, snowy winters.
Economy
The economy of Quarryville Borough is largely based on agriculture and light manufacturing. The town is home to several small businesses, including a flour mill, a sawmill, a brickyard, and a tannery. The town also has a railroad station, which connects it to the larger cities of Lancaster and Philadelphia.
The town is also home to several small retail stores, restaurants, and other businesses. The town is also home to a number of small farms, which produce a variety of crops, including corn, soybeans, wheat, and hay.
Demographics
As of the 2010 census, the population of Quarryville Borough was 1,845. The racial makeup of the borough was 97.3% White, 0.9% African American, 0.2% Native American, 0.3% Asian, 0.1% Pacific Islander, 0.3% from other races, and 0.9% from two or more races. Hispanic or Latino of any race were 1.2% of the population.
The median household income in Quarryville Borough was $50,938, and the median family income was $60,938. The per capita income for the borough was $25,938. About 5.3% of families and 7.2% of the population were below the poverty line, including 8.3% of those under age 18 and 5.2% of those age 65 or over.
Common Questions
What is Per Capita Income in Quarryville borough?
Per Capita income in Quarryville borough is $32,122.
What is the Median Family Income in Quarryville borough?
Median Family Income in Quarryville borough is $90,579.
What is the Median Household income in Quarryville borough?
Median Household Income in Quarryville borough is $81,667.
What is Income or Wage Gap in Quarryville borough?
Income or Wage Gap in Quarryville borough is 41.1%.
Women in Quarryville borough earn 58.9 cents for every dollar earned by a man.
What is Inequality or Gini Index in Quarryville borough?
Inequality or Gini Index in Quarryville borough is 0.38.
What is the Total Population of Quarryville borough?
Total Population of Quarryville borough is 2,833.
What is the Total Male Population of Quarryville borough?
Total Male Population of Quarryville borough is 1,396.
What is the Total Female Population of Quarryville borough?
Total Female Population of Quarryville borough is 1,437.
What is the Ratio of Males per 100 Females in Quarryville borough?
There are 97.15 Males per 100 Females in Quarryville borough.
What is the Ratio of Females per 100 Males in Quarryville borough?
There are 102.94 Females per 100 Males in Quarryville borough.
What is the Median Population Age in Quarryville borough?
Median Population Age in Quarryville borough is 36.2 Years.
What is the Average Family Size in Quarryville borough
Average Family Size in Quarryville borough is 3.1 People.
What is the Average Household Size in Quarryville borough
Average Household Size in Quarryville borough is 2.8 People.
How Large is the Labor Force in Quarryville borough?
There are 1,353 People in the Labor Forcein in Quarryville borough.
What is the Percentage of People in the Labor Force in Quarryville borough?
64.9% of People are in the Labor Force in Quarryville borough.
What is the Unemployment Rate in Quarryville borough?
Unemployment Rate in Quarryville borough is 3.5%.