Rimersburg borough, PA Map & Demographics
Rimersburg borough Overview
$18,668
PER CAPITA INCOME
$54,318
AVG FAMILY INCOME
$46,964
AVG HOUSEHOLD INCOME
18.9%
WAGE / INCOME GAP [ % ]
81.1¢/ $1
WAGE / INCOME GAP [ $ ]
0.40
INEQUALITY / GINI INDEX
1,078
TOTAL POPULATION
568
MALE POPULATION
510
FEMALE POPULATION
111.37
MALES / 100 FEMALES
89.79
FEMALES / 100 MALES
40.3
MEDIAN AGE
3.4
AVG FAMILY SIZE
2.7
AVG HOUSEHOLD SIZE
411
LABOR FORCE [ PEOPLE ]
47.3%
PERCENT IN LABOR FORCE
Income in Rimersburg borough
Income Overview in Rimersburg borough
Per Capita Income in Rimersburg borough is $18,668, while median incomes of families and households are $54,318 and $46,964 respectively.
| Characteristic | Number | Measure |
| Per Capita Income | 1,078 | $18,668 |
| Median Family Income | 260 | $54,318 |
| Mean Family Income | 260 | $53,547 |
| Median Household Income | 402 | $46,964 |
| Mean Household Income | 402 | $47,989 |
| Income Deficit | 260 | $0 |
| Wage / Income Gap (%) | 1,078 | 18.87% |
| Wage / Income Gap ($) | 1,078 | 81.13¢ per $1 |
| Gini / Inequality Index | 1,078 | 0.40 |
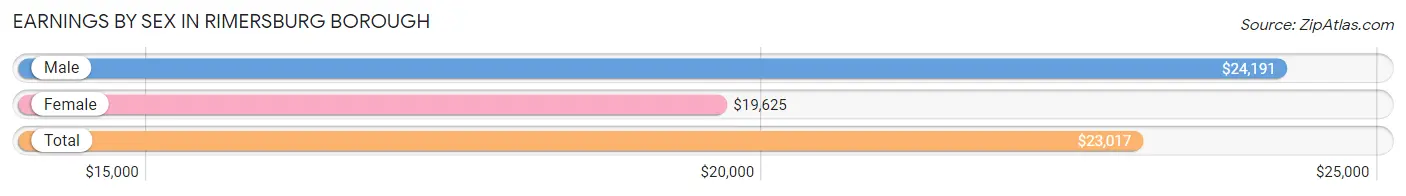
Earnings by Sex in Rimersburg borough
Average Earnings in Rimersburg borough are $23,017, $24,191 for men and $19,625 for women, a difference of 18.9%.
| Sex | Number | Average Earnings |
| Male | 273 (62.1%) | $24,191 |
| Female | 167 (38.0%) | $19,625 |
| Total | 440 (100.0%) | $23,017 |
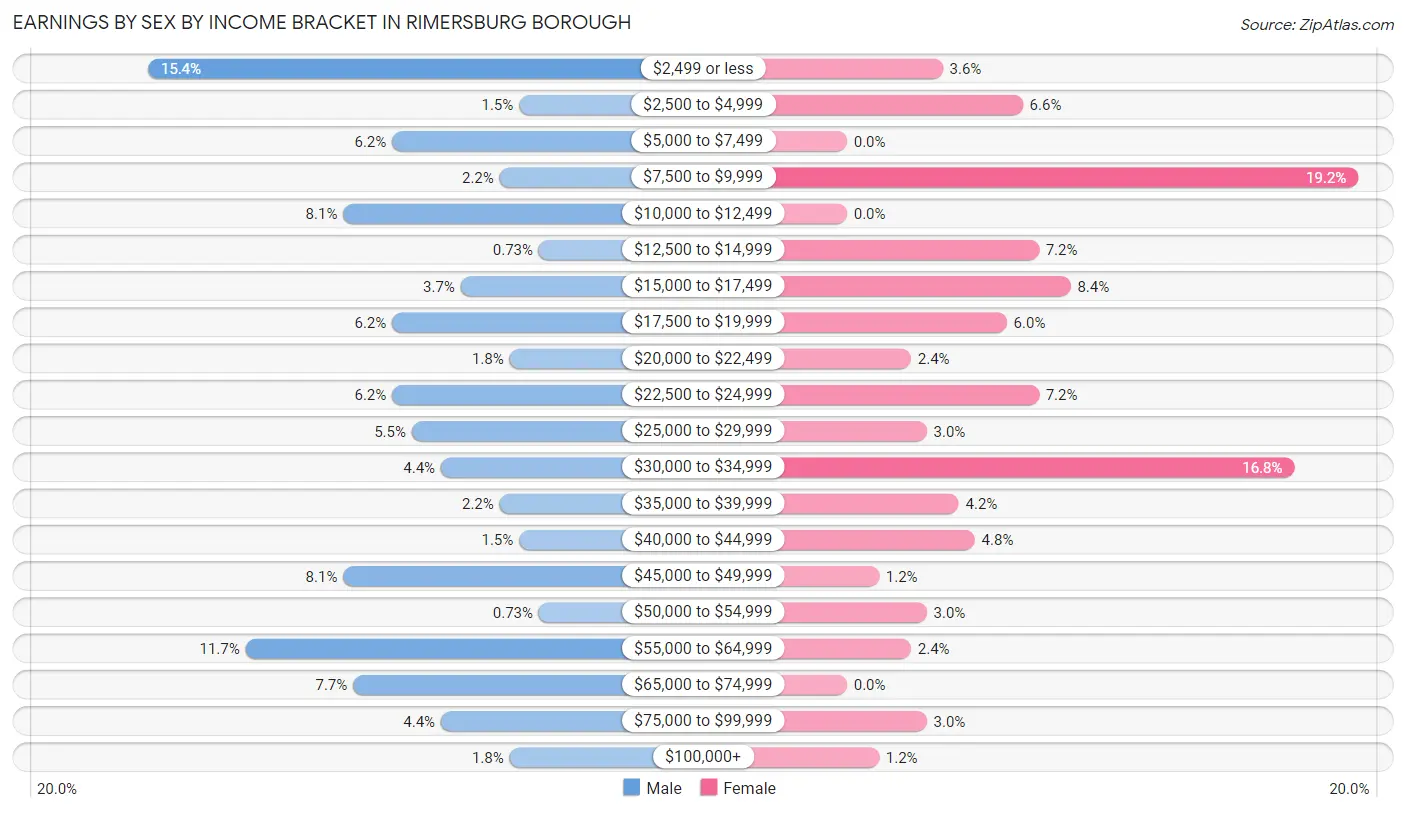
Earnings by Sex by Income Bracket in Rimersburg borough
The most common earnings brackets in Rimersburg borough are $2,499 or less for men (42 | 15.4%) and $7,500 to $9,999 for women (32 | 19.2%).
| Income | Male | Female |
| $2,499 or less | 42 (15.4%) | 6 (3.6%) |
| $2,500 to $4,999 | 4 (1.5%) | 11 (6.6%) |
| $5,000 to $7,499 | 17 (6.2%) | 0 (0.0%) |
| $7,500 to $9,999 | 6 (2.2%) | 32 (19.2%) |
| $10,000 to $12,499 | 22 (8.1%) | 0 (0.0%) |
| $12,500 to $14,999 | 2 (0.7%) | 12 (7.2%) |
| $15,000 to $17,499 | 10 (3.7%) | 14 (8.4%) |
| $17,500 to $19,999 | 17 (6.2%) | 10 (6.0%) |
| $20,000 to $22,499 | 5 (1.8%) | 4 (2.4%) |
| $22,500 to $24,999 | 17 (6.2%) | 12 (7.2%) |
| $25,000 to $29,999 | 15 (5.5%) | 5 (3.0%) |
| $30,000 to $34,999 | 12 (4.4%) | 28 (16.8%) |
| $35,000 to $39,999 | 6 (2.2%) | 7 (4.2%) |
| $40,000 to $44,999 | 4 (1.5%) | 8 (4.8%) |
| $45,000 to $49,999 | 22 (8.1%) | 2 (1.2%) |
| $50,000 to $54,999 | 2 (0.7%) | 5 (3.0%) |
| $55,000 to $64,999 | 32 (11.7%) | 4 (2.4%) |
| $65,000 to $74,999 | 21 (7.7%) | 0 (0.0%) |
| $75,000 to $99,999 | 12 (4.4%) | 5 (3.0%) |
| $100,000+ | 5 (1.8%) | 2 (1.2%) |
| Total | 273 (100.0%) | 167 (100.0%) |
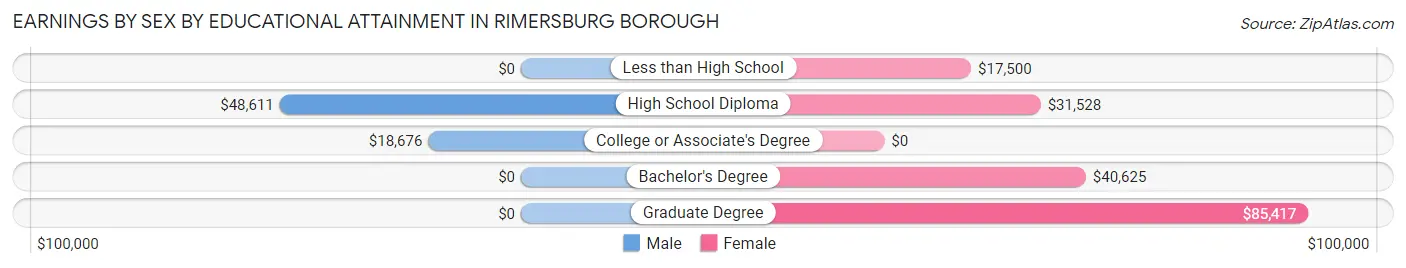
Earnings by Sex by Educational Attainment in Rimersburg borough
Average earnings in Rimersburg borough are $36,875 for men and $29,583 for women, a difference of 19.8%. Men with an educational attainment of high school diploma enjoy the highest average annual earnings of $48,611, while those with college or associate's degree education earn the least with $18,676. Women with an educational attainment of graduate degree earn the most with the average annual earnings of $85,417, while those with less than high school education have the smallest earnings of $17,500.
| Educational Attainment | Male Income | Female Income |
| Less than High School | - | - |
| High School Diploma | $48,611 | $31,528 |
| College or Associate's Degree | $18,676 | $0 |
| Bachelor's Degree | - | - |
| Graduate Degree | - | - |
| Total | $36,875 | $29,583 |
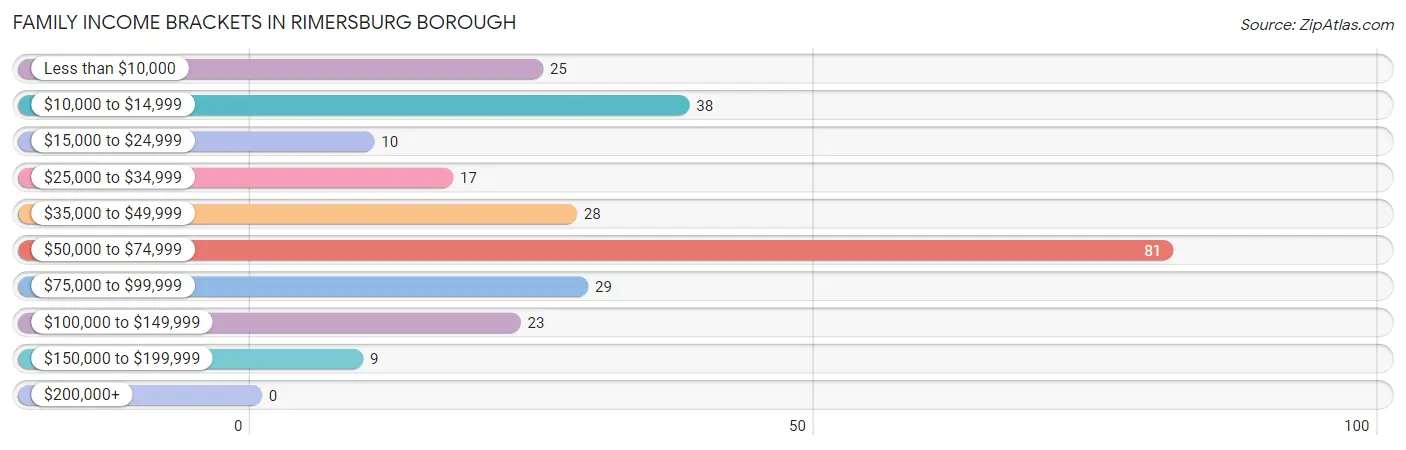
Family Income in Rimersburg borough
Family Income Brackets in Rimersburg borough
According to the Rimersburg borough family income data, there are 81 families falling into the $50,000 to $74,999 income range, which is the most common income bracket and makes up 31.1% of all families.
| Income Bracket | # Families | % Families |
| Less than $10,000 | 25 | 9.6% |
| $10,000 to $14,999 | 38 | 14.6% |
| $15,000 to $24,999 | 10 | 3.8% |
| $25,000 to $34,999 | 17 | 6.5% |
| $35,000 to $49,999 | 28 | 10.8% |
| $50,000 to $74,999 | 81 | 31.2% |
| $75,000 to $99,999 | 29 | 11.2% |
| $100,000 to $149,999 | 23 | 8.8% |
| $150,000 to $199,999 | 9 | 3.5% |
| $200,000+ | 0 | 0.0% |
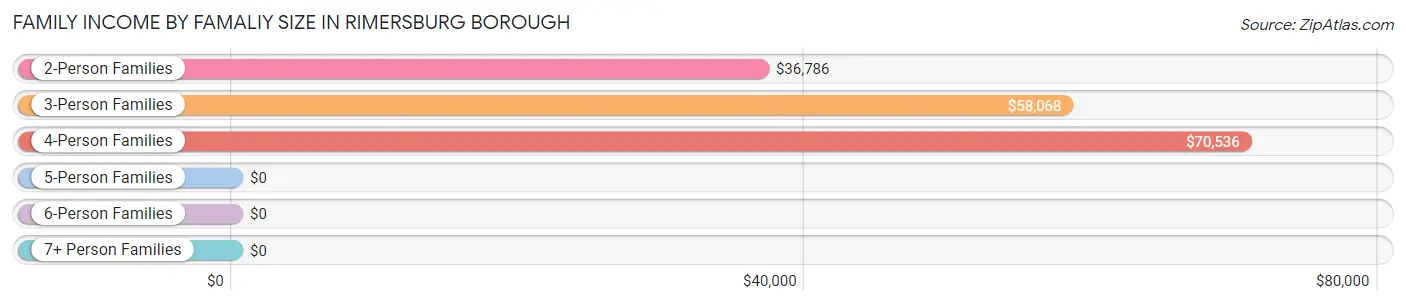
Family Income by Famaliy Size in Rimersburg borough
4-person families (39 | 15.0%) account for the highest median family income in Rimersburg borough with $70,536 per family, while 3-person families (48 | 18.5%) have the highest median income of $19,356 per family member.
| Income Bracket | # Families | Median Income |
| 2-Person Families | 128 (49.2%) | $36,786 |
| 3-Person Families | 48 (18.5%) | $58,068 |
| 4-Person Families | 39 (15.0%) | $70,536 |
| 5-Person Families | 24 (9.2%) | $0 |
| 6-Person Families | 10 (3.8%) | $0 |
| 7+ Person Families | 11 (4.2%) | $0 |
| Total | 260 (100.0%) | $54,318 |
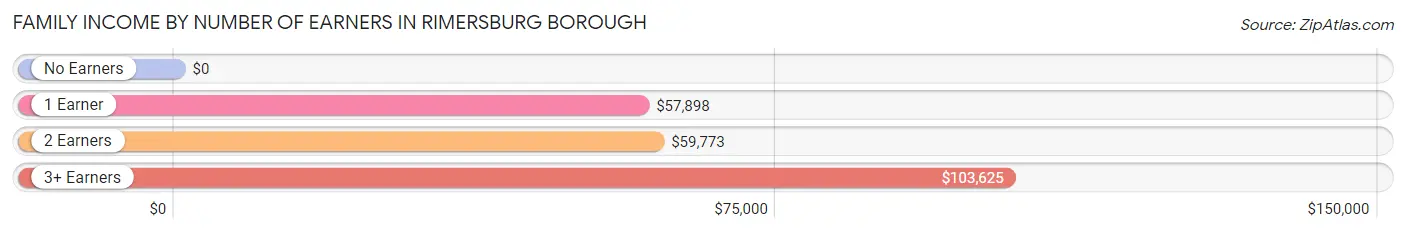
Family Income by Number of Earners in Rimersburg borough
| Number of Earners | # Families | Median Income |
| No Earners | 76 (29.2%) | $0 |
| 1 Earner | 105 (40.4%) | $57,898 |
| 2 Earners | 64 (24.6%) | $59,773 |
| 3+ Earners | 15 (5.8%) | $103,625 |
| Total | 260 (100.0%) | $54,318 |
Household Income in Rimersburg borough
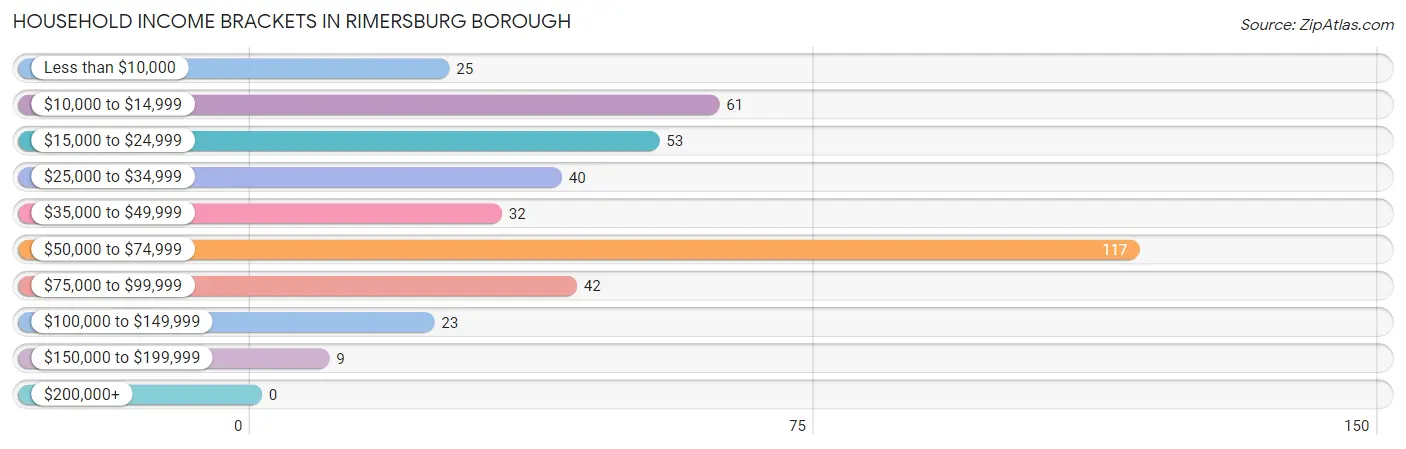
Household Income Brackets in Rimersburg borough
With 117 households falling in the category, the $50,000 to $74,999 income range is the most frequent in Rimersburg borough, accounting for 29.1% of all households.
| Income Bracket | # Households | % Households |
| Less than $10,000 | 25 | 6.2% |
| $10,000 to $14,999 | 61 | 15.2% |
| $15,000 to $24,999 | 53 | 13.2% |
| $25,000 to $34,999 | 40 | 10.0% |
| $35,000 to $49,999 | 32 | 8.0% |
| $50,000 to $74,999 | 117 | 29.1% |
| $75,000 to $99,999 | 42 | 10.4% |
| $100,000 to $149,999 | 23 | 5.7% |
| $150,000 to $199,999 | 9 | 2.2% |
| $200,000+ | 0 | 0.0% |
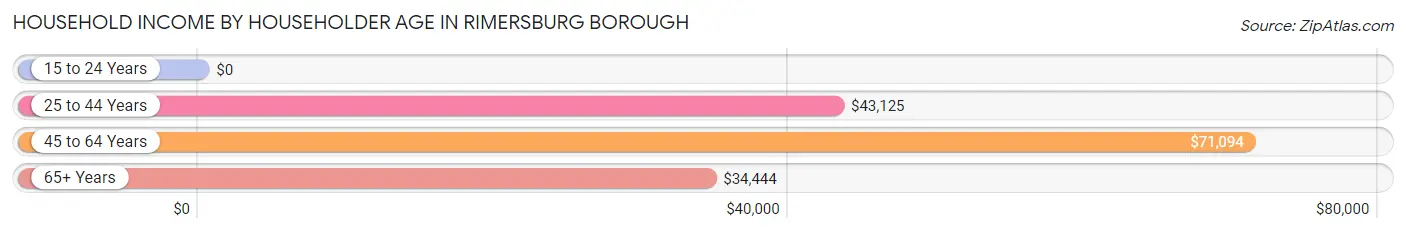
Household Income by Householder Age in Rimersburg borough
The median household income in Rimersburg borough is $46,964, with the highest median household income of $71,094 found in the 45 to 64 years age bracket for the primary householder. A total of 109 households (27.1%) fall into this category. Meanwhile, the 15 to 24 years age bracket for the primary householder has the lowest median household income of $0, with 13 households (3.2%) in this group.
| Income Bracket | # Households | Median Income |
| 15 to 24 Years | 13 (3.2%) | $0 |
| 25 to 44 Years | 140 (34.8%) | $43,125 |
| 45 to 64 Years | 109 (27.1%) | $71,094 |
| 65+ Years | 140 (34.8%) | $34,444 |
| Total | 402 (100.0%) | $46,964 |
Poverty in Rimersburg borough
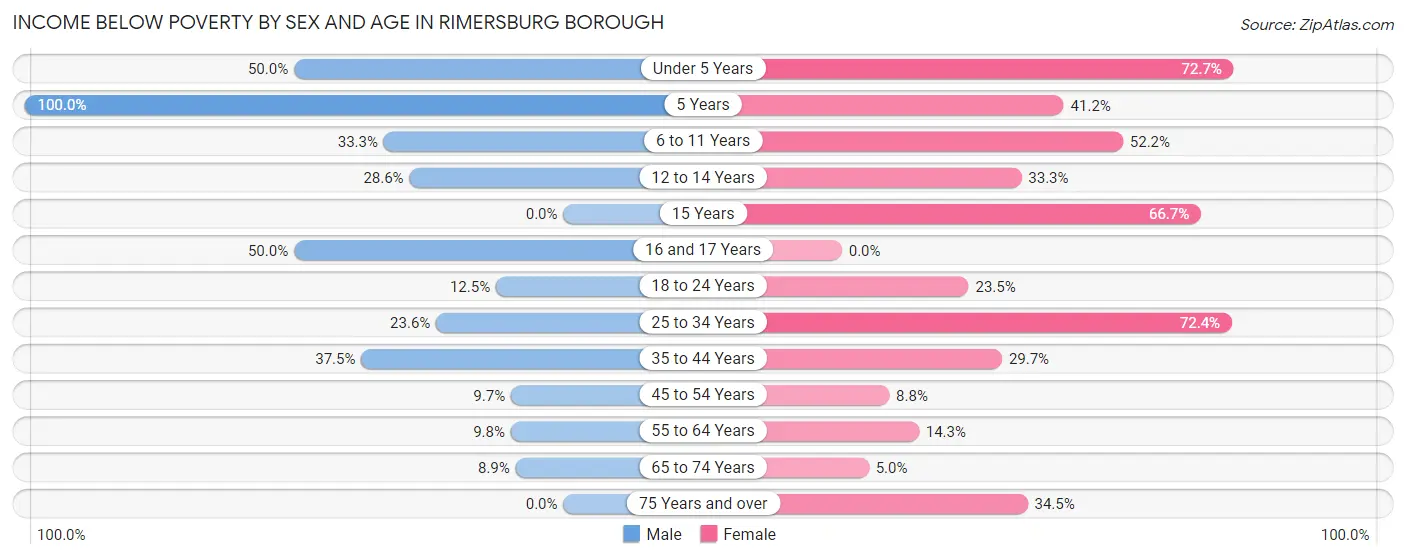
Income Below Poverty by Sex and Age in Rimersburg borough
With 19.7% poverty level for males and 28.4% for females among the residents of Rimersburg borough, 5 year old males and under 5 year old females are the most vulnerable to poverty, with 2 males (100.0%) and 8 females (72.7%) in their respective age groups living below the poverty level.
| Age Bracket | Male | Female |
| Under 5 Years | 26 (50.0%) | 8 (72.7%) |
| 5 Years | 2 (100.0%) | 7 (41.2%) |
| 6 to 11 Years | 15 (33.3%) | 24 (52.2%) |
| 12 to 14 Years | 6 (28.6%) | 2 (33.3%) |
| 15 Years | 0 (0.0%) | 6 (66.7%) |
| 16 and 17 Years | 2 (50.0%) | 0 (0.0%) |
| 18 to 24 Years | 11 (12.5%) | 12 (23.5%) |
| 25 to 34 Years | 17 (23.6%) | 42 (72.4%) |
| 35 to 44 Years | 15 (37.5%) | 11 (29.7%) |
| 45 to 54 Years | 7 (9.7%) | 8 (8.8%) |
| 55 to 64 Years | 4 (9.8%) | 12 (14.3%) |
| 65 to 74 Years | 7 (8.9%) | 3 (5.0%) |
| 75 Years and over | 0 (0.0%) | 10 (34.5%) |
| Total | 112 (19.7%) | 145 (28.4%) |
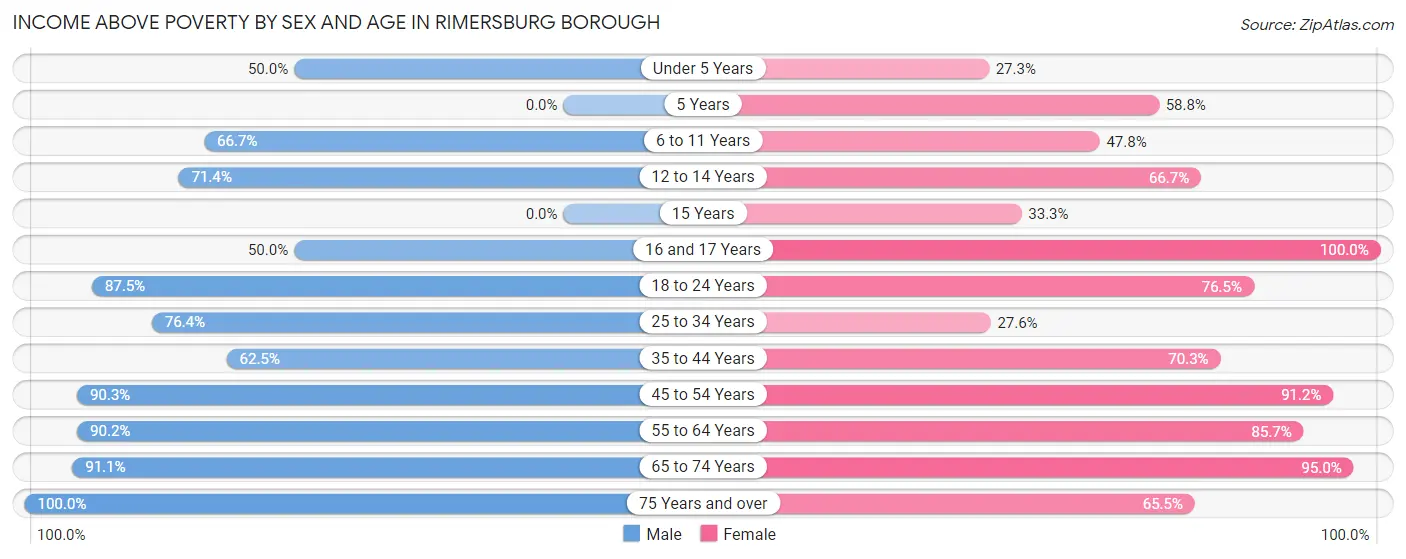
Income Above Poverty by Sex and Age in Rimersburg borough
According to the poverty statistics in Rimersburg borough, males aged 75 years and over and females aged 16 and 17 years are the age groups that are most secure financially, with 100.0% of males and 100.0% of females in these age groups living above the poverty line.
| Age Bracket | Male | Female |
| Under 5 Years | 26 (50.0%) | 3 (27.3%) |
| 5 Years | 0 (0.0%) | 10 (58.8%) |
| 6 to 11 Years | 30 (66.7%) | 22 (47.8%) |
| 12 to 14 Years | 15 (71.4%) | 4 (66.7%) |
| 15 Years | 0 (0.0%) | 3 (33.3%) |
| 16 and 17 Years | 2 (50.0%) | 11 (100.0%) |
| 18 to 24 Years | 77 (87.5%) | 39 (76.5%) |
| 25 to 34 Years | 55 (76.4%) | 16 (27.6%) |
| 35 to 44 Years | 25 (62.5%) | 26 (70.3%) |
| 45 to 54 Years | 65 (90.3%) | 83 (91.2%) |
| 55 to 64 Years | 37 (90.2%) | 72 (85.7%) |
| 65 to 74 Years | 72 (91.1%) | 57 (95.0%) |
| 75 Years and over | 52 (100.0%) | 19 (65.5%) |
| Total | 456 (80.3%) | 365 (71.6%) |
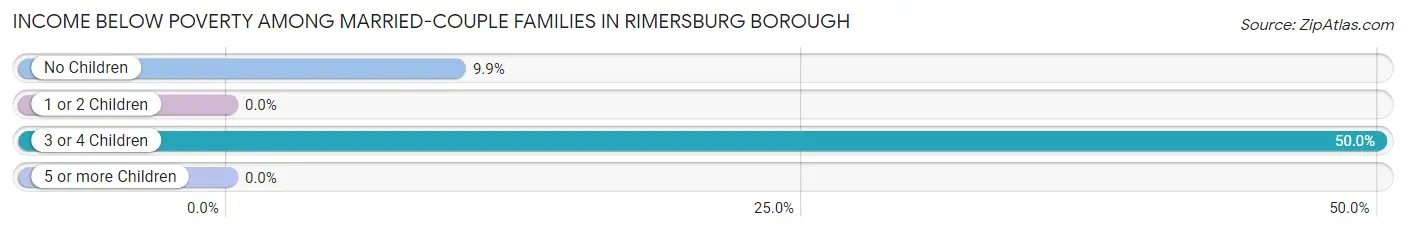
Income Below Poverty Among Married-Couple Families in Rimersburg borough
The poverty statistics for married-couple families in Rimersburg borough show that 10.6% or 18 of the total 170 families live below the poverty line. Families with 3 or 4 children have the highest poverty rate of 50.0%, comprising of 6 families. On the other hand, families with 1 or 2 children have the lowest poverty rate of 0.0%, which includes 0 families.
| Children | Above Poverty | Below Poverty |
| No Children | 109 (90.1%) | 12 (9.9%) |
| 1 or 2 Children | 28 (100.0%) | 0 (0.0%) |
| 3 or 4 Children | 6 (50.0%) | 6 (50.0%) |
| 5 or more Children | 9 (100.0%) | 0 (0.0%) |
| Total | 152 (89.4%) | 18 (10.6%) |
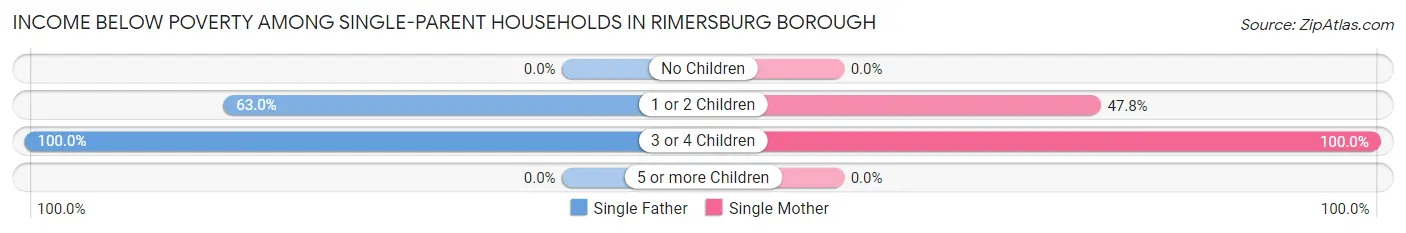
Income Below Poverty Among Single-Parent Households in Rimersburg borough
According to the poverty data in Rimersburg borough, 55.9% or 19 single-father households and 60.7% or 34 single-mother households are living below the poverty line. Among single-father households, those with 3 or 4 children have the highest poverty rate, with 2 households (100.0%) experiencing poverty. Likewise, among single-mother households, those with 3 or 4 children have the highest poverty rate, with 23 households (100.0%) falling below the poverty line.
| Children | Single Father | Single Mother |
| No Children | 0 (0.0%) | 0 (0.0%) |
| 1 or 2 Children | 17 (63.0%) | 11 (47.8%) |
| 3 or 4 Children | 2 (100.0%) | 23 (100.0%) |
| 5 or more Children | 0 (0.0%) | 0 (0.0%) |
| Total | 19 (55.9%) | 34 (60.7%) |
Income Below Poverty Among Married-Couple vs Single-Parent Households in Rimersburg borough
The poverty data for Rimersburg borough shows that 18 of the married-couple family households (10.6%) and 53 of the single-parent households (58.9%) are living below the poverty level. Within the married-couple family households, those with 3 or 4 children have the highest poverty rate, with 6 households (50.0%) falling below the poverty line. Among the single-parent households, those with 3 or 4 children have the highest poverty rate, with 25 household (100.0%) living below poverty.
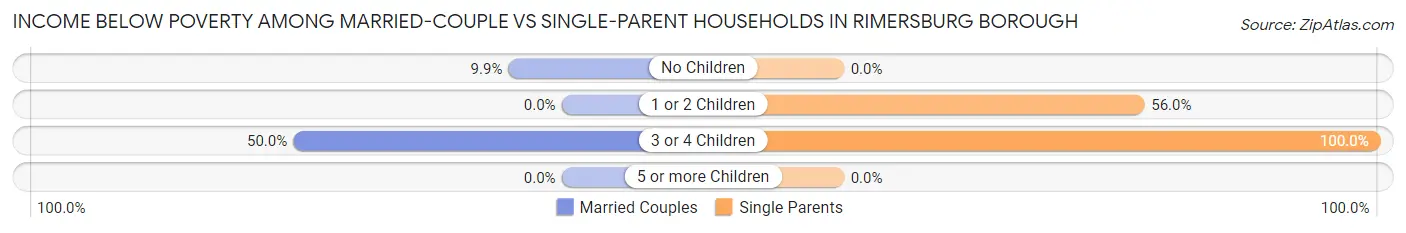
| Children | Married-Couple Families | Single-Parent Households |
| No Children | 12 (9.9%) | 0 (0.0%) |
| 1 or 2 Children | 0 (0.0%) | 28 (56.0%) |
| 3 or 4 Children | 6 (50.0%) | 25 (100.0%) |
| 5 or more Children | 0 (0.0%) | 0 (0.0%) |
| Total | 18 (10.6%) | 53 (58.9%) |
Race in Rimersburg borough
The most populous races in Rimersburg borough are White / Caucasian (991 | 91.9%), Two or more Races (57 | 5.3%), and Black / African American (30 | 2.8%).
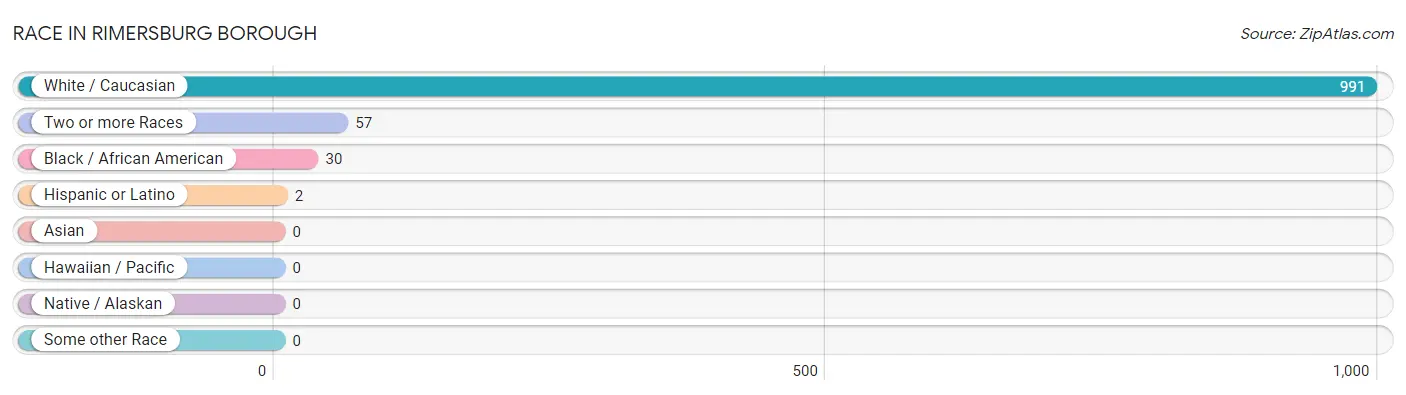
| Race | # Population | % Population |
| Asian | 0 | 0.0% |
| Black / African American | 30 | 2.8% |
| Hawaiian / Pacific | 0 | 0.0% |
| Hispanic or Latino | 2 | 0.2% |
| Native / Alaskan | 0 | 0.0% |
| White / Caucasian | 991 | 91.9% |
| Two or more Races | 57 | 5.3% |
| Some other Race | 0 | 0.0% |
| Total | 1,078 | 100.0% |
Ancestry in Rimersburg borough
The most populous ancestries reported in Rimersburg borough are German (369 | 34.2%), Irish (215 | 19.9%), Italian (69 | 6.4%), French (44 | 4.1%), and American (40 | 3.7%), together accounting for 68.4% of all Rimersburg borough residents.
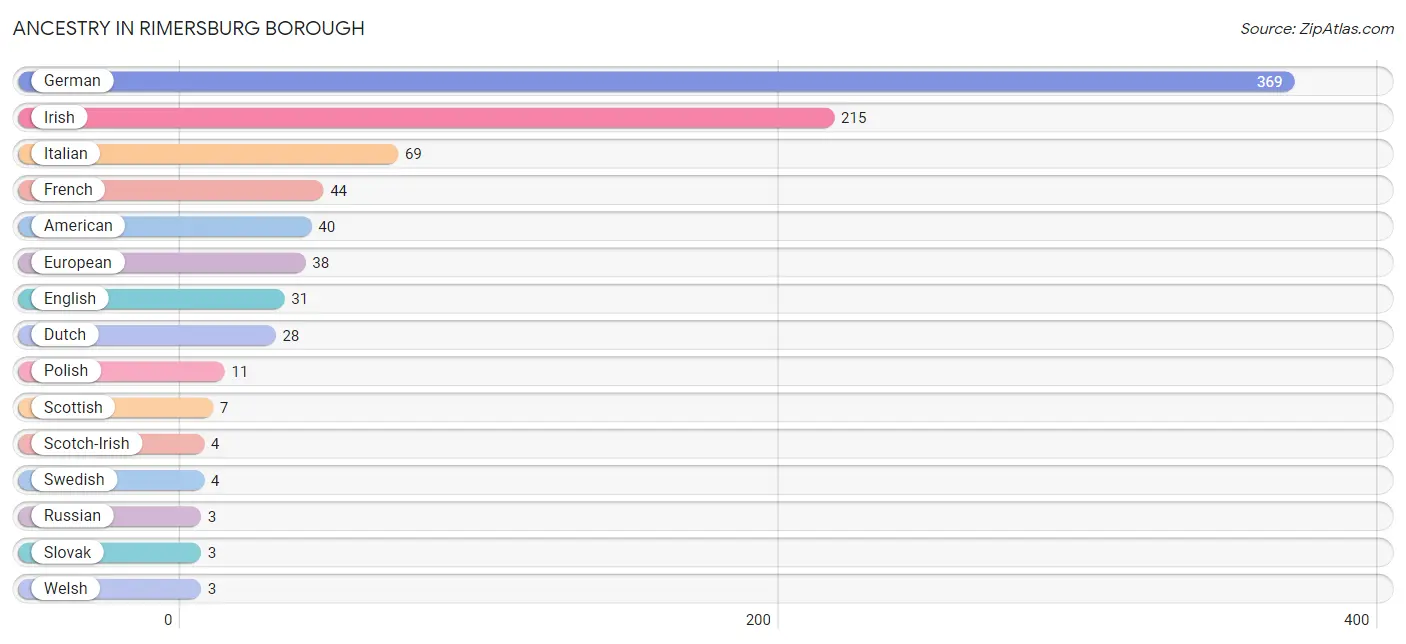
| Ancestry | # Population | % Population |
| American | 40 | 3.7% |
| Central American | 2 | 0.2% |
| Czech | 2 | 0.2% |
| Dutch | 28 | 2.6% |
| English | 31 | 2.9% |
| European | 38 | 3.5% |
| French | 44 | 4.1% |
| German | 369 | 34.2% |
| Guamanian / Chamorro | 2 | 0.2% |
| Guatemalan | 2 | 0.2% |
| Hungarian | 2 | 0.2% |
| Irish | 215 | 19.9% |
| Italian | 69 | 6.4% |
| Polish | 11 | 1.0% |
| Russian | 3 | 0.3% |
| Scotch-Irish | 4 | 0.4% |
| Scottish | 7 | 0.6% |
| Slovak | 3 | 0.3% |
| Swedish | 4 | 0.4% |
| Welsh | 3 | 0.3% | View All 20 Rows |
Immigrants in Rimersburg borough

| Immigration Origin | # Population | % Population | View All 0 Rows |
Sex and Age in Rimersburg borough
Sex and Age in Rimersburg borough
The most populous age groups in Rimersburg borough are 25 to 29 Years (64 | 11.3%) for men and 60 to 64 Years (62 | 12.2%) for women.
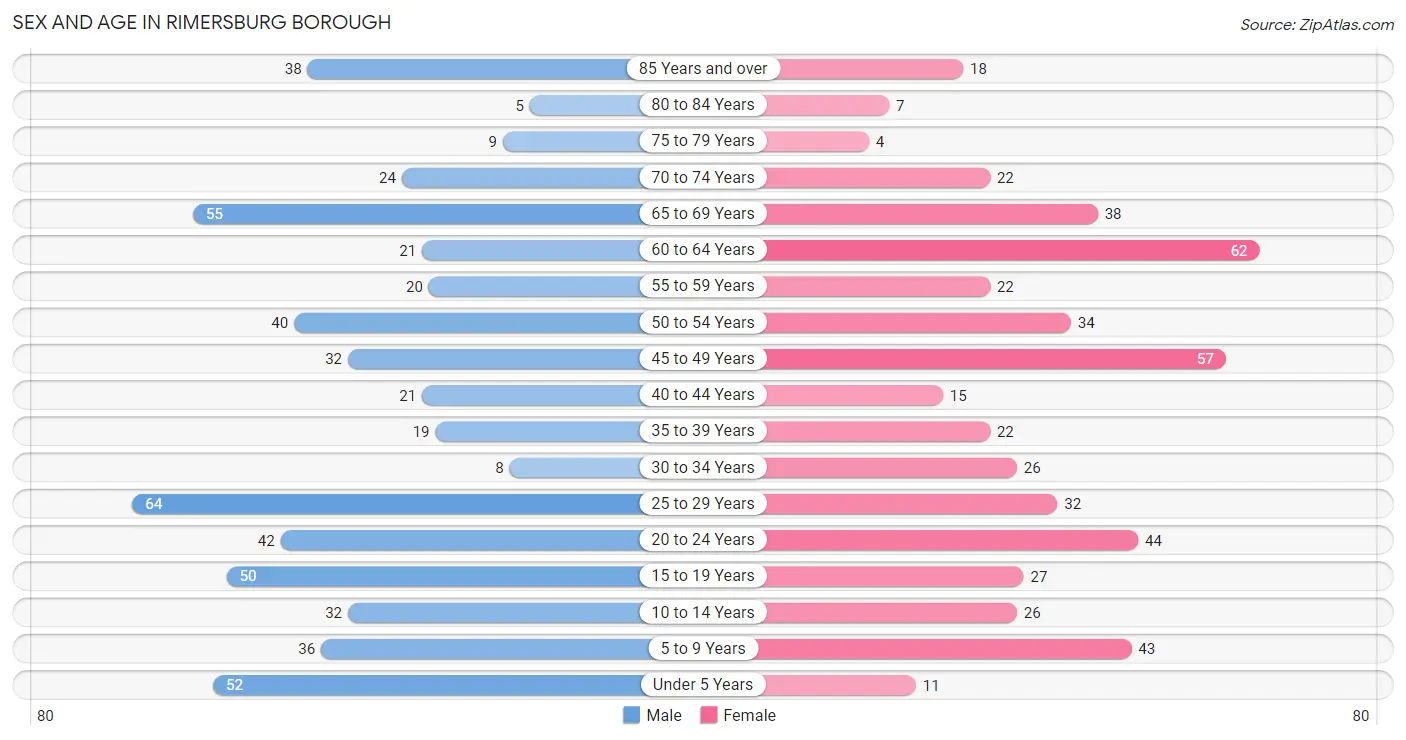
| Age Bracket | Male | Female |
| Under 5 Years | 52 (9.1%) | 11 (2.2%) |
| 5 to 9 Years | 36 (6.3%) | 43 (8.4%) |
| 10 to 14 Years | 32 (5.6%) | 26 (5.1%) |
| 15 to 19 Years | 50 (8.8%) | 27 (5.3%) |
| 20 to 24 Years | 42 (7.4%) | 44 (8.6%) |
| 25 to 29 Years | 64 (11.3%) | 32 (6.3%) |
| 30 to 34 Years | 8 (1.4%) | 26 (5.1%) |
| 35 to 39 Years | 19 (3.4%) | 22 (4.3%) |
| 40 to 44 Years | 21 (3.7%) | 15 (2.9%) |
| 45 to 49 Years | 32 (5.6%) | 57 (11.2%) |
| 50 to 54 Years | 40 (7.0%) | 34 (6.7%) |
| 55 to 59 Years | 20 (3.5%) | 22 (4.3%) |
| 60 to 64 Years | 21 (3.7%) | 62 (12.2%) |
| 65 to 69 Years | 55 (9.7%) | 38 (7.4%) |
| 70 to 74 Years | 24 (4.2%) | 22 (4.3%) |
| 75 to 79 Years | 9 (1.6%) | 4 (0.8%) |
| 80 to 84 Years | 5 (0.9%) | 7 (1.4%) |
| 85 Years and over | 38 (6.7%) | 18 (3.5%) |
| Total | 568 (100.0%) | 510 (100.0%) |
Families and Households in Rimersburg borough
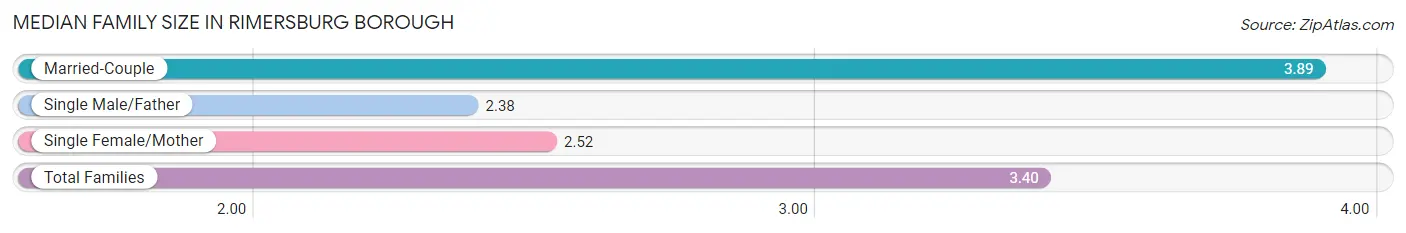
Median Family Size in Rimersburg borough
The median family size in Rimersburg borough is 3.40 persons per family, with married-couple families (170 | 65.4%) accounting for the largest median family size of 3.89 persons per family. On the other hand, single male/father families (34 | 13.1%) represent the smallest median family size with 2.38 persons per family.
| Family Type | # Families | Family Size |
| Married-Couple | 170 (65.4%) | 3.89 |
| Single Male/Father | 34 (13.1%) | 2.38 |
| Single Female/Mother | 56 (21.5%) | 2.52 |
| Total Families | 260 (100.0%) | 3.40 |
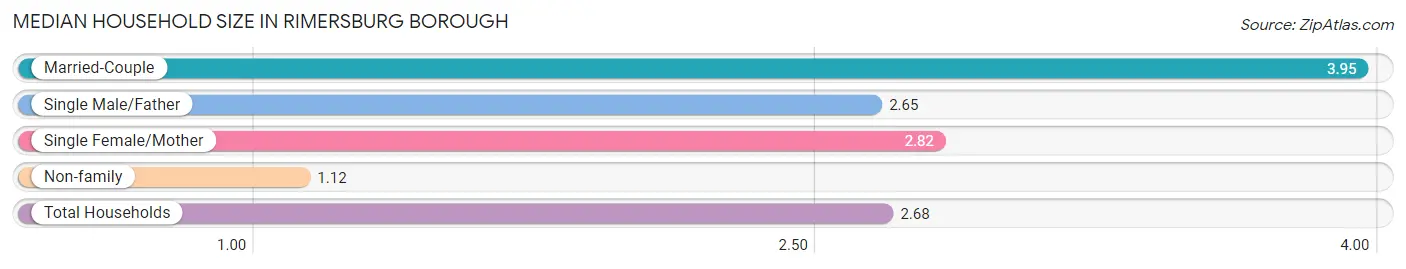
Median Household Size in Rimersburg borough
The median household size in Rimersburg borough is 2.68 persons per household, with married-couple households (170 | 42.3%) accounting for the largest median household size of 3.95 persons per household. non-family households (142 | 35.3%) represent the smallest median household size with 1.12 persons per household.
| Household Type | # Households | Household Size |
| Married-Couple | 170 (42.3%) | 3.95 |
| Single Male/Father | 34 (8.5%) | 2.65 |
| Single Female/Mother | 56 (13.9%) | 2.82 |
| Non-family | 142 (35.3%) | 1.12 |
| Total Households | 402 (100.0%) | 2.68 |
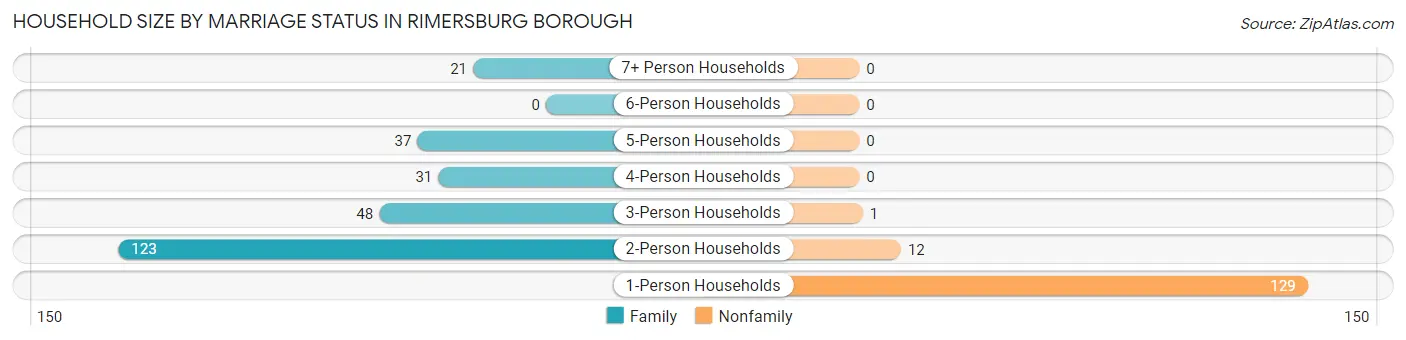
Household Size by Marriage Status in Rimersburg borough
Out of a total of 402 households in Rimersburg borough, 260 (64.7%) are family households, while 142 (35.3%) are nonfamily households. The most numerous type of family households are 2-person households, comprising 123, and the most common type of nonfamily households are 1-person households, comprising 129.
| Household Size | Family Households | Nonfamily Households |
| 1-Person Households | - | 129 (32.1%) |
| 2-Person Households | 123 (30.6%) | 12 (3.0%) |
| 3-Person Households | 48 (11.9%) | 1 (0.3%) |
| 4-Person Households | 31 (7.7%) | 0 (0.0%) |
| 5-Person Households | 37 (9.2%) | 0 (0.0%) |
| 6-Person Households | 0 (0.0%) | 0 (0.0%) |
| 7+ Person Households | 21 (5.2%) | 0 (0.0%) |
| Total | 260 (64.7%) | 142 (35.3%) |
Female Fertility in Rimersburg borough
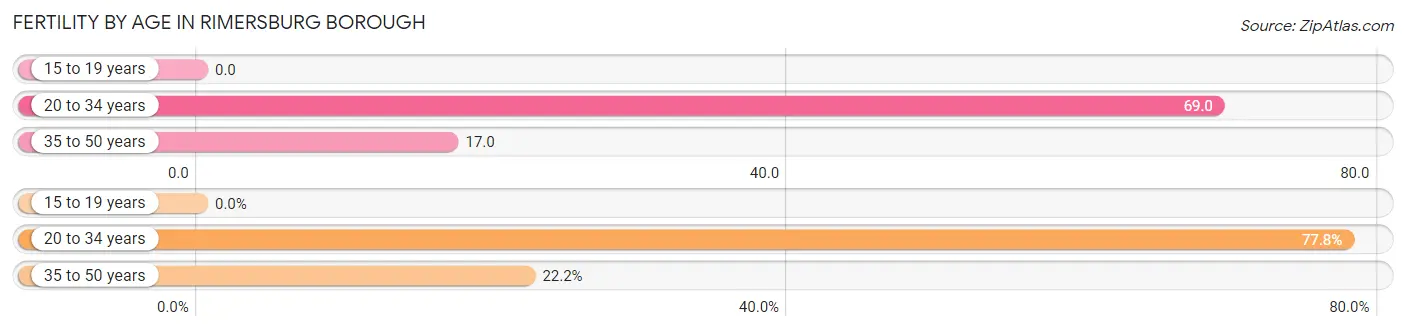
Fertility by Age in Rimersburg borough
Average fertility rate in Rimersburg borough is 37.0 births per 1,000 women. Women in the age bracket of 20 to 34 years have the highest fertility rate with 69.0 births per 1,000 women. Women in the age bracket of 20 to 34 years acount for 77.8% of all women with births.
| Age Bracket | Women with Births | Births / 1,000 Women |
| 15 to 19 years | 0 (0.0%) | 0.0 |
| 20 to 34 years | 7 (77.8%) | 69.0 |
| 35 to 50 years | 2 (22.2%) | 17.0 |
| Total | 9 (100.0%) | 37.0 |
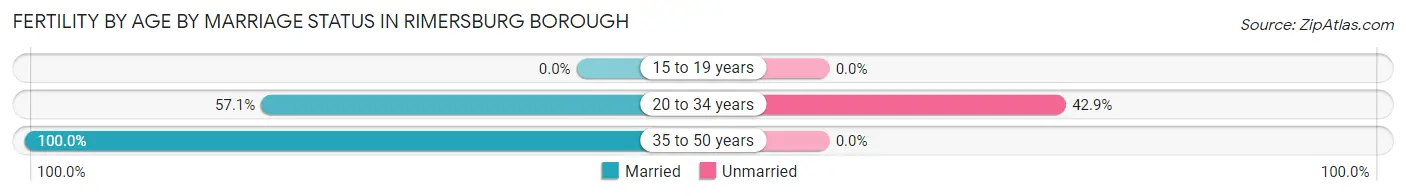
Fertility by Age by Marriage Status in Rimersburg borough
66.7% of women with births (9) in Rimersburg borough are married. The highest percentage of unmarried women with births falls into 20 to 34 years age bracket with 42.9% of them unmarried at the time of birth, while the lowest percentage of unmarried women with births belong to 35 to 50 years age bracket with 0.0% of them unmarried.
| Age Bracket | Married | Unmarried |
| 15 to 19 years | 0 (0.0%) | 0 (0.0%) |
| 20 to 34 years | 4 (57.1%) | 3 (42.9%) |
| 35 to 50 years | 2 (100.0%) | 0 (0.0%) |
| Total | 6 (66.7%) | 3 (33.3%) |
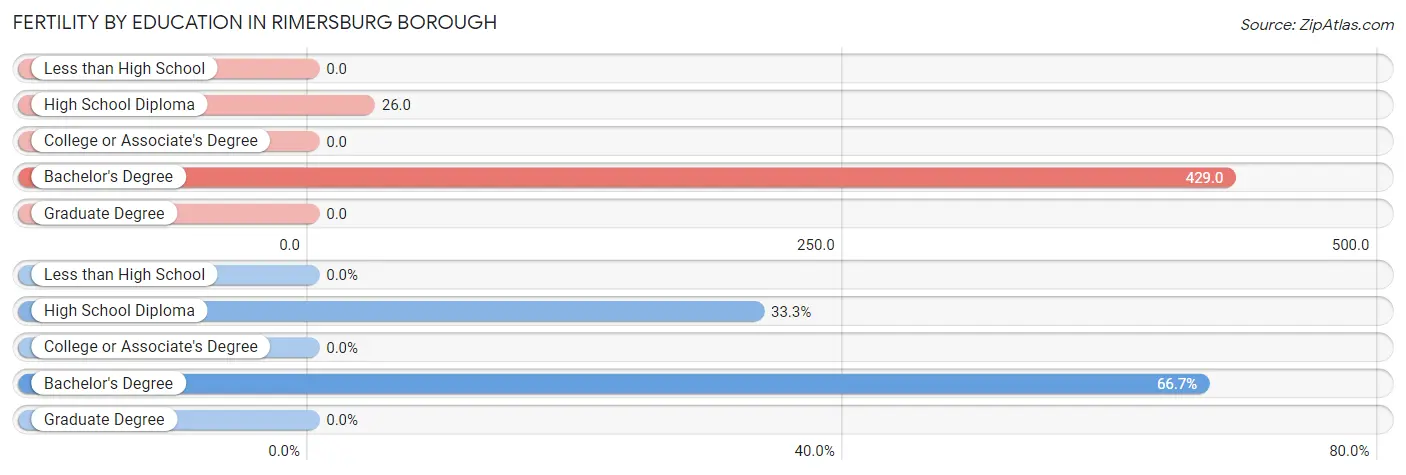
Fertility by Education in Rimersburg borough
| Educational Attainment | Women with Births | Births / 1,000 Women |
| Less than High School | 0 (0.0%) | 0.0 |
| High School Diploma | 3 (33.3%) | 26.0 |
| College or Associate's Degree | 0 (0.0%) | 0.0 |
| Bachelor's Degree | 6 (66.7%) | 429.0 |
| Graduate Degree | 0 (0.0%) | 0.0 |
| Total | 9 (100.0%) | 37.0 |
Fertility by Education by Marriage Status in Rimersburg borough
33.3% of women with births in Rimersburg borough are unmarried. Women with the educational attainment of bachelor's degree are most likely to be married with 100.0% of them married at childbirth, while women with the educational attainment of high school diploma are least likely to be married with 100.0% of them unmarried at childbirth.

| Educational Attainment | Married | Unmarried |
| Less than High School | 0 (0.0%) | 0 (0.0%) |
| High School Diploma | 0 (0.0%) | 3 (100.0%) |
| College or Associate's Degree | 0 (0.0%) | 0 (0.0%) |
| Bachelor's Degree | 6 (100.0%) | 0 (0.0%) |
| Graduate Degree | 0 (0.0%) | 0 (0.0%) |
| Total | 6 (66.7%) | 3 (33.3%) |
Employment Characteristics in Rimersburg borough
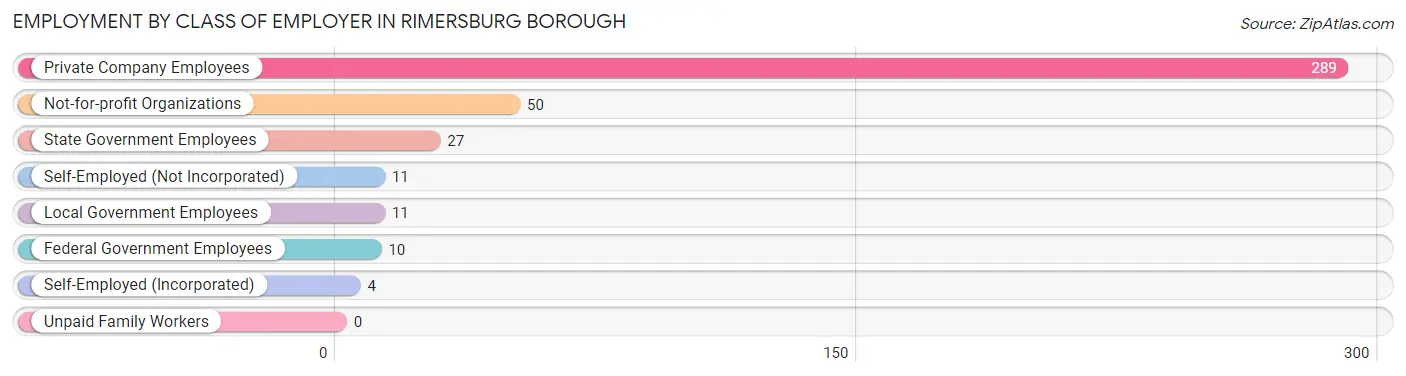
Employment by Class of Employer in Rimersburg borough
Among the 402 employed individuals in Rimersburg borough, private company employees (289 | 71.9%), not-for-profit organizations (50 | 12.4%), and state government employees (27 | 6.7%) make up the most common classes of employment.
| Employer Class | # Employees | % Employees |
| Private Company Employees | 289 | 71.9% |
| Self-Employed (Incorporated) | 4 | 1.0% |
| Self-Employed (Not Incorporated) | 11 | 2.7% |
| Not-for-profit Organizations | 50 | 12.4% |
| Local Government Employees | 11 | 2.7% |
| State Government Employees | 27 | 6.7% |
| Federal Government Employees | 10 | 2.5% |
| Unpaid Family Workers | 0 | 0.0% |
| Total | 402 | 100.0% |
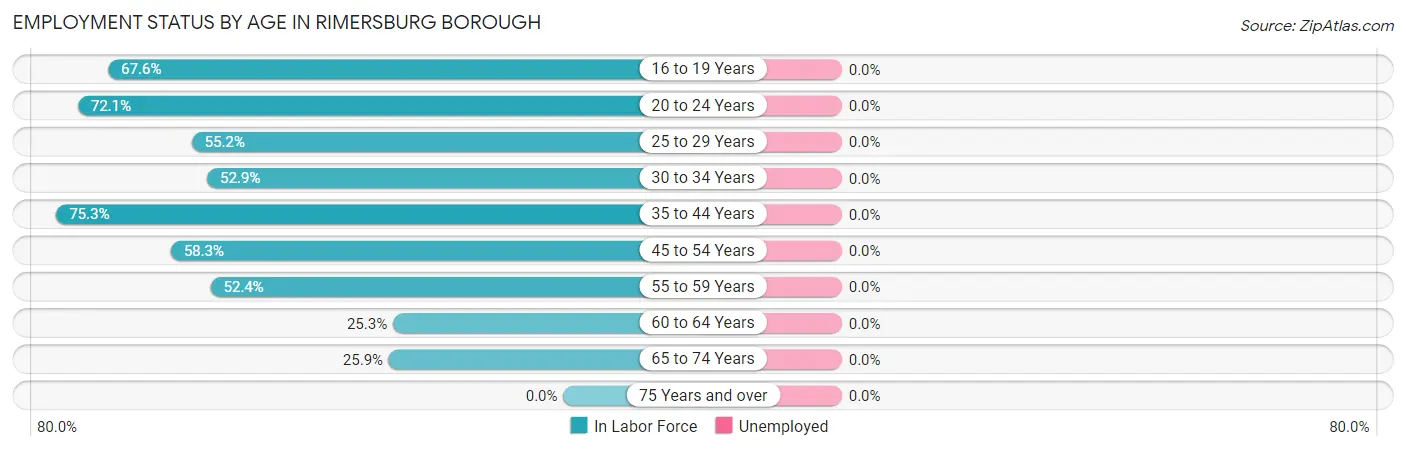
Employment Status by Age in Rimersburg borough
| Age Bracket | In Labor Force | Unemployed |
| 16 to 19 Years | 46 (67.6%) | 0 (0.0%) |
| 20 to 24 Years | 62 (72.1%) | 0 (0.0%) |
| 25 to 29 Years | 53 (55.2%) | 0 (0.0%) |
| 30 to 34 Years | 18 (52.9%) | 0 (0.0%) |
| 35 to 44 Years | 58 (75.3%) | 0 (0.0%) |
| 45 to 54 Years | 95 (58.3%) | 0 (0.0%) |
| 55 to 59 Years | 22 (52.4%) | 0 (0.0%) |
| 60 to 64 Years | 21 (25.3%) | 0 (0.0%) |
| 65 to 74 Years | 36 (25.9%) | 0 (0.0%) |
| 75 Years and over | 0 (0.0%) | 0 (0.0%) |
| Total | 411 (47.3%) | 0 (0.0%) |
Employment Status by Educational Attainment in Rimersburg borough
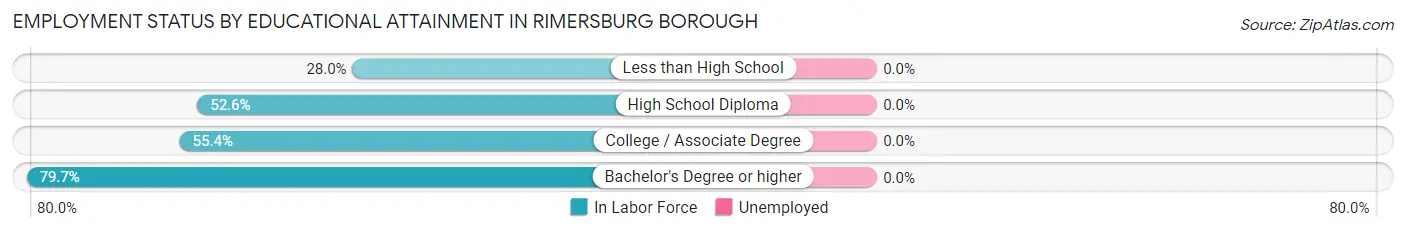
| Educational Attainment | In Labor Force | Unemployed |
| Less than High School | 14 (28.0%) | 0 (0.0%) |
| High School Diploma | 144 (52.6%) | 0 (0.0%) |
| College / Associate Degree | 62 (55.4%) | 0 (0.0%) |
| Bachelor's Degree or higher | 47 (79.7%) | 0 (0.0%) |
| Total | 267 (53.9%) | 0 (0.0%) |
Employment Occupations by Sex in Rimersburg borough
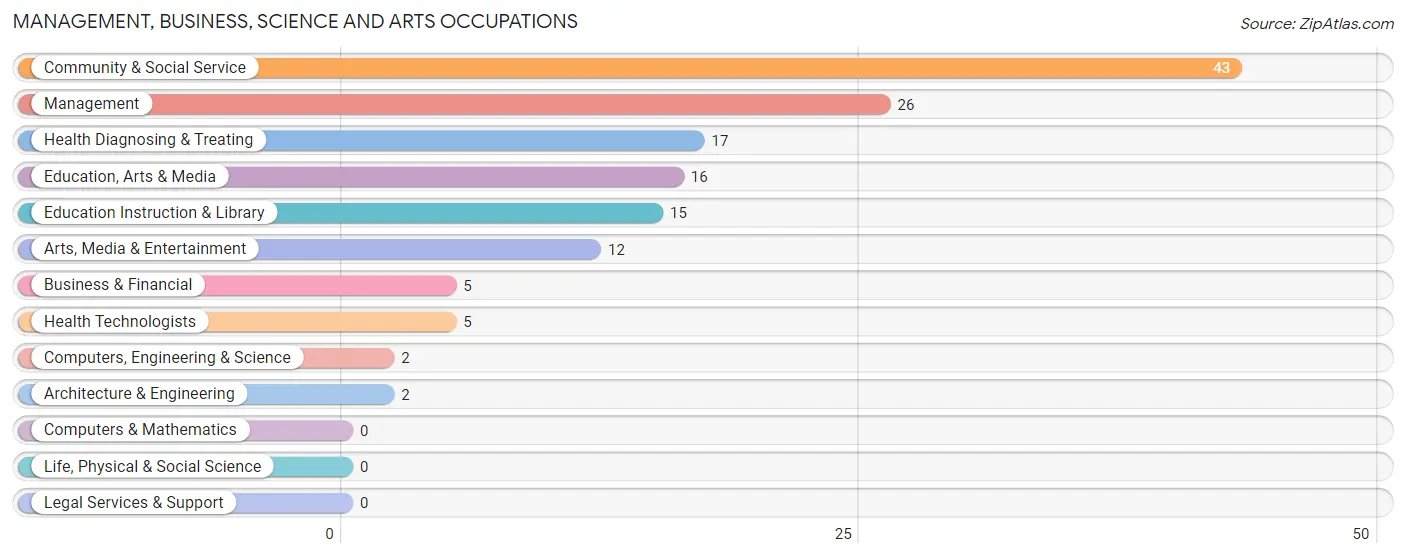
Management, Business, Science and Arts Occupations
The most common Management, Business, Science and Arts occupations in Rimersburg borough are Community & Social Service (43 | 10.5%), Management (26 | 6.3%), Health Diagnosing & Treating (17 | 4.1%), Education, Arts & Media (16 | 3.9%), and Education Instruction & Library (15 | 3.6%).
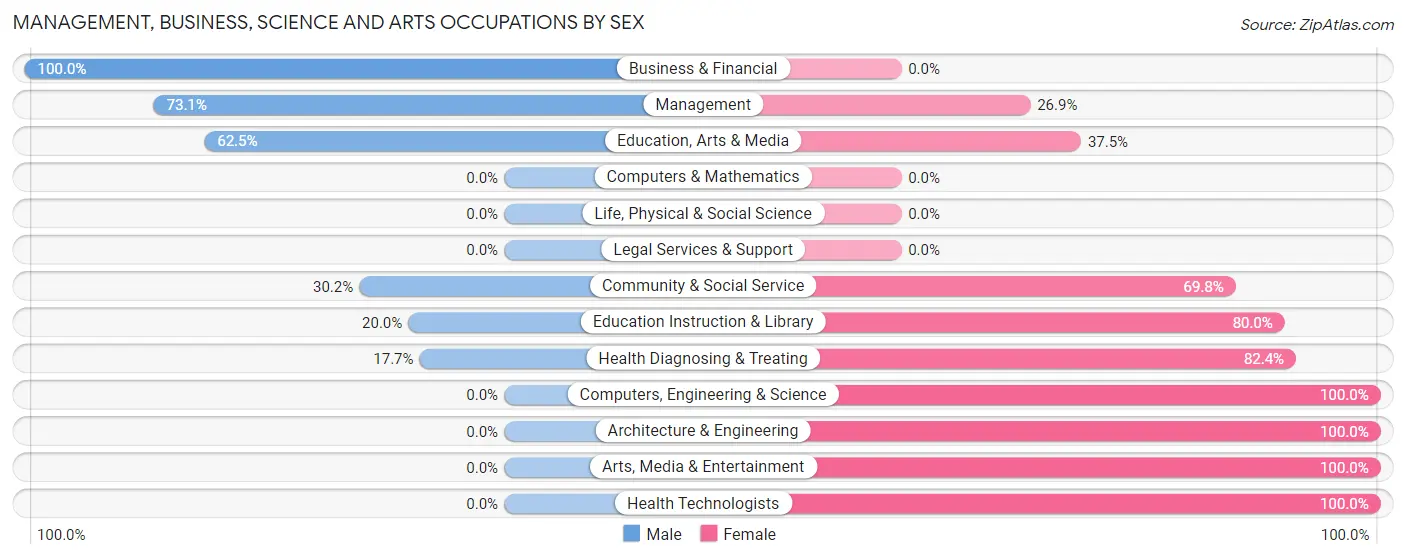
Management, Business, Science and Arts Occupations by Sex
Within the Management, Business, Science and Arts occupations in Rimersburg borough, the most male-oriented occupations are Business & Financial (100.0%), Management (73.1%), and Education, Arts & Media (62.5%), while the most female-oriented occupations are Computers, Engineering & Science (100.0%), Architecture & Engineering (100.0%), and Arts, Media & Entertainment (100.0%).
| Occupation | Male | Female |
| Management | 19 (73.1%) | 7 (26.9%) |
| Business & Financial | 5 (100.0%) | 0 (0.0%) |
| Computers, Engineering & Science | 0 (0.0%) | 2 (100.0%) |
| Computers & Mathematics | 0 (0.0%) | 0 (0.0%) |
| Architecture & Engineering | 0 (0.0%) | 2 (100.0%) |
| Life, Physical & Social Science | 0 (0.0%) | 0 (0.0%) |
| Community & Social Service | 13 (30.2%) | 30 (69.8%) |
| Education, Arts & Media | 10 (62.5%) | 6 (37.5%) |
| Legal Services & Support | 0 (0.0%) | 0 (0.0%) |
| Education Instruction & Library | 3 (20.0%) | 12 (80.0%) |
| Arts, Media & Entertainment | 0 (0.0%) | 12 (100.0%) |
| Health Diagnosing & Treating | 3 (17.6%) | 14 (82.4%) |
| Health Technologists | 0 (0.0%) | 5 (100.0%) |
| Total (Category) | 40 (43.0%) | 53 (57.0%) |
| Total (Overall) | 263 (64.0%) | 148 (36.0%) |
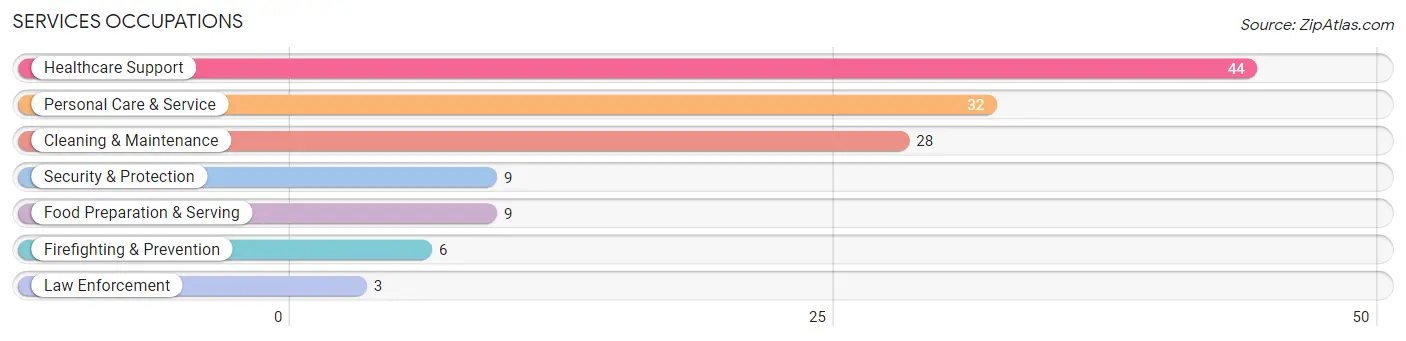
Services Occupations
The most common Services occupations in Rimersburg borough are Healthcare Support (44 | 10.7%), Personal Care & Service (32 | 7.8%), Cleaning & Maintenance (28 | 6.8%), Security & Protection (9 | 2.2%), and Food Preparation & Serving (9 | 2.2%).
Services Occupations by Sex
Within the Services occupations in Rimersburg borough, the most male-oriented occupations are Security & Protection (100.0%), Firefighting & Prevention (100.0%), and Law Enforcement (100.0%), while the most female-oriented occupations are Food Preparation & Serving (77.8%), Healthcare Support (50.0%), and Personal Care & Service (28.1%).
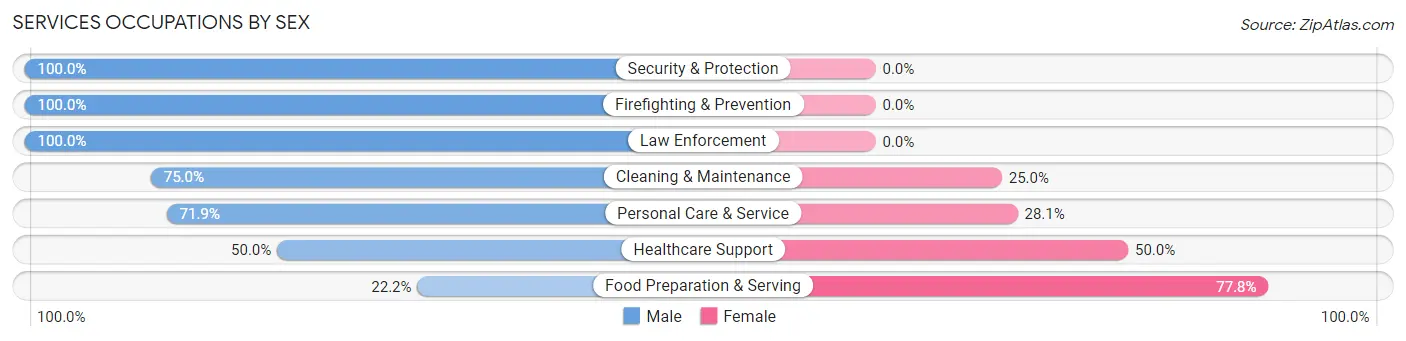
| Occupation | Male | Female |
| Healthcare Support | 22 (50.0%) | 22 (50.0%) |
| Security & Protection | 9 (100.0%) | 0 (0.0%) |
| Firefighting & Prevention | 6 (100.0%) | 0 (0.0%) |
| Law Enforcement | 3 (100.0%) | 0 (0.0%) |
| Food Preparation & Serving | 2 (22.2%) | 7 (77.8%) |
| Cleaning & Maintenance | 21 (75.0%) | 7 (25.0%) |
| Personal Care & Service | 23 (71.9%) | 9 (28.1%) |
| Total (Category) | 77 (63.1%) | 45 (36.9%) |
| Total (Overall) | 263 (64.0%) | 148 (36.0%) |
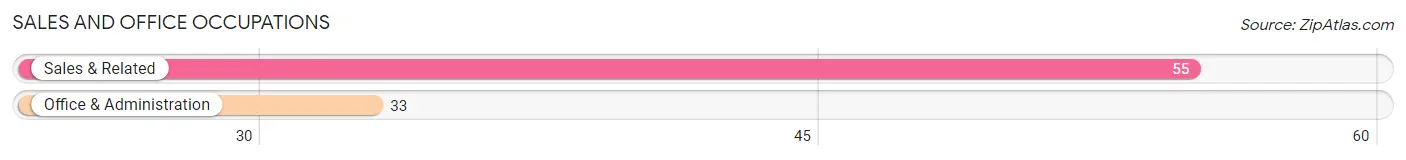
Sales and Office Occupations
The most common Sales and Office occupations in Rimersburg borough are Sales & Related (55 | 13.4%), and Office & Administration (33 | 8.0%).
Sales and Office Occupations by Sex
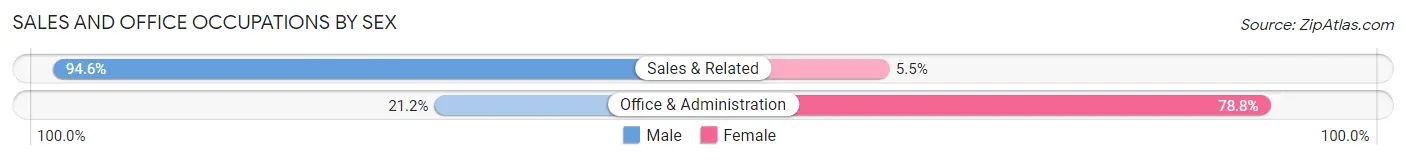
| Occupation | Male | Female |
| Sales & Related | 52 (94.6%) | 3 (5.4%) |
| Office & Administration | 7 (21.2%) | 26 (78.8%) |
| Total (Category) | 59 (67.0%) | 29 (33.0%) |
| Total (Overall) | 263 (64.0%) | 148 (36.0%) |
Natural Resources, Construction and Maintenance Occupations
The most common Natural Resources, Construction and Maintenance occupations in Rimersburg borough are Installation, Maintenance & Repair (12 | 2.9%), and Construction & Extraction (3 | 0.7%).
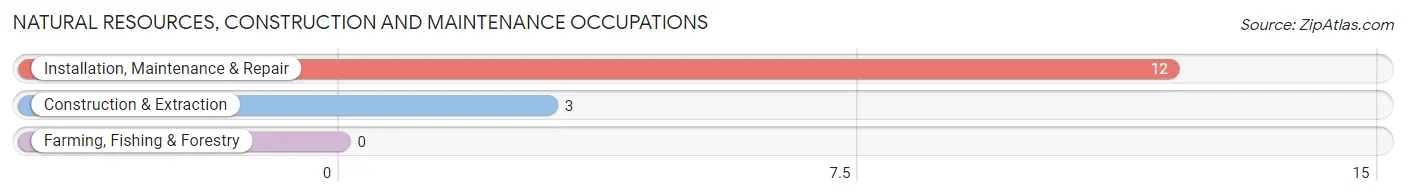
Natural Resources, Construction and Maintenance Occupations by Sex
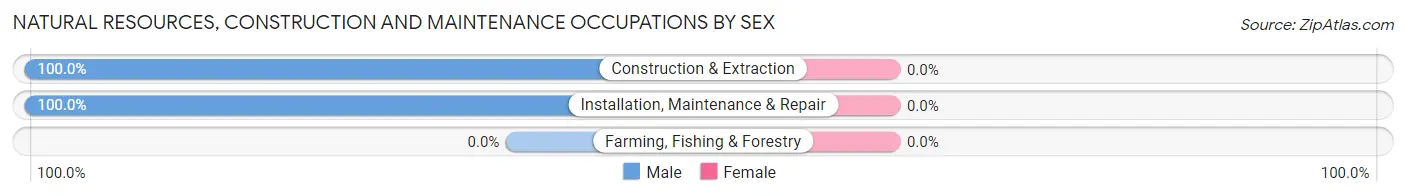
| Occupation | Male | Female |
| Farming, Fishing & Forestry | 0 (0.0%) | 0 (0.0%) |
| Construction & Extraction | 3 (100.0%) | 0 (0.0%) |
| Installation, Maintenance & Repair | 12 (100.0%) | 0 (0.0%) |
| Total (Category) | 15 (100.0%) | 0 (0.0%) |
| Total (Overall) | 263 (64.0%) | 148 (36.0%) |
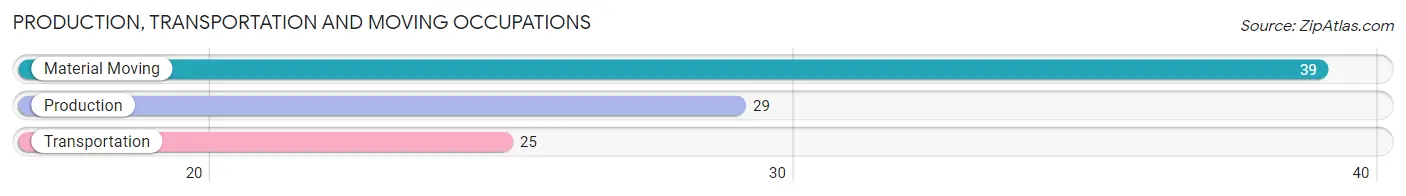
Production, Transportation and Moving Occupations
The most common Production, Transportation and Moving occupations in Rimersburg borough are Material Moving (39 | 9.5%), Production (29 | 7.1%), and Transportation (25 | 6.1%).
Production, Transportation and Moving Occupations by Sex
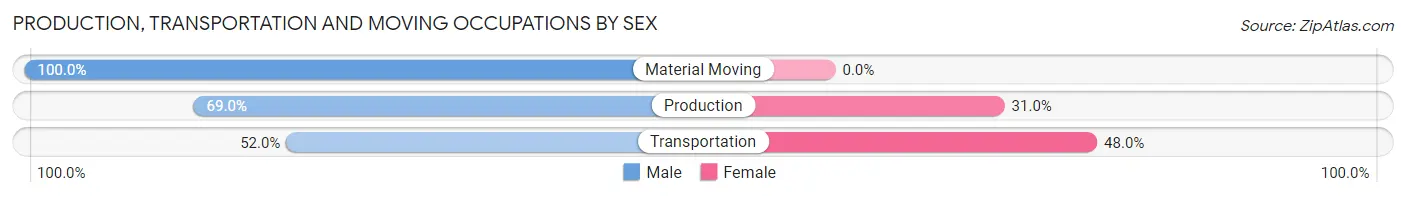
| Occupation | Male | Female |
| Production | 20 (69.0%) | 9 (31.0%) |
| Transportation | 13 (52.0%) | 12 (48.0%) |
| Material Moving | 39 (100.0%) | 0 (0.0%) |
| Total (Category) | 72 (77.4%) | 21 (22.6%) |
| Total (Overall) | 263 (64.0%) | 148 (36.0%) |
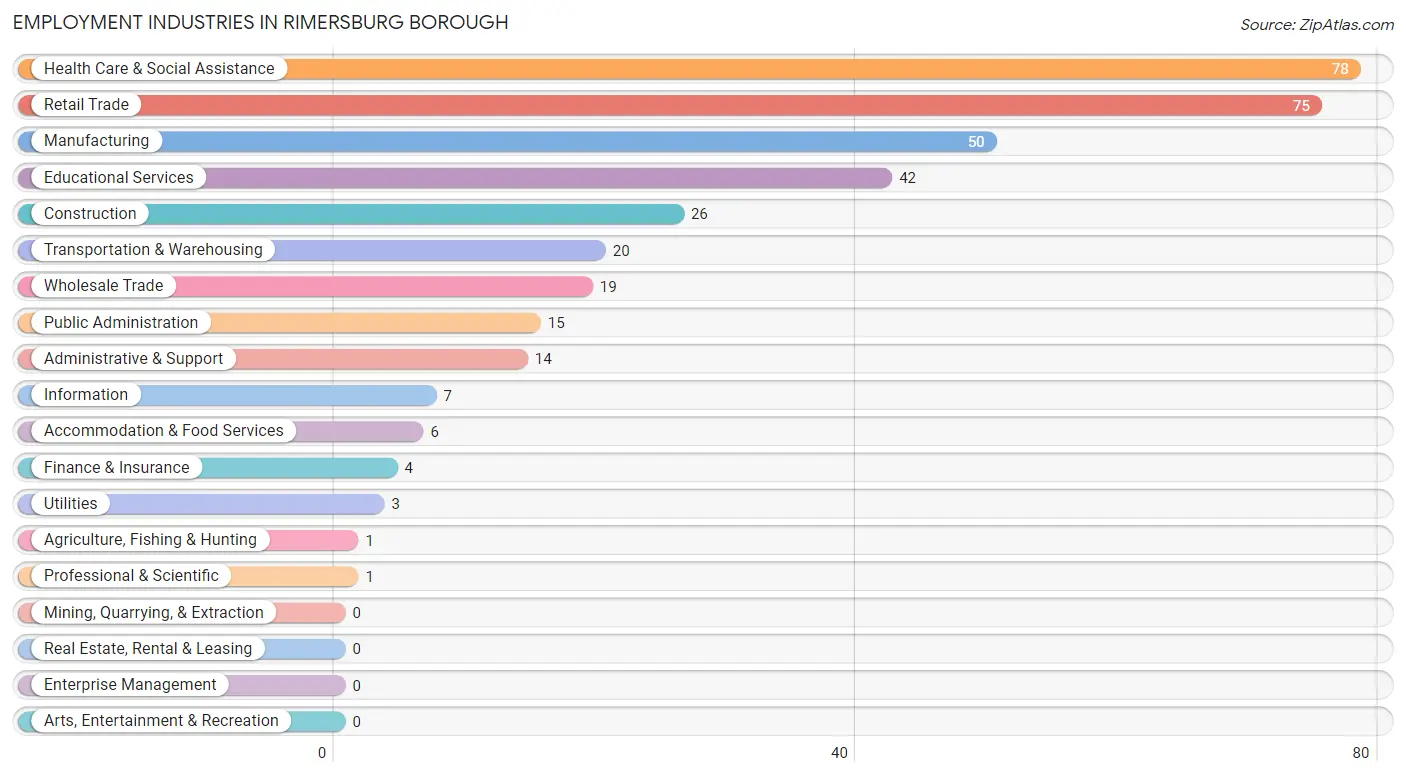
Employment Industries by Sex in Rimersburg borough
Employment Industries in Rimersburg borough
The major employment industries in Rimersburg borough include Health Care & Social Assistance (78 | 19.0%), Retail Trade (75 | 18.2%), Manufacturing (50 | 12.2%), Educational Services (42 | 10.2%), and Construction (26 | 6.3%).
Employment Industries by Sex in Rimersburg borough
The Rimersburg borough industries that see more men than women are Agriculture, Fishing & Hunting (100.0%), Manufacturing (100.0%), and Wholesale Trade (100.0%), whereas the industries that tend to have a higher number of women are Information (100.0%), Finance & Insurance (100.0%), and Professional & Scientific (100.0%).
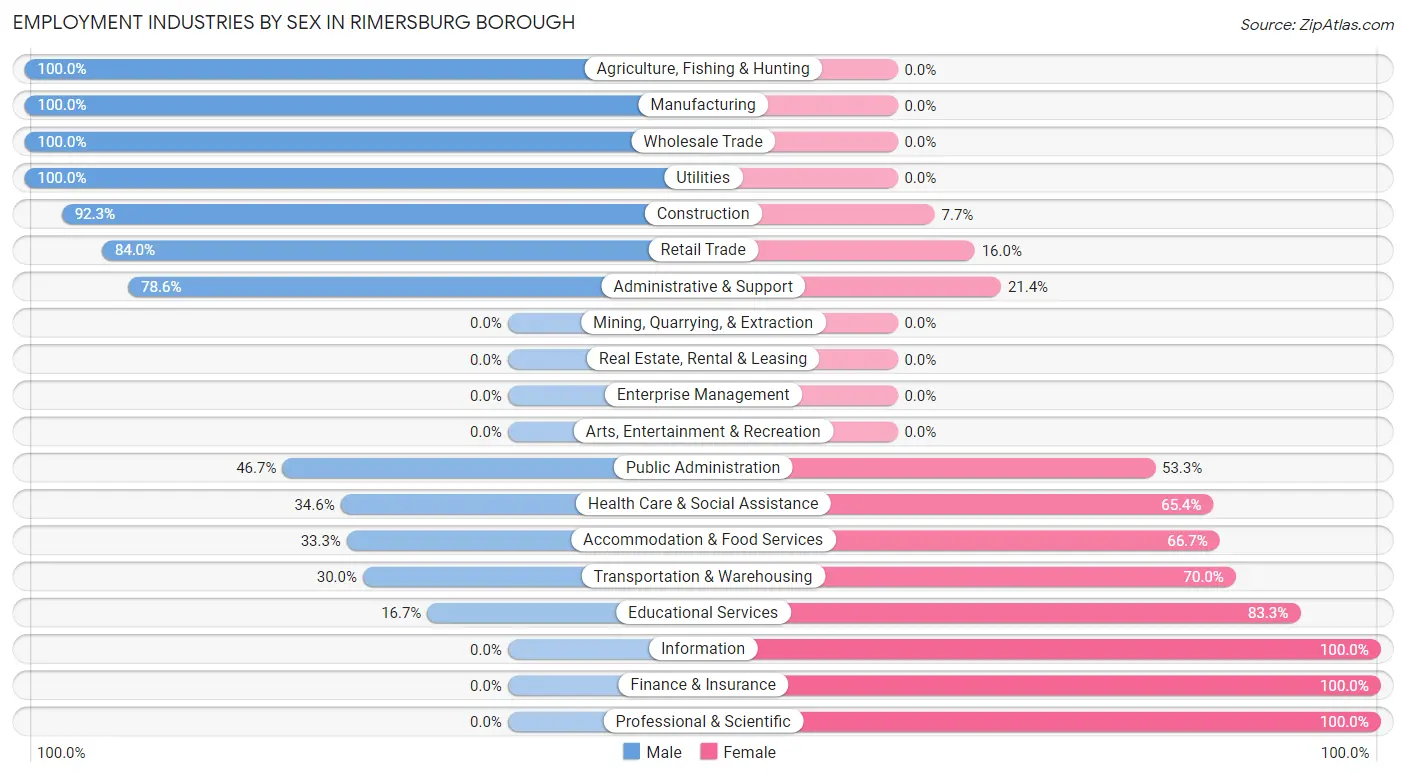
| Industry | Male | Female |
| Agriculture, Fishing & Hunting | 1 (100.0%) | 0 (0.0%) |
| Mining, Quarrying, & Extraction | 0 (0.0%) | 0 (0.0%) |
| Construction | 24 (92.3%) | 2 (7.7%) |
| Manufacturing | 50 (100.0%) | 0 (0.0%) |
| Wholesale Trade | 19 (100.0%) | 0 (0.0%) |
| Retail Trade | 63 (84.0%) | 12 (16.0%) |
| Transportation & Warehousing | 6 (30.0%) | 14 (70.0%) |
| Utilities | 3 (100.0%) | 0 (0.0%) |
| Information | 0 (0.0%) | 7 (100.0%) |
| Finance & Insurance | 0 (0.0%) | 4 (100.0%) |
| Real Estate, Rental & Leasing | 0 (0.0%) | 0 (0.0%) |
| Professional & Scientific | 0 (0.0%) | 1 (100.0%) |
| Enterprise Management | 0 (0.0%) | 0 (0.0%) |
| Administrative & Support | 11 (78.6%) | 3 (21.4%) |
| Educational Services | 7 (16.7%) | 35 (83.3%) |
| Health Care & Social Assistance | 27 (34.6%) | 51 (65.4%) |
| Arts, Entertainment & Recreation | 0 (0.0%) | 0 (0.0%) |
| Accommodation & Food Services | 2 (33.3%) | 4 (66.7%) |
| Public Administration | 7 (46.7%) | 8 (53.3%) |
| Total | 263 (64.0%) | 148 (36.0%) |
Education in Rimersburg borough
School Enrollment in Rimersburg borough
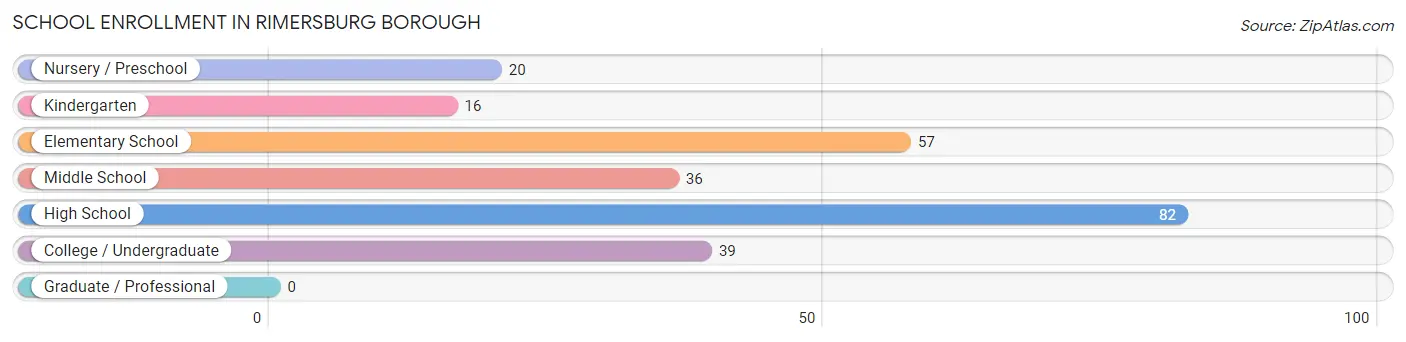
The most common levels of schooling among the 250 students in Rimersburg borough are high school (82 | 32.8%), elementary school (57 | 22.8%), and college / undergraduate (39 | 15.6%).
| School Level | # Students | % Students |
| Nursery / Preschool | 20 | 8.0% |
| Kindergarten | 16 | 6.4% |
| Elementary School | 57 | 22.8% |
| Middle School | 36 | 14.4% |
| High School | 82 | 32.8% |
| College / Undergraduate | 39 | 15.6% |
| Graduate / Professional | 0 | 0.0% |
| Total | 250 | 100.0% |
School Enrollment by Age by Funding Source in Rimersburg borough
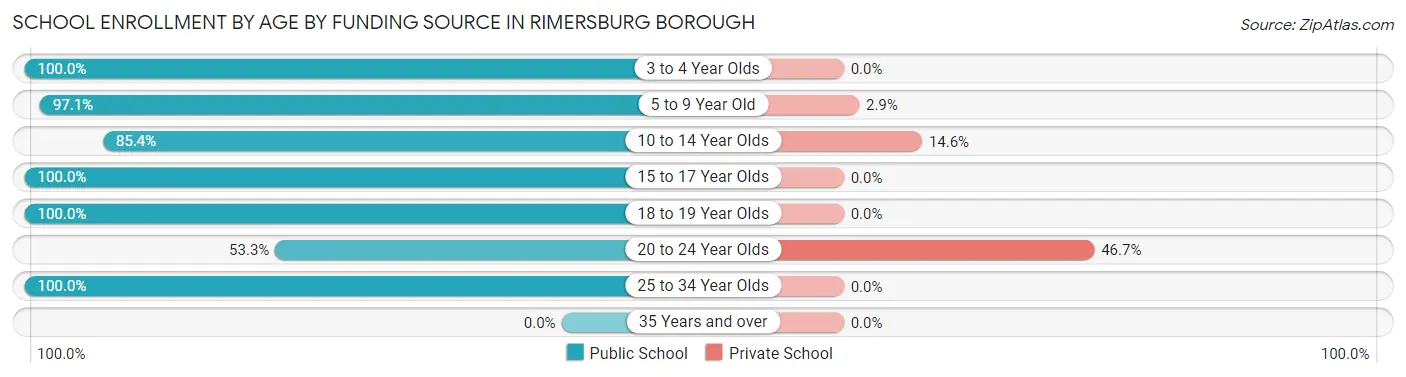
Out of a total of 250 students who are enrolled in schools in Rimersburg borough, 23 (9.2%) attend a private institution, while the remaining 227 (90.8%) are enrolled in public schools. The age group of 20 to 24 year olds has the highest likelihood of being enrolled in private schools, with 14 (46.7% in the age bracket) enrolled. Conversely, the age group of 3 to 4 year olds has the lowest likelihood of being enrolled in a private school, with 20 (100.0% in the age bracket) attending a public institution.
| Age Bracket | Public School | Private School |
| 3 to 4 Year Olds | 20 (100.0%) | 0 (0.0%) |
| 5 to 9 Year Old | 68 (97.1%) | 2 (2.9%) |
| 10 to 14 Year Olds | 41 (85.4%) | 7 (14.6%) |
| 15 to 17 Year Olds | 24 (100.0%) | 0 (0.0%) |
| 18 to 19 Year Olds | 49 (100.0%) | 0 (0.0%) |
| 20 to 24 Year Olds | 16 (53.3%) | 14 (46.7%) |
| 25 to 34 Year Olds | 9 (100.0%) | 0 (0.0%) |
| 35 Years and over | 0 (0.0%) | 0 (0.0%) |
| Total | 227 (90.8%) | 23 (9.2%) |
Educational Attainment by Field of Study in Rimersburg borough
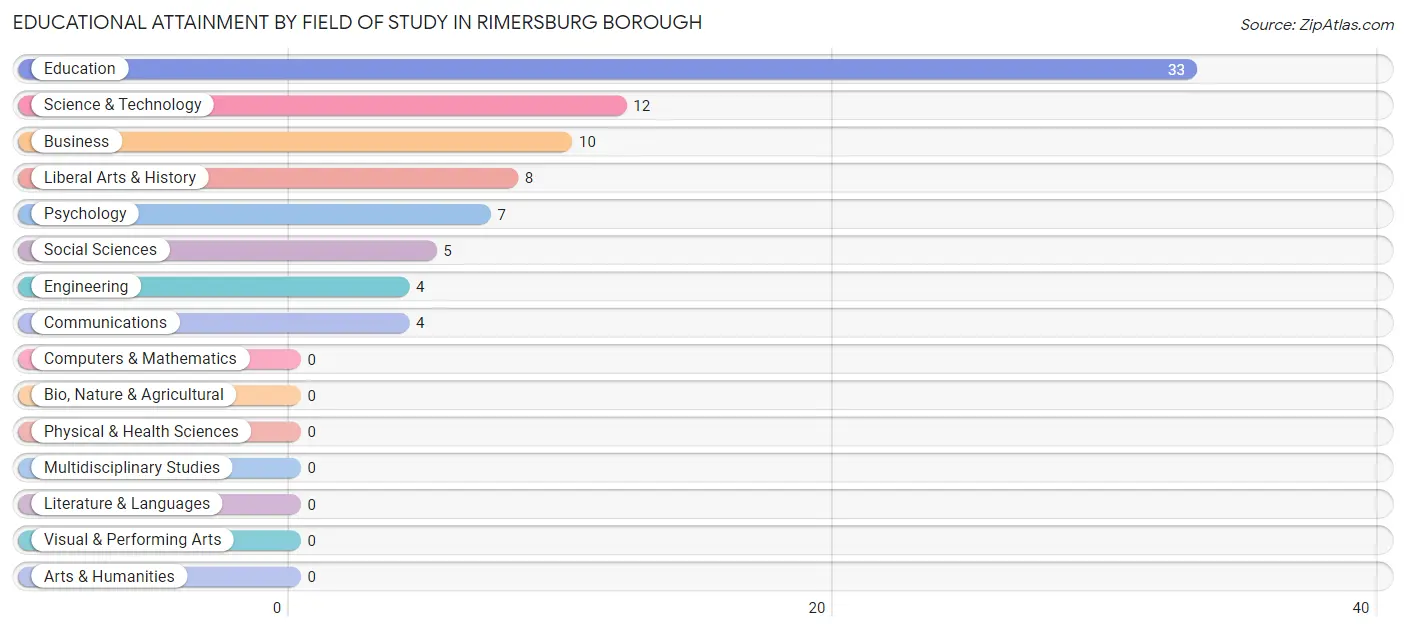
Education (33 | 39.8%), science & technology (12 | 14.5%), business (10 | 12.0%), liberal arts & history (8 | 9.6%), and psychology (7 | 8.4%) are the most common fields of study among 83 individuals in Rimersburg borough who have obtained a bachelor's degree or higher.
| Field of Study | # Graduates | % Graduates |
| Computers & Mathematics | 0 | 0.0% |
| Bio, Nature & Agricultural | 0 | 0.0% |
| Physical & Health Sciences | 0 | 0.0% |
| Psychology | 7 | 8.4% |
| Social Sciences | 5 | 6.0% |
| Engineering | 4 | 4.8% |
| Multidisciplinary Studies | 0 | 0.0% |
| Science & Technology | 12 | 14.5% |
| Business | 10 | 12.0% |
| Education | 33 | 39.8% |
| Literature & Languages | 0 | 0.0% |
| Liberal Arts & History | 8 | 9.6% |
| Visual & Performing Arts | 0 | 0.0% |
| Communications | 4 | 4.8% |
| Arts & Humanities | 0 | 0.0% |
| Total | 83 | 100.0% |
Transportation & Commute in Rimersburg borough
Vehicle Availability by Sex in Rimersburg borough
The most prevalent vehicle ownership categories in Rimersburg borough are males with 2 vehicles (81, accounting for 30.8%) and females with 2 vehicles (48, making up 58.3%).
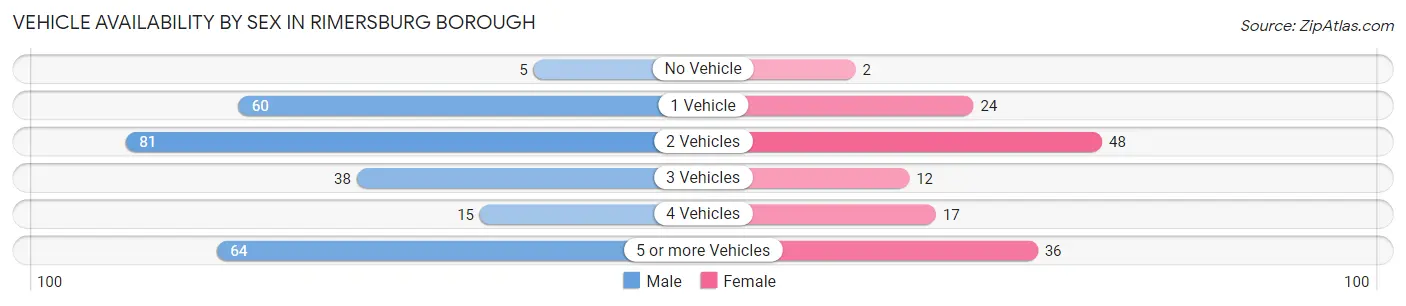
| Vehicles Available | Male | Female |
| No Vehicle | 5 (1.9%) | 2 (1.4%) |
| 1 Vehicle | 60 (22.8%) | 24 (17.3%) |
| 2 Vehicles | 81 (30.8%) | 48 (34.5%) |
| 3 Vehicles | 38 (14.4%) | 12 (8.6%) |
| 4 Vehicles | 15 (5.7%) | 17 (12.2%) |
| 5 or more Vehicles | 64 (24.3%) | 36 (25.9%) |
| Total | 263 (100.0%) | 139 (100.0%) |
Commute Time in Rimersburg borough
The most frequently occuring commute durations in Rimersburg borough are less than 5 minutes (109 commuters, 28.1%), 45 to 59 minutes (58 commuters, 14.9%), and 10 to 14 minutes (49 commuters, 12.6%).
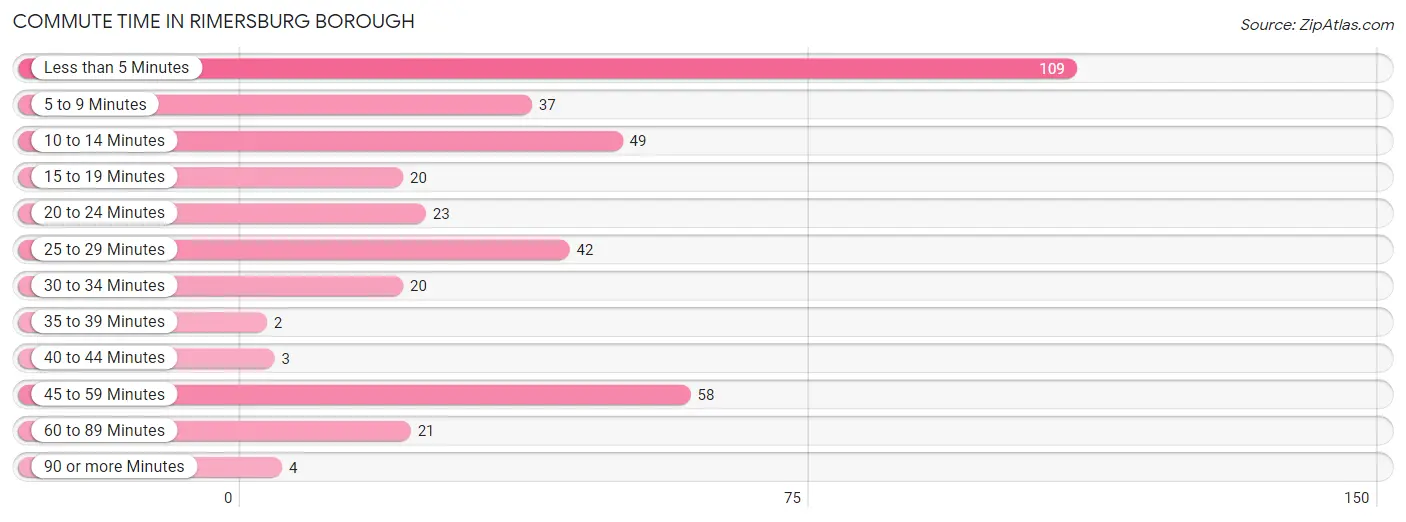
| Commute Time | # Commuters | % Commuters |
| Less than 5 Minutes | 109 | 28.1% |
| 5 to 9 Minutes | 37 | 9.5% |
| 10 to 14 Minutes | 49 | 12.6% |
| 15 to 19 Minutes | 20 | 5.1% |
| 20 to 24 Minutes | 23 | 5.9% |
| 25 to 29 Minutes | 42 | 10.8% |
| 30 to 34 Minutes | 20 | 5.1% |
| 35 to 39 Minutes | 2 | 0.5% |
| 40 to 44 Minutes | 3 | 0.8% |
| 45 to 59 Minutes | 58 | 14.9% |
| 60 to 89 Minutes | 21 | 5.4% |
| 90 or more Minutes | 4 | 1.0% |
Commute Time by Sex in Rimersburg borough
The most common commute times in Rimersburg borough are less than 5 minutes (74 commuters, 28.7%) for males and less than 5 minutes (35 commuters, 26.9%) for females.
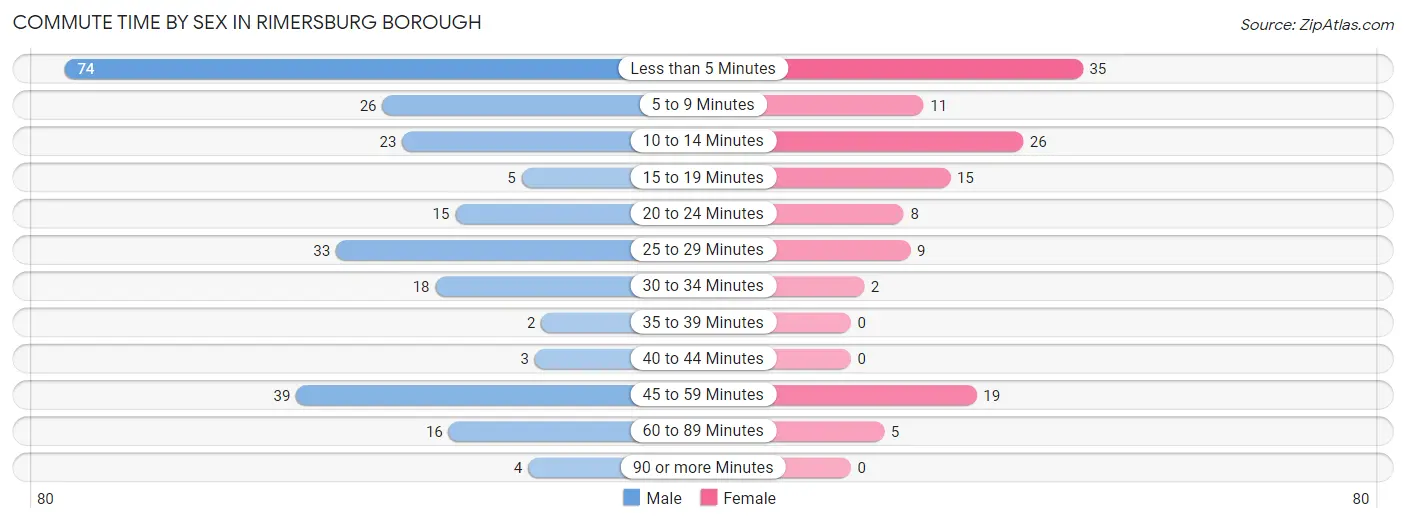
| Commute Time | Male | Female |
| Less than 5 Minutes | 74 (28.7%) | 35 (26.9%) |
| 5 to 9 Minutes | 26 (10.1%) | 11 (8.5%) |
| 10 to 14 Minutes | 23 (8.9%) | 26 (20.0%) |
| 15 to 19 Minutes | 5 (1.9%) | 15 (11.5%) |
| 20 to 24 Minutes | 15 (5.8%) | 8 (6.1%) |
| 25 to 29 Minutes | 33 (12.8%) | 9 (6.9%) |
| 30 to 34 Minutes | 18 (7.0%) | 2 (1.5%) |
| 35 to 39 Minutes | 2 (0.8%) | 0 (0.0%) |
| 40 to 44 Minutes | 3 (1.2%) | 0 (0.0%) |
| 45 to 59 Minutes | 39 (15.1%) | 19 (14.6%) |
| 60 to 89 Minutes | 16 (6.2%) | 5 (3.8%) |
| 90 or more Minutes | 4 (1.5%) | 0 (0.0%) |
Time of Departure to Work by Sex in Rimersburg borough
The most frequent times of departure to work in Rimersburg borough are 12:00 AM to 4:59 AM (70, 27.1%) for males and 8:30 AM to 8:59 AM (24, 18.5%) for females.
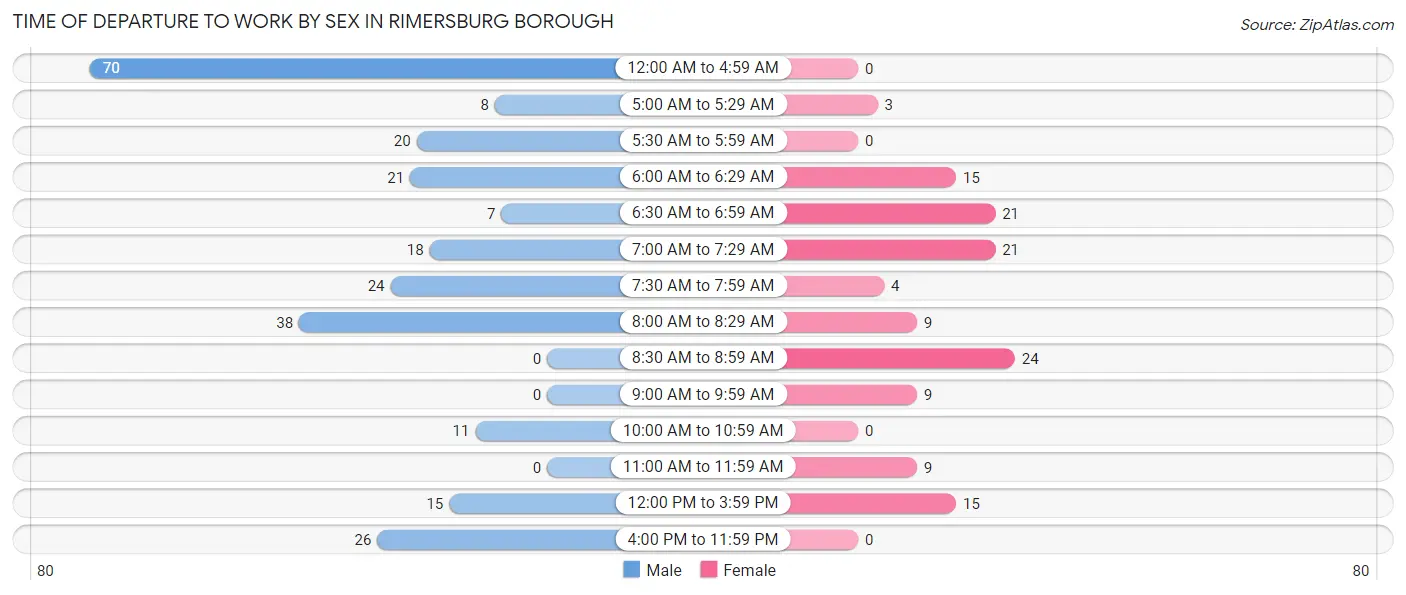
| Time of Departure | Male | Female |
| 12:00 AM to 4:59 AM | 70 (27.1%) | 0 (0.0%) |
| 5:00 AM to 5:29 AM | 8 (3.1%) | 3 (2.3%) |
| 5:30 AM to 5:59 AM | 20 (7.7%) | 0 (0.0%) |
| 6:00 AM to 6:29 AM | 21 (8.1%) | 15 (11.5%) |
| 6:30 AM to 6:59 AM | 7 (2.7%) | 21 (16.2%) |
| 7:00 AM to 7:29 AM | 18 (7.0%) | 21 (16.2%) |
| 7:30 AM to 7:59 AM | 24 (9.3%) | 4 (3.1%) |
| 8:00 AM to 8:29 AM | 38 (14.7%) | 9 (6.9%) |
| 8:30 AM to 8:59 AM | 0 (0.0%) | 24 (18.5%) |
| 9:00 AM to 9:59 AM | 0 (0.0%) | 9 (6.9%) |
| 10:00 AM to 10:59 AM | 11 (4.3%) | 0 (0.0%) |
| 11:00 AM to 11:59 AM | 0 (0.0%) | 9 (6.9%) |
| 12:00 PM to 3:59 PM | 15 (5.8%) | 15 (11.5%) |
| 4:00 PM to 11:59 PM | 26 (10.1%) | 0 (0.0%) |
| Total | 258 (100.0%) | 130 (100.0%) |
Housing Occupancy in Rimersburg borough
Occupancy by Ownership in Rimersburg borough
Of the total 402 dwellings in Rimersburg borough, owner-occupied units account for 220 (54.7%), while renter-occupied units make up 182 (45.3%).
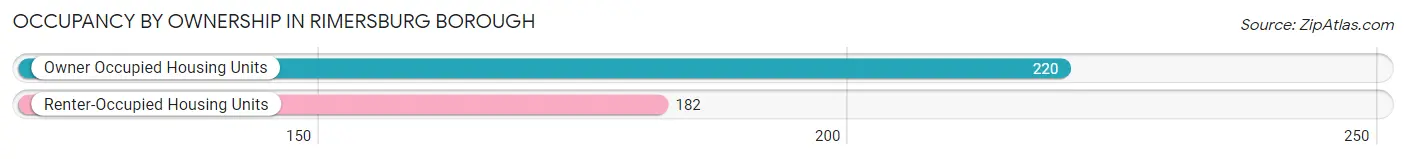
| Occupancy | # Housing Units | % Housing Units |
| Owner Occupied Housing Units | 220 | 54.7% |
| Renter-Occupied Housing Units | 182 | 45.3% |
| Total Occupied Housing Units | 402 | 100.0% |
Occupancy by Household Size in Rimersburg borough
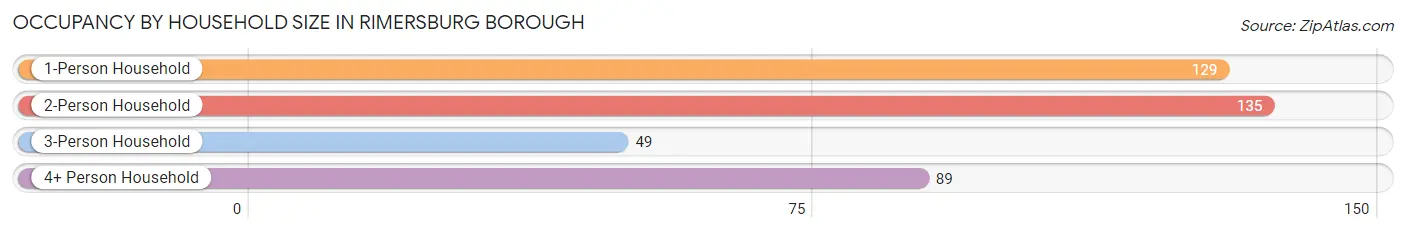
| Household Size | # Housing Units | % Housing Units |
| 1-Person Household | 129 | 32.1% |
| 2-Person Household | 135 | 33.6% |
| 3-Person Household | 49 | 12.2% |
| 4+ Person Household | 89 | 22.1% |
| Total Housing Units | 402 | 100.0% |
Occupancy by Ownership by Household Size in Rimersburg borough
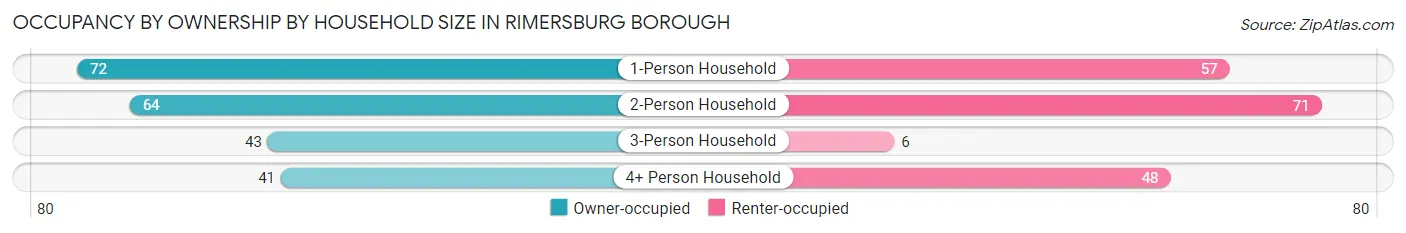
| Household Size | Owner-occupied | Renter-occupied |
| 1-Person Household | 72 (55.8%) | 57 (44.2%) |
| 2-Person Household | 64 (47.4%) | 71 (52.6%) |
| 3-Person Household | 43 (87.8%) | 6 (12.2%) |
| 4+ Person Household | 41 (46.1%) | 48 (53.9%) |
| Total Housing Units | 220 (54.7%) | 182 (45.3%) |
Occupancy by Educational Attainment in Rimersburg borough
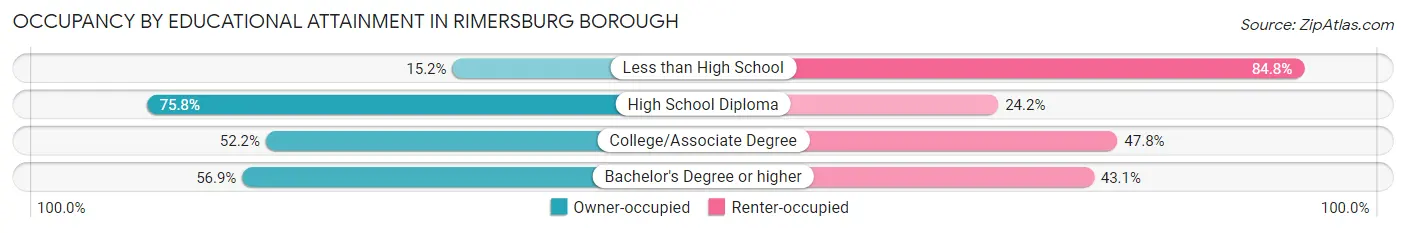
| Household Size | Owner-occupied | Renter-occupied |
| Less than High School | 12 (15.2%) | 67 (84.8%) |
| High School Diploma | 119 (75.8%) | 38 (24.2%) |
| College/Associate Degree | 60 (52.2%) | 55 (47.8%) |
| Bachelor's Degree or higher | 29 (56.9%) | 22 (43.1%) |
Occupancy by Age of Householder in Rimersburg borough
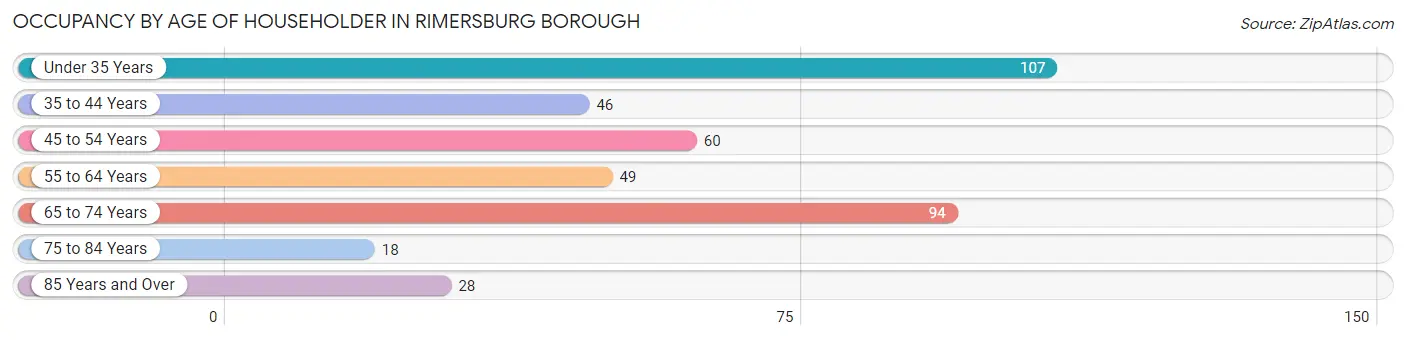
| Age Bracket | # Households | % Households |
| Under 35 Years | 107 | 26.6% |
| 35 to 44 Years | 46 | 11.4% |
| 45 to 54 Years | 60 | 14.9% |
| 55 to 64 Years | 49 | 12.2% |
| 65 to 74 Years | 94 | 23.4% |
| 75 to 84 Years | 18 | 4.5% |
| 85 Years and Over | 28 | 7.0% |
| Total | 402 | 100.0% |
Housing Finances in Rimersburg borough
Median Income by Occupancy in Rimersburg borough
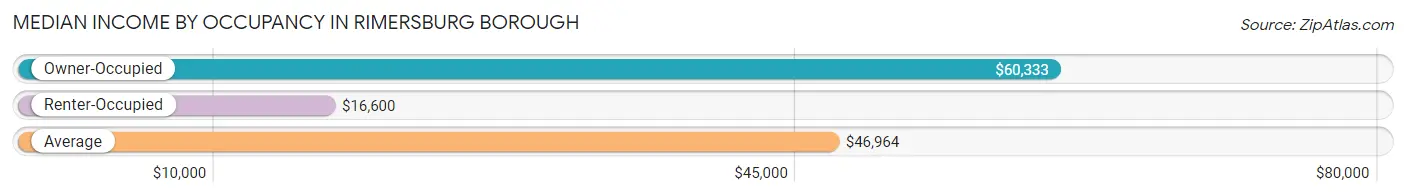
| Occupancy Type | # Households | Median Income |
| Owner-Occupied | 220 (54.7%) | $60,333 |
| Renter-Occupied | 182 (45.3%) | $16,600 |
| Average | 402 (100.0%) | $46,964 |
Occupancy by Householder Income Bracket in Rimersburg borough
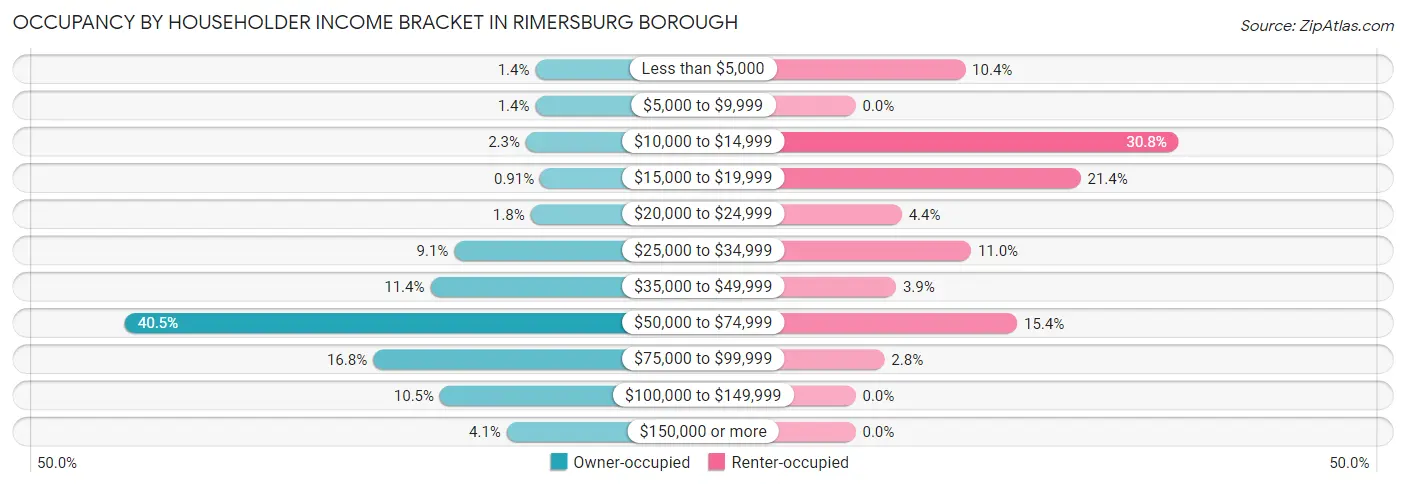
| Income Bracket | Owner-occupied | Renter-occupied |
| Less than $5,000 | 3 (1.4%) | 19 (10.4%) |
| $5,000 to $9,999 | 3 (1.4%) | 0 (0.0%) |
| $10,000 to $14,999 | 5 (2.3%) | 56 (30.8%) |
| $15,000 to $19,999 | 2 (0.9%) | 39 (21.4%) |
| $20,000 to $24,999 | 4 (1.8%) | 8 (4.4%) |
| $25,000 to $34,999 | 20 (9.1%) | 20 (11.0%) |
| $35,000 to $49,999 | 25 (11.4%) | 7 (3.8%) |
| $50,000 to $74,999 | 89 (40.5%) | 28 (15.4%) |
| $75,000 to $99,999 | 37 (16.8%) | 5 (2.8%) |
| $100,000 to $149,999 | 23 (10.4%) | 0 (0.0%) |
| $150,000 or more | 9 (4.1%) | 0 (0.0%) |
| Total | 220 (100.0%) | 182 (100.0%) |
Monthly Housing Cost Tiers in Rimersburg borough
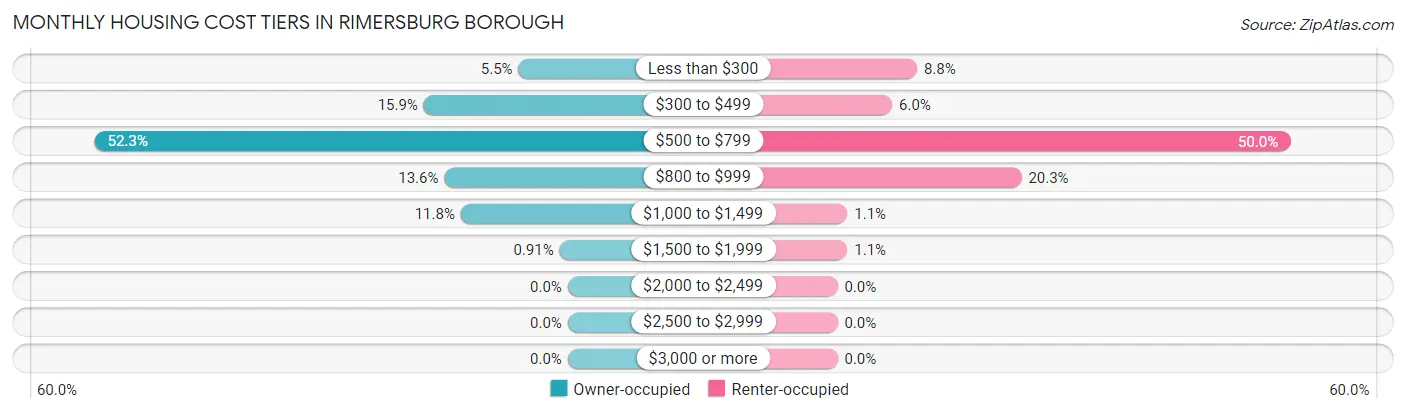
| Monthly Cost | Owner-occupied | Renter-occupied |
| Less than $300 | 12 (5.4%) | 16 (8.8%) |
| $300 to $499 | 35 (15.9%) | 11 (6.0%) |
| $500 to $799 | 115 (52.3%) | 91 (50.0%) |
| $800 to $999 | 30 (13.6%) | 37 (20.3%) |
| $1,000 to $1,499 | 26 (11.8%) | 2 (1.1%) |
| $1,500 to $1,999 | 2 (0.9%) | 2 (1.1%) |
| $2,000 to $2,499 | 0 (0.0%) | 0 (0.0%) |
| $2,500 to $2,999 | 0 (0.0%) | 0 (0.0%) |
| $3,000 or more | 0 (0.0%) | 0 (0.0%) |
| Total | 220 (100.0%) | 182 (100.0%) |
Physical Housing Characteristics in Rimersburg borough
Housing Structures in Rimersburg borough
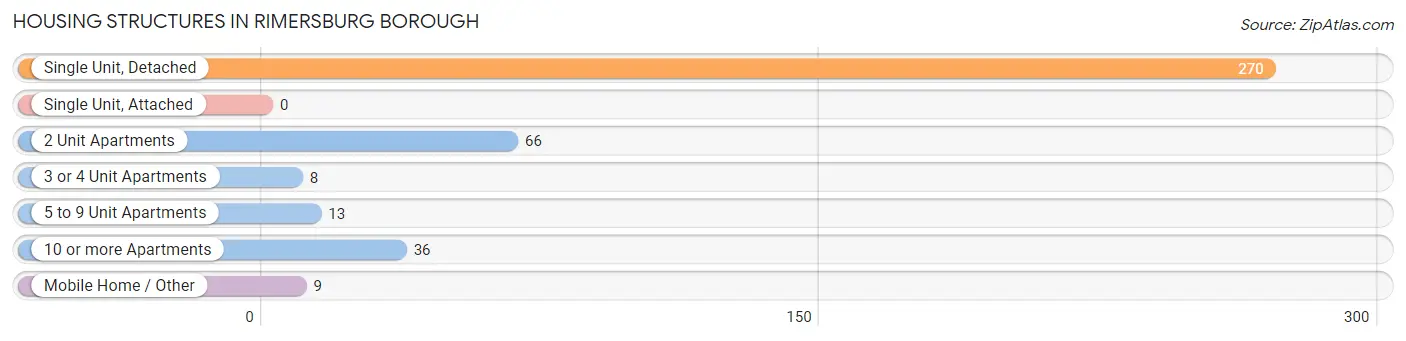
| Structure Type | # Housing Units | % Housing Units |
| Single Unit, Detached | 270 | 67.2% |
| Single Unit, Attached | 0 | 0.0% |
| 2 Unit Apartments | 66 | 16.4% |
| 3 or 4 Unit Apartments | 8 | 2.0% |
| 5 to 9 Unit Apartments | 13 | 3.2% |
| 10 or more Apartments | 36 | 9.0% |
| Mobile Home / Other | 9 | 2.2% |
| Total | 402 | 100.0% |
Housing Structures by Occupancy in Rimersburg borough
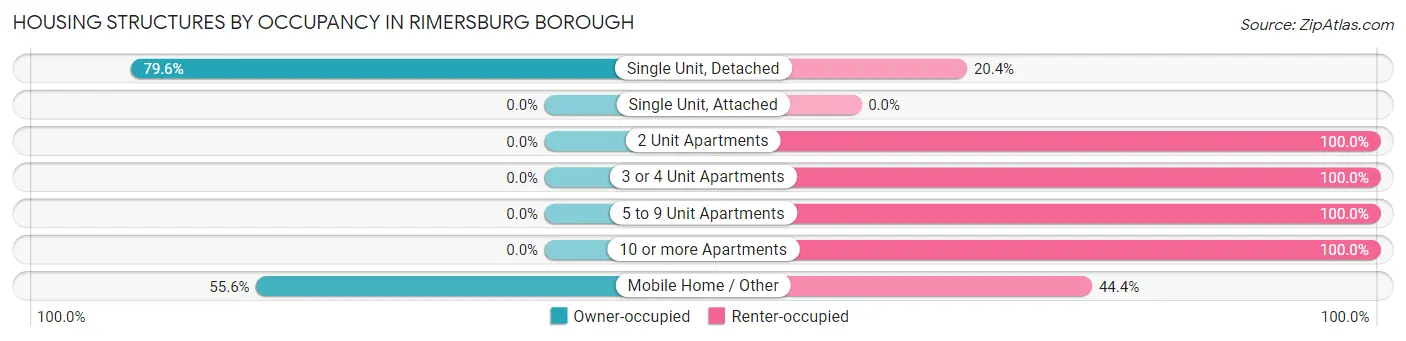
| Structure Type | Owner-occupied | Renter-occupied |
| Single Unit, Detached | 215 (79.6%) | 55 (20.4%) |
| Single Unit, Attached | 0 (0.0%) | 0 (0.0%) |
| 2 Unit Apartments | 0 (0.0%) | 66 (100.0%) |
| 3 or 4 Unit Apartments | 0 (0.0%) | 8 (100.0%) |
| 5 to 9 Unit Apartments | 0 (0.0%) | 13 (100.0%) |
| 10 or more Apartments | 0 (0.0%) | 36 (100.0%) |
| Mobile Home / Other | 5 (55.6%) | 4 (44.4%) |
| Total | 220 (54.7%) | 182 (45.3%) |
Housing Structures by Number of Rooms in Rimersburg borough
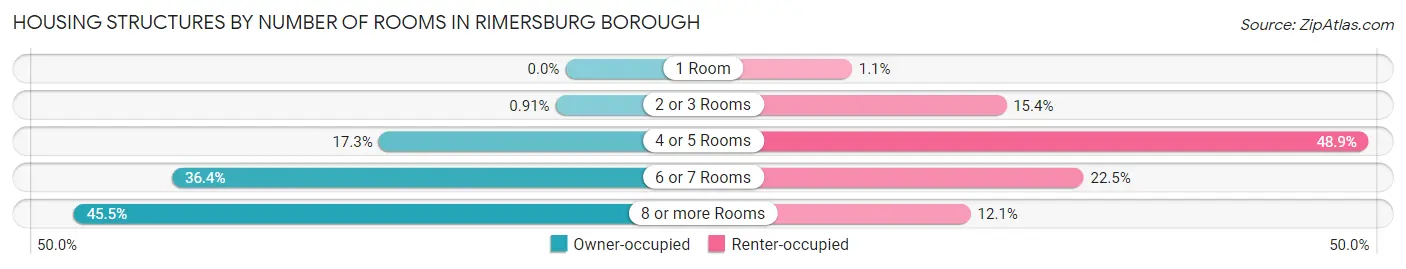
| Number of Rooms | Owner-occupied | Renter-occupied |
| 1 Room | 0 (0.0%) | 2 (1.1%) |
| 2 or 3 Rooms | 2 (0.9%) | 28 (15.4%) |
| 4 or 5 Rooms | 38 (17.3%) | 89 (48.9%) |
| 6 or 7 Rooms | 80 (36.4%) | 41 (22.5%) |
| 8 or more Rooms | 100 (45.5%) | 22 (12.1%) |
| Total | 220 (100.0%) | 182 (100.0%) |
Housing Structure by Heating Type in Rimersburg borough
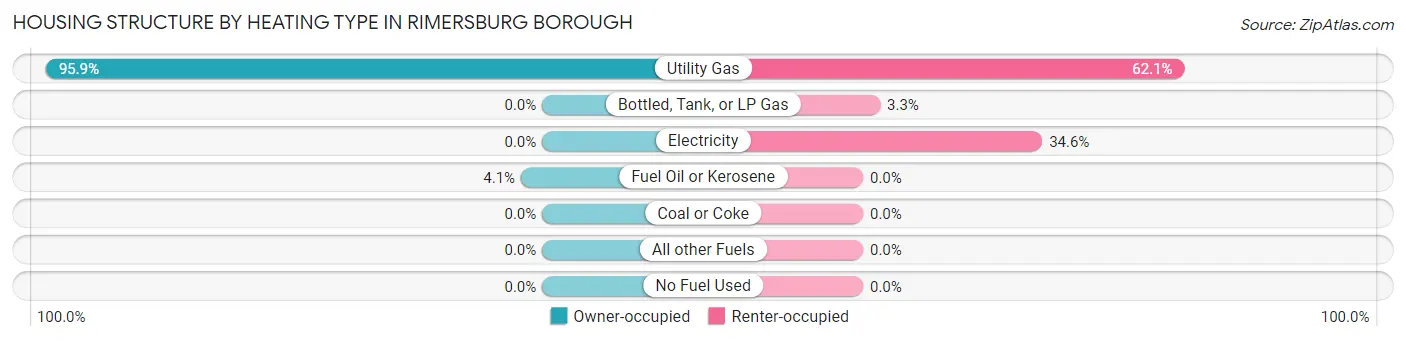
| Heating Type | Owner-occupied | Renter-occupied |
| Utility Gas | 211 (95.9%) | 113 (62.1%) |
| Bottled, Tank, or LP Gas | 0 (0.0%) | 6 (3.3%) |
| Electricity | 0 (0.0%) | 63 (34.6%) |
| Fuel Oil or Kerosene | 9 (4.1%) | 0 (0.0%) |
| Coal or Coke | 0 (0.0%) | 0 (0.0%) |
| All other Fuels | 0 (0.0%) | 0 (0.0%) |
| No Fuel Used | 0 (0.0%) | 0 (0.0%) |
| Total | 220 (100.0%) | 182 (100.0%) |
Household Vehicle Usage in Rimersburg borough
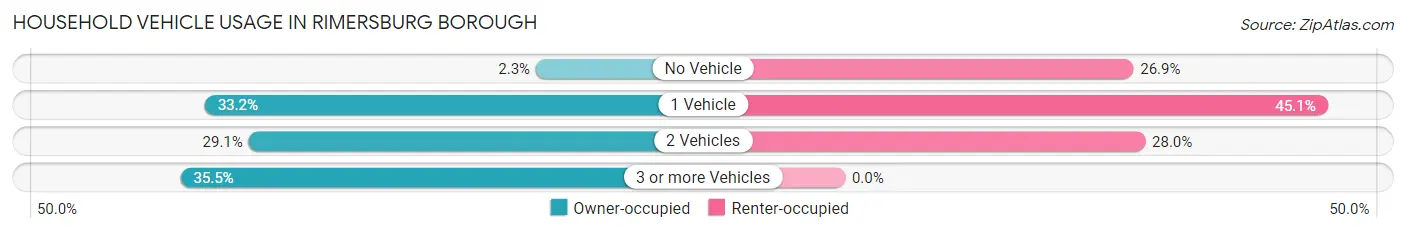
| Vehicles per Household | Owner-occupied | Renter-occupied |
| No Vehicle | 5 (2.3%) | 49 (26.9%) |
| 1 Vehicle | 73 (33.2%) | 82 (45.1%) |
| 2 Vehicles | 64 (29.1%) | 51 (28.0%) |
| 3 or more Vehicles | 78 (35.4%) | 0 (0.0%) |
| Total | 220 (100.0%) | 182 (100.0%) |
Real Estate & Mortgages in Rimersburg borough
Real Estate and Mortgage Overview in Rimersburg borough
| Characteristic | Without Mortgage | With Mortgage |
| Housing Units | 90 | 130 |
| Median Property Value | $95,500 | $54,600 |
| Median Household Income | $58,750 | $7 |
| Monthly Housing Costs | $490 | $0 |
| Real Estate Taxes | $1,338 | $0 |
Property Value by Mortgage Status in Rimersburg borough
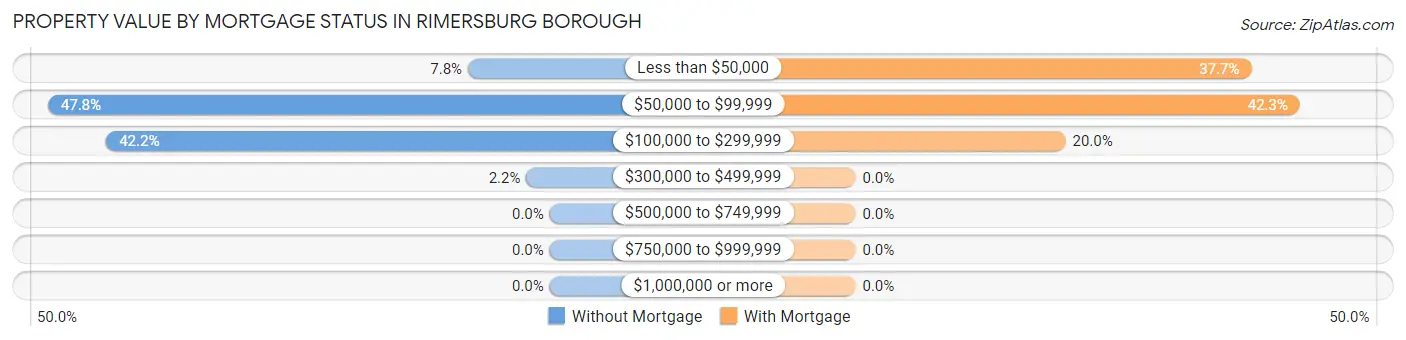
| Property Value | Without Mortgage | With Mortgage |
| Less than $50,000 | 7 (7.8%) | 49 (37.7%) |
| $50,000 to $99,999 | 43 (47.8%) | 55 (42.3%) |
| $100,000 to $299,999 | 38 (42.2%) | 26 (20.0%) |
| $300,000 to $499,999 | 2 (2.2%) | 0 (0.0%) |
| $500,000 to $749,999 | 0 (0.0%) | 0 (0.0%) |
| $750,000 to $999,999 | 0 (0.0%) | 0 (0.0%) |
| $1,000,000 or more | 0 (0.0%) | 0 (0.0%) |
| Total | 90 (100.0%) | 130 (100.0%) |
Household Income by Mortgage Status in Rimersburg borough
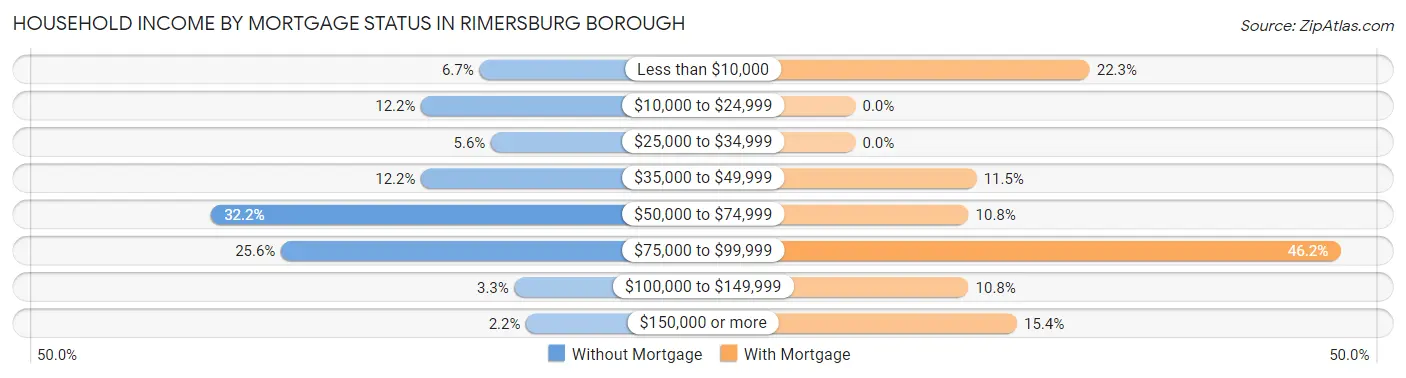
| Household Income | Without Mortgage | With Mortgage |
| Less than $10,000 | 6 (6.7%) | 29 (22.3%) |
| $10,000 to $24,999 | 11 (12.2%) | 0 (0.0%) |
| $25,000 to $34,999 | 5 (5.6%) | 0 (0.0%) |
| $35,000 to $49,999 | 11 (12.2%) | 15 (11.5%) |
| $50,000 to $74,999 | 29 (32.2%) | 14 (10.8%) |
| $75,000 to $99,999 | 23 (25.6%) | 60 (46.2%) |
| $100,000 to $149,999 | 3 (3.3%) | 14 (10.8%) |
| $150,000 or more | 2 (2.2%) | 20 (15.4%) |
| Total | 90 (100.0%) | 130 (100.0%) |
Property Value to Household Income Ratio in Rimersburg borough
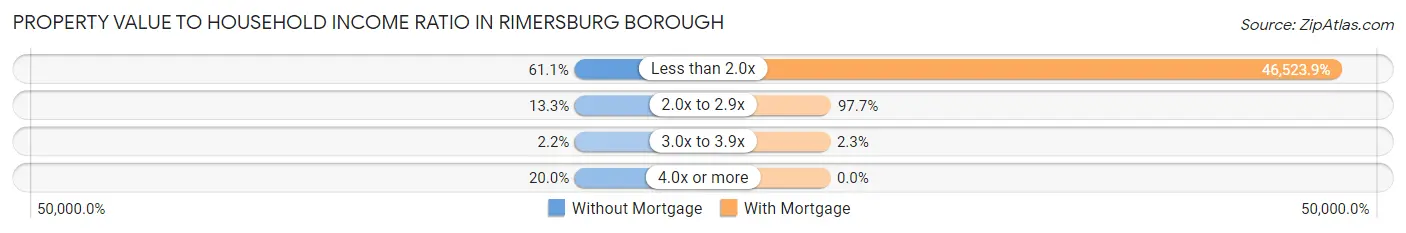
| Value-to-Income Ratio | Without Mortgage | With Mortgage |
| Less than 2.0x | 55 (61.1%) | 60,481 (46,523.8%) |
| 2.0x to 2.9x | 12 (13.3%) | 127 (97.7%) |
| 3.0x to 3.9x | 2 (2.2%) | 3 (2.3%) |
| 4.0x or more | 18 (20.0%) | 0 (0.0%) |
| Total | 90 (100.0%) | 130 (100.0%) |
Real Estate Taxes by Mortgage Status in Rimersburg borough
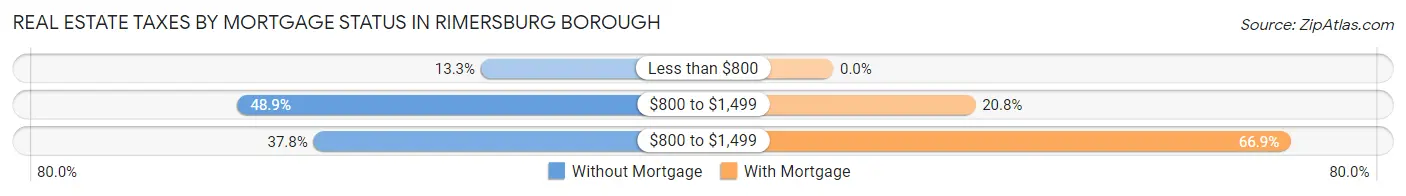
| Property Taxes | Without Mortgage | With Mortgage |
| Less than $800 | 12 (13.3%) | 0 (0.0%) |
| $800 to $1,499 | 44 (48.9%) | 27 (20.8%) |
| $800 to $1,499 | 34 (37.8%) | 87 (66.9%) |
| Total | 90 (100.0%) | 130 (100.0%) |
Health & Disability in Rimersburg borough
Health Insurance Coverage by Age in Rimersburg borough
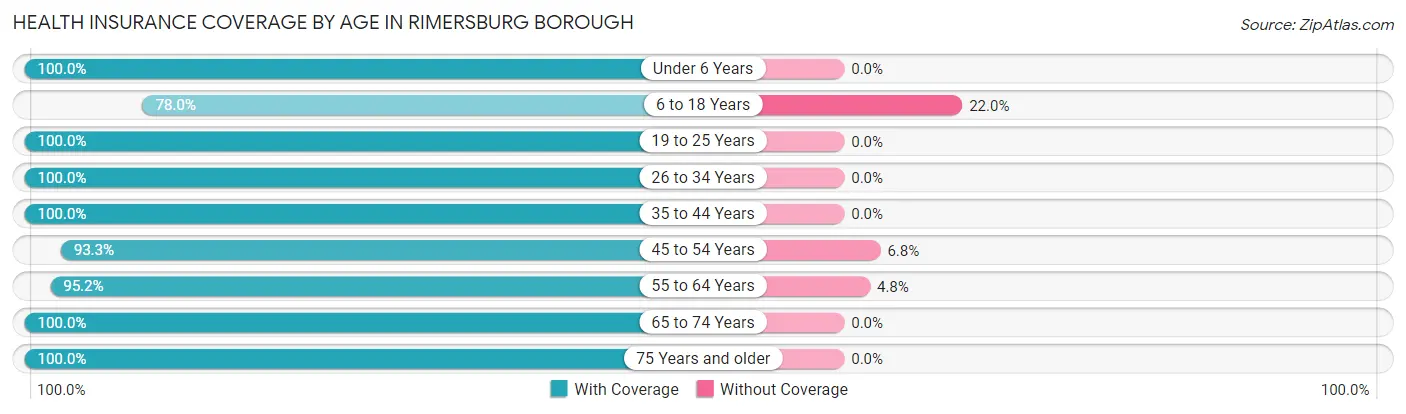
| Age Bracket | With Coverage | Without Coverage |
| Under 6 Years | 82 (100.0%) | 0 (0.0%) |
| 6 to 18 Years | 149 (78.0%) | 42 (22.0%) |
| 19 to 25 Years | 95 (100.0%) | 0 (0.0%) |
| 26 to 34 Years | 125 (100.0%) | 0 (0.0%) |
| 35 to 44 Years | 77 (100.0%) | 0 (0.0%) |
| 45 to 54 Years | 152 (93.2%) | 11 (6.8%) |
| 55 to 64 Years | 119 (95.2%) | 6 (4.8%) |
| 65 to 74 Years | 139 (100.0%) | 0 (0.0%) |
| 75 Years and older | 81 (100.0%) | 0 (0.0%) |
| Total | 1,019 (94.5%) | 59 (5.5%) |
Health Insurance Coverage by Citizenship Status in Rimersburg borough
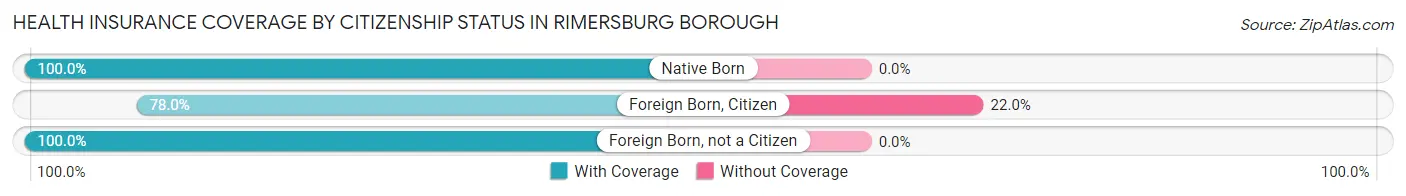
| Citizenship Status | With Coverage | Without Coverage |
| Native Born | 82 (100.0%) | 0 (0.0%) |
| Foreign Born, Citizen | 149 (78.0%) | 42 (22.0%) |
| Foreign Born, not a Citizen | 95 (100.0%) | 0 (0.0%) |
Health Insurance Coverage by Household Income in Rimersburg borough
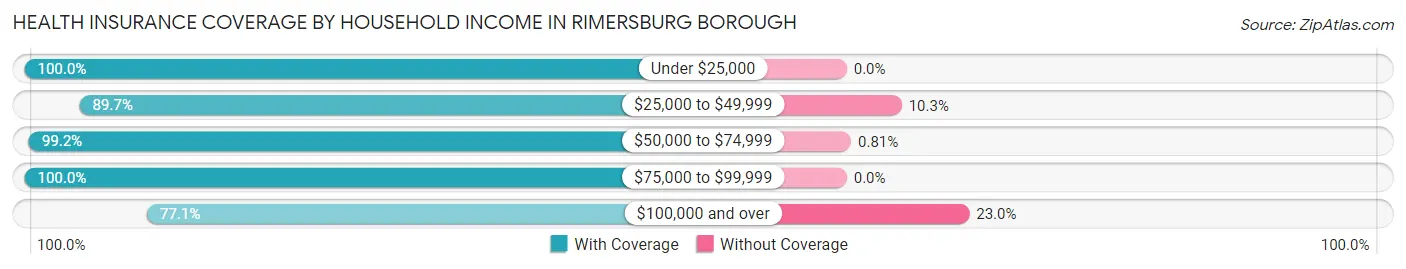
| Household Income | With Coverage | Without Coverage |
| Under $25,000 | 295 (100.0%) | 0 (0.0%) |
| $25,000 to $49,999 | 122 (89.7%) | 14 (10.3%) |
| $50,000 to $74,999 | 367 (99.2%) | 3 (0.8%) |
| $75,000 to $99,999 | 94 (100.0%) | 0 (0.0%) |
| $100,000 and over | 141 (77.0%) | 42 (23.0%) |
Public vs Private Health Insurance Coverage by Age in Rimersburg borough
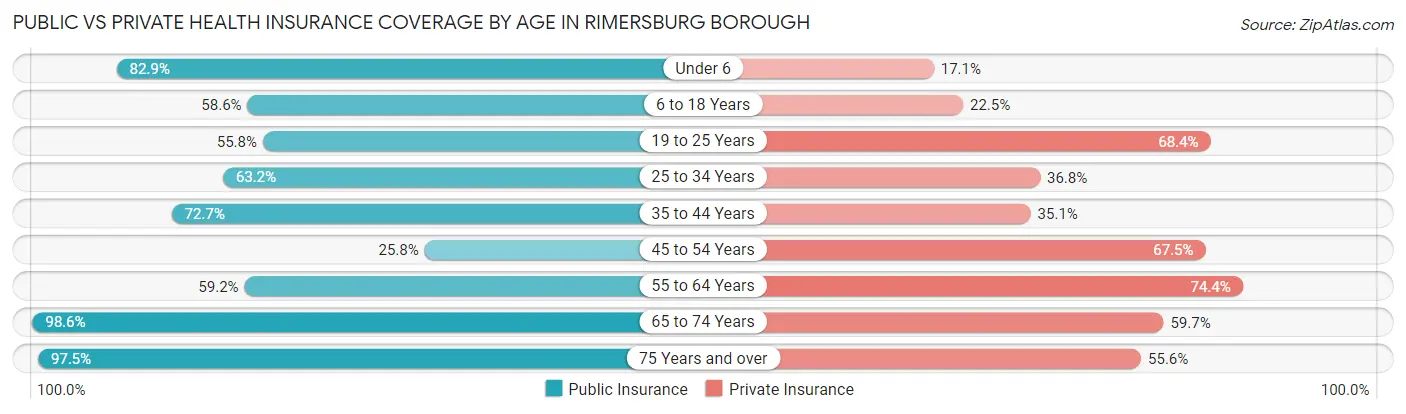
| Age Bracket | Public Insurance | Private Insurance |
| Under 6 | 68 (82.9%) | 14 (17.1%) |
| 6 to 18 Years | 112 (58.6%) | 43 (22.5%) |
| 19 to 25 Years | 53 (55.8%) | 65 (68.4%) |
| 25 to 34 Years | 79 (63.2%) | 46 (36.8%) |
| 35 to 44 Years | 56 (72.7%) | 27 (35.1%) |
| 45 to 54 Years | 42 (25.8%) | 110 (67.5%) |
| 55 to 64 Years | 74 (59.2%) | 93 (74.4%) |
| 65 to 74 Years | 137 (98.6%) | 83 (59.7%) |
| 75 Years and over | 79 (97.5%) | 45 (55.6%) |
| Total | 700 (64.9%) | 526 (48.8%) |
Disability Status by Sex by Age in Rimersburg borough
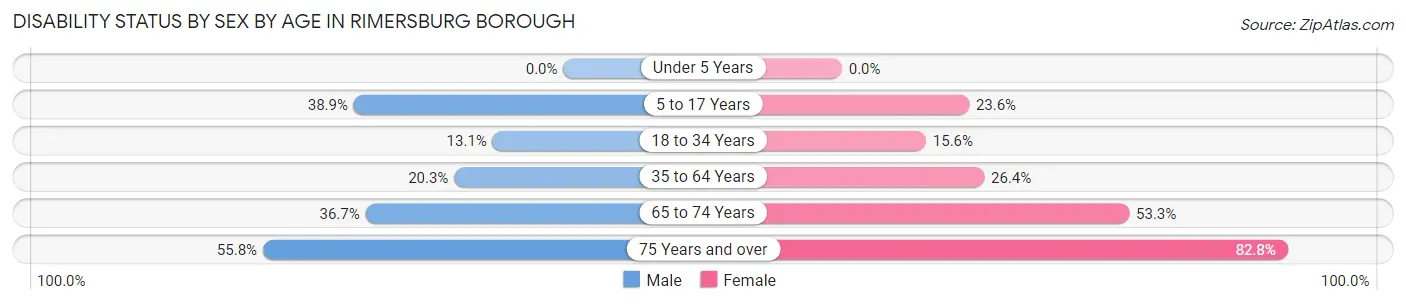
| Age Bracket | Male | Female |
| Under 5 Years | 0 (0.0%) | 0 (0.0%) |
| 5 to 17 Years | 28 (38.9%) | 21 (23.6%) |
| 18 to 34 Years | 21 (13.1%) | 17 (15.6%) |
| 35 to 64 Years | 31 (20.3%) | 56 (26.4%) |
| 65 to 74 Years | 29 (36.7%) | 32 (53.3%) |
| 75 Years and over | 29 (55.8%) | 24 (82.8%) |
Disability Class by Sex by Age in Rimersburg borough
Disability Class: Hearing Difficulty
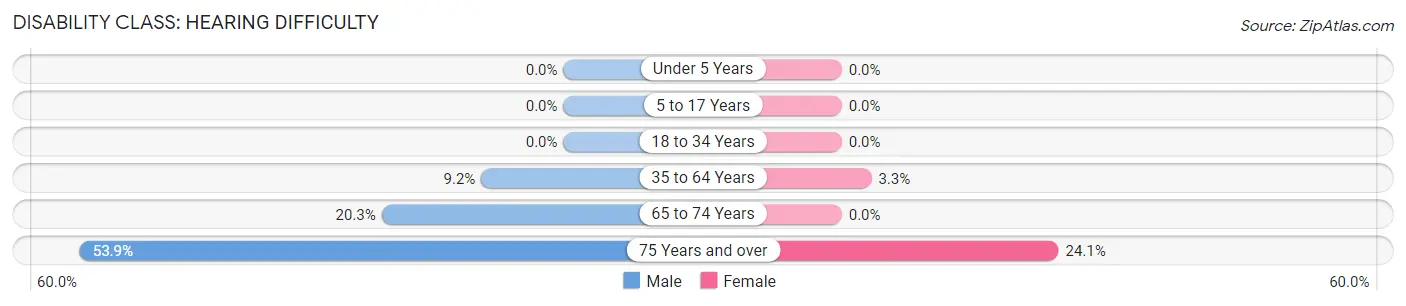
| Age Bracket | Male | Female |
| Under 5 Years | 0 (0.0%) | 0 (0.0%) |
| 5 to 17 Years | 0 (0.0%) | 0 (0.0%) |
| 18 to 34 Years | 0 (0.0%) | 0 (0.0%) |
| 35 to 64 Years | 14 (9.1%) | 7 (3.3%) |
| 65 to 74 Years | 16 (20.3%) | 0 (0.0%) |
| 75 Years and over | 28 (53.8%) | 7 (24.1%) |
Disability Class: Vision Difficulty
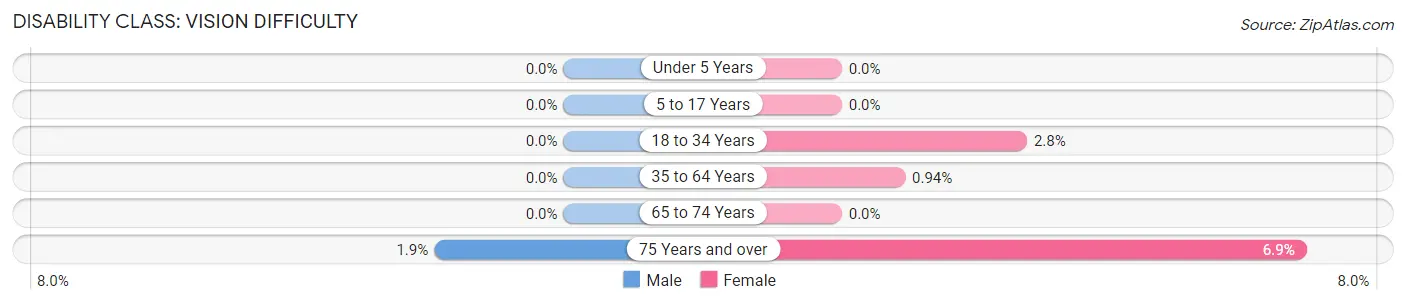
| Age Bracket | Male | Female |
| Under 5 Years | 0 (0.0%) | 0 (0.0%) |
| 5 to 17 Years | 0 (0.0%) | 0 (0.0%) |
| 18 to 34 Years | 0 (0.0%) | 3 (2.8%) |
| 35 to 64 Years | 0 (0.0%) | 2 (0.9%) |
| 65 to 74 Years | 0 (0.0%) | 0 (0.0%) |
| 75 Years and over | 1 (1.9%) | 2 (6.9%) |
Disability Class: Cognitive Difficulty
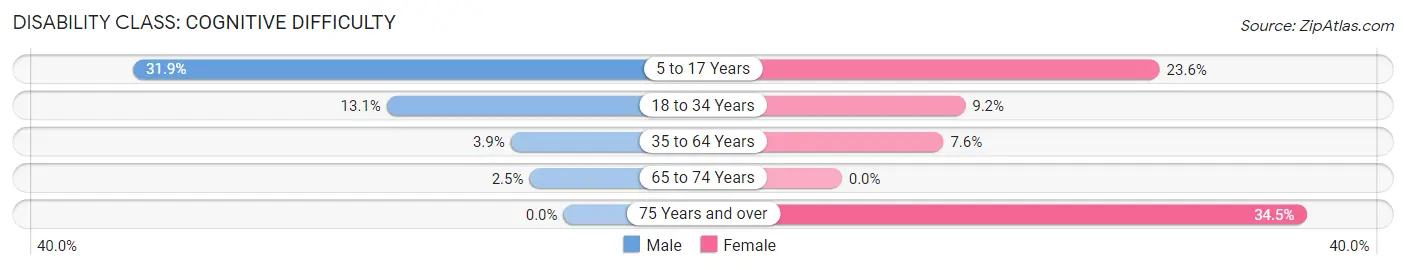
| Age Bracket | Male | Female |
| 5 to 17 Years | 23 (31.9%) | 21 (23.6%) |
| 18 to 34 Years | 21 (13.1%) | 10 (9.2%) |
| 35 to 64 Years | 6 (3.9%) | 16 (7.5%) |
| 65 to 74 Years | 2 (2.5%) | 0 (0.0%) |
| 75 Years and over | 0 (0.0%) | 10 (34.5%) |
Disability Class: Ambulatory Difficulty
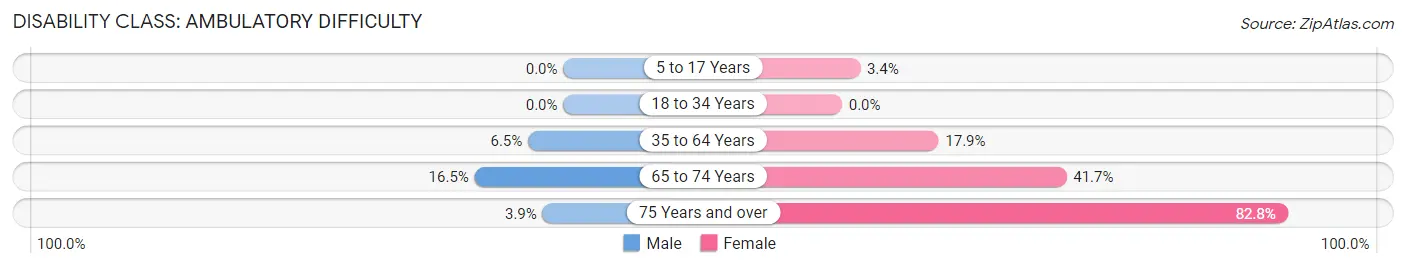
| Age Bracket | Male | Female |
| 5 to 17 Years | 0 (0.0%) | 3 (3.4%) |
| 18 to 34 Years | 0 (0.0%) | 0 (0.0%) |
| 35 to 64 Years | 10 (6.5%) | 38 (17.9%) |
| 65 to 74 Years | 13 (16.5%) | 25 (41.7%) |
| 75 Years and over | 2 (3.8%) | 24 (82.8%) |
Disability Class: Self-Care Difficulty
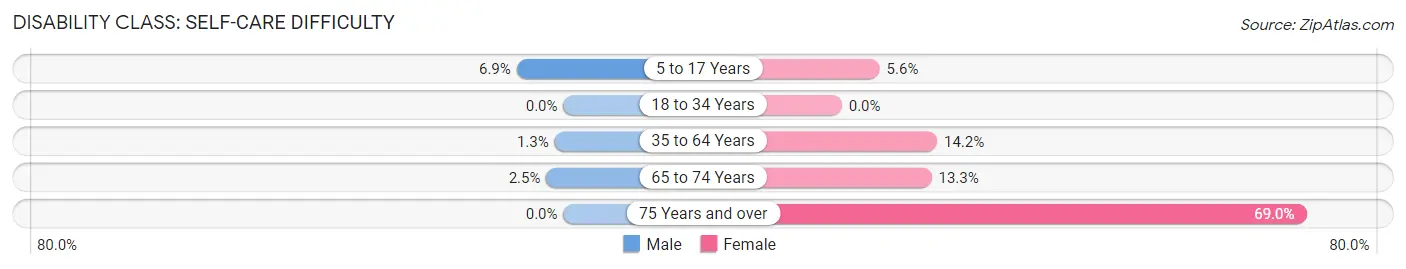
| Age Bracket | Male | Female |
| 5 to 17 Years | 5 (6.9%) | 5 (5.6%) |
| 18 to 34 Years | 0 (0.0%) | 0 (0.0%) |
| 35 to 64 Years | 2 (1.3%) | 30 (14.1%) |
| 65 to 74 Years | 2 (2.5%) | 8 (13.3%) |
| 75 Years and over | 0 (0.0%) | 20 (69.0%) |
Technology Access in Rimersburg borough
Computing Device Access in Rimersburg borough
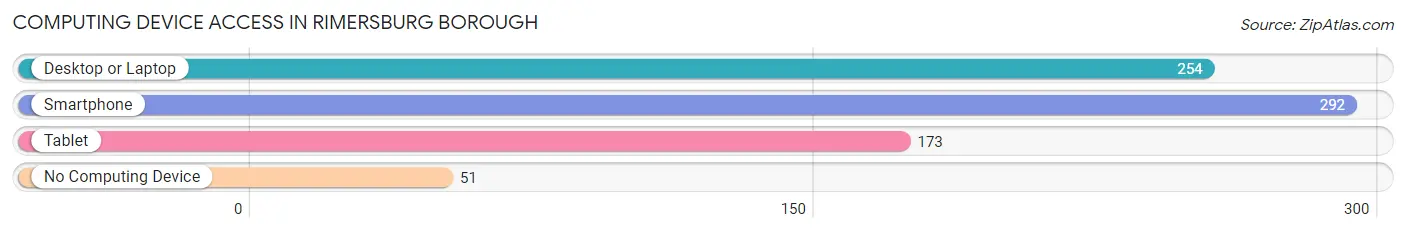
| Device Type | # Households | % Households |
| Desktop or Laptop | 254 | 63.2% |
| Smartphone | 292 | 72.6% |
| Tablet | 173 | 43.0% |
| No Computing Device | 51 | 12.7% |
| Total | 402 | 100.0% |
Internet Access in Rimersburg borough
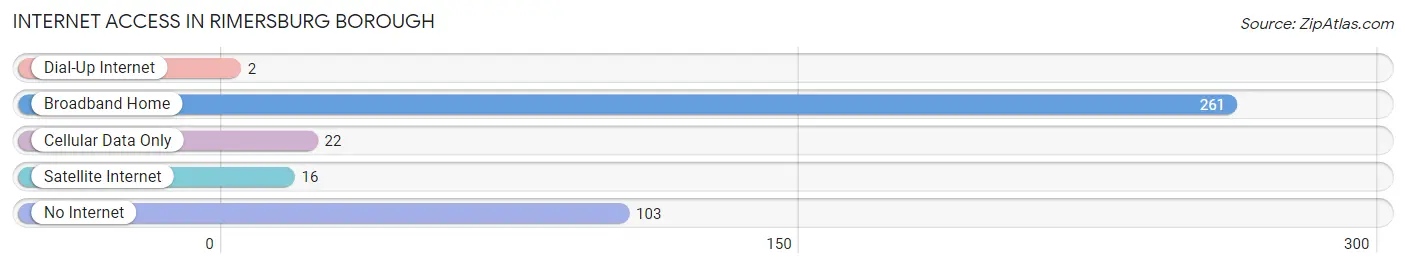
| Internet Type | # Households | % Households |
| Dial-Up Internet | 2 | 0.5% |
| Broadband Home | 261 | 64.9% |
| Cellular Data Only | 22 | 5.5% |
| Satellite Internet | 16 | 4.0% |
| No Internet | 103 | 25.6% |
| Total | 402 | 100.0% |
Rimersburg borough Summary
Rimersburg Borough is a small borough located in Clarion County, Pennsylvania. It is situated in the northwest corner of the county, approximately 25 miles east of the city of Pittsburgh. The borough is bordered by the townships of Perry, Madison, and Licking. As of the 2010 census, the population of Rimersburg was 1,093.
History
Rimersburg was founded in 1820 by John Rimer, a German immigrant who had settled in the area in 1817. The town was originally known as Rimer’sburg, but the name was changed to Rimersburg in 1825. The town was incorporated as a borough in 1872.
Rimersburg was an important stop on the Pittsburgh, Fort Wayne and Chicago Railway, which ran through the town from 1854 to 1964. The railway was a major factor in the growth of the town, as it allowed for the transportation of goods and people to and from the area.
Geography
Rimersburg is located at 41°14'N 79°25'W (41.2333, -79.4167). According to the United States Census Bureau, the borough has a total area of 0.7 square miles (1.8 km2), all of it land.
The borough is located in the Allegheny Plateau region of Pennsylvania. The terrain is generally flat, with some rolling hills. The Clarion River runs through the borough, and there are several small creeks and streams in the area.
Economy
Rimersburg’s economy is largely based on agriculture and light manufacturing. The borough is home to several small businesses, including a lumber mill, a furniture factory, and a dairy farm. There are also several small retail stores in the area.
Demographics
As of the 2010 census, there were 1,093 people, 441 households, and 298 families residing in the borough. The population density was 1,541.7 people per square mile (595.2/km2). There were 476 housing units at an average density of 676.3 per square mile (261.3/km2). The racial makeup of the borough was 98.7% White, 0.2% African American, 0.2% Native American, 0.2% Asian, and 0.7% from two or more races.
The median income for a household in the borough was $35,000, and the median income for a family was $41,250. Males had a median income of $30,000 versus $21,250 for females. The per capita income for the borough was $17,845. About 8.3% of families and 10.2% of the population were below the poverty line, including 14.3% of those under age 18 and 8.3% of those age 65 or over.
Common Questions
What is Per Capita Income in Rimersburg borough?
Per Capita income in Rimersburg borough is $18,668.
What is the Median Family Income in Rimersburg borough?
Median Family Income in Rimersburg borough is $54,318.
What is the Median Household income in Rimersburg borough?
Median Household Income in Rimersburg borough is $46,964.
What is Income or Wage Gap in Rimersburg borough?
Income or Wage Gap in Rimersburg borough is 18.9%.
Women in Rimersburg borough earn 81.1 cents for every dollar earned by a man.
What is Inequality or Gini Index in Rimersburg borough?
Inequality or Gini Index in Rimersburg borough is 0.40.
What is the Total Population of Rimersburg borough?
Total Population of Rimersburg borough is 1,078.
What is the Total Male Population of Rimersburg borough?
Total Male Population of Rimersburg borough is 568.
What is the Total Female Population of Rimersburg borough?
Total Female Population of Rimersburg borough is 510.
What is the Ratio of Males per 100 Females in Rimersburg borough?
There are 111.37 Males per 100 Females in Rimersburg borough.
What is the Ratio of Females per 100 Males in Rimersburg borough?
There are 89.79 Females per 100 Males in Rimersburg borough.
What is the Median Population Age in Rimersburg borough?
Median Population Age in Rimersburg borough is 40.3 Years.
What is the Average Family Size in Rimersburg borough
Average Family Size in Rimersburg borough is 3.4 People.
What is the Average Household Size in Rimersburg borough
Average Household Size in Rimersburg borough is 2.7 People.
How Large is the Labor Force in Rimersburg borough?
There are 411 People in the Labor Forcein in Rimersburg borough.
What is the Percentage of People in the Labor Force in Rimersburg borough?
47.3% of People are in the Labor Force in Rimersburg borough.