South Bethlehem borough, PA Map & Demographics
South Bethlehem borough Overview
$28,955
PER CAPITA INCOME
$76,094
AVG FAMILY INCOME
$40,313
AVG HOUSEHOLD INCOME
29.5%
WAGE / INCOME GAP [ % ]
70.5¢/ $1
WAGE / INCOME GAP [ $ ]
$6,922
FAMILY INCOME DEFICIT
0.43
INEQUALITY / GINI INDEX
379
TOTAL POPULATION
176
MALE POPULATION
203
FEMALE POPULATION
86.70
MALES / 100 FEMALES
115.34
FEMALES / 100 MALES
50.0
MEDIAN AGE
2.9
AVG FAMILY SIZE
2.0
AVG HOUSEHOLD SIZE
187
LABOR FORCE [ PEOPLE ]
57.7%
PERCENT IN LABOR FORCE
1.6%
UNEMPLOYMENT RATE
Income in South Bethlehem borough
Income Overview in South Bethlehem borough
Per Capita Income in South Bethlehem borough is $28,955, while median incomes of families and households are $76,094 and $40,313 respectively.
| Characteristic | Number | Measure |
| Per Capita Income | 379 | $28,955 |
| Median Family Income | 86 | $76,094 |
| Mean Family Income | 86 | $77,670 |
| Median Household Income | 189 | $40,313 |
| Mean Household Income | 189 | $58,625 |
| Income Deficit | 86 | $6,922 |
| Wage / Income Gap (%) | 379 | 29.53% |
| Wage / Income Gap ($) | 379 | 70.47¢ per $1 |
| Gini / Inequality Index | 379 | 0.43 |
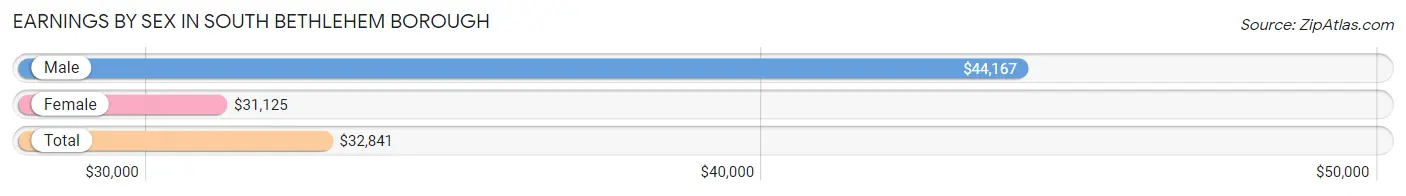
Earnings by Sex in South Bethlehem borough
Average Earnings in South Bethlehem borough are $32,841, $44,167 for men and $31,125 for women, a difference of 29.5%.
| Sex | Number | Average Earnings |
| Male | 114 (58.5%) | $44,167 |
| Female | 81 (41.5%) | $31,125 |
| Total | 195 (100.0%) | $32,841 |
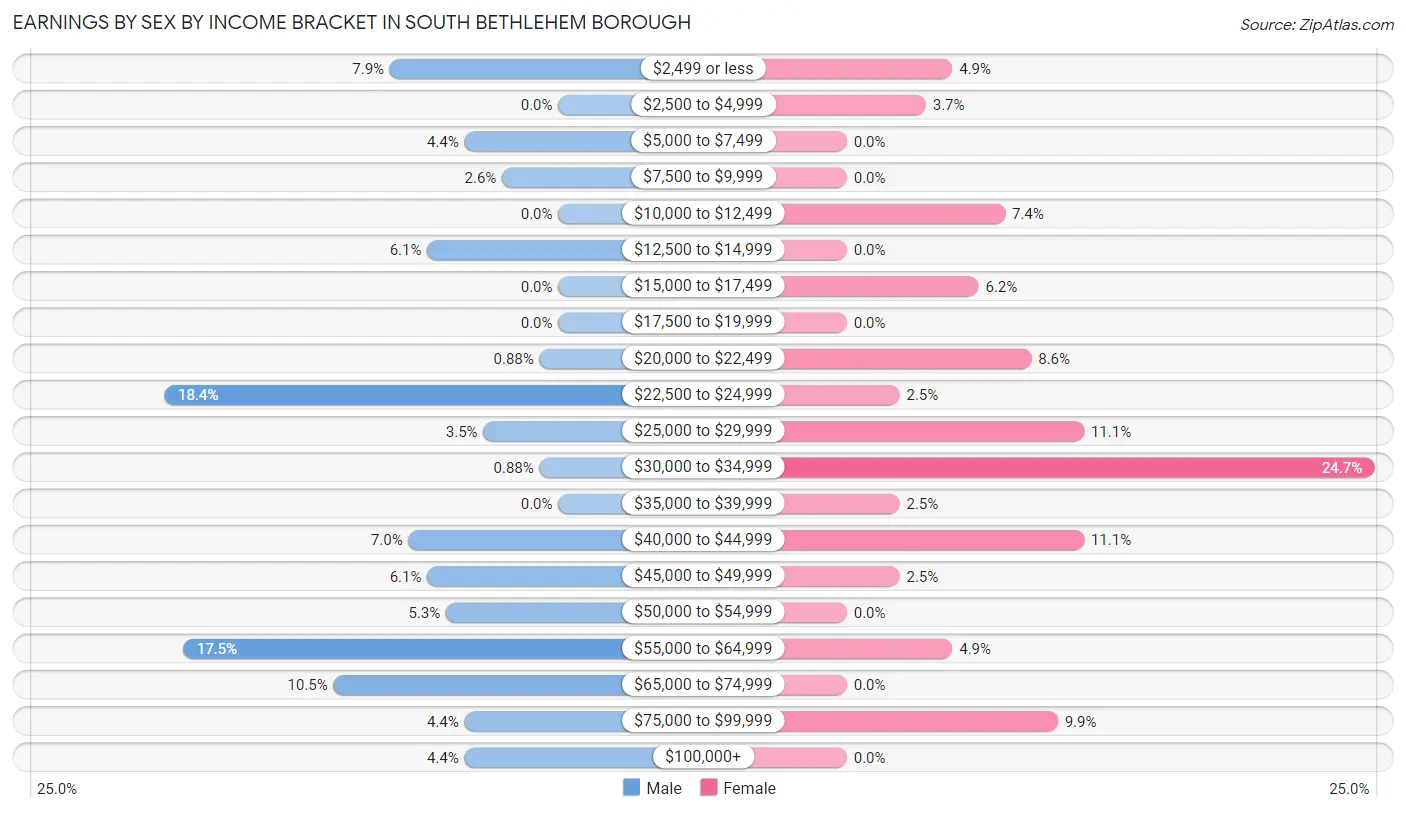
Earnings by Sex by Income Bracket in South Bethlehem borough
The most common earnings brackets in South Bethlehem borough are $22,500 to $24,999 for men (21 | 18.4%) and $30,000 to $34,999 for women (20 | 24.7%).
| Income | Male | Female |
| $2,499 or less | 9 (7.9%) | 4 (4.9%) |
| $2,500 to $4,999 | 0 (0.0%) | 3 (3.7%) |
| $5,000 to $7,499 | 5 (4.4%) | 0 (0.0%) |
| $7,500 to $9,999 | 3 (2.6%) | 0 (0.0%) |
| $10,000 to $12,499 | 0 (0.0%) | 6 (7.4%) |
| $12,500 to $14,999 | 7 (6.1%) | 0 (0.0%) |
| $15,000 to $17,499 | 0 (0.0%) | 5 (6.2%) |
| $17,500 to $19,999 | 0 (0.0%) | 0 (0.0%) |
| $20,000 to $22,499 | 1 (0.9%) | 7 (8.6%) |
| $22,500 to $24,999 | 21 (18.4%) | 2 (2.5%) |
| $25,000 to $29,999 | 4 (3.5%) | 9 (11.1%) |
| $30,000 to $34,999 | 1 (0.9%) | 20 (24.7%) |
| $35,000 to $39,999 | 0 (0.0%) | 2 (2.5%) |
| $40,000 to $44,999 | 8 (7.0%) | 9 (11.1%) |
| $45,000 to $49,999 | 7 (6.1%) | 2 (2.5%) |
| $50,000 to $54,999 | 6 (5.3%) | 0 (0.0%) |
| $55,000 to $64,999 | 20 (17.5%) | 4 (4.9%) |
| $65,000 to $74,999 | 12 (10.5%) | 0 (0.0%) |
| $75,000 to $99,999 | 5 (4.4%) | 8 (9.9%) |
| $100,000+ | 5 (4.4%) | 0 (0.0%) |
| Total | 114 (100.0%) | 81 (100.0%) |
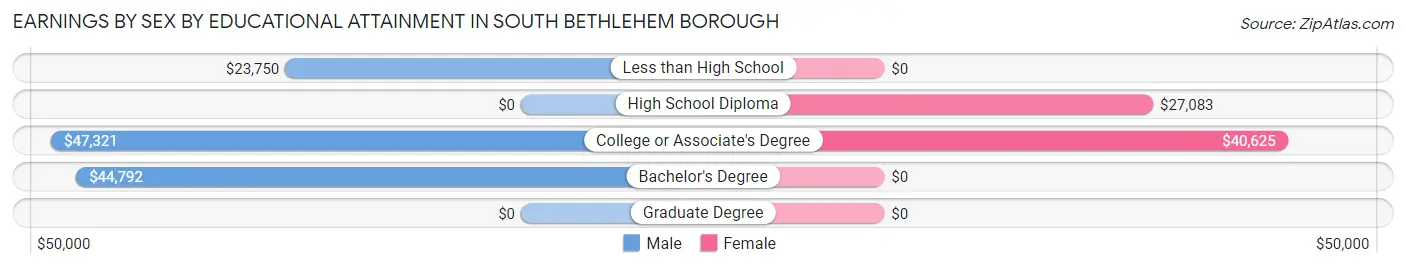
Earnings by Sex by Educational Attainment in South Bethlehem borough
Average earnings in South Bethlehem borough are $46,071 for men and $32,375 for women, a difference of 29.7%. Men with an educational attainment of college or associate's degree enjoy the highest average annual earnings of $47,321, while those with less than high school education earn the least with $23,750. Women with an educational attainment of college or associate's degree earn the most with the average annual earnings of $40,625, while those with high school diploma education have the smallest earnings of $27,083.
| Educational Attainment | Male Income | Female Income |
| Less than High School | $23,750 | $0 |
| High School Diploma | - | - |
| College or Associate's Degree | $47,321 | $40,625 |
| Bachelor's Degree | $44,792 | $0 |
| Graduate Degree | - | - |
| Total | $46,071 | $32,375 |
Family Income in South Bethlehem borough
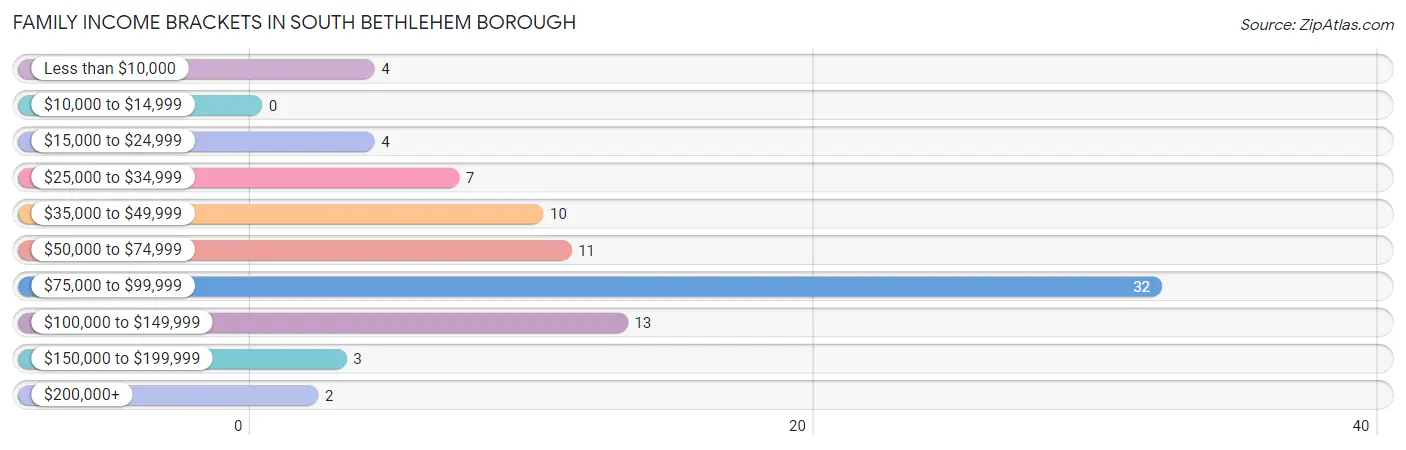
Family Income Brackets in South Bethlehem borough
According to the South Bethlehem borough family income data, there are 32 families falling into the $75,000 to $99,999 income range, which is the most common income bracket and makes up 37.2% of all families.
| Income Bracket | # Families | % Families |
| Less than $10,000 | 4 | 4.7% |
| $10,000 to $14,999 | 0 | 0.0% |
| $15,000 to $24,999 | 4 | 4.7% |
| $25,000 to $34,999 | 7 | 8.1% |
| $35,000 to $49,999 | 10 | 11.6% |
| $50,000 to $74,999 | 11 | 12.8% |
| $75,000 to $99,999 | 32 | 37.2% |
| $100,000 to $149,999 | 13 | 15.1% |
| $150,000 to $199,999 | 3 | 3.5% |
| $200,000+ | 2 | 2.3% |
Family Income by Famaliy Size in South Bethlehem borough
4-person families (8 | 9.3%) account for the highest median family income in South Bethlehem borough with $83,750 per family, while 2-person families (48 | 55.8%) have the highest median income of $37,981 per family member.
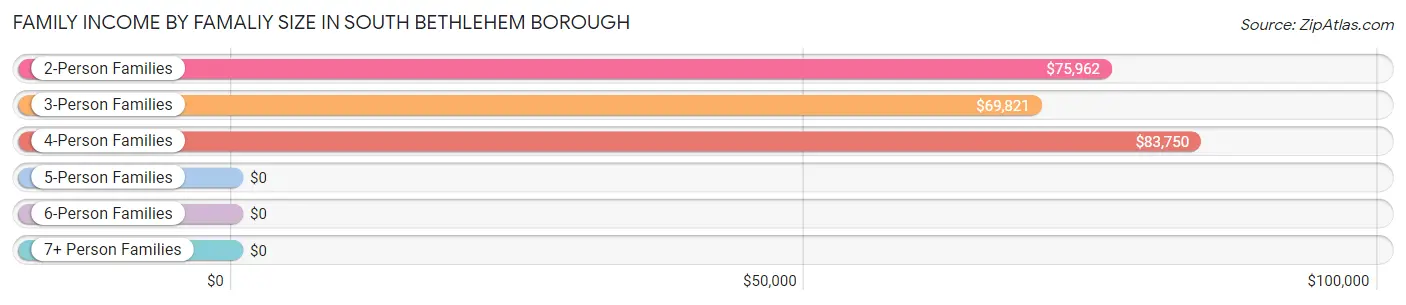
| Income Bracket | # Families | Median Income |
| 2-Person Families | 48 (55.8%) | $75,962 |
| 3-Person Families | 21 (24.4%) | $69,821 |
| 4-Person Families | 8 (9.3%) | $83,750 |
| 5-Person Families | 6 (7.0%) | $0 |
| 6-Person Families | 3 (3.5%) | $0 |
| 7+ Person Families | 0 (0.0%) | $0 |
| Total | 86 (100.0%) | $76,094 |
Family Income by Number of Earners in South Bethlehem borough
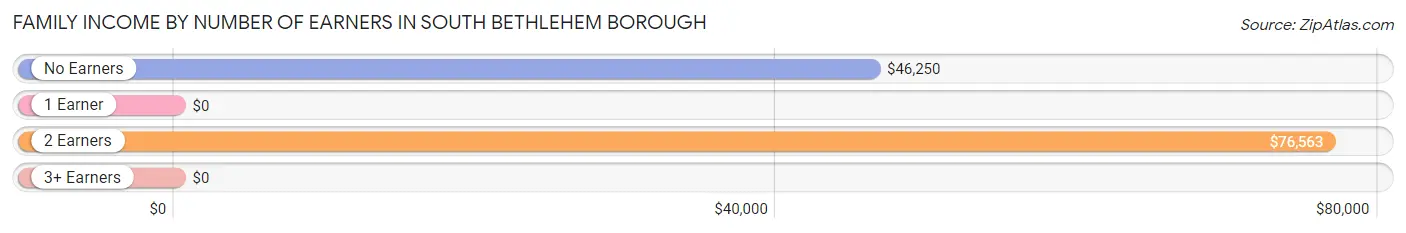
| Number of Earners | # Families | Median Income |
| No Earners | 18 (20.9%) | $46,250 |
| 1 Earner | 19 (22.1%) | $0 |
| 2 Earners | 46 (53.5%) | $76,563 |
| 3+ Earners | 3 (3.5%) | $0 |
| Total | 86 (100.0%) | $76,094 |
Household Income in South Bethlehem borough
Household Income Brackets in South Bethlehem borough
With 34 households falling in the category, the $15,000 to $24,999 income range is the most frequent in South Bethlehem borough, accounting for 18.0% of all households. In contrast, only 2 households (1.1%) fall into the $200,000+ income bracket, making it the least populous group.
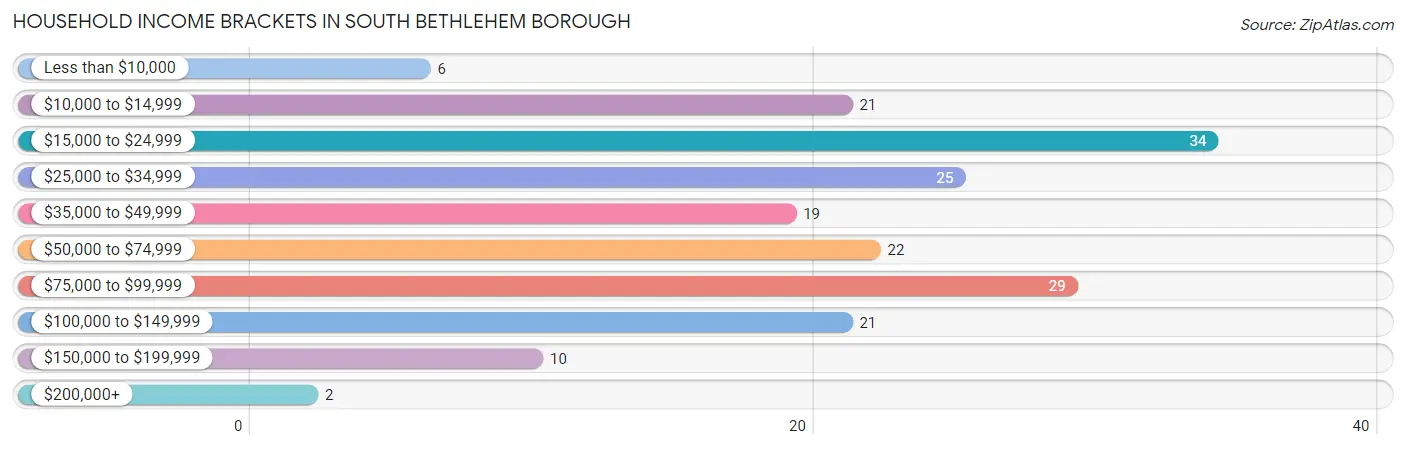
| Income Bracket | # Households | % Households |
| Less than $10,000 | 6 | 3.2% |
| $10,000 to $14,999 | 21 | 11.1% |
| $15,000 to $24,999 | 34 | 18.0% |
| $25,000 to $34,999 | 25 | 13.2% |
| $35,000 to $49,999 | 19 | 10.1% |
| $50,000 to $74,999 | 22 | 11.6% |
| $75,000 to $99,999 | 29 | 15.3% |
| $100,000 to $149,999 | 21 | 11.1% |
| $150,000 to $199,999 | 10 | 5.3% |
| $200,000+ | 2 | 1.1% |
Household Income by Householder Age in South Bethlehem borough
The median household income in South Bethlehem borough is $40,313, with the highest median household income of $64,583 found in the 45 to 64 years age bracket for the primary householder. A total of 91 households (48.1%) fall into this category. Meanwhile, the 15 to 24 years age bracket for the primary householder has the lowest median household income of $0, with 4 households (2.1%) in this group.
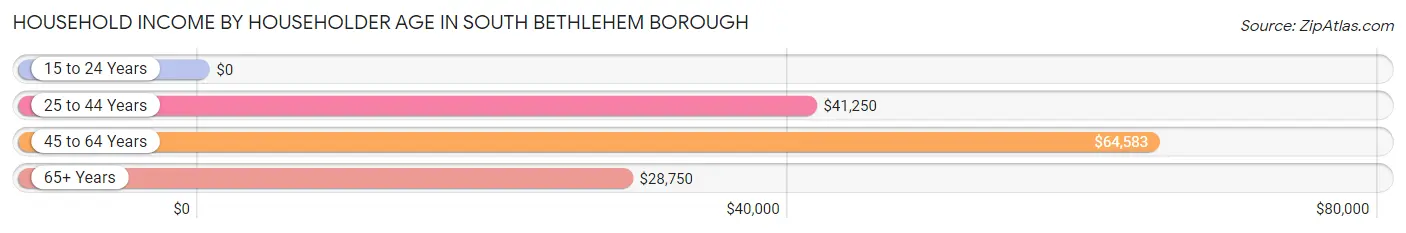
| Income Bracket | # Households | Median Income |
| 15 to 24 Years | 4 (2.1%) | $0 |
| 25 to 44 Years | 38 (20.1%) | $41,250 |
| 45 to 64 Years | 91 (48.1%) | $64,583 |
| 65+ Years | 56 (29.6%) | $28,750 |
| Total | 189 (100.0%) | $40,313 |
Poverty in South Bethlehem borough
Income Below Poverty by Sex and Age in South Bethlehem borough
With 16.7% poverty level for males and 14.3% for females among the residents of South Bethlehem borough, 15 year old males and 55 to 64 year old females are the most vulnerable to poverty, with 4 males (100.0%) and 18 females (51.4%) in their respective age groups living below the poverty level.
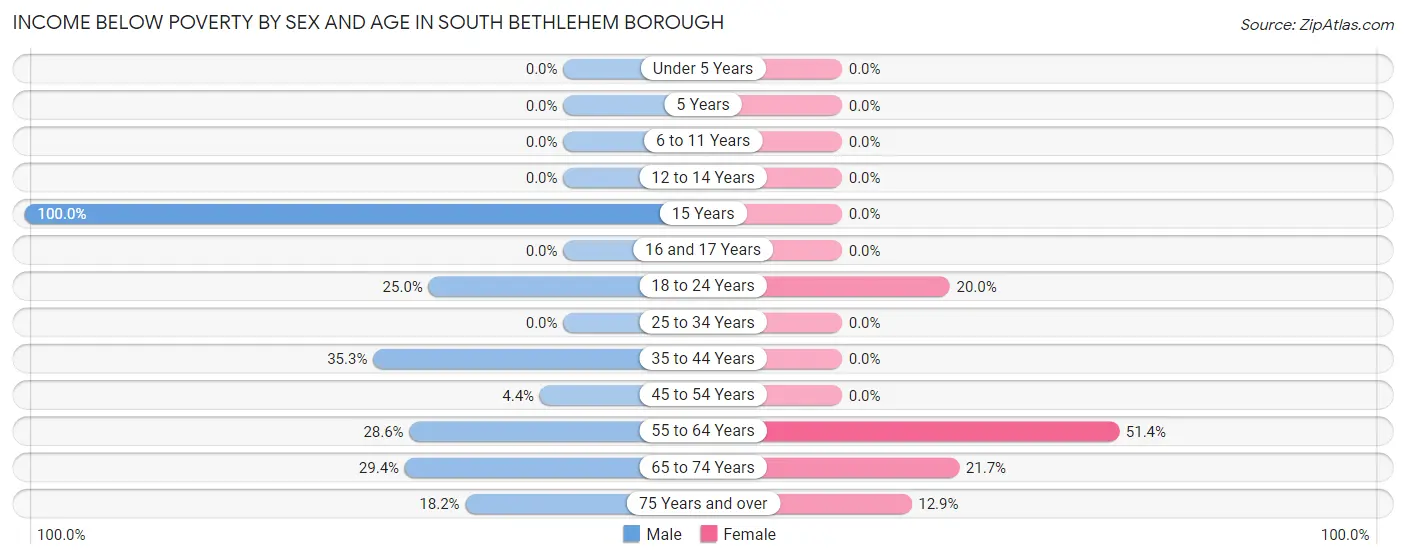
| Age Bracket | Male | Female |
| Under 5 Years | 0 (0.0%) | 0 (0.0%) |
| 5 Years | 0 (0.0%) | 0 (0.0%) |
| 6 to 11 Years | 0 (0.0%) | 0 (0.0%) |
| 12 to 14 Years | 0 (0.0%) | 0 (0.0%) |
| 15 Years | 4 (100.0%) | 0 (0.0%) |
| 16 and 17 Years | 0 (0.0%) | 0 (0.0%) |
| 18 to 24 Years | 2 (25.0%) | 2 (20.0%) |
| 25 to 34 Years | 0 (0.0%) | 0 (0.0%) |
| 35 to 44 Years | 6 (35.3%) | 0 (0.0%) |
| 45 to 54 Years | 2 (4.3%) | 0 (0.0%) |
| 55 to 64 Years | 8 (28.6%) | 18 (51.4%) |
| 65 to 74 Years | 5 (29.4%) | 5 (21.7%) |
| 75 Years and over | 2 (18.2%) | 4 (12.9%) |
| Total | 29 (16.7%) | 29 (14.3%) |
Income Above Poverty by Sex and Age in South Bethlehem borough
According to the poverty statistics in South Bethlehem borough, males aged under 5 years and females aged under 5 years are the age groups that are most secure financially, with 100.0% of males and 100.0% of females in these age groups living above the poverty line.
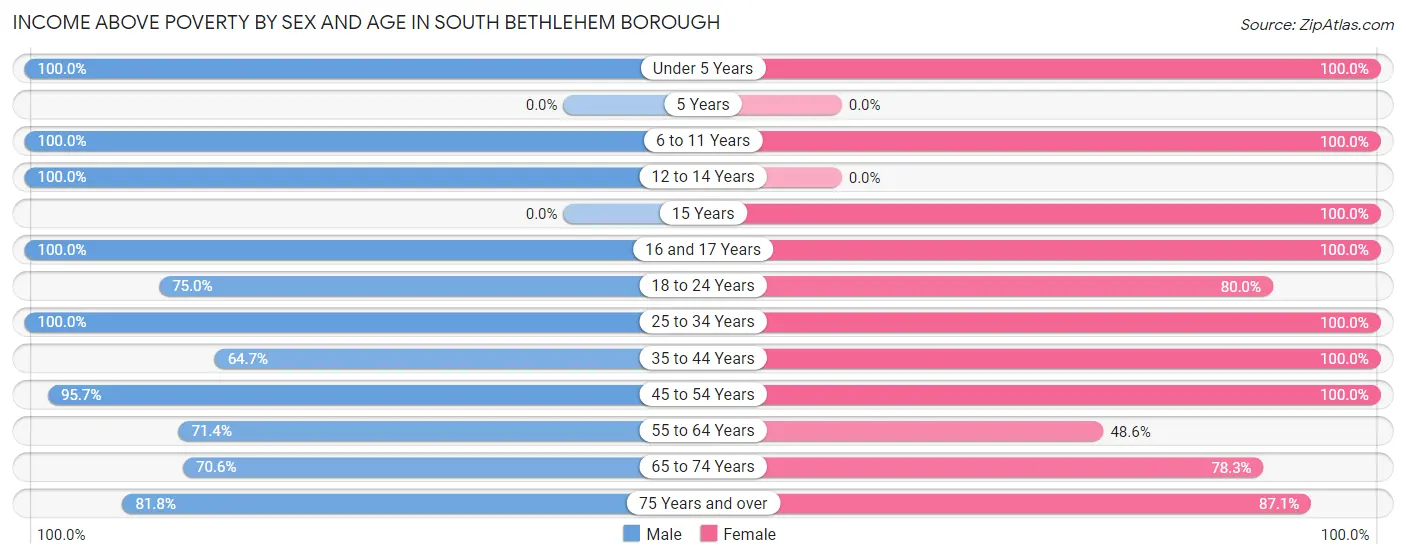
| Age Bracket | Male | Female |
| Under 5 Years | 11 (100.0%) | 8 (100.0%) |
| 5 Years | 0 (0.0%) | 0 (0.0%) |
| 6 to 11 Years | 5 (100.0%) | 21 (100.0%) |
| 12 to 14 Years | 2 (100.0%) | 0 (0.0%) |
| 15 Years | 0 (0.0%) | 2 (100.0%) |
| 16 and 17 Years | 2 (100.0%) | 6 (100.0%) |
| 18 to 24 Years | 6 (75.0%) | 8 (80.0%) |
| 25 to 34 Years | 23 (100.0%) | 17 (100.0%) |
| 35 to 44 Years | 11 (64.7%) | 13 (100.0%) |
| 45 to 54 Years | 44 (95.7%) | 37 (100.0%) |
| 55 to 64 Years | 20 (71.4%) | 17 (48.6%) |
| 65 to 74 Years | 12 (70.6%) | 18 (78.3%) |
| 75 Years and over | 9 (81.8%) | 27 (87.1%) |
| Total | 145 (83.3%) | 174 (85.7%) |
Income Below Poverty Among Married-Couple Families in South Bethlehem borough
The poverty statistics for married-couple families in South Bethlehem borough show that 13.4% or 9 of the total 67 families live below the poverty line. Families with no children have the highest poverty rate of 20.4%, comprising of 9 families. On the other hand, families with 1 or 2 children have the lowest poverty rate of 0.0%, which includes 0 families.
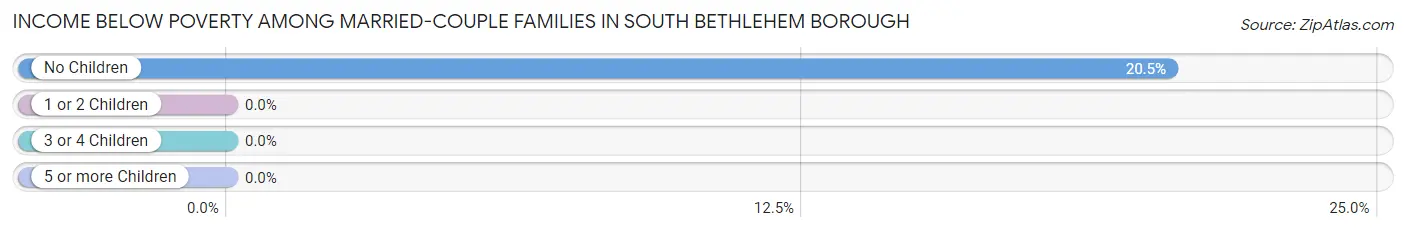
| Children | Above Poverty | Below Poverty |
| No Children | 35 (79.5%) | 9 (20.4%) |
| 1 or 2 Children | 18 (100.0%) | 0 (0.0%) |
| 3 or 4 Children | 5 (100.0%) | 0 (0.0%) |
| 5 or more Children | 0 (0.0%) | 0 (0.0%) |
| Total | 58 (86.6%) | 9 (13.4%) |
Income Below Poverty Among Single-Parent Households in South Bethlehem borough
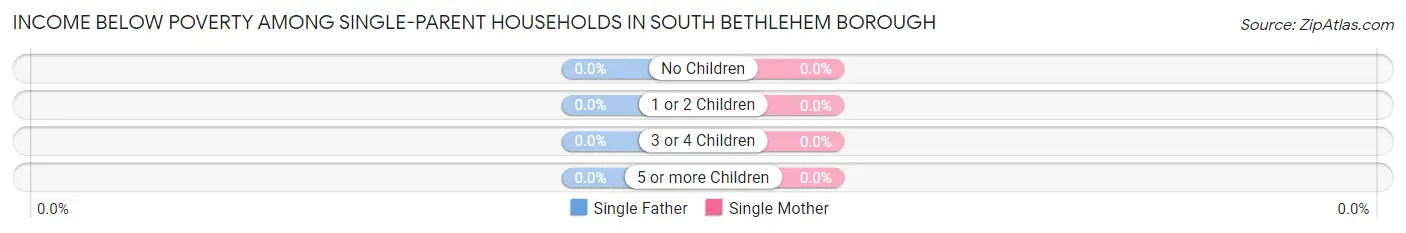
| Children | Single Father | Single Mother |
| No Children | 0 (0.0%) | 0 (0.0%) |
| 1 or 2 Children | 0 (0.0%) | 0 (0.0%) |
| 3 or 4 Children | 0 (0.0%) | 0 (0.0%) |
| 5 or more Children | 0 (0.0%) | 0 (0.0%) |
| Total | 0 (0.0%) | 0 (0.0%) |
Income Below Poverty Among Married-Couple vs Single-Parent Households in South Bethlehem borough
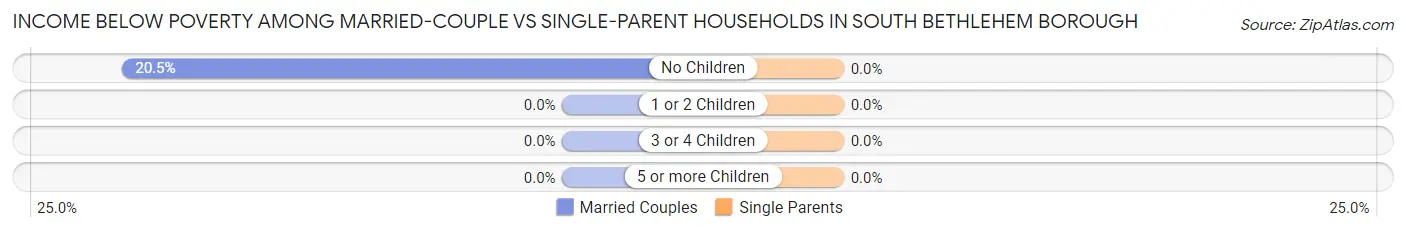
| Children | Married-Couple Families | Single-Parent Households |
| No Children | 9 (20.4%) | 0 (0.0%) |
| 1 or 2 Children | 0 (0.0%) | 0 (0.0%) |
| 3 or 4 Children | 0 (0.0%) | 0 (0.0%) |
| 5 or more Children | 0 (0.0%) | 0 (0.0%) |
| Total | 9 (13.4%) | 0 (0.0%) |
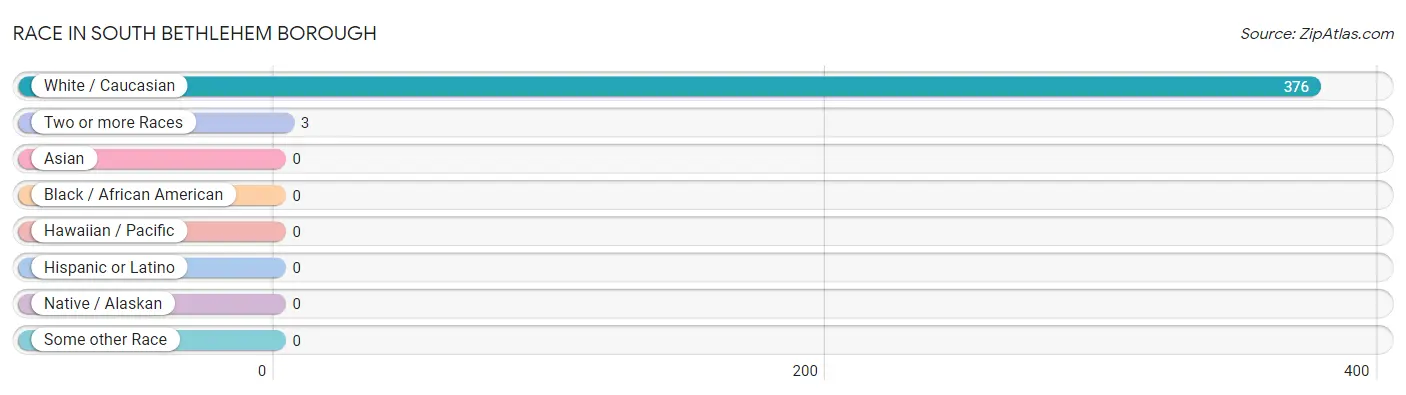
Race in South Bethlehem borough
The most populous races in South Bethlehem borough are White / Caucasian (376 | 99.2%), and Two or more Races (3 | 0.8%).
| Race | # Population | % Population |
| Asian | 0 | 0.0% |
| Black / African American | 0 | 0.0% |
| Hawaiian / Pacific | 0 | 0.0% |
| Hispanic or Latino | 0 | 0.0% |
| Native / Alaskan | 0 | 0.0% |
| White / Caucasian | 376 | 99.2% |
| Two or more Races | 3 | 0.8% |
| Some other Race | 0 | 0.0% |
| Total | 379 | 100.0% |
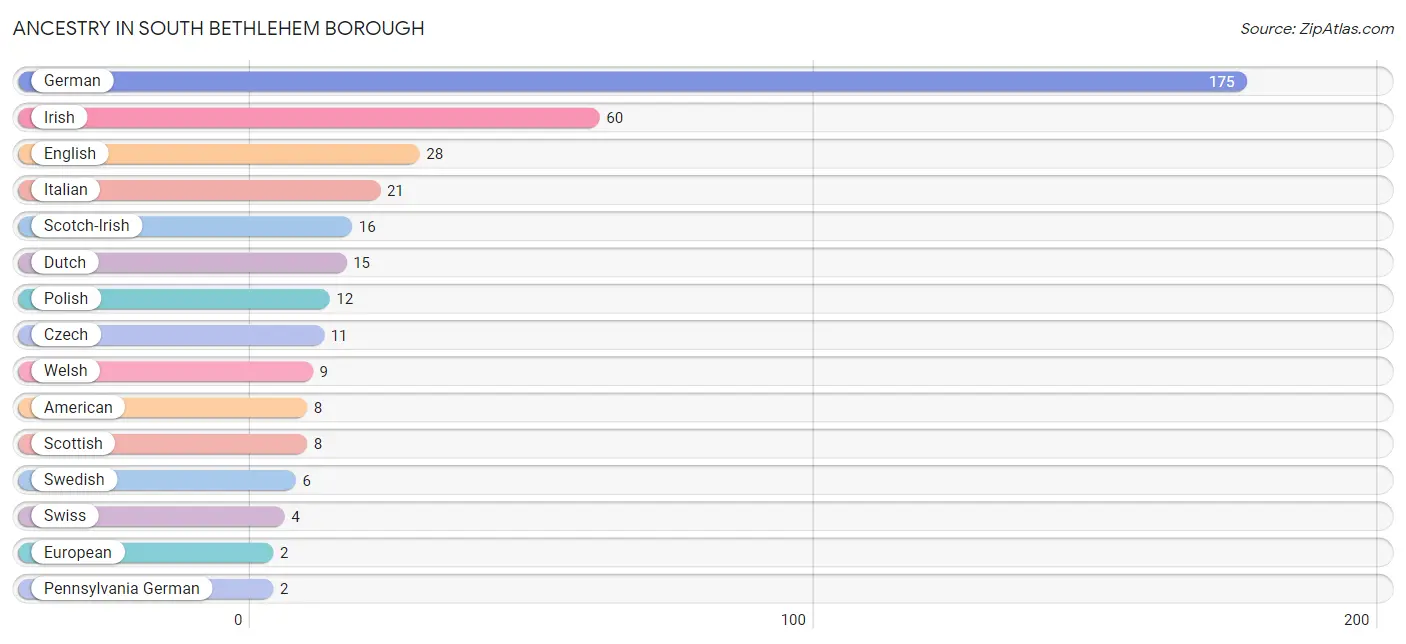
Ancestry in South Bethlehem borough
The most populous ancestries reported in South Bethlehem borough are German (175 | 46.2%), Irish (60 | 15.8%), English (28 | 7.4%), Italian (21 | 5.5%), and Scotch-Irish (16 | 4.2%), together accounting for 79.1% of all South Bethlehem borough residents.
| Ancestry | # Population | % Population |
| American | 8 | 2.1% |
| Czech | 11 | 2.9% |
| Dutch | 15 | 4.0% |
| English | 28 | 7.4% |
| European | 2 | 0.5% |
| German | 175 | 46.2% |
| Hungarian | 1 | 0.3% |
| Irish | 60 | 15.8% |
| Italian | 21 | 5.5% |
| Pennsylvania German | 2 | 0.5% |
| Polish | 12 | 3.2% |
| Scotch-Irish | 16 | 4.2% |
| Scottish | 8 | 2.1% |
| Swedish | 6 | 1.6% |
| Swiss | 4 | 1.1% |
| Welsh | 9 | 2.4% | View All 16 Rows |
Immigrants in South Bethlehem borough

| Immigration Origin | # Population | % Population | View All 0 Rows |
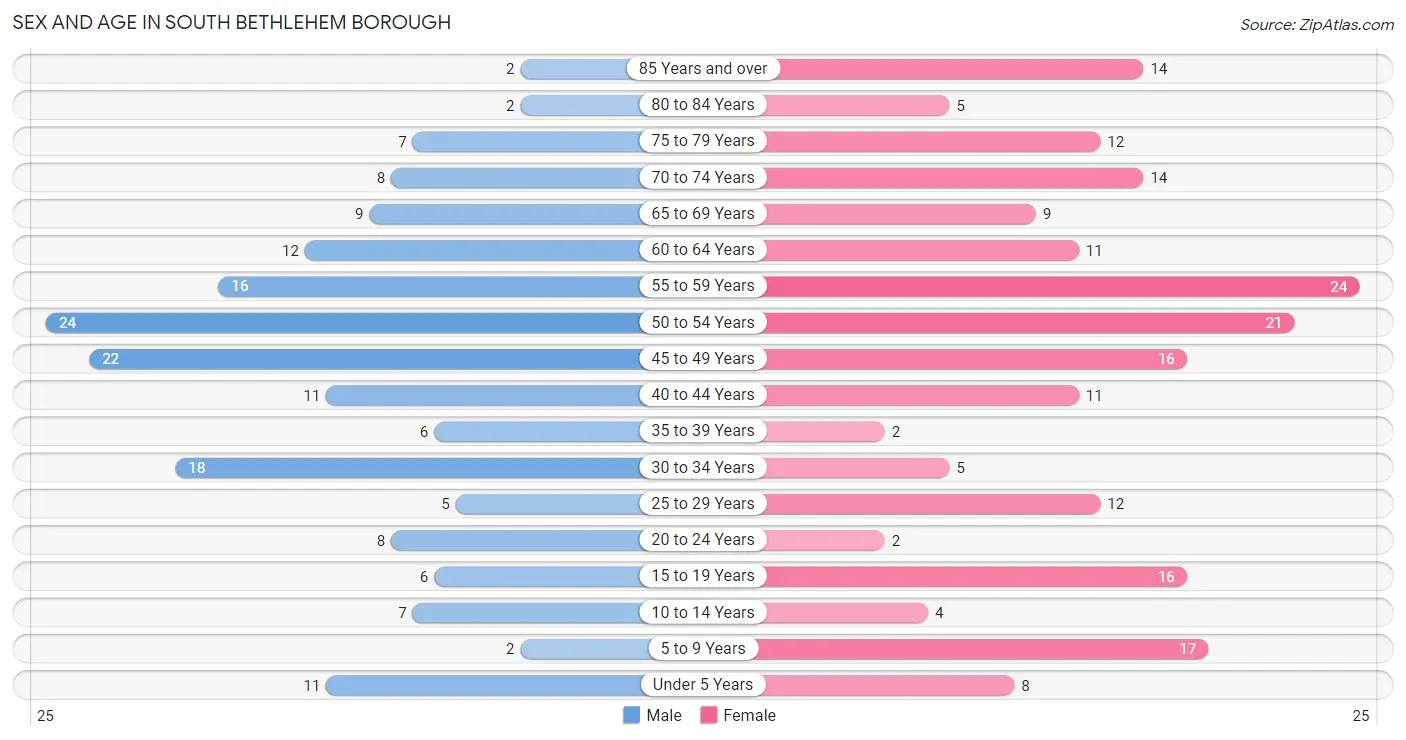
Sex and Age in South Bethlehem borough
Sex and Age in South Bethlehem borough
The most populous age groups in South Bethlehem borough are 50 to 54 Years (24 | 13.6%) for men and 55 to 59 Years (24 | 11.8%) for women.
| Age Bracket | Male | Female |
| Under 5 Years | 11 (6.2%) | 8 (3.9%) |
| 5 to 9 Years | 2 (1.1%) | 17 (8.4%) |
| 10 to 14 Years | 7 (4.0%) | 4 (2.0%) |
| 15 to 19 Years | 6 (3.4%) | 16 (7.9%) |
| 20 to 24 Years | 8 (4.5%) | 2 (1.0%) |
| 25 to 29 Years | 5 (2.8%) | 12 (5.9%) |
| 30 to 34 Years | 18 (10.2%) | 5 (2.5%) |
| 35 to 39 Years | 6 (3.4%) | 2 (1.0%) |
| 40 to 44 Years | 11 (6.2%) | 11 (5.4%) |
| 45 to 49 Years | 22 (12.5%) | 16 (7.9%) |
| 50 to 54 Years | 24 (13.6%) | 21 (10.3%) |
| 55 to 59 Years | 16 (9.1%) | 24 (11.8%) |
| 60 to 64 Years | 12 (6.8%) | 11 (5.4%) |
| 65 to 69 Years | 9 (5.1%) | 9 (4.4%) |
| 70 to 74 Years | 8 (4.5%) | 14 (6.9%) |
| 75 to 79 Years | 7 (4.0%) | 12 (5.9%) |
| 80 to 84 Years | 2 (1.1%) | 5 (2.5%) |
| 85 Years and over | 2 (1.1%) | 14 (6.9%) |
| Total | 176 (100.0%) | 203 (100.0%) |
Families and Households in South Bethlehem borough
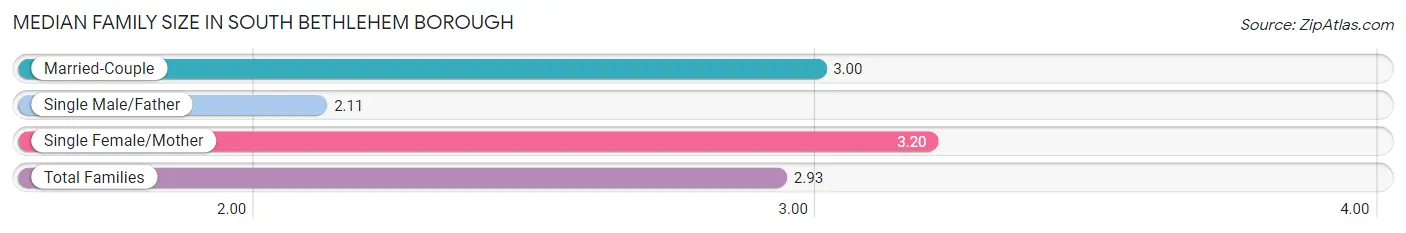
Median Family Size in South Bethlehem borough
The median family size in South Bethlehem borough is 2.93 persons per family, with single female/mother families (10 | 11.6%) accounting for the largest median family size of 3.2 persons per family. On the other hand, single male/father families (9 | 10.5%) represent the smallest median family size with 2.11 persons per family.
| Family Type | # Families | Family Size |
| Married-Couple | 67 (77.9%) | 3.00 |
| Single Male/Father | 9 (10.5%) | 2.11 |
| Single Female/Mother | 10 (11.6%) | 3.20 |
| Total Families | 86 (100.0%) | 2.93 |
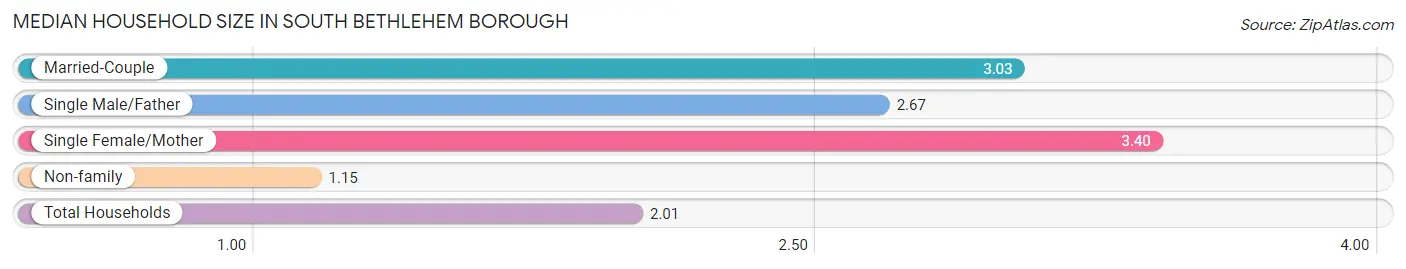
Median Household Size in South Bethlehem borough
The median household size in South Bethlehem borough is 2.01 persons per household, with single female/mother households (10 | 5.3%) accounting for the largest median household size of 3.4 persons per household. non-family households (103 | 54.5%) represent the smallest median household size with 1.15 persons per household.
| Household Type | # Households | Household Size |
| Married-Couple | 67 (35.4%) | 3.03 |
| Single Male/Father | 9 (4.8%) | 2.67 |
| Single Female/Mother | 10 (5.3%) | 3.40 |
| Non-family | 103 (54.5%) | 1.15 |
| Total Households | 189 (100.0%) | 2.01 |
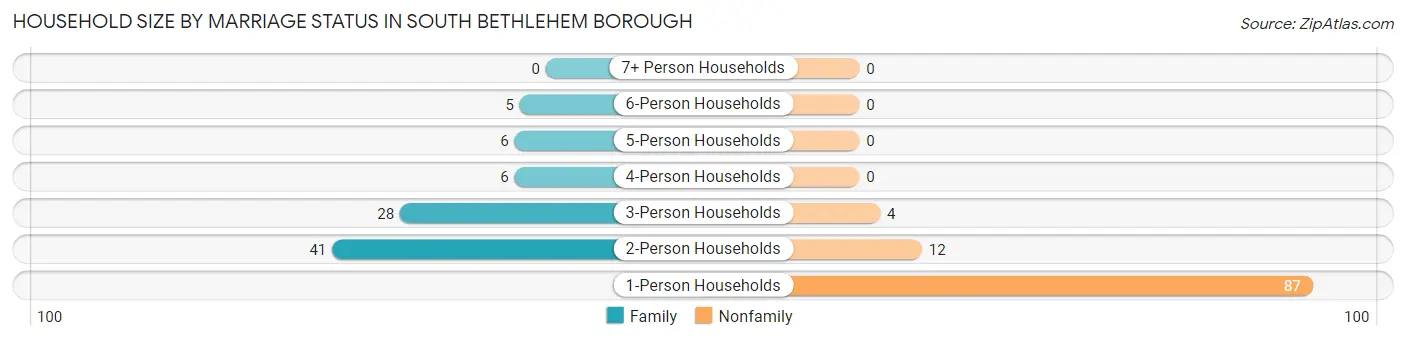
Household Size by Marriage Status in South Bethlehem borough
Out of a total of 189 households in South Bethlehem borough, 86 (45.5%) are family households, while 103 (54.5%) are nonfamily households. The most numerous type of family households are 2-person households, comprising 41, and the most common type of nonfamily households are 1-person households, comprising 87.
| Household Size | Family Households | Nonfamily Households |
| 1-Person Households | - | 87 (46.0%) |
| 2-Person Households | 41 (21.7%) | 12 (6.4%) |
| 3-Person Households | 28 (14.8%) | 4 (2.1%) |
| 4-Person Households | 6 (3.2%) | 0 (0.0%) |
| 5-Person Households | 6 (3.2%) | 0 (0.0%) |
| 6-Person Households | 5 (2.6%) | 0 (0.0%) |
| 7+ Person Households | 0 (0.0%) | 0 (0.0%) |
| Total | 86 (45.5%) | 103 (54.5%) |
Female Fertility in South Bethlehem borough
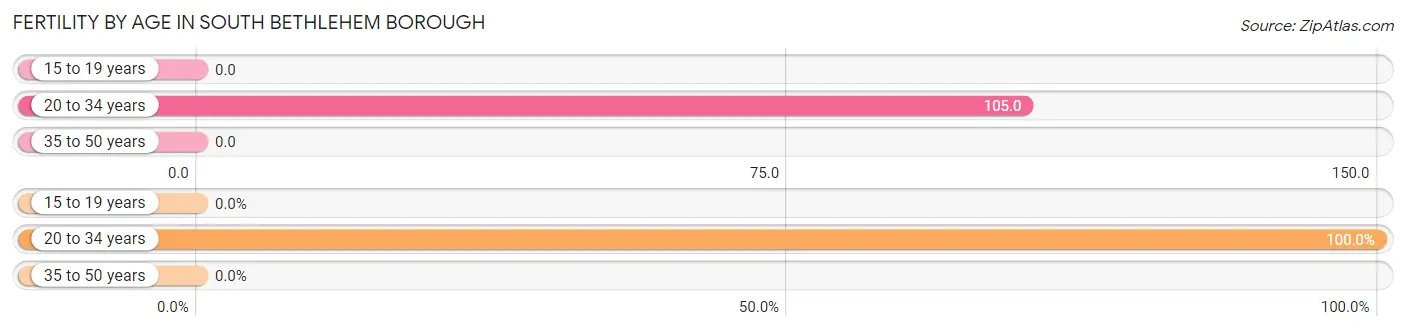
Fertility by Age in South Bethlehem borough
Average fertility rate in South Bethlehem borough is 28.0 births per 1,000 women. Women in the age bracket of 20 to 34 years have the highest fertility rate with 105.0 births per 1,000 women. Women in the age bracket of 20 to 34 years acount for 100.0% of all women with births.
| Age Bracket | Women with Births | Births / 1,000 Women |
| 15 to 19 years | 0 (0.0%) | 0.0 |
| 20 to 34 years | 2 (100.0%) | 105.0 |
| 35 to 50 years | 0 (0.0%) | 0.0 |
| Total | 2 (100.0%) | 28.0 |
Fertility by Age by Marriage Status in South Bethlehem borough
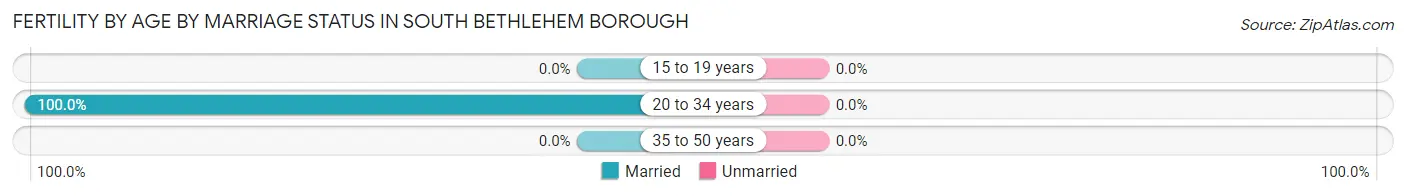
| Age Bracket | Married | Unmarried |
| 15 to 19 years | 0 (0.0%) | 0 (0.0%) |
| 20 to 34 years | 2 (100.0%) | 0 (0.0%) |
| 35 to 50 years | 0 (0.0%) | 0 (0.0%) |
| Total | 2 (100.0%) | 0 (0.0%) |
Fertility by Education in South Bethlehem borough
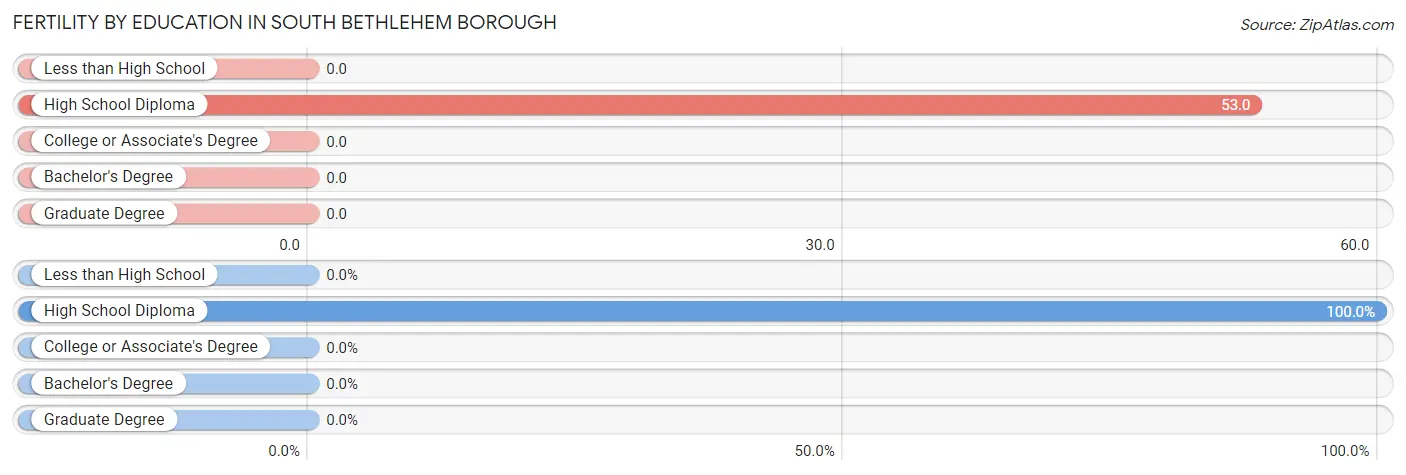
| Educational Attainment | Women with Births | Births / 1,000 Women |
| Less than High School | 0 (0.0%) | 0.0 |
| High School Diploma | 2 (100.0%) | 53.0 |
| College or Associate's Degree | 0 (0.0%) | 0.0 |
| Bachelor's Degree | 0 (0.0%) | 0.0 |
| Graduate Degree | 0 (0.0%) | 0.0 |
| Total | 2 (100.0%) | 28.0 |
Fertility by Education by Marriage Status in South Bethlehem borough
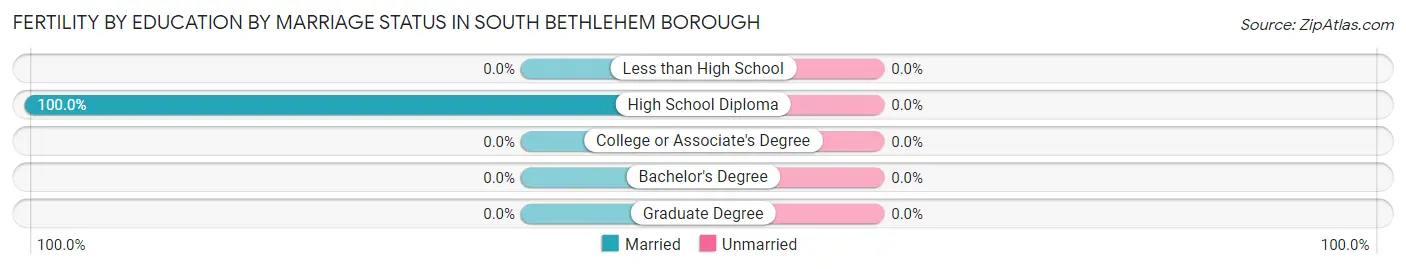
| Educational Attainment | Married | Unmarried |
| Less than High School | 0 (0.0%) | 0 (0.0%) |
| High School Diploma | 2 (100.0%) | 0 (0.0%) |
| College or Associate's Degree | 0 (0.0%) | 0 (0.0%) |
| Bachelor's Degree | 0 (0.0%) | 0 (0.0%) |
| Graduate Degree | 0 (0.0%) | 0 (0.0%) |
| Total | 2 (100.0%) | 0 (0.0%) |
Employment Characteristics in South Bethlehem borough
Employment by Class of Employer in South Bethlehem borough
Among the 183 employed individuals in South Bethlehem borough, private company employees (129 | 70.5%), state government employees (20 | 10.9%), and not-for-profit organizations (16 | 8.7%) make up the most common classes of employment.
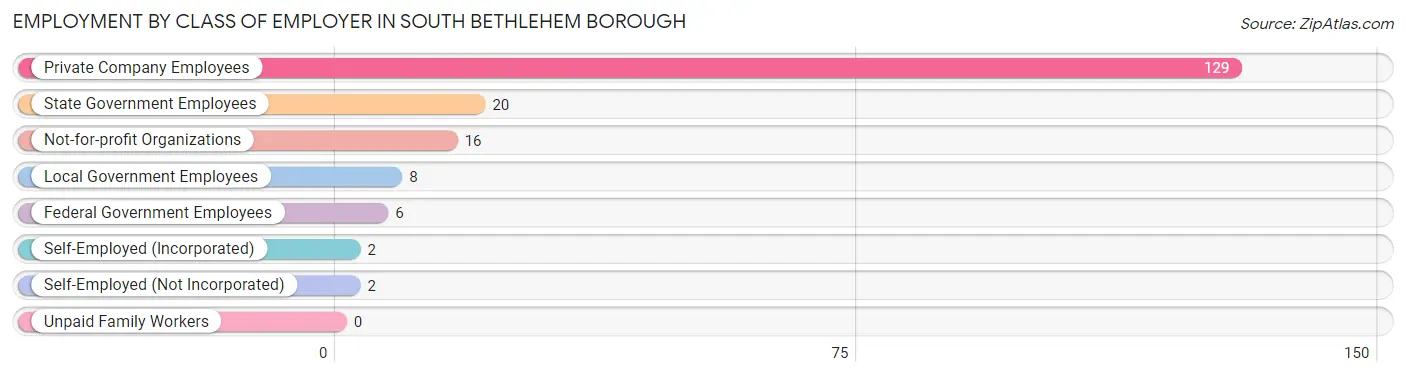
| Employer Class | # Employees | % Employees |
| Private Company Employees | 129 | 70.5% |
| Self-Employed (Incorporated) | 2 | 1.1% |
| Self-Employed (Not Incorporated) | 2 | 1.1% |
| Not-for-profit Organizations | 16 | 8.7% |
| Local Government Employees | 8 | 4.4% |
| State Government Employees | 20 | 10.9% |
| Federal Government Employees | 6 | 3.3% |
| Unpaid Family Workers | 0 | 0.0% |
| Total | 183 | 100.0% |
Employment Status by Age in South Bethlehem borough
According to the labor force statistics for South Bethlehem borough, out of the total population over 16 years of age (324), 57.7% or 187 individuals are in the labor force, with 1.6% or 3 of them unemployed. The age group with the highest labor force participation rate is 25 to 29 years, with 100.0% or 17 individuals in the labor force. Within the labor force, the 25 to 29 years age range has the highest percentage of unemployed individuals, with 17.6% or 3 of them being unemployed.
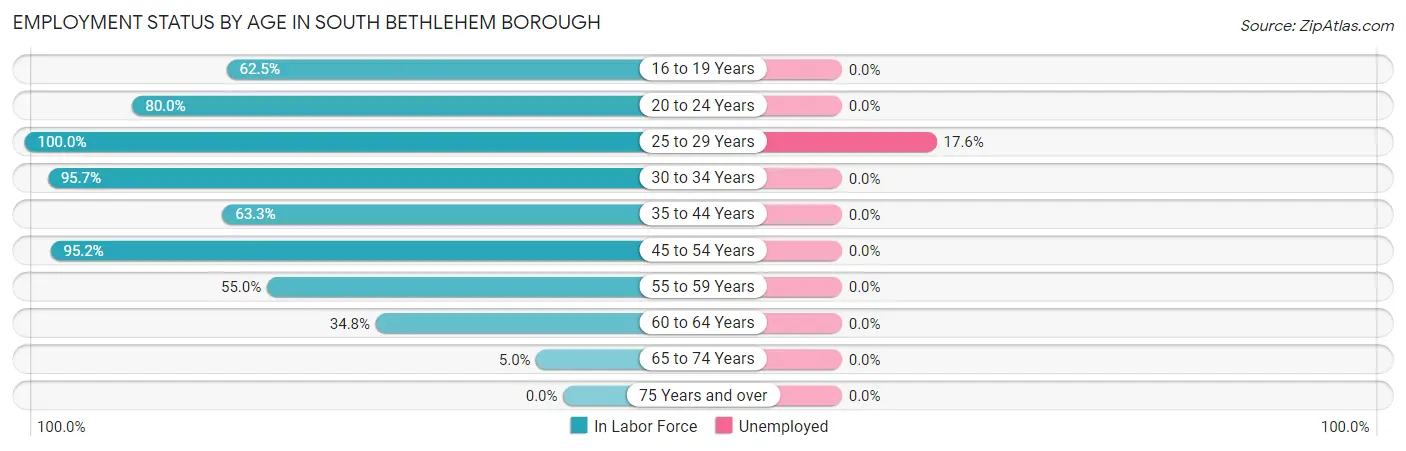
| Age Bracket | In Labor Force | Unemployed |
| 16 to 19 Years | 10 (62.5%) | 0 (0.0%) |
| 20 to 24 Years | 8 (80.0%) | 0 (0.0%) |
| 25 to 29 Years | 17 (100.0%) | 3 (17.6%) |
| 30 to 34 Years | 22 (95.7%) | 0 (0.0%) |
| 35 to 44 Years | 19 (63.3%) | 0 (0.0%) |
| 45 to 54 Years | 79 (95.2%) | 0 (0.0%) |
| 55 to 59 Years | 22 (55.0%) | 0 (0.0%) |
| 60 to 64 Years | 8 (34.8%) | 0 (0.0%) |
| 65 to 74 Years | 2 (5.0%) | 0 (0.0%) |
| 75 Years and over | 0 (0.0%) | 0 (0.0%) |
| Total | 187 (57.7%) | 3 (1.6%) |
Employment Status by Educational Attainment in South Bethlehem borough
According to labor force statistics for South Bethlehem borough, 77.3% of individuals (167) out of the total population between 25 and 64 years of age (216) are in the labor force, with 1.8% or 3 of them being unemployed. The group with the highest labor force participation rate are those with the educational attainment of bachelor's degree or higher, with 91.5% or 43 individuals in the labor force. Within the labor force, individuals with bachelor's degree or higher education have the highest percentage of unemployment, with 7.0% or 3 of them being unemployed.
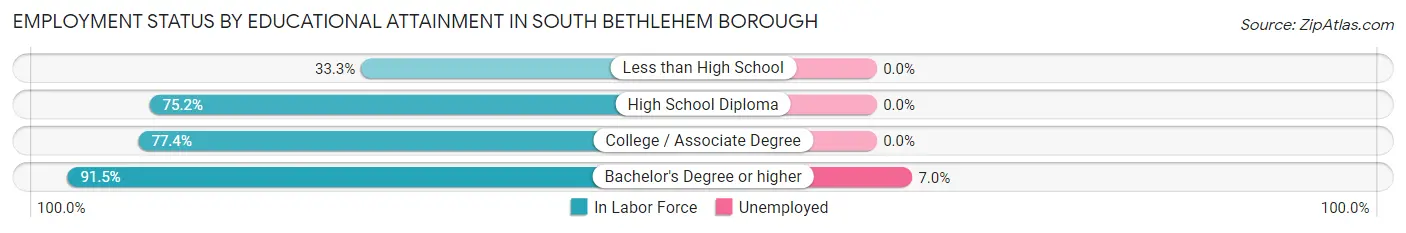
| Educational Attainment | In Labor Force | Unemployed |
| Less than High School | 3 (33.3%) | 0 (0.0%) |
| High School Diploma | 97 (75.2%) | 0 (0.0%) |
| College / Associate Degree | 24 (77.4%) | 0 (0.0%) |
| Bachelor's Degree or higher | 43 (91.5%) | 3 (7.0%) |
| Total | 167 (77.3%) | 4 (1.8%) |
Employment Occupations by Sex in South Bethlehem borough
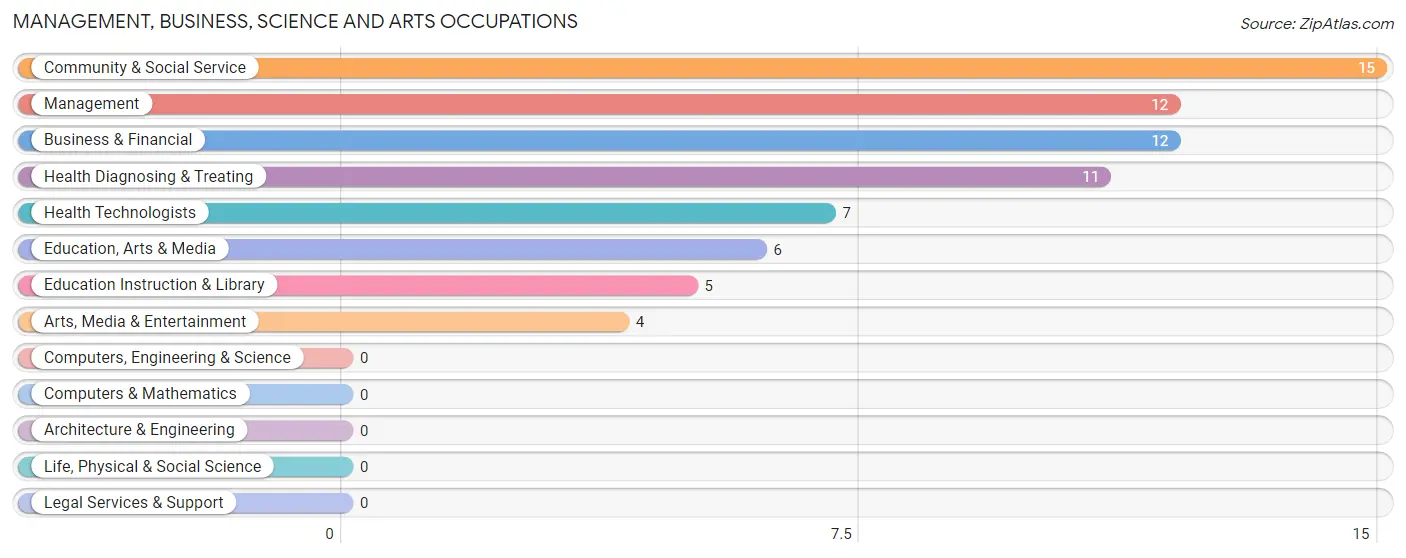
Management, Business, Science and Arts Occupations
The most common Management, Business, Science and Arts occupations in South Bethlehem borough are Community & Social Service (15 | 8.2%), Management (12 | 6.5%), Business & Financial (12 | 6.5%), Health Diagnosing & Treating (11 | 6.0%), and Health Technologists (7 | 3.8%).
Management, Business, Science and Arts Occupations by Sex
Within the Management, Business, Science and Arts occupations in South Bethlehem borough, the most male-oriented occupations are Business & Financial (100.0%), Arts, Media & Entertainment (100.0%), and Management (66.7%), while the most female-oriented occupations are Education, Arts & Media (100.0%), Health Technologists (100.0%), and Health Diagnosing & Treating (81.8%).
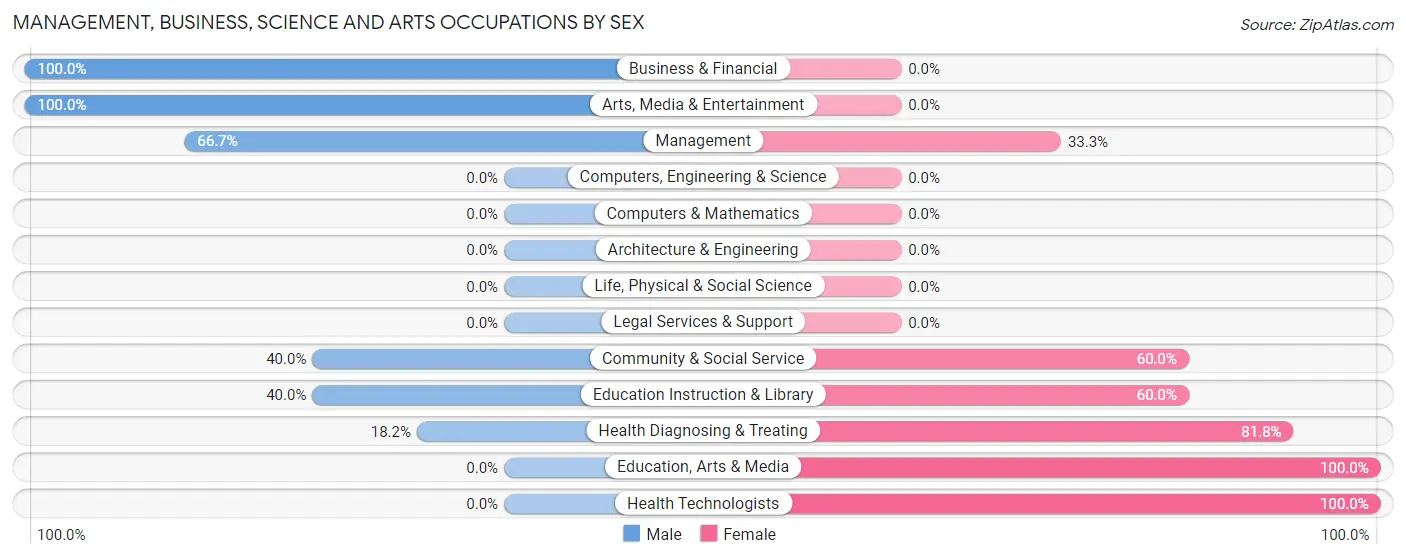
| Occupation | Male | Female |
| Management | 8 (66.7%) | 4 (33.3%) |
| Business & Financial | 12 (100.0%) | 0 (0.0%) |
| Computers, Engineering & Science | 0 (0.0%) | 0 (0.0%) |
| Computers & Mathematics | 0 (0.0%) | 0 (0.0%) |
| Architecture & Engineering | 0 (0.0%) | 0 (0.0%) |
| Life, Physical & Social Science | 0 (0.0%) | 0 (0.0%) |
| Community & Social Service | 6 (40.0%) | 9 (60.0%) |
| Education, Arts & Media | 0 (0.0%) | 6 (100.0%) |
| Legal Services & Support | 0 (0.0%) | 0 (0.0%) |
| Education Instruction & Library | 2 (40.0%) | 3 (60.0%) |
| Arts, Media & Entertainment | 4 (100.0%) | 0 (0.0%) |
| Health Diagnosing & Treating | 2 (18.2%) | 9 (81.8%) |
| Health Technologists | 0 (0.0%) | 7 (100.0%) |
| Total (Category) | 28 (56.0%) | 22 (44.0%) |
| Total (Overall) | 105 (57.1%) | 79 (42.9%) |
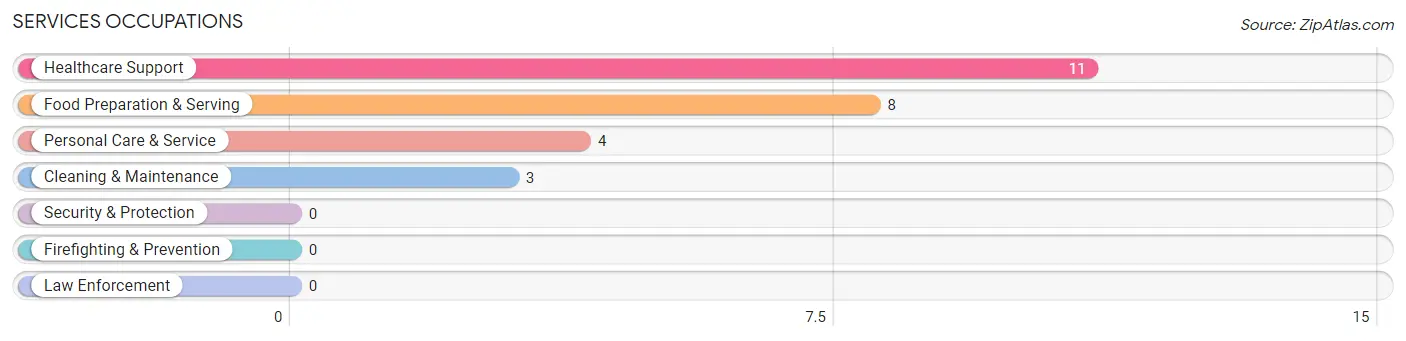
Services Occupations
The most common Services occupations in South Bethlehem borough are Healthcare Support (11 | 6.0%), Food Preparation & Serving (8 | 4.3%), Personal Care & Service (4 | 2.2%), and Cleaning & Maintenance (3 | 1.6%).
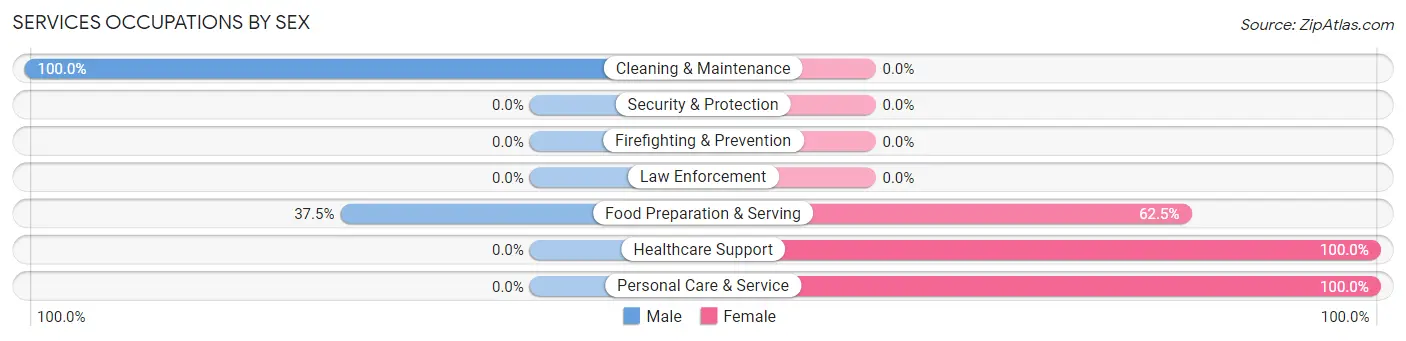
Services Occupations by Sex
Within the Services occupations in South Bethlehem borough, the most male-oriented occupations are Cleaning & Maintenance (100.0%), and Food Preparation & Serving (37.5%), while the most female-oriented occupations are Healthcare Support (100.0%), Personal Care & Service (100.0%), and Food Preparation & Serving (62.5%).
| Occupation | Male | Female |
| Healthcare Support | 0 (0.0%) | 11 (100.0%) |
| Security & Protection | 0 (0.0%) | 0 (0.0%) |
| Firefighting & Prevention | 0 (0.0%) | 0 (0.0%) |
| Law Enforcement | 0 (0.0%) | 0 (0.0%) |
| Food Preparation & Serving | 3 (37.5%) | 5 (62.5%) |
| Cleaning & Maintenance | 3 (100.0%) | 0 (0.0%) |
| Personal Care & Service | 0 (0.0%) | 4 (100.0%) |
| Total (Category) | 6 (23.1%) | 20 (76.9%) |
| Total (Overall) | 105 (57.1%) | 79 (42.9%) |
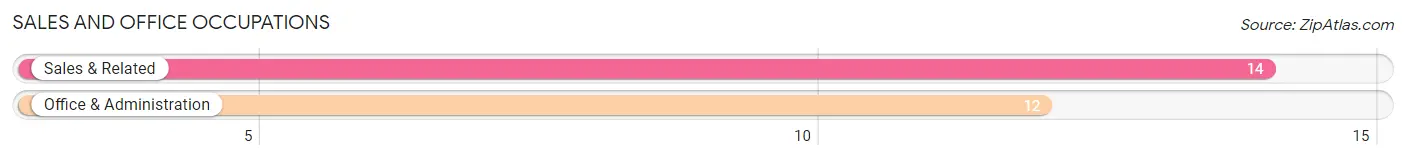
Sales and Office Occupations
The most common Sales and Office occupations in South Bethlehem borough are Sales & Related (14 | 7.6%), and Office & Administration (12 | 6.5%).
Sales and Office Occupations by Sex
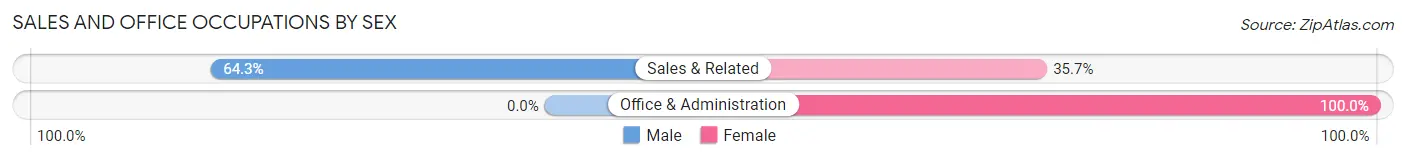
| Occupation | Male | Female |
| Sales & Related | 9 (64.3%) | 5 (35.7%) |
| Office & Administration | 0 (0.0%) | 12 (100.0%) |
| Total (Category) | 9 (34.6%) | 17 (65.4%) |
| Total (Overall) | 105 (57.1%) | 79 (42.9%) |
Natural Resources, Construction and Maintenance Occupations
The most common Natural Resources, Construction and Maintenance occupations in South Bethlehem borough are Construction & Extraction (10 | 5.4%), and Installation, Maintenance & Repair (10 | 5.4%).
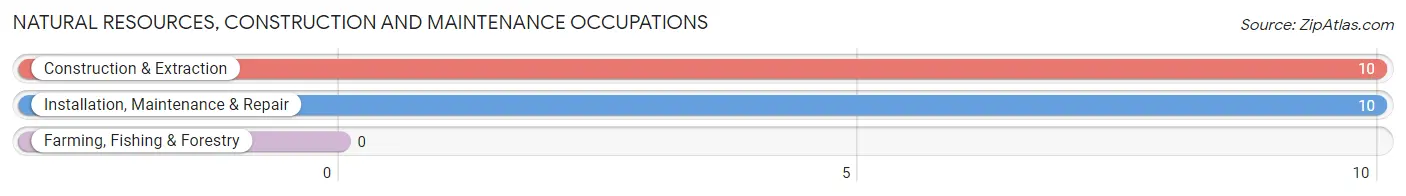
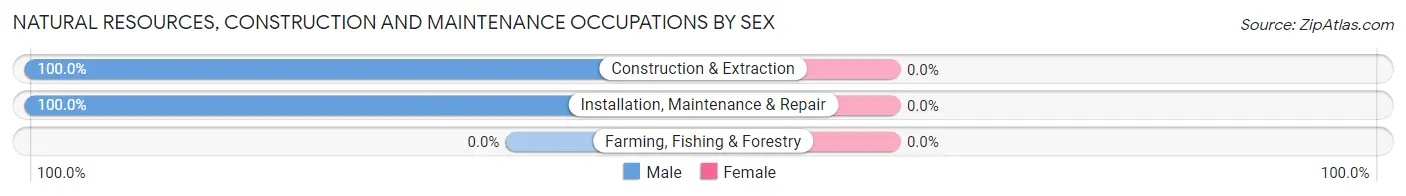
Natural Resources, Construction and Maintenance Occupations by Sex
| Occupation | Male | Female |
| Farming, Fishing & Forestry | 0 (0.0%) | 0 (0.0%) |
| Construction & Extraction | 10 (100.0%) | 0 (0.0%) |
| Installation, Maintenance & Repair | 10 (100.0%) | 0 (0.0%) |
| Total (Category) | 20 (100.0%) | 0 (0.0%) |
| Total (Overall) | 105 (57.1%) | 79 (42.9%) |
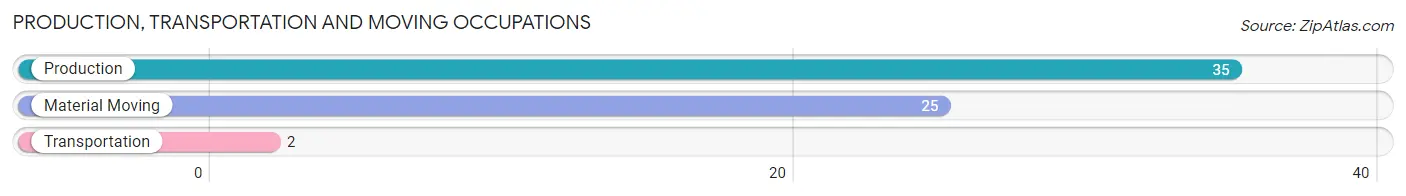
Production, Transportation and Moving Occupations
The most common Production, Transportation and Moving occupations in South Bethlehem borough are Production (35 | 19.0%), Material Moving (25 | 13.6%), and Transportation (2 | 1.1%).
Production, Transportation and Moving Occupations by Sex
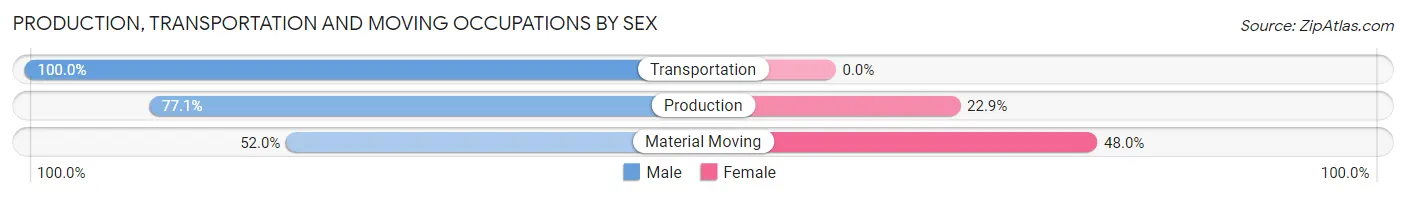
| Occupation | Male | Female |
| Production | 27 (77.1%) | 8 (22.9%) |
| Transportation | 2 (100.0%) | 0 (0.0%) |
| Material Moving | 13 (52.0%) | 12 (48.0%) |
| Total (Category) | 42 (67.7%) | 20 (32.3%) |
| Total (Overall) | 105 (57.1%) | 79 (42.9%) |
Employment Industries by Sex in South Bethlehem borough
Employment Industries in South Bethlehem borough
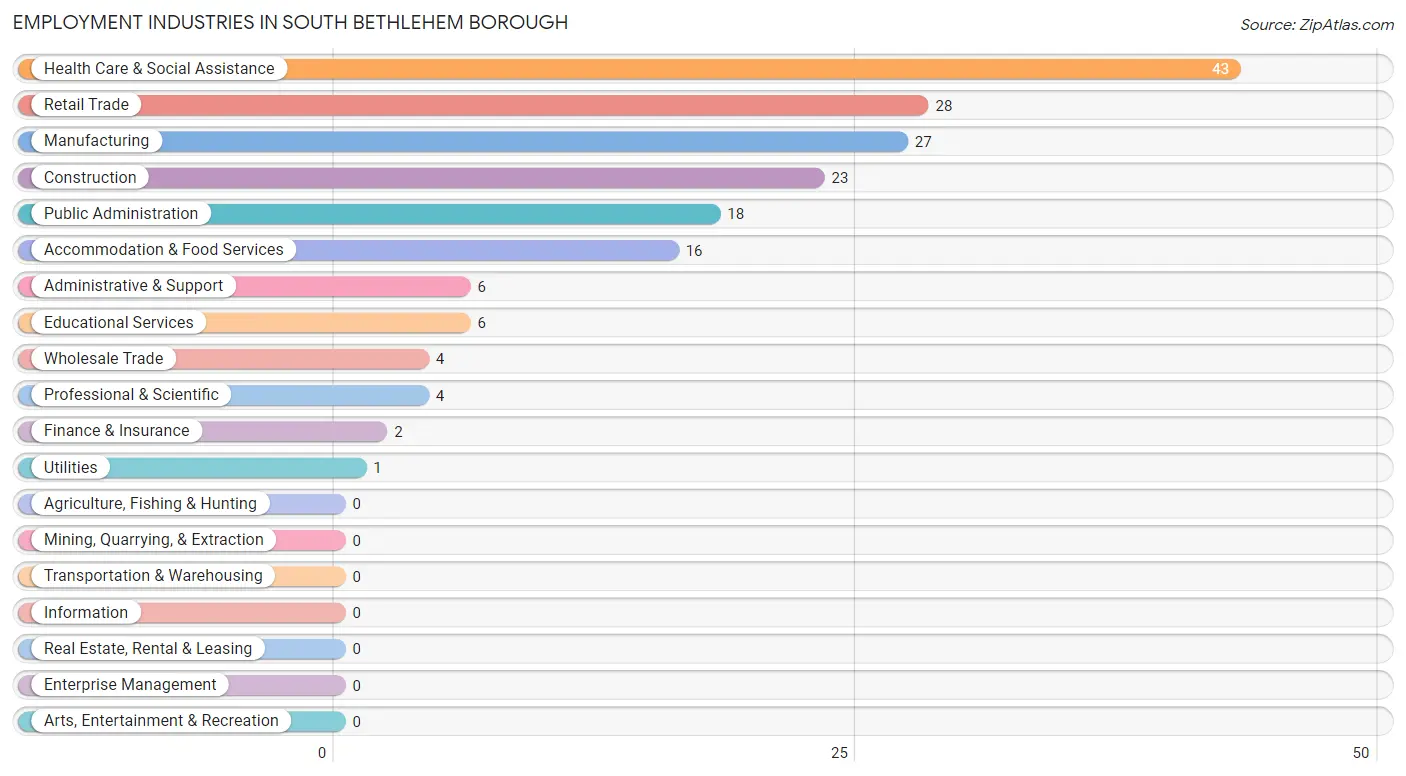
The major employment industries in South Bethlehem borough include Health Care & Social Assistance (43 | 23.4%), Retail Trade (28 | 15.2%), Manufacturing (27 | 14.7%), Construction (23 | 12.5%), and Public Administration (18 | 9.8%).
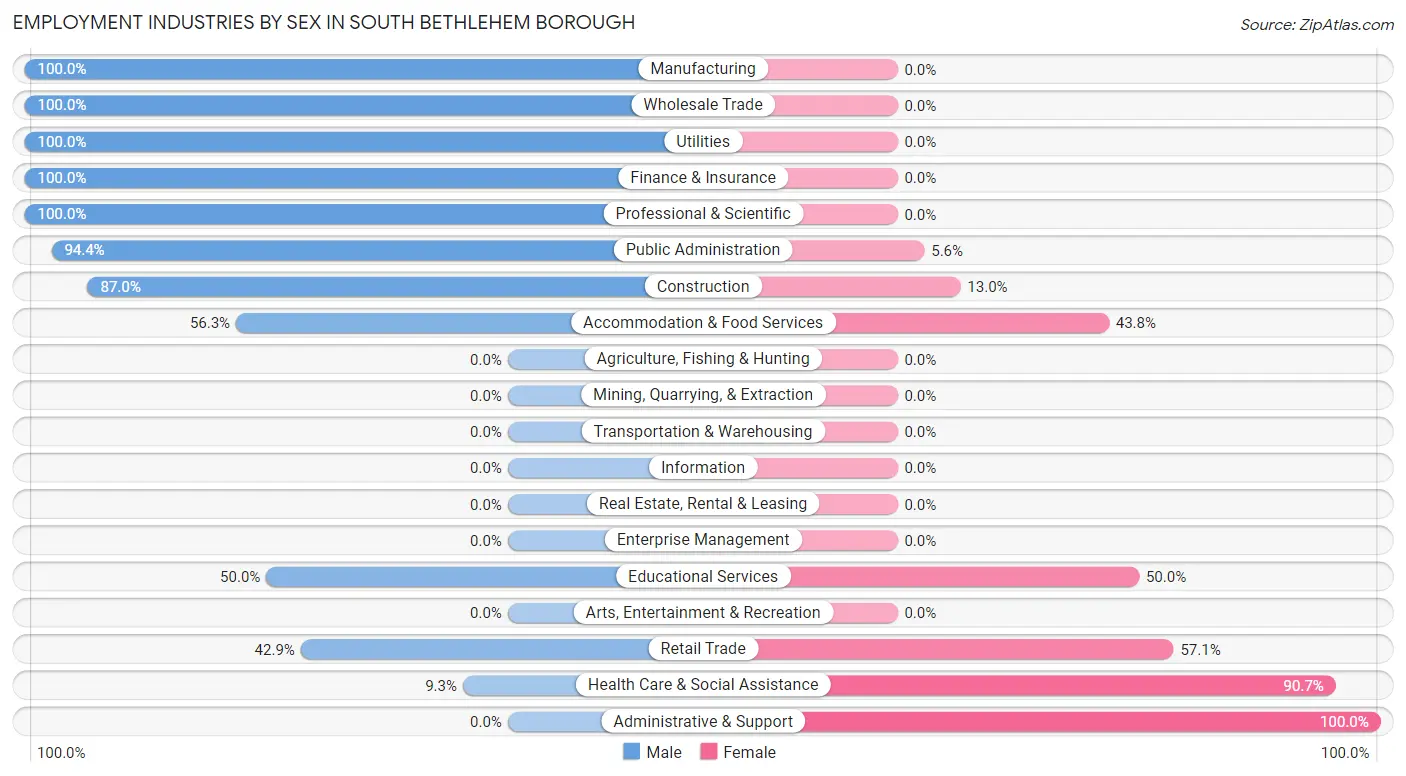
Employment Industries by Sex in South Bethlehem borough
The South Bethlehem borough industries that see more men than women are Manufacturing (100.0%), Wholesale Trade (100.0%), and Utilities (100.0%), whereas the industries that tend to have a higher number of women are Administrative & Support (100.0%), Health Care & Social Assistance (90.7%), and Retail Trade (57.1%).
| Industry | Male | Female |
| Agriculture, Fishing & Hunting | 0 (0.0%) | 0 (0.0%) |
| Mining, Quarrying, & Extraction | 0 (0.0%) | 0 (0.0%) |
| Construction | 20 (87.0%) | 3 (13.0%) |
| Manufacturing | 27 (100.0%) | 0 (0.0%) |
| Wholesale Trade | 4 (100.0%) | 0 (0.0%) |
| Retail Trade | 12 (42.9%) | 16 (57.1%) |
| Transportation & Warehousing | 0 (0.0%) | 0 (0.0%) |
| Utilities | 1 (100.0%) | 0 (0.0%) |
| Information | 0 (0.0%) | 0 (0.0%) |
| Finance & Insurance | 2 (100.0%) | 0 (0.0%) |
| Real Estate, Rental & Leasing | 0 (0.0%) | 0 (0.0%) |
| Professional & Scientific | 4 (100.0%) | 0 (0.0%) |
| Enterprise Management | 0 (0.0%) | 0 (0.0%) |
| Administrative & Support | 0 (0.0%) | 6 (100.0%) |
| Educational Services | 3 (50.0%) | 3 (50.0%) |
| Health Care & Social Assistance | 4 (9.3%) | 39 (90.7%) |
| Arts, Entertainment & Recreation | 0 (0.0%) | 0 (0.0%) |
| Accommodation & Food Services | 9 (56.2%) | 7 (43.8%) |
| Public Administration | 17 (94.4%) | 1 (5.6%) |
| Total | 105 (57.1%) | 79 (42.9%) |
Education in South Bethlehem borough
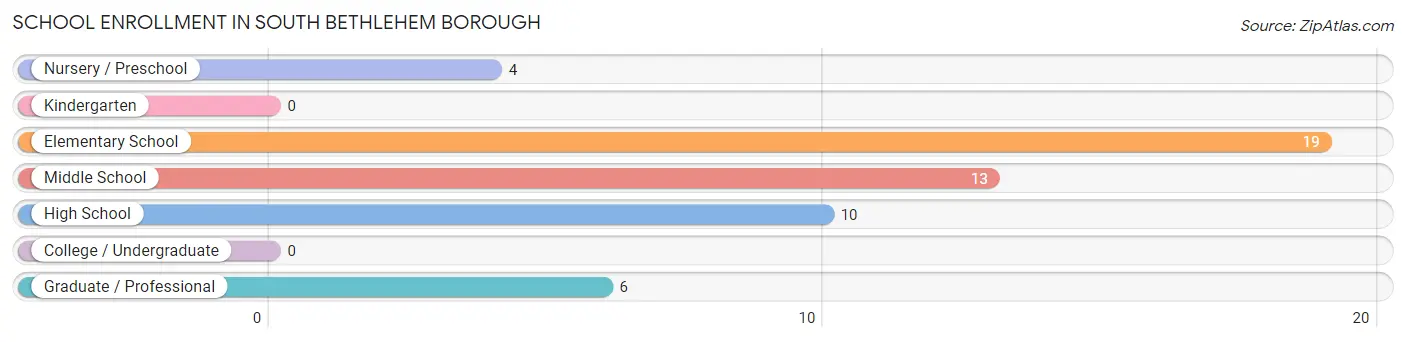
School Enrollment in South Bethlehem borough
The most common levels of schooling among the 52 students in South Bethlehem borough are elementary school (19 | 36.5%), middle school (13 | 25.0%), and high school (10 | 19.2%).
| School Level | # Students | % Students |
| Nursery / Preschool | 4 | 7.7% |
| Kindergarten | 0 | 0.0% |
| Elementary School | 19 | 36.5% |
| Middle School | 13 | 25.0% |
| High School | 10 | 19.2% |
| College / Undergraduate | 0 | 0.0% |
| Graduate / Professional | 6 | 11.5% |
| Total | 52 | 100.0% |
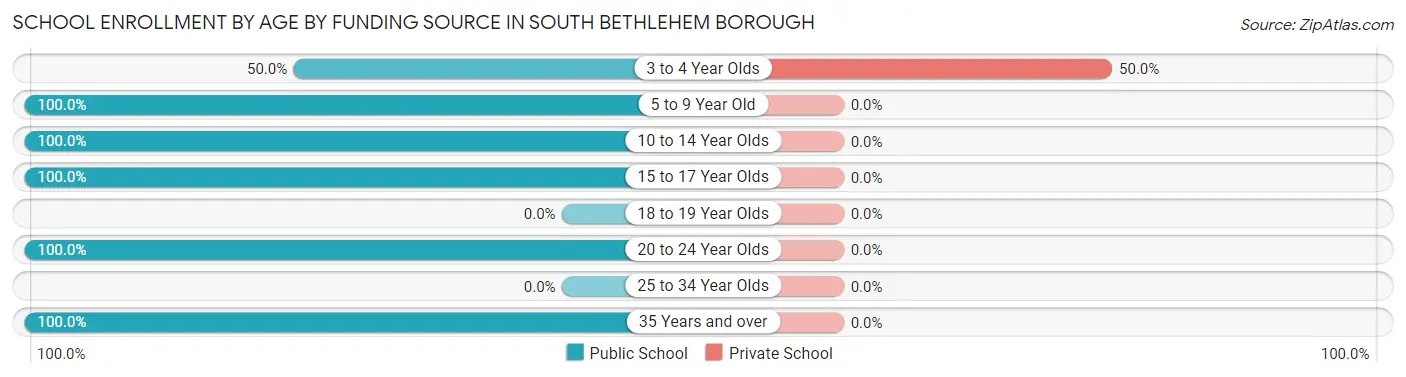
School Enrollment by Age by Funding Source in South Bethlehem borough
Out of a total of 52 students who are enrolled in schools in South Bethlehem borough, 2 (3.8%) attend a private institution, while the remaining 50 (96.2%) are enrolled in public schools. The age group of 3 to 4 year olds has the highest likelihood of being enrolled in private schools, with 2 (50.0% in the age bracket) enrolled. Conversely, the age group of 5 to 9 year old has the lowest likelihood of being enrolled in a private school, with 19 (100.0% in the age bracket) attending a public institution.
| Age Bracket | Public School | Private School |
| 3 to 4 Year Olds | 2 (50.0%) | 2 (50.0%) |
| 5 to 9 Year Old | 19 (100.0%) | 0 (0.0%) |
| 10 to 14 Year Olds | 11 (100.0%) | 0 (0.0%) |
| 15 to 17 Year Olds | 8 (100.0%) | 0 (0.0%) |
| 18 to 19 Year Olds | 0 (0.0%) | 0 (0.0%) |
| 20 to 24 Year Olds | 4 (100.0%) | 0 (0.0%) |
| 25 to 34 Year Olds | 0 (0.0%) | 0 (0.0%) |
| 35 Years and over | 6 (100.0%) | 0 (0.0%) |
| Total | 50 (96.2%) | 2 (3.8%) |
Educational Attainment by Field of Study in South Bethlehem borough
Bio, nature & agricultural (13 | 20.6%), education (13 | 20.6%), psychology (10 | 15.9%), science & technology (7 | 11.1%), and business (5 | 7.9%) are the most common fields of study among 63 individuals in South Bethlehem borough who have obtained a bachelor's degree or higher.
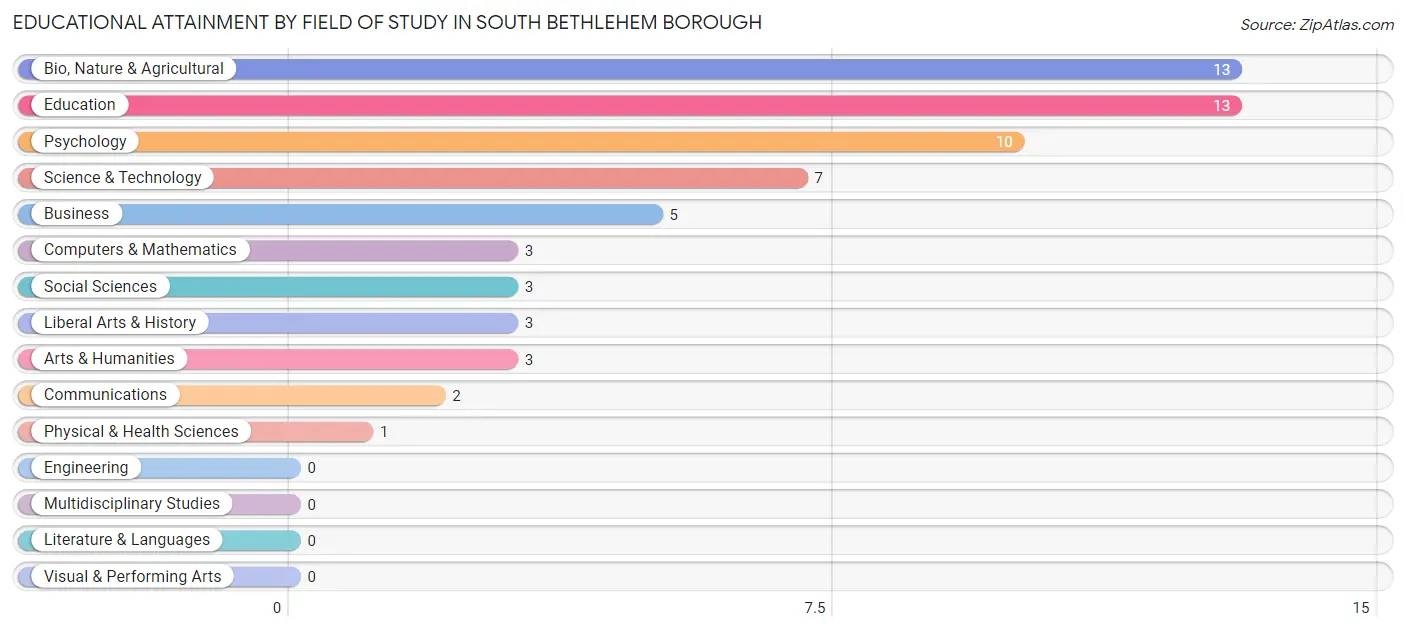
| Field of Study | # Graduates | % Graduates |
| Computers & Mathematics | 3 | 4.8% |
| Bio, Nature & Agricultural | 13 | 20.6% |
| Physical & Health Sciences | 1 | 1.6% |
| Psychology | 10 | 15.9% |
| Social Sciences | 3 | 4.8% |
| Engineering | 0 | 0.0% |
| Multidisciplinary Studies | 0 | 0.0% |
| Science & Technology | 7 | 11.1% |
| Business | 5 | 7.9% |
| Education | 13 | 20.6% |
| Literature & Languages | 0 | 0.0% |
| Liberal Arts & History | 3 | 4.8% |
| Visual & Performing Arts | 0 | 0.0% |
| Communications | 2 | 3.2% |
| Arts & Humanities | 3 | 4.8% |
| Total | 63 | 100.0% |
Transportation & Commute in South Bethlehem borough
Vehicle Availability by Sex in South Bethlehem borough
The most prevalent vehicle ownership categories in South Bethlehem borough are males with 3 vehicles (31, accounting for 29.8%) and females with 3 vehicles (34, making up 39.2%).
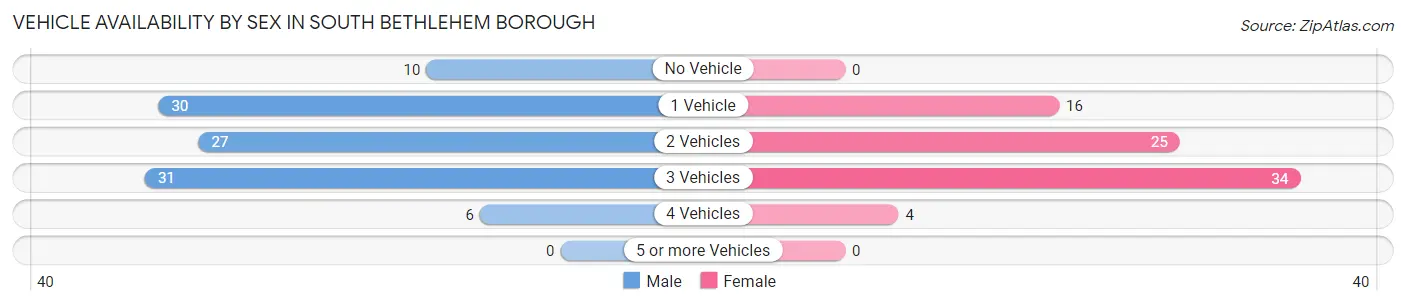
| Vehicles Available | Male | Female |
| No Vehicle | 10 (9.6%) | 0 (0.0%) |
| 1 Vehicle | 30 (28.8%) | 16 (20.3%) |
| 2 Vehicles | 27 (26.0%) | 25 (31.7%) |
| 3 Vehicles | 31 (29.8%) | 34 (43.0%) |
| 4 Vehicles | 6 (5.8%) | 4 (5.1%) |
| 5 or more Vehicles | 0 (0.0%) | 0 (0.0%) |
| Total | 104 (100.0%) | 79 (100.0%) |
Commute Time in South Bethlehem borough
The most frequently occuring commute durations in South Bethlehem borough are 5 to 9 minutes (36 commuters, 21.2%), 30 to 34 minutes (31 commuters, 18.2%), and 20 to 24 minutes (26 commuters, 15.3%).
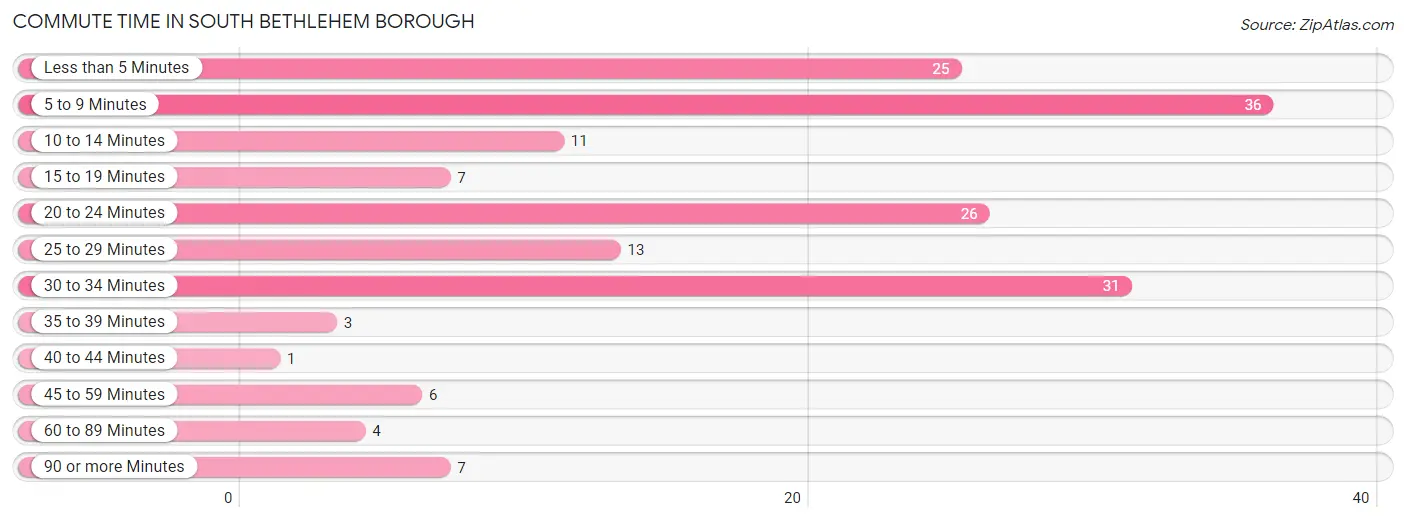
| Commute Time | # Commuters | % Commuters |
| Less than 5 Minutes | 25 | 14.7% |
| 5 to 9 Minutes | 36 | 21.2% |
| 10 to 14 Minutes | 11 | 6.5% |
| 15 to 19 Minutes | 7 | 4.1% |
| 20 to 24 Minutes | 26 | 15.3% |
| 25 to 29 Minutes | 13 | 7.6% |
| 30 to 34 Minutes | 31 | 18.2% |
| 35 to 39 Minutes | 3 | 1.8% |
| 40 to 44 Minutes | 1 | 0.6% |
| 45 to 59 Minutes | 6 | 3.5% |
| 60 to 89 Minutes | 4 | 2.4% |
| 90 or more Minutes | 7 | 4.1% |
Commute Time by Sex in South Bethlehem borough
The most common commute times in South Bethlehem borough are 30 to 34 minutes (21 commuters, 22.6%) for males and 5 to 9 minutes (19 commuters, 24.7%) for females.
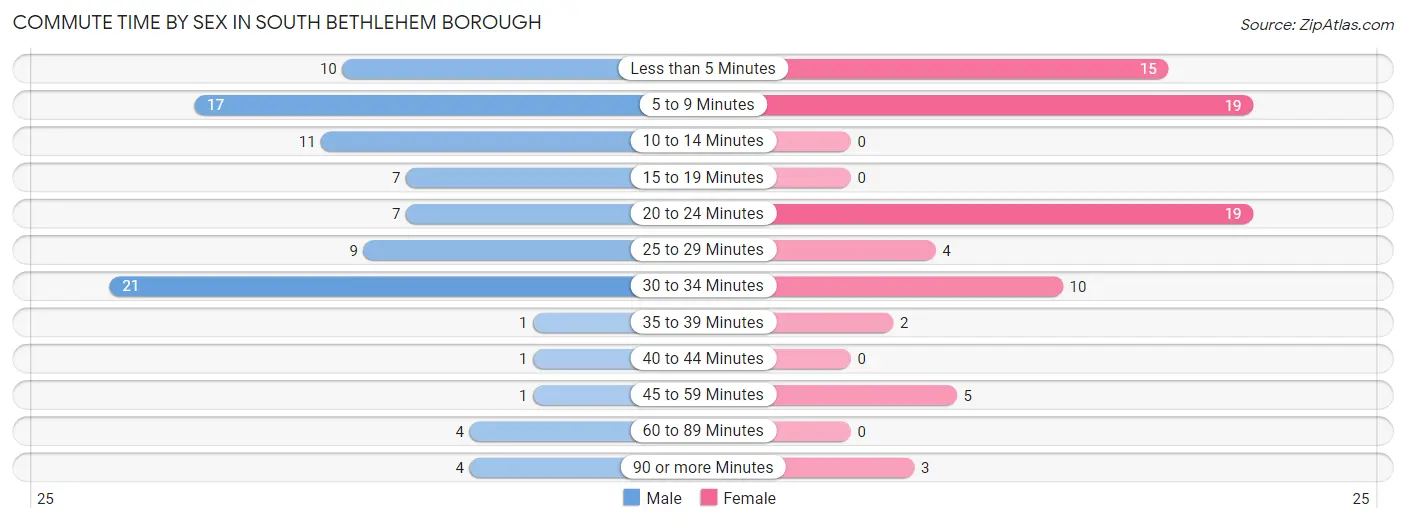
| Commute Time | Male | Female |
| Less than 5 Minutes | 10 (10.7%) | 15 (19.5%) |
| 5 to 9 Minutes | 17 (18.3%) | 19 (24.7%) |
| 10 to 14 Minutes | 11 (11.8%) | 0 (0.0%) |
| 15 to 19 Minutes | 7 (7.5%) | 0 (0.0%) |
| 20 to 24 Minutes | 7 (7.5%) | 19 (24.7%) |
| 25 to 29 Minutes | 9 (9.7%) | 4 (5.2%) |
| 30 to 34 Minutes | 21 (22.6%) | 10 (13.0%) |
| 35 to 39 Minutes | 1 (1.1%) | 2 (2.6%) |
| 40 to 44 Minutes | 1 (1.1%) | 0 (0.0%) |
| 45 to 59 Minutes | 1 (1.1%) | 5 (6.5%) |
| 60 to 89 Minutes | 4 (4.3%) | 0 (0.0%) |
| 90 or more Minutes | 4 (4.3%) | 3 (3.9%) |
Time of Departure to Work by Sex in South Bethlehem borough
The most frequent times of departure to work in South Bethlehem borough are 6:00 AM to 6:29 AM (12, 12.9%) for males and 8:00 AM to 8:29 AM (13, 16.9%) for females.
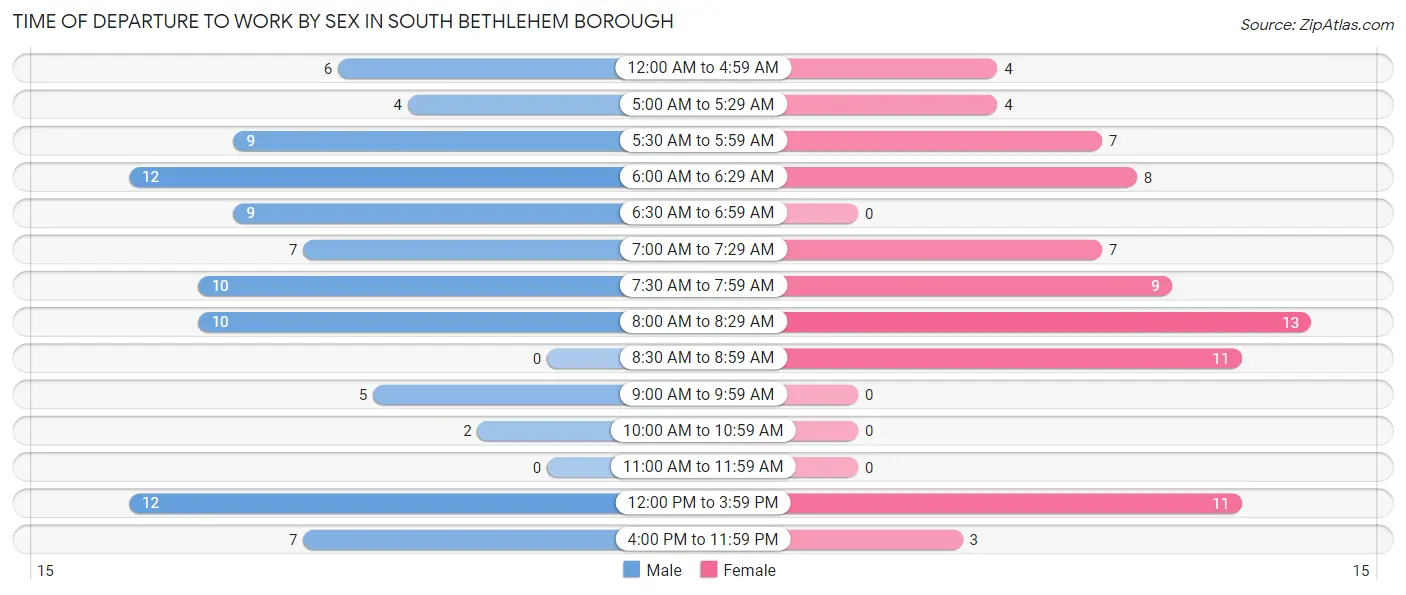
| Time of Departure | Male | Female |
| 12:00 AM to 4:59 AM | 6 (6.5%) | 4 (5.2%) |
| 5:00 AM to 5:29 AM | 4 (4.3%) | 4 (5.2%) |
| 5:30 AM to 5:59 AM | 9 (9.7%) | 7 (9.1%) |
| 6:00 AM to 6:29 AM | 12 (12.9%) | 8 (10.4%) |
| 6:30 AM to 6:59 AM | 9 (9.7%) | 0 (0.0%) |
| 7:00 AM to 7:29 AM | 7 (7.5%) | 7 (9.1%) |
| 7:30 AM to 7:59 AM | 10 (10.7%) | 9 (11.7%) |
| 8:00 AM to 8:29 AM | 10 (10.7%) | 13 (16.9%) |
| 8:30 AM to 8:59 AM | 0 (0.0%) | 11 (14.3%) |
| 9:00 AM to 9:59 AM | 5 (5.4%) | 0 (0.0%) |
| 10:00 AM to 10:59 AM | 2 (2.1%) | 0 (0.0%) |
| 11:00 AM to 11:59 AM | 0 (0.0%) | 0 (0.0%) |
| 12:00 PM to 3:59 PM | 12 (12.9%) | 11 (14.3%) |
| 4:00 PM to 11:59 PM | 7 (7.5%) | 3 (3.9%) |
| Total | 93 (100.0%) | 77 (100.0%) |
Housing Occupancy in South Bethlehem borough
Occupancy by Ownership in South Bethlehem borough
Of the total 189 dwellings in South Bethlehem borough, owner-occupied units account for 127 (67.2%), while renter-occupied units make up 62 (32.8%).
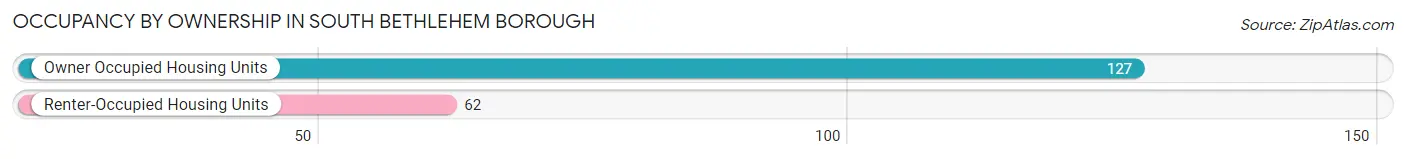
| Occupancy | # Housing Units | % Housing Units |
| Owner Occupied Housing Units | 127 | 67.2% |
| Renter-Occupied Housing Units | 62 | 32.8% |
| Total Occupied Housing Units | 189 | 100.0% |
Occupancy by Household Size in South Bethlehem borough
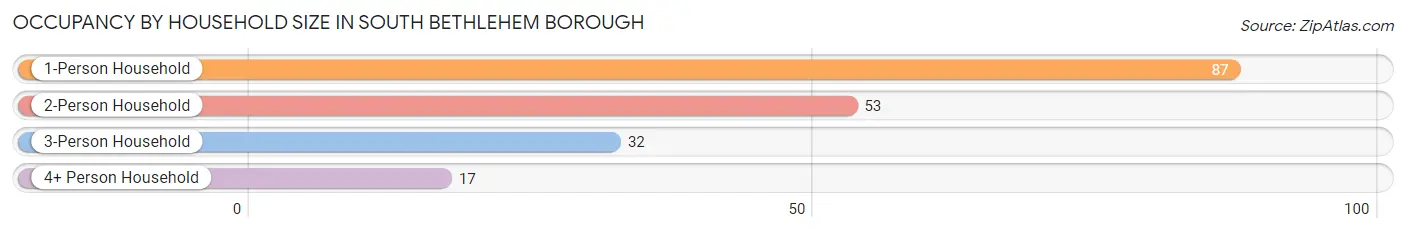
| Household Size | # Housing Units | % Housing Units |
| 1-Person Household | 87 | 46.0% |
| 2-Person Household | 53 | 28.0% |
| 3-Person Household | 32 | 16.9% |
| 4+ Person Household | 17 | 9.0% |
| Total Housing Units | 189 | 100.0% |
Occupancy by Ownership by Household Size in South Bethlehem borough
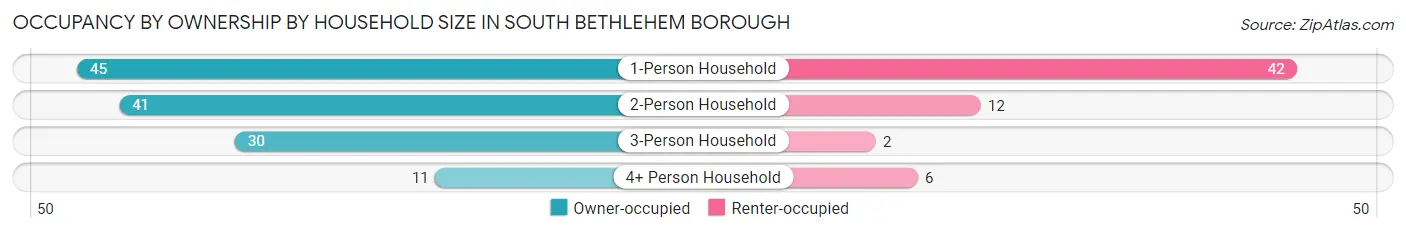
| Household Size | Owner-occupied | Renter-occupied |
| 1-Person Household | 45 (51.7%) | 42 (48.3%) |
| 2-Person Household | 41 (77.4%) | 12 (22.6%) |
| 3-Person Household | 30 (93.8%) | 2 (6.2%) |
| 4+ Person Household | 11 (64.7%) | 6 (35.3%) |
| Total Housing Units | 127 (67.2%) | 62 (32.8%) |
Occupancy by Educational Attainment in South Bethlehem borough
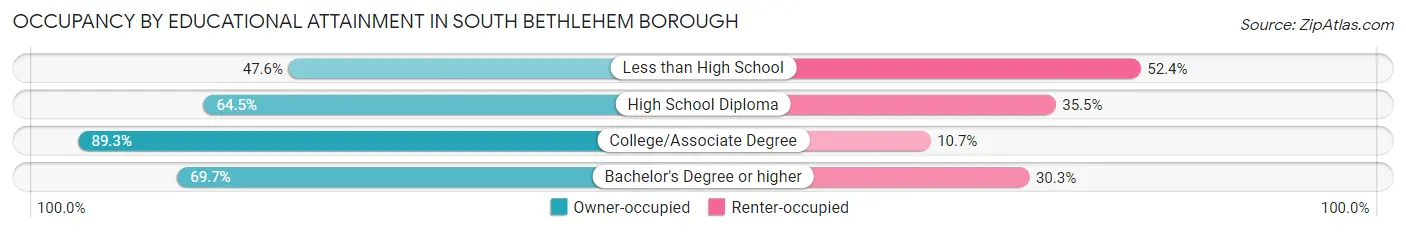
| Household Size | Owner-occupied | Renter-occupied |
| Less than High School | 10 (47.6%) | 11 (52.4%) |
| High School Diploma | 69 (64.5%) | 38 (35.5%) |
| College/Associate Degree | 25 (89.3%) | 3 (10.7%) |
| Bachelor's Degree or higher | 23 (69.7%) | 10 (30.3%) |
Occupancy by Age of Householder in South Bethlehem borough
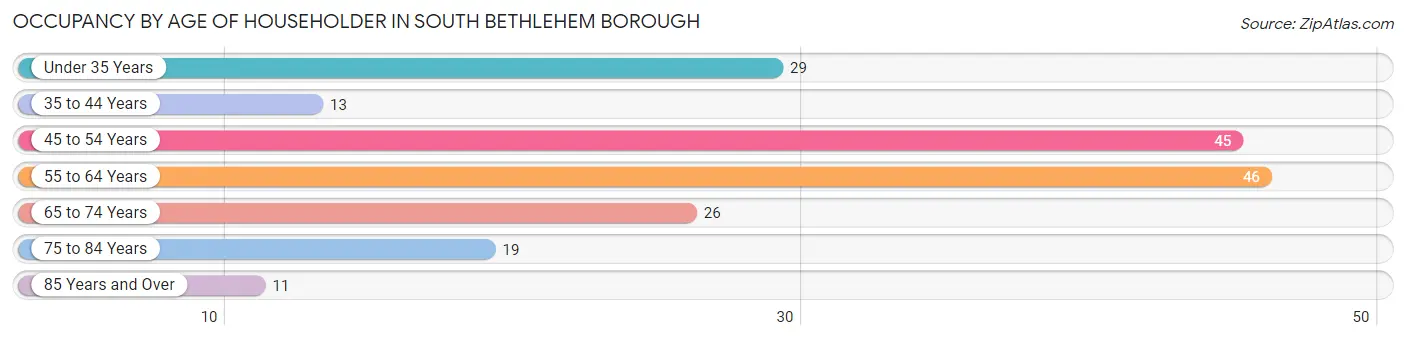
| Age Bracket | # Households | % Households |
| Under 35 Years | 29 | 15.3% |
| 35 to 44 Years | 13 | 6.9% |
| 45 to 54 Years | 45 | 23.8% |
| 55 to 64 Years | 46 | 24.3% |
| 65 to 74 Years | 26 | 13.8% |
| 75 to 84 Years | 19 | 10.1% |
| 85 Years and Over | 11 | 5.8% |
| Total | 189 | 100.0% |
Housing Finances in South Bethlehem borough
Median Income by Occupancy in South Bethlehem borough
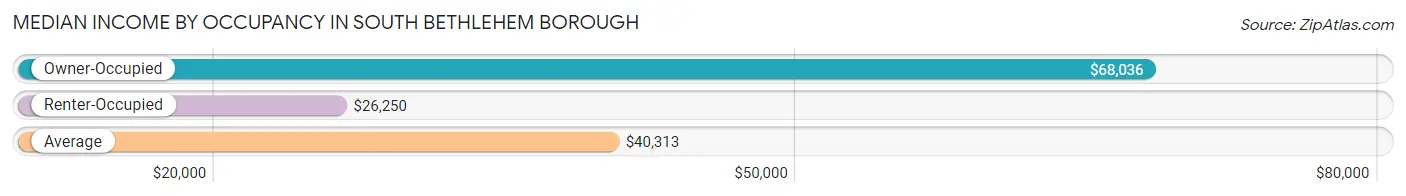
| Occupancy Type | # Households | Median Income |
| Owner-Occupied | 127 (67.2%) | $68,036 |
| Renter-Occupied | 62 (32.8%) | $26,250 |
| Average | 189 (100.0%) | $40,313 |
Occupancy by Householder Income Bracket in South Bethlehem borough
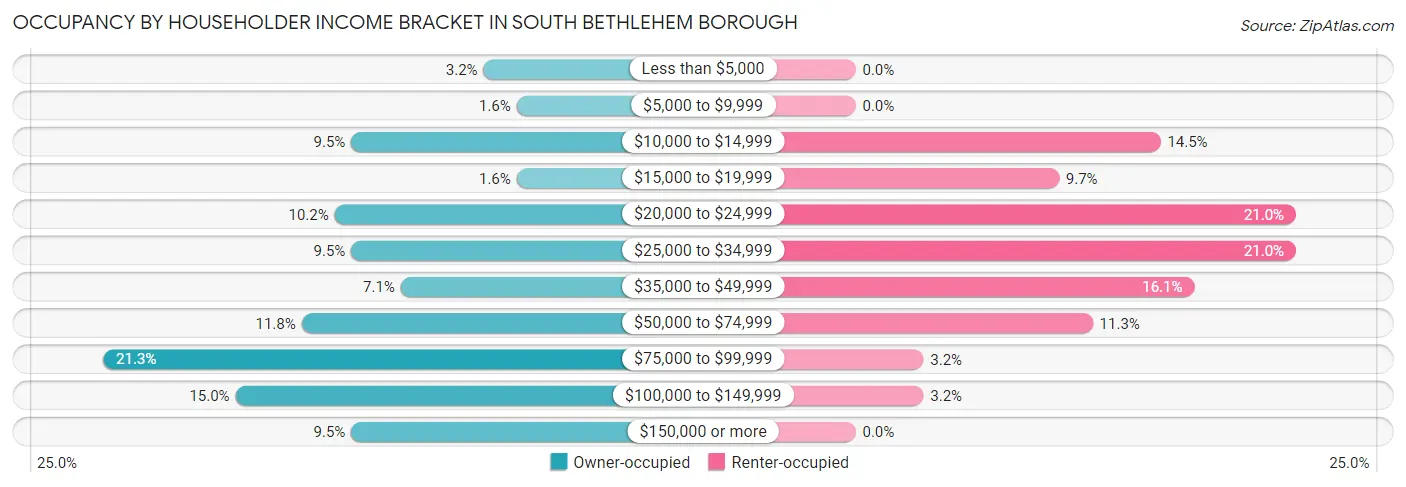
| Income Bracket | Owner-occupied | Renter-occupied |
| Less than $5,000 | 4 (3.2%) | 0 (0.0%) |
| $5,000 to $9,999 | 2 (1.6%) | 0 (0.0%) |
| $10,000 to $14,999 | 12 (9.5%) | 9 (14.5%) |
| $15,000 to $19,999 | 2 (1.6%) | 6 (9.7%) |
| $20,000 to $24,999 | 13 (10.2%) | 13 (21.0%) |
| $25,000 to $34,999 | 12 (9.5%) | 13 (21.0%) |
| $35,000 to $49,999 | 9 (7.1%) | 10 (16.1%) |
| $50,000 to $74,999 | 15 (11.8%) | 7 (11.3%) |
| $75,000 to $99,999 | 27 (21.3%) | 2 (3.2%) |
| $100,000 to $149,999 | 19 (15.0%) | 2 (3.2%) |
| $150,000 or more | 12 (9.5%) | 0 (0.0%) |
| Total | 127 (100.0%) | 62 (100.0%) |
Monthly Housing Cost Tiers in South Bethlehem borough
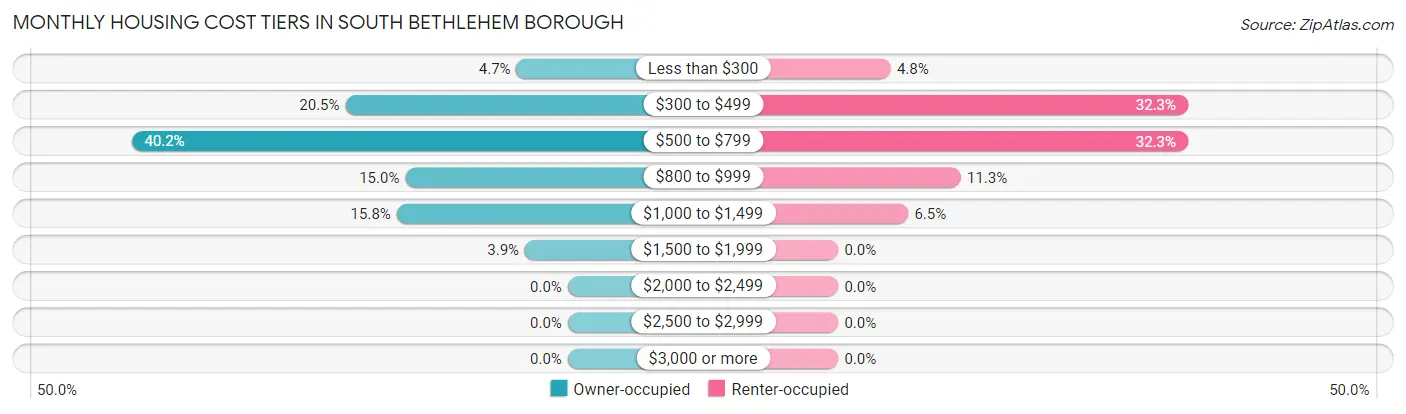
| Monthly Cost | Owner-occupied | Renter-occupied |
| Less than $300 | 6 (4.7%) | 3 (4.8%) |
| $300 to $499 | 26 (20.5%) | 20 (32.3%) |
| $500 to $799 | 51 (40.2%) | 20 (32.3%) |
| $800 to $999 | 19 (15.0%) | 7 (11.3%) |
| $1,000 to $1,499 | 20 (15.8%) | 4 (6.5%) |
| $1,500 to $1,999 | 5 (3.9%) | 0 (0.0%) |
| $2,000 to $2,499 | 0 (0.0%) | 0 (0.0%) |
| $2,500 to $2,999 | 0 (0.0%) | 0 (0.0%) |
| $3,000 or more | 0 (0.0%) | 0 (0.0%) |
| Total | 127 (100.0%) | 62 (100.0%) |
Physical Housing Characteristics in South Bethlehem borough
Housing Structures in South Bethlehem borough
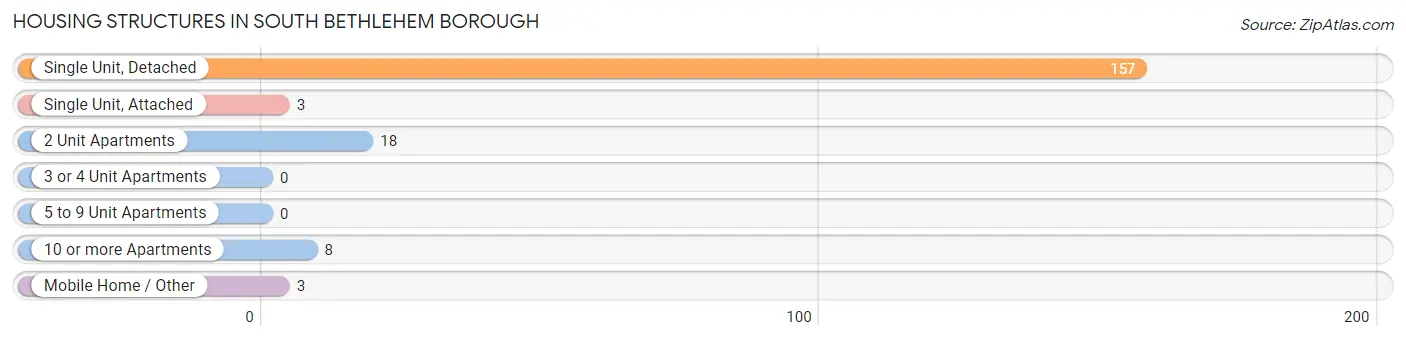
| Structure Type | # Housing Units | % Housing Units |
| Single Unit, Detached | 157 | 83.1% |
| Single Unit, Attached | 3 | 1.6% |
| 2 Unit Apartments | 18 | 9.5% |
| 3 or 4 Unit Apartments | 0 | 0.0% |
| 5 to 9 Unit Apartments | 0 | 0.0% |
| 10 or more Apartments | 8 | 4.2% |
| Mobile Home / Other | 3 | 1.6% |
| Total | 189 | 100.0% |
Housing Structures by Occupancy in South Bethlehem borough
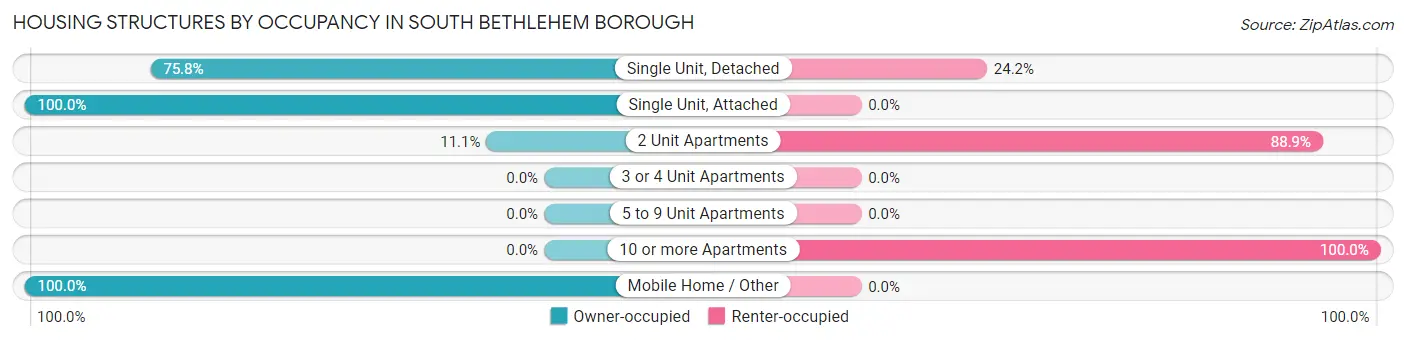
| Structure Type | Owner-occupied | Renter-occupied |
| Single Unit, Detached | 119 (75.8%) | 38 (24.2%) |
| Single Unit, Attached | 3 (100.0%) | 0 (0.0%) |
| 2 Unit Apartments | 2 (11.1%) | 16 (88.9%) |
| 3 or 4 Unit Apartments | 0 (0.0%) | 0 (0.0%) |
| 5 to 9 Unit Apartments | 0 (0.0%) | 0 (0.0%) |
| 10 or more Apartments | 0 (0.0%) | 8 (100.0%) |
| Mobile Home / Other | 3 (100.0%) | 0 (0.0%) |
| Total | 127 (67.2%) | 62 (32.8%) |
Housing Structures by Number of Rooms in South Bethlehem borough
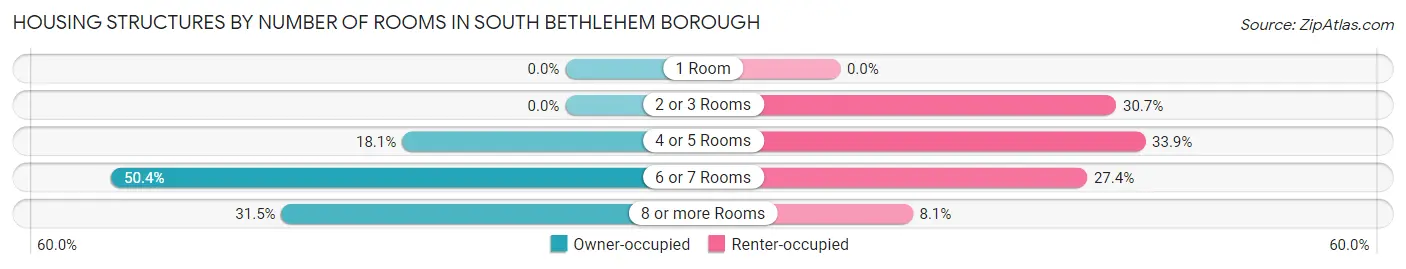
| Number of Rooms | Owner-occupied | Renter-occupied |
| 1 Room | 0 (0.0%) | 0 (0.0%) |
| 2 or 3 Rooms | 0 (0.0%) | 19 (30.6%) |
| 4 or 5 Rooms | 23 (18.1%) | 21 (33.9%) |
| 6 or 7 Rooms | 64 (50.4%) | 17 (27.4%) |
| 8 or more Rooms | 40 (31.5%) | 5 (8.1%) |
| Total | 127 (100.0%) | 62 (100.0%) |
Housing Structure by Heating Type in South Bethlehem borough
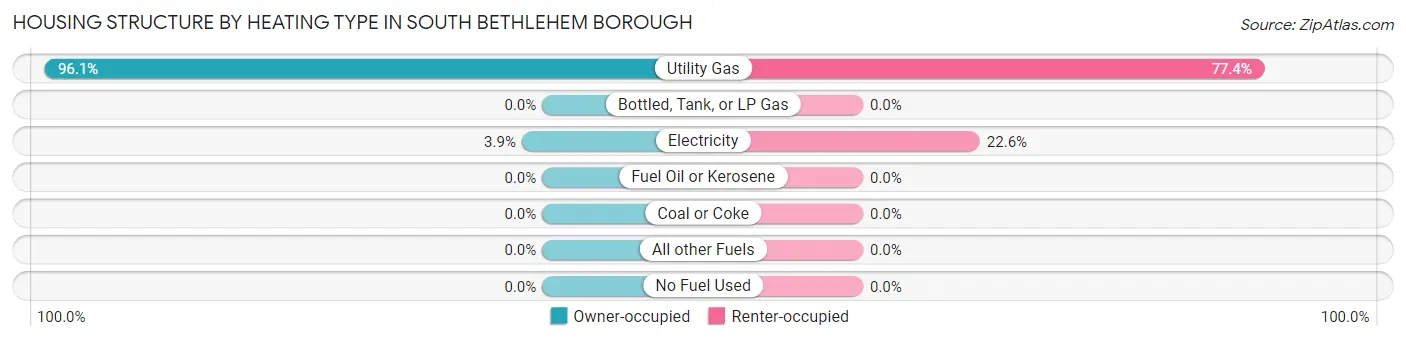
| Heating Type | Owner-occupied | Renter-occupied |
| Utility Gas | 122 (96.1%) | 48 (77.4%) |
| Bottled, Tank, or LP Gas | 0 (0.0%) | 0 (0.0%) |
| Electricity | 5 (3.9%) | 14 (22.6%) |
| Fuel Oil or Kerosene | 0 (0.0%) | 0 (0.0%) |
| Coal or Coke | 0 (0.0%) | 0 (0.0%) |
| All other Fuels | 0 (0.0%) | 0 (0.0%) |
| No Fuel Used | 0 (0.0%) | 0 (0.0%) |
| Total | 127 (100.0%) | 62 (100.0%) |
Household Vehicle Usage in South Bethlehem borough
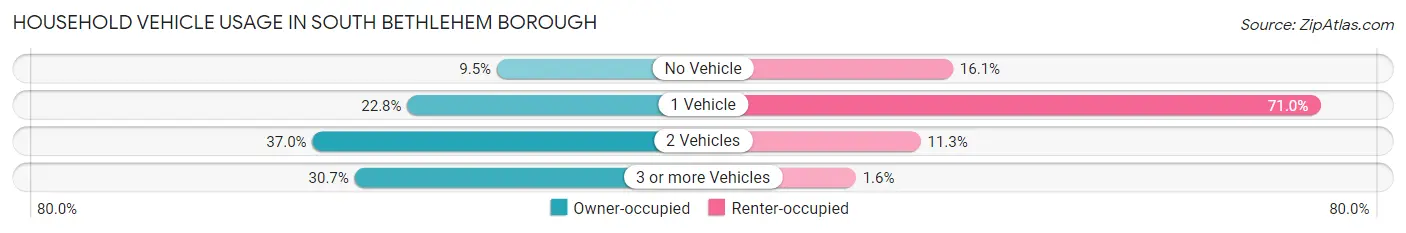
| Vehicles per Household | Owner-occupied | Renter-occupied |
| No Vehicle | 12 (9.5%) | 10 (16.1%) |
| 1 Vehicle | 29 (22.8%) | 44 (71.0%) |
| 2 Vehicles | 47 (37.0%) | 7 (11.3%) |
| 3 or more Vehicles | 39 (30.7%) | 1 (1.6%) |
| Total | 127 (100.0%) | 62 (100.0%) |
Real Estate & Mortgages in South Bethlehem borough
Real Estate and Mortgage Overview in South Bethlehem borough
| Characteristic | Without Mortgage | With Mortgage |
| Housing Units | 60 | 67 |
| Median Property Value | $125,000 | $88,900 |
| Median Household Income | $40,000 | $12 |
| Monthly Housing Costs | $489 | $0 |
| Real Estate Taxes | $1,367 | $3 |
Property Value by Mortgage Status in South Bethlehem borough
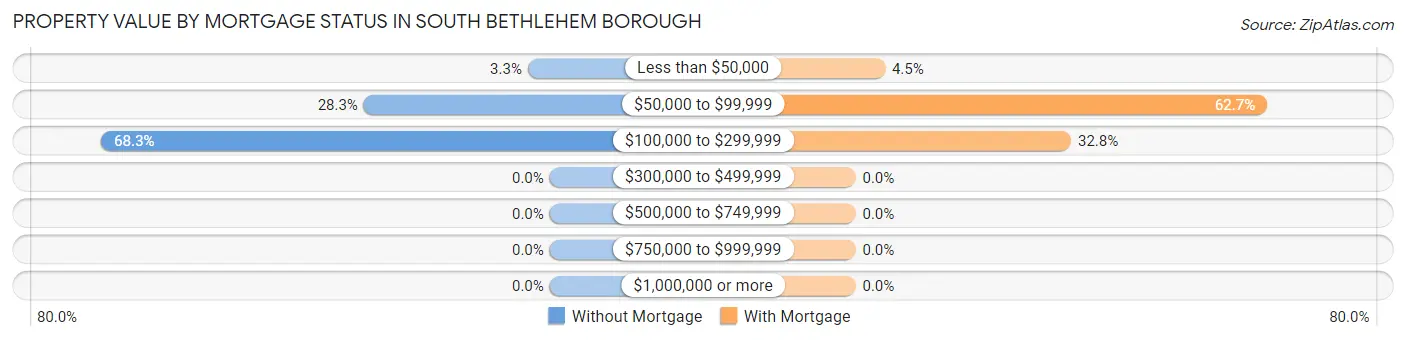
| Property Value | Without Mortgage | With Mortgage |
| Less than $50,000 | 2 (3.3%) | 3 (4.5%) |
| $50,000 to $99,999 | 17 (28.3%) | 42 (62.7%) |
| $100,000 to $299,999 | 41 (68.3%) | 22 (32.8%) |
| $300,000 to $499,999 | 0 (0.0%) | 0 (0.0%) |
| $500,000 to $749,999 | 0 (0.0%) | 0 (0.0%) |
| $750,000 to $999,999 | 0 (0.0%) | 0 (0.0%) |
| $1,000,000 or more | 0 (0.0%) | 0 (0.0%) |
| Total | 60 (100.0%) | 67 (100.0%) |
Household Income by Mortgage Status in South Bethlehem borough
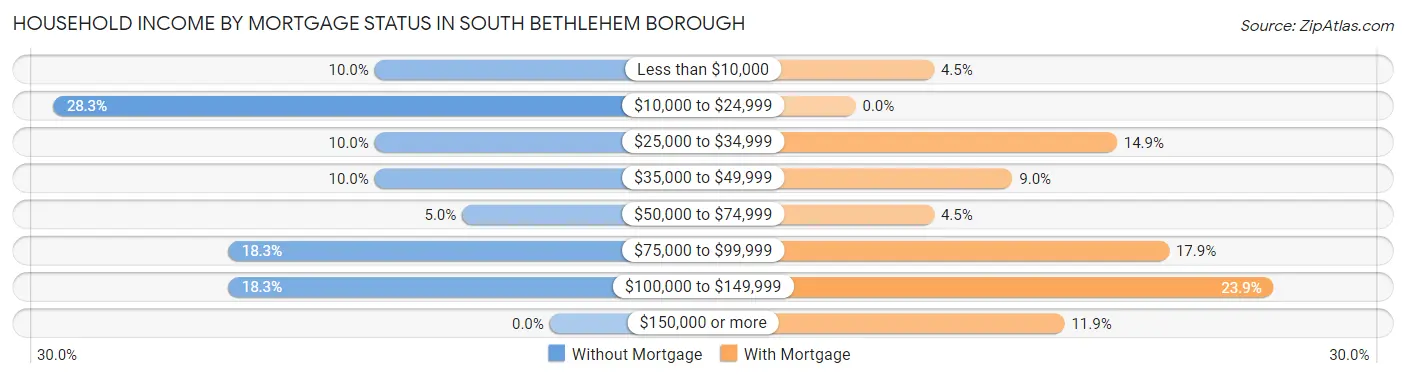
| Household Income | Without Mortgage | With Mortgage |
| Less than $10,000 | 6 (10.0%) | 3 (4.5%) |
| $10,000 to $24,999 | 17 (28.3%) | 0 (0.0%) |
| $25,000 to $34,999 | 6 (10.0%) | 10 (14.9%) |
| $35,000 to $49,999 | 6 (10.0%) | 6 (9.0%) |
| $50,000 to $74,999 | 3 (5.0%) | 3 (4.5%) |
| $75,000 to $99,999 | 11 (18.3%) | 12 (17.9%) |
| $100,000 to $149,999 | 11 (18.3%) | 16 (23.9%) |
| $150,000 or more | 0 (0.0%) | 8 (11.9%) |
| Total | 60 (100.0%) | 67 (100.0%) |
Property Value to Household Income Ratio in South Bethlehem borough
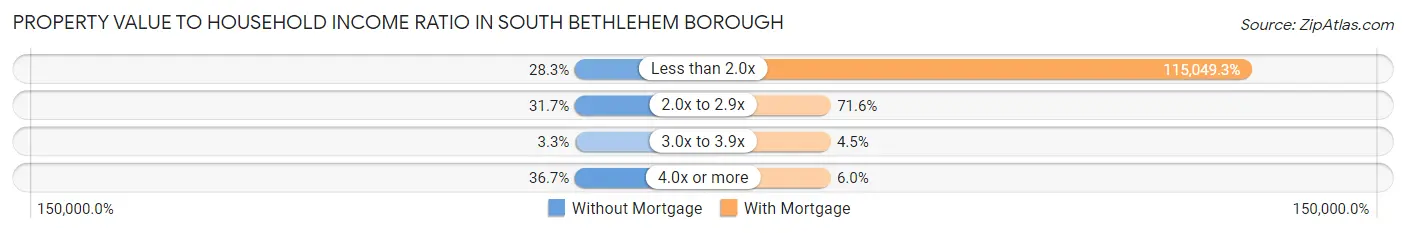
| Value-to-Income Ratio | Without Mortgage | With Mortgage |
| Less than 2.0x | 17 (28.3%) | 77,083 (115,049.3%) |
| 2.0x to 2.9x | 19 (31.7%) | 48 (71.6%) |
| 3.0x to 3.9x | 2 (3.3%) | 3 (4.5%) |
| 4.0x or more | 22 (36.7%) | 4 (6.0%) |
| Total | 60 (100.0%) | 67 (100.0%) |
Real Estate Taxes by Mortgage Status in South Bethlehem borough
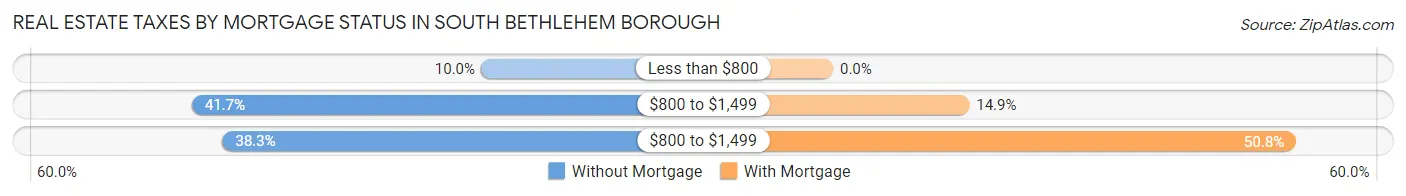
| Property Taxes | Without Mortgage | With Mortgage |
| Less than $800 | 6 (10.0%) | 0 (0.0%) |
| $800 to $1,499 | 25 (41.7%) | 10 (14.9%) |
| $800 to $1,499 | 23 (38.3%) | 34 (50.7%) |
| Total | 60 (100.0%) | 67 (100.0%) |
Health & Disability in South Bethlehem borough
Health Insurance Coverage by Age in South Bethlehem borough
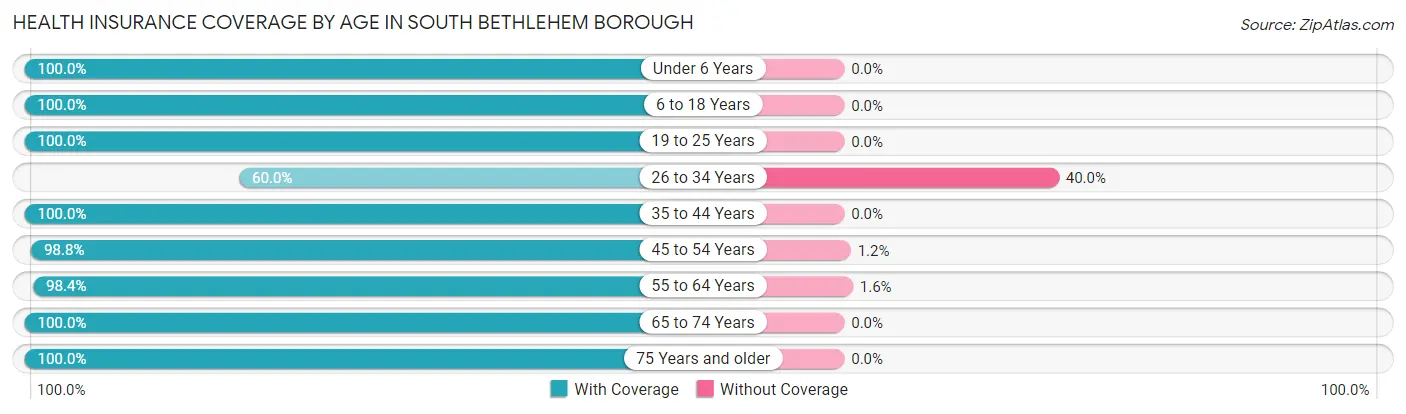
| Age Bracket | With Coverage | Without Coverage |
| Under 6 Years | 19 (100.0%) | 0 (0.0%) |
| 6 to 18 Years | 47 (100.0%) | 0 (0.0%) |
| 19 to 25 Years | 15 (100.0%) | 0 (0.0%) |
| 26 to 34 Years | 24 (60.0%) | 16 (40.0%) |
| 35 to 44 Years | 30 (100.0%) | 0 (0.0%) |
| 45 to 54 Years | 82 (98.8%) | 1 (1.2%) |
| 55 to 64 Years | 62 (98.4%) | 1 (1.6%) |
| 65 to 74 Years | 40 (100.0%) | 0 (0.0%) |
| 75 Years and older | 42 (100.0%) | 0 (0.0%) |
| Total | 361 (95.3%) | 18 (4.8%) |
Health Insurance Coverage by Citizenship Status in South Bethlehem borough
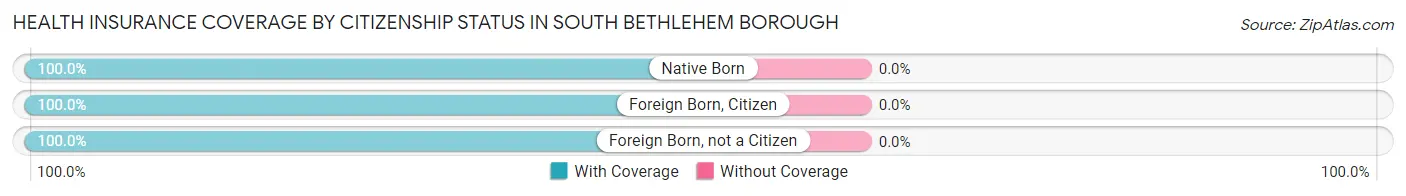
| Citizenship Status | With Coverage | Without Coverage |
| Native Born | 19 (100.0%) | 0 (0.0%) |
| Foreign Born, Citizen | 47 (100.0%) | 0 (0.0%) |
| Foreign Born, not a Citizen | 15 (100.0%) | 0 (0.0%) |
Health Insurance Coverage by Household Income in South Bethlehem borough
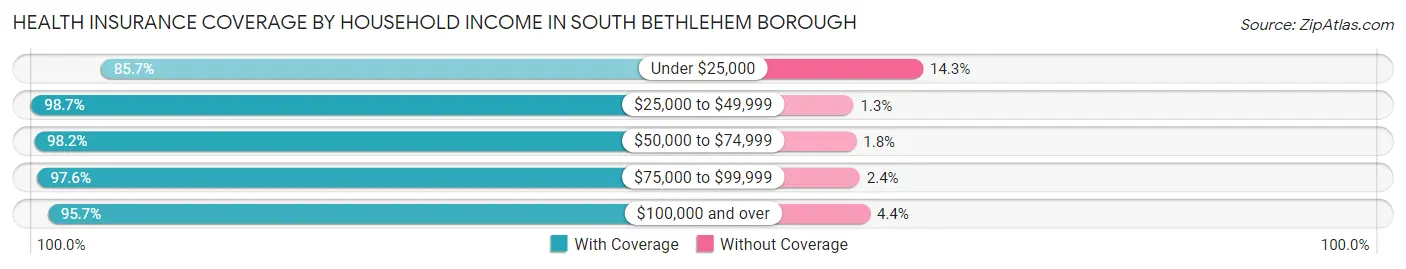
| Household Income | With Coverage | Without Coverage |
| Under $25,000 | 60 (85.7%) | 10 (14.3%) |
| $25,000 to $49,999 | 78 (98.7%) | 1 (1.3%) |
| $50,000 to $74,999 | 55 (98.2%) | 1 (1.8%) |
| $75,000 to $99,999 | 80 (97.6%) | 2 (2.4%) |
| $100,000 and over | 88 (95.7%) | 4 (4.3%) |
Public vs Private Health Insurance Coverage by Age in South Bethlehem borough
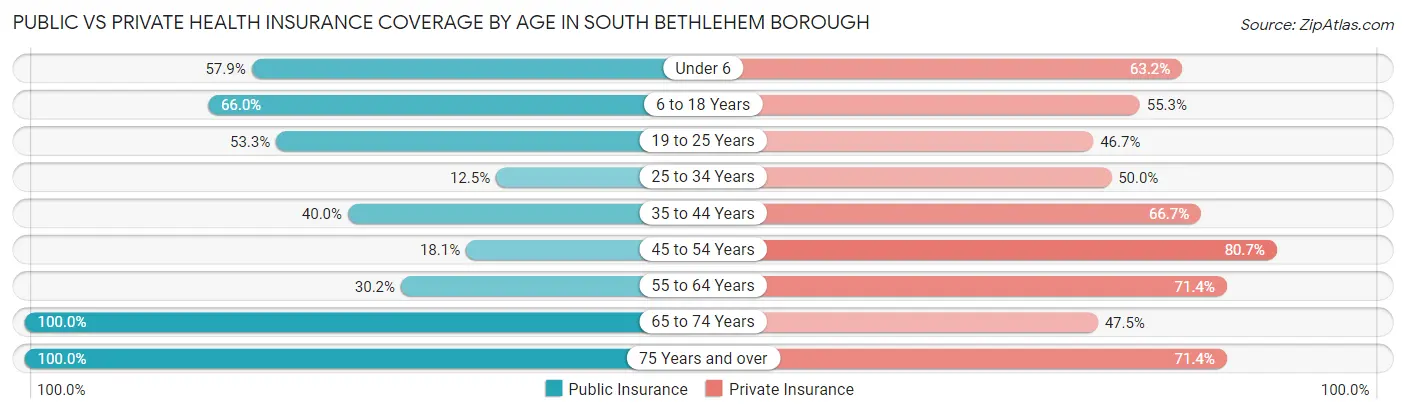
| Age Bracket | Public Insurance | Private Insurance |
| Under 6 | 11 (57.9%) | 12 (63.2%) |
| 6 to 18 Years | 31 (66.0%) | 26 (55.3%) |
| 19 to 25 Years | 8 (53.3%) | 7 (46.7%) |
| 25 to 34 Years | 5 (12.5%) | 20 (50.0%) |
| 35 to 44 Years | 12 (40.0%) | 20 (66.7%) |
| 45 to 54 Years | 15 (18.1%) | 67 (80.7%) |
| 55 to 64 Years | 19 (30.2%) | 45 (71.4%) |
| 65 to 74 Years | 40 (100.0%) | 19 (47.5%) |
| 75 Years and over | 42 (100.0%) | 30 (71.4%) |
| Total | 183 (48.3%) | 246 (64.9%) |
Disability Status by Sex by Age in South Bethlehem borough
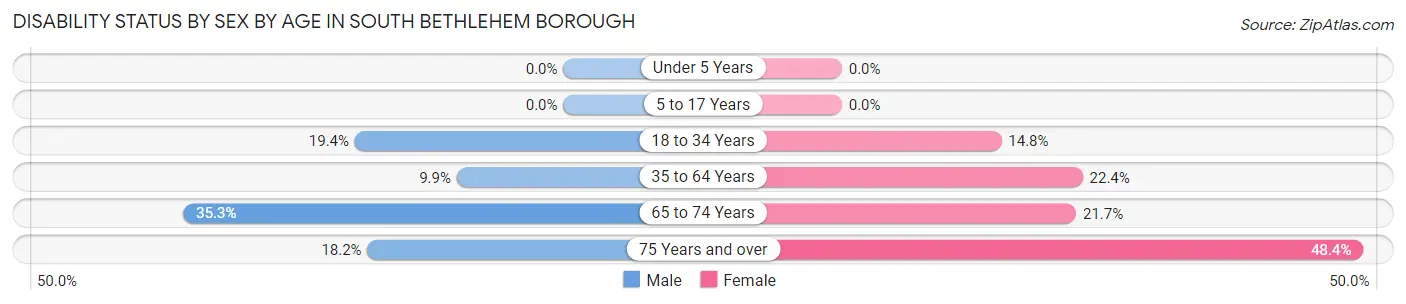
| Age Bracket | Male | Female |
| Under 5 Years | 0 (0.0%) | 0 (0.0%) |
| 5 to 17 Years | 0 (0.0%) | 0 (0.0%) |
| 18 to 34 Years | 6 (19.4%) | 4 (14.8%) |
| 35 to 64 Years | 9 (9.9%) | 19 (22.4%) |
| 65 to 74 Years | 6 (35.3%) | 5 (21.7%) |
| 75 Years and over | 2 (18.2%) | 15 (48.4%) |
Disability Class by Sex by Age in South Bethlehem borough
Disability Class: Hearing Difficulty
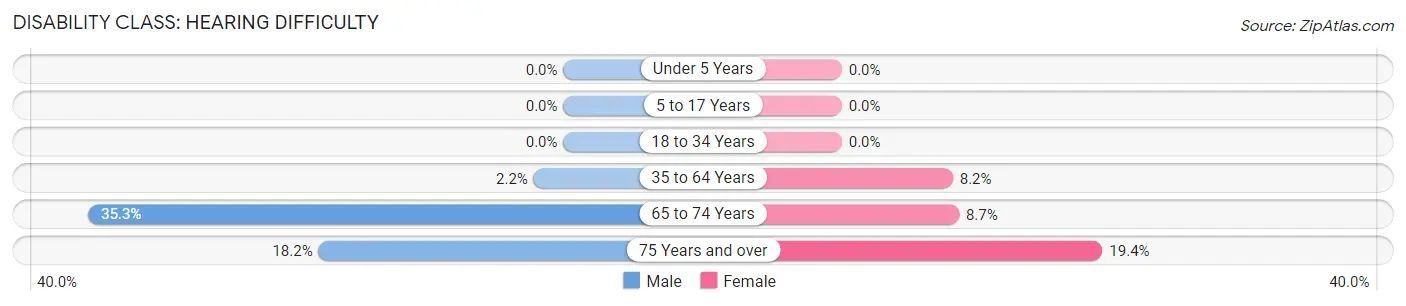
| Age Bracket | Male | Female |
| Under 5 Years | 0 (0.0%) | 0 (0.0%) |
| 5 to 17 Years | 0 (0.0%) | 0 (0.0%) |
| 18 to 34 Years | 0 (0.0%) | 0 (0.0%) |
| 35 to 64 Years | 2 (2.2%) | 7 (8.2%) |
| 65 to 74 Years | 6 (35.3%) | 2 (8.7%) |
| 75 Years and over | 2 (18.2%) | 6 (19.4%) |
Disability Class: Vision Difficulty
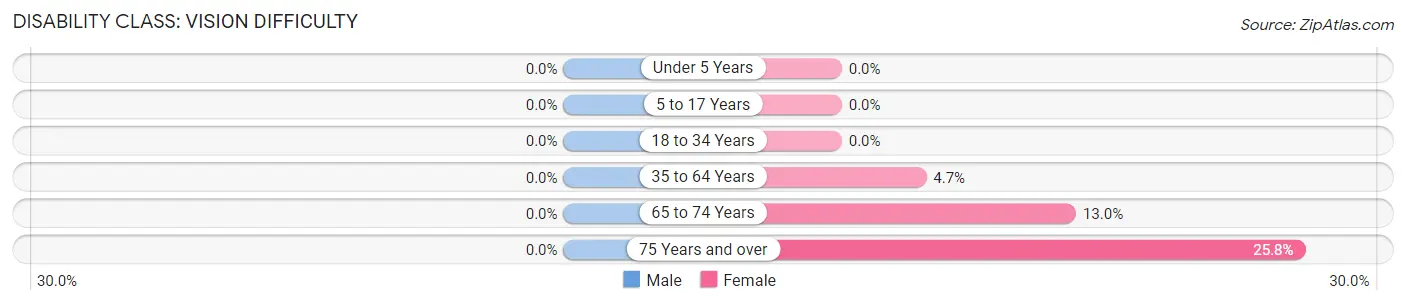
| Age Bracket | Male | Female |
| Under 5 Years | 0 (0.0%) | 0 (0.0%) |
| 5 to 17 Years | 0 (0.0%) | 0 (0.0%) |
| 18 to 34 Years | 0 (0.0%) | 0 (0.0%) |
| 35 to 64 Years | 0 (0.0%) | 4 (4.7%) |
| 65 to 74 Years | 0 (0.0%) | 3 (13.0%) |
| 75 Years and over | 0 (0.0%) | 8 (25.8%) |
Disability Class: Cognitive Difficulty
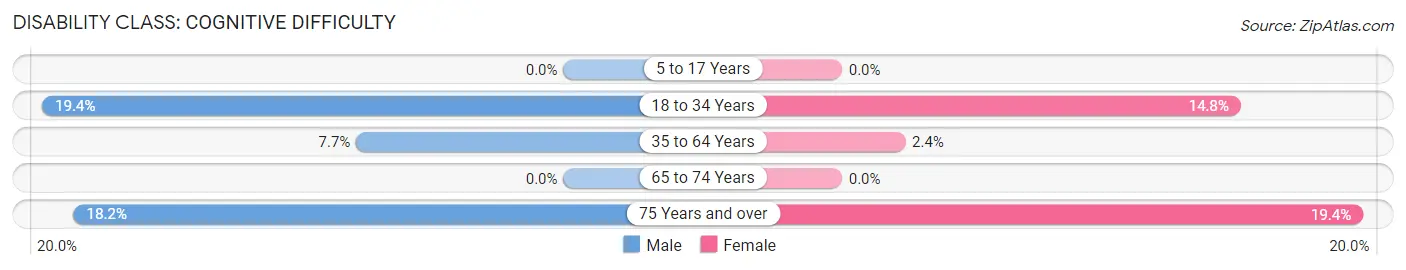
| Age Bracket | Male | Female |
| 5 to 17 Years | 0 (0.0%) | 0 (0.0%) |
| 18 to 34 Years | 6 (19.4%) | 4 (14.8%) |
| 35 to 64 Years | 7 (7.7%) | 2 (2.4%) |
| 65 to 74 Years | 0 (0.0%) | 0 (0.0%) |
| 75 Years and over | 2 (18.2%) | 6 (19.4%) |
Disability Class: Ambulatory Difficulty
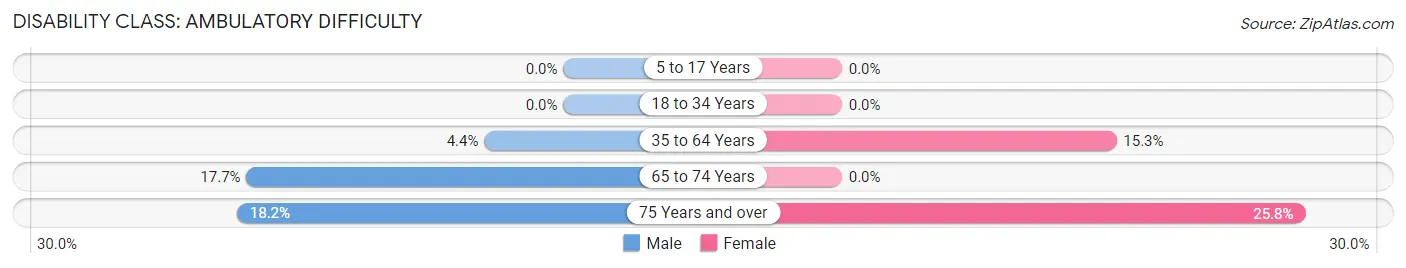
| Age Bracket | Male | Female |
| 5 to 17 Years | 0 (0.0%) | 0 (0.0%) |
| 18 to 34 Years | 0 (0.0%) | 0 (0.0%) |
| 35 to 64 Years | 4 (4.4%) | 13 (15.3%) |
| 65 to 74 Years | 3 (17.6%) | 0 (0.0%) |
| 75 Years and over | 2 (18.2%) | 8 (25.8%) |
Disability Class: Self-Care Difficulty
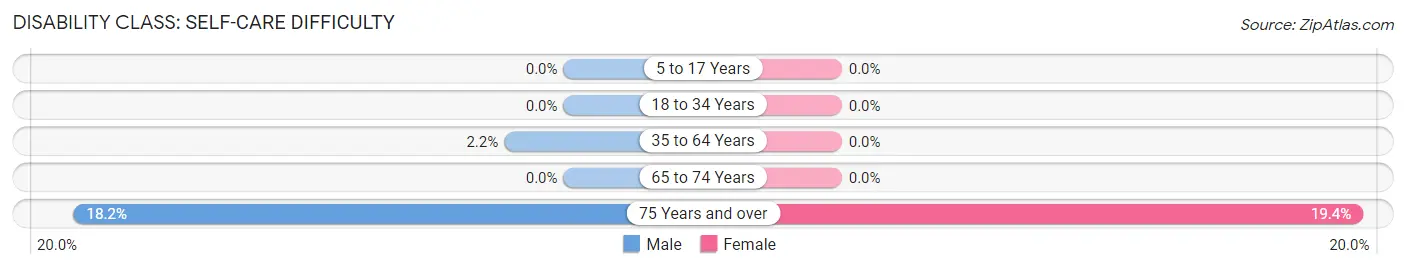
| Age Bracket | Male | Female |
| 5 to 17 Years | 0 (0.0%) | 0 (0.0%) |
| 18 to 34 Years | 0 (0.0%) | 0 (0.0%) |
| 35 to 64 Years | 2 (2.2%) | 0 (0.0%) |
| 65 to 74 Years | 0 (0.0%) | 0 (0.0%) |
| 75 Years and over | 2 (18.2%) | 6 (19.4%) |
Technology Access in South Bethlehem borough
Computing Device Access in South Bethlehem borough
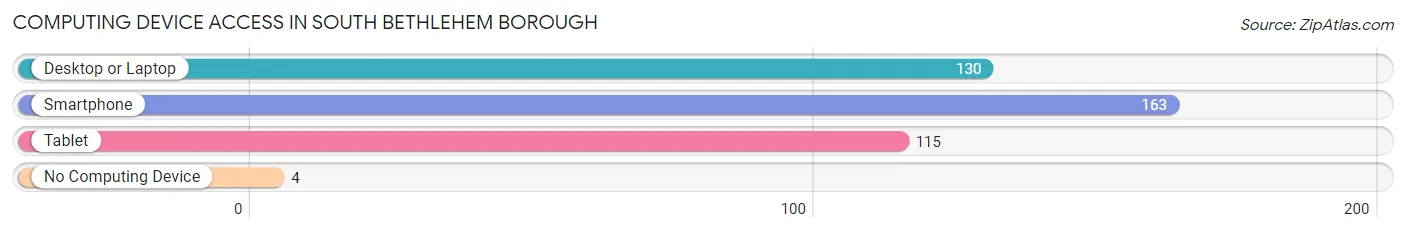
| Device Type | # Households | % Households |
| Desktop or Laptop | 130 | 68.8% |
| Smartphone | 163 | 86.2% |
| Tablet | 115 | 60.9% |
| No Computing Device | 4 | 2.1% |
| Total | 189 | 100.0% |
Internet Access in South Bethlehem borough
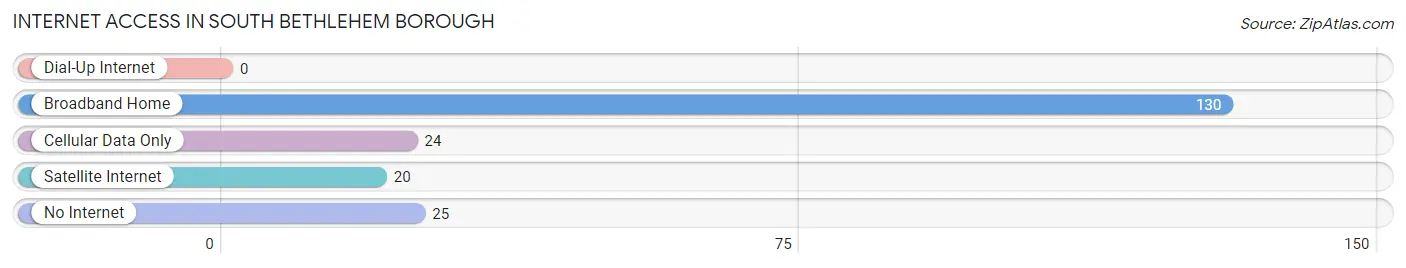
| Internet Type | # Households | % Households |
| Dial-Up Internet | 0 | 0.0% |
| Broadband Home | 130 | 68.8% |
| Cellular Data Only | 24 | 12.7% |
| Satellite Internet | 20 | 10.6% |
| No Internet | 25 | 13.2% |
| Total | 189 | 100.0% |
South Bethlehem borough Summary
South Bethlehem Borough is a small borough located in Northampton County, Pennsylvania. It is situated in the Lehigh Valley region of the state, and is part of the Allentown-Bethlehem-Easton metropolitan area. The borough has a population of approximately 2,500 people, and is home to a variety of businesses, including a number of small manufacturing companies.
History
South Bethlehem was first settled in the late 1700s by German immigrants. The area was originally known as “The Forks” due to its location at the confluence of the Lehigh and Delaware Rivers. In 1845, the area was incorporated as a borough, and was named South Bethlehem in honor of the nearby city of Bethlehem.
In the late 19th century, South Bethlehem experienced a period of rapid growth and development. The borough was home to a number of factories and mills, and was a major center of the iron and steel industry. The Bethlehem Steel Corporation, which was founded in the borough in 1904, was one of the largest steel producers in the world.
In the early 20th century, South Bethlehem was a major center of the silk industry. The borough was home to a number of silk mills, and was the site of the first silk mill in the United States. The silk industry declined in the mid-20th century, and the borough’s economy shifted to a focus on light manufacturing and services.
Geography
South Bethlehem is located in Northampton County, Pennsylvania. It is situated in the Lehigh Valley region of the state, and is part of the Allentown-Bethlehem-Easton metropolitan area. The borough is located on the east bank of the Lehigh River, and is bordered by the city of Bethlehem to the north, Freemansburg to the east, and Lower Saucon Township to the south and west.
The borough has a total area of 0.8 square miles, all of which is land. The terrain of the borough is mostly flat, with some rolling hills in the northern part of the borough. The borough is located in the humid continental climate zone, and has four distinct seasons.
Economy
South Bethlehem’s economy is largely based on light manufacturing and services. The borough is home to a number of small manufacturing companies, including a number of metalworking and plastics companies. The borough is also home to a number of retail stores, restaurants, and other businesses.
The borough is also home to a number of educational institutions, including Moravian College and Lehigh University. The borough is also home to a number of healthcare facilities, including St. Luke’s University Hospital and Lehigh Valley Hospital.
Demographics
As of the 2010 census, South Bethlehem had a population of 2,521 people. The racial makeup of the borough was 87.3% White, 5.2% African American, 0.3% Native American, 2.2% Asian, 0.1% Pacific Islander, and 4.9% from other races. Hispanic or Latino of any race were 8.2% of the population.
The median household income in South Bethlehem was $41,944, and the median family income was $50,938. The per capita income in the borough was $20,945. About 8.3% of families and 11.2% of the population were below the poverty line.
Common Questions
What is Per Capita Income in South Bethlehem borough?
Per Capita income in South Bethlehem borough is $28,955.
What is the Median Family Income in South Bethlehem borough?
Median Family Income in South Bethlehem borough is $76,094.
What is the Median Household income in South Bethlehem borough?
Median Household Income in South Bethlehem borough is $40,313.
What is Income or Wage Gap in South Bethlehem borough?
Income or Wage Gap in South Bethlehem borough is 29.5%.
Women in South Bethlehem borough earn 70.5 cents for every dollar earned by a man.
What is Family Income Deficit in South Bethlehem borough?
Family Income Deficit in South Bethlehem borough is $6,922.
Families that are below poverty line in South Bethlehem borough earn $6,922 less on average than the poverty threshold level.
What is Inequality or Gini Index in South Bethlehem borough?
Inequality or Gini Index in South Bethlehem borough is 0.43.
What is the Total Population of South Bethlehem borough?
Total Population of South Bethlehem borough is 379.
What is the Total Male Population of South Bethlehem borough?
Total Male Population of South Bethlehem borough is 176.
What is the Total Female Population of South Bethlehem borough?
Total Female Population of South Bethlehem borough is 203.
What is the Ratio of Males per 100 Females in South Bethlehem borough?
There are 86.70 Males per 100 Females in South Bethlehem borough.
What is the Ratio of Females per 100 Males in South Bethlehem borough?
There are 115.34 Females per 100 Males in South Bethlehem borough.
What is the Median Population Age in South Bethlehem borough?
Median Population Age in South Bethlehem borough is 50.0 Years.
What is the Average Family Size in South Bethlehem borough
Average Family Size in South Bethlehem borough is 2.9 People.
What is the Average Household Size in South Bethlehem borough
Average Household Size in South Bethlehem borough is 2.0 People.
How Large is the Labor Force in South Bethlehem borough?
There are 187 People in the Labor Forcein in South Bethlehem borough.
What is the Percentage of People in the Labor Force in South Bethlehem borough?
57.7% of People are in the Labor Force in South Bethlehem borough.
What is the Unemployment Rate in South Bethlehem borough?
Unemployment Rate in South Bethlehem borough is 1.6%.