Lawrence Park, PA Map & Demographics
Lawrence Park Map
Lawrence Park Overview
$30,059
PER CAPITA INCOME
$69,057
AVG FAMILY INCOME
$64,375
AVG HOUSEHOLD INCOME
34.5%
WAGE / INCOME GAP [ % ]
65.5¢/ $1
WAGE / INCOME GAP [ $ ]
0.38
INEQUALITY / GINI INDEX
3,818
TOTAL POPULATION
1,685
MALE POPULATION
2,133
FEMALE POPULATION
79.00
MALES / 100 FEMALES
126.59
FEMALES / 100 MALES
36.5
MEDIAN AGE
2.9
AVG FAMILY SIZE
2.5
AVG HOUSEHOLD SIZE
1,814
LABOR FORCE [ PEOPLE ]
66.8%
PERCENT IN LABOR FORCE
1.9%
UNEMPLOYMENT RATE
Income in Lawrence Park
Income Overview in Lawrence Park
Per Capita Income in Lawrence Park is $30,059, while median incomes of families and households are $69,057 and $64,375 respectively.
| Characteristic | Number | Measure |
| Per Capita Income | 3,818 | $30,059 |
| Median Family Income | 1,028 | $69,057 |
| Mean Family Income | 1,028 | $81,705 |
| Median Household Income | 1,497 | $64,375 |
| Mean Household Income | 1,497 | $74,601 |
| Income Deficit | 1,028 | $0 |
| Wage / Income Gap (%) | 3,818 | 34.46% |
| Wage / Income Gap ($) | 3,818 | 65.54¢ per $1 |
| Gini / Inequality Index | 3,818 | 0.38 |
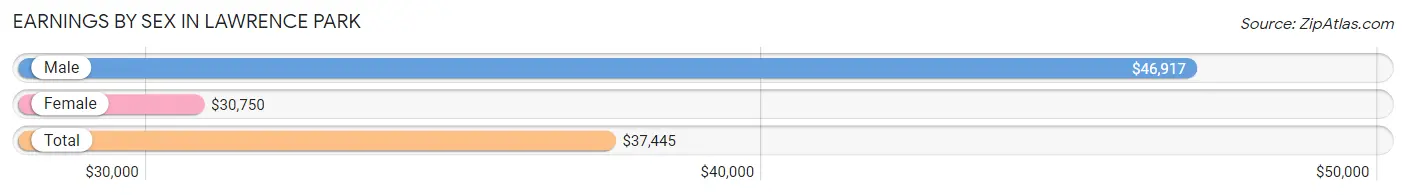
Earnings by Sex in Lawrence Park
Average Earnings in Lawrence Park are $37,445, $46,917 for men and $30,750 for women, a difference of 34.5%.
| Sex | Number | Average Earnings |
| Male | 924 (47.0%) | $46,917 |
| Female | 1,042 (53.0%) | $30,750 |
| Total | 1,966 (100.0%) | $37,445 |
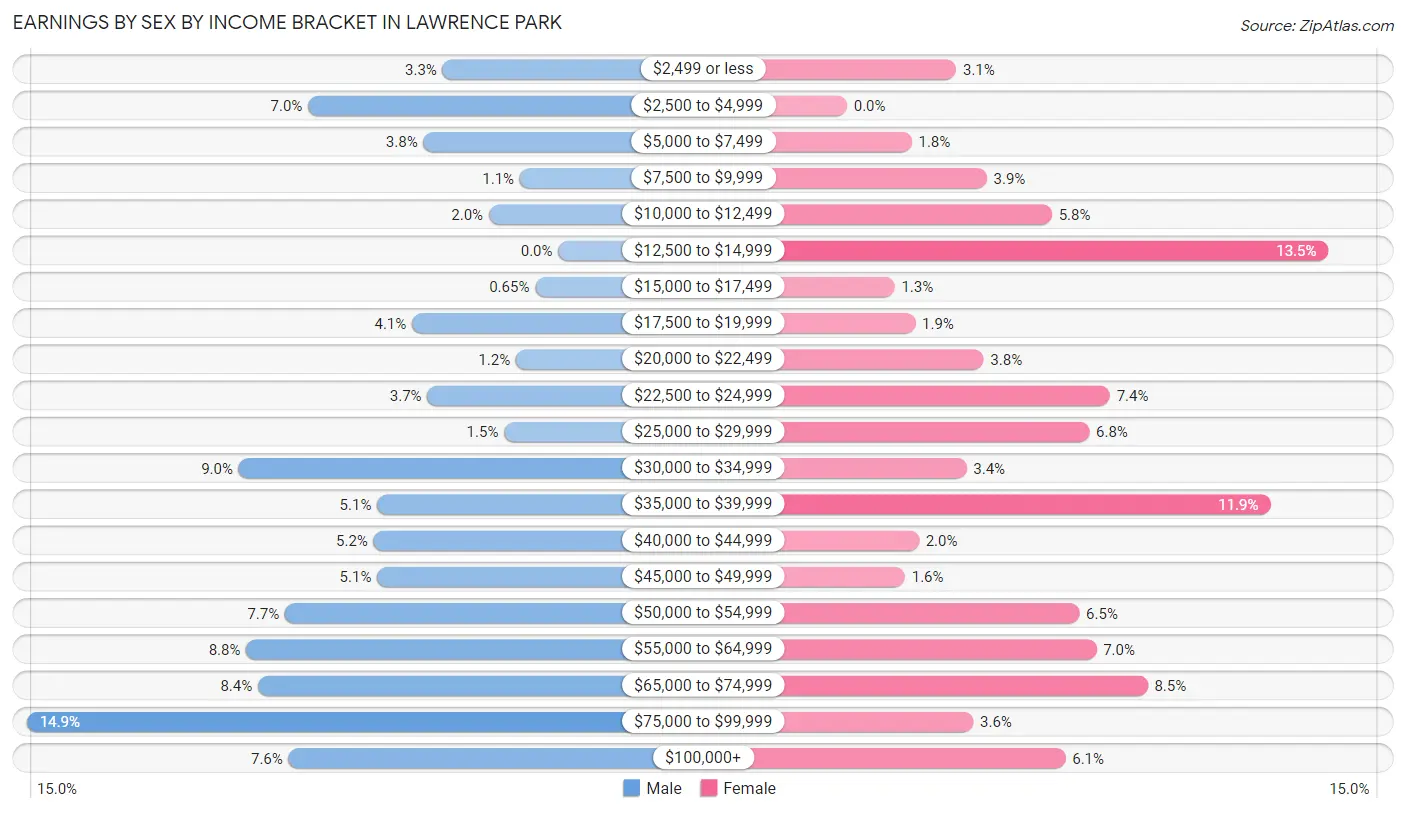
Earnings by Sex by Income Bracket in Lawrence Park
The most common earnings brackets in Lawrence Park are $75,000 to $99,999 for men (138 | 14.9%) and $12,500 to $14,999 for women (141 | 13.5%).
| Income | Male | Female |
| $2,499 or less | 30 (3.3%) | 32 (3.1%) |
| $2,500 to $4,999 | 65 (7.0%) | 0 (0.0%) |
| $5,000 to $7,499 | 35 (3.8%) | 19 (1.8%) |
| $7,500 to $9,999 | 10 (1.1%) | 41 (3.9%) |
| $10,000 to $12,499 | 18 (1.9%) | 60 (5.8%) |
| $12,500 to $14,999 | 0 (0.0%) | 141 (13.5%) |
| $15,000 to $17,499 | 6 (0.6%) | 14 (1.3%) |
| $17,500 to $19,999 | 38 (4.1%) | 20 (1.9%) |
| $20,000 to $22,499 | 11 (1.2%) | 40 (3.8%) |
| $22,500 to $24,999 | 34 (3.7%) | 77 (7.4%) |
| $25,000 to $29,999 | 14 (1.5%) | 71 (6.8%) |
| $30,000 to $34,999 | 83 (9.0%) | 35 (3.4%) |
| $35,000 to $39,999 | 47 (5.1%) | 124 (11.9%) |
| $40,000 to $44,999 | 48 (5.2%) | 21 (2.0%) |
| $45,000 to $49,999 | 47 (5.1%) | 17 (1.6%) |
| $50,000 to $54,999 | 71 (7.7%) | 68 (6.5%) |
| $55,000 to $64,999 | 81 (8.8%) | 73 (7.0%) |
| $65,000 to $74,999 | 78 (8.4%) | 88 (8.5%) |
| $75,000 to $99,999 | 138 (14.9%) | 37 (3.5%) |
| $100,000+ | 70 (7.6%) | 64 (6.1%) |
| Total | 924 (100.0%) | 1,042 (100.0%) |
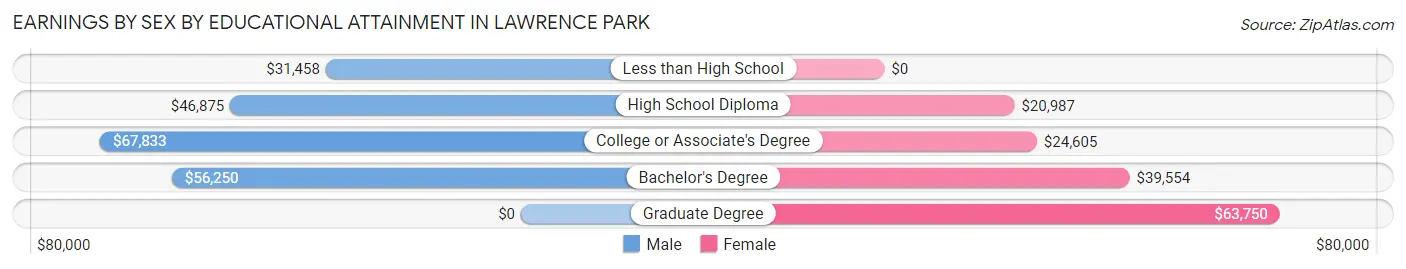
Earnings by Sex by Educational Attainment in Lawrence Park
Average earnings in Lawrence Park are $51,698 for men and $33,500 for women, a difference of 35.2%. Men with an educational attainment of college or associate's degree enjoy the highest average annual earnings of $67,833, while those with less than high school education earn the least with $31,458. Women with an educational attainment of graduate degree earn the most with the average annual earnings of $63,750, while those with high school diploma education have the smallest earnings of $20,987.
| Educational Attainment | Male Income | Female Income |
| Less than High School | $31,458 | $0 |
| High School Diploma | $46,875 | $20,987 |
| College or Associate's Degree | $67,833 | $24,605 |
| Bachelor's Degree | $56,250 | $39,554 |
| Graduate Degree | - | - |
| Total | $51,698 | $33,500 |
Family Income in Lawrence Park
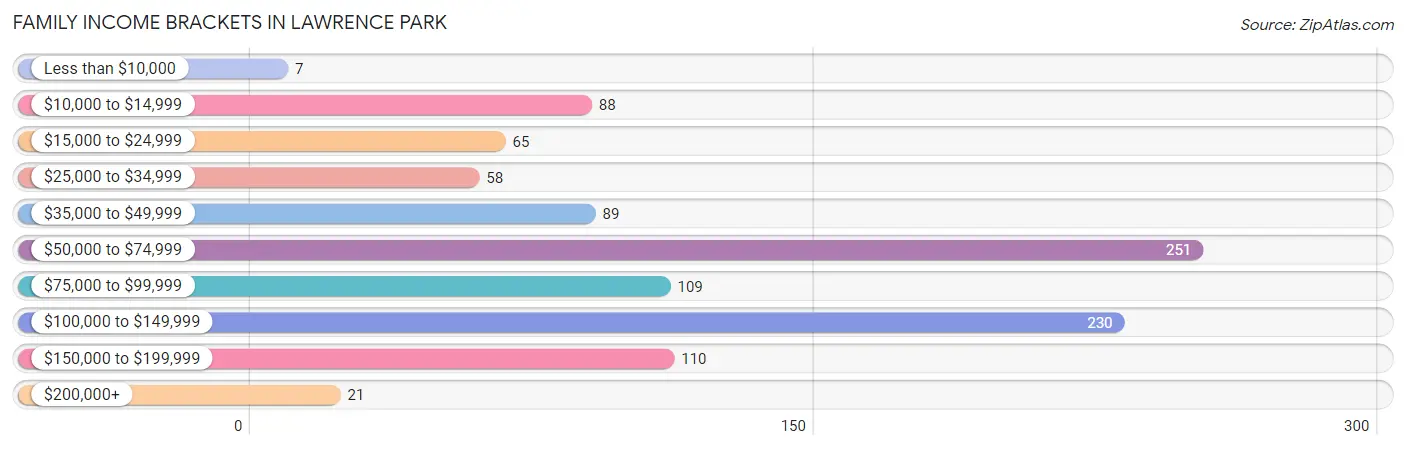
Family Income Brackets in Lawrence Park
According to the Lawrence Park family income data, there are 251 families falling into the $50,000 to $74,999 income range, which is the most common income bracket and makes up 24.4% of all families. Conversely, the less than $10,000 income bracket is the least frequent group with only 7 families (0.7%) belonging to this category.
| Income Bracket | # Families | % Families |
| Less than $10,000 | 7 | 0.7% |
| $10,000 to $14,999 | 88 | 8.6% |
| $15,000 to $24,999 | 65 | 6.3% |
| $25,000 to $34,999 | 58 | 5.6% |
| $35,000 to $49,999 | 89 | 8.7% |
| $50,000 to $74,999 | 251 | 24.4% |
| $75,000 to $99,999 | 109 | 10.6% |
| $100,000 to $149,999 | 230 | 22.4% |
| $150,000 to $199,999 | 110 | 10.7% |
| $200,000+ | 21 | 2.0% |
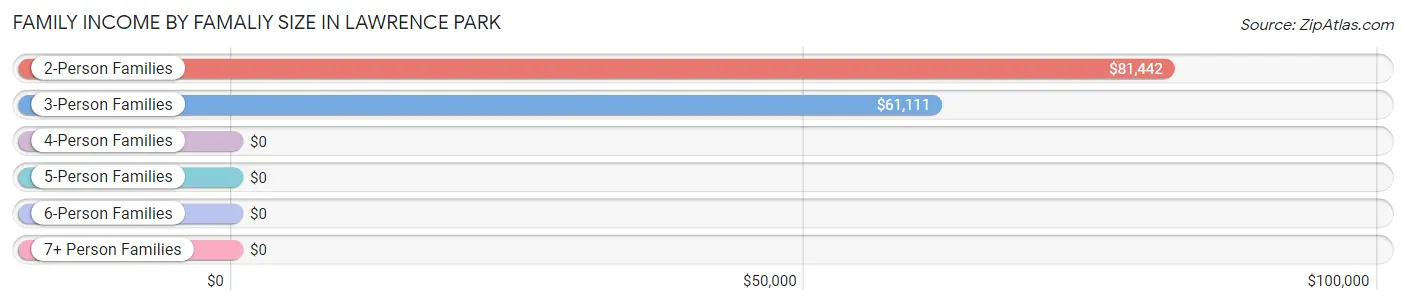
Family Income by Famaliy Size in Lawrence Park
2-person families (531 | 51.6%) account for the highest median family income in Lawrence Park with $81,442 per family, while 2-person families (531 | 51.6%) have the highest median income of $40,721 per family member.
| Income Bracket | # Families | Median Income |
| 2-Person Families | 531 (51.6%) | $81,442 |
| 3-Person Families | 182 (17.7%) | $61,111 |
| 4-Person Families | 277 (27.0%) | $0 |
| 5-Person Families | 35 (3.4%) | $0 |
| 6-Person Families | 3 (0.3%) | $0 |
| 7+ Person Families | 0 (0.0%) | $0 |
| Total | 1,028 (100.0%) | $69,057 |
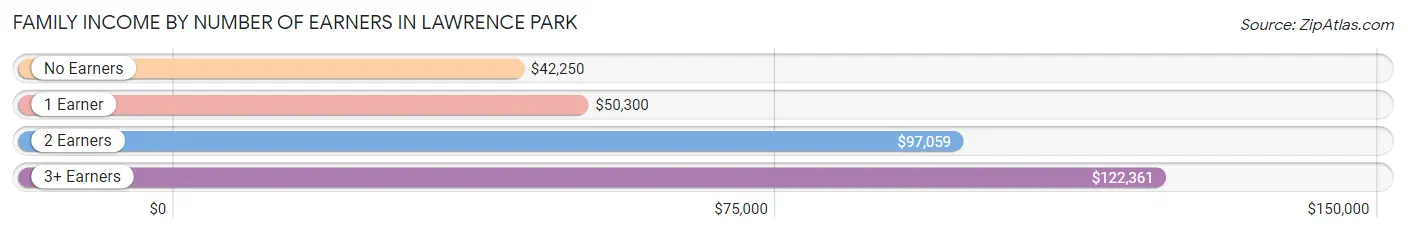
Family Income by Number of Earners in Lawrence Park
The median family income in Lawrence Park is $69,057, with families comprising 3+ earners (43) having the highest median family income of $122,361, while families with no earners (129) have the lowest median family income of $42,250, accounting for 4.2% and 12.6% of families, respectively.
| Number of Earners | # Families | Median Income |
| No Earners | 129 (12.6%) | $42,250 |
| 1 Earner | 408 (39.7%) | $50,300 |
| 2 Earners | 448 (43.6%) | $97,059 |
| 3+ Earners | 43 (4.2%) | $122,361 |
| Total | 1,028 (100.0%) | $69,057 |
Household Income in Lawrence Park
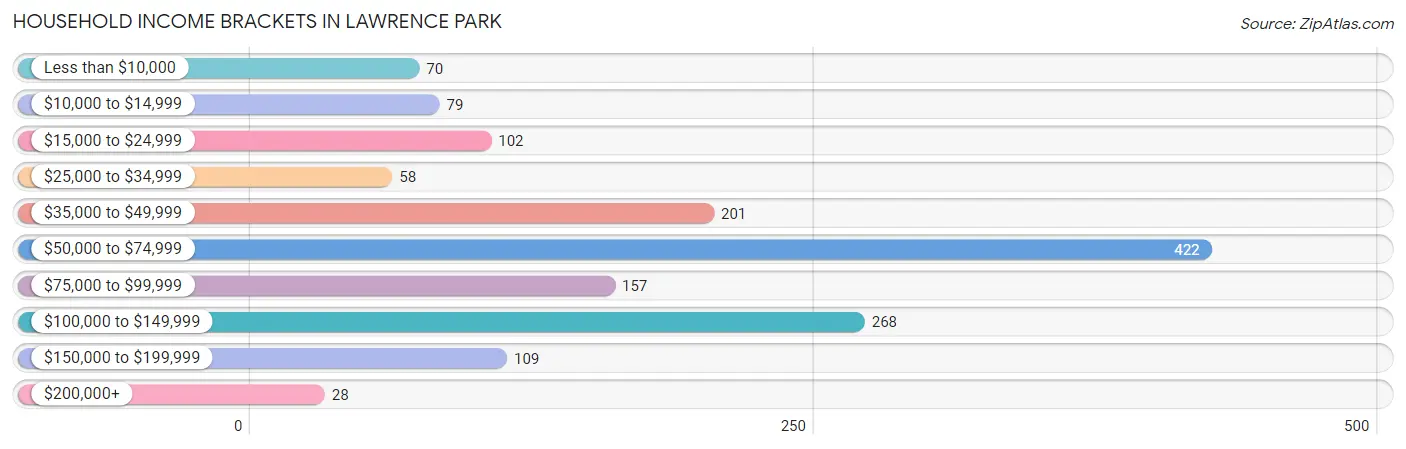
Household Income Brackets in Lawrence Park
With 422 households falling in the category, the $50,000 to $74,999 income range is the most frequent in Lawrence Park, accounting for 28.2% of all households. In contrast, only 28 households (1.9%) fall into the $200,000+ income bracket, making it the least populous group.
| Income Bracket | # Households | % Households |
| Less than $10,000 | 70 | 4.7% |
| $10,000 to $14,999 | 79 | 5.3% |
| $15,000 to $24,999 | 102 | 6.8% |
| $25,000 to $34,999 | 58 | 3.9% |
| $35,000 to $49,999 | 201 | 13.4% |
| $50,000 to $74,999 | 422 | 28.2% |
| $75,000 to $99,999 | 157 | 10.5% |
| $100,000 to $149,999 | 268 | 17.9% |
| $150,000 to $199,999 | 109 | 7.3% |
| $200,000+ | 28 | 1.9% |
Household Income by Householder Age in Lawrence Park
The median household income in Lawrence Park is $64,375, with the highest median household income of $77,708 found in the 45 to 64 years age bracket for the primary householder. A total of 564 households (37.7%) fall into this category. Meanwhile, the 15 to 24 years age bracket for the primary householder has the lowest median household income of $0, with 48 households (3.2%) in this group.
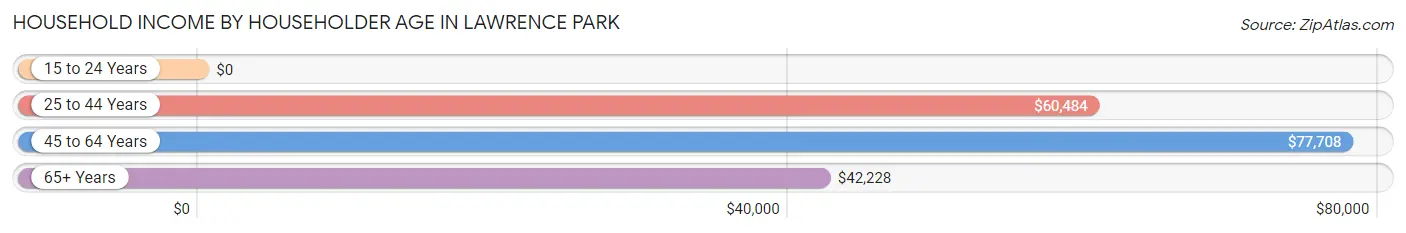
| Income Bracket | # Households | Median Income |
| 15 to 24 Years | 48 (3.2%) | $0 |
| 25 to 44 Years | 560 (37.4%) | $60,484 |
| 45 to 64 Years | 564 (37.7%) | $77,708 |
| 65+ Years | 325 (21.7%) | $42,228 |
| Total | 1,497 (100.0%) | $64,375 |
Poverty in Lawrence Park
Income Below Poverty by Sex and Age in Lawrence Park
With 17.5% poverty level for males and 22.1% for females among the residents of Lawrence Park, 16 and 17 year old males and 6 to 11 year old females are the most vulnerable to poverty, with 18 males (72.0%) and 130 females (60.8%) in their respective age groups living below the poverty level.
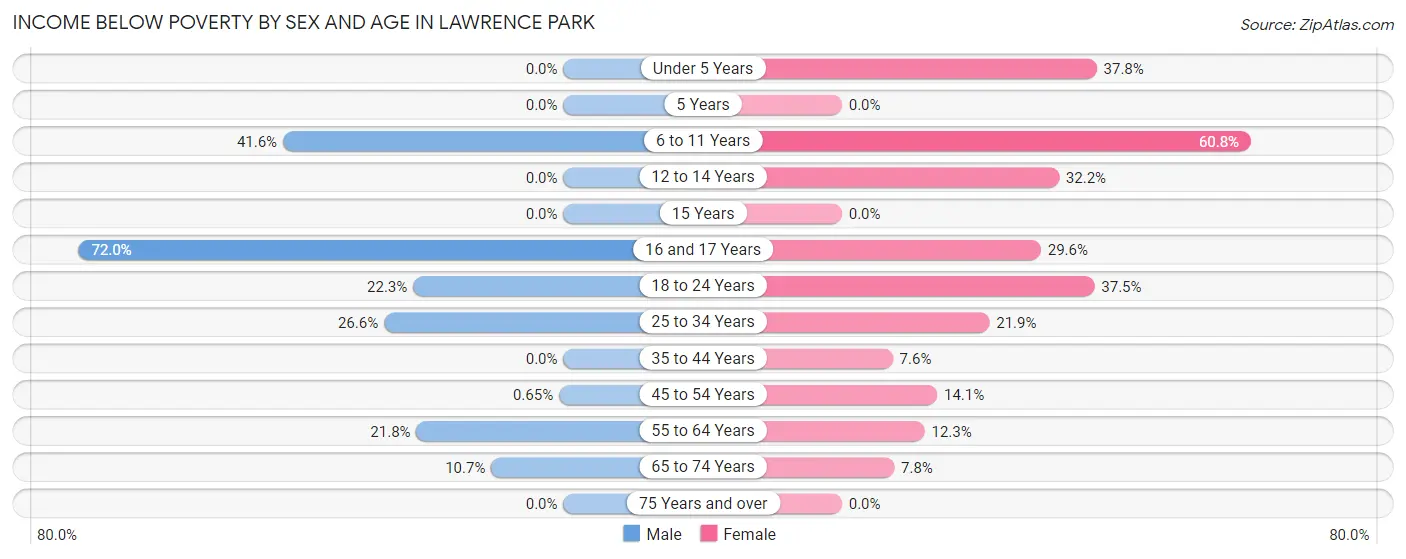
| Age Bracket | Male | Female |
| Under 5 Years | 0 (0.0%) | 84 (37.8%) |
| 5 Years | 0 (0.0%) | 0 (0.0%) |
| 6 to 11 Years | 122 (41.6%) | 130 (60.8%) |
| 12 to 14 Years | 0 (0.0%) | 49 (32.2%) |
| 15 Years | 0 (0.0%) | 0 (0.0%) |
| 16 and 17 Years | 18 (72.0%) | 13 (29.5%) |
| 18 to 24 Years | 29 (22.3%) | 18 (37.5%) |
| 25 to 34 Years | 45 (26.6%) | 60 (21.9%) |
| 35 to 44 Years | 0 (0.0%) | 20 (7.5%) |
| 45 to 54 Years | 1 (0.6%) | 27 (14.1%) |
| 55 to 64 Years | 60 (21.8%) | 37 (12.3%) |
| 65 to 74 Years | 15 (10.7%) | 15 (7.8%) |
| 75 Years and over | 0 (0.0%) | 0 (0.0%) |
| Total | 290 (17.5%) | 453 (22.1%) |
Income Above Poverty by Sex and Age in Lawrence Park
According to the poverty statistics in Lawrence Park, males aged under 5 years and females aged 5 years are the age groups that are most secure financially, with 100.0% of males and 100.0% of females in these age groups living above the poverty line.
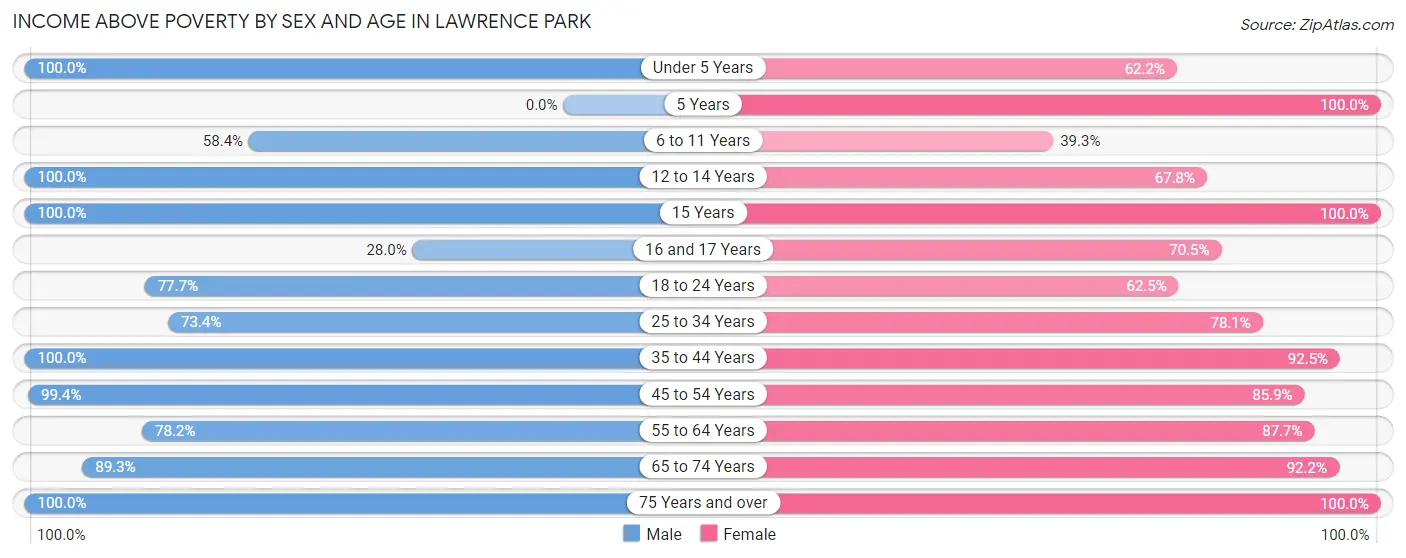
| Age Bracket | Male | Female |
| Under 5 Years | 53 (100.0%) | 138 (62.2%) |
| 5 Years | 0 (0.0%) | 18 (100.0%) |
| 6 to 11 Years | 171 (58.4%) | 84 (39.3%) |
| 12 to 14 Years | 106 (100.0%) | 103 (67.8%) |
| 15 Years | 13 (100.0%) | 31 (100.0%) |
| 16 and 17 Years | 7 (28.0%) | 31 (70.5%) |
| 18 to 24 Years | 101 (77.7%) | 30 (62.5%) |
| 25 to 34 Years | 124 (73.4%) | 214 (78.1%) |
| 35 to 44 Years | 242 (100.0%) | 245 (92.4%) |
| 45 to 54 Years | 152 (99.4%) | 164 (85.9%) |
| 55 to 64 Years | 215 (78.2%) | 264 (87.7%) |
| 65 to 74 Years | 125 (89.3%) | 178 (92.2%) |
| 75 Years and over | 53 (100.0%) | 95 (100.0%) |
| Total | 1,362 (82.5%) | 1,595 (77.9%) |
Income Below Poverty Among Married-Couple Families in Lawrence Park
The poverty statistics for married-couple families in Lawrence Park show that 3.5% or 20 of the total 569 families live below the poverty line. Families with 1 or 2 children have the highest poverty rate of 7.4%, comprising of 13 families. On the other hand, families with 3 or 4 children have the lowest poverty rate of 0.0%, which includes 0 families.
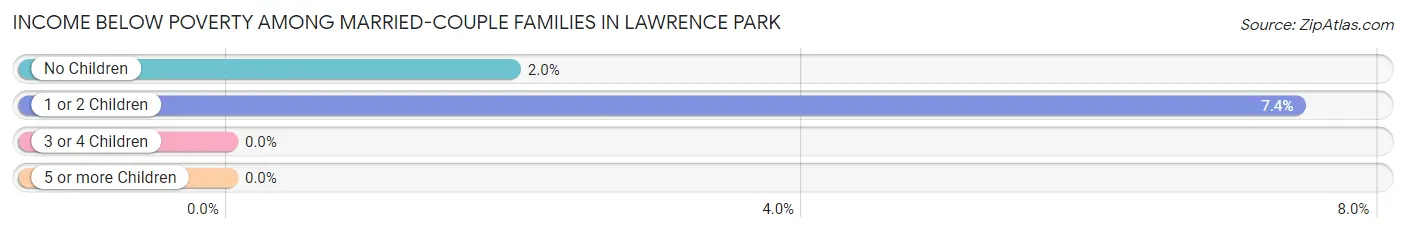
| Children | Above Poverty | Below Poverty |
| No Children | 349 (98.0%) | 7 (2.0%) |
| 1 or 2 Children | 162 (92.6%) | 13 (7.4%) |
| 3 or 4 Children | 38 (100.0%) | 0 (0.0%) |
| 5 or more Children | 0 (0.0%) | 0 (0.0%) |
| Total | 549 (96.5%) | 20 (3.5%) |
Income Below Poverty Among Single-Parent Households in Lawrence Park
According to the poverty data in Lawrence Park, 14.7% or 15 single-father households and 30.0% or 107 single-mother households are living below the poverty line. Among single-father households, those with 3 or 4 children have the highest poverty rate, with 15 households (100.0%) experiencing poverty. Likewise, among single-mother households, those with 3 or 4 children have the highest poverty rate, with 80 households (78.4%) falling below the poverty line.
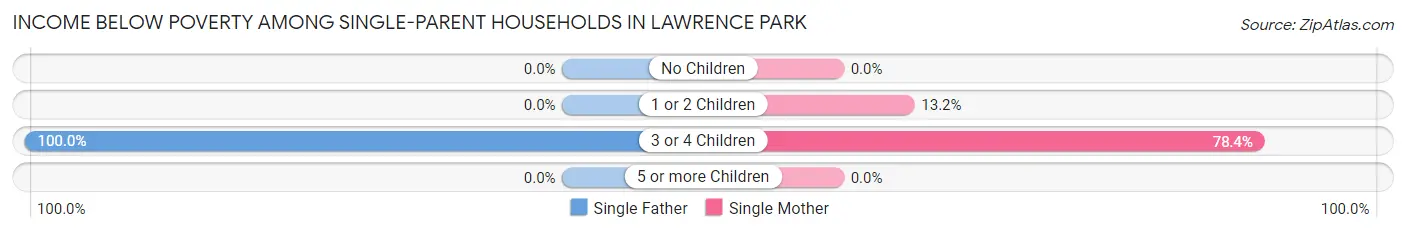
| Children | Single Father | Single Mother |
| No Children | 0 (0.0%) | 0 (0.0%) |
| 1 or 2 Children | 0 (0.0%) | 27 (13.2%) |
| 3 or 4 Children | 15 (100.0%) | 80 (78.4%) |
| 5 or more Children | 0 (0.0%) | 0 (0.0%) |
| Total | 15 (14.7%) | 107 (30.0%) |
Income Below Poverty Among Married-Couple vs Single-Parent Households in Lawrence Park
The poverty data for Lawrence Park shows that 20 of the married-couple family households (3.5%) and 122 of the single-parent households (26.6%) are living below the poverty level. Within the married-couple family households, those with 1 or 2 children have the highest poverty rate, with 13 households (7.4%) falling below the poverty line. Among the single-parent households, those with 3 or 4 children have the highest poverty rate, with 95 household (81.2%) living below poverty.
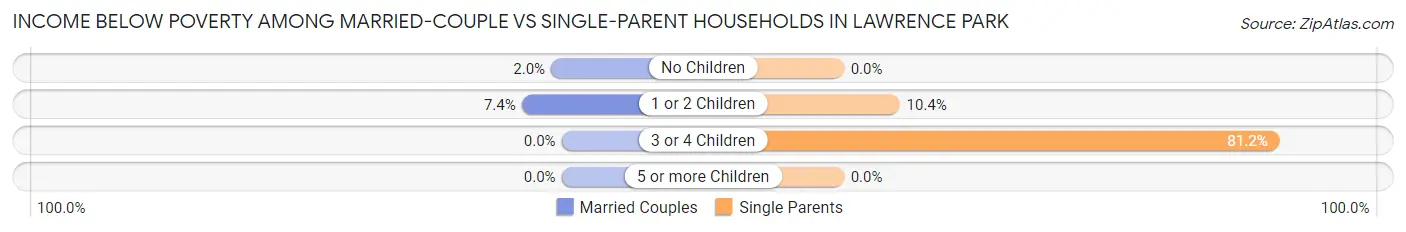
| Children | Married-Couple Families | Single-Parent Households |
| No Children | 7 (2.0%) | 0 (0.0%) |
| 1 or 2 Children | 13 (7.4%) | 27 (10.4%) |
| 3 or 4 Children | 0 (0.0%) | 95 (81.2%) |
| 5 or more Children | 0 (0.0%) | 0 (0.0%) |
| Total | 20 (3.5%) | 122 (26.6%) |
Race in Lawrence Park
The most populous races in Lawrence Park are White / Caucasian (3,308 | 86.6%), Black / African American (376 | 9.9%), and Two or more Races (85 | 2.2%).
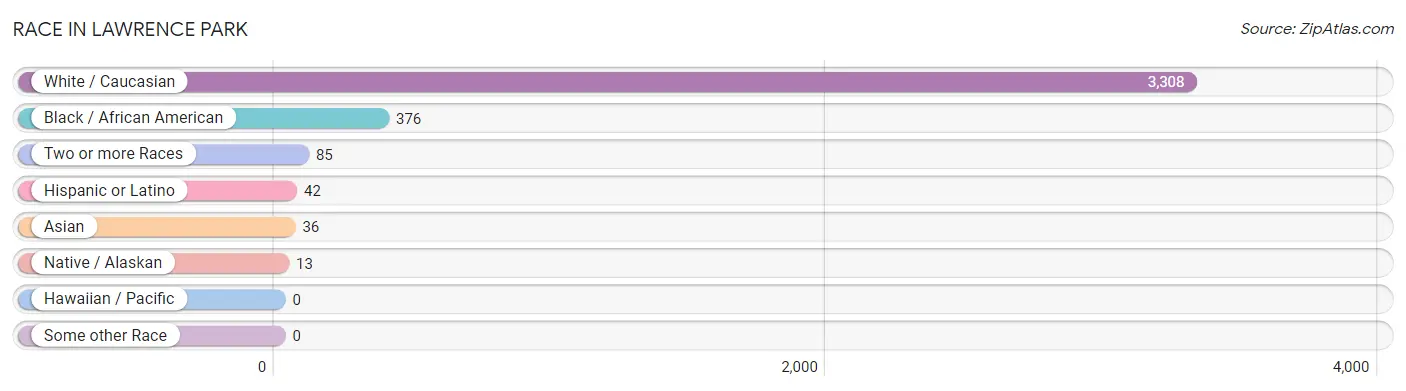
| Race | # Population | % Population |
| Asian | 36 | 0.9% |
| Black / African American | 376 | 9.9% |
| Hawaiian / Pacific | 0 | 0.0% |
| Hispanic or Latino | 42 | 1.1% |
| Native / Alaskan | 13 | 0.3% |
| White / Caucasian | 3,308 | 86.6% |
| Two or more Races | 85 | 2.2% |
| Some other Race | 0 | 0.0% |
| Total | 3,818 | 100.0% |
Ancestry in Lawrence Park
The most populous ancestries reported in Lawrence Park are German (987 | 25.9%), Irish (640 | 16.8%), Italian (477 | 12.5%), English (348 | 9.1%), and Polish (241 | 6.3%), together accounting for 70.5% of all Lawrence Park residents.
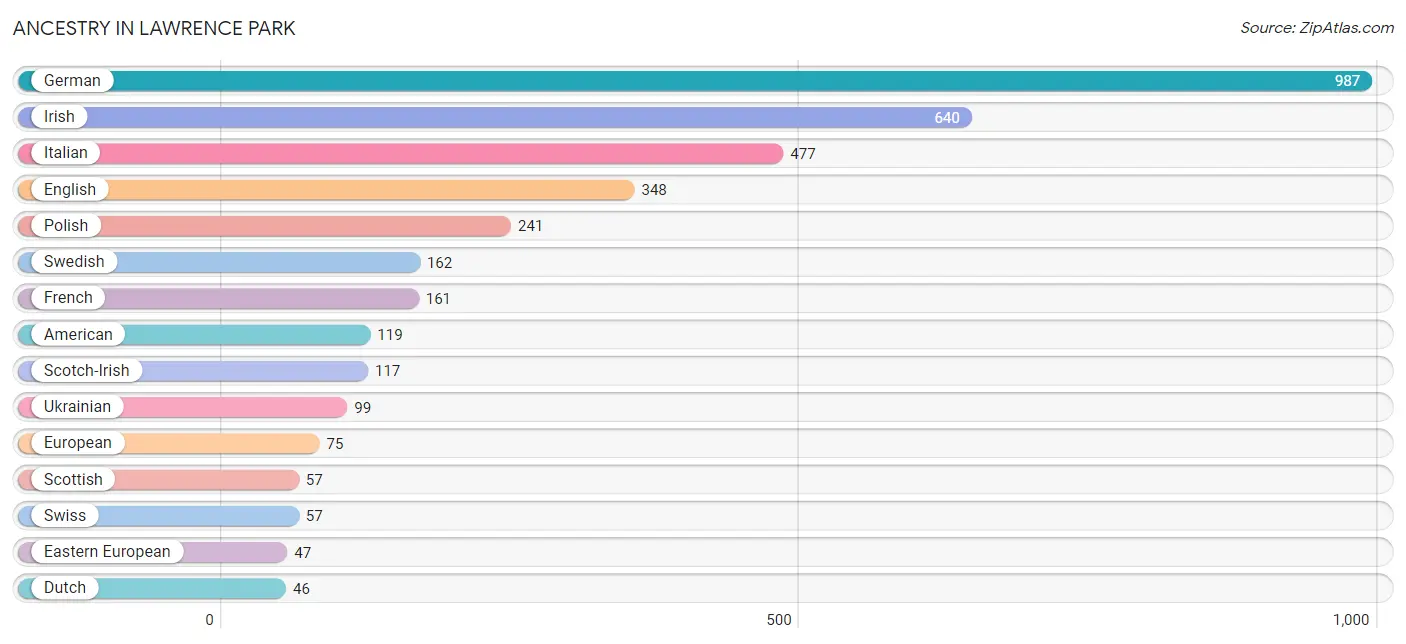
| Ancestry | # Population | % Population |
| African | 5 | 0.1% |
| American | 119 | 3.1% |
| Bhutanese | 27 | 0.7% |
| Canadian | 5 | 0.1% |
| Cuban | 23 | 0.6% |
| Czech | 5 | 0.1% |
| Czechoslovakian | 17 | 0.4% |
| Danish | 23 | 0.6% |
| Dutch | 46 | 1.2% |
| Eastern European | 47 | 1.2% |
| English | 348 | 9.1% |
| European | 75 | 2.0% |
| French | 161 | 4.2% |
| German | 987 | 25.9% |
| Hungarian | 14 | 0.4% |
| Irish | 640 | 16.8% |
| Italian | 477 | 12.5% |
| Jamaican | 11 | 0.3% |
| Mexican | 6 | 0.2% |
| Norwegian | 4 | 0.1% |
| Pakistani | 9 | 0.2% |
| Peruvian | 12 | 0.3% |
| Polish | 241 | 6.3% |
| Puerto Rican | 1 | 0.0% |
| Scotch-Irish | 117 | 3.1% |
| Scottish | 57 | 1.5% |
| South American | 12 | 0.3% |
| South American Indian | 12 | 0.3% |
| Subsaharan African | 5 | 0.1% |
| Swedish | 162 | 4.2% |
| Swiss | 57 | 1.5% |
| Ukrainian | 99 | 2.6% |
| Welsh | 13 | 0.3% | View All 33 Rows |
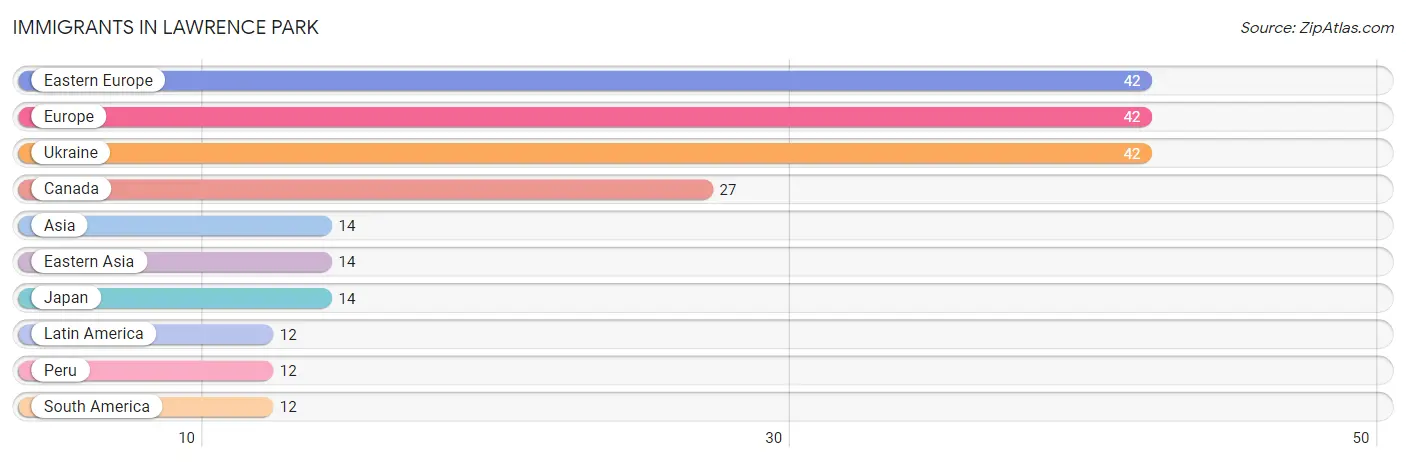
Immigrants in Lawrence Park
The most numerous immigrant groups reported in Lawrence Park came from Eastern Europe (42 | 1.1%), Europe (42 | 1.1%), Ukraine (42 | 1.1%), Canada (27 | 0.7%), and Asia (14 | 0.4%), together accounting for 4.4% of all Lawrence Park residents.
| Immigration Origin | # Population | % Population |
| Asia | 14 | 0.4% |
| Canada | 27 | 0.7% |
| Eastern Asia | 14 | 0.4% |
| Eastern Europe | 42 | 1.1% |
| Europe | 42 | 1.1% |
| Japan | 14 | 0.4% |
| Latin America | 12 | 0.3% |
| Peru | 12 | 0.3% |
| South America | 12 | 0.3% |
| Ukraine | 42 | 1.1% | View All 10 Rows |
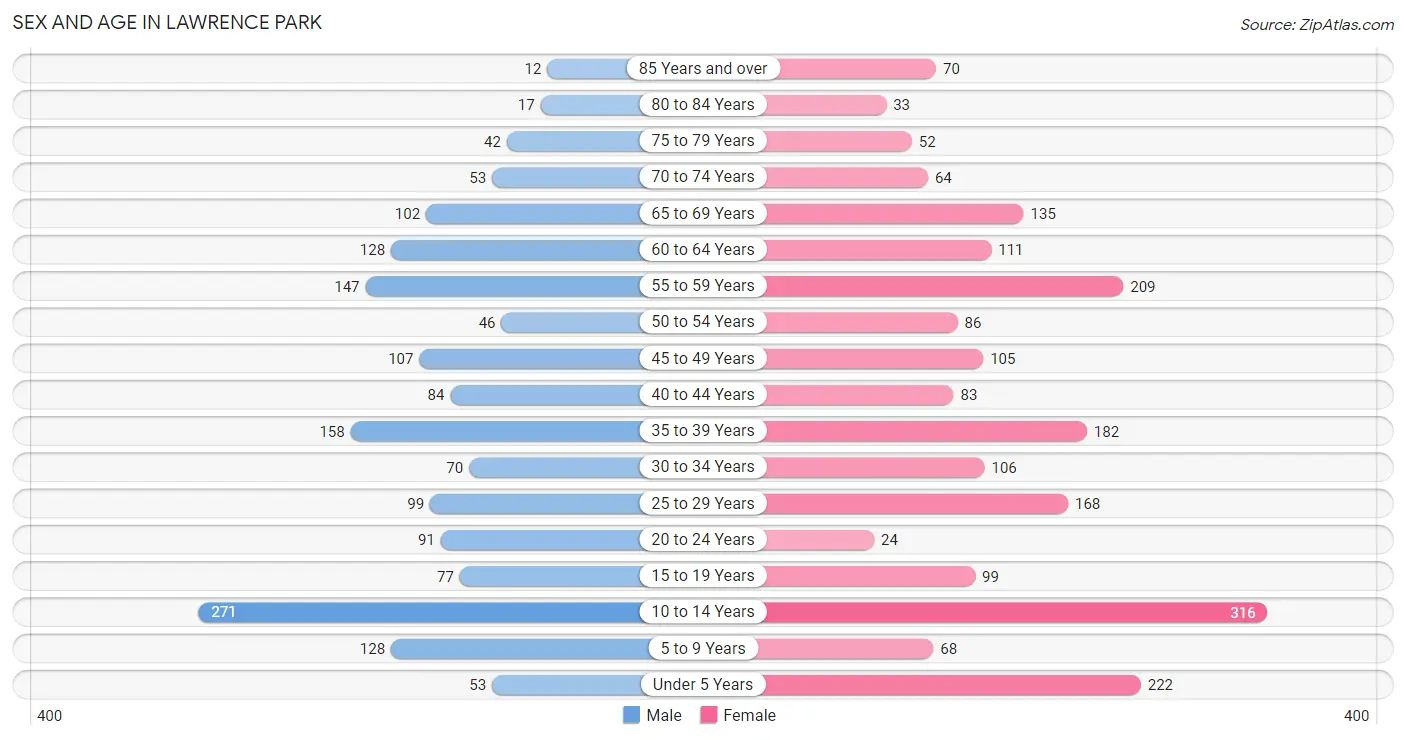
Sex and Age in Lawrence Park
Sex and Age in Lawrence Park
The most populous age groups in Lawrence Park are 10 to 14 Years (271 | 16.1%) for men and 10 to 14 Years (316 | 14.8%) for women.
| Age Bracket | Male | Female |
| Under 5 Years | 53 (3.2%) | 222 (10.4%) |
| 5 to 9 Years | 128 (7.6%) | 68 (3.2%) |
| 10 to 14 Years | 271 (16.1%) | 316 (14.8%) |
| 15 to 19 Years | 77 (4.6%) | 99 (4.6%) |
| 20 to 24 Years | 91 (5.4%) | 24 (1.1%) |
| 25 to 29 Years | 99 (5.9%) | 168 (7.9%) |
| 30 to 34 Years | 70 (4.2%) | 106 (5.0%) |
| 35 to 39 Years | 158 (9.4%) | 182 (8.5%) |
| 40 to 44 Years | 84 (5.0%) | 83 (3.9%) |
| 45 to 49 Years | 107 (6.4%) | 105 (4.9%) |
| 50 to 54 Years | 46 (2.7%) | 86 (4.0%) |
| 55 to 59 Years | 147 (8.7%) | 209 (9.8%) |
| 60 to 64 Years | 128 (7.6%) | 111 (5.2%) |
| 65 to 69 Years | 102 (6.0%) | 135 (6.3%) |
| 70 to 74 Years | 53 (3.2%) | 64 (3.0%) |
| 75 to 79 Years | 42 (2.5%) | 52 (2.4%) |
| 80 to 84 Years | 17 (1.0%) | 33 (1.5%) |
| 85 Years and over | 12 (0.7%) | 70 (3.3%) |
| Total | 1,685 (100.0%) | 2,133 (100.0%) |
Families and Households in Lawrence Park
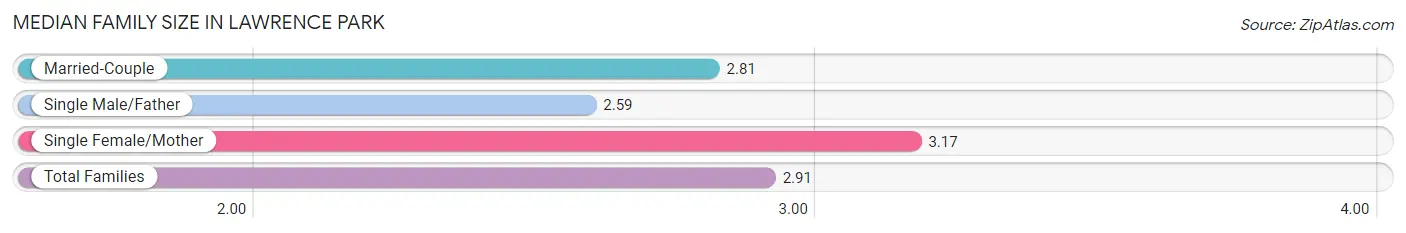
Median Family Size in Lawrence Park
The median family size in Lawrence Park is 2.91 persons per family, with single female/mother families (357 | 34.7%) accounting for the largest median family size of 3.17 persons per family. On the other hand, single male/father families (102 | 9.9%) represent the smallest median family size with 2.59 persons per family.
| Family Type | # Families | Family Size |
| Married-Couple | 569 (55.3%) | 2.81 |
| Single Male/Father | 102 (9.9%) | 2.59 |
| Single Female/Mother | 357 (34.7%) | 3.17 |
| Total Families | 1,028 (100.0%) | 2.91 |
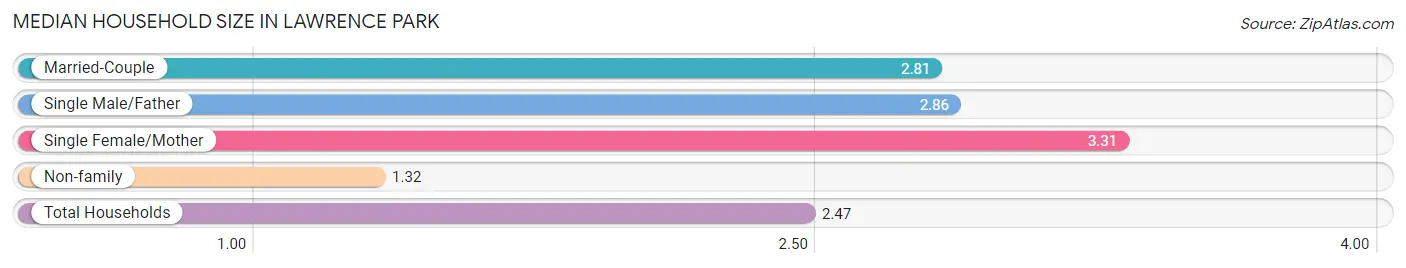
Median Household Size in Lawrence Park
The median household size in Lawrence Park is 2.47 persons per household, with single female/mother households (357 | 23.8%) accounting for the largest median household size of 3.31 persons per household. non-family households (469 | 31.3%) represent the smallest median household size with 1.32 persons per household.
| Household Type | # Households | Household Size |
| Married-Couple | 569 (38.0%) | 2.81 |
| Single Male/Father | 102 (6.8%) | 2.86 |
| Single Female/Mother | 357 (23.8%) | 3.31 |
| Non-family | 469 (31.3%) | 1.32 |
| Total Households | 1,497 (100.0%) | 2.47 |
Household Size by Marriage Status in Lawrence Park
Out of a total of 1,497 households in Lawrence Park, 1,028 (68.7%) are family households, while 469 (31.3%) are nonfamily households. The most numerous type of family households are 2-person households, comprising 519, and the most common type of nonfamily households are 1-person households, comprising 348.
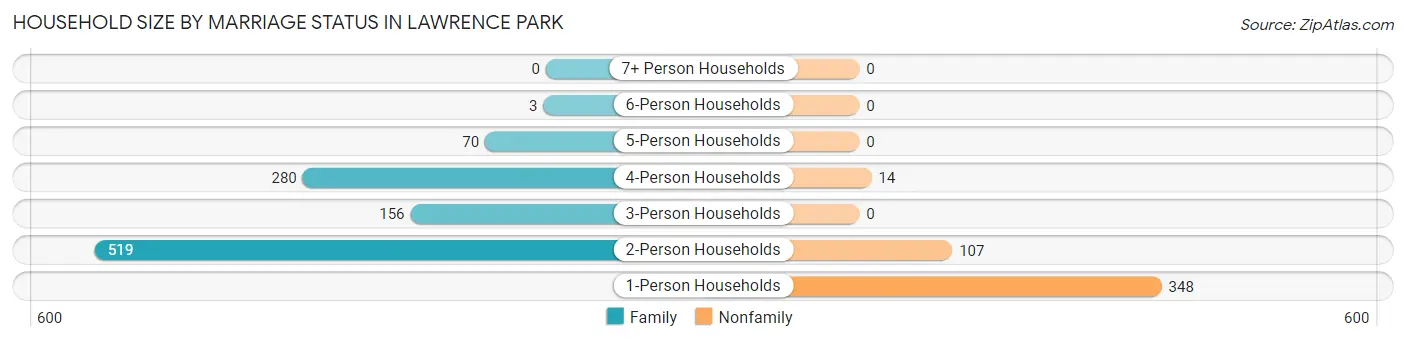
| Household Size | Family Households | Nonfamily Households |
| 1-Person Households | - | 348 (23.3%) |
| 2-Person Households | 519 (34.7%) | 107 (7.1%) |
| 3-Person Households | 156 (10.4%) | 0 (0.0%) |
| 4-Person Households | 280 (18.7%) | 14 (0.9%) |
| 5-Person Households | 70 (4.7%) | 0 (0.0%) |
| 6-Person Households | 3 (0.2%) | 0 (0.0%) |
| 7+ Person Households | 0 (0.0%) | 0 (0.0%) |
| Total | 1,028 (68.7%) | 469 (31.3%) |
Female Fertility in Lawrence Park
Fertility by Age in Lawrence Park
Average fertility rate in Lawrence Park is 9.0 births per 1,000 women. Women in the age bracket of 35 to 50 years have the highest fertility rate with 18.0 births per 1,000 women. Women in the age bracket of 35 to 50 years acount for 100.0% of all women with births.
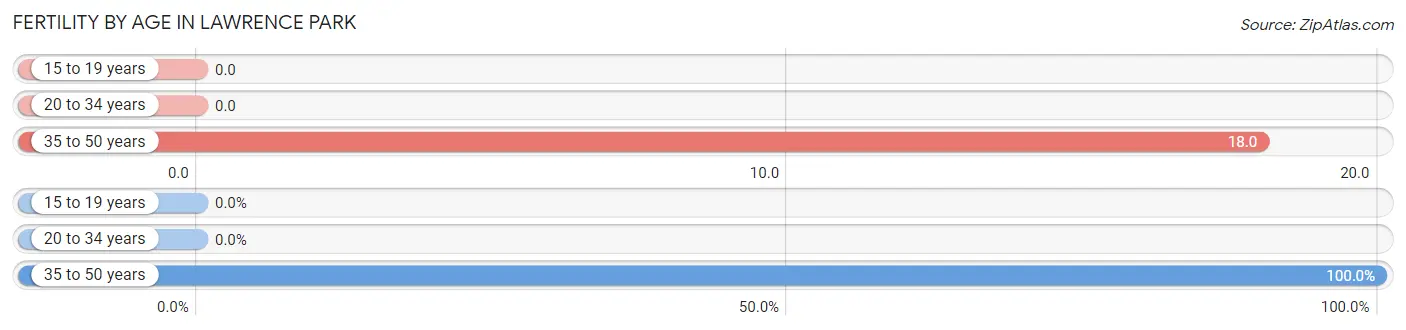
| Age Bracket | Women with Births | Births / 1,000 Women |
| 15 to 19 years | 0 (0.0%) | 0.0 |
| 20 to 34 years | 0 (0.0%) | 0.0 |
| 35 to 50 years | 7 (100.0%) | 18.0 |
| Total | 7 (100.0%) | 9.0 |
Fertility by Age by Marriage Status in Lawrence Park
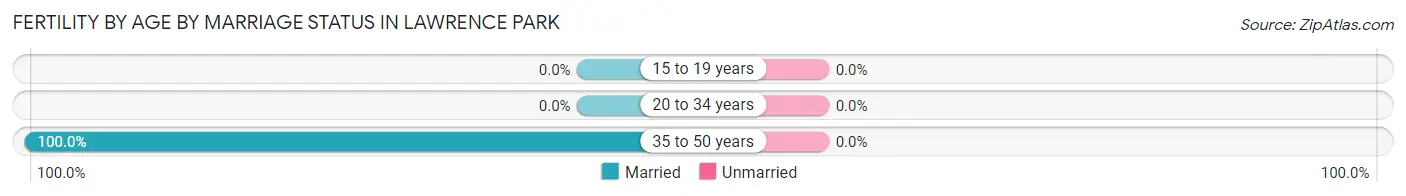
| Age Bracket | Married | Unmarried |
| 15 to 19 years | 0 (0.0%) | 0 (0.0%) |
| 20 to 34 years | 0 (0.0%) | 0 (0.0%) |
| 35 to 50 years | 7 (100.0%) | 0 (0.0%) |
| Total | 7 (100.0%) | 0 (0.0%) |
Fertility by Education in Lawrence Park
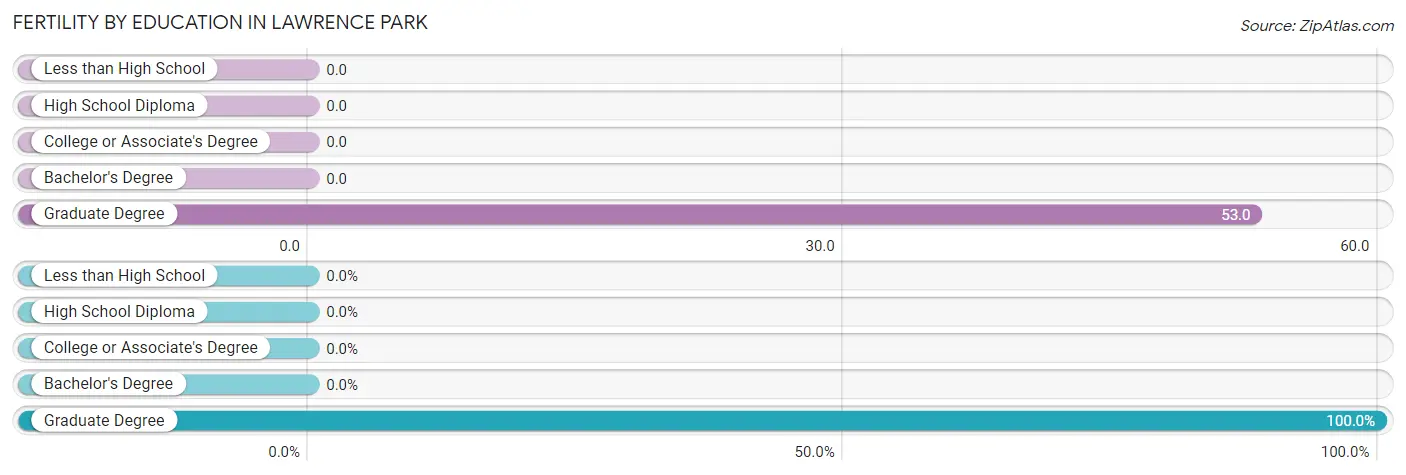
| Educational Attainment | Women with Births | Births / 1,000 Women |
| Less than High School | 0 (0.0%) | 0.0 |
| High School Diploma | 0 (0.0%) | 0.0 |
| College or Associate's Degree | 0 (0.0%) | 0.0 |
| Bachelor's Degree | 0 (0.0%) | 0.0 |
| Graduate Degree | 7 (100.0%) | 53.0 |
| Total | 7 (100.0%) | 9.0 |
Fertility by Education by Marriage Status in Lawrence Park
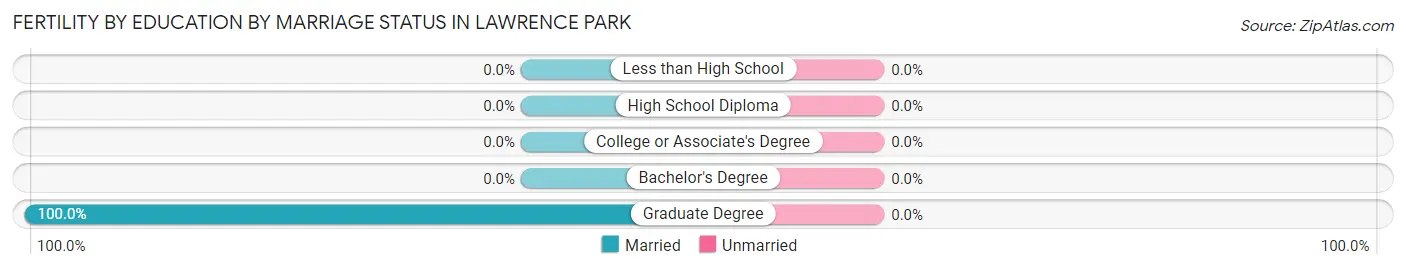
| Educational Attainment | Married | Unmarried |
| Less than High School | 0 (0.0%) | 0 (0.0%) |
| High School Diploma | 0 (0.0%) | 0 (0.0%) |
| College or Associate's Degree | 0 (0.0%) | 0 (0.0%) |
| Bachelor's Degree | 0 (0.0%) | 0 (0.0%) |
| Graduate Degree | 7 (100.0%) | 0 (0.0%) |
| Total | 7 (100.0%) | 0 (0.0%) |
Employment Characteristics in Lawrence Park
Employment by Class of Employer in Lawrence Park
Among the 1,755 employed individuals in Lawrence Park, private company employees (924 | 52.6%), not-for-profit organizations (536 | 30.5%), and local government employees (91 | 5.2%) make up the most common classes of employment.
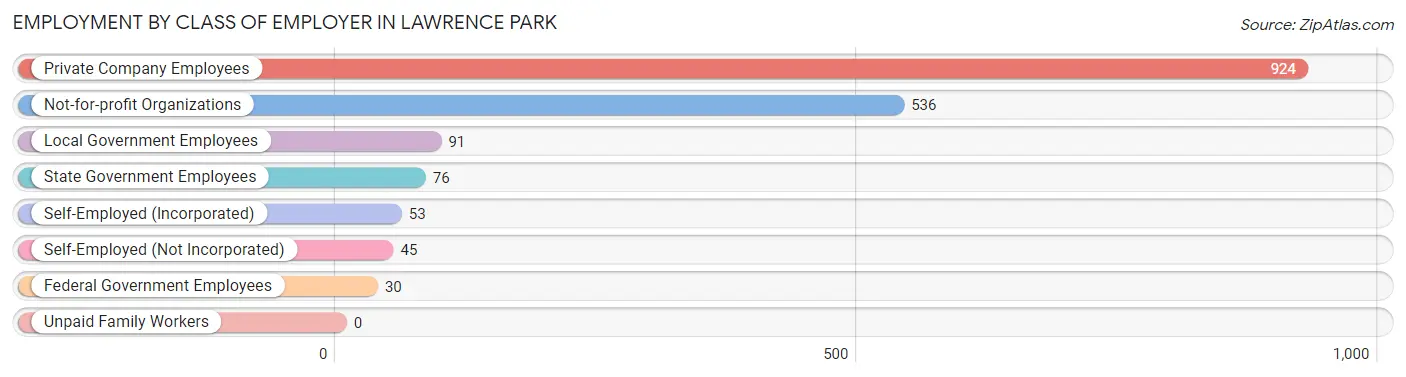
| Employer Class | # Employees | % Employees |
| Private Company Employees | 924 | 52.6% |
| Self-Employed (Incorporated) | 53 | 3.0% |
| Self-Employed (Not Incorporated) | 45 | 2.6% |
| Not-for-profit Organizations | 536 | 30.5% |
| Local Government Employees | 91 | 5.2% |
| State Government Employees | 76 | 4.3% |
| Federal Government Employees | 30 | 1.7% |
| Unpaid Family Workers | 0 | 0.0% |
| Total | 1,755 | 100.0% |
Employment Status by Age in Lawrence Park
According to the labor force statistics for Lawrence Park, out of the total population over 16 years of age (2,716), 66.8% or 1,814 individuals are in the labor force, with 1.9% or 34 of them unemployed. The age group with the highest labor force participation rate is 35 to 44 years, with 94.5% or 479 individuals in the labor force. Within the labor force, the 16 to 19 years age range has the highest percentage of unemployed individuals, with 22.5% or 9 of them being unemployed.
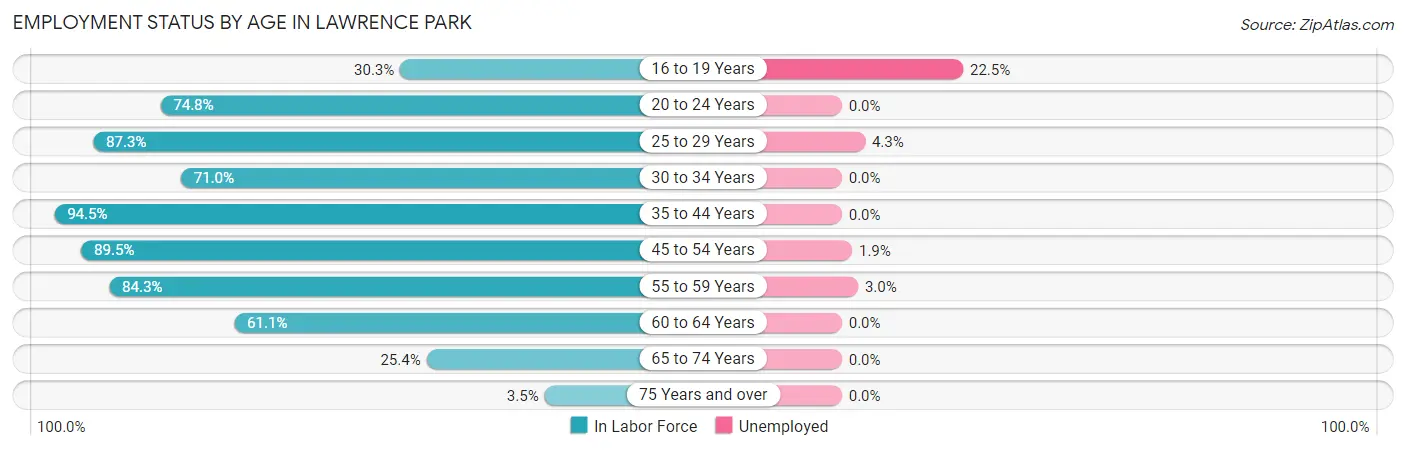
| Age Bracket | In Labor Force | Unemployed |
| 16 to 19 Years | 40 (30.3%) | 9 (22.5%) |
| 20 to 24 Years | 86 (74.8%) | 0 (0.0%) |
| 25 to 29 Years | 233 (87.3%) | 10 (4.3%) |
| 30 to 34 Years | 125 (71.0%) | 0 (0.0%) |
| 35 to 44 Years | 479 (94.5%) | 0 (0.0%) |
| 45 to 54 Years | 308 (89.5%) | 6 (1.9%) |
| 55 to 59 Years | 300 (84.3%) | 9 (3.0%) |
| 60 to 64 Years | 146 (61.1%) | 0 (0.0%) |
| 65 to 74 Years | 90 (25.4%) | 0 (0.0%) |
| 75 Years and over | 8 (3.5%) | 0 (0.0%) |
| Total | 1,814 (66.8%) | 34 (1.9%) |
Employment Status by Educational Attainment in Lawrence Park
According to labor force statistics for Lawrence Park, 84.2% of individuals (1,591) out of the total population between 25 and 64 years of age (1,889) are in the labor force, with 1.6% or 25 of them being unemployed. The group with the highest labor force participation rate are those with the educational attainment of bachelor's degree or higher, with 99.1% or 679 individuals in the labor force. Within the labor force, individuals with college / associate degree education have the highest percentage of unemployment, with 3.6% or 16 of them being unemployed.
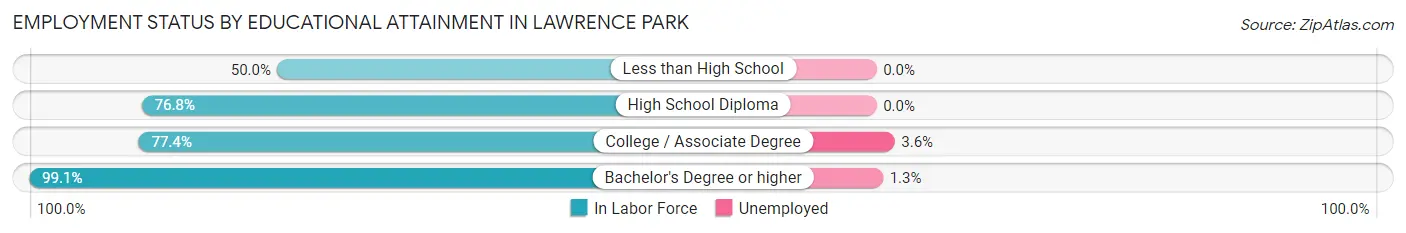
| Educational Attainment | In Labor Force | Unemployed |
| Less than High School | 30 (50.0%) | 0 (0.0%) |
| High School Diploma | 440 (76.8%) | 0 (0.0%) |
| College / Associate Degree | 442 (77.4%) | 21 (3.6%) |
| Bachelor's Degree or higher | 679 (99.1%) | 9 (1.3%) |
| Total | 1,591 (84.2%) | 30 (1.6%) |
Employment Occupations by Sex in Lawrence Park
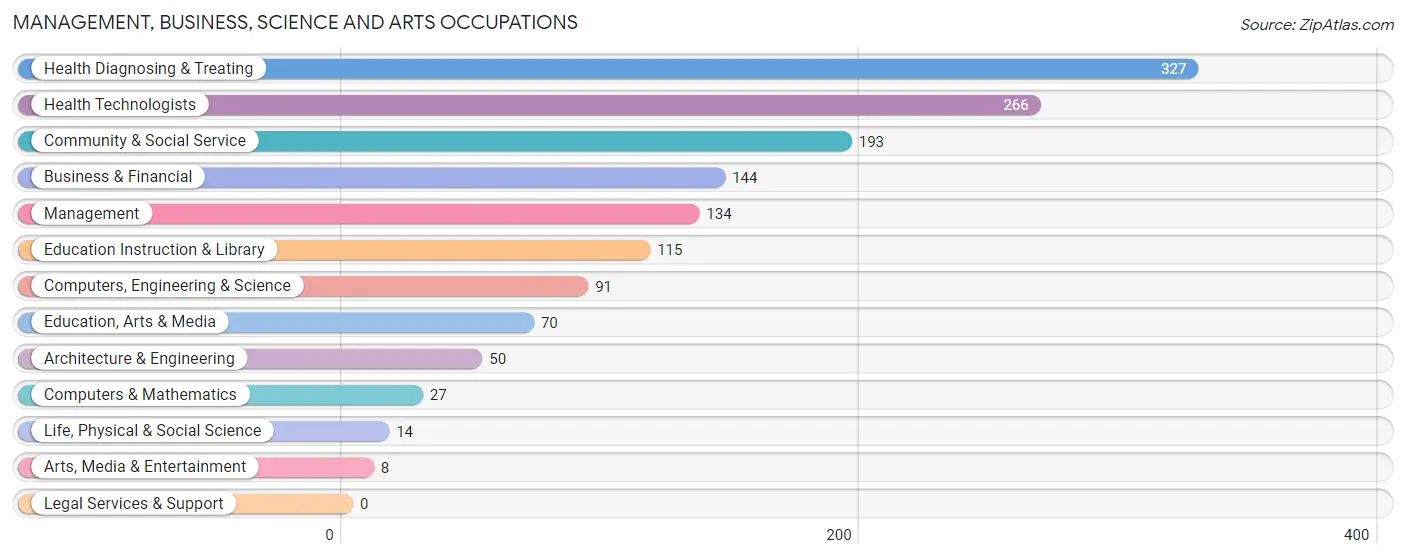
Management, Business, Science and Arts Occupations
The most common Management, Business, Science and Arts occupations in Lawrence Park are Health Diagnosing & Treating (327 | 18.4%), Health Technologists (266 | 14.9%), Community & Social Service (193 | 10.8%), Business & Financial (144 | 8.1%), and Management (134 | 7.5%).
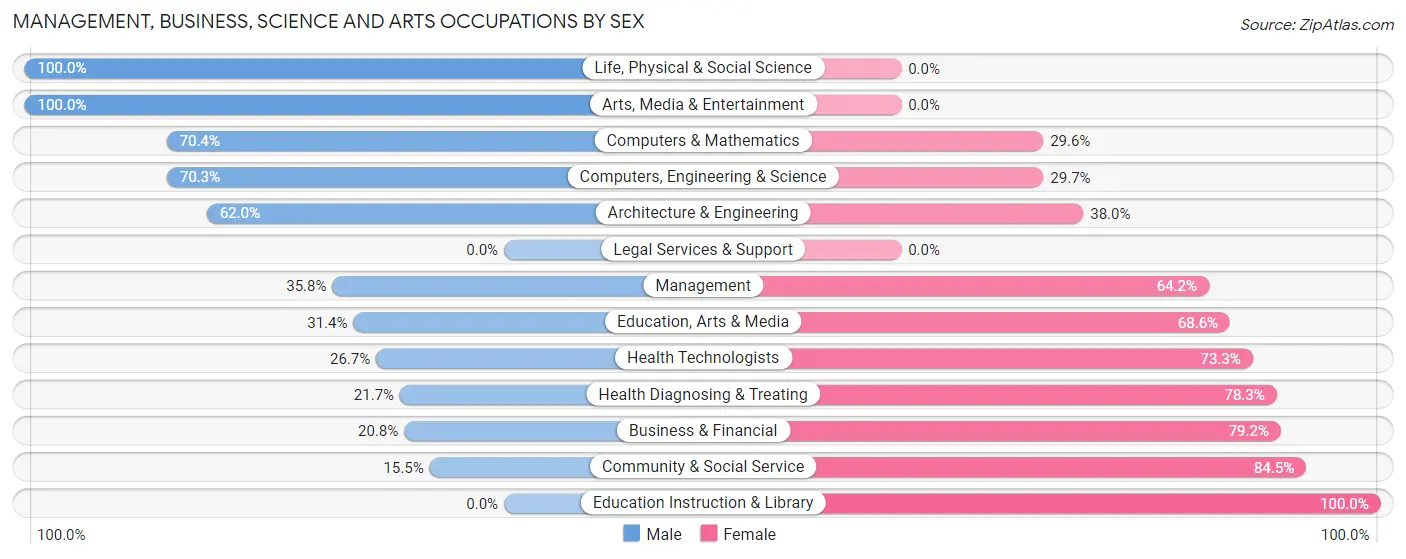
Management, Business, Science and Arts Occupations by Sex
Within the Management, Business, Science and Arts occupations in Lawrence Park, the most male-oriented occupations are Life, Physical & Social Science (100.0%), Arts, Media & Entertainment (100.0%), and Computers & Mathematics (70.4%), while the most female-oriented occupations are Education Instruction & Library (100.0%), Community & Social Service (84.5%), and Business & Financial (79.2%).
| Occupation | Male | Female |
| Management | 48 (35.8%) | 86 (64.2%) |
| Business & Financial | 30 (20.8%) | 114 (79.2%) |
| Computers, Engineering & Science | 64 (70.3%) | 27 (29.7%) |
| Computers & Mathematics | 19 (70.4%) | 8 (29.6%) |
| Architecture & Engineering | 31 (62.0%) | 19 (38.0%) |
| Life, Physical & Social Science | 14 (100.0%) | 0 (0.0%) |
| Community & Social Service | 30 (15.5%) | 163 (84.5%) |
| Education, Arts & Media | 22 (31.4%) | 48 (68.6%) |
| Legal Services & Support | 0 (0.0%) | 0 (0.0%) |
| Education Instruction & Library | 0 (0.0%) | 115 (100.0%) |
| Arts, Media & Entertainment | 8 (100.0%) | 0 (0.0%) |
| Health Diagnosing & Treating | 71 (21.7%) | 256 (78.3%) |
| Health Technologists | 71 (26.7%) | 195 (73.3%) |
| Total (Category) | 243 (27.3%) | 646 (72.7%) |
| Total (Overall) | 805 (45.2%) | 976 (54.8%) |
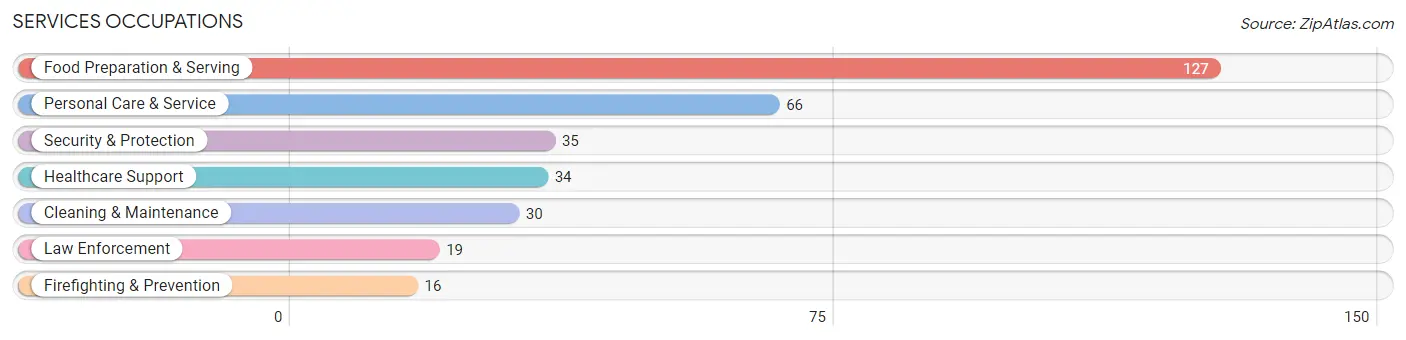
Services Occupations
The most common Services occupations in Lawrence Park are Food Preparation & Serving (127 | 7.1%), Personal Care & Service (66 | 3.7%), Security & Protection (35 | 2.0%), Healthcare Support (34 | 1.9%), and Cleaning & Maintenance (30 | 1.7%).
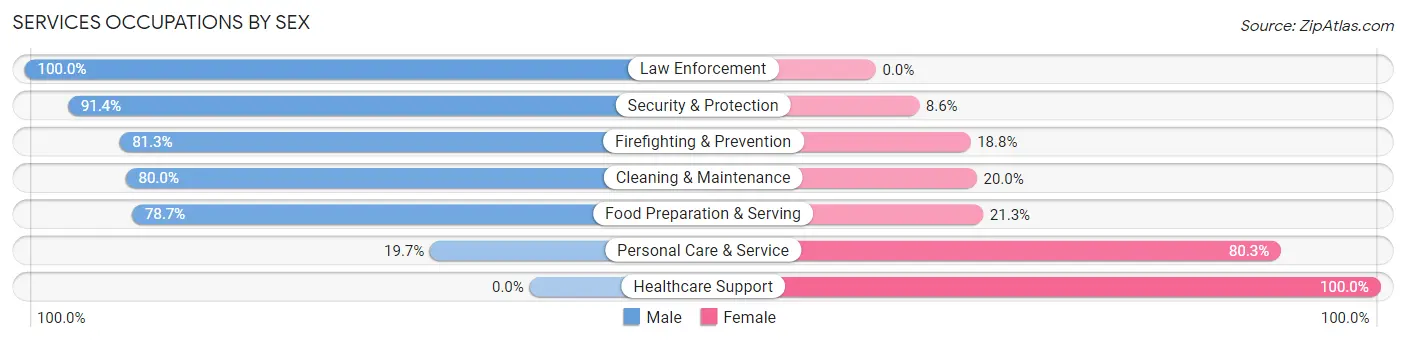
Services Occupations by Sex
Within the Services occupations in Lawrence Park, the most male-oriented occupations are Law Enforcement (100.0%), Security & Protection (91.4%), and Firefighting & Prevention (81.2%), while the most female-oriented occupations are Healthcare Support (100.0%), Personal Care & Service (80.3%), and Food Preparation & Serving (21.3%).
| Occupation | Male | Female |
| Healthcare Support | 0 (0.0%) | 34 (100.0%) |
| Security & Protection | 32 (91.4%) | 3 (8.6%) |
| Firefighting & Prevention | 13 (81.2%) | 3 (18.8%) |
| Law Enforcement | 19 (100.0%) | 0 (0.0%) |
| Food Preparation & Serving | 100 (78.7%) | 27 (21.3%) |
| Cleaning & Maintenance | 24 (80.0%) | 6 (20.0%) |
| Personal Care & Service | 13 (19.7%) | 53 (80.3%) |
| Total (Category) | 169 (57.9%) | 123 (42.1%) |
| Total (Overall) | 805 (45.2%) | 976 (54.8%) |
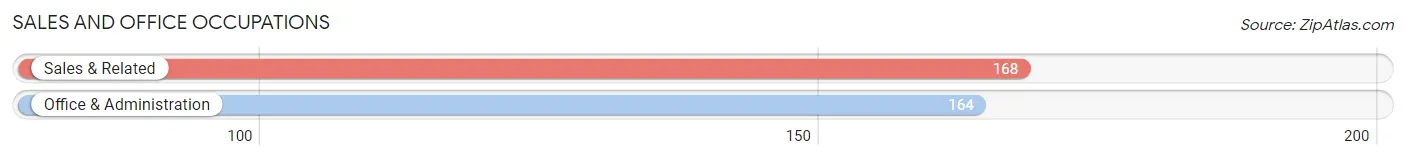
Sales and Office Occupations
The most common Sales and Office occupations in Lawrence Park are Sales & Related (168 | 9.4%), and Office & Administration (164 | 9.2%).
Sales and Office Occupations by Sex
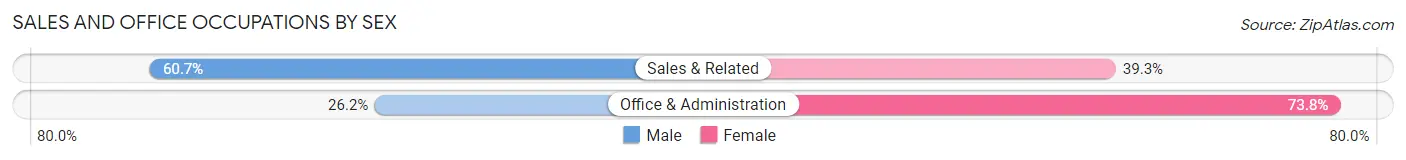
| Occupation | Male | Female |
| Sales & Related | 102 (60.7%) | 66 (39.3%) |
| Office & Administration | 43 (26.2%) | 121 (73.8%) |
| Total (Category) | 145 (43.7%) | 187 (56.3%) |
| Total (Overall) | 805 (45.2%) | 976 (54.8%) |
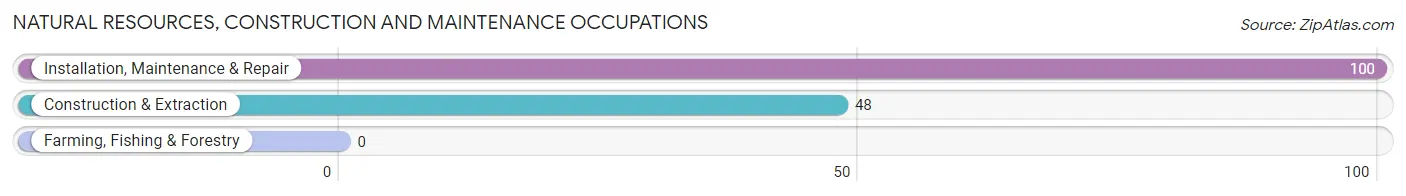
Natural Resources, Construction and Maintenance Occupations
The most common Natural Resources, Construction and Maintenance occupations in Lawrence Park are Installation, Maintenance & Repair (100 | 5.6%), and Construction & Extraction (48 | 2.7%).
Natural Resources, Construction and Maintenance Occupations by Sex
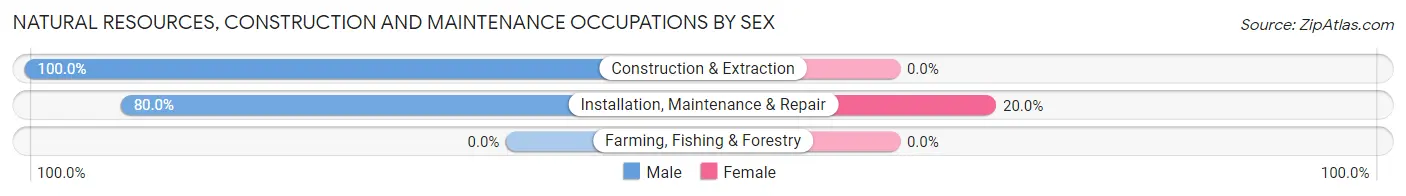
| Occupation | Male | Female |
| Farming, Fishing & Forestry | 0 (0.0%) | 0 (0.0%) |
| Construction & Extraction | 48 (100.0%) | 0 (0.0%) |
| Installation, Maintenance & Repair | 80 (80.0%) | 20 (20.0%) |
| Total (Category) | 128 (86.5%) | 20 (13.5%) |
| Total (Overall) | 805 (45.2%) | 976 (54.8%) |
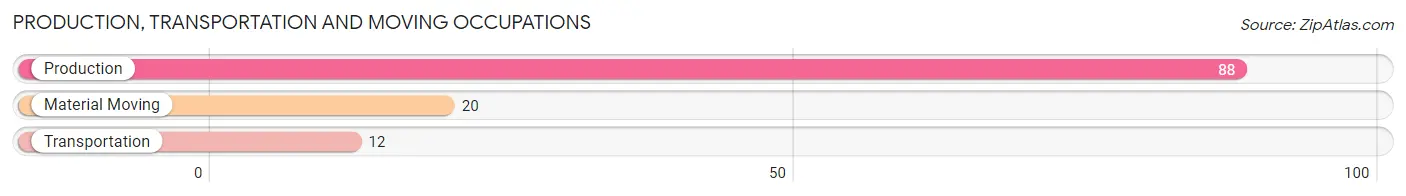
Production, Transportation and Moving Occupations
The most common Production, Transportation and Moving occupations in Lawrence Park are Production (88 | 4.9%), Material Moving (20 | 1.1%), and Transportation (12 | 0.7%).
Production, Transportation and Moving Occupations by Sex
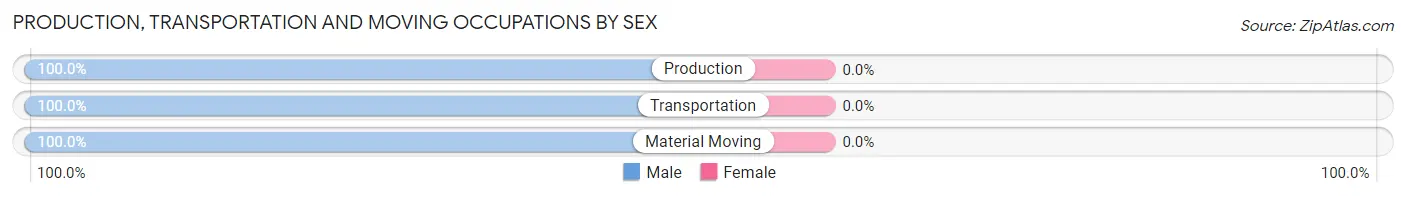
| Occupation | Male | Female |
| Production | 88 (100.0%) | 0 (0.0%) |
| Transportation | 12 (100.0%) | 0 (0.0%) |
| Material Moving | 20 (100.0%) | 0 (0.0%) |
| Total (Category) | 120 (100.0%) | 0 (0.0%) |
| Total (Overall) | 805 (45.2%) | 976 (54.8%) |
Employment Industries by Sex in Lawrence Park
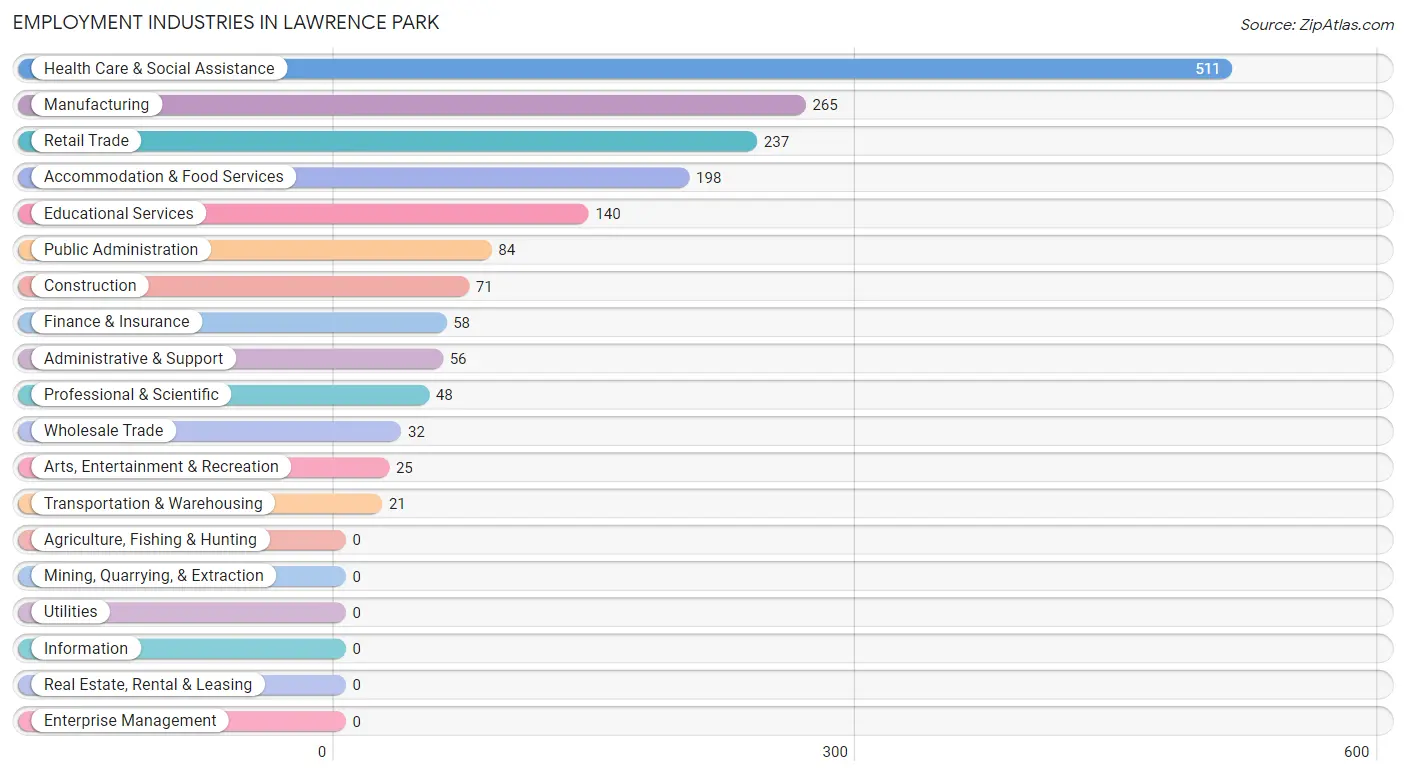
Employment Industries in Lawrence Park
The major employment industries in Lawrence Park include Health Care & Social Assistance (511 | 28.7%), Manufacturing (265 | 14.9%), Retail Trade (237 | 13.3%), Accommodation & Food Services (198 | 11.1%), and Educational Services (140 | 7.9%).
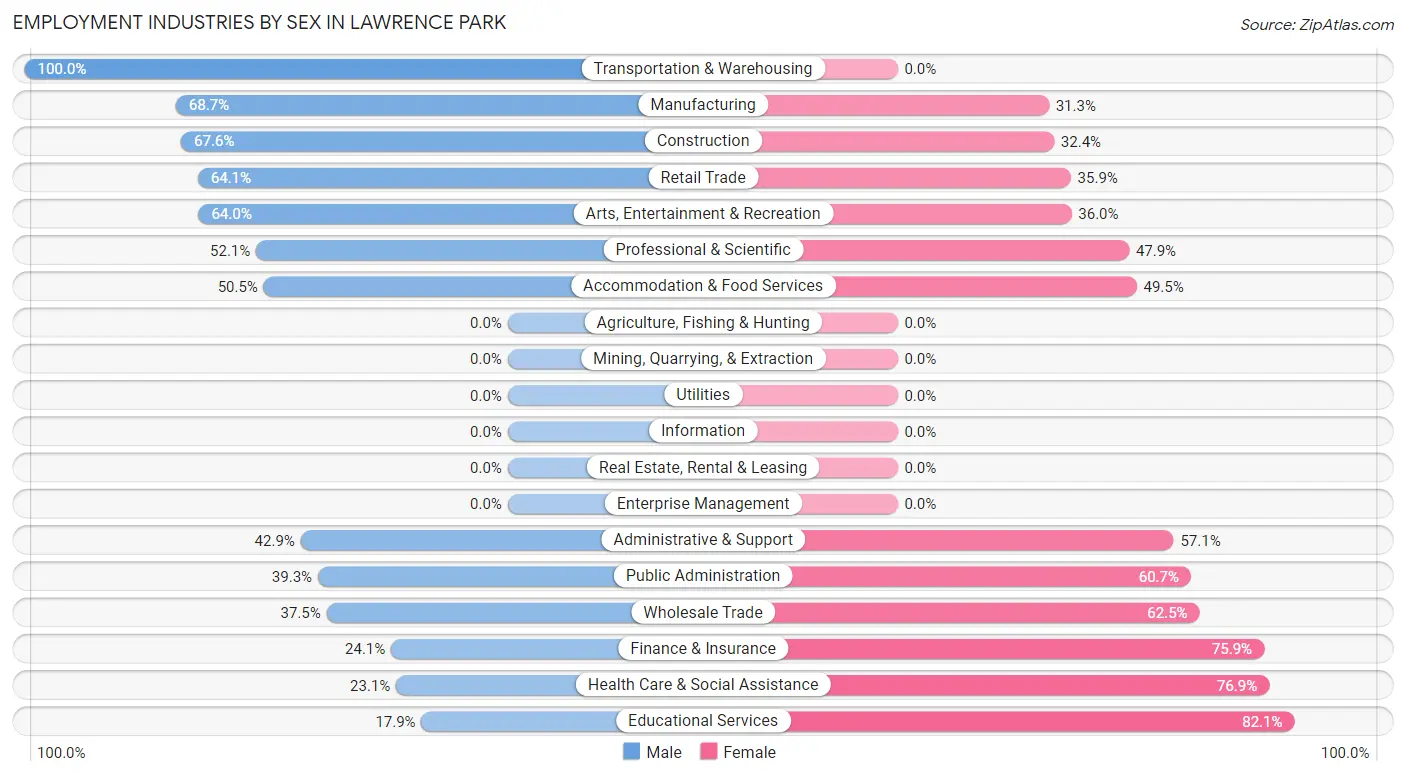
Employment Industries by Sex in Lawrence Park
The Lawrence Park industries that see more men than women are Transportation & Warehousing (100.0%), Manufacturing (68.7%), and Construction (67.6%), whereas the industries that tend to have a higher number of women are Educational Services (82.1%), Health Care & Social Assistance (76.9%), and Finance & Insurance (75.9%).
| Industry | Male | Female |
| Agriculture, Fishing & Hunting | 0 (0.0%) | 0 (0.0%) |
| Mining, Quarrying, & Extraction | 0 (0.0%) | 0 (0.0%) |
| Construction | 48 (67.6%) | 23 (32.4%) |
| Manufacturing | 182 (68.7%) | 83 (31.3%) |
| Wholesale Trade | 12 (37.5%) | 20 (62.5%) |
| Retail Trade | 152 (64.1%) | 85 (35.9%) |
| Transportation & Warehousing | 21 (100.0%) | 0 (0.0%) |
| Utilities | 0 (0.0%) | 0 (0.0%) |
| Information | 0 (0.0%) | 0 (0.0%) |
| Finance & Insurance | 14 (24.1%) | 44 (75.9%) |
| Real Estate, Rental & Leasing | 0 (0.0%) | 0 (0.0%) |
| Professional & Scientific | 25 (52.1%) | 23 (47.9%) |
| Enterprise Management | 0 (0.0%) | 0 (0.0%) |
| Administrative & Support | 24 (42.9%) | 32 (57.1%) |
| Educational Services | 25 (17.9%) | 115 (82.1%) |
| Health Care & Social Assistance | 118 (23.1%) | 393 (76.9%) |
| Arts, Entertainment & Recreation | 16 (64.0%) | 9 (36.0%) |
| Accommodation & Food Services | 100 (50.5%) | 98 (49.5%) |
| Public Administration | 33 (39.3%) | 51 (60.7%) |
| Total | 805 (45.2%) | 976 (54.8%) |
Education in Lawrence Park
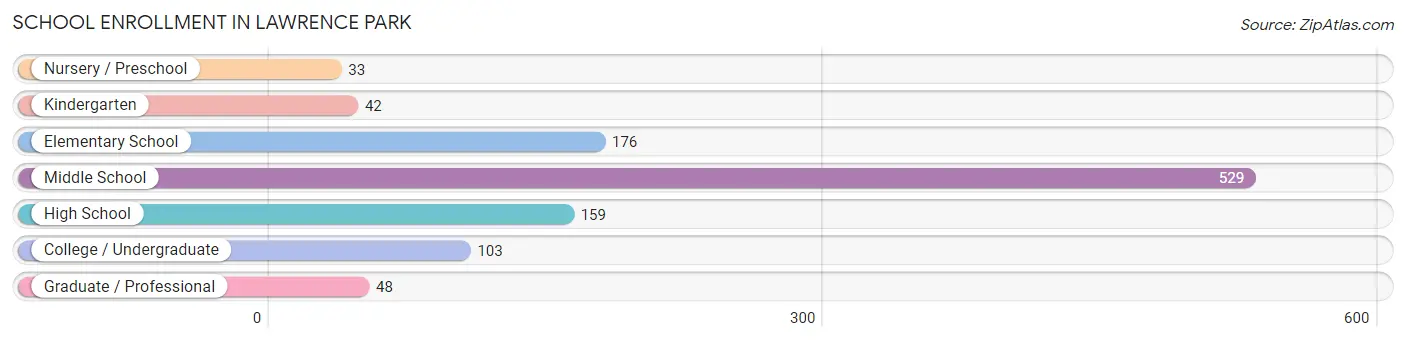
School Enrollment in Lawrence Park
The most common levels of schooling among the 1,090 students in Lawrence Park are middle school (529 | 48.5%), elementary school (176 | 16.2%), and high school (159 | 14.6%).
| School Level | # Students | % Students |
| Nursery / Preschool | 33 | 3.0% |
| Kindergarten | 42 | 3.8% |
| Elementary School | 176 | 16.2% |
| Middle School | 529 | 48.5% |
| High School | 159 | 14.6% |
| College / Undergraduate | 103 | 9.5% |
| Graduate / Professional | 48 | 4.4% |
| Total | 1,090 | 100.0% |
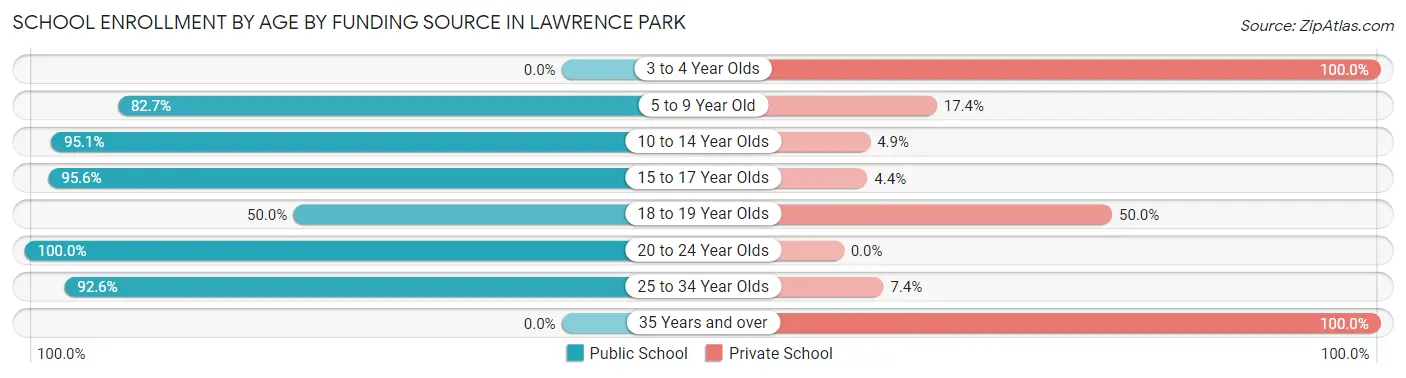
School Enrollment by Age by Funding Source in Lawrence Park
Out of a total of 1,090 students who are enrolled in schools in Lawrence Park, 125 (11.5%) attend a private institution, while the remaining 965 (88.5%) are enrolled in public schools. The age group of 3 to 4 year olds has the highest likelihood of being enrolled in private schools, with 15 (100.0% in the age bracket) enrolled. Conversely, the age group of 20 to 24 year olds has the lowest likelihood of being enrolled in a private school, with 17 (100.0% in the age bracket) attending a public institution.
| Age Bracket | Public School | Private School |
| 3 to 4 Year Olds | 0 (0.0%) | 15 (100.0%) |
| 5 to 9 Year Old | 162 (82.7%) | 34 (17.3%) |
| 10 to 14 Year Olds | 558 (95.1%) | 29 (4.9%) |
| 15 to 17 Year Olds | 108 (95.6%) | 5 (4.4%) |
| 18 to 19 Year Olds | 20 (50.0%) | 20 (50.0%) |
| 20 to 24 Year Olds | 17 (100.0%) | 0 (0.0%) |
| 25 to 34 Year Olds | 100 (92.6%) | 8 (7.4%) |
| 35 Years and over | 0 (0.0%) | 14 (100.0%) |
| Total | 965 (88.5%) | 125 (11.5%) |
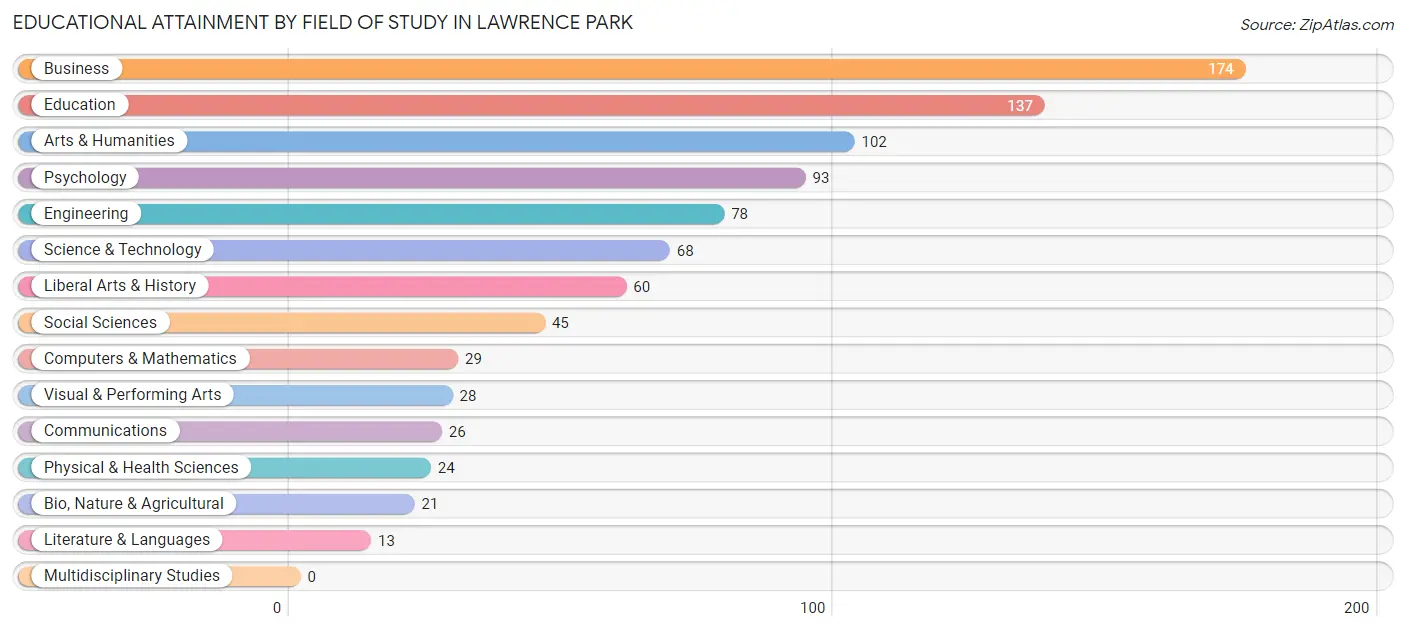
Educational Attainment by Field of Study in Lawrence Park
Business (174 | 19.4%), education (137 | 15.3%), arts & humanities (102 | 11.4%), psychology (93 | 10.4%), and engineering (78 | 8.7%) are the most common fields of study among 898 individuals in Lawrence Park who have obtained a bachelor's degree or higher.
| Field of Study | # Graduates | % Graduates |
| Computers & Mathematics | 29 | 3.2% |
| Bio, Nature & Agricultural | 21 | 2.3% |
| Physical & Health Sciences | 24 | 2.7% |
| Psychology | 93 | 10.4% |
| Social Sciences | 45 | 5.0% |
| Engineering | 78 | 8.7% |
| Multidisciplinary Studies | 0 | 0.0% |
| Science & Technology | 68 | 7.6% |
| Business | 174 | 19.4% |
| Education | 137 | 15.3% |
| Literature & Languages | 13 | 1.5% |
| Liberal Arts & History | 60 | 6.7% |
| Visual & Performing Arts | 28 | 3.1% |
| Communications | 26 | 2.9% |
| Arts & Humanities | 102 | 11.4% |
| Total | 898 | 100.0% |
Transportation & Commute in Lawrence Park
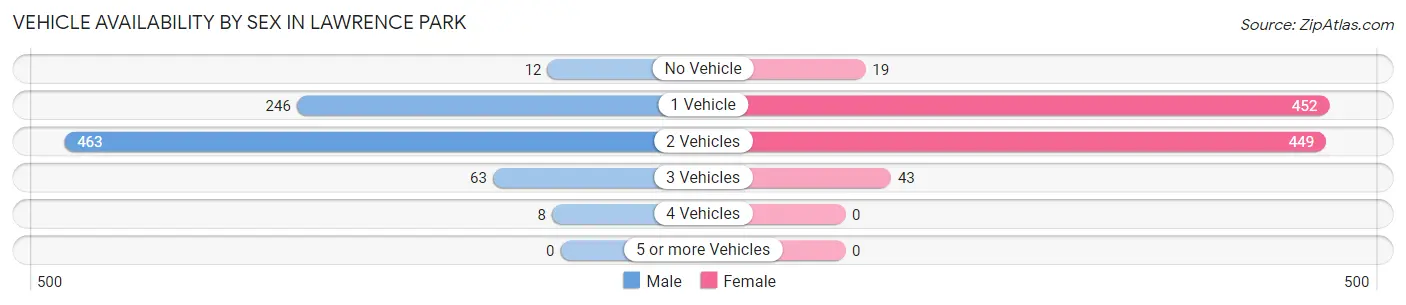
Vehicle Availability by Sex in Lawrence Park
The most prevalent vehicle ownership categories in Lawrence Park are males with 2 vehicles (463, accounting for 58.5%) and females with 2 vehicles (449, making up 48.1%).
| Vehicles Available | Male | Female |
| No Vehicle | 12 (1.5%) | 19 (2.0%) |
| 1 Vehicle | 246 (31.1%) | 452 (46.9%) |
| 2 Vehicles | 463 (58.5%) | 449 (46.6%) |
| 3 Vehicles | 63 (8.0%) | 43 (4.5%) |
| 4 Vehicles | 8 (1.0%) | 0 (0.0%) |
| 5 or more Vehicles | 0 (0.0%) | 0 (0.0%) |
| Total | 792 (100.0%) | 963 (100.0%) |
Commute Time in Lawrence Park
The most frequently occuring commute durations in Lawrence Park are 20 to 24 minutes (411 commuters, 24.8%), 10 to 14 minutes (320 commuters, 19.4%), and 15 to 19 minutes (297 commuters, 18.0%).
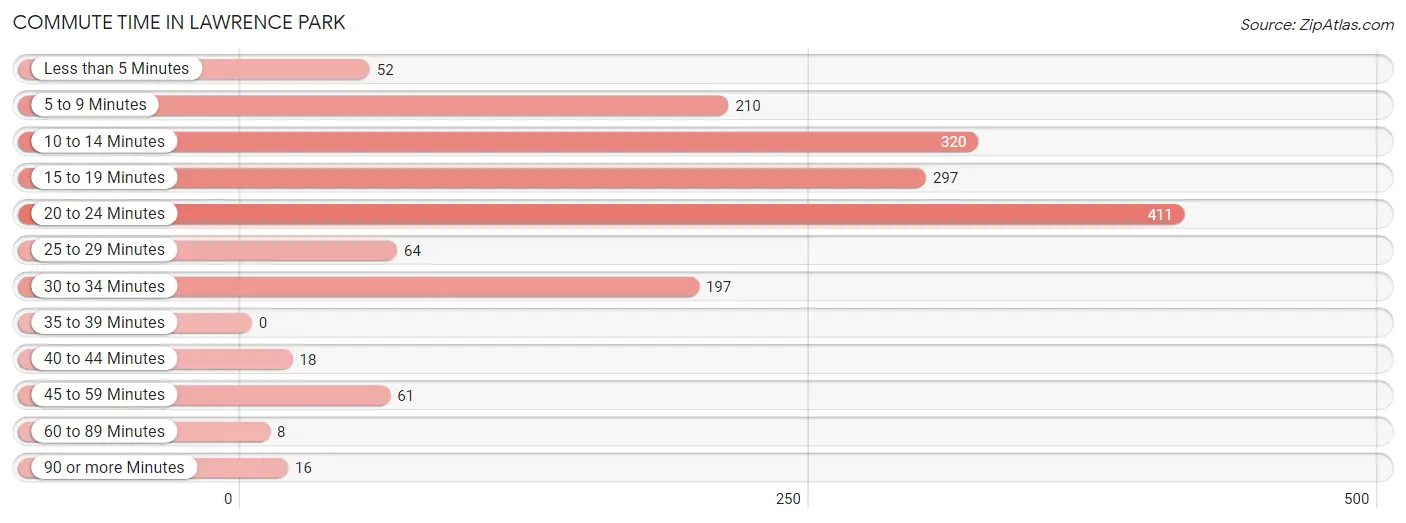
| Commute Time | # Commuters | % Commuters |
| Less than 5 Minutes | 52 | 3.1% |
| 5 to 9 Minutes | 210 | 12.7% |
| 10 to 14 Minutes | 320 | 19.4% |
| 15 to 19 Minutes | 297 | 18.0% |
| 20 to 24 Minutes | 411 | 24.8% |
| 25 to 29 Minutes | 64 | 3.9% |
| 30 to 34 Minutes | 197 | 11.9% |
| 35 to 39 Minutes | 0 | 0.0% |
| 40 to 44 Minutes | 18 | 1.1% |
| 45 to 59 Minutes | 61 | 3.7% |
| 60 to 89 Minutes | 8 | 0.5% |
| 90 or more Minutes | 16 | 1.0% |
Commute Time by Sex in Lawrence Park
The most common commute times in Lawrence Park are 20 to 24 minutes (253 commuters, 33.4%) for males and 10 to 14 minutes (193 commuters, 21.5%) for females.
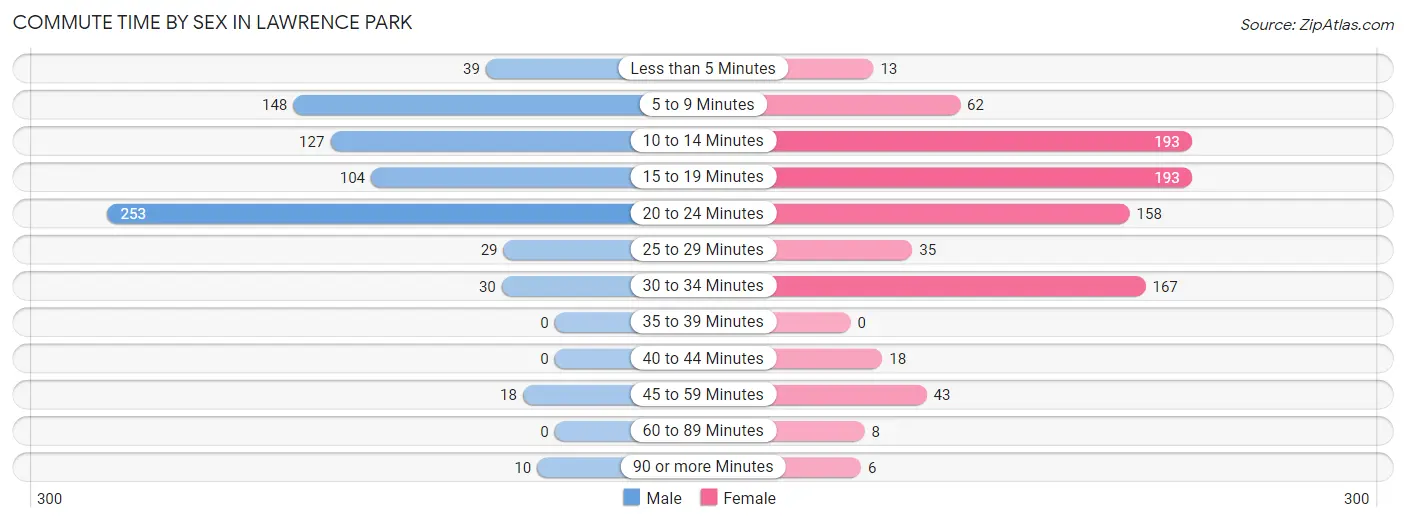
| Commute Time | Male | Female |
| Less than 5 Minutes | 39 (5.1%) | 13 (1.5%) |
| 5 to 9 Minutes | 148 (19.5%) | 62 (6.9%) |
| 10 to 14 Minutes | 127 (16.8%) | 193 (21.5%) |
| 15 to 19 Minutes | 104 (13.7%) | 193 (21.5%) |
| 20 to 24 Minutes | 253 (33.4%) | 158 (17.6%) |
| 25 to 29 Minutes | 29 (3.8%) | 35 (3.9%) |
| 30 to 34 Minutes | 30 (4.0%) | 167 (18.6%) |
| 35 to 39 Minutes | 0 (0.0%) | 0 (0.0%) |
| 40 to 44 Minutes | 0 (0.0%) | 18 (2.0%) |
| 45 to 59 Minutes | 18 (2.4%) | 43 (4.8%) |
| 60 to 89 Minutes | 0 (0.0%) | 8 (0.9%) |
| 90 or more Minutes | 10 (1.3%) | 6 (0.7%) |
Time of Departure to Work by Sex in Lawrence Park
The most frequent times of departure to work in Lawrence Park are 7:00 AM to 7:29 AM (158, 20.8%) for males and 7:30 AM to 7:59 AM (159, 17.7%) for females.
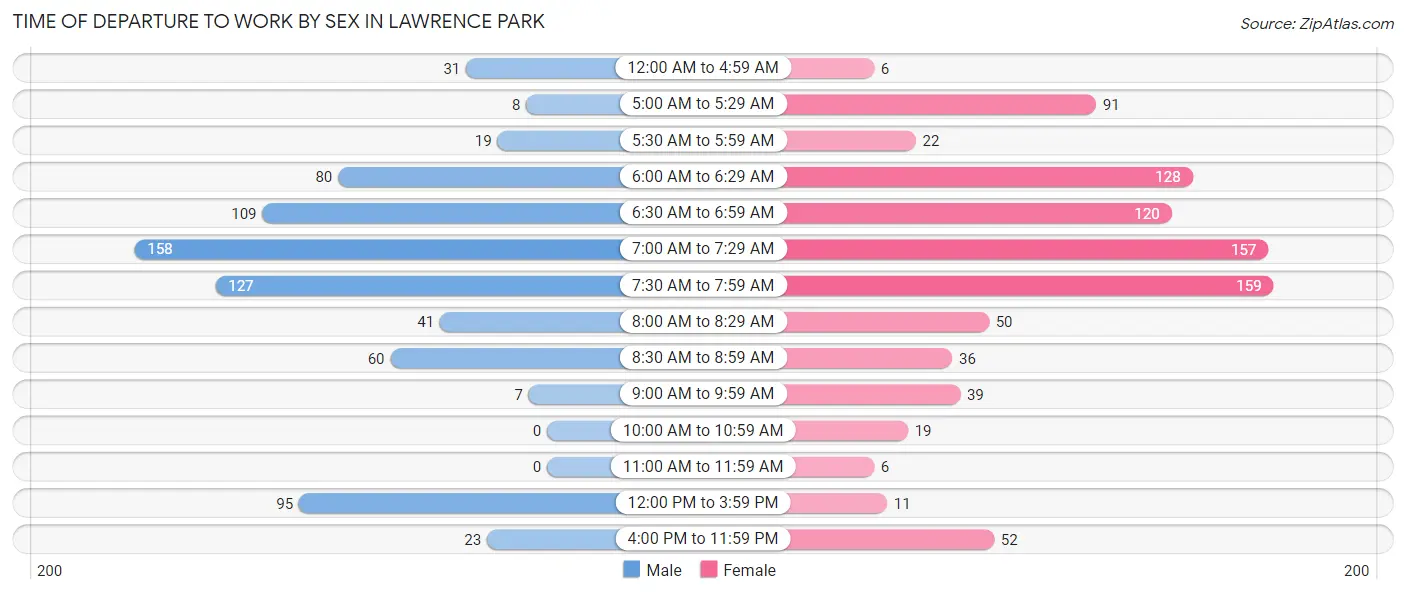
| Time of Departure | Male | Female |
| 12:00 AM to 4:59 AM | 31 (4.1%) | 6 (0.7%) |
| 5:00 AM to 5:29 AM | 8 (1.1%) | 91 (10.2%) |
| 5:30 AM to 5:59 AM | 19 (2.5%) | 22 (2.5%) |
| 6:00 AM to 6:29 AM | 80 (10.5%) | 128 (14.3%) |
| 6:30 AM to 6:59 AM | 109 (14.4%) | 120 (13.4%) |
| 7:00 AM to 7:29 AM | 158 (20.8%) | 157 (17.5%) |
| 7:30 AM to 7:59 AM | 127 (16.8%) | 159 (17.7%) |
| 8:00 AM to 8:29 AM | 41 (5.4%) | 50 (5.6%) |
| 8:30 AM to 8:59 AM | 60 (7.9%) | 36 (4.0%) |
| 9:00 AM to 9:59 AM | 7 (0.9%) | 39 (4.3%) |
| 10:00 AM to 10:59 AM | 0 (0.0%) | 19 (2.1%) |
| 11:00 AM to 11:59 AM | 0 (0.0%) | 6 (0.7%) |
| 12:00 PM to 3:59 PM | 95 (12.5%) | 11 (1.2%) |
| 4:00 PM to 11:59 PM | 23 (3.0%) | 52 (5.8%) |
| Total | 758 (100.0%) | 896 (100.0%) |
Housing Occupancy in Lawrence Park
Occupancy by Ownership in Lawrence Park
Of the total 1,497 dwellings in Lawrence Park, owner-occupied units account for 1,167 (78.0%), while renter-occupied units make up 330 (22.0%).
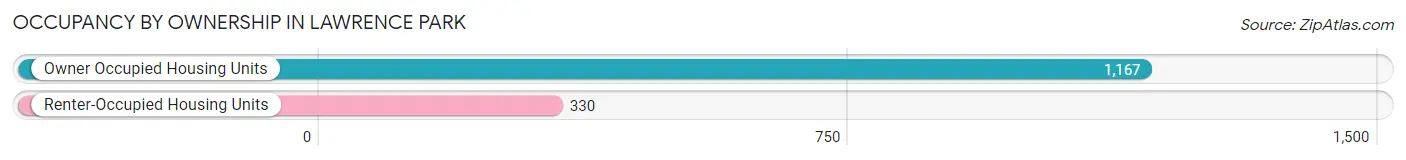
| Occupancy | # Housing Units | % Housing Units |
| Owner Occupied Housing Units | 1,167 | 78.0% |
| Renter-Occupied Housing Units | 330 | 22.0% |
| Total Occupied Housing Units | 1,497 | 100.0% |
Occupancy by Household Size in Lawrence Park
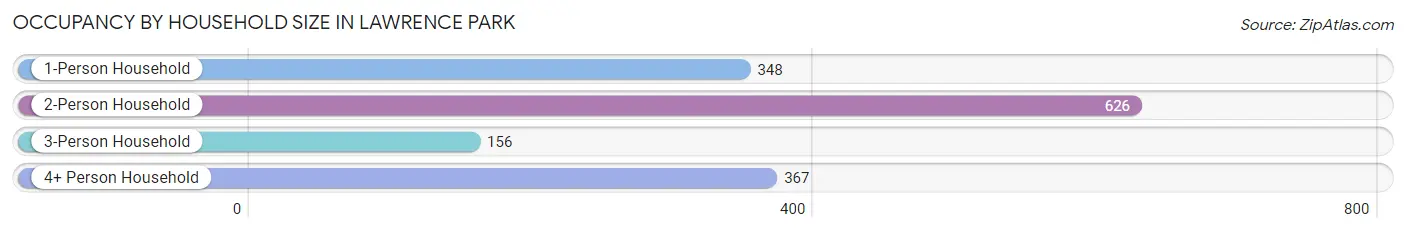
| Household Size | # Housing Units | % Housing Units |
| 1-Person Household | 348 | 23.3% |
| 2-Person Household | 626 | 41.8% |
| 3-Person Household | 156 | 10.4% |
| 4+ Person Household | 367 | 24.5% |
| Total Housing Units | 1,497 | 100.0% |
Occupancy by Ownership by Household Size in Lawrence Park
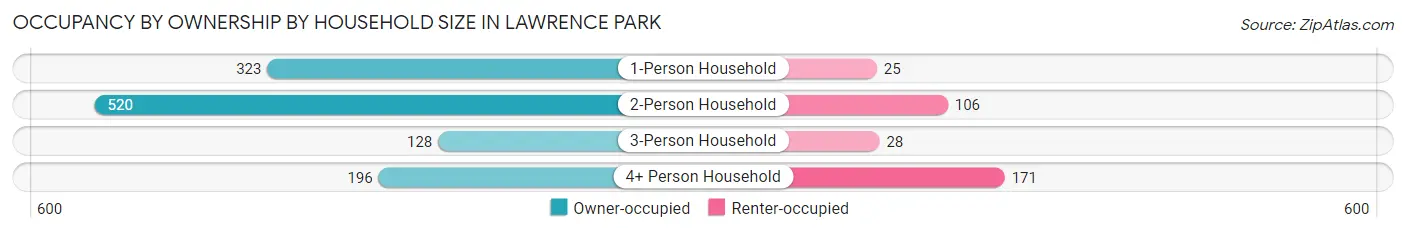
| Household Size | Owner-occupied | Renter-occupied |
| 1-Person Household | 323 (92.8%) | 25 (7.2%) |
| 2-Person Household | 520 (83.1%) | 106 (16.9%) |
| 3-Person Household | 128 (82.1%) | 28 (17.9%) |
| 4+ Person Household | 196 (53.4%) | 171 (46.6%) |
| Total Housing Units | 1,167 (78.0%) | 330 (22.0%) |
Occupancy by Educational Attainment in Lawrence Park
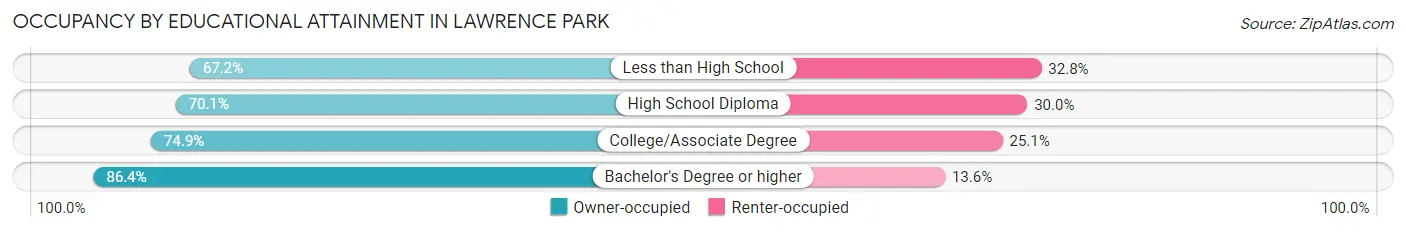
| Household Size | Owner-occupied | Renter-occupied |
| Less than High School | 39 (67.2%) | 19 (32.8%) |
| High School Diploma | 297 (70.1%) | 127 (29.9%) |
| College/Associate Degree | 299 (74.9%) | 100 (25.1%) |
| Bachelor's Degree or higher | 532 (86.4%) | 84 (13.6%) |
Occupancy by Age of Householder in Lawrence Park
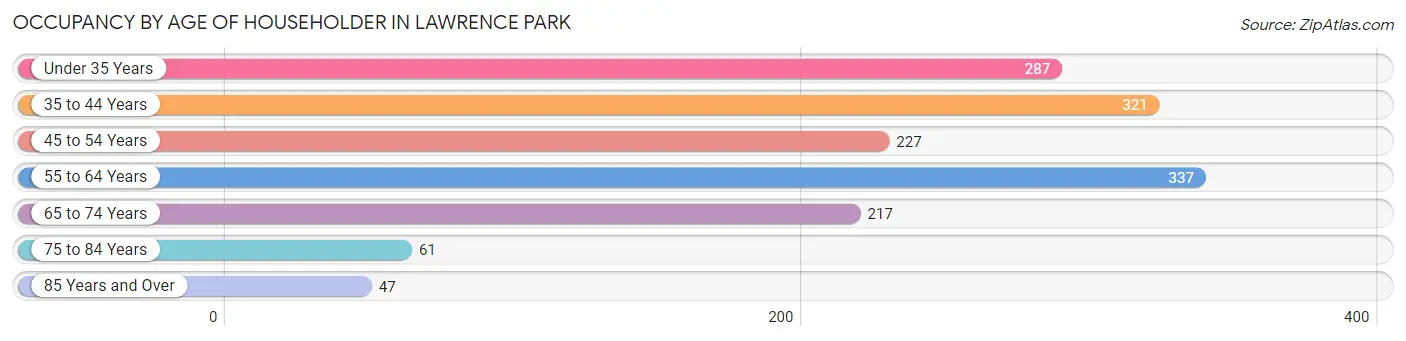
| Age Bracket | # Households | % Households |
| Under 35 Years | 287 | 19.2% |
| 35 to 44 Years | 321 | 21.4% |
| 45 to 54 Years | 227 | 15.2% |
| 55 to 64 Years | 337 | 22.5% |
| 65 to 74 Years | 217 | 14.5% |
| 75 to 84 Years | 61 | 4.1% |
| 85 Years and Over | 47 | 3.1% |
| Total | 1,497 | 100.0% |
Housing Finances in Lawrence Park
Median Income by Occupancy in Lawrence Park
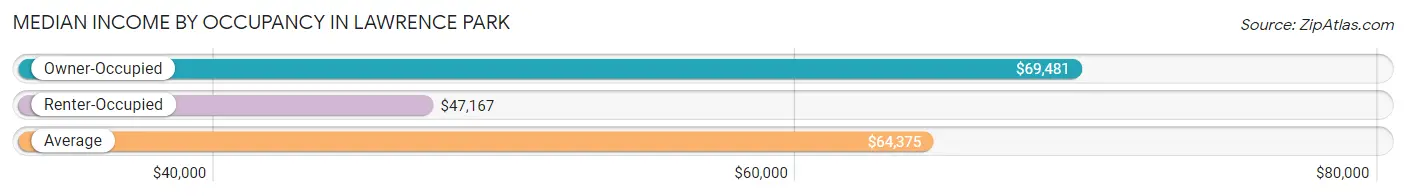
| Occupancy Type | # Households | Median Income |
| Owner-Occupied | 1,167 (78.0%) | $69,481 |
| Renter-Occupied | 330 (22.0%) | $47,167 |
| Average | 1,497 (100.0%) | $64,375 |
Occupancy by Householder Income Bracket in Lawrence Park
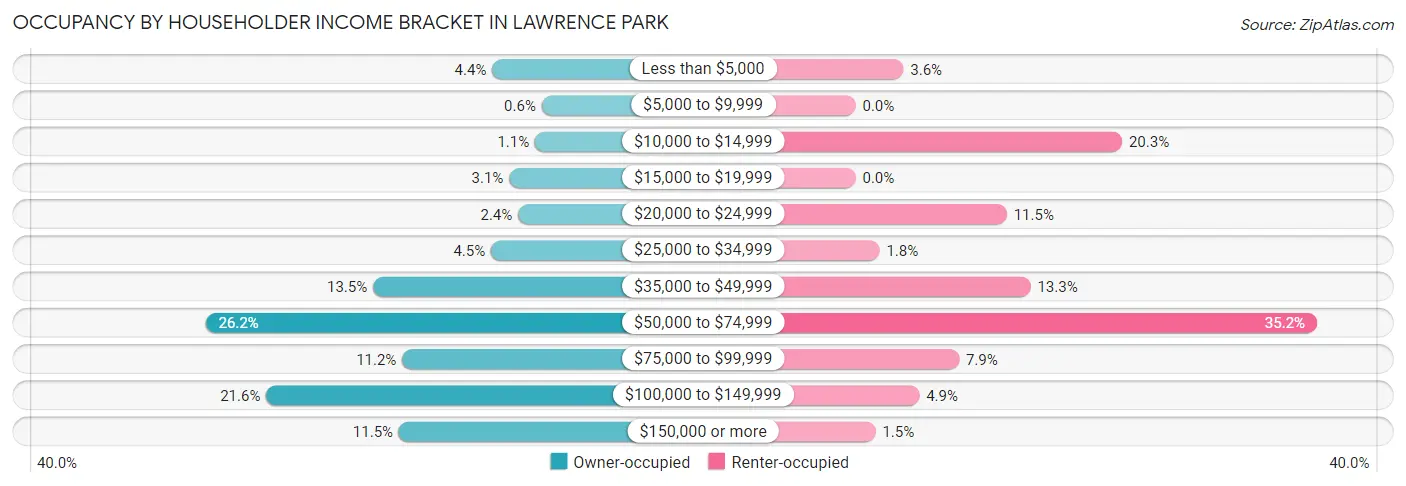
| Income Bracket | Owner-occupied | Renter-occupied |
| Less than $5,000 | 51 (4.4%) | 12 (3.6%) |
| $5,000 to $9,999 | 7 (0.6%) | 0 (0.0%) |
| $10,000 to $14,999 | 13 (1.1%) | 67 (20.3%) |
| $15,000 to $19,999 | 36 (3.1%) | 0 (0.0%) |
| $20,000 to $24,999 | 28 (2.4%) | 38 (11.5%) |
| $25,000 to $34,999 | 52 (4.5%) | 6 (1.8%) |
| $35,000 to $49,999 | 157 (13.5%) | 44 (13.3%) |
| $50,000 to $74,999 | 306 (26.2%) | 116 (35.1%) |
| $75,000 to $99,999 | 131 (11.2%) | 26 (7.9%) |
| $100,000 to $149,999 | 252 (21.6%) | 16 (4.9%) |
| $150,000 or more | 134 (11.5%) | 5 (1.5%) |
| Total | 1,167 (100.0%) | 330 (100.0%) |
Monthly Housing Cost Tiers in Lawrence Park
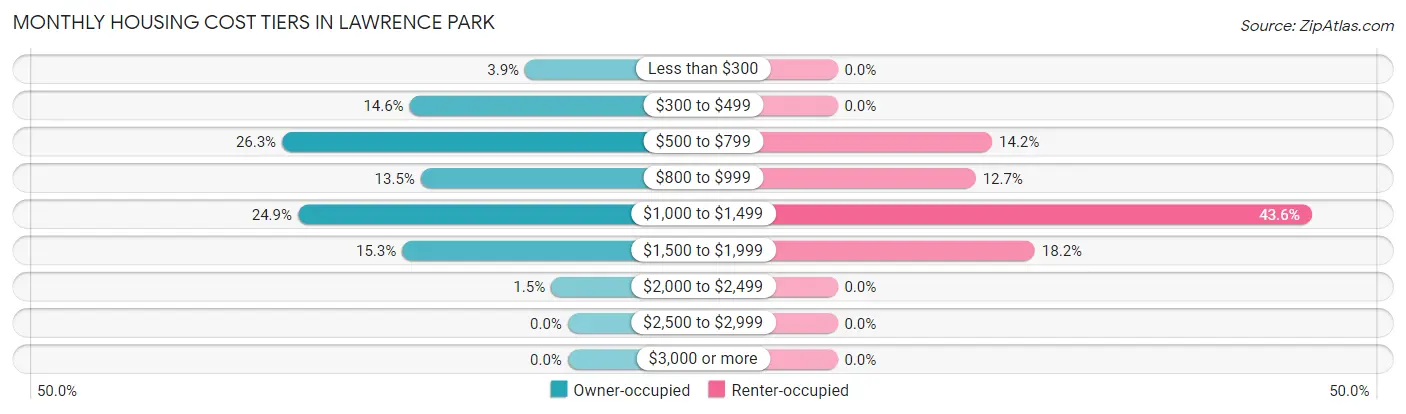
| Monthly Cost | Owner-occupied | Renter-occupied |
| Less than $300 | 46 (3.9%) | 0 (0.0%) |
| $300 to $499 | 170 (14.6%) | 0 (0.0%) |
| $500 to $799 | 307 (26.3%) | 47 (14.2%) |
| $800 to $999 | 158 (13.5%) | 42 (12.7%) |
| $1,000 to $1,499 | 290 (24.8%) | 144 (43.6%) |
| $1,500 to $1,999 | 178 (15.2%) | 60 (18.2%) |
| $2,000 to $2,499 | 18 (1.5%) | 0 (0.0%) |
| $2,500 to $2,999 | 0 (0.0%) | 0 (0.0%) |
| $3,000 or more | 0 (0.0%) | 0 (0.0%) |
| Total | 1,167 (100.0%) | 330 (100.0%) |
Physical Housing Characteristics in Lawrence Park
Housing Structures in Lawrence Park
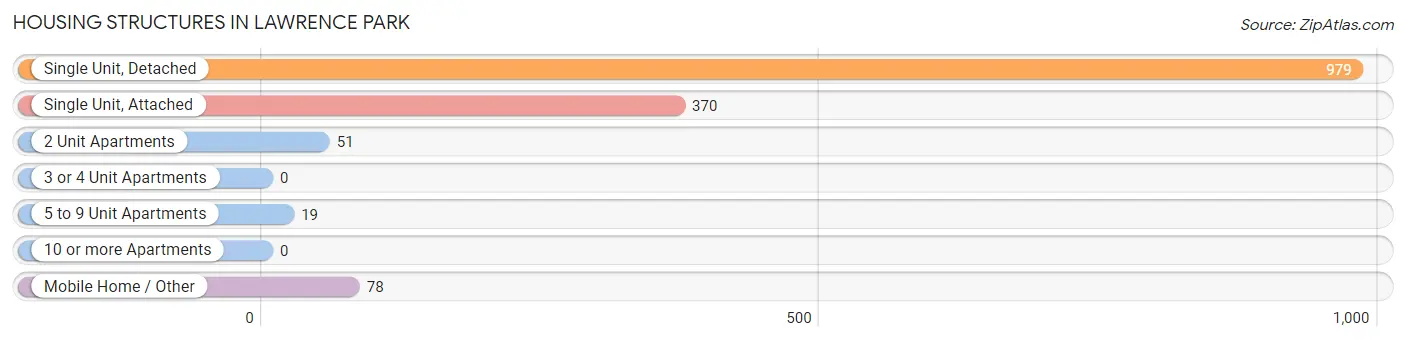
| Structure Type | # Housing Units | % Housing Units |
| Single Unit, Detached | 979 | 65.4% |
| Single Unit, Attached | 370 | 24.7% |
| 2 Unit Apartments | 51 | 3.4% |
| 3 or 4 Unit Apartments | 0 | 0.0% |
| 5 to 9 Unit Apartments | 19 | 1.3% |
| 10 or more Apartments | 0 | 0.0% |
| Mobile Home / Other | 78 | 5.2% |
| Total | 1,497 | 100.0% |
Housing Structures by Occupancy in Lawrence Park
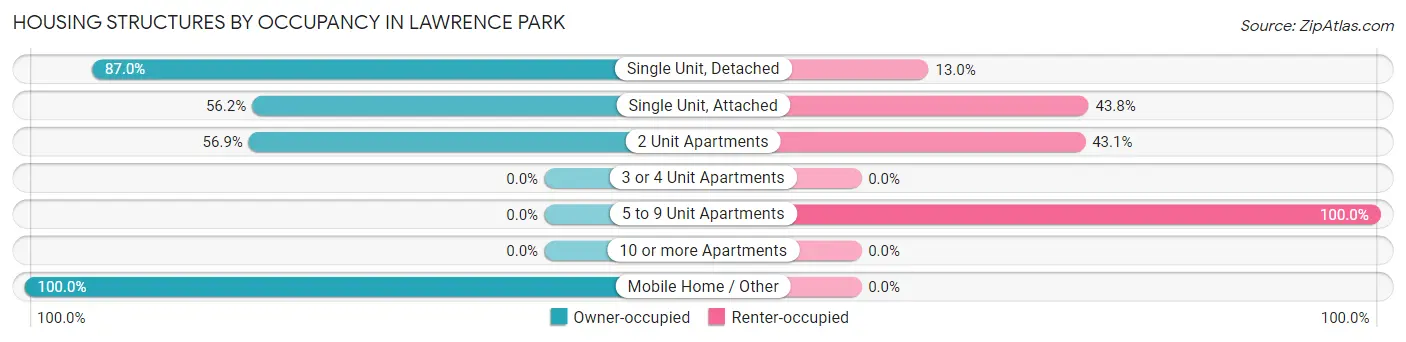
| Structure Type | Owner-occupied | Renter-occupied |
| Single Unit, Detached | 852 (87.0%) | 127 (13.0%) |
| Single Unit, Attached | 208 (56.2%) | 162 (43.8%) |
| 2 Unit Apartments | 29 (56.9%) | 22 (43.1%) |
| 3 or 4 Unit Apartments | 0 (0.0%) | 0 (0.0%) |
| 5 to 9 Unit Apartments | 0 (0.0%) | 19 (100.0%) |
| 10 or more Apartments | 0 (0.0%) | 0 (0.0%) |
| Mobile Home / Other | 78 (100.0%) | 0 (0.0%) |
| Total | 1,167 (78.0%) | 330 (22.0%) |
Housing Structures by Number of Rooms in Lawrence Park
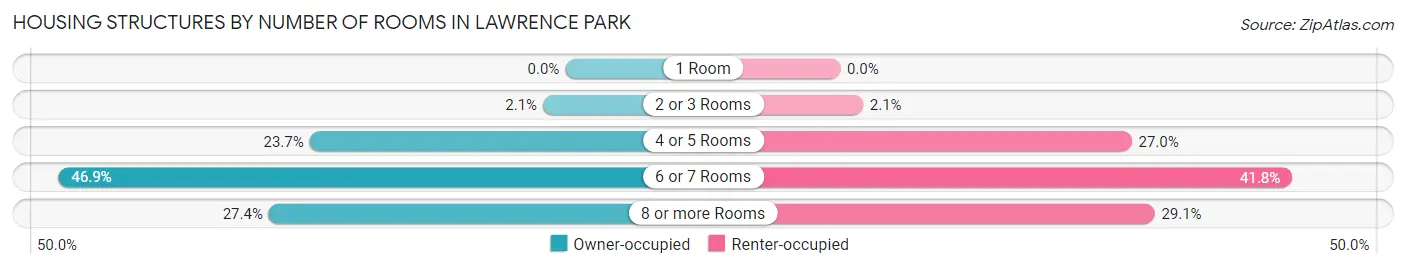
| Number of Rooms | Owner-occupied | Renter-occupied |
| 1 Room | 0 (0.0%) | 0 (0.0%) |
| 2 or 3 Rooms | 24 (2.1%) | 7 (2.1%) |
| 4 or 5 Rooms | 276 (23.6%) | 89 (27.0%) |
| 6 or 7 Rooms | 547 (46.9%) | 138 (41.8%) |
| 8 or more Rooms | 320 (27.4%) | 96 (29.1%) |
| Total | 1,167 (100.0%) | 330 (100.0%) |
Housing Structure by Heating Type in Lawrence Park
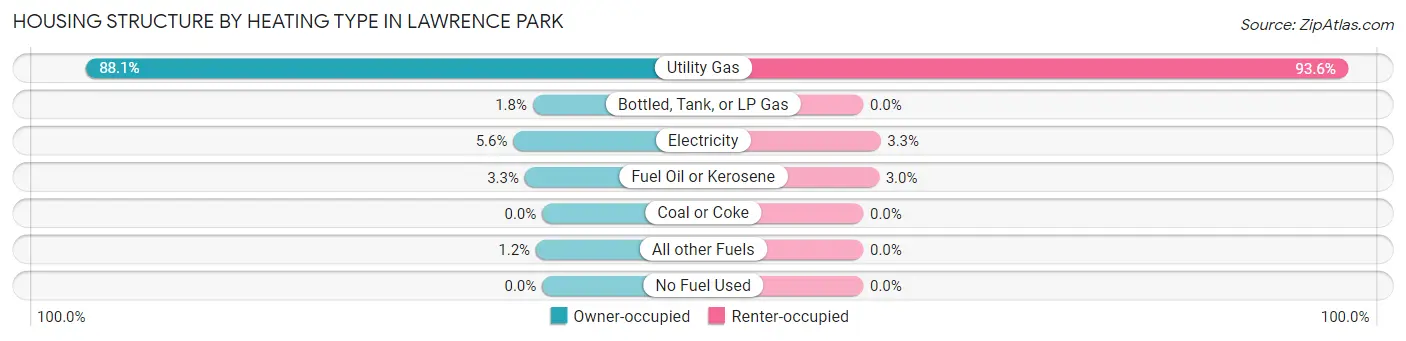
| Heating Type | Owner-occupied | Renter-occupied |
| Utility Gas | 1,028 (88.1%) | 309 (93.6%) |
| Bottled, Tank, or LP Gas | 21 (1.8%) | 0 (0.0%) |
| Electricity | 65 (5.6%) | 11 (3.3%) |
| Fuel Oil or Kerosene | 39 (3.3%) | 10 (3.0%) |
| Coal or Coke | 0 (0.0%) | 0 (0.0%) |
| All other Fuels | 14 (1.2%) | 0 (0.0%) |
| No Fuel Used | 0 (0.0%) | 0 (0.0%) |
| Total | 1,167 (100.0%) | 330 (100.0%) |
Household Vehicle Usage in Lawrence Park
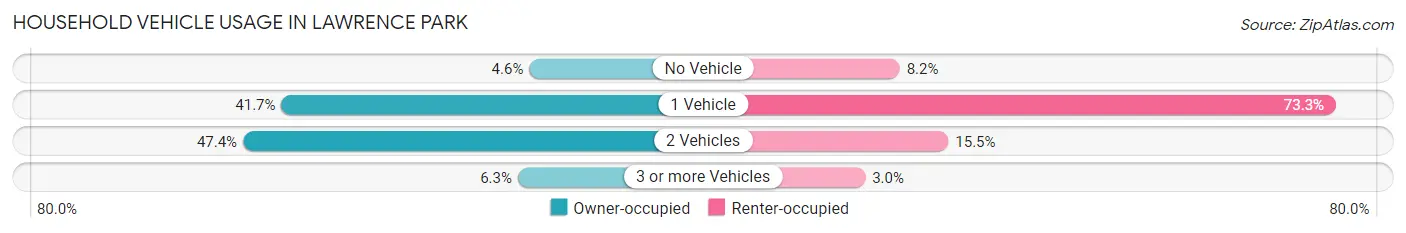
| Vehicles per Household | Owner-occupied | Renter-occupied |
| No Vehicle | 54 (4.6%) | 27 (8.2%) |
| 1 Vehicle | 486 (41.6%) | 242 (73.3%) |
| 2 Vehicles | 553 (47.4%) | 51 (15.4%) |
| 3 or more Vehicles | 74 (6.3%) | 10 (3.0%) |
| Total | 1,167 (100.0%) | 330 (100.0%) |
Real Estate & Mortgages in Lawrence Park
Real Estate and Mortgage Overview in Lawrence Park
| Characteristic | Without Mortgage | With Mortgage |
| Housing Units | 457 | 710 |
| Median Property Value | $109,300 | $135,000 |
| Median Household Income | $50,823 | $102 |
| Monthly Housing Costs | $521 | $0 |
| Real Estate Taxes | $2,670 | $7 |
Property Value by Mortgage Status in Lawrence Park
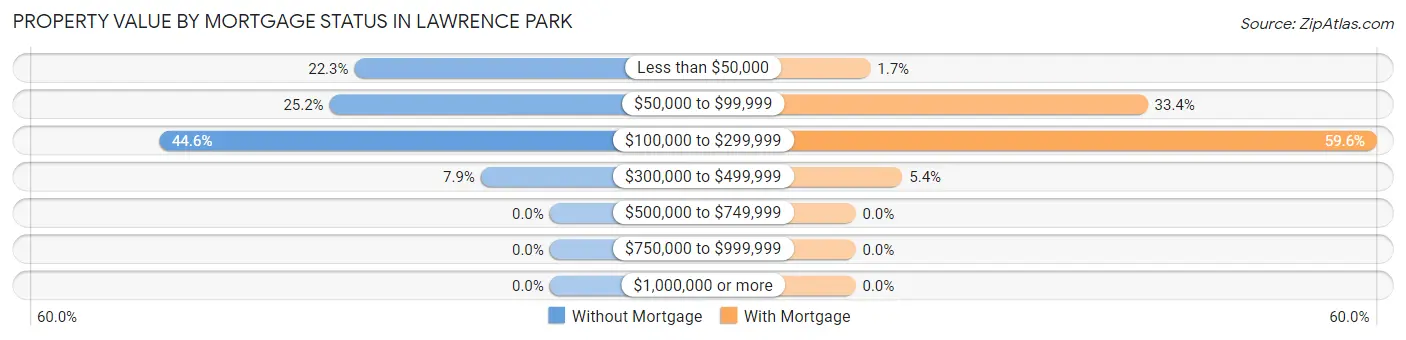
| Property Value | Without Mortgage | With Mortgage |
| Less than $50,000 | 102 (22.3%) | 12 (1.7%) |
| $50,000 to $99,999 | 115 (25.2%) | 237 (33.4%) |
| $100,000 to $299,999 | 204 (44.6%) | 423 (59.6%) |
| $300,000 to $499,999 | 36 (7.9%) | 38 (5.3%) |
| $500,000 to $749,999 | 0 (0.0%) | 0 (0.0%) |
| $750,000 to $999,999 | 0 (0.0%) | 0 (0.0%) |
| $1,000,000 or more | 0 (0.0%) | 0 (0.0%) |
| Total | 457 (100.0%) | 710 (100.0%) |
Household Income by Mortgage Status in Lawrence Park
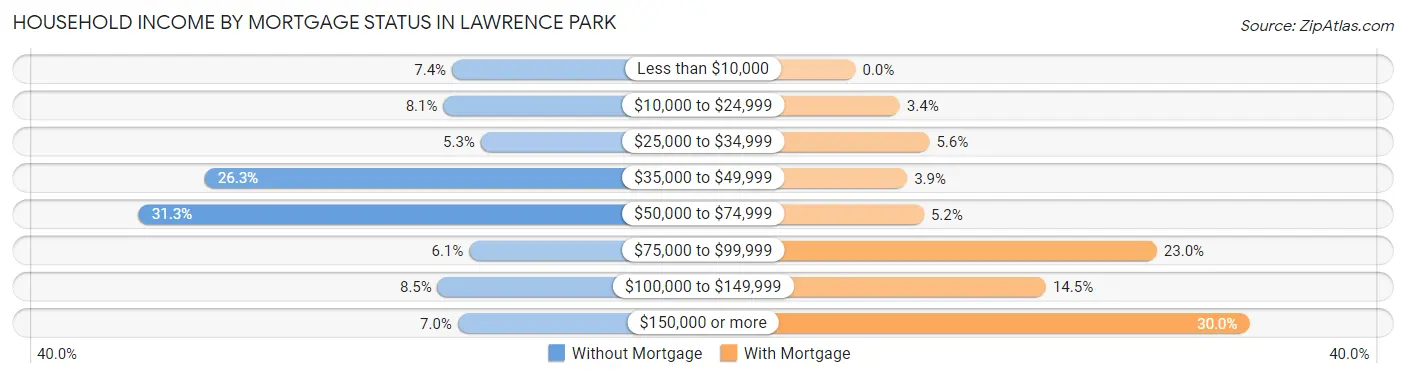
| Household Income | Without Mortgage | With Mortgage |
| Less than $10,000 | 34 (7.4%) | 0 (0.0%) |
| $10,000 to $24,999 | 37 (8.1%) | 24 (3.4%) |
| $25,000 to $34,999 | 24 (5.2%) | 40 (5.6%) |
| $35,000 to $49,999 | 120 (26.3%) | 28 (3.9%) |
| $50,000 to $74,999 | 143 (31.3%) | 37 (5.2%) |
| $75,000 to $99,999 | 28 (6.1%) | 163 (23.0%) |
| $100,000 to $149,999 | 39 (8.5%) | 103 (14.5%) |
| $150,000 or more | 32 (7.0%) | 213 (30.0%) |
| Total | 457 (100.0%) | 710 (100.0%) |
Property Value to Household Income Ratio in Lawrence Park
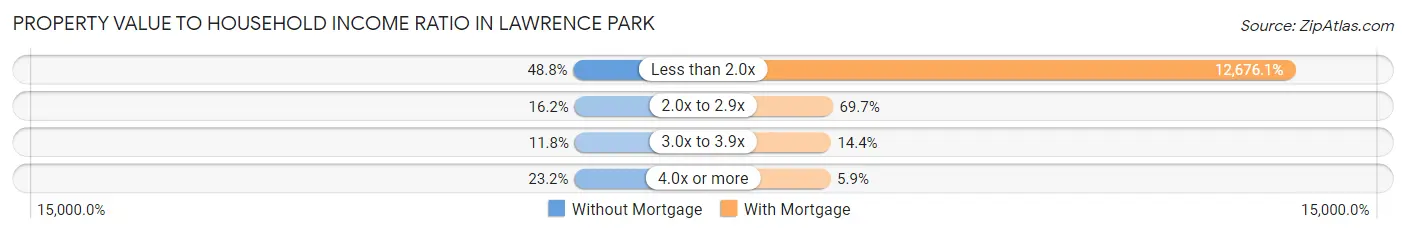
| Value-to-Income Ratio | Without Mortgage | With Mortgage |
| Less than 2.0x | 223 (48.8%) | 90,000 (12,676.1%) |
| 2.0x to 2.9x | 74 (16.2%) | 495 (69.7%) |
| 3.0x to 3.9x | 54 (11.8%) | 102 (14.4%) |
| 4.0x or more | 106 (23.2%) | 42 (5.9%) |
| Total | 457 (100.0%) | 710 (100.0%) |
Real Estate Taxes by Mortgage Status in Lawrence Park
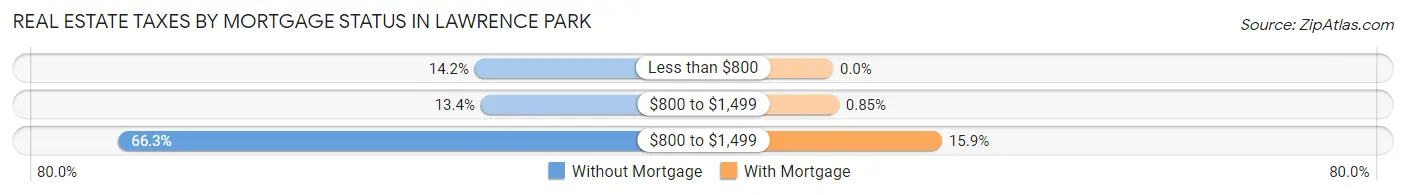
| Property Taxes | Without Mortgage | With Mortgage |
| Less than $800 | 65 (14.2%) | 0 (0.0%) |
| $800 to $1,499 | 61 (13.4%) | 6 (0.9%) |
| $800 to $1,499 | 303 (66.3%) | 113 (15.9%) |
| Total | 457 (100.0%) | 710 (100.0%) |
Health & Disability in Lawrence Park
Health Insurance Coverage by Age in Lawrence Park
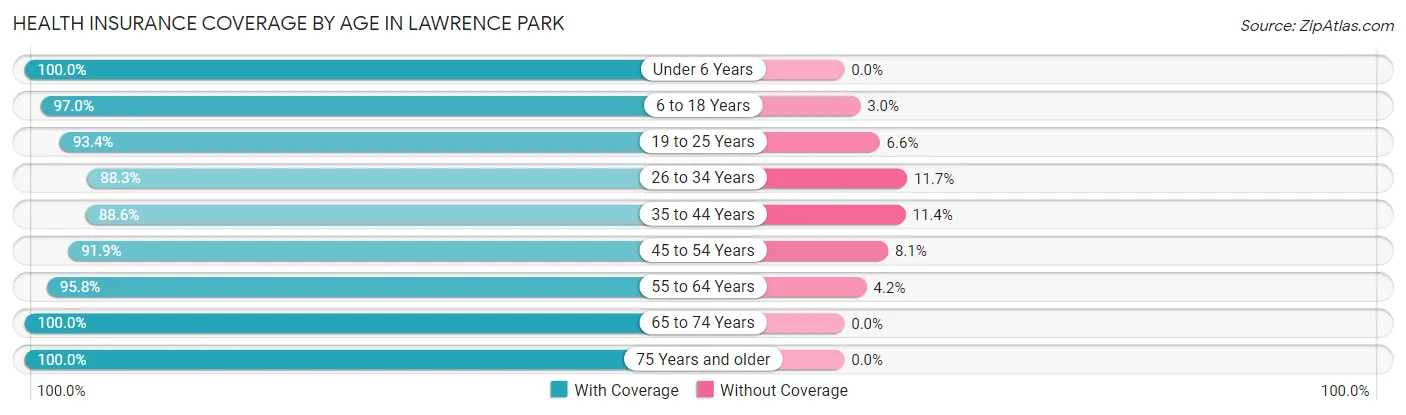
| Age Bracket | With Coverage | Without Coverage |
| Under 6 Years | 293 (100.0%) | 0 (0.0%) |
| 6 to 18 Years | 913 (97.0%) | 28 (3.0%) |
| 19 to 25 Years | 170 (93.4%) | 12 (6.6%) |
| 26 to 34 Years | 332 (88.3%) | 44 (11.7%) |
| 35 to 44 Years | 449 (88.6%) | 58 (11.4%) |
| 45 to 54 Years | 316 (91.9%) | 28 (8.1%) |
| 55 to 64 Years | 552 (95.8%) | 24 (4.2%) |
| 65 to 74 Years | 333 (100.0%) | 0 (0.0%) |
| 75 Years and older | 148 (100.0%) | 0 (0.0%) |
| Total | 3,506 (94.8%) | 194 (5.2%) |
Health Insurance Coverage by Citizenship Status in Lawrence Park
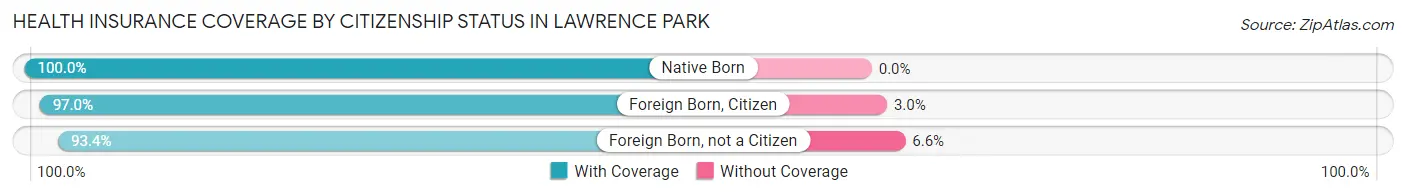
| Citizenship Status | With Coverage | Without Coverage |
| Native Born | 293 (100.0%) | 0 (0.0%) |
| Foreign Born, Citizen | 913 (97.0%) | 28 (3.0%) |
| Foreign Born, not a Citizen | 170 (93.4%) | 12 (6.6%) |
Health Insurance Coverage by Household Income in Lawrence Park
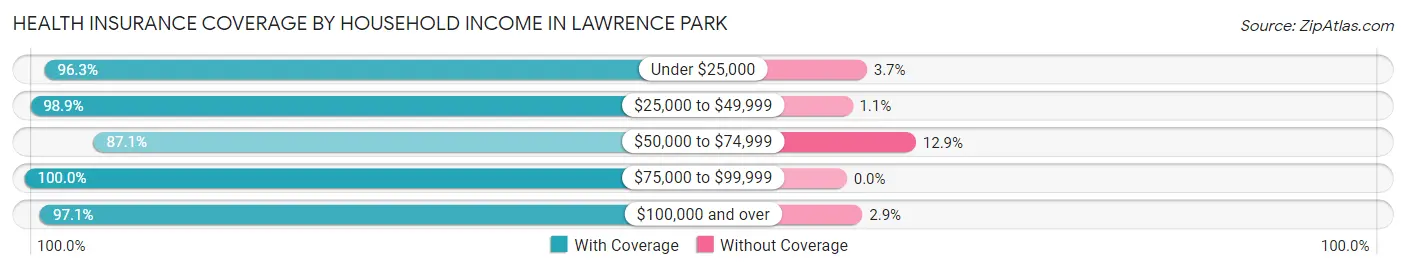
| Household Income | With Coverage | Without Coverage |
| Under $25,000 | 618 (96.3%) | 24 (3.7%) |
| $25,000 to $49,999 | 560 (98.9%) | 6 (1.1%) |
| $50,000 to $74,999 | 881 (87.1%) | 131 (12.9%) |
| $75,000 to $99,999 | 343 (100.0%) | 0 (0.0%) |
| $100,000 and over | 1,098 (97.1%) | 33 (2.9%) |
Public vs Private Health Insurance Coverage by Age in Lawrence Park
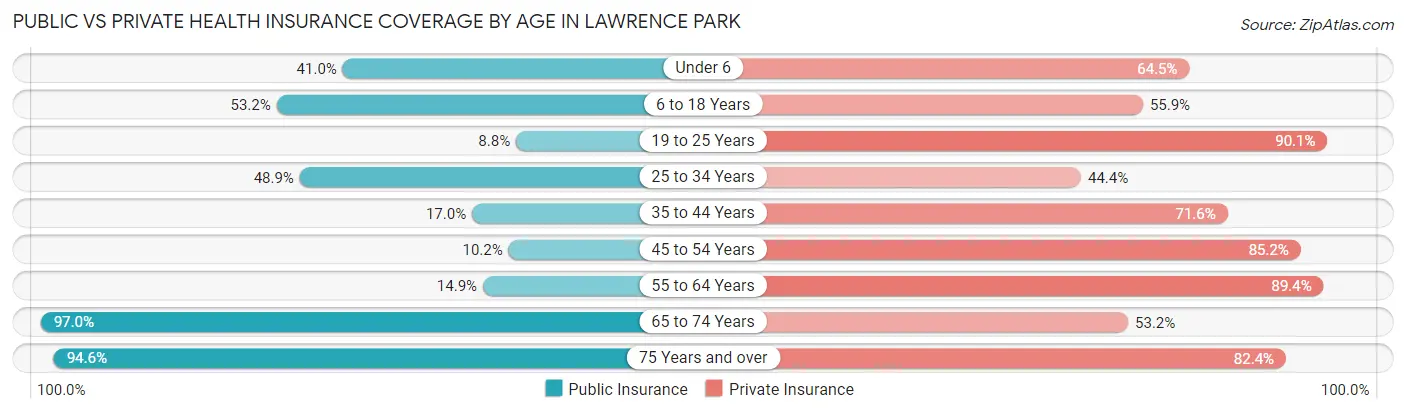
| Age Bracket | Public Insurance | Private Insurance |
| Under 6 | 120 (41.0%) | 189 (64.5%) |
| 6 to 18 Years | 501 (53.2%) | 526 (55.9%) |
| 19 to 25 Years | 16 (8.8%) | 164 (90.1%) |
| 25 to 34 Years | 184 (48.9%) | 167 (44.4%) |
| 35 to 44 Years | 86 (17.0%) | 363 (71.6%) |
| 45 to 54 Years | 35 (10.2%) | 293 (85.2%) |
| 55 to 64 Years | 86 (14.9%) | 515 (89.4%) |
| 65 to 74 Years | 323 (97.0%) | 177 (53.1%) |
| 75 Years and over | 140 (94.6%) | 122 (82.4%) |
| Total | 1,491 (40.3%) | 2,516 (68.0%) |
Disability Status by Sex by Age in Lawrence Park
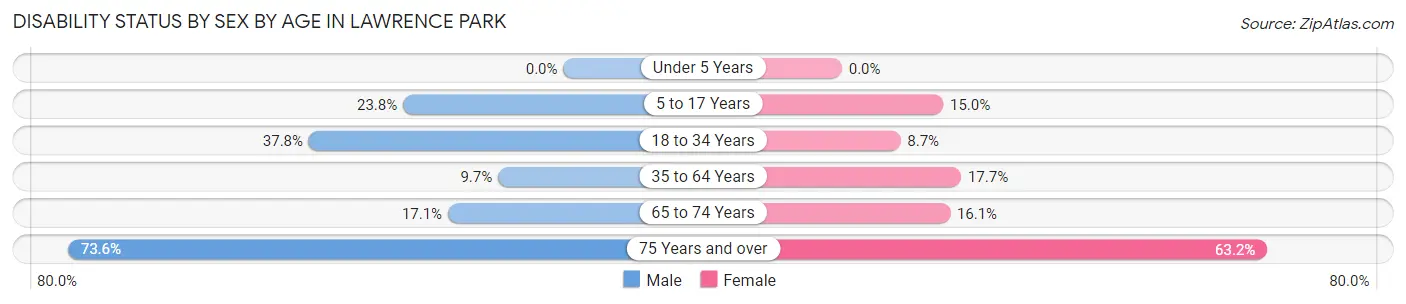
| Age Bracket | Male | Female |
| Under 5 Years | 0 (0.0%) | 0 (0.0%) |
| 5 to 17 Years | 104 (23.8%) | 69 (15.0%) |
| 18 to 34 Years | 113 (37.8%) | 28 (8.7%) |
| 35 to 64 Years | 65 (9.7%) | 134 (17.7%) |
| 65 to 74 Years | 24 (17.1%) | 31 (16.1%) |
| 75 Years and over | 39 (73.6%) | 60 (63.2%) |
Disability Class by Sex by Age in Lawrence Park
Disability Class: Hearing Difficulty
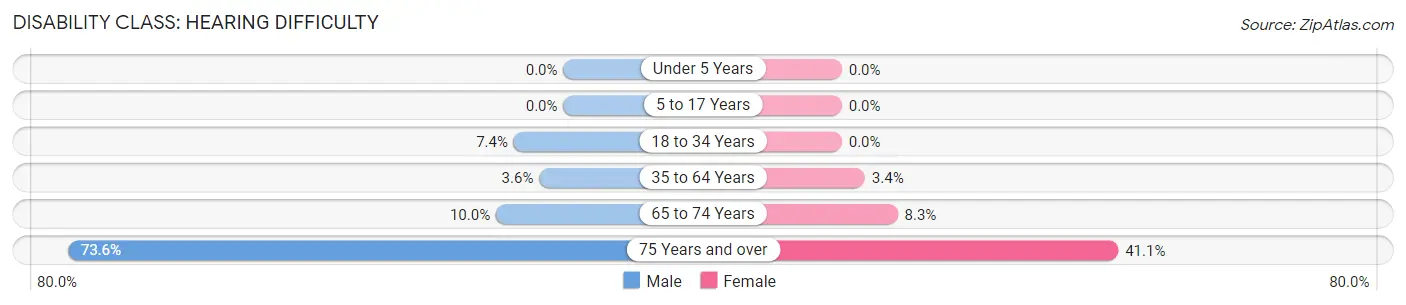
| Age Bracket | Male | Female |
| Under 5 Years | 0 (0.0%) | 0 (0.0%) |
| 5 to 17 Years | 0 (0.0%) | 0 (0.0%) |
| 18 to 34 Years | 22 (7.4%) | 0 (0.0%) |
| 35 to 64 Years | 24 (3.6%) | 26 (3.4%) |
| 65 to 74 Years | 14 (10.0%) | 16 (8.3%) |
| 75 Years and over | 39 (73.6%) | 39 (41.0%) |
Disability Class: Vision Difficulty
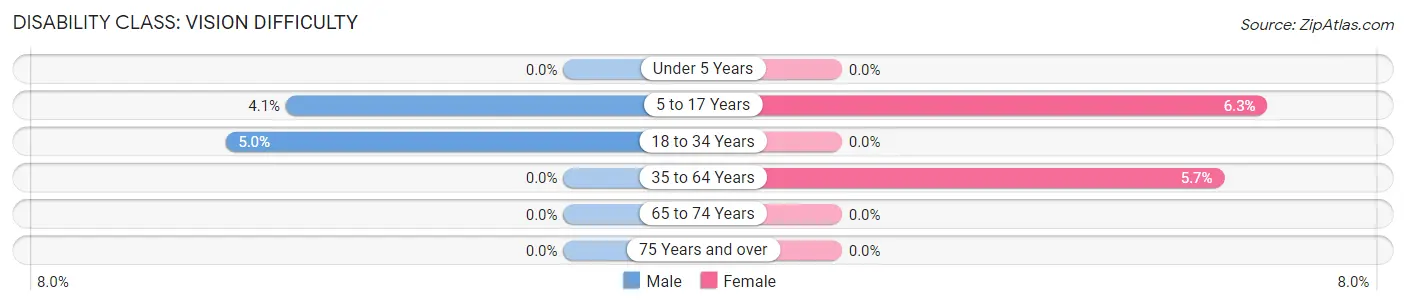
| Age Bracket | Male | Female |
| Under 5 Years | 0 (0.0%) | 0 (0.0%) |
| 5 to 17 Years | 18 (4.1%) | 29 (6.3%) |
| 18 to 34 Years | 15 (5.0%) | 0 (0.0%) |
| 35 to 64 Years | 0 (0.0%) | 43 (5.7%) |
| 65 to 74 Years | 0 (0.0%) | 0 (0.0%) |
| 75 Years and over | 0 (0.0%) | 0 (0.0%) |
Disability Class: Cognitive Difficulty
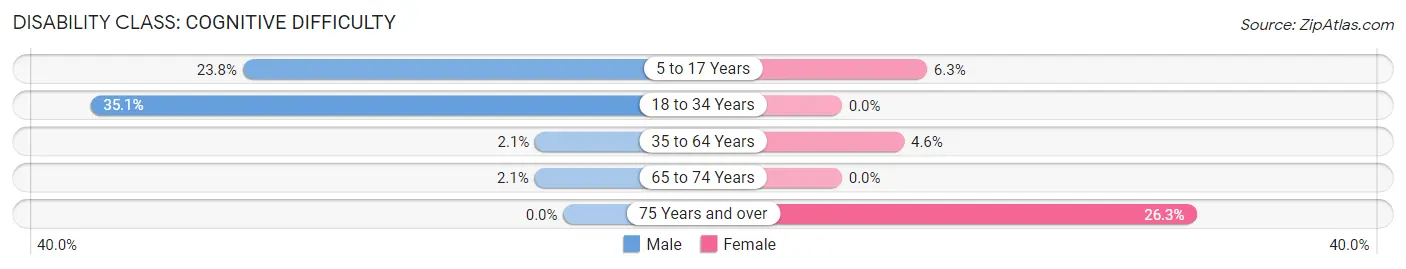
| Age Bracket | Male | Female |
| 5 to 17 Years | 104 (23.8%) | 29 (6.3%) |
| 18 to 34 Years | 105 (35.1%) | 0 (0.0%) |
| 35 to 64 Years | 14 (2.1%) | 35 (4.6%) |
| 65 to 74 Years | 3 (2.1%) | 0 (0.0%) |
| 75 Years and over | 0 (0.0%) | 25 (26.3%) |
Disability Class: Ambulatory Difficulty
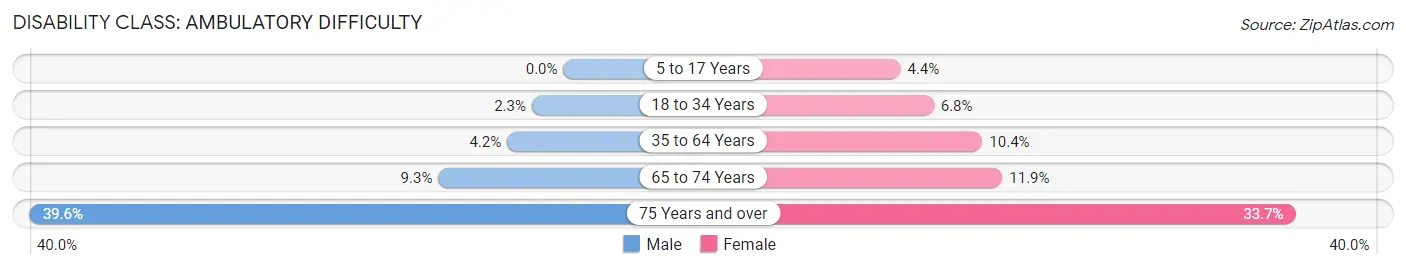
| Age Bracket | Male | Female |
| 5 to 17 Years | 0 (0.0%) | 20 (4.4%) |
| 18 to 34 Years | 7 (2.3%) | 22 (6.8%) |
| 35 to 64 Years | 28 (4.2%) | 79 (10.4%) |
| 65 to 74 Years | 13 (9.3%) | 23 (11.9%) |
| 75 Years and over | 21 (39.6%) | 32 (33.7%) |
Disability Class: Self-Care Difficulty
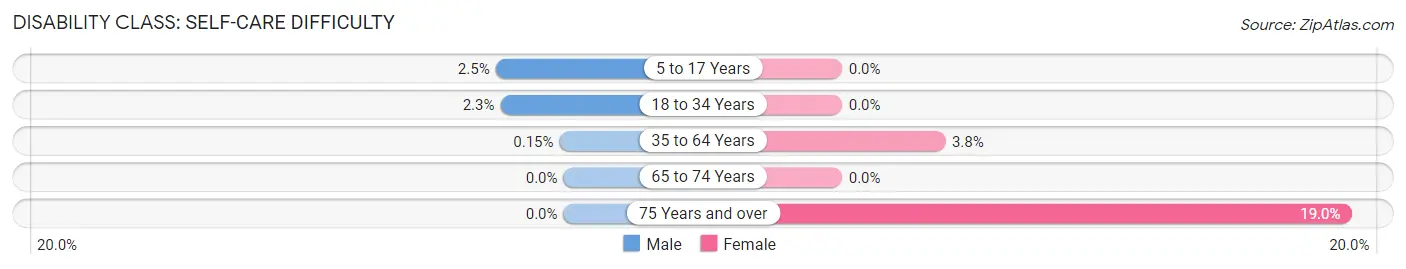
| Age Bracket | Male | Female |
| 5 to 17 Years | 11 (2.5%) | 0 (0.0%) |
| 18 to 34 Years | 7 (2.3%) | 0 (0.0%) |
| 35 to 64 Years | 1 (0.2%) | 29 (3.8%) |
| 65 to 74 Years | 0 (0.0%) | 0 (0.0%) |
| 75 Years and over | 0 (0.0%) | 18 (19.0%) |
Technology Access in Lawrence Park
Computing Device Access in Lawrence Park
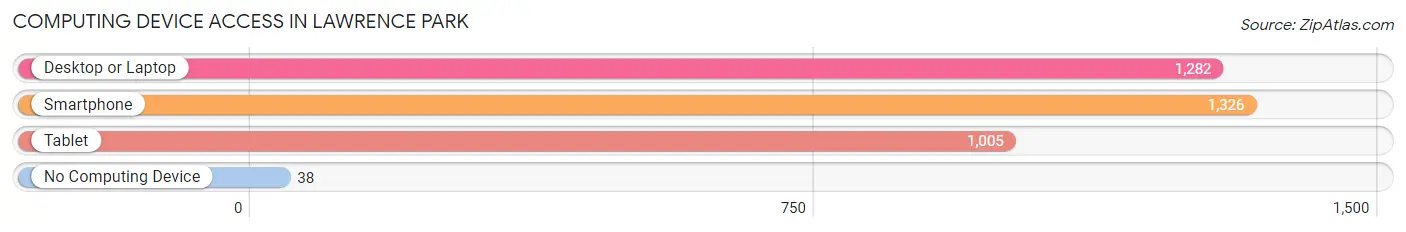
| Device Type | # Households | % Households |
| Desktop or Laptop | 1,282 | 85.6% |
| Smartphone | 1,326 | 88.6% |
| Tablet | 1,005 | 67.1% |
| No Computing Device | 38 | 2.5% |
| Total | 1,497 | 100.0% |
Internet Access in Lawrence Park
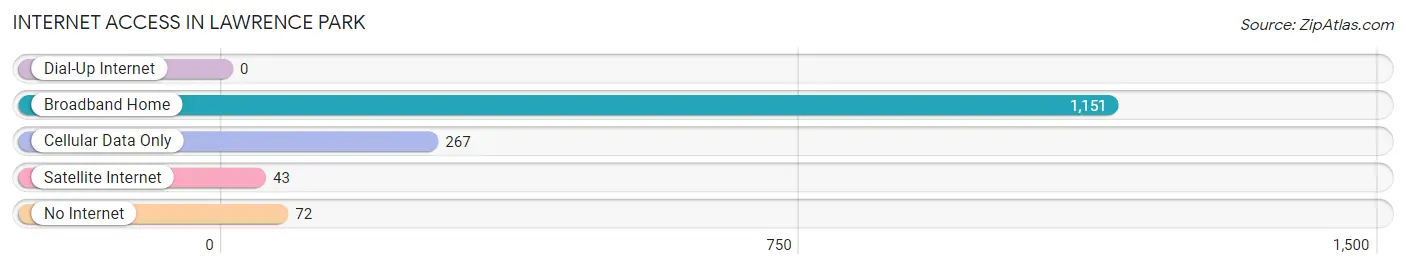
| Internet Type | # Households | % Households |
| Dial-Up Internet | 0 | 0.0% |
| Broadband Home | 1,151 | 76.9% |
| Cellular Data Only | 267 | 17.8% |
| Satellite Internet | 43 | 2.9% |
| No Internet | 72 | 4.8% |
| Total | 1,497 | 100.0% |
Lawrence Park Summary
Lawrence Park is a small borough located in Erie County, Pennsylvania. It is situated in the northwest corner of the county, just south of the city of Erie. The borough was incorporated in 1895 and has a population of approximately 2,000 people.
Geography
Lawrence Park is located in the northwest corner of Erie County, Pennsylvania. It is situated on the east side of the city of Erie, and is bordered by the townships of Millcreek, Harborcreek, and Greene. The borough is approximately 2.5 square miles in size and is situated at an elevation of 890 feet above sea level. The terrain is mostly flat, with some rolling hills in the northern part of the borough. The main waterway is Walnut Creek, which flows through the borough from north to south.
Climate
Lawrence Park has a humid continental climate, with cold winters and warm summers. The average annual temperature is around 50°F, with average highs in the summer reaching around 80°F and average lows in the winter reaching around 20°F. The average annual precipitation is around 37 inches, with most of it falling in the form of snow in the winter months.
Demographics
As of the 2010 census, the population of Lawrence Park was 2,039. The racial makeup of the borough was 97.2% White, 0.9% African American, 0.3% Native American, 0.4% Asian, 0.1% Pacific Islander, 0.2% from other races, and 0.9% from two or more races. Hispanic or Latino of any race were 1.2% of the population.
Economy
Lawrence Park is primarily a residential community, with most of its residents commuting to nearby cities for work. The borough does have some small businesses, including a few restaurants, a grocery store, and a few retail stores. The largest employer in the borough is the Lawrence Park Industrial Park, which is home to several manufacturing and distribution companies.
Education
Lawrence Park is served by the Iroquois School District. The district operates two elementary schools, one middle school, and one high school. The district also operates a vocational-technical school, which offers courses in a variety of trades.
Transportation
Lawrence Park is served by the Erie Metropolitan Transit Authority, which provides bus service to the borough and the surrounding area. The borough is also served by the Erie International Airport, which is located just outside of the borough limits.
Conclusion
Lawrence Park is a small borough located in Erie County, Pennsylvania. It is situated in the northwest corner of the county, just south of the city of Erie. The borough was incorporated in 1895 and has a population of approximately 2,000 people. The borough is primarily a residential community, with most of its residents commuting to nearby cities for work. Lawrence Park is served by the Iroquois School District and is also served by the Erie Metropolitan Transit Authority and the Erie International Airport.
Common Questions
What is Per Capita Income in Lawrence Park?
Per Capita income in Lawrence Park is $30,059.
What is the Median Family Income in Lawrence Park?
Median Family Income in Lawrence Park is $69,057.
What is the Median Household income in Lawrence Park?
Median Household Income in Lawrence Park is $64,375.
What is Income or Wage Gap in Lawrence Park?
Income or Wage Gap in Lawrence Park is 34.5%.
Women in Lawrence Park earn 65.5 cents for every dollar earned by a man.
What is Inequality or Gini Index in Lawrence Park?
Inequality or Gini Index in Lawrence Park is 0.38.
What is the Total Population of Lawrence Park?
Total Population of Lawrence Park is 3,818.
What is the Total Male Population of Lawrence Park?
Total Male Population of Lawrence Park is 1,685.
What is the Total Female Population of Lawrence Park?
Total Female Population of Lawrence Park is 2,133.
What is the Ratio of Males per 100 Females in Lawrence Park?
There are 79.00 Males per 100 Females in Lawrence Park.
What is the Ratio of Females per 100 Males in Lawrence Park?
There are 126.59 Females per 100 Males in Lawrence Park.
What is the Median Population Age in Lawrence Park?
Median Population Age in Lawrence Park is 36.5 Years.
What is the Average Family Size in Lawrence Park
Average Family Size in Lawrence Park is 2.9 People.
What is the Average Household Size in Lawrence Park
Average Household Size in Lawrence Park is 2.5 People.
How Large is the Labor Force in Lawrence Park?
There are 1,814 People in the Labor Forcein in Lawrence Park.
What is the Percentage of People in the Labor Force in Lawrence Park?
66.8% of People are in the Labor Force in Lawrence Park.
What is the Unemployment Rate in Lawrence Park?
Unemployment Rate in Lawrence Park is 1.9%.