Spring Ridge, PA Map & Demographics
Spring Ridge Map
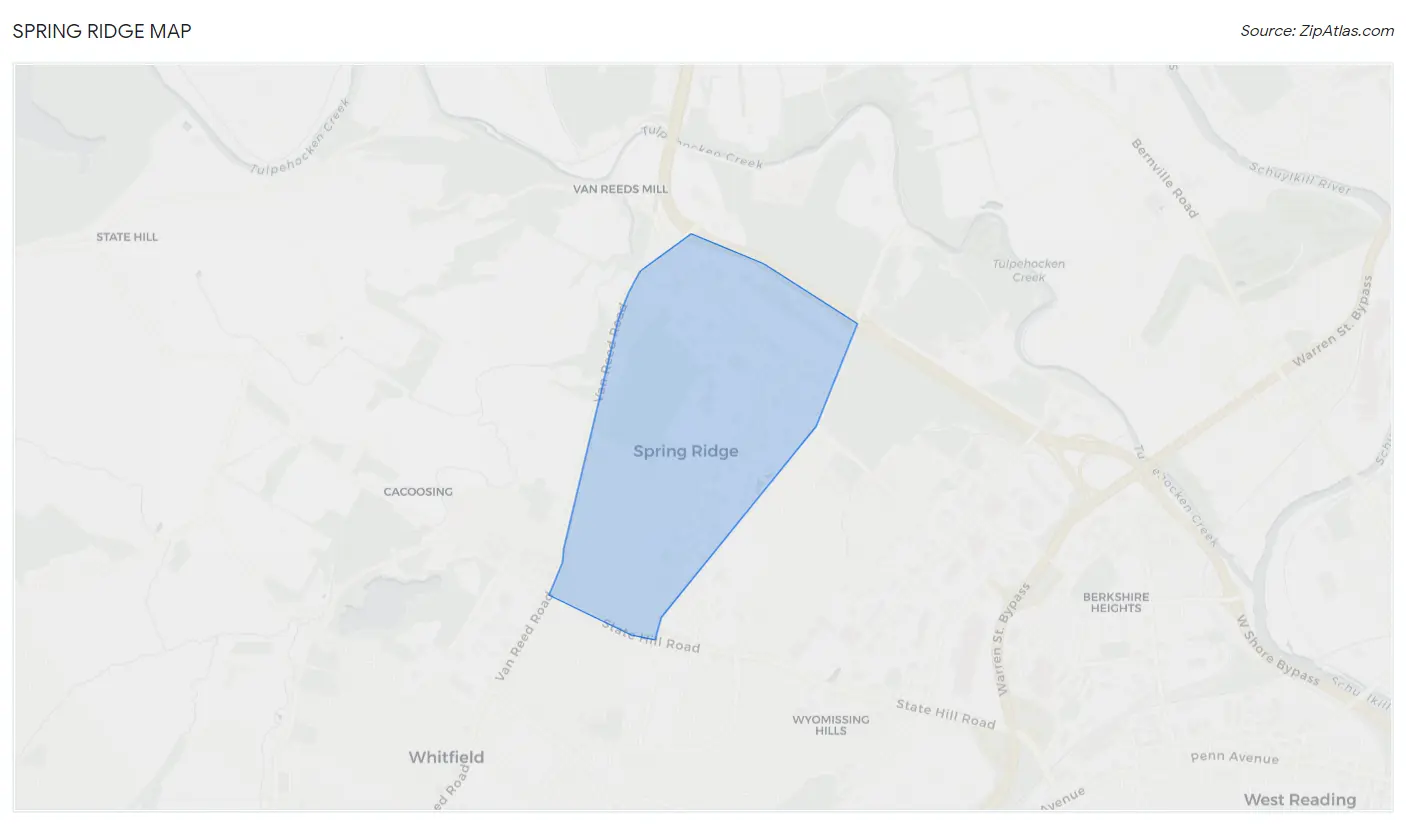
Spring Ridge Overview
$49,362
PER CAPITA INCOME
$49,047
AVG HOUSEHOLD INCOME
0.51
INEQUALITY / GINI INDEX
898
TOTAL POPULATION
437
MALE POPULATION
461
FEMALE POPULATION
94.79
MALES / 100 FEMALES
105.49
FEMALES / 100 MALES
69.9
MEDIAN AGE
2.2
AVG FAMILY SIZE
1.8
AVG HOUSEHOLD SIZE
331
LABOR FORCE [ PEOPLE ]
39.3%
PERCENT IN LABOR FORCE
4.2%
UNEMPLOYMENT RATE
Income in Spring Ridge
Income Overview in Spring Ridge
| Characteristic | Number | Measure |
| Per Capita Income | 898 | $49,362 |
| Median Family Income | 309 | $0 |
| Mean Family Income | 309 | $113,152 |
| Median Household Income | 497 | $49,047 |
| Mean Household Income | 497 | $86,422 |
| Income Deficit | 309 | $0 |
| Wage / Income Gap (%) | 898 | 0.00% |
| Wage / Income Gap ($) | 898 | 100.00¢ per $1 |
| Gini / Inequality Index | 898 | 0.51 |
Earnings by Sex in Spring Ridge
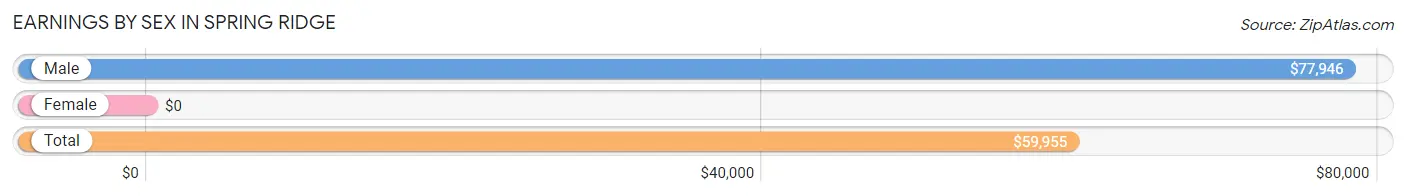
| Sex | Number | Average Earnings |
| Male | 169 (45.3%) | $77,946 |
| Female | 204 (54.7%) | $0 |
| Total | 373 (100.0%) | $59,955 |
Earnings by Sex by Income Bracket in Spring Ridge
The most common earnings brackets in Spring Ridge are $100,000+ for men (58 | 34.3%) and $2,499 or less for women (56 | 27.5%).
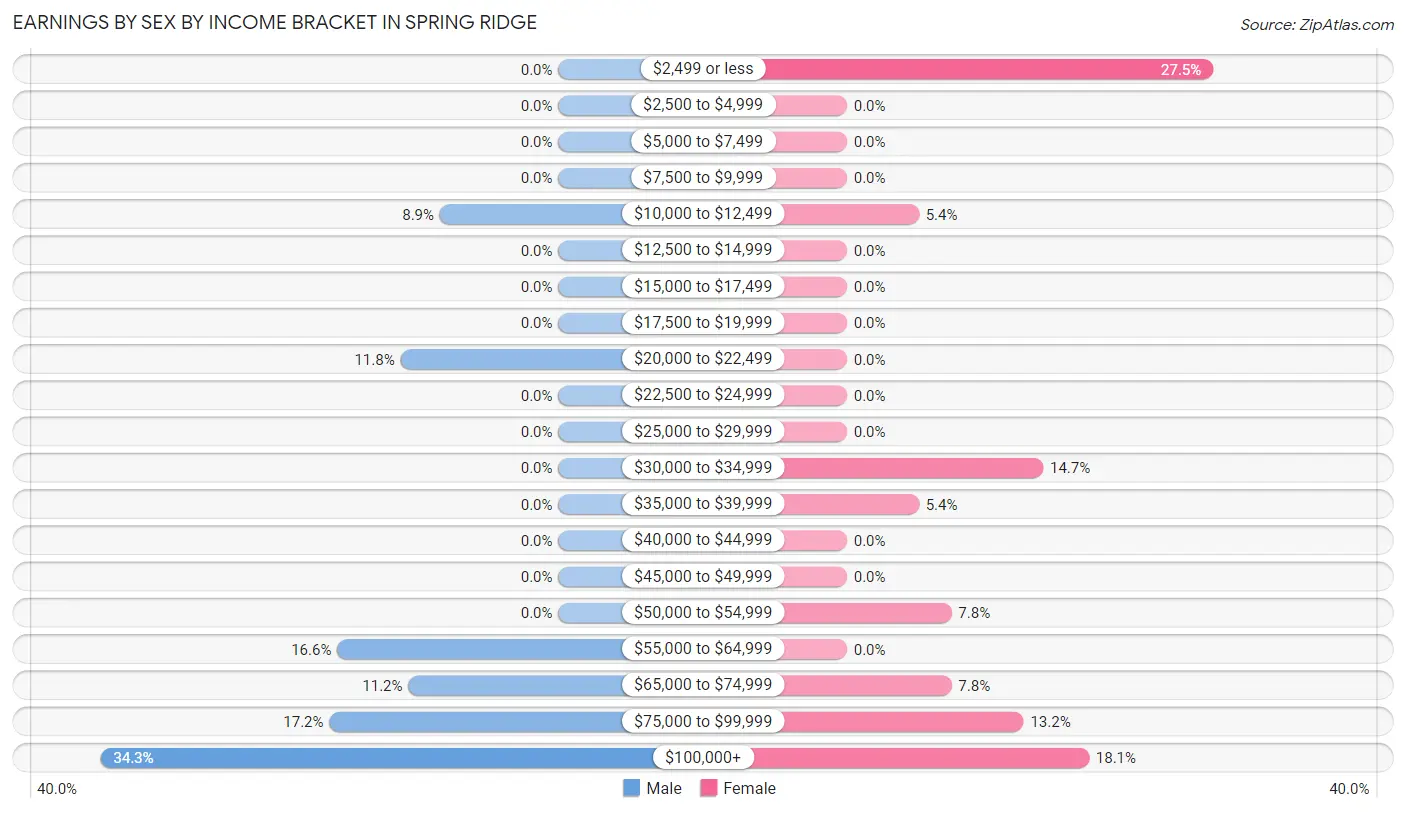
| Income | Male | Female |
| $2,499 or less | 0 (0.0%) | 56 (27.5%) |
| $2,500 to $4,999 | 0 (0.0%) | 0 (0.0%) |
| $5,000 to $7,499 | 0 (0.0%) | 0 (0.0%) |
| $7,500 to $9,999 | 0 (0.0%) | 0 (0.0%) |
| $10,000 to $12,499 | 15 (8.9%) | 11 (5.4%) |
| $12,500 to $14,999 | 0 (0.0%) | 0 (0.0%) |
| $15,000 to $17,499 | 0 (0.0%) | 0 (0.0%) |
| $17,500 to $19,999 | 0 (0.0%) | 0 (0.0%) |
| $20,000 to $22,499 | 20 (11.8%) | 0 (0.0%) |
| $22,500 to $24,999 | 0 (0.0%) | 0 (0.0%) |
| $25,000 to $29,999 | 0 (0.0%) | 0 (0.0%) |
| $30,000 to $34,999 | 0 (0.0%) | 30 (14.7%) |
| $35,000 to $39,999 | 0 (0.0%) | 11 (5.4%) |
| $40,000 to $44,999 | 0 (0.0%) | 0 (0.0%) |
| $45,000 to $49,999 | 0 (0.0%) | 0 (0.0%) |
| $50,000 to $54,999 | 0 (0.0%) | 16 (7.8%) |
| $55,000 to $64,999 | 28 (16.6%) | 0 (0.0%) |
| $65,000 to $74,999 | 19 (11.2%) | 16 (7.8%) |
| $75,000 to $99,999 | 29 (17.2%) | 27 (13.2%) |
| $100,000+ | 58 (34.3%) | 37 (18.1%) |
| Total | 169 (100.0%) | 204 (100.0%) |
Earnings by Sex by Educational Attainment in Spring Ridge
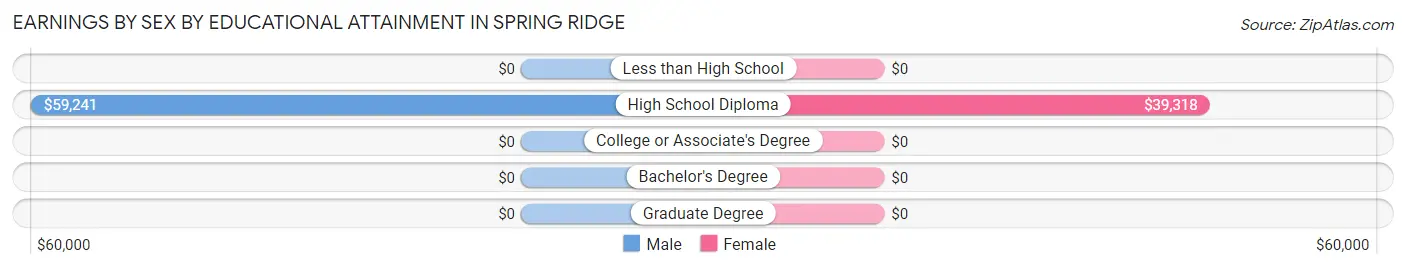
| Educational Attainment | Male Income | Female Income |
| Less than High School | - | - |
| High School Diploma | $59,241 | $39,318 |
| College or Associate's Degree | - | - |
| Bachelor's Degree | - | - |
| Graduate Degree | - | - |
| Total | $77,946 | $0 |
Family Income in Spring Ridge
Family Income Brackets in Spring Ridge
According to the Spring Ridge family income data, there are 127 families falling into the $35,000 to $49,999 income range, which is the most common income bracket and makes up 41.1% of all families.
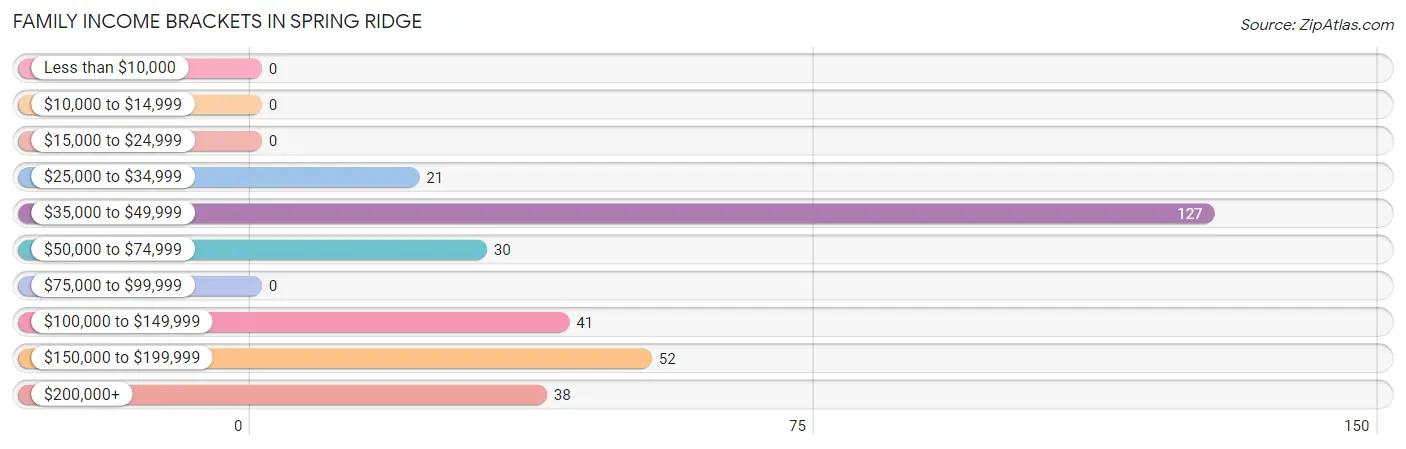
| Income Bracket | # Families | % Families |
| Less than $10,000 | 0 | 0.0% |
| $10,000 to $14,999 | 0 | 0.0% |
| $15,000 to $24,999 | 0 | 0.0% |
| $25,000 to $34,999 | 21 | 6.8% |
| $35,000 to $49,999 | 127 | 41.1% |
| $50,000 to $74,999 | 30 | 9.7% |
| $75,000 to $99,999 | 0 | 0.0% |
| $100,000 to $149,999 | 41 | 13.3% |
| $150,000 to $199,999 | 52 | 16.8% |
| $200,000+ | 38 | 12.3% |
Family Income by Famaliy Size in Spring Ridge
2-person families (255 | 82.5%) account for the highest median family income in Spring Ridge with $48,686 per family, while 2-person families (255 | 82.5%) have the highest median income of $24,343 per family member.
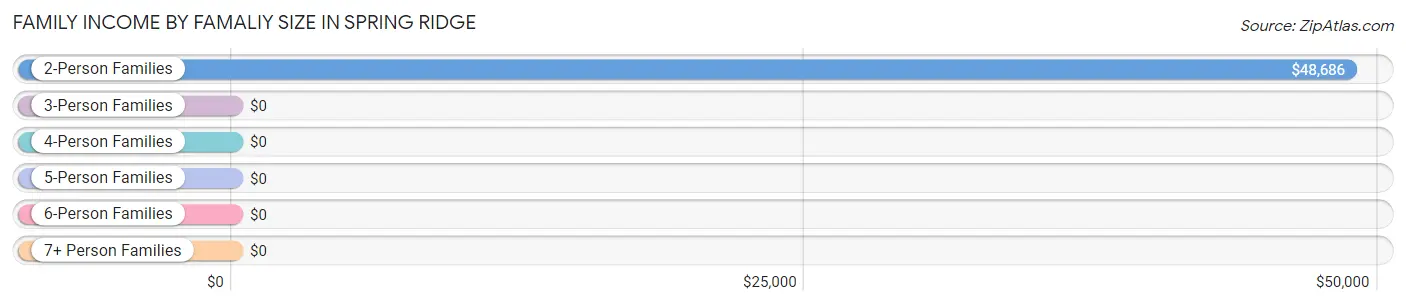
| Income Bracket | # Families | Median Income |
| 2-Person Families | 255 (82.5%) | $48,686 |
| 3-Person Families | 41 (13.3%) | $0 |
| 4-Person Families | 13 (4.2%) | $0 |
| 5-Person Families | 0 (0.0%) | $0 |
| 6-Person Families | 0 (0.0%) | $0 |
| 7+ Person Families | 0 (0.0%) | $0 |
| Total | 309 (100.0%) | $0 |
Family Income by Number of Earners in Spring Ridge
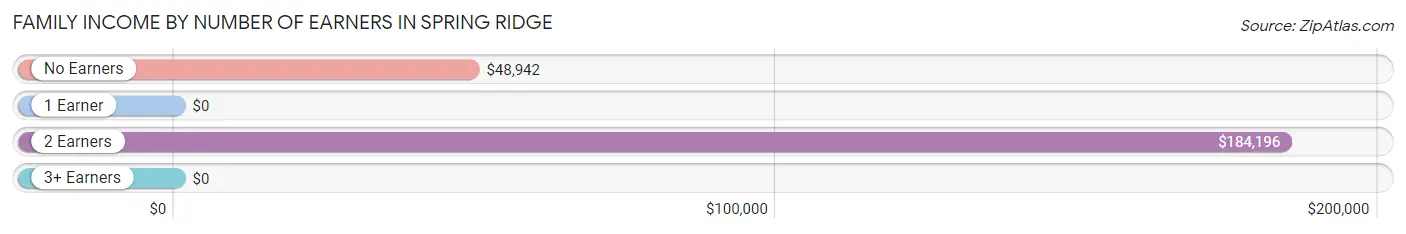
| Number of Earners | # Families | Median Income |
| No Earners | 121 (39.2%) | $48,942 |
| 1 Earner | 108 (34.9%) | $0 |
| 2 Earners | 65 (21.0%) | $184,196 |
| 3+ Earners | 15 (4.9%) | $0 |
| Total | 309 (100.0%) | $0 |
Household Income in Spring Ridge
Household Income Brackets in Spring Ridge
With 147 households falling in the category, the $35,000 to $49,999 income range is the most frequent in Spring Ridge, accounting for 29.6% of all households.
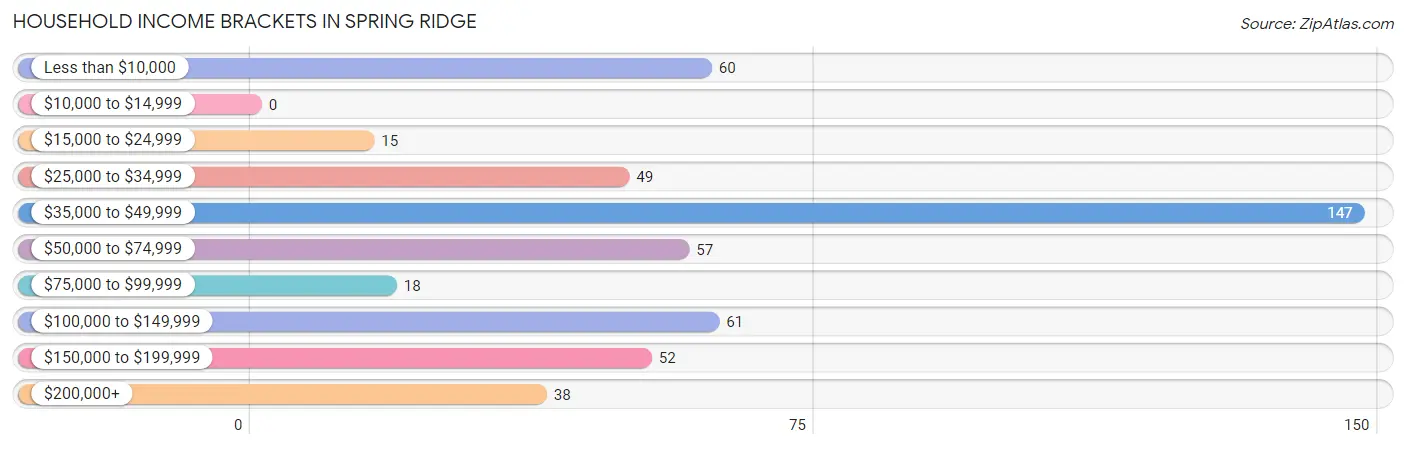
| Income Bracket | # Households | % Households |
| Less than $10,000 | 60 | 12.1% |
| $10,000 to $14,999 | 0 | 0.0% |
| $15,000 to $24,999 | 15 | 3.0% |
| $25,000 to $34,999 | 49 | 9.9% |
| $35,000 to $49,999 | 147 | 29.6% |
| $50,000 to $74,999 | 57 | 11.5% |
| $75,000 to $99,999 | 18 | 3.6% |
| $100,000 to $149,999 | 61 | 12.3% |
| $150,000 to $199,999 | 52 | 10.5% |
| $200,000+ | 38 | 7.6% |
Household Income by Householder Age in Spring Ridge
The median household income in Spring Ridge is $49,047, with the highest median household income of $139,531 found in the 25 to 44 years age bracket for the primary householder. A total of 34 households (6.8%) fall into this category.
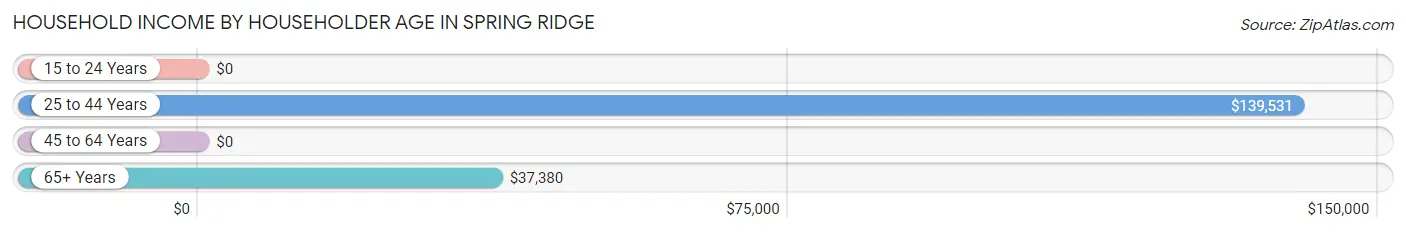
| Income Bracket | # Households | Median Income |
| 15 to 24 Years | 0 (0.0%) | $0 |
| 25 to 44 Years | 34 (6.8%) | $139,531 |
| 45 to 64 Years | 104 (20.9%) | $0 |
| 65+ Years | 359 (72.2%) | $37,380 |
| Total | 497 (100.0%) | $49,047 |
Poverty in Spring Ridge
Income Below Poverty by Sex and Age in Spring Ridge
With 9.8% poverty level for males and 3.7% for females among the residents of Spring Ridge, 75 year old and over males and 65 to 74 year old females are the most vulnerable to poverty, with 43 males (24.4%) and 17 females (8.7%) in their respective age groups living below the poverty level.
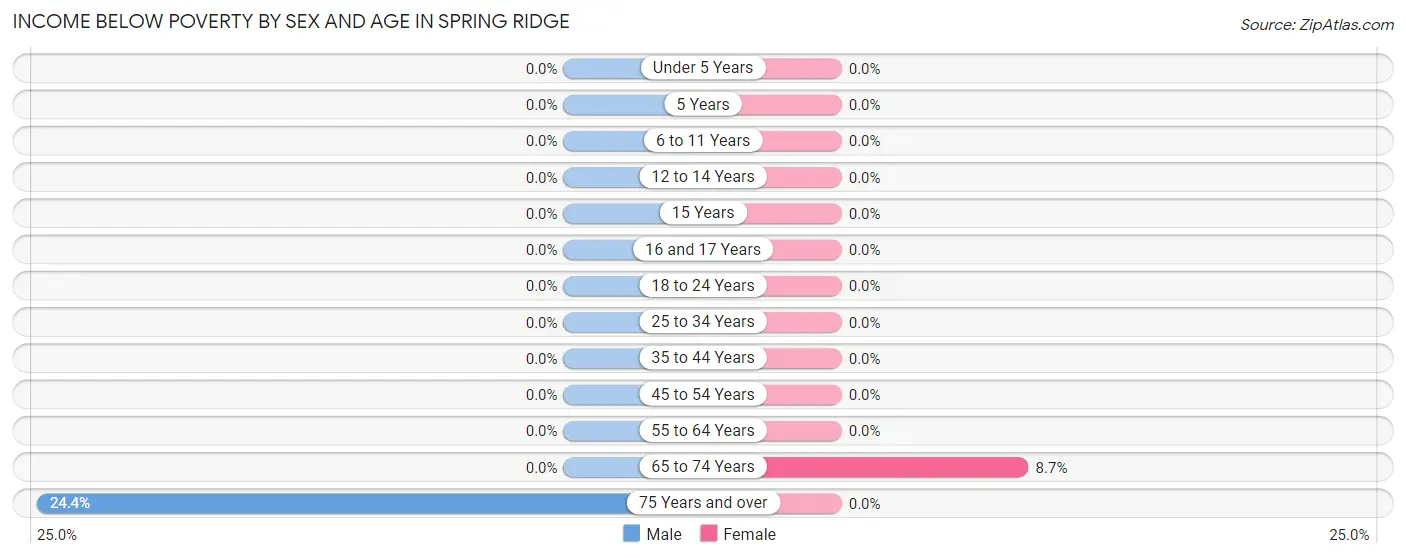
| Age Bracket | Male | Female |
| Under 5 Years | 0 (0.0%) | 0 (0.0%) |
| 5 Years | 0 (0.0%) | 0 (0.0%) |
| 6 to 11 Years | 0 (0.0%) | 0 (0.0%) |
| 12 to 14 Years | 0 (0.0%) | 0 (0.0%) |
| 15 Years | 0 (0.0%) | 0 (0.0%) |
| 16 and 17 Years | 0 (0.0%) | 0 (0.0%) |
| 18 to 24 Years | 0 (0.0%) | 0 (0.0%) |
| 25 to 34 Years | 0 (0.0%) | 0 (0.0%) |
| 35 to 44 Years | 0 (0.0%) | 0 (0.0%) |
| 45 to 54 Years | 0 (0.0%) | 0 (0.0%) |
| 55 to 64 Years | 0 (0.0%) | 0 (0.0%) |
| 65 to 74 Years | 0 (0.0%) | 17 (8.7%) |
| 75 Years and over | 43 (24.4%) | 0 (0.0%) |
| Total | 43 (9.8%) | 17 (3.7%) |
Income Above Poverty by Sex and Age in Spring Ridge
According to the poverty statistics in Spring Ridge, males aged 6 to 11 years and females aged 6 to 11 years are the age groups that are most secure financially, with 100.0% of males and 100.0% of females in these age groups living above the poverty line.
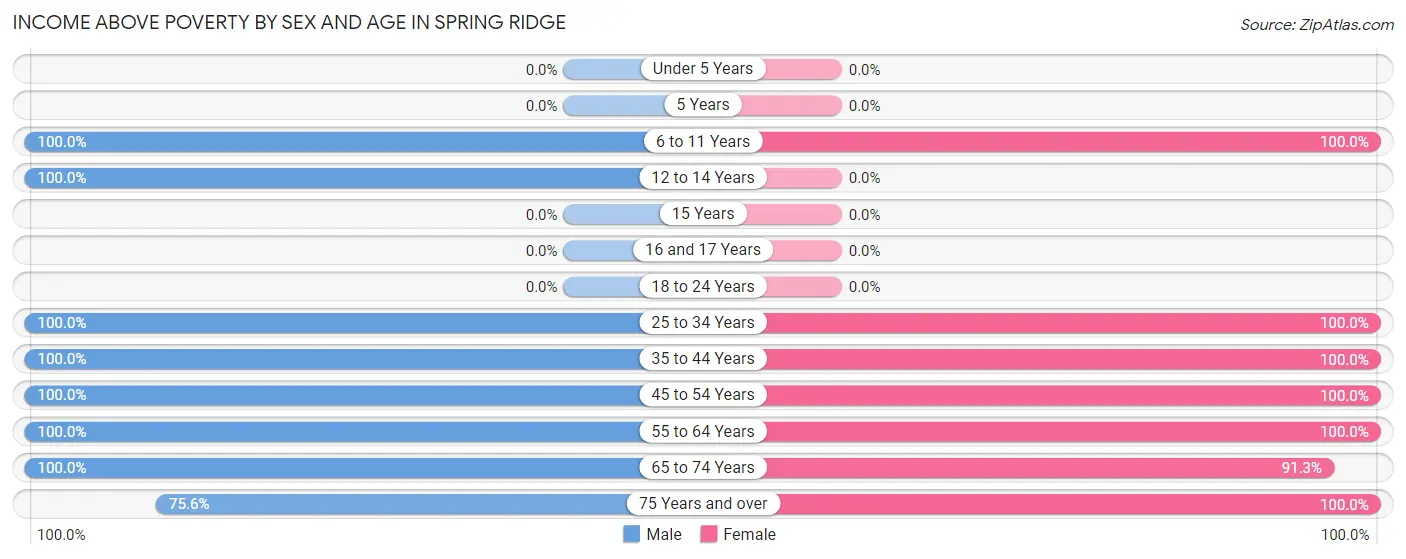
| Age Bracket | Male | Female |
| Under 5 Years | 0 (0.0%) | 0 (0.0%) |
| 5 Years | 0 (0.0%) | 0 (0.0%) |
| 6 to 11 Years | 11 (100.0%) | 15 (100.0%) |
| 12 to 14 Years | 30 (100.0%) | 0 (0.0%) |
| 15 Years | 0 (0.0%) | 0 (0.0%) |
| 16 and 17 Years | 0 (0.0%) | 0 (0.0%) |
| 18 to 24 Years | 0 (0.0%) | 0 (0.0%) |
| 25 to 34 Years | 14 (100.0%) | 20 (100.0%) |
| 35 to 44 Years | 14 (100.0%) | 30 (100.0%) |
| 45 to 54 Years | 56 (100.0%) | 40 (100.0%) |
| 55 to 64 Years | 54 (100.0%) | 47 (100.0%) |
| 65 to 74 Years | 82 (100.0%) | 179 (91.3%) |
| 75 Years and over | 133 (75.6%) | 113 (100.0%) |
| Total | 394 (90.2%) | 444 (96.3%) |
Income Below Poverty Among Married-Couple Families in Spring Ridge
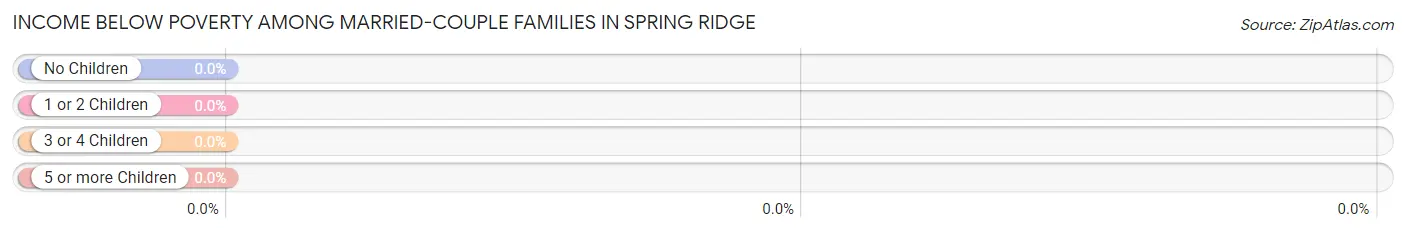
| Children | Above Poverty | Below Poverty |
| No Children | 269 (100.0%) | 0 (0.0%) |
| 1 or 2 Children | 13 (100.0%) | 0 (0.0%) |
| 3 or 4 Children | 0 (0.0%) | 0 (0.0%) |
| 5 or more Children | 0 (0.0%) | 0 (0.0%) |
| Total | 282 (100.0%) | 0 (0.0%) |
Income Below Poverty Among Single-Parent Households in Spring Ridge
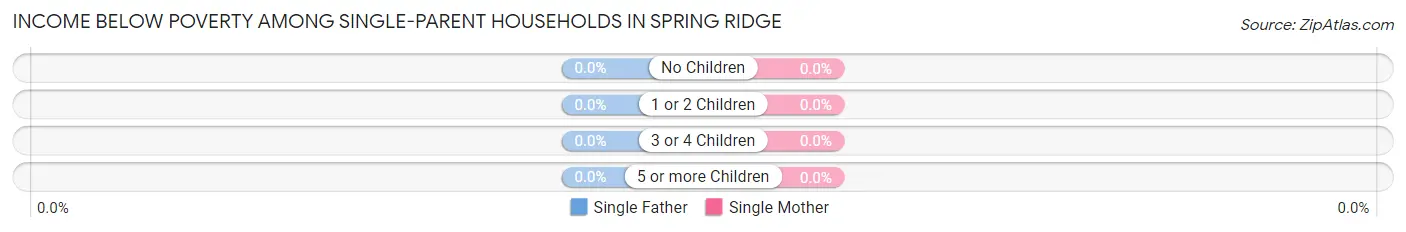
| Children | Single Father | Single Mother |
| No Children | 0 (0.0%) | 0 (0.0%) |
| 1 or 2 Children | 0 (0.0%) | 0 (0.0%) |
| 3 or 4 Children | 0 (0.0%) | 0 (0.0%) |
| 5 or more Children | 0 (0.0%) | 0 (0.0%) |
| Total | 0 (0.0%) | 0 (0.0%) |
Income Below Poverty Among Married-Couple vs Single-Parent Households in Spring Ridge
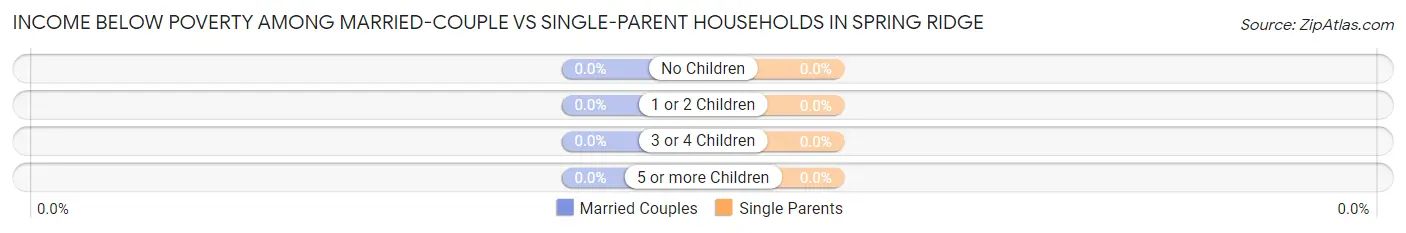
| Children | Married-Couple Families | Single-Parent Households |
| No Children | 0 (0.0%) | 0 (0.0%) |
| 1 or 2 Children | 0 (0.0%) | 0 (0.0%) |
| 3 or 4 Children | 0 (0.0%) | 0 (0.0%) |
| 5 or more Children | 0 (0.0%) | 0 (0.0%) |
| Total | 0 (0.0%) | 0 (0.0%) |
Race in Spring Ridge
The most populous races in Spring Ridge are White / Caucasian (769 | 85.6%), Two or more Races (109 | 12.1%), and Hispanic or Latino (23 | 2.6%).
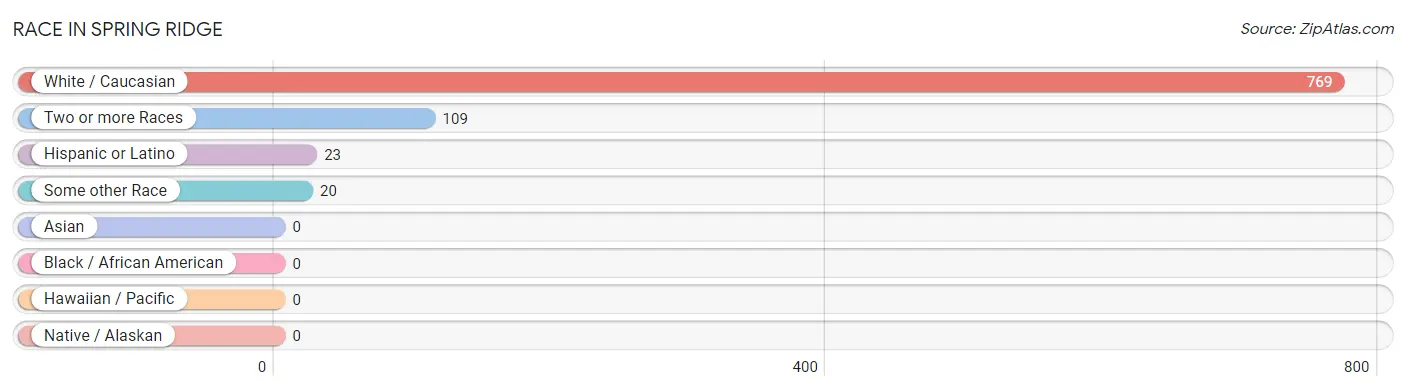
| Race | # Population | % Population |
| Asian | 0 | 0.0% |
| Black / African American | 0 | 0.0% |
| Hawaiian / Pacific | 0 | 0.0% |
| Hispanic or Latino | 23 | 2.6% |
| Native / Alaskan | 0 | 0.0% |
| White / Caucasian | 769 | 85.6% |
| Two or more Races | 109 | 12.1% |
| Some other Race | 20 | 2.2% |
| Total | 898 | 100.0% |
Ancestry in Spring Ridge
The most populous ancestries reported in Spring Ridge are German (179 | 19.9%), Irish (112 | 12.5%), Italian (73 | 8.1%), Welsh (57 | 6.4%), and Bhutanese (52 | 5.8%), together accounting for 52.7% of all Spring Ridge residents.
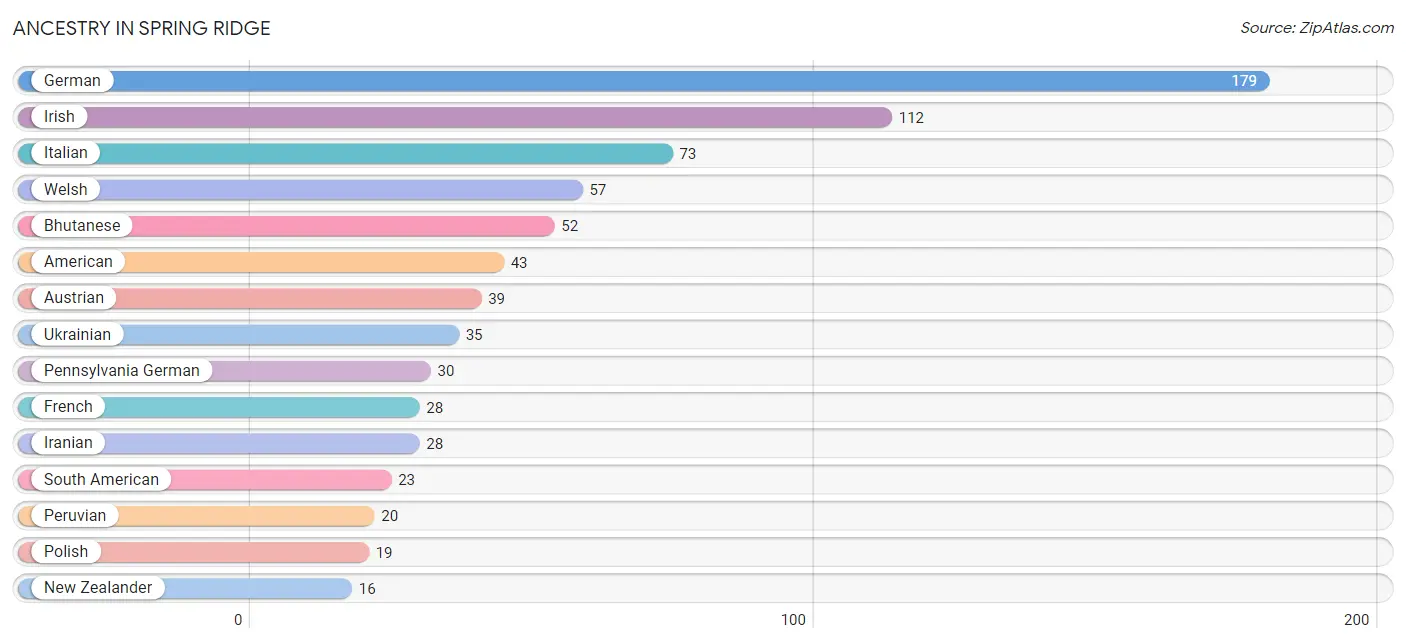
| Ancestry | # Population | % Population |
| American | 43 | 4.8% |
| Austrian | 39 | 4.3% |
| Bhutanese | 52 | 5.8% |
| Eastern European | 15 | 1.7% |
| Ecuadorian | 3 | 0.3% |
| French | 28 | 3.1% |
| German | 179 | 19.9% |
| Iranian | 28 | 3.1% |
| Irish | 112 | 12.5% |
| Italian | 73 | 8.1% |
| New Zealander | 16 | 1.8% |
| Pennsylvania German | 30 | 3.3% |
| Peruvian | 20 | 2.2% |
| Polish | 19 | 2.1% |
| Slovak | 10 | 1.1% |
| Slovene | 15 | 1.7% |
| South American | 23 | 2.6% |
| Ukrainian | 35 | 3.9% |
| Welsh | 57 | 6.4% | View All 19 Rows |
Immigrants in Spring Ridge
The most numerous immigrant groups reported in Spring Ridge came from Asia (78 | 8.7%), South Central Asia (59 | 6.6%), England (43 | 4.8%), Europe (43 | 4.8%), and Northern Europe (43 | 4.8%), together accounting for 29.6% of all Spring Ridge residents.
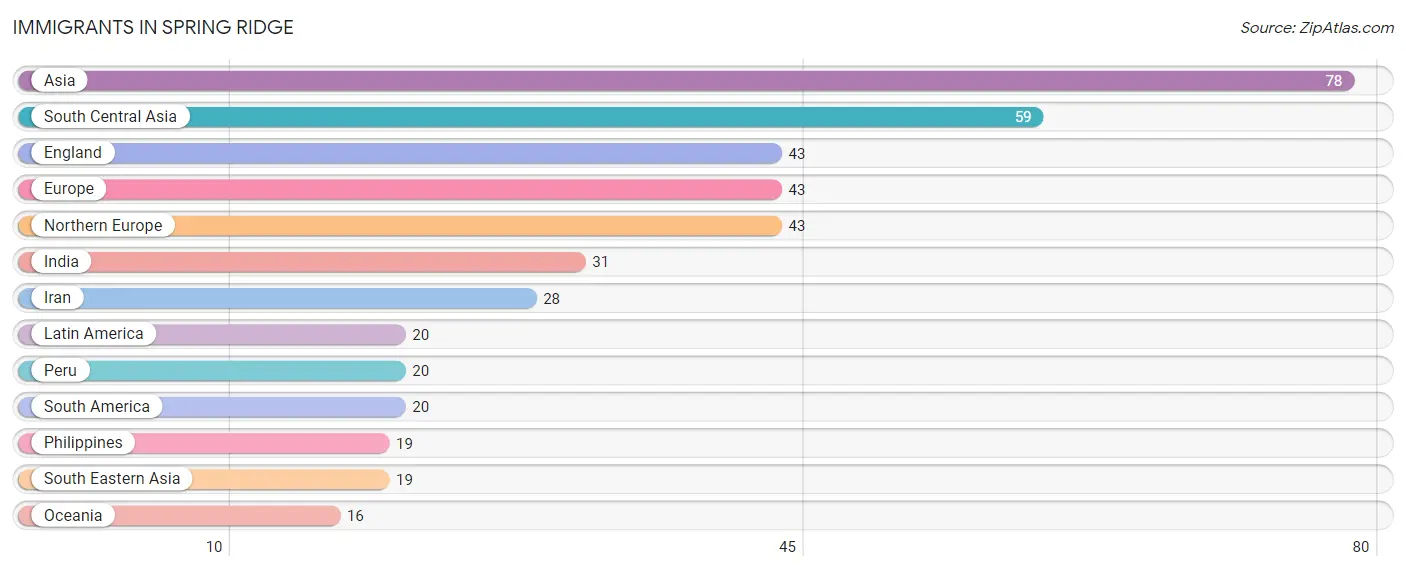
| Immigration Origin | # Population | % Population |
| Asia | 78 | 8.7% |
| England | 43 | 4.8% |
| Europe | 43 | 4.8% |
| India | 31 | 3.5% |
| Iran | 28 | 3.1% |
| Latin America | 20 | 2.2% |
| Northern Europe | 43 | 4.8% |
| Oceania | 16 | 1.8% |
| Peru | 20 | 2.2% |
| Philippines | 19 | 2.1% |
| South America | 20 | 2.2% |
| South Central Asia | 59 | 6.6% |
| South Eastern Asia | 19 | 2.1% | View All 13 Rows |
Sex and Age in Spring Ridge
Sex and Age in Spring Ridge
The most populous age groups in Spring Ridge are 75 to 79 Years (89 | 20.4%) for men and 70 to 74 Years (142 | 30.8%) for women.
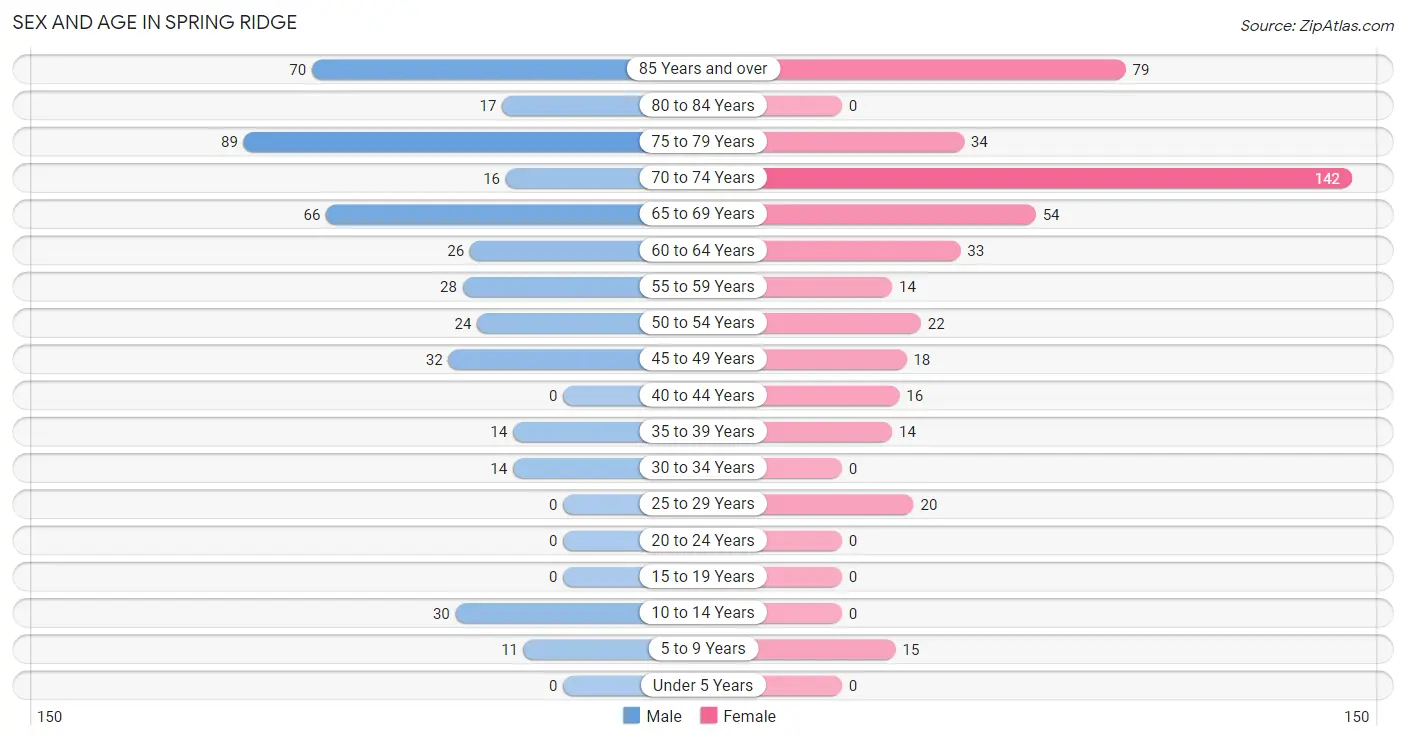
| Age Bracket | Male | Female |
| Under 5 Years | 0 (0.0%) | 0 (0.0%) |
| 5 to 9 Years | 11 (2.5%) | 15 (3.3%) |
| 10 to 14 Years | 30 (6.9%) | 0 (0.0%) |
| 15 to 19 Years | 0 (0.0%) | 0 (0.0%) |
| 20 to 24 Years | 0 (0.0%) | 0 (0.0%) |
| 25 to 29 Years | 0 (0.0%) | 20 (4.3%) |
| 30 to 34 Years | 14 (3.2%) | 0 (0.0%) |
| 35 to 39 Years | 14 (3.2%) | 14 (3.0%) |
| 40 to 44 Years | 0 (0.0%) | 16 (3.5%) |
| 45 to 49 Years | 32 (7.3%) | 18 (3.9%) |
| 50 to 54 Years | 24 (5.5%) | 22 (4.8%) |
| 55 to 59 Years | 28 (6.4%) | 14 (3.0%) |
| 60 to 64 Years | 26 (5.9%) | 33 (7.2%) |
| 65 to 69 Years | 66 (15.1%) | 54 (11.7%) |
| 70 to 74 Years | 16 (3.7%) | 142 (30.8%) |
| 75 to 79 Years | 89 (20.4%) | 34 (7.4%) |
| 80 to 84 Years | 17 (3.9%) | 0 (0.0%) |
| 85 Years and over | 70 (16.0%) | 79 (17.1%) |
| Total | 437 (100.0%) | 461 (100.0%) |
Families and Households in Spring Ridge
Median Family Size in Spring Ridge
The median family size in Spring Ridge is 2.24 persons per family, with single female/mother families (16 | 5.2%) accounting for the largest median family size of 3.06 persons per family. On the other hand, married-couple families (282 | 91.3%) represent the smallest median family size with 2.19 persons per family.
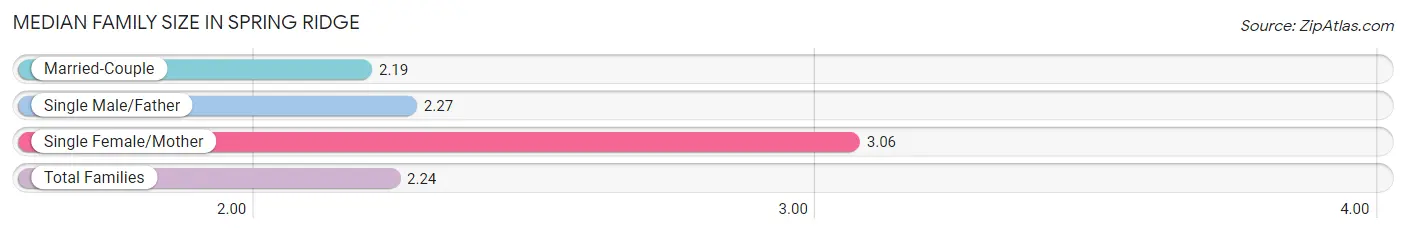
| Family Type | # Families | Family Size |
| Married-Couple | 282 (91.3%) | 2.19 |
| Single Male/Father | 11 (3.6%) | 2.27 |
| Single Female/Mother | 16 (5.2%) | 3.06 |
| Total Families | 309 (100.0%) | 2.24 |
Median Household Size in Spring Ridge
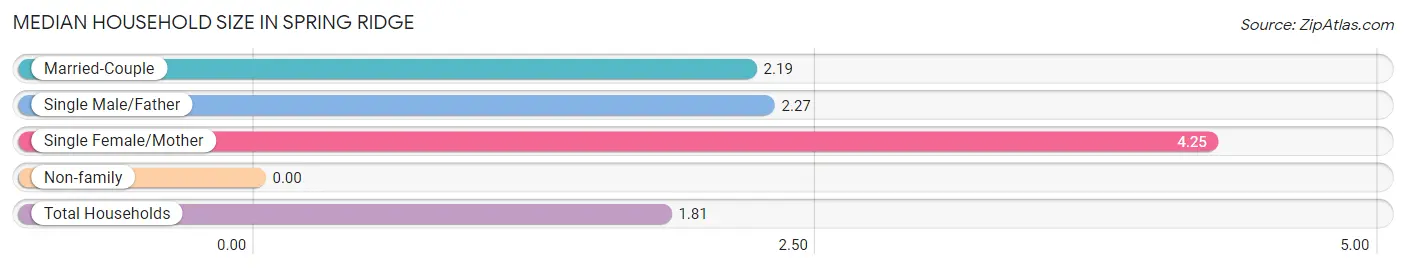
| Household Type | # Households | Household Size |
| Married-Couple | 282 (56.7%) | 2.19 |
| Single Male/Father | 11 (2.2%) | 2.27 |
| Single Female/Mother | 16 (3.2%) | 4.25 |
| Non-family | 188 (37.8%) | - |
| Total Households | 497 (100.0%) | 1.81 |
Household Size by Marriage Status in Spring Ridge
Out of a total of 497 households in Spring Ridge, 309 (62.2%) are family households, while 188 (37.8%) are nonfamily households. The most numerous type of family households are 2-person households, comprising 255, and the most common type of nonfamily households are 1-person households, comprising 188.
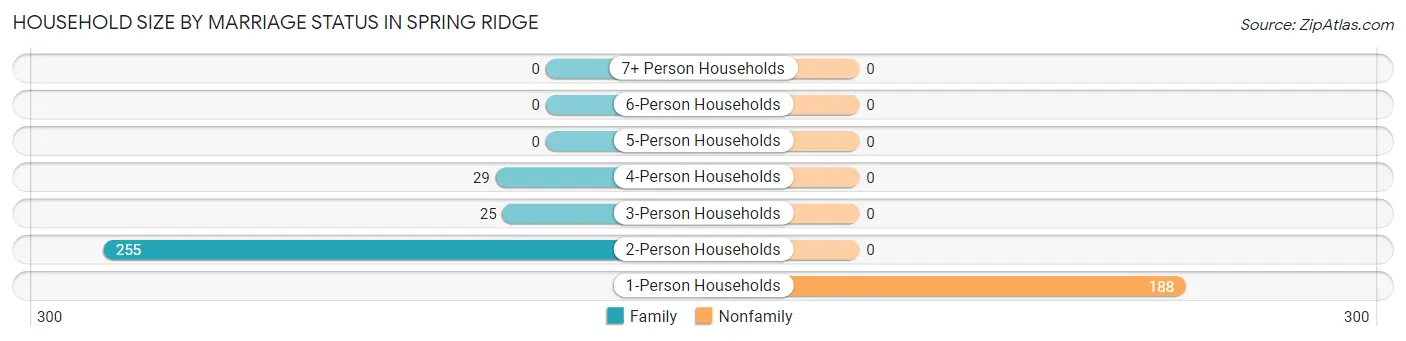
| Household Size | Family Households | Nonfamily Households |
| 1-Person Households | - | 188 (37.8%) |
| 2-Person Households | 255 (51.3%) | 0 (0.0%) |
| 3-Person Households | 25 (5.0%) | 0 (0.0%) |
| 4-Person Households | 29 (5.8%) | 0 (0.0%) |
| 5-Person Households | 0 (0.0%) | 0 (0.0%) |
| 6-Person Households | 0 (0.0%) | 0 (0.0%) |
| 7+ Person Households | 0 (0.0%) | 0 (0.0%) |
| Total | 309 (62.2%) | 188 (37.8%) |
Female Fertility in Spring Ridge
Fertility by Age in Spring Ridge
| Age Bracket | Women with Births | Births / 1,000 Women |
| 15 to 19 years | 0 (0.0%) | 0.0 |
| 20 to 34 years | 0 (0.0%) | 0.0 |
| 35 to 50 years | 0 (0.0%) | 0.0 |
| Total | 0 (0.0%) | 0.0 |
Fertility by Age by Marriage Status in Spring Ridge
| Age Bracket | Married | Unmarried |
| 15 to 19 years | 0 (0.0%) | 0 (0.0%) |
| 20 to 34 years | 0 (0.0%) | 0 (0.0%) |
| 35 to 50 years | 0 (0.0%) | 0 (0.0%) |
| Total | 0 (0.0%) | 0 (0.0%) |
Fertility by Education in Spring Ridge
| Educational Attainment | Women with Births | Births / 1,000 Women |
| Less than High School | 0 (0.0%) | 0.0 |
| High School Diploma | 0 (0.0%) | 0.0 |
| College or Associate's Degree | 0 (0.0%) | 0.0 |
| Bachelor's Degree | 0 (0.0%) | 0.0 |
| Graduate Degree | 0 (0.0%) | 0.0 |
| Total | 0 (0.0%) | 0.0 |
Fertility by Education by Marriage Status in Spring Ridge
| Educational Attainment | Married | Unmarried |
| Less than High School | 0 (0.0%) | 0 (0.0%) |
| High School Diploma | 0 (0.0%) | 0 (0.0%) |
| College or Associate's Degree | 0 (0.0%) | 0 (0.0%) |
| Bachelor's Degree | 0 (0.0%) | 0 (0.0%) |
| Graduate Degree | 0 (0.0%) | 0 (0.0%) |
| Total | 0 (0.0%) | 0 (0.0%) |
Employment Characteristics in Spring Ridge
Employment by Class of Employer in Spring Ridge
Among the 317 employed individuals in Spring Ridge, private company employees (154 | 48.6%), not-for-profit organizations (97 | 30.6%), and self-employed (not incorporated) (28 | 8.8%) make up the most common classes of employment.
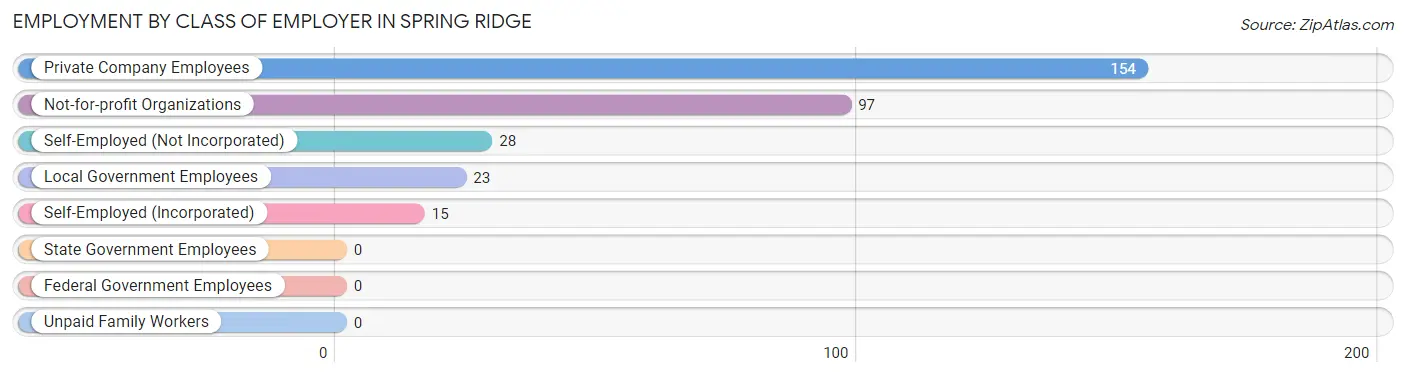
| Employer Class | # Employees | % Employees |
| Private Company Employees | 154 | 48.6% |
| Self-Employed (Incorporated) | 15 | 4.7% |
| Self-Employed (Not Incorporated) | 28 | 8.8% |
| Not-for-profit Organizations | 97 | 30.6% |
| Local Government Employees | 23 | 7.3% |
| State Government Employees | 0 | 0.0% |
| Federal Government Employees | 0 | 0.0% |
| Unpaid Family Workers | 0 | 0.0% |
| Total | 317 | 100.0% |
Employment Status by Age in Spring Ridge
According to the labor force statistics for Spring Ridge, out of the total population over 16 years of age (842), 39.3% or 331 individuals are in the labor force, with 4.2% or 14 of them unemployed. The age group with the highest labor force participation rate is 25 to 29 years, with 100.0% or 20 individuals in the labor force. Within the labor force, the 30 to 34 years age range has the highest percentage of unemployed individuals, with 100.0% or 14 of them being unemployed.
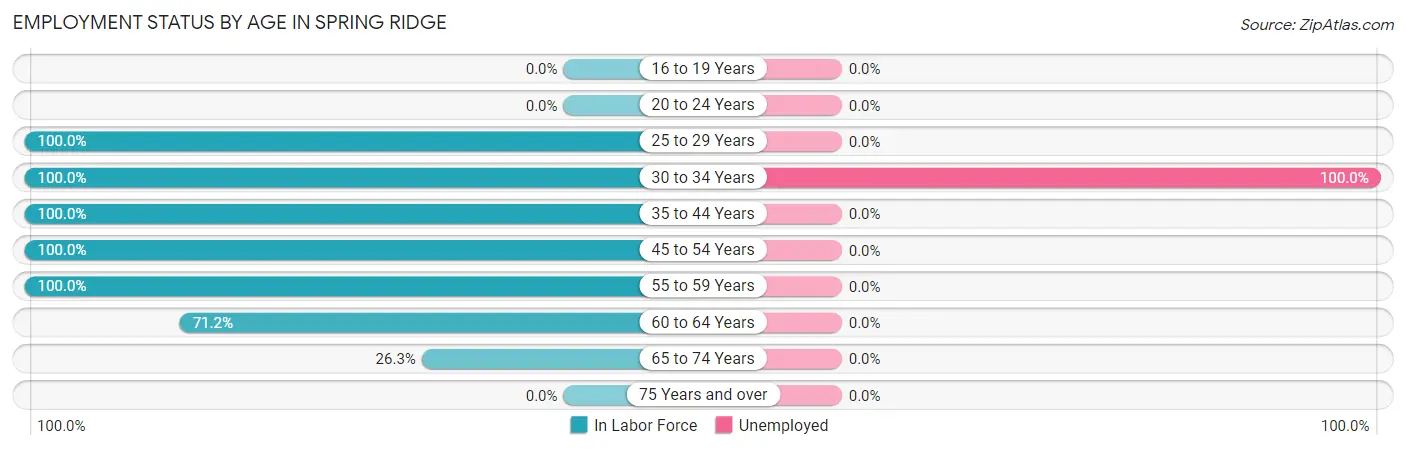
| Age Bracket | In Labor Force | Unemployed |
| 16 to 19 Years | 0 (0.0%) | 0 (0.0%) |
| 20 to 24 Years | 0 (0.0%) | 0 (0.0%) |
| 25 to 29 Years | 20 (100.0%) | 0 (0.0%) |
| 30 to 34 Years | 14 (100.0%) | 14 (100.0%) |
| 35 to 44 Years | 44 (100.0%) | 0 (0.0%) |
| 45 to 54 Years | 96 (100.0%) | 0 (0.0%) |
| 55 to 59 Years | 42 (100.0%) | 0 (0.0%) |
| 60 to 64 Years | 42 (71.2%) | 0 (0.0%) |
| 65 to 74 Years | 73 (26.3%) | 0 (0.0%) |
| 75 Years and over | 0 (0.0%) | 0 (0.0%) |
| Total | 331 (39.3%) | 14 (4.2%) |
Employment Status by Educational Attainment in Spring Ridge
According to labor force statistics for Spring Ridge, 93.8% of individuals (258) out of the total population between 25 and 64 years of age (275) are in the labor force, with 5.4% or 14 of them being unemployed. The group with the highest labor force participation rate are those with the educational attainment of high school diploma, with 100.0% or 97 individuals in the labor force. Within the labor force, individuals with bachelor's degree or higher education have the highest percentage of unemployment, with 10.5% or 14 of them being unemployed.
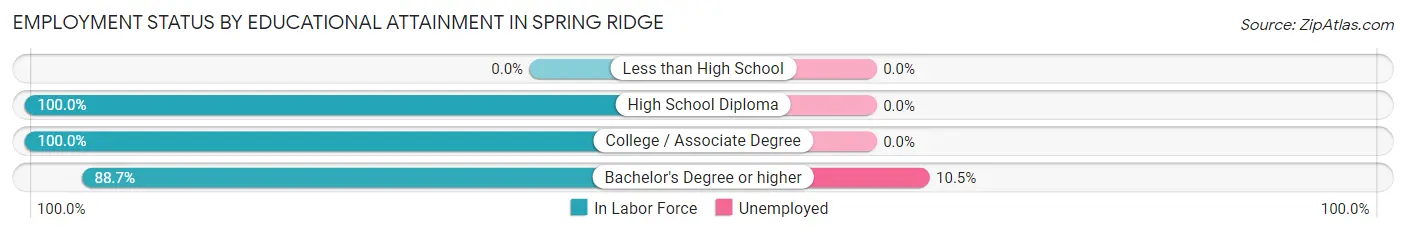
| Educational Attainment | In Labor Force | Unemployed |
| Less than High School | 0 (0.0%) | 0 (0.0%) |
| High School Diploma | 97 (100.0%) | 0 (0.0%) |
| College / Associate Degree | 28 (100.0%) | 0 (0.0%) |
| Bachelor's Degree or higher | 133 (88.7%) | 16 (10.5%) |
| Total | 258 (93.8%) | 15 (5.4%) |
Employment Occupations by Sex in Spring Ridge
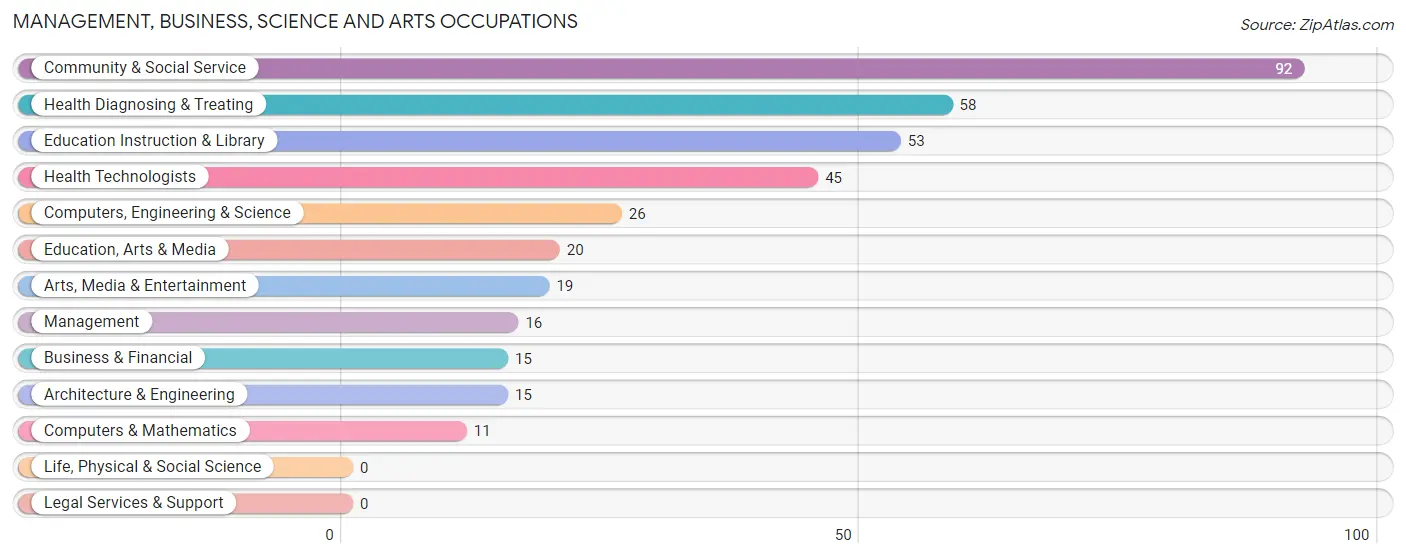
Management, Business, Science and Arts Occupations
The most common Management, Business, Science and Arts occupations in Spring Ridge are Community & Social Service (92 | 29.0%), Health Diagnosing & Treating (58 | 18.3%), Education Instruction & Library (53 | 16.7%), Health Technologists (45 | 14.2%), and Computers, Engineering & Science (26 | 8.2%).
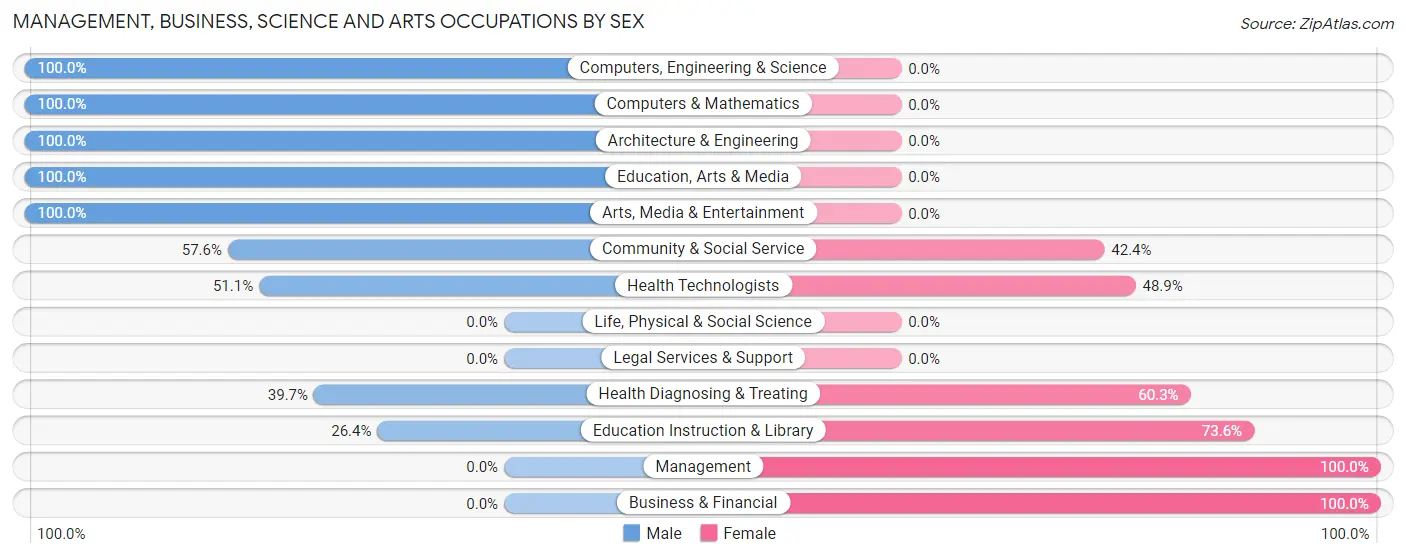
Management, Business, Science and Arts Occupations by Sex
Within the Management, Business, Science and Arts occupations in Spring Ridge, the most male-oriented occupations are Computers, Engineering & Science (100.0%), Computers & Mathematics (100.0%), and Architecture & Engineering (100.0%), while the most female-oriented occupations are Management (100.0%), Business & Financial (100.0%), and Education Instruction & Library (73.6%).
| Occupation | Male | Female |
| Management | 0 (0.0%) | 16 (100.0%) |
| Business & Financial | 0 (0.0%) | 15 (100.0%) |
| Computers, Engineering & Science | 26 (100.0%) | 0 (0.0%) |
| Computers & Mathematics | 11 (100.0%) | 0 (0.0%) |
| Architecture & Engineering | 15 (100.0%) | 0 (0.0%) |
| Life, Physical & Social Science | 0 (0.0%) | 0 (0.0%) |
| Community & Social Service | 53 (57.6%) | 39 (42.4%) |
| Education, Arts & Media | 20 (100.0%) | 0 (0.0%) |
| Legal Services & Support | 0 (0.0%) | 0 (0.0%) |
| Education Instruction & Library | 14 (26.4%) | 39 (73.6%) |
| Arts, Media & Entertainment | 19 (100.0%) | 0 (0.0%) |
| Health Diagnosing & Treating | 23 (39.7%) | 35 (60.3%) |
| Health Technologists | 23 (51.1%) | 22 (48.9%) |
| Total (Category) | 102 (49.3%) | 105 (50.7%) |
| Total (Overall) | 169 (53.3%) | 148 (46.7%) |
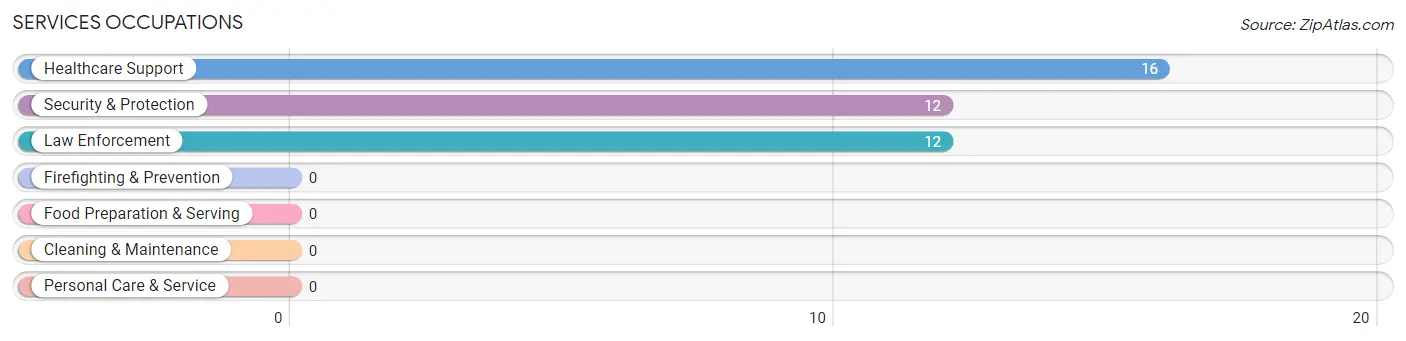
Services Occupations
The most common Services occupations in Spring Ridge are Healthcare Support (16 | 5.1%), Security & Protection (12 | 3.8%), and Law Enforcement (12 | 3.8%).
Services Occupations by Sex
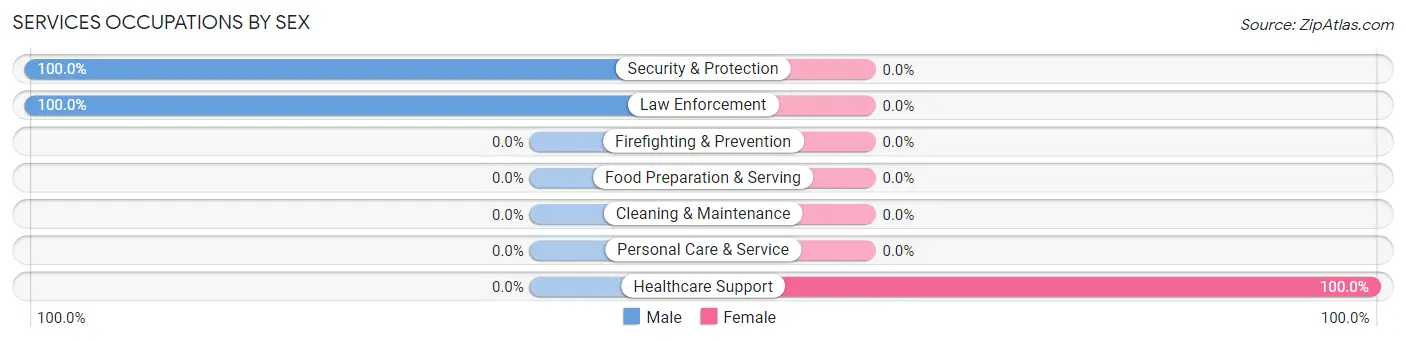
| Occupation | Male | Female |
| Healthcare Support | 0 (0.0%) | 16 (100.0%) |
| Security & Protection | 12 (100.0%) | 0 (0.0%) |
| Firefighting & Prevention | 0 (0.0%) | 0 (0.0%) |
| Law Enforcement | 12 (100.0%) | 0 (0.0%) |
| Food Preparation & Serving | 0 (0.0%) | 0 (0.0%) |
| Cleaning & Maintenance | 0 (0.0%) | 0 (0.0%) |
| Personal Care & Service | 0 (0.0%) | 0 (0.0%) |
| Total (Category) | 12 (42.9%) | 16 (57.1%) |
| Total (Overall) | 169 (53.3%) | 148 (46.7%) |
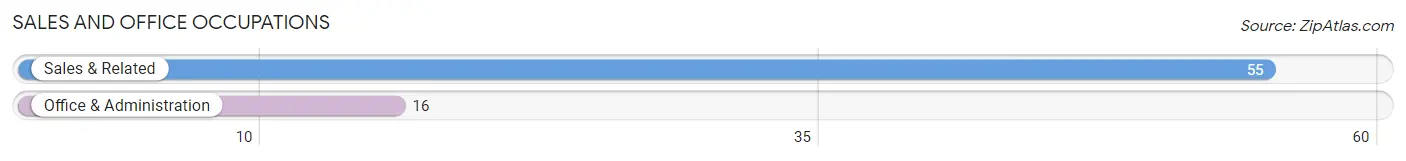
Sales and Office Occupations
The most common Sales and Office occupations in Spring Ridge are Sales & Related (55 | 17.3%), and Office & Administration (16 | 5.1%).
Sales and Office Occupations by Sex

| Occupation | Male | Female |
| Sales & Related | 55 (100.0%) | 0 (0.0%) |
| Office & Administration | 0 (0.0%) | 16 (100.0%) |
| Total (Category) | 55 (77.5%) | 16 (22.5%) |
| Total (Overall) | 169 (53.3%) | 148 (46.7%) |
Natural Resources, Construction and Maintenance Occupations
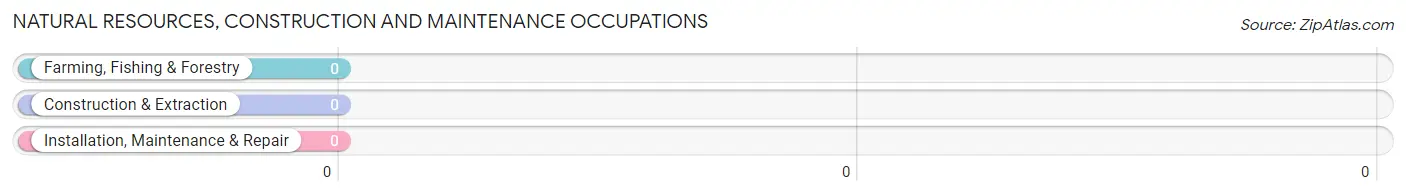
Natural Resources, Construction and Maintenance Occupations by Sex
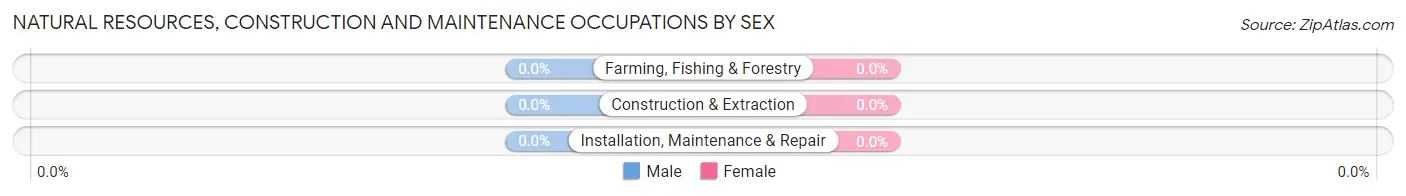
| Occupation | Male | Female |
| Farming, Fishing & Forestry | 0 (0.0%) | 0 (0.0%) |
| Construction & Extraction | 0 (0.0%) | 0 (0.0%) |
| Installation, Maintenance & Repair | 0 (0.0%) | 0 (0.0%) |
| Total (Category) | 0 (0.0%) | 0 (0.0%) |
| Total (Overall) | 169 (53.3%) | 148 (46.7%) |
Production, Transportation and Moving Occupations
The most common Production, Transportation and Moving occupations in Spring Ridge are , and Production (11 | 3.5%).
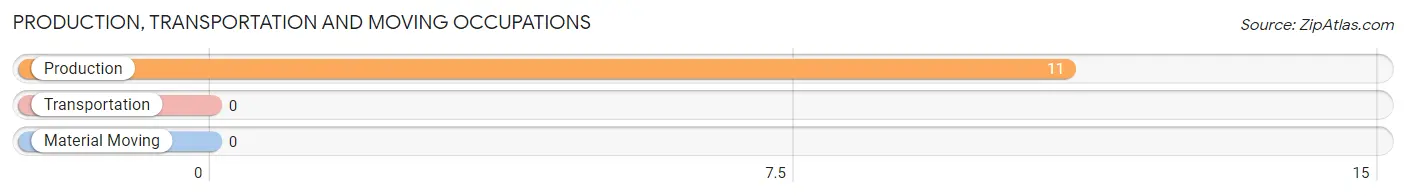
Production, Transportation and Moving Occupations by Sex
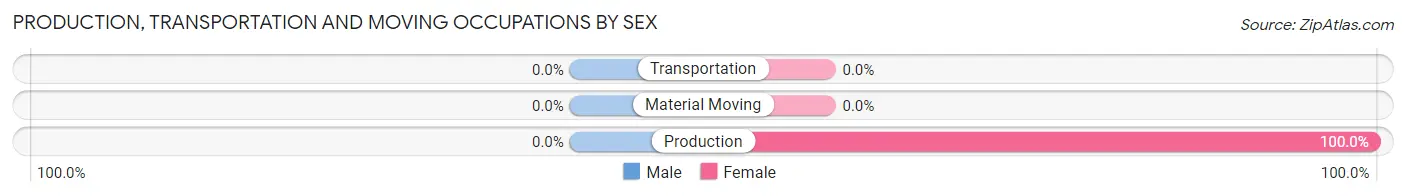
| Occupation | Male | Female |
| Production | 0 (0.0%) | 11 (100.0%) |
| Transportation | 0 (0.0%) | 0 (0.0%) |
| Material Moving | 0 (0.0%) | 0 (0.0%) |
| Total (Category) | 0 (0.0%) | 11 (100.0%) |
| Total (Overall) | 169 (53.3%) | 148 (46.7%) |
Employment Industries by Sex in Spring Ridge
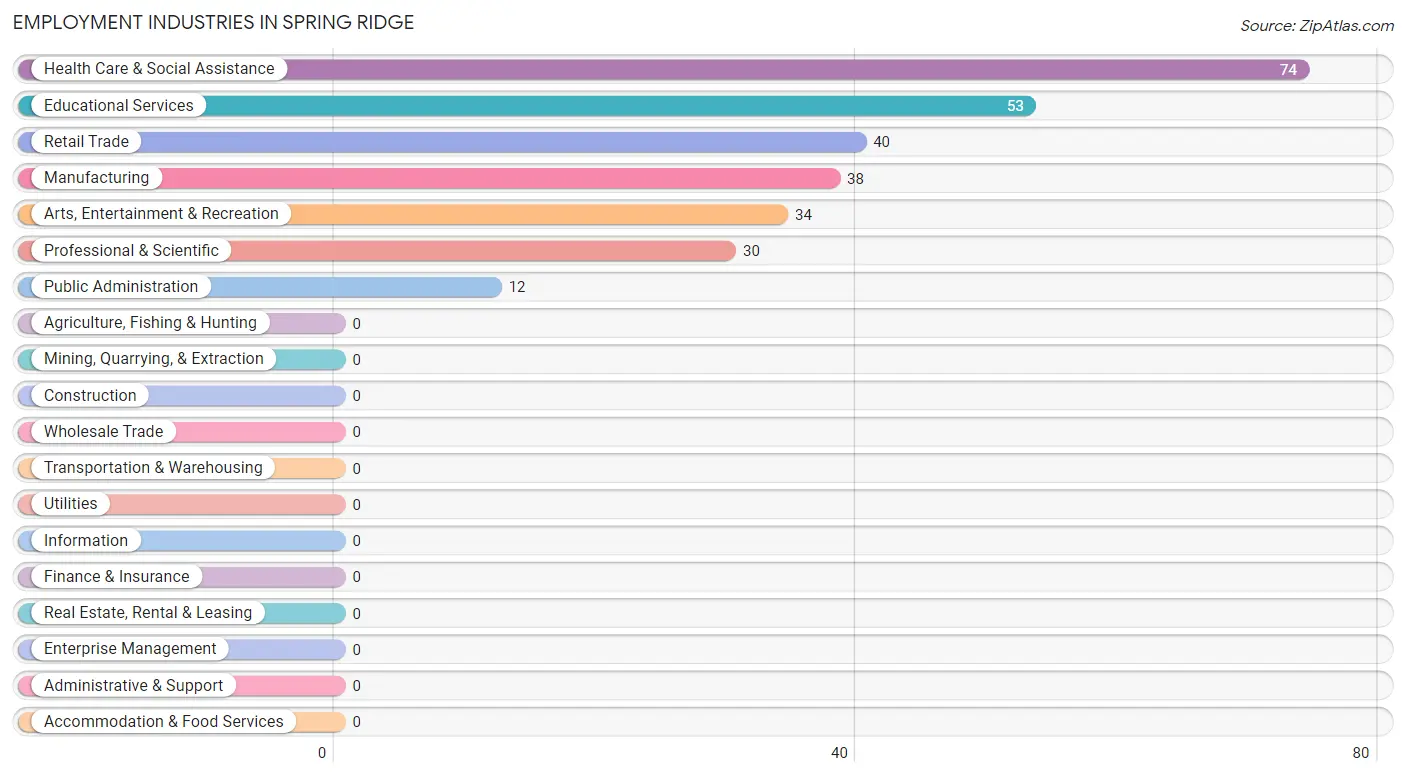
Employment Industries in Spring Ridge
The major employment industries in Spring Ridge include Health Care & Social Assistance (74 | 23.3%), Educational Services (53 | 16.7%), Retail Trade (40 | 12.6%), Manufacturing (38 | 12.0%), and Arts, Entertainment & Recreation (34 | 10.7%).
Employment Industries by Sex in Spring Ridge
The Spring Ridge industries that see more men than women are Retail Trade (100.0%), Arts, Entertainment & Recreation (100.0%), and Public Administration (100.0%), whereas the industries that tend to have a higher number of women are Educational Services (73.6%), Manufacturing (71.1%), and Health Care & Social Assistance (68.9%).
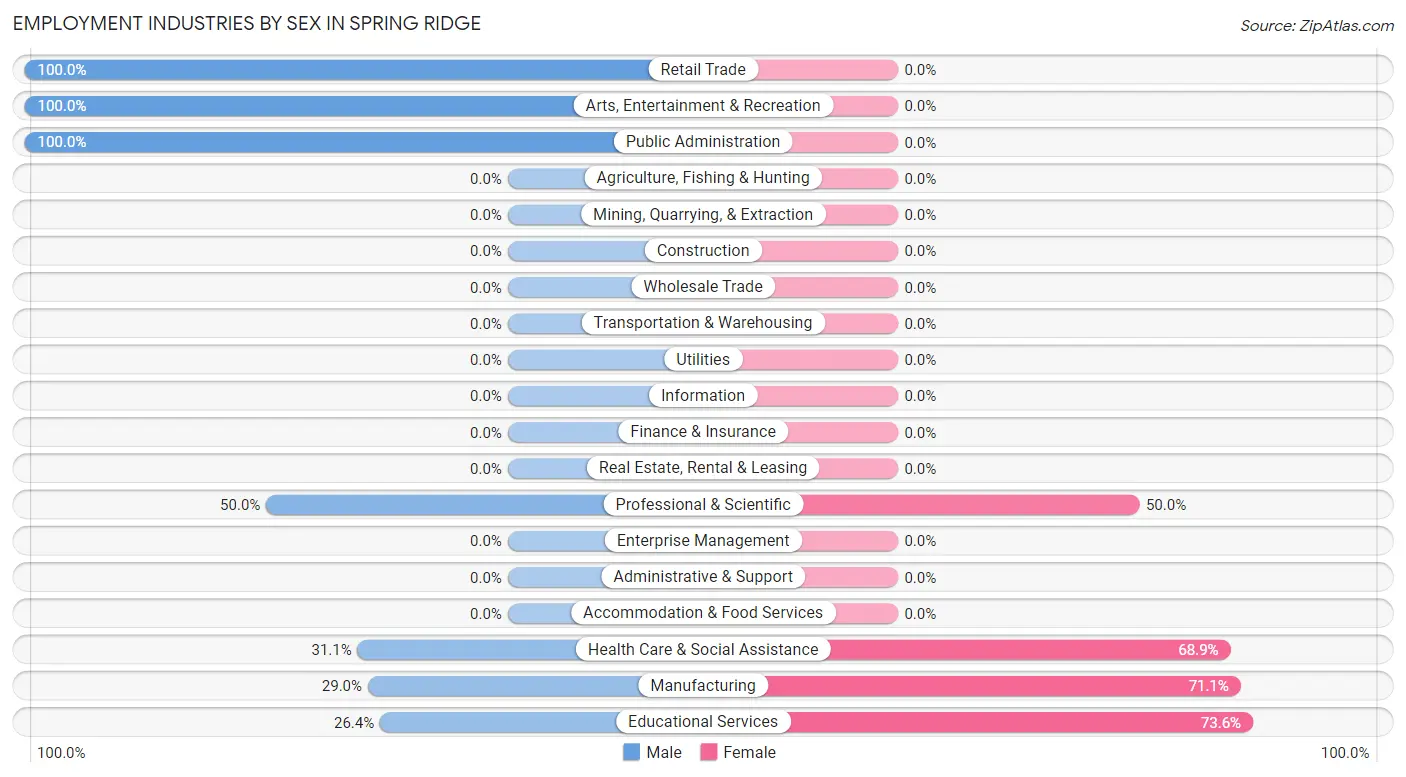
| Industry | Male | Female |
| Agriculture, Fishing & Hunting | 0 (0.0%) | 0 (0.0%) |
| Mining, Quarrying, & Extraction | 0 (0.0%) | 0 (0.0%) |
| Construction | 0 (0.0%) | 0 (0.0%) |
| Manufacturing | 11 (28.9%) | 27 (71.1%) |
| Wholesale Trade | 0 (0.0%) | 0 (0.0%) |
| Retail Trade | 40 (100.0%) | 0 (0.0%) |
| Transportation & Warehousing | 0 (0.0%) | 0 (0.0%) |
| Utilities | 0 (0.0%) | 0 (0.0%) |
| Information | 0 (0.0%) | 0 (0.0%) |
| Finance & Insurance | 0 (0.0%) | 0 (0.0%) |
| Real Estate, Rental & Leasing | 0 (0.0%) | 0 (0.0%) |
| Professional & Scientific | 15 (50.0%) | 15 (50.0%) |
| Enterprise Management | 0 (0.0%) | 0 (0.0%) |
| Administrative & Support | 0 (0.0%) | 0 (0.0%) |
| Educational Services | 14 (26.4%) | 39 (73.6%) |
| Health Care & Social Assistance | 23 (31.1%) | 51 (68.9%) |
| Arts, Entertainment & Recreation | 34 (100.0%) | 0 (0.0%) |
| Accommodation & Food Services | 0 (0.0%) | 0 (0.0%) |
| Public Administration | 12 (100.0%) | 0 (0.0%) |
| Total | 169 (53.3%) | 148 (46.7%) |
Education in Spring Ridge
School Enrollment in Spring Ridge
The most common levels of schooling among the 56 students in Spring Ridge are middle school (30 | 53.6%), and elementary school (26 | 46.4%).
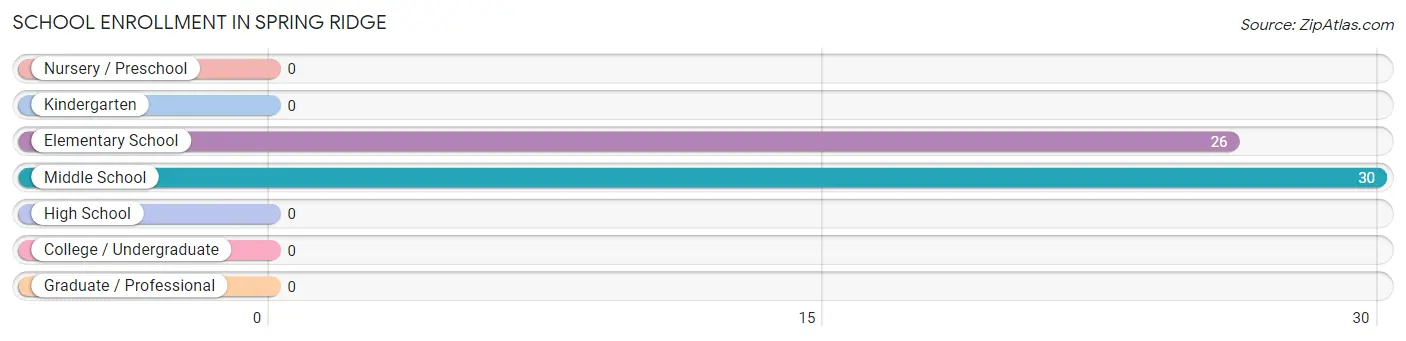
| School Level | # Students | % Students |
| Nursery / Preschool | 0 | 0.0% |
| Kindergarten | 0 | 0.0% |
| Elementary School | 26 | 46.4% |
| Middle School | 30 | 53.6% |
| High School | 0 | 0.0% |
| College / Undergraduate | 0 | 0.0% |
| Graduate / Professional | 0 | 0.0% |
| Total | 56 | 100.0% |
School Enrollment by Age by Funding Source in Spring Ridge
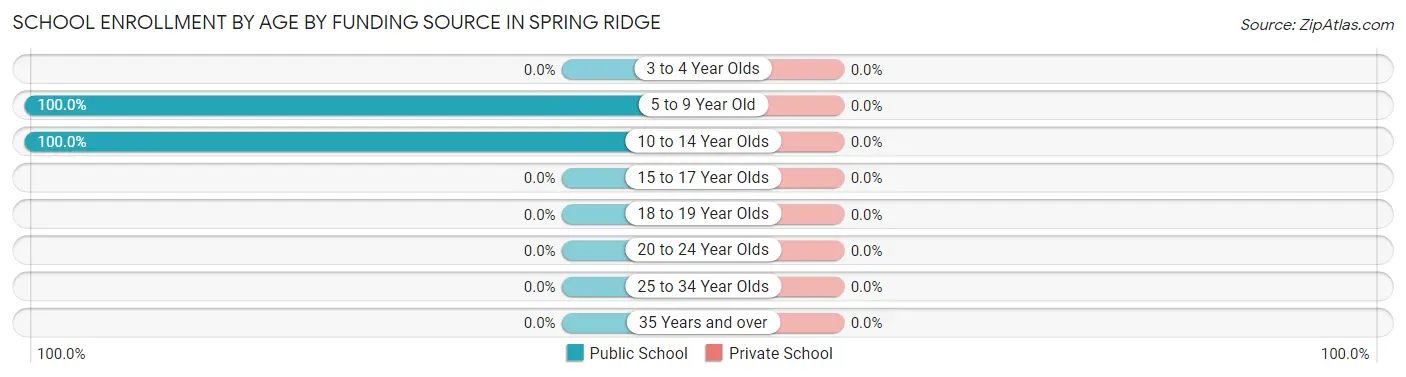
| Age Bracket | Public School | Private School |
| 3 to 4 Year Olds | 0 (0.0%) | 0 (0.0%) |
| 5 to 9 Year Old | 26 (100.0%) | 0 (0.0%) |
| 10 to 14 Year Olds | 30 (100.0%) | 0 (0.0%) |
| 15 to 17 Year Olds | 0 (0.0%) | 0 (0.0%) |
| 18 to 19 Year Olds | 0 (0.0%) | 0 (0.0%) |
| 20 to 24 Year Olds | 0 (0.0%) | 0 (0.0%) |
| 25 to 34 Year Olds | 0 (0.0%) | 0 (0.0%) |
| 35 Years and over | 0 (0.0%) | 0 (0.0%) |
| Total | 56 (100.0%) | 0 (0.0%) |
Educational Attainment by Field of Study in Spring Ridge
Business (69 | 19.0%), science & technology (59 | 16.3%), communications (43 | 11.8%), engineering (42 | 11.6%), and education (42 | 11.6%) are the most common fields of study among 363 individuals in Spring Ridge who have obtained a bachelor's degree or higher.
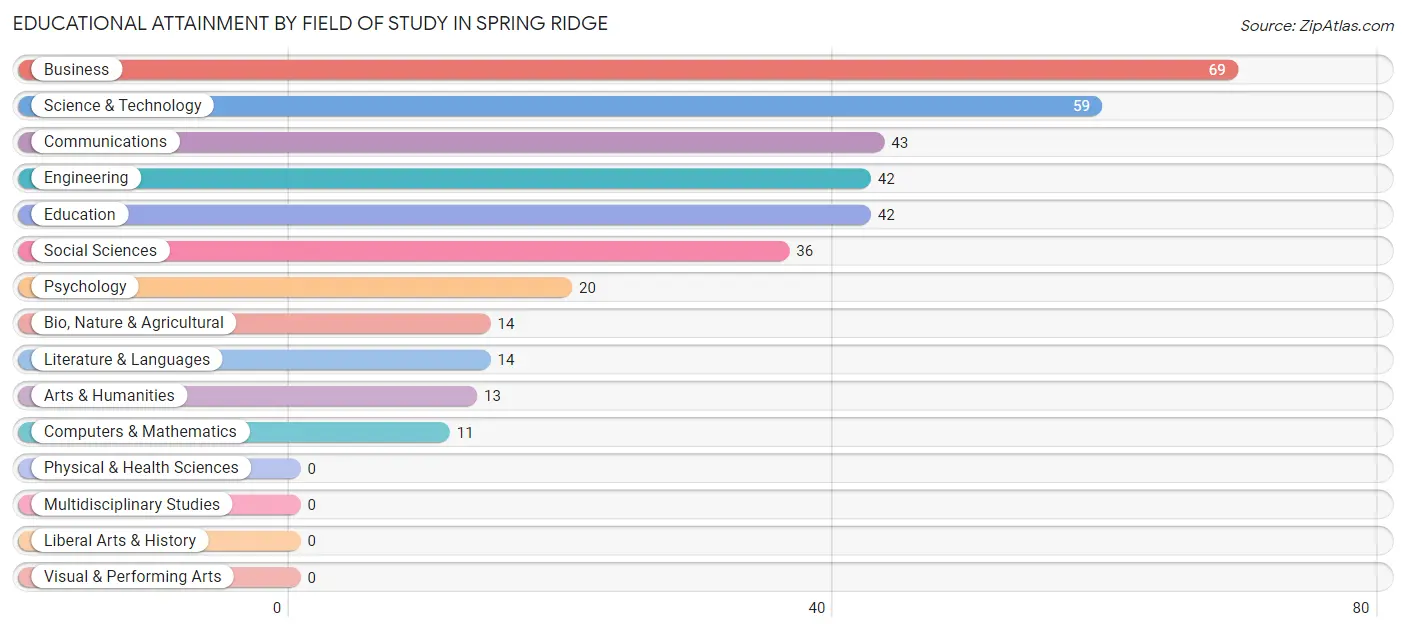
| Field of Study | # Graduates | % Graduates |
| Computers & Mathematics | 11 | 3.0% |
| Bio, Nature & Agricultural | 14 | 3.9% |
| Physical & Health Sciences | 0 | 0.0% |
| Psychology | 20 | 5.5% |
| Social Sciences | 36 | 9.9% |
| Engineering | 42 | 11.6% |
| Multidisciplinary Studies | 0 | 0.0% |
| Science & Technology | 59 | 16.3% |
| Business | 69 | 19.0% |
| Education | 42 | 11.6% |
| Literature & Languages | 14 | 3.9% |
| Liberal Arts & History | 0 | 0.0% |
| Visual & Performing Arts | 0 | 0.0% |
| Communications | 43 | 11.8% |
| Arts & Humanities | 13 | 3.6% |
| Total | 363 | 100.0% |
Transportation & Commute in Spring Ridge
Vehicle Availability by Sex in Spring Ridge
The most prevalent vehicle ownership categories in Spring Ridge are males with 2 vehicles (96, accounting for 56.8%) and females with 2 vehicles (101, making up 64.9%).
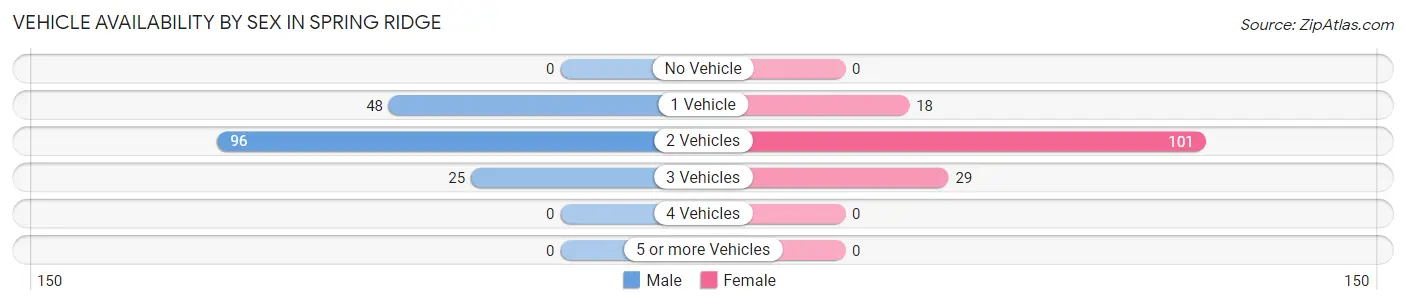
| Vehicles Available | Male | Female |
| No Vehicle | 0 (0.0%) | 0 (0.0%) |
| 1 Vehicle | 48 (28.4%) | 18 (12.2%) |
| 2 Vehicles | 96 (56.8%) | 101 (68.2%) |
| 3 Vehicles | 25 (14.8%) | 29 (19.6%) |
| 4 Vehicles | 0 (0.0%) | 0 (0.0%) |
| 5 or more Vehicles | 0 (0.0%) | 0 (0.0%) |
| Total | 169 (100.0%) | 148 (100.0%) |
Commute Time in Spring Ridge
The most frequently occuring commute durations in Spring Ridge are 5 to 9 minutes (94 commuters, 31.1%), 15 to 19 minutes (72 commuters, 23.8%), and 10 to 14 minutes (46 commuters, 15.2%).
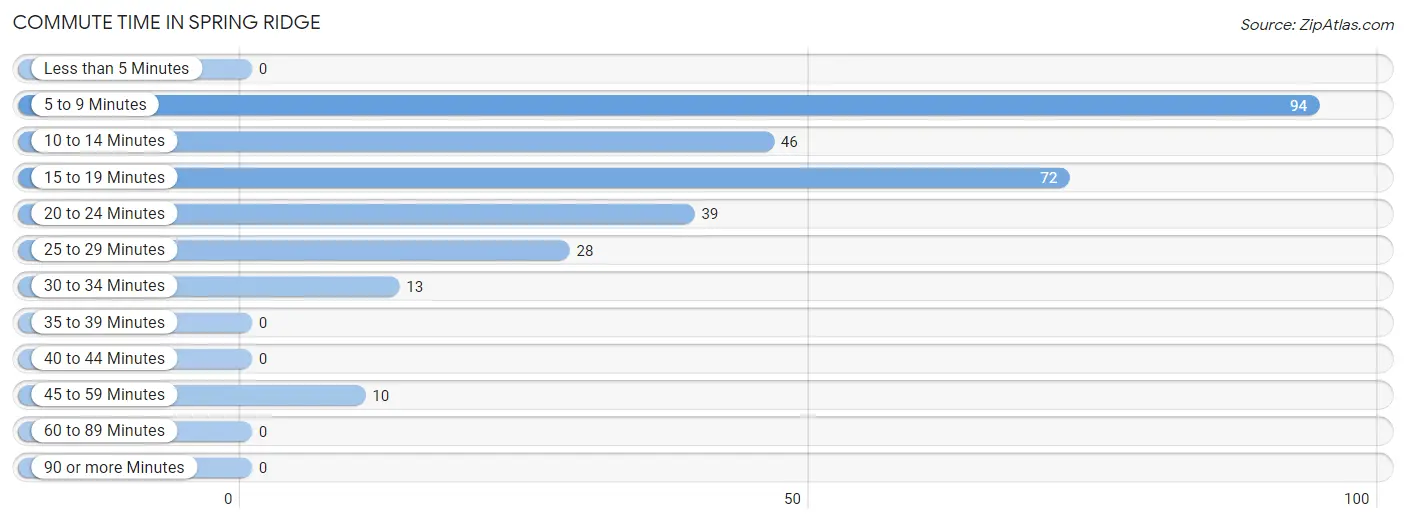
| Commute Time | # Commuters | % Commuters |
| Less than 5 Minutes | 0 | 0.0% |
| 5 to 9 Minutes | 94 | 31.1% |
| 10 to 14 Minutes | 46 | 15.2% |
| 15 to 19 Minutes | 72 | 23.8% |
| 20 to 24 Minutes | 39 | 12.9% |
| 25 to 29 Minutes | 28 | 9.3% |
| 30 to 34 Minutes | 13 | 4.3% |
| 35 to 39 Minutes | 0 | 0.0% |
| 40 to 44 Minutes | 0 | 0.0% |
| 45 to 59 Minutes | 10 | 3.3% |
| 60 to 89 Minutes | 0 | 0.0% |
| 90 or more Minutes | 0 | 0.0% |
Commute Time by Sex in Spring Ridge
The most common commute times in Spring Ridge are 15 to 19 minutes (41 commuters, 24.3%) for males and 5 to 9 minutes (55 commuters, 41.3%) for females.
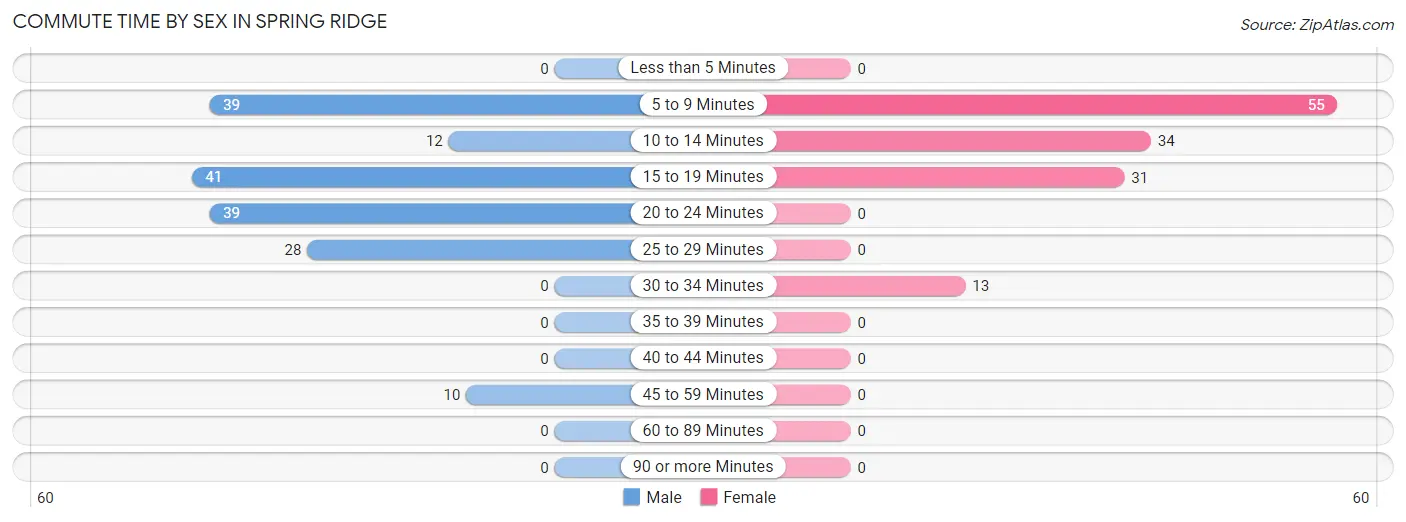
| Commute Time | Male | Female |
| Less than 5 Minutes | 0 (0.0%) | 0 (0.0%) |
| 5 to 9 Minutes | 39 (23.1%) | 55 (41.3%) |
| 10 to 14 Minutes | 12 (7.1%) | 34 (25.6%) |
| 15 to 19 Minutes | 41 (24.3%) | 31 (23.3%) |
| 20 to 24 Minutes | 39 (23.1%) | 0 (0.0%) |
| 25 to 29 Minutes | 28 (16.6%) | 0 (0.0%) |
| 30 to 34 Minutes | 0 (0.0%) | 13 (9.8%) |
| 35 to 39 Minutes | 0 (0.0%) | 0 (0.0%) |
| 40 to 44 Minutes | 0 (0.0%) | 0 (0.0%) |
| 45 to 59 Minutes | 10 (5.9%) | 0 (0.0%) |
| 60 to 89 Minutes | 0 (0.0%) | 0 (0.0%) |
| 90 or more Minutes | 0 (0.0%) | 0 (0.0%) |
Time of Departure to Work by Sex in Spring Ridge
The most frequent times of departure to work in Spring Ridge are 8:00 AM to 8:29 AM (42, 24.8%) for males and 7:00 AM to 7:29 AM (70, 52.6%) for females.
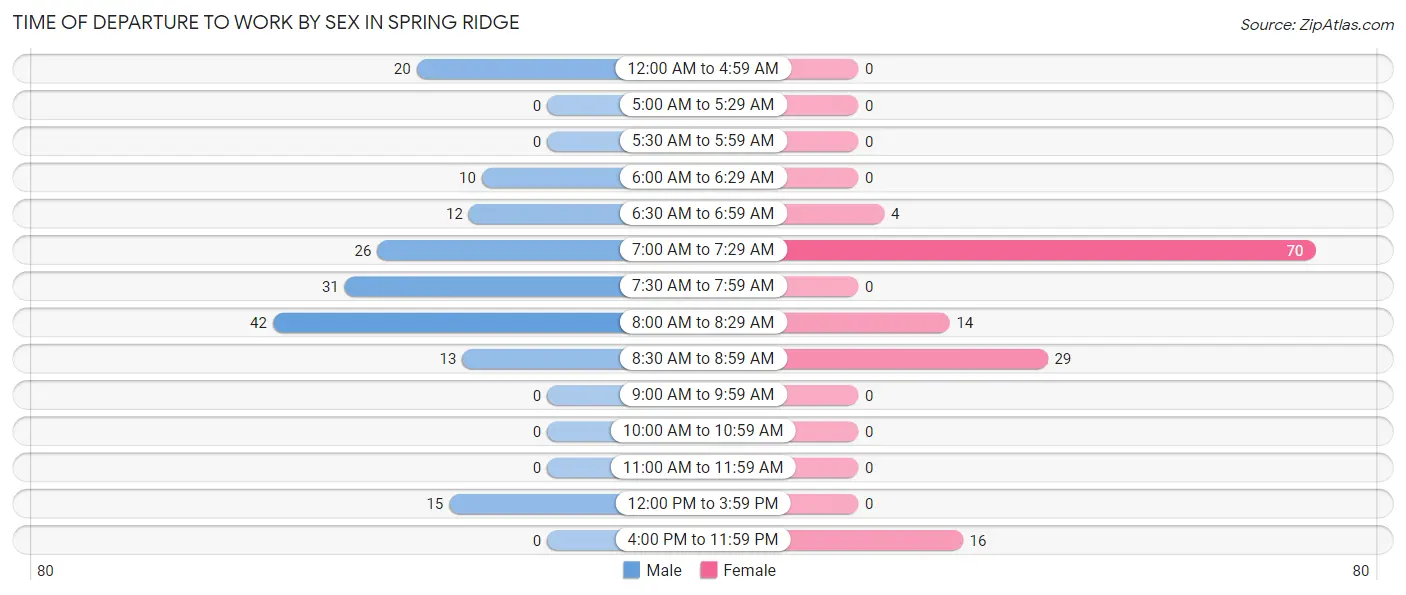
| Time of Departure | Male | Female |
| 12:00 AM to 4:59 AM | 20 (11.8%) | 0 (0.0%) |
| 5:00 AM to 5:29 AM | 0 (0.0%) | 0 (0.0%) |
| 5:30 AM to 5:59 AM | 0 (0.0%) | 0 (0.0%) |
| 6:00 AM to 6:29 AM | 10 (5.9%) | 0 (0.0%) |
| 6:30 AM to 6:59 AM | 12 (7.1%) | 4 (3.0%) |
| 7:00 AM to 7:29 AM | 26 (15.4%) | 70 (52.6%) |
| 7:30 AM to 7:59 AM | 31 (18.3%) | 0 (0.0%) |
| 8:00 AM to 8:29 AM | 42 (24.8%) | 14 (10.5%) |
| 8:30 AM to 8:59 AM | 13 (7.7%) | 29 (21.8%) |
| 9:00 AM to 9:59 AM | 0 (0.0%) | 0 (0.0%) |
| 10:00 AM to 10:59 AM | 0 (0.0%) | 0 (0.0%) |
| 11:00 AM to 11:59 AM | 0 (0.0%) | 0 (0.0%) |
| 12:00 PM to 3:59 PM | 15 (8.9%) | 0 (0.0%) |
| 4:00 PM to 11:59 PM | 0 (0.0%) | 16 (12.0%) |
| Total | 169 (100.0%) | 133 (100.0%) |
Housing Occupancy in Spring Ridge
Occupancy by Ownership in Spring Ridge
Of the total 497 dwellings in Spring Ridge, owner-occupied units account for 463 (93.2%), while renter-occupied units make up 34 (6.8%).
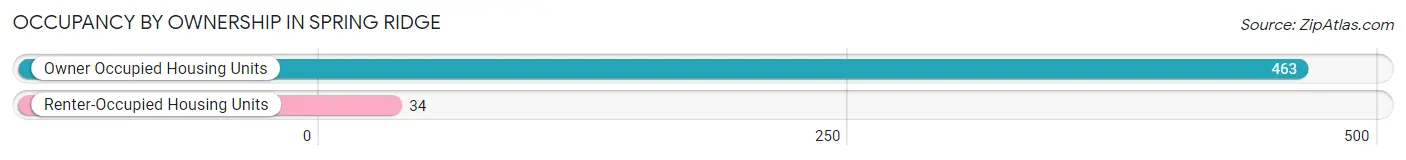
| Occupancy | # Housing Units | % Housing Units |
| Owner Occupied Housing Units | 463 | 93.2% |
| Renter-Occupied Housing Units | 34 | 6.8% |
| Total Occupied Housing Units | 497 | 100.0% |
Occupancy by Household Size in Spring Ridge
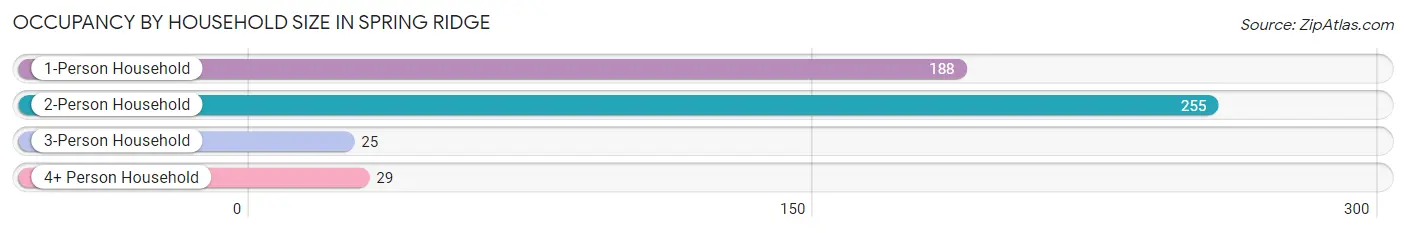
| Household Size | # Housing Units | % Housing Units |
| 1-Person Household | 188 | 37.8% |
| 2-Person Household | 255 | 51.3% |
| 3-Person Household | 25 | 5.0% |
| 4+ Person Household | 29 | 5.8% |
| Total Housing Units | 497 | 100.0% |
Occupancy by Ownership by Household Size in Spring Ridge
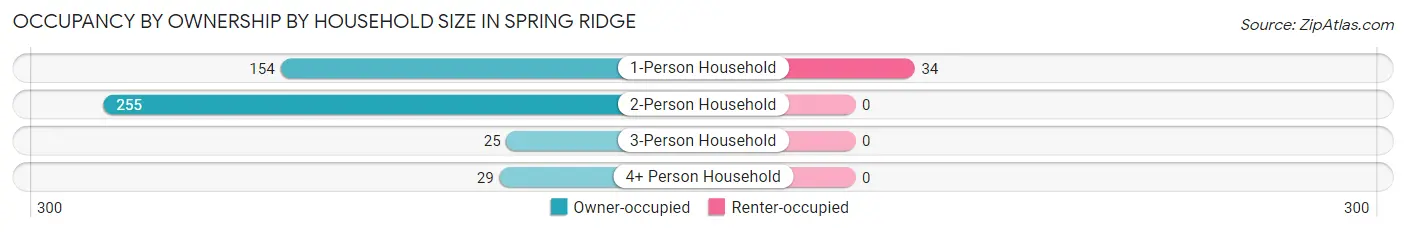
| Household Size | Owner-occupied | Renter-occupied |
| 1-Person Household | 154 (81.9%) | 34 (18.1%) |
| 2-Person Household | 255 (100.0%) | 0 (0.0%) |
| 3-Person Household | 25 (100.0%) | 0 (0.0%) |
| 4+ Person Household | 29 (100.0%) | 0 (0.0%) |
| Total Housing Units | 463 (93.2%) | 34 (6.8%) |
Occupancy by Educational Attainment in Spring Ridge
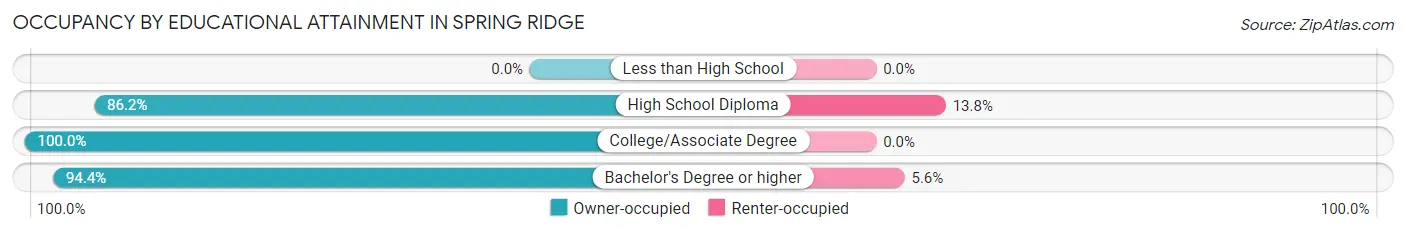
| Household Size | Owner-occupied | Renter-occupied |
| Less than High School | 0 (0.0%) | 0 (0.0%) |
| High School Diploma | 125 (86.2%) | 20 (13.8%) |
| College/Associate Degree | 103 (100.0%) | 0 (0.0%) |
| Bachelor's Degree or higher | 235 (94.4%) | 14 (5.6%) |
Occupancy by Age of Householder in Spring Ridge
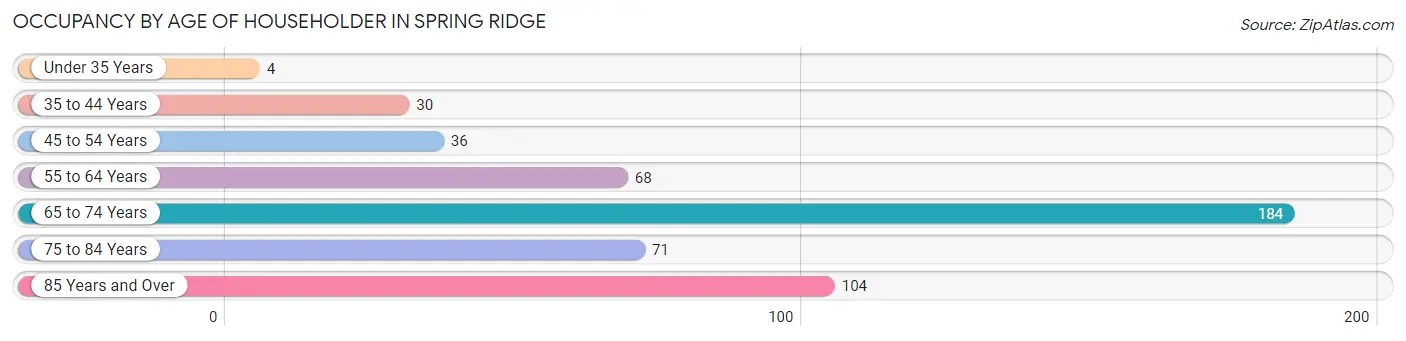
| Age Bracket | # Households | % Households |
| Under 35 Years | 4 | 0.8% |
| 35 to 44 Years | 30 | 6.0% |
| 45 to 54 Years | 36 | 7.2% |
| 55 to 64 Years | 68 | 13.7% |
| 65 to 74 Years | 184 | 37.0% |
| 75 to 84 Years | 71 | 14.3% |
| 85 Years and Over | 104 | 20.9% |
| Total | 497 | 100.0% |
Housing Finances in Spring Ridge
Median Income by Occupancy in Spring Ridge
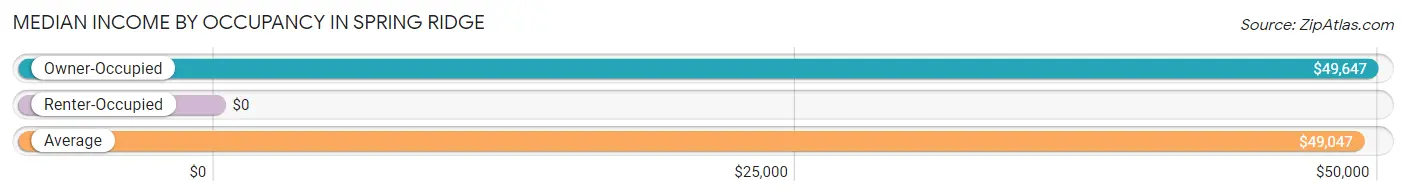
| Occupancy Type | # Households | Median Income |
| Owner-Occupied | 463 (93.2%) | $49,647 |
| Renter-Occupied | 34 (6.8%) | $0 |
| Average | 497 (100.0%) | $49,047 |
Occupancy by Householder Income Bracket in Spring Ridge
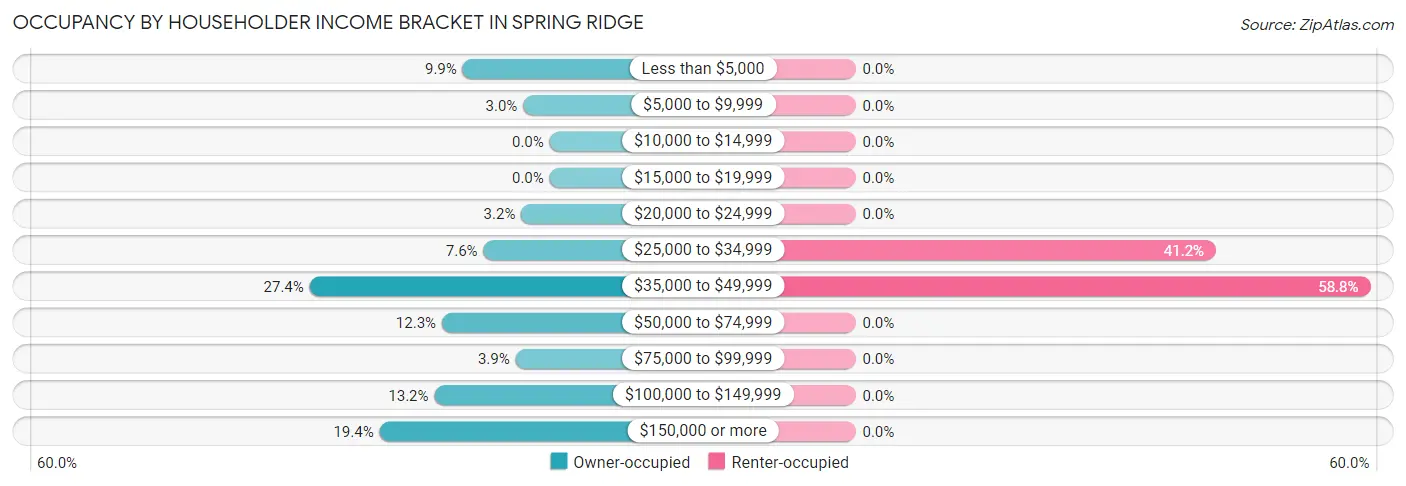
| Income Bracket | Owner-occupied | Renter-occupied |
| Less than $5,000 | 46 (9.9%) | 0 (0.0%) |
| $5,000 to $9,999 | 14 (3.0%) | 0 (0.0%) |
| $10,000 to $14,999 | 0 (0.0%) | 0 (0.0%) |
| $15,000 to $19,999 | 0 (0.0%) | 0 (0.0%) |
| $20,000 to $24,999 | 15 (3.2%) | 0 (0.0%) |
| $25,000 to $34,999 | 35 (7.6%) | 14 (41.2%) |
| $35,000 to $49,999 | 127 (27.4%) | 20 (58.8%) |
| $50,000 to $74,999 | 57 (12.3%) | 0 (0.0%) |
| $75,000 to $99,999 | 18 (3.9%) | 0 (0.0%) |
| $100,000 to $149,999 | 61 (13.2%) | 0 (0.0%) |
| $150,000 or more | 90 (19.4%) | 0 (0.0%) |
| Total | 463 (100.0%) | 34 (100.0%) |
Monthly Housing Cost Tiers in Spring Ridge
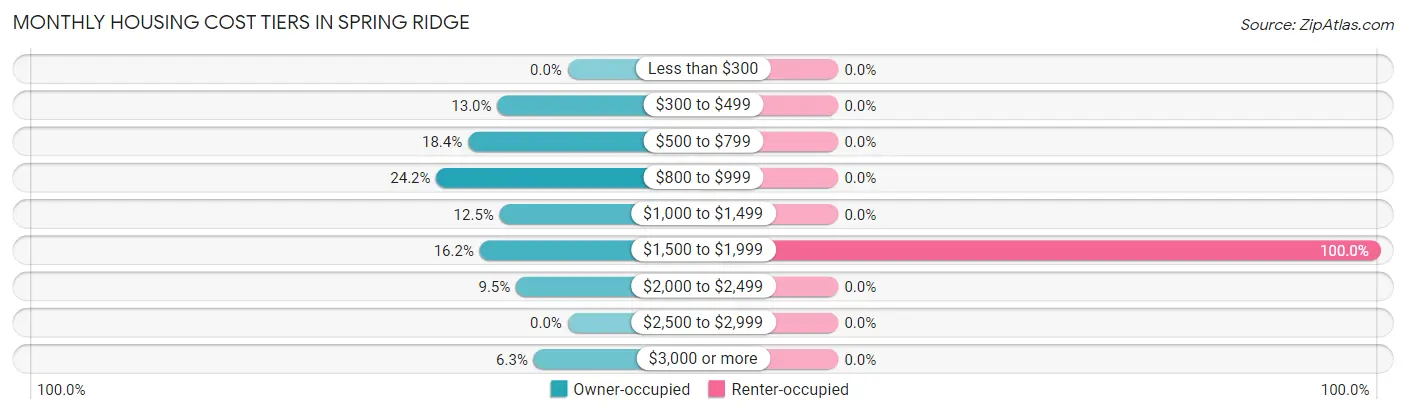
| Monthly Cost | Owner-occupied | Renter-occupied |
| Less than $300 | 0 (0.0%) | 0 (0.0%) |
| $300 to $499 | 60 (13.0%) | 0 (0.0%) |
| $500 to $799 | 85 (18.4%) | 0 (0.0%) |
| $800 to $999 | 112 (24.2%) | 0 (0.0%) |
| $1,000 to $1,499 | 58 (12.5%) | 0 (0.0%) |
| $1,500 to $1,999 | 75 (16.2%) | 34 (100.0%) |
| $2,000 to $2,499 | 44 (9.5%) | 0 (0.0%) |
| $2,500 to $2,999 | 0 (0.0%) | 0 (0.0%) |
| $3,000 or more | 29 (6.3%) | 0 (0.0%) |
| Total | 463 (100.0%) | 34 (100.0%) |
Physical Housing Characteristics in Spring Ridge
Housing Structures in Spring Ridge
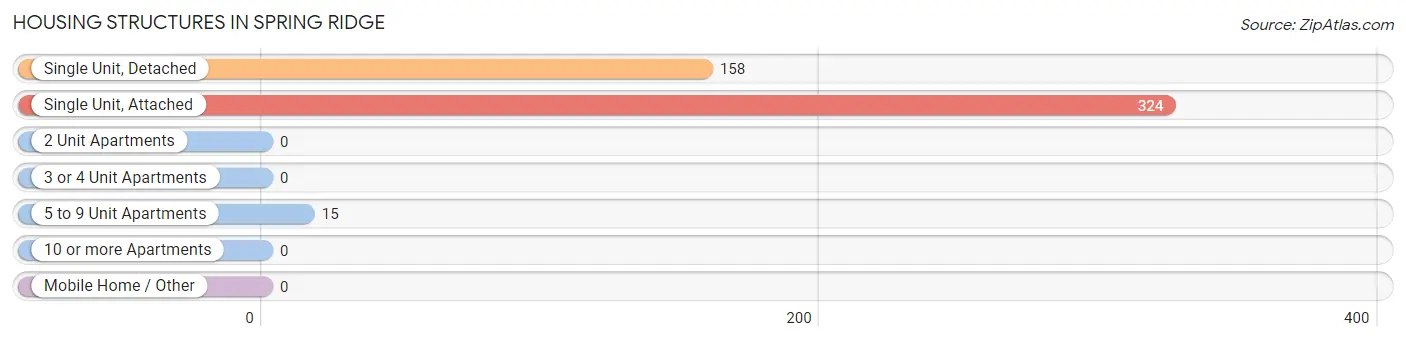
| Structure Type | # Housing Units | % Housing Units |
| Single Unit, Detached | 158 | 31.8% |
| Single Unit, Attached | 324 | 65.2% |
| 2 Unit Apartments | 0 | 0.0% |
| 3 or 4 Unit Apartments | 0 | 0.0% |
| 5 to 9 Unit Apartments | 15 | 3.0% |
| 10 or more Apartments | 0 | 0.0% |
| Mobile Home / Other | 0 | 0.0% |
| Total | 497 | 100.0% |
Housing Structures by Occupancy in Spring Ridge
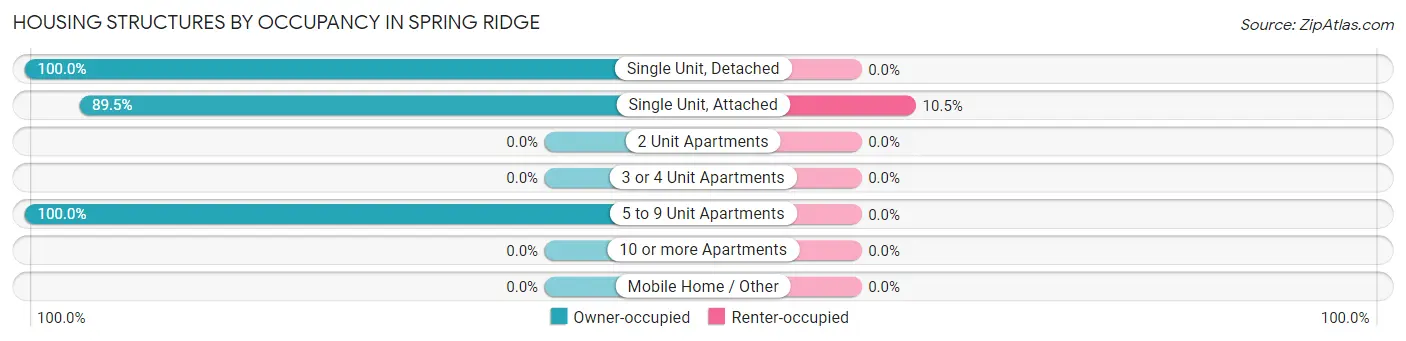
| Structure Type | Owner-occupied | Renter-occupied |
| Single Unit, Detached | 158 (100.0%) | 0 (0.0%) |
| Single Unit, Attached | 290 (89.5%) | 34 (10.5%) |
| 2 Unit Apartments | 0 (0.0%) | 0 (0.0%) |
| 3 or 4 Unit Apartments | 0 (0.0%) | 0 (0.0%) |
| 5 to 9 Unit Apartments | 15 (100.0%) | 0 (0.0%) |
| 10 or more Apartments | 0 (0.0%) | 0 (0.0%) |
| Mobile Home / Other | 0 (0.0%) | 0 (0.0%) |
| Total | 463 (93.2%) | 34 (6.8%) |
Housing Structures by Number of Rooms in Spring Ridge
| Number of Rooms | Owner-occupied | Renter-occupied |
| 1 Room | 0 (0.0%) | 0 (0.0%) |
| 2 or 3 Rooms | 0 (0.0%) | 0 (0.0%) |
| 4 or 5 Rooms | 127 (27.4%) | 20 (58.8%) |
| 6 or 7 Rooms | 231 (49.9%) | 0 (0.0%) |
| 8 or more Rooms | 105 (22.7%) | 14 (41.2%) |
| Total | 463 (100.0%) | 34 (100.0%) |
Housing Structure by Heating Type in Spring Ridge
| Heating Type | Owner-occupied | Renter-occupied |
| Utility Gas | 334 (72.1%) | 14 (41.2%) |
| Bottled, Tank, or LP Gas | 0 (0.0%) | 0 (0.0%) |
| Electricity | 113 (24.4%) | 20 (58.8%) |
| Fuel Oil or Kerosene | 0 (0.0%) | 0 (0.0%) |
| Coal or Coke | 0 (0.0%) | 0 (0.0%) |
| All other Fuels | 16 (3.5%) | 0 (0.0%) |
| No Fuel Used | 0 (0.0%) | 0 (0.0%) |
| Total | 463 (100.0%) | 34 (100.0%) |
Household Vehicle Usage in Spring Ridge
| Vehicles per Household | Owner-occupied | Renter-occupied |
| No Vehicle | 62 (13.4%) | 0 (0.0%) |
| 1 Vehicle | 121 (26.1%) | 34 (100.0%) |
| 2 Vehicles | 255 (55.1%) | 0 (0.0%) |
| 3 or more Vehicles | 25 (5.4%) | 0 (0.0%) |
| Total | 463 (100.0%) | 34 (100.0%) |
Real Estate & Mortgages in Spring Ridge
Real Estate and Mortgage Overview in Spring Ridge
| Characteristic | Without Mortgage | With Mortgage |
| Housing Units | 328 | 135 |
| Median Property Value | $310,600 | $341,300 |
| Median Household Income | $48,718 | $66 |
| Monthly Housing Costs | $833 | $29 |
| Real Estate Taxes | $5,182 | $0 |
Property Value by Mortgage Status in Spring Ridge
| Property Value | Without Mortgage | With Mortgage |
| Less than $50,000 | 0 (0.0%) | 0 (0.0%) |
| $50,000 to $99,999 | 0 (0.0%) | 0 (0.0%) |
| $100,000 to $299,999 | 153 (46.7%) | 46 (34.1%) |
| $300,000 to $499,999 | 175 (53.3%) | 64 (47.4%) |
| $500,000 to $749,999 | 0 (0.0%) | 10 (7.4%) |
| $750,000 to $999,999 | 0 (0.0%) | 15 (11.1%) |
| $1,000,000 or more | 0 (0.0%) | 0 (0.0%) |
| Total | 328 (100.0%) | 135 (100.0%) |
Household Income by Mortgage Status in Spring Ridge
| Household Income | Without Mortgage | With Mortgage |
| Less than $10,000 | 43 (13.1%) | 10 (7.4%) |
| $10,000 to $24,999 | 0 (0.0%) | 17 (12.6%) |
| $25,000 to $34,999 | 14 (4.3%) | 15 (11.1%) |
| $35,000 to $49,999 | 127 (38.7%) | 21 (15.6%) |
| $50,000 to $74,999 | 57 (17.4%) | 0 (0.0%) |
| $75,000 to $99,999 | 18 (5.5%) | 0 (0.0%) |
| $100,000 to $149,999 | 45 (13.7%) | 0 (0.0%) |
| $150,000 or more | 24 (7.3%) | 16 (11.8%) |
| Total | 328 (100.0%) | 135 (100.0%) |
Property Value to Household Income Ratio in Spring Ridge
| Value-to-Income Ratio | Without Mortgage | With Mortgage |
| Less than 2.0x | 28 (8.5%) | 139,766 (103,530.4%) |
| 2.0x to 2.9x | 11 (3.4%) | 39 (28.9%) |
| 3.0x to 3.9x | 98 (29.9%) | 28 (20.7%) |
| 4.0x or more | 148 (45.1%) | 0 (0.0%) |
| Total | 328 (100.0%) | 135 (100.0%) |
Real Estate Taxes by Mortgage Status in Spring Ridge
| Property Taxes | Without Mortgage | With Mortgage |
| Less than $800 | 0 (0.0%) | 0 (0.0%) |
| $800 to $1,499 | 0 (0.0%) | 0 (0.0%) |
| $800 to $1,499 | 328 (100.0%) | 0 (0.0%) |
| Total | 328 (100.0%) | 135 (100.0%) |
Health & Disability in Spring Ridge
Health Insurance Coverage by Age in Spring Ridge
| Age Bracket | With Coverage | Without Coverage |
| Under 6 Years | 0 (0.0%) | 0 (0.0%) |
| 6 to 18 Years | 56 (100.0%) | 0 (0.0%) |
| 19 to 25 Years | 16 (100.0%) | 0 (0.0%) |
| 26 to 34 Years | 18 (100.0%) | 0 (0.0%) |
| 35 to 44 Years | 44 (100.0%) | 0 (0.0%) |
| 45 to 54 Years | 96 (100.0%) | 0 (0.0%) |
| 55 to 64 Years | 101 (100.0%) | 0 (0.0%) |
| 65 to 74 Years | 278 (100.0%) | 0 (0.0%) |
| 75 Years and older | 289 (100.0%) | 0 (0.0%) |
| Total | 898 (100.0%) | 0 (0.0%) |
Health Insurance Coverage by Citizenship Status in Spring Ridge
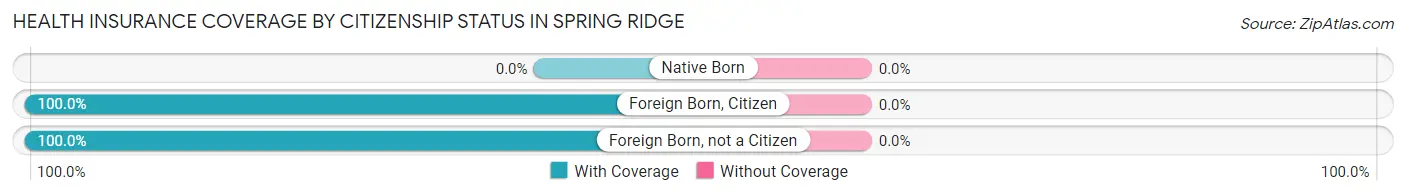
| Citizenship Status | With Coverage | Without Coverage |
| Native Born | 0 (0.0%) | 0 (0.0%) |
| Foreign Born, Citizen | 56 (100.0%) | 0 (0.0%) |
| Foreign Born, not a Citizen | 16 (100.0%) | 0 (0.0%) |
Health Insurance Coverage by Household Income in Spring Ridge
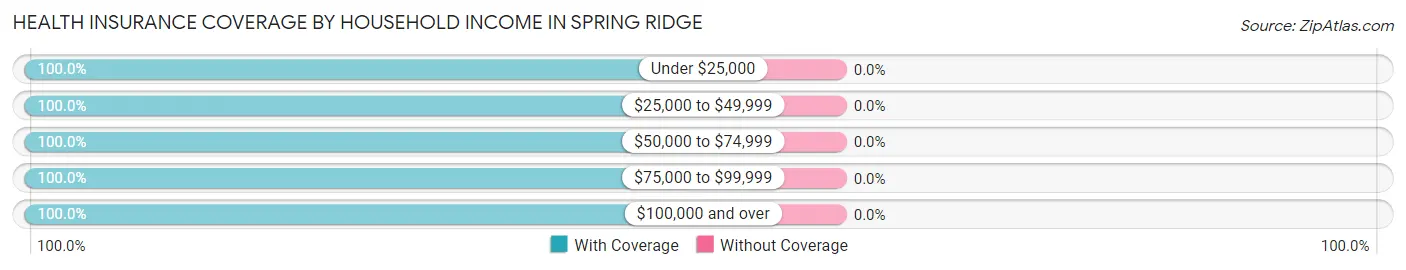
| Household Income | With Coverage | Without Coverage |
| Under $25,000 | 75 (100.0%) | 0 (0.0%) |
| $25,000 to $49,999 | 339 (100.0%) | 0 (0.0%) |
| $50,000 to $74,999 | 74 (100.0%) | 0 (0.0%) |
| $75,000 to $99,999 | 18 (100.0%) | 0 (0.0%) |
| $100,000 and over | 392 (100.0%) | 0 (0.0%) |
Public vs Private Health Insurance Coverage by Age in Spring Ridge
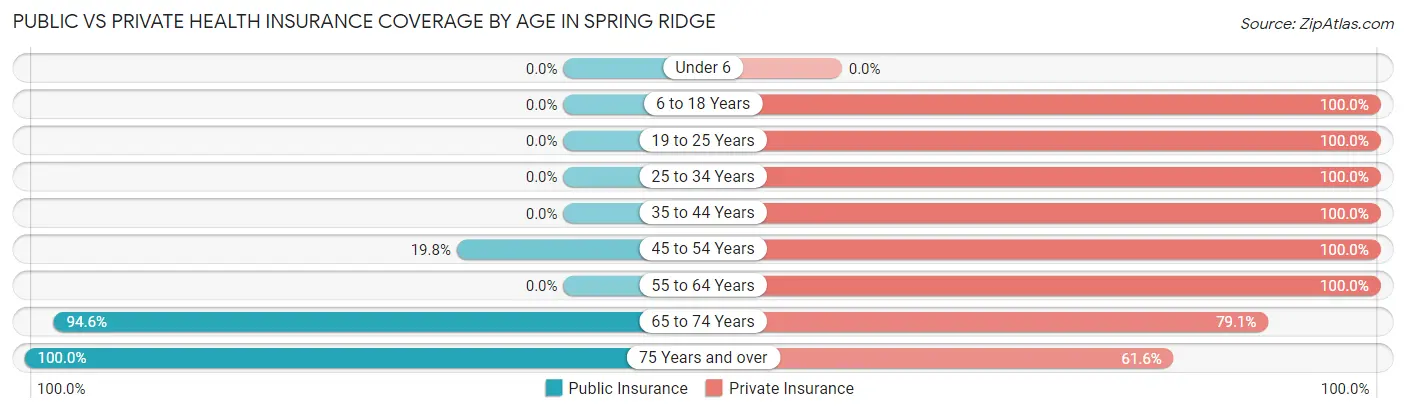
| Age Bracket | Public Insurance | Private Insurance |
| Under 6 | 0 (0.0%) | 0 (0.0%) |
| 6 to 18 Years | 0 (0.0%) | 56 (100.0%) |
| 19 to 25 Years | 0 (0.0%) | 16 (100.0%) |
| 25 to 34 Years | 0 (0.0%) | 18 (100.0%) |
| 35 to 44 Years | 0 (0.0%) | 44 (100.0%) |
| 45 to 54 Years | 19 (19.8%) | 96 (100.0%) |
| 55 to 64 Years | 0 (0.0%) | 101 (100.0%) |
| 65 to 74 Years | 263 (94.6%) | 220 (79.1%) |
| 75 Years and over | 289 (100.0%) | 178 (61.6%) |
| Total | 571 (63.6%) | 729 (81.2%) |
Disability Status by Sex by Age in Spring Ridge
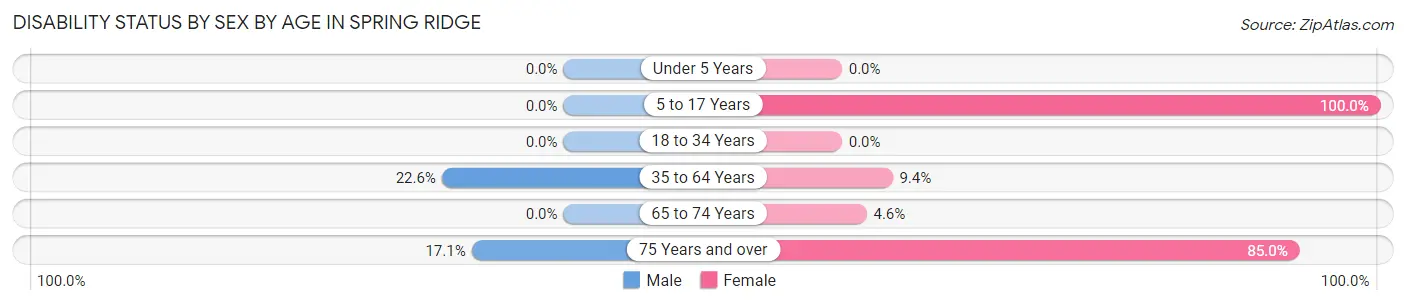
| Age Bracket | Male | Female |
| Under 5 Years | 0 (0.0%) | 0 (0.0%) |
| 5 to 17 Years | 0 (0.0%) | 15 (100.0%) |
| 18 to 34 Years | 0 (0.0%) | 0 (0.0%) |
| 35 to 64 Years | 28 (22.6%) | 11 (9.4%) |
| 65 to 74 Years | 0 (0.0%) | 9 (4.6%) |
| 75 Years and over | 30 (17.1%) | 96 (85.0%) |
Disability Class by Sex by Age in Spring Ridge
Disability Class: Hearing Difficulty
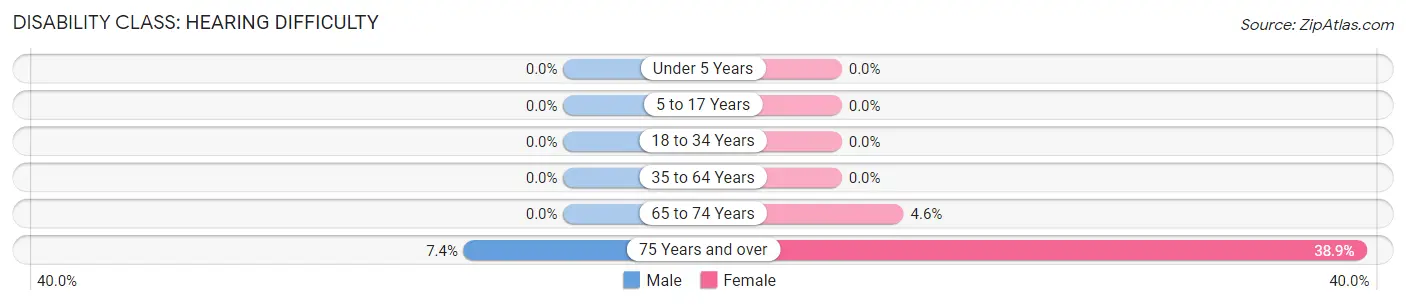
| Age Bracket | Male | Female |
| Under 5 Years | 0 (0.0%) | 0 (0.0%) |
| 5 to 17 Years | 0 (0.0%) | 0 (0.0%) |
| 18 to 34 Years | 0 (0.0%) | 0 (0.0%) |
| 35 to 64 Years | 0 (0.0%) | 0 (0.0%) |
| 65 to 74 Years | 0 (0.0%) | 9 (4.6%) |
| 75 Years and over | 13 (7.4%) | 44 (38.9%) |
Disability Class: Vision Difficulty
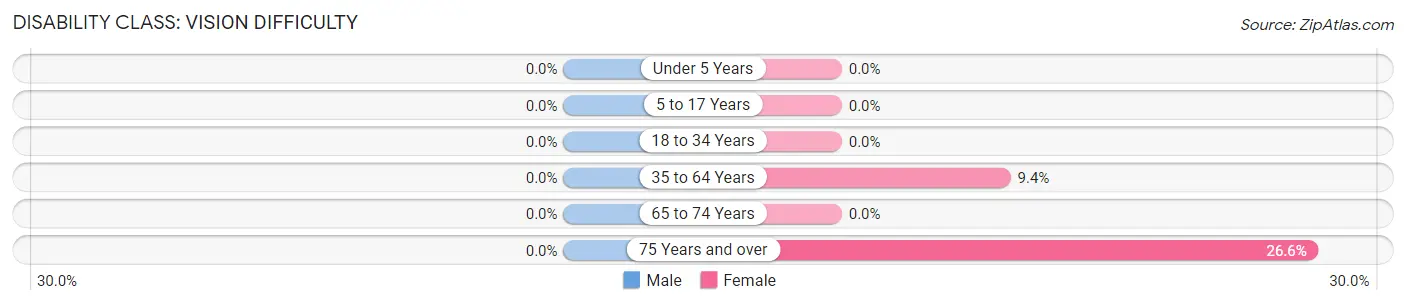
| Age Bracket | Male | Female |
| Under 5 Years | 0 (0.0%) | 0 (0.0%) |
| 5 to 17 Years | 0 (0.0%) | 0 (0.0%) |
| 18 to 34 Years | 0 (0.0%) | 0 (0.0%) |
| 35 to 64 Years | 0 (0.0%) | 11 (9.4%) |
| 65 to 74 Years | 0 (0.0%) | 0 (0.0%) |
| 75 Years and over | 0 (0.0%) | 30 (26.6%) |
Disability Class: Cognitive Difficulty
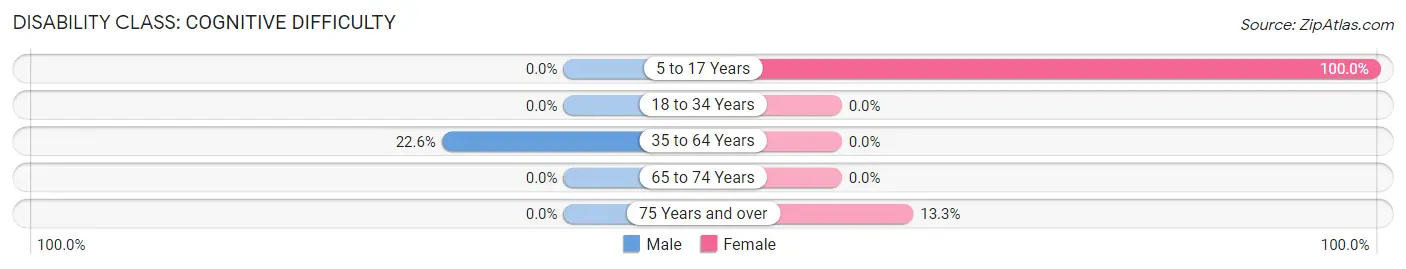
| Age Bracket | Male | Female |
| 5 to 17 Years | 0 (0.0%) | 15 (100.0%) |
| 18 to 34 Years | 0 (0.0%) | 0 (0.0%) |
| 35 to 64 Years | 28 (22.6%) | 0 (0.0%) |
| 65 to 74 Years | 0 (0.0%) | 0 (0.0%) |
| 75 Years and over | 0 (0.0%) | 15 (13.3%) |
Disability Class: Ambulatory Difficulty
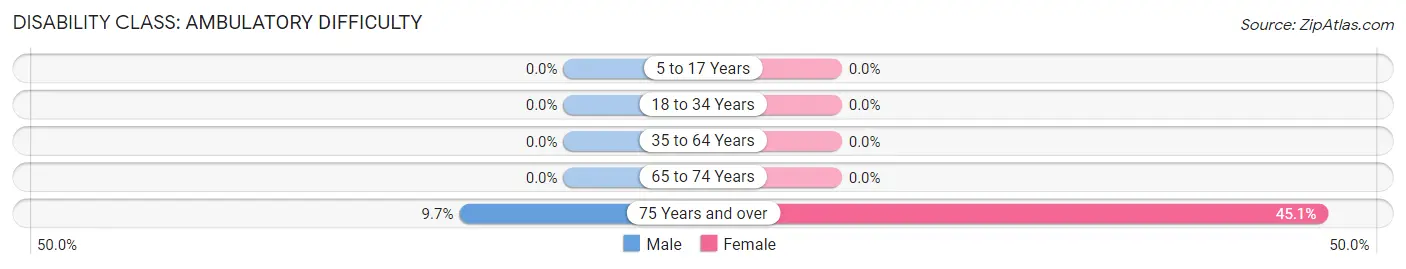
| Age Bracket | Male | Female |
| 5 to 17 Years | 0 (0.0%) | 0 (0.0%) |
| 18 to 34 Years | 0 (0.0%) | 0 (0.0%) |
| 35 to 64 Years | 0 (0.0%) | 0 (0.0%) |
| 65 to 74 Years | 0 (0.0%) | 0 (0.0%) |
| 75 Years and over | 17 (9.7%) | 51 (45.1%) |
Disability Class: Self-Care Difficulty
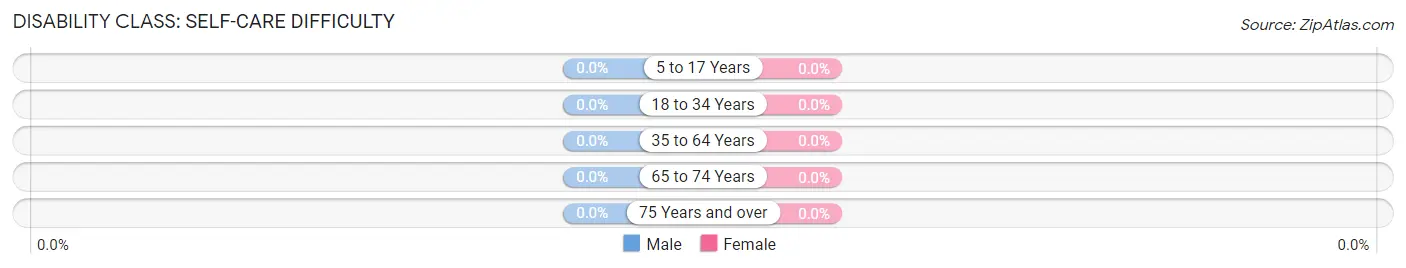
| Age Bracket | Male | Female |
| 5 to 17 Years | 0 (0.0%) | 0 (0.0%) |
| 18 to 34 Years | 0 (0.0%) | 0 (0.0%) |
| 35 to 64 Years | 0 (0.0%) | 0 (0.0%) |
| 65 to 74 Years | 0 (0.0%) | 0 (0.0%) |
| 75 Years and over | 0 (0.0%) | 0 (0.0%) |
Technology Access in Spring Ridge
Computing Device Access in Spring Ridge
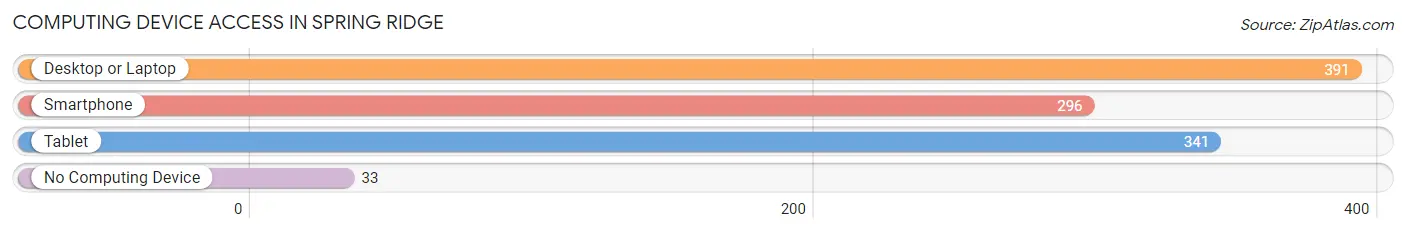
| Device Type | # Households | % Households |
| Desktop or Laptop | 391 | 78.7% |
| Smartphone | 296 | 59.6% |
| Tablet | 341 | 68.6% |
| No Computing Device | 33 | 6.6% |
| Total | 497 | 100.0% |
Internet Access in Spring Ridge
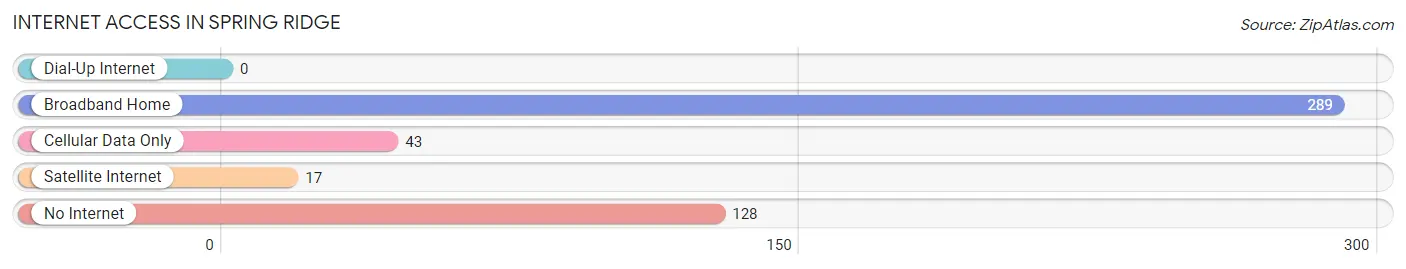
| Internet Type | # Households | % Households |
| Dial-Up Internet | 0 | 0.0% |
| Broadband Home | 289 | 58.2% |
| Cellular Data Only | 43 | 8.6% |
| Satellite Internet | 17 | 3.4% |
| No Internet | 128 | 25.8% |
| Total | 497 | 100.0% |
Spring Ridge Summary
Ridge Spring is a small borough located in Montgomery County, Pennsylvania. It is situated in the southeastern corner of the county, just north of the city of Philadelphia. The borough is bordered by the townships of Upper Merion, Lower Merion, and Upper Providence. The population of Ridge Spring was 2,845 at the 2010 census.
History
Ridge Spring was first settled in the late 1700s by a group of German immigrants. The area was originally known as “Ridge Valley” and was part of the larger township of Upper Merion. In 1854, the area was officially incorporated as the borough of Ridge Spring. The name was derived from the nearby ridge that runs through the area.
The borough was primarily an agricultural community until the late 19th century. In the late 1800s, the area began to experience a period of industrialization. Several factories were built in the area, including a paper mill, a brickyard, and a tannery. The factories provided employment for many of the residents of Ridge Spring.
Geography
Ridge Spring is located at 40°7′17″N 75°17′45″W (40.1214, -75.2958). According to the United States Census Bureau, the borough has a total area of 0.7 square miles (1.8 km2), all of it land.
The borough is located in the southeastern corner of Montgomery County, just north of the city of Philadelphia. It is bordered by the townships of Upper Merion, Lower Merion, and Upper Providence.
Economy
Ridge Spring is a primarily residential community. The borough does not have any major industries or businesses. The majority of the borough’s residents are employed in the nearby cities of Philadelphia and Norristown.
Demographics
As of the 2010 census, there were 2,845 people, 1,093 households, and 790 families residing in the borough. The population density was 4,093.3 people per square mile (1,579.2/km2). There were 1,164 housing units at an average density of 1,664.3 per square mile (642.2/km2). The racial makeup of the borough was 87.2% White, 5.7% African American, 0.2% Native American, 3.2% Asian, 0.1% Pacific Islander, 1.3% from other races, and 2.4% from two or more races. Hispanic or Latino of any race were 4.2% of the population.
There were 1,093 households, out of which 28.2% had children under the age of 18 living with them, 54.2% were married couples living together, 11.2% had a female householder with no husband present, and 30.2% were non-families. 25.2% of all households were made up of individuals, and 11.2% had someone living alone who was 65 years of age or older. The average household size was 2.60 and the average family size was 3.14.
In the borough, the population was spread out, with 22.2% under the age of 18, 6.7% from 18 to 24, 28.2% from 25 to 44, 25.2% from 45 to 64, and 17.7% who were 65 years of age or older. The median age was 40 years. For every 100 females, there were 92.2 males. For every 100 females age 18 and over, there were 88.7 males.
The median income for a household in the borough was $60,938, and the median income for a family was $71,250. Males had a median income of $50,000 versus $37,500 for females. The per capita income for the borough was $27,945. About 3.2% of families and 4.2% of the population were below the poverty line, including 5.2% of those under age 18 and 4.2% of those age 65 or over.
Common Questions
What is Per Capita Income in Spring Ridge?
Per Capita income in Spring Ridge is $49,362.
What is the Median Household income in Spring Ridge?
Median Household Income in Spring Ridge is $49,047.
What is Inequality or Gini Index in Spring Ridge?
Inequality or Gini Index in Spring Ridge is 0.51.
What is the Total Population of Spring Ridge?
Total Population of Spring Ridge is 898.
What is the Total Male Population of Spring Ridge?
Total Male Population of Spring Ridge is 437.
What is the Total Female Population of Spring Ridge?
Total Female Population of Spring Ridge is 461.
What is the Ratio of Males per 100 Females in Spring Ridge?
There are 94.79 Males per 100 Females in Spring Ridge.
What is the Ratio of Females per 100 Males in Spring Ridge?
There are 105.49 Females per 100 Males in Spring Ridge.
What is the Median Population Age in Spring Ridge?
Median Population Age in Spring Ridge is 69.9 Years.
What is the Average Family Size in Spring Ridge
Average Family Size in Spring Ridge is 2.2 People.
What is the Average Household Size in Spring Ridge
Average Household Size in Spring Ridge is 1.8 People.
How Large is the Labor Force in Spring Ridge?
There are 331 People in the Labor Forcein in Spring Ridge.
What is the Percentage of People in the Labor Force in Spring Ridge?
39.3% of People are in the Labor Force in Spring Ridge.
What is the Unemployment Rate in Spring Ridge?
Unemployment Rate in Spring Ridge is 4.2%.