Curtisville, PA Map & Demographics
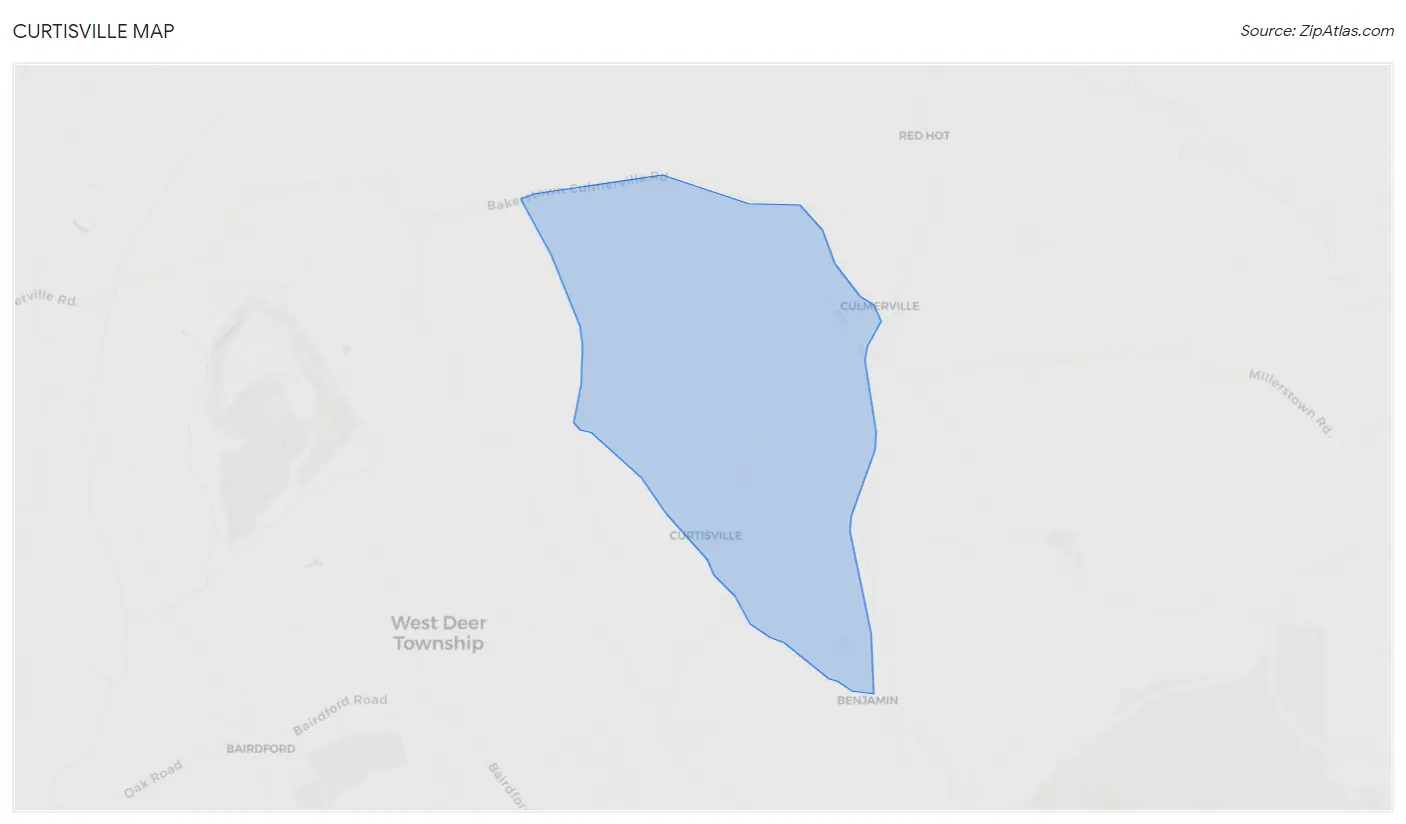
Curtisville Map
Curtisville Overview
$38,109
PER CAPITA INCOME
$98,421
AVG FAMILY INCOME
$59,022
AVG HOUSEHOLD INCOME
8.8%
WAGE / INCOME GAP [ % ]
91.2¢/ $1
WAGE / INCOME GAP [ $ ]
0.31
INEQUALITY / GINI INDEX
877
TOTAL POPULATION
434
MALE POPULATION
443
FEMALE POPULATION
97.97
MALES / 100 FEMALES
102.07
FEMALES / 100 MALES
45.1
MEDIAN AGE
2.6
AVG FAMILY SIZE
1.9
AVG HOUSEHOLD SIZE
641
LABOR FORCE [ PEOPLE ]
84.8%
PERCENT IN LABOR FORCE
Curtisville Area Codes
Income in Curtisville
Income Overview in Curtisville
Per Capita Income in Curtisville is $38,109, while median incomes of families and households are $98,421 and $59,022 respectively.
| Characteristic | Number | Measure |
| Per Capita Income | 877 | $38,109 |
| Median Family Income | 242 | $98,421 |
| Mean Family Income | 242 | $93,269 |
| Median Household Income | 464 | $59,022 |
| Mean Household Income | 464 | $72,033 |
| Income Deficit | 242 | $0 |
| Wage / Income Gap (%) | 877 | 8.84% |
| Wage / Income Gap ($) | 877 | 91.16¢ per $1 |
| Gini / Inequality Index | 877 | 0.31 |
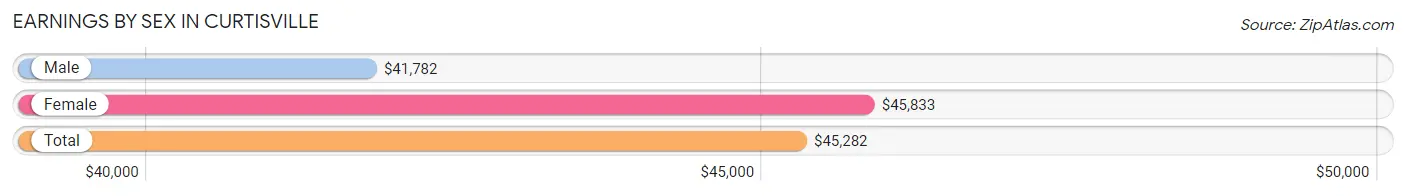
Earnings by Sex in Curtisville
Average Earnings in Curtisville are $45,282, $41,782 for men and $45,833 for women, a difference of 8.8%.
| Sex | Number | Average Earnings |
| Male | 325 (49.0%) | $41,782 |
| Female | 338 (51.0%) | $45,833 |
| Total | 663 (100.0%) | $45,282 |
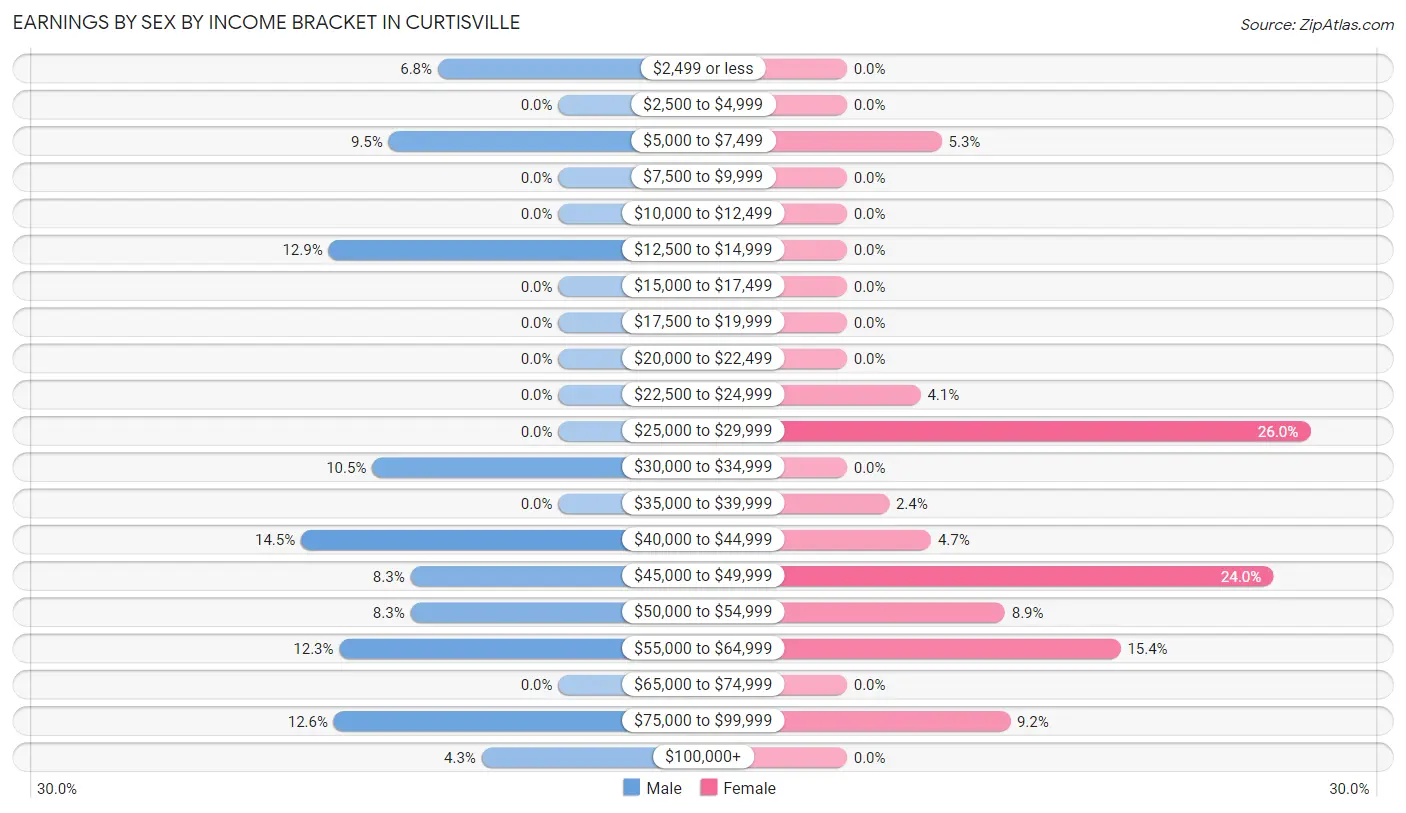
Earnings by Sex by Income Bracket in Curtisville
The most common earnings brackets in Curtisville are $40,000 to $44,999 for men (47 | 14.5%) and $25,000 to $29,999 for women (88 | 26.0%).
| Income | Male | Female |
| $2,499 or less | 22 (6.8%) | 0 (0.0%) |
| $2,500 to $4,999 | 0 (0.0%) | 0 (0.0%) |
| $5,000 to $7,499 | 31 (9.5%) | 18 (5.3%) |
| $7,500 to $9,999 | 0 (0.0%) | 0 (0.0%) |
| $10,000 to $12,499 | 0 (0.0%) | 0 (0.0%) |
| $12,500 to $14,999 | 42 (12.9%) | 0 (0.0%) |
| $15,000 to $17,499 | 0 (0.0%) | 0 (0.0%) |
| $17,500 to $19,999 | 0 (0.0%) | 0 (0.0%) |
| $20,000 to $22,499 | 0 (0.0%) | 0 (0.0%) |
| $22,500 to $24,999 | 0 (0.0%) | 14 (4.1%) |
| $25,000 to $29,999 | 0 (0.0%) | 88 (26.0%) |
| $30,000 to $34,999 | 34 (10.5%) | 0 (0.0%) |
| $35,000 to $39,999 | 0 (0.0%) | 8 (2.4%) |
| $40,000 to $44,999 | 47 (14.5%) | 16 (4.7%) |
| $45,000 to $49,999 | 27 (8.3%) | 81 (24.0%) |
| $50,000 to $54,999 | 27 (8.3%) | 30 (8.9%) |
| $55,000 to $64,999 | 40 (12.3%) | 52 (15.4%) |
| $65,000 to $74,999 | 0 (0.0%) | 0 (0.0%) |
| $75,000 to $99,999 | 41 (12.6%) | 31 (9.2%) |
| $100,000+ | 14 (4.3%) | 0 (0.0%) |
| Total | 325 (100.0%) | 338 (100.0%) |
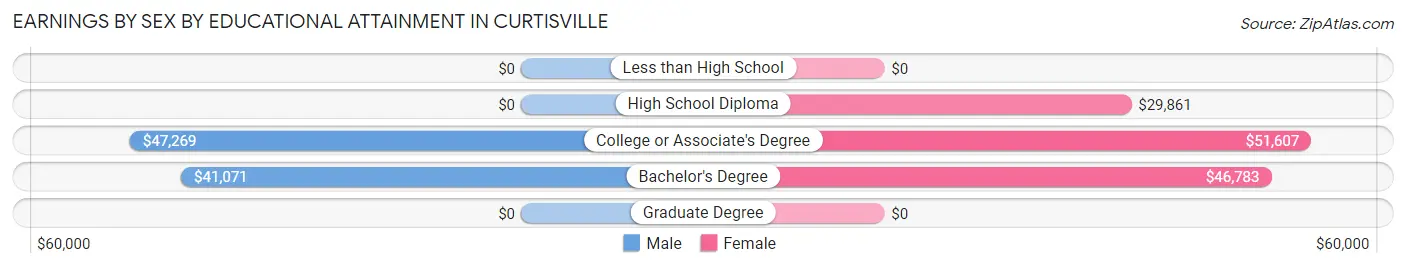
Earnings by Sex by Educational Attainment in Curtisville
Average earnings in Curtisville are $50,278 for men and $45,833 for women, a difference of 8.8%. Men with an educational attainment of college or associate's degree enjoy the highest average annual earnings of $47,269, while those with bachelor's degree education earn the least with $41,071. Women with an educational attainment of college or associate's degree earn the most with the average annual earnings of $51,607, while those with high school diploma education have the smallest earnings of $29,861.
| Educational Attainment | Male Income | Female Income |
| Less than High School | - | - |
| High School Diploma | - | - |
| College or Associate's Degree | $47,269 | $51,607 |
| Bachelor's Degree | $41,071 | $46,783 |
| Graduate Degree | - | - |
| Total | $50,278 | $45,833 |
Family Income in Curtisville
Family Income Brackets in Curtisville
According to the Curtisville family income data, there are 80 families falling into the $100,000 to $149,999 income range, which is the most common income bracket and makes up 33.1% of all families.
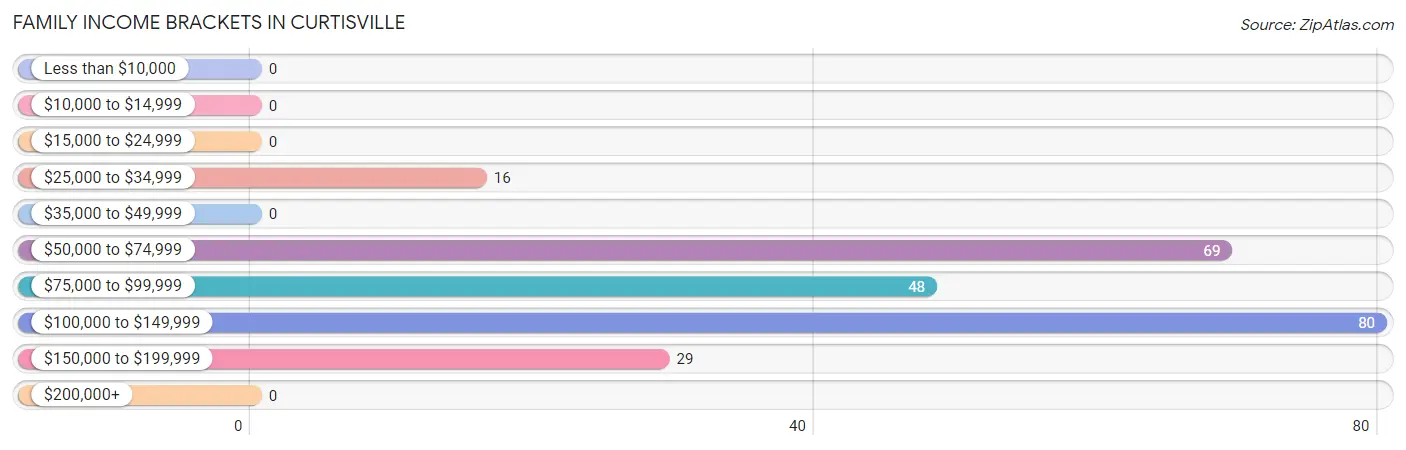
| Income Bracket | # Families | % Families |
| Less than $10,000 | 0 | 0.0% |
| $10,000 to $14,999 | 0 | 0.0% |
| $15,000 to $24,999 | 0 | 0.0% |
| $25,000 to $34,999 | 16 | 6.6% |
| $35,000 to $49,999 | 0 | 0.0% |
| $50,000 to $74,999 | 69 | 28.5% |
| $75,000 to $99,999 | 48 | 19.8% |
| $100,000 to $149,999 | 80 | 33.1% |
| $150,000 to $199,999 | 29 | 12.0% |
| $200,000+ | 0 | 0.0% |
Family Income by Famaliy Size in Curtisville
3-person families (51 | 21.1%) account for the highest median family income in Curtisville with $115,341 per family, while 3-person families (51 | 21.1%) have the highest median income of $38,447 per family member.
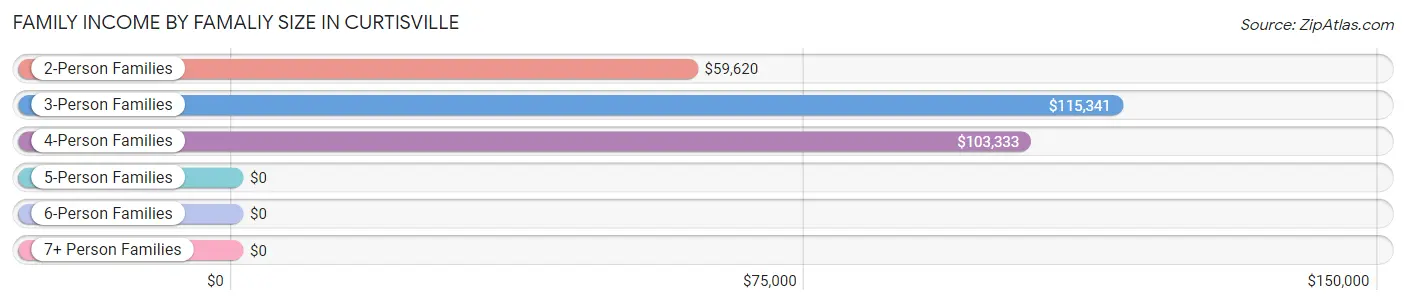
| Income Bracket | # Families | Median Income |
| 2-Person Families | 149 (61.6%) | $59,620 |
| 3-Person Families | 51 (21.1%) | $115,341 |
| 4-Person Families | 42 (17.4%) | $103,333 |
| 5-Person Families | 0 (0.0%) | $0 |
| 6-Person Families | 0 (0.0%) | $0 |
| 7+ Person Families | 0 (0.0%) | $0 |
| Total | 242 (100.0%) | $98,421 |
Family Income by Number of Earners in Curtisville
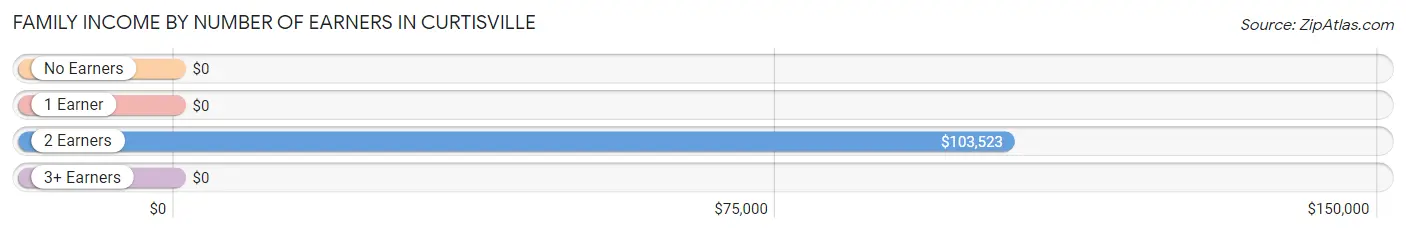
| Number of Earners | # Families | Median Income |
| No Earners | 14 (5.8%) | $0 |
| 1 Earner | 37 (15.3%) | $0 |
| 2 Earners | 172 (71.1%) | $103,523 |
| 3+ Earners | 19 (7.9%) | $0 |
| Total | 242 (100.0%) | $98,421 |
Household Income in Curtisville
Household Income Brackets in Curtisville
With 99 households falling in the category, the $50,000 to $74,999 income range is the most frequent in Curtisville, accounting for 21.3% of all households.
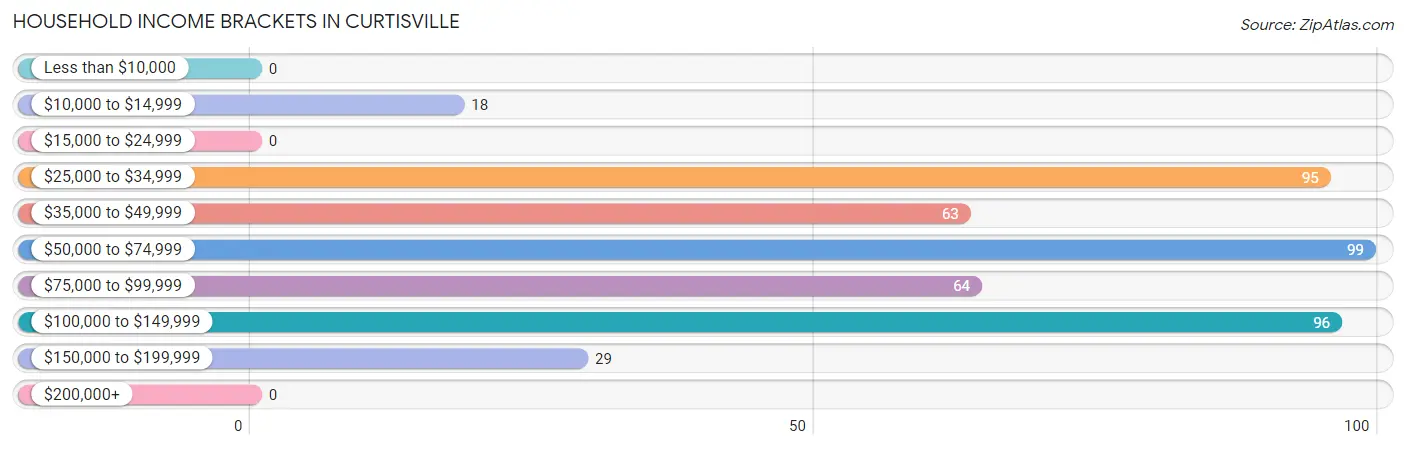
| Income Bracket | # Households | % Households |
| Less than $10,000 | 0 | 0.0% |
| $10,000 to $14,999 | 18 | 3.9% |
| $15,000 to $24,999 | 0 | 0.0% |
| $25,000 to $34,999 | 95 | 20.5% |
| $35,000 to $49,999 | 63 | 13.6% |
| $50,000 to $74,999 | 99 | 21.3% |
| $75,000 to $99,999 | 64 | 13.8% |
| $100,000 to $149,999 | 96 | 20.7% |
| $150,000 to $199,999 | 29 | 6.3% |
| $200,000+ | 0 | 0.0% |
Household Income by Householder Age in Curtisville
The median household income in Curtisville is $59,022, with the highest median household income of $115,455 found in the 25 to 44 years age bracket for the primary householder. A total of 110 households (23.7%) fall into this category. Meanwhile, the 15 to 24 years age bracket for the primary householder has the lowest median household income of $0, with 34 households (7.3%) in this group.
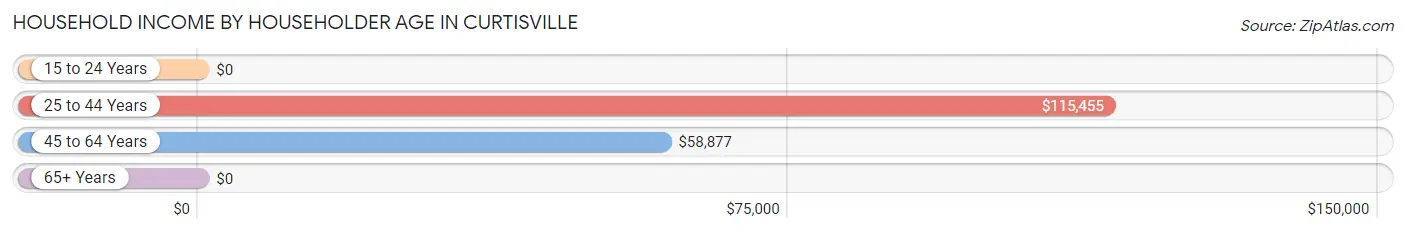
| Income Bracket | # Households | Median Income |
| 15 to 24 Years | 34 (7.3%) | $0 |
| 25 to 44 Years | 110 (23.7%) | $115,455 |
| 45 to 64 Years | 238 (51.3%) | $58,877 |
| 65+ Years | 82 (17.7%) | $0 |
| Total | 464 (100.0%) | $59,022 |
Poverty in Curtisville
Income Below Poverty by Sex and Age in Curtisville
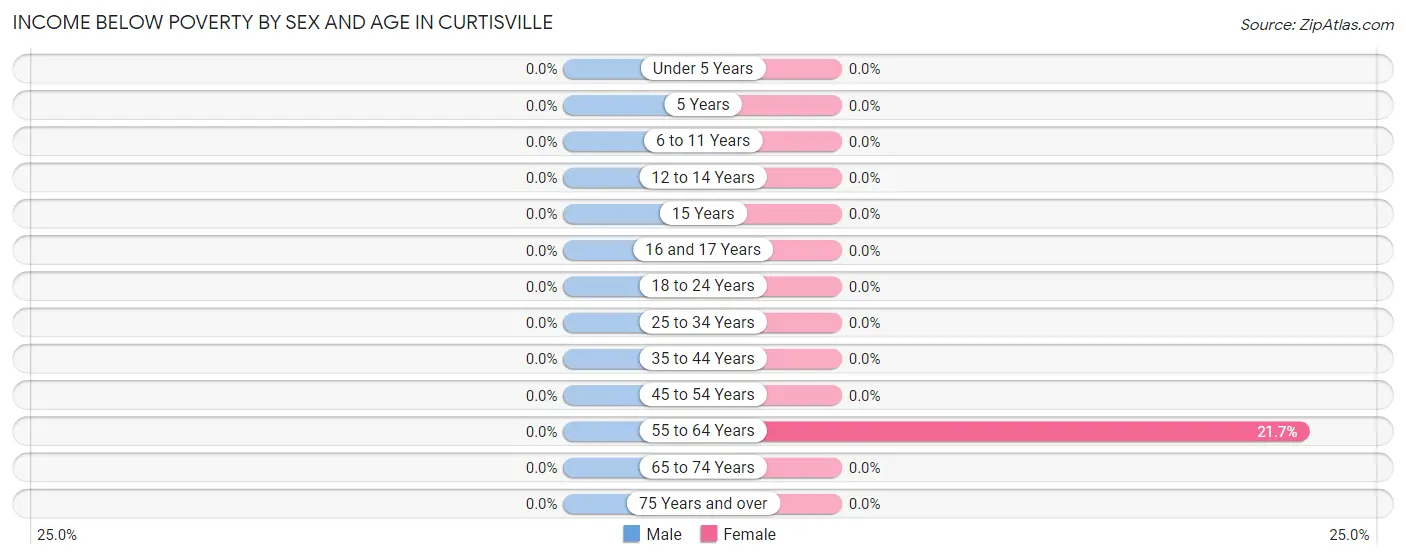
| Age Bracket | Male | Female |
| Under 5 Years | 0 (0.0%) | 0 (0.0%) |
| 5 Years | 0 (0.0%) | 0 (0.0%) |
| 6 to 11 Years | 0 (0.0%) | 0 (0.0%) |
| 12 to 14 Years | 0 (0.0%) | 0 (0.0%) |
| 15 Years | 0 (0.0%) | 0 (0.0%) |
| 16 and 17 Years | 0 (0.0%) | 0 (0.0%) |
| 18 to 24 Years | 0 (0.0%) | 0 (0.0%) |
| 25 to 34 Years | 0 (0.0%) | 0 (0.0%) |
| 35 to 44 Years | 0 (0.0%) | 0 (0.0%) |
| 45 to 54 Years | 0 (0.0%) | 0 (0.0%) |
| 55 to 64 Years | 0 (0.0%) | 18 (21.7%) |
| 65 to 74 Years | 0 (0.0%) | 0 (0.0%) |
| 75 Years and over | 0 (0.0%) | 0 (0.0%) |
| Total | 0 (0.0%) | 18 (4.1%) |
Income Above Poverty by Sex and Age in Curtisville
According to the poverty statistics in Curtisville, males aged under 5 years and females aged under 5 years are the age groups that are most secure financially, with 100.0% of males and 100.0% of females in these age groups living above the poverty line.
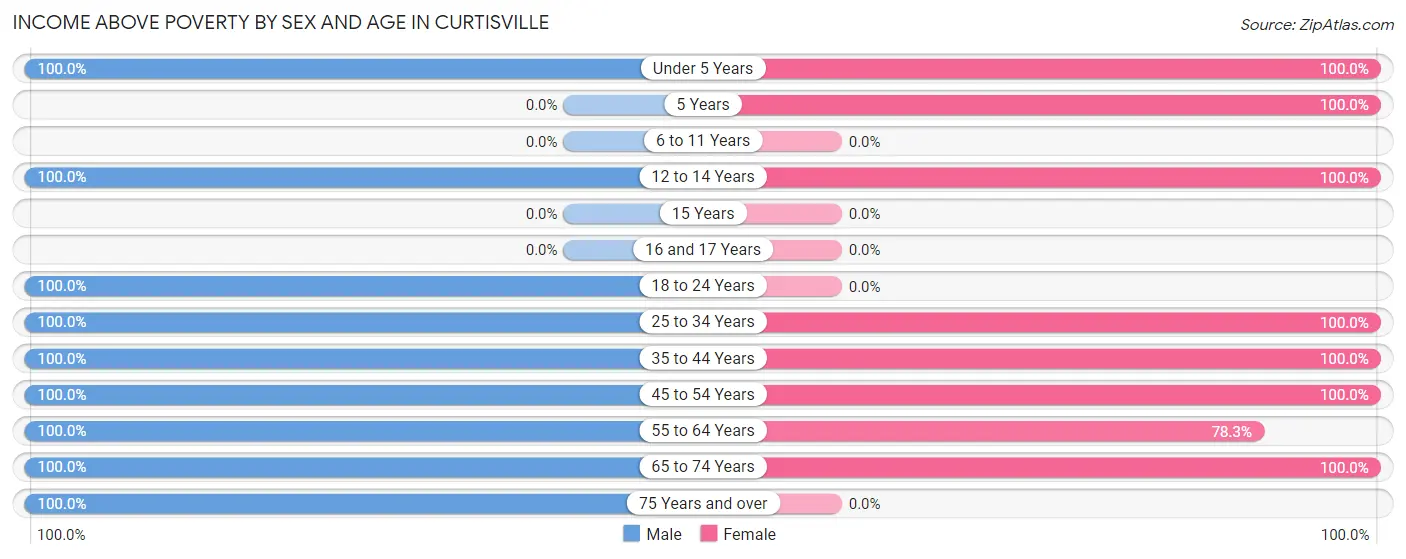
| Age Bracket | Male | Female |
| Under 5 Years | 47 (100.0%) | 24 (100.0%) |
| 5 Years | 0 (0.0%) | 14 (100.0%) |
| 6 to 11 Years | 0 (0.0%) | 0 (0.0%) |
| 12 to 14 Years | 17 (100.0%) | 19 (100.0%) |
| 15 Years | 0 (0.0%) | 0 (0.0%) |
| 16 and 17 Years | 0 (0.0%) | 0 (0.0%) |
| 18 to 24 Years | 97 (100.0%) | 0 (0.0%) |
| 25 to 34 Years | 76 (100.0%) | 80 (100.0%) |
| 35 to 44 Years | 14 (100.0%) | 46 (100.0%) |
| 45 to 54 Years | 133 (100.0%) | 98 (100.0%) |
| 55 to 64 Years | 15 (100.0%) | 65 (78.3%) |
| 65 to 74 Years | 14 (100.0%) | 79 (100.0%) |
| 75 Years and over | 21 (100.0%) | 0 (0.0%) |
| Total | 434 (100.0%) | 425 (95.9%) |
Income Below Poverty Among Married-Couple Families in Curtisville
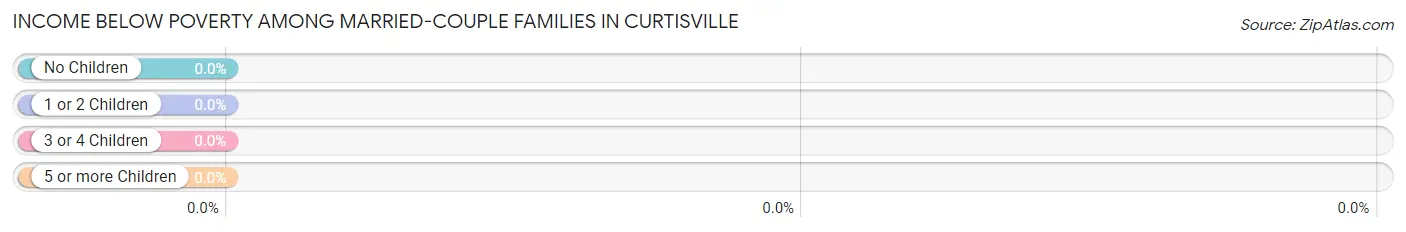
| Children | Above Poverty | Below Poverty |
| No Children | 106 (100.0%) | 0 (0.0%) |
| 1 or 2 Children | 85 (100.0%) | 0 (0.0%) |
| 3 or 4 Children | 0 (0.0%) | 0 (0.0%) |
| 5 or more Children | 0 (0.0%) | 0 (0.0%) |
| Total | 191 (100.0%) | 0 (0.0%) |
Income Below Poverty Among Single-Parent Households in Curtisville
| Children | Single Father | Single Mother |
| No Children | 0 (0.0%) | 0 (0.0%) |
| 1 or 2 Children | 0 (0.0%) | 0 (0.0%) |
| 3 or 4 Children | 0 (0.0%) | 0 (0.0%) |
| 5 or more Children | 0 (0.0%) | 0 (0.0%) |
| Total | 0 (0.0%) | 0 (0.0%) |
Income Below Poverty Among Married-Couple vs Single-Parent Households in Curtisville
| Children | Married-Couple Families | Single-Parent Households |
| No Children | 0 (0.0%) | 0 (0.0%) |
| 1 or 2 Children | 0 (0.0%) | 0 (0.0%) |
| 3 or 4 Children | 0 (0.0%) | 0 (0.0%) |
| 5 or more Children | 0 (0.0%) | 0 (0.0%) |
| Total | 0 (0.0%) | 0 (0.0%) |
Race in Curtisville
The most populous races in Curtisville are White / Caucasian (827 | 94.3%), Two or more Races (50 | 5.7%), and Hispanic or Latino (17 | 1.9%).
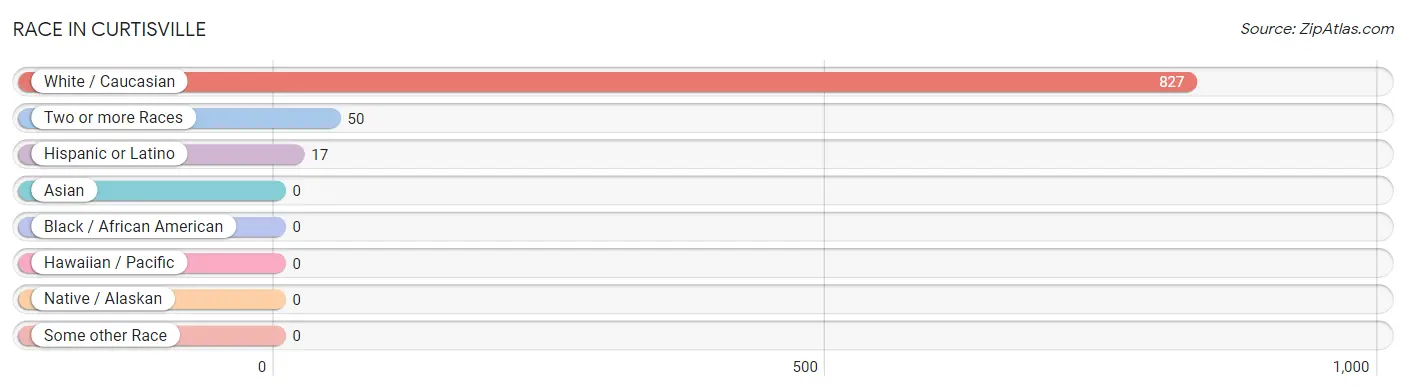
| Race | # Population | % Population |
| Asian | 0 | 0.0% |
| Black / African American | 0 | 0.0% |
| Hawaiian / Pacific | 0 | 0.0% |
| Hispanic or Latino | 17 | 1.9% |
| Native / Alaskan | 0 | 0.0% |
| White / Caucasian | 827 | 94.3% |
| Two or more Races | 50 | 5.7% |
| Some other Race | 0 | 0.0% |
| Total | 877 | 100.0% |
Ancestry in Curtisville
The most populous ancestries reported in Curtisville are German (219 | 25.0%), Italian (192 | 21.9%), Polish (192 | 21.9%), Irish (132 | 15.0%), and Hungarian (71 | 8.1%), together accounting for 91.9% of all Curtisville residents.
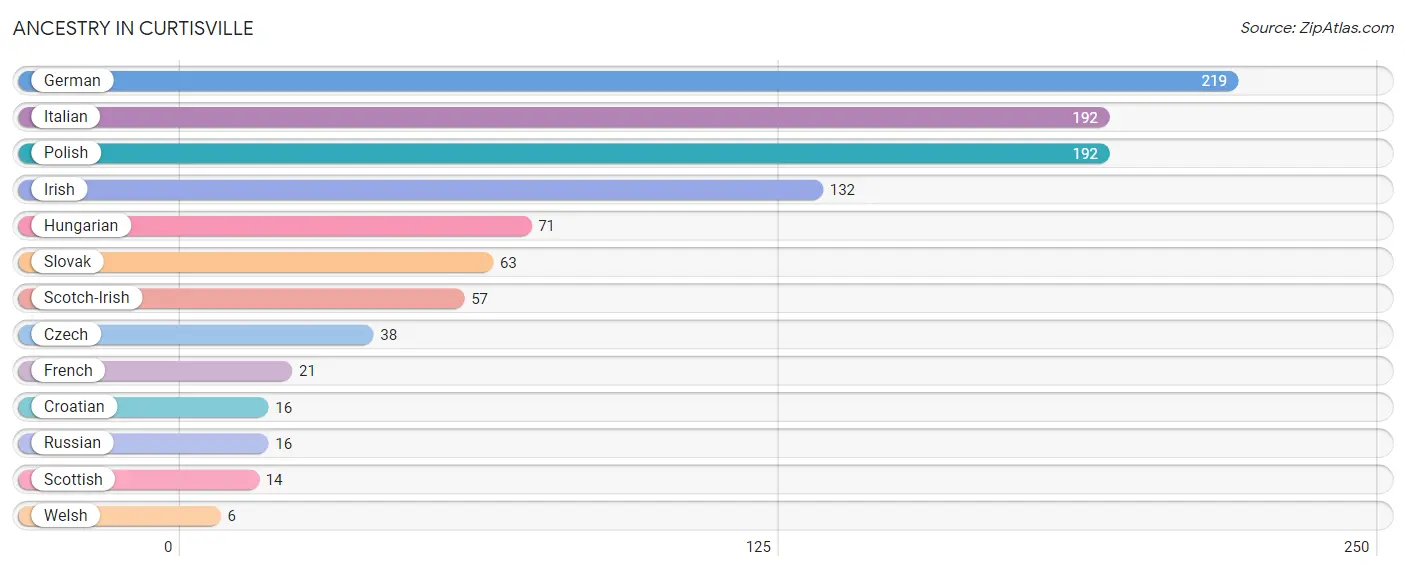
| Ancestry | # Population | % Population |
| Croatian | 16 | 1.8% |
| Czech | 38 | 4.3% |
| French | 21 | 2.4% |
| German | 219 | 25.0% |
| Hungarian | 71 | 8.1% |
| Irish | 132 | 15.0% |
| Italian | 192 | 21.9% |
| Polish | 192 | 21.9% |
| Russian | 16 | 1.8% |
| Scotch-Irish | 57 | 6.5% |
| Scottish | 14 | 1.6% |
| Slovak | 63 | 7.2% |
| Welsh | 6 | 0.7% | View All 13 Rows |
Immigrants in Curtisville

| Immigration Origin | # Population | % Population | View All 0 Rows |
Sex and Age in Curtisville
Sex and Age in Curtisville
The most populous age groups in Curtisville are 45 to 49 Years (86 | 19.8%) for men and 60 to 64 Years (83 | 18.7%) for women.
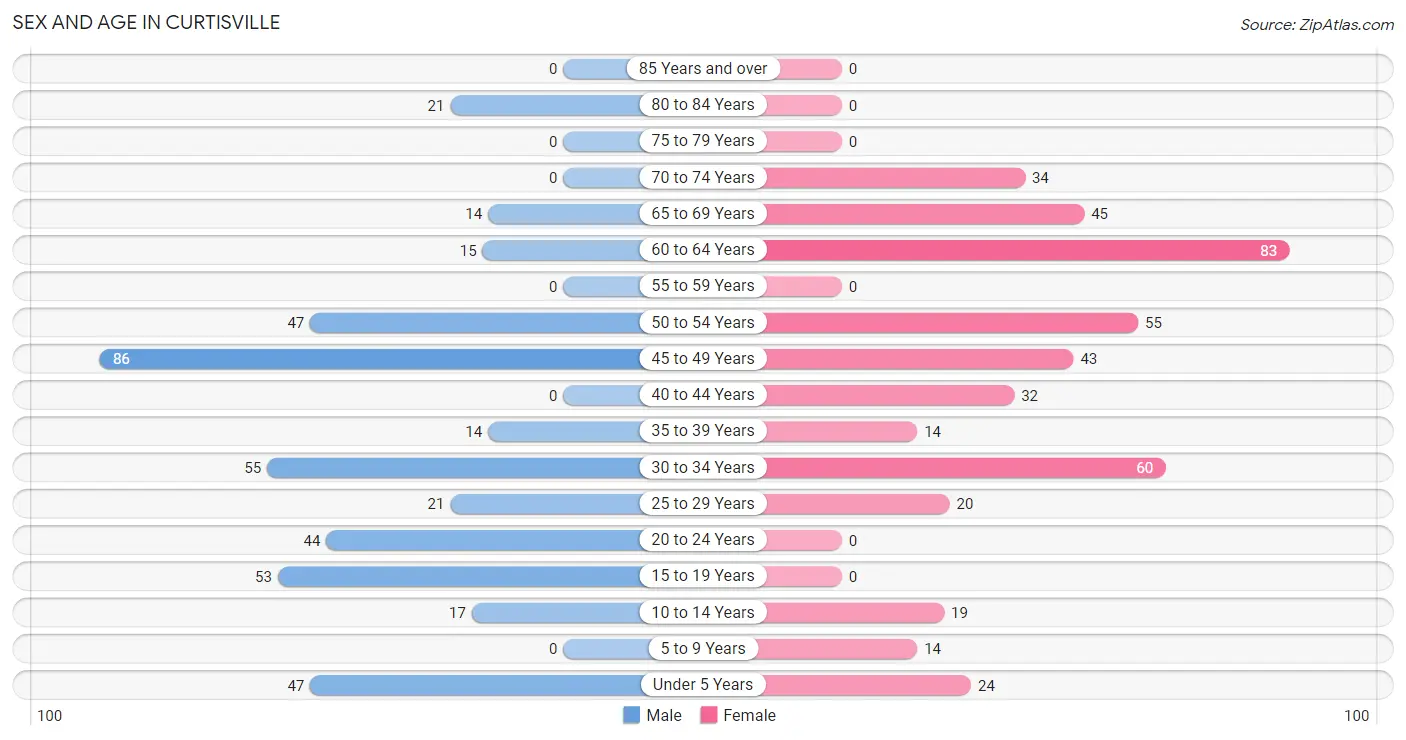
| Age Bracket | Male | Female |
| Under 5 Years | 47 (10.8%) | 24 (5.4%) |
| 5 to 9 Years | 0 (0.0%) | 14 (3.2%) |
| 10 to 14 Years | 17 (3.9%) | 19 (4.3%) |
| 15 to 19 Years | 53 (12.2%) | 0 (0.0%) |
| 20 to 24 Years | 44 (10.1%) | 0 (0.0%) |
| 25 to 29 Years | 21 (4.8%) | 20 (4.5%) |
| 30 to 34 Years | 55 (12.7%) | 60 (13.5%) |
| 35 to 39 Years | 14 (3.2%) | 14 (3.2%) |
| 40 to 44 Years | 0 (0.0%) | 32 (7.2%) |
| 45 to 49 Years | 86 (19.8%) | 43 (9.7%) |
| 50 to 54 Years | 47 (10.8%) | 55 (12.4%) |
| 55 to 59 Years | 0 (0.0%) | 0 (0.0%) |
| 60 to 64 Years | 15 (3.5%) | 83 (18.7%) |
| 65 to 69 Years | 14 (3.2%) | 45 (10.2%) |
| 70 to 74 Years | 0 (0.0%) | 34 (7.7%) |
| 75 to 79 Years | 0 (0.0%) | 0 (0.0%) |
| 80 to 84 Years | 21 (4.8%) | 0 (0.0%) |
| 85 Years and over | 0 (0.0%) | 0 (0.0%) |
| Total | 434 (100.0%) | 443 (100.0%) |
Families and Households in Curtisville
Median Family Size in Curtisville
The median family size in Curtisville is 2.57 persons per family, with married-couple families (191 | 78.9%) accounting for the largest median family size of 2.63 persons per family. On the other hand, single male/father families (27 | 11.2%) represent the smallest median family size with 2.15 persons per family.
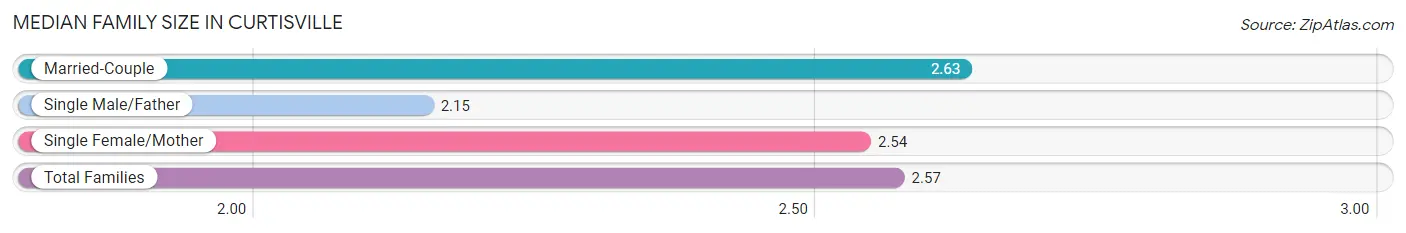
| Family Type | # Families | Family Size |
| Married-Couple | 191 (78.9%) | 2.63 |
| Single Male/Father | 27 (11.2%) | 2.15 |
| Single Female/Mother | 24 (9.9%) | 2.54 |
| Total Families | 242 (100.0%) | 2.57 |
Median Household Size in Curtisville
The median household size in Curtisville is 1.89 persons per household, with single female/mother households (24 | 5.2%) accounting for the largest median household size of 3.25 persons per household. non-family households (222 | 47.8%) represent the smallest median household size with 1.07 persons per household.
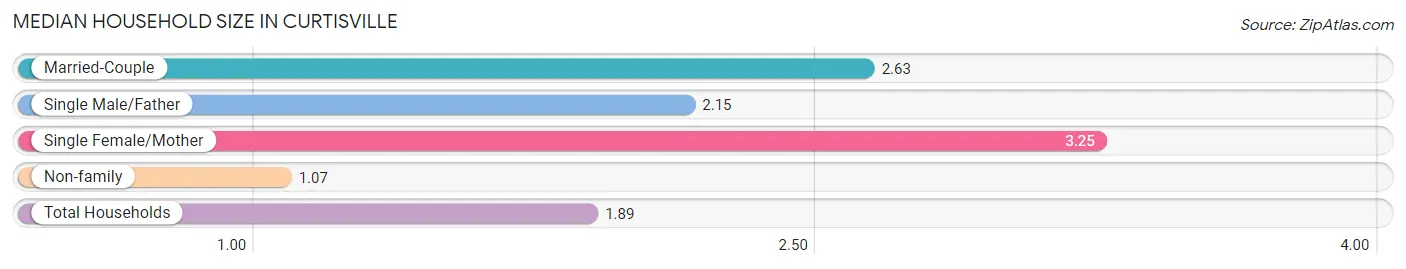
| Household Type | # Households | Household Size |
| Married-Couple | 191 (41.2%) | 2.63 |
| Single Male/Father | 27 (5.8%) | 2.15 |
| Single Female/Mother | 24 (5.2%) | 3.25 |
| Non-family | 222 (47.8%) | 1.07 |
| Total Households | 464 (100.0%) | 1.89 |
Household Size by Marriage Status in Curtisville
Out of a total of 464 households in Curtisville, 242 (52.2%) are family households, while 222 (47.8%) are nonfamily households. The most numerous type of family households are 2-person households, comprising 133, and the most common type of nonfamily households are 1-person households, comprising 206.
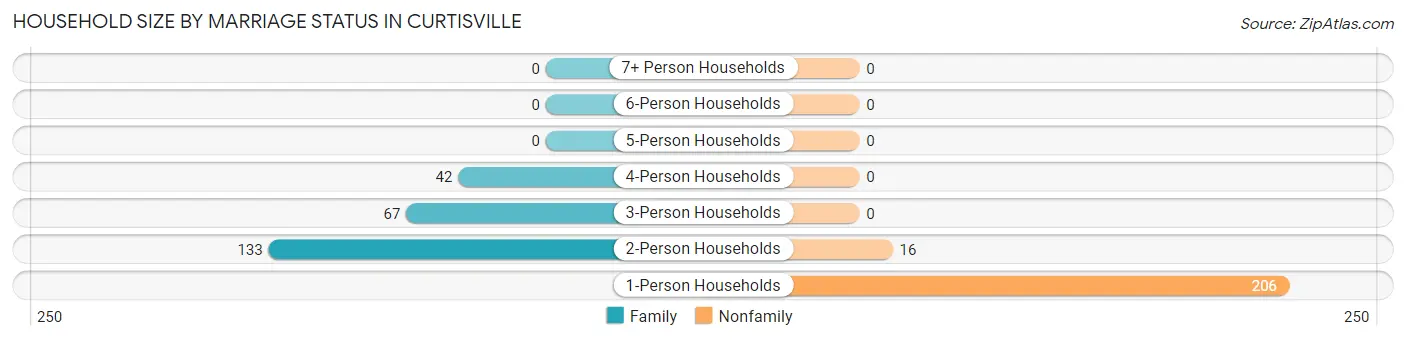
| Household Size | Family Households | Nonfamily Households |
| 1-Person Households | - | 206 (44.4%) |
| 2-Person Households | 133 (28.7%) | 16 (3.5%) |
| 3-Person Households | 67 (14.4%) | 0 (0.0%) |
| 4-Person Households | 42 (9.0%) | 0 (0.0%) |
| 5-Person Households | 0 (0.0%) | 0 (0.0%) |
| 6-Person Households | 0 (0.0%) | 0 (0.0%) |
| 7+ Person Households | 0 (0.0%) | 0 (0.0%) |
| Total | 242 (52.2%) | 222 (47.8%) |
Female Fertility in Curtisville
Fertility by Age in Curtisville
Average fertility rate in Curtisville is 29.0 births per 1,000 women. Women in the age bracket of 20 to 34 years have the highest fertility rate with 75.0 births per 1,000 women. Women in the age bracket of 20 to 34 years acount for 100.0% of all women with births.
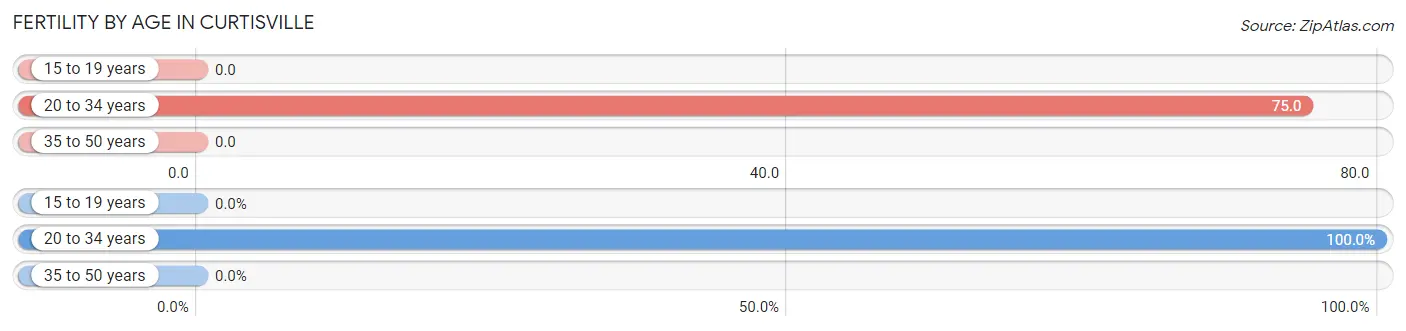
| Age Bracket | Women with Births | Births / 1,000 Women |
| 15 to 19 years | 0 (0.0%) | 0.0 |
| 20 to 34 years | 6 (100.0%) | 75.0 |
| 35 to 50 years | 0 (0.0%) | 0.0 |
| Total | 6 (100.0%) | 29.0 |
Fertility by Age by Marriage Status in Curtisville
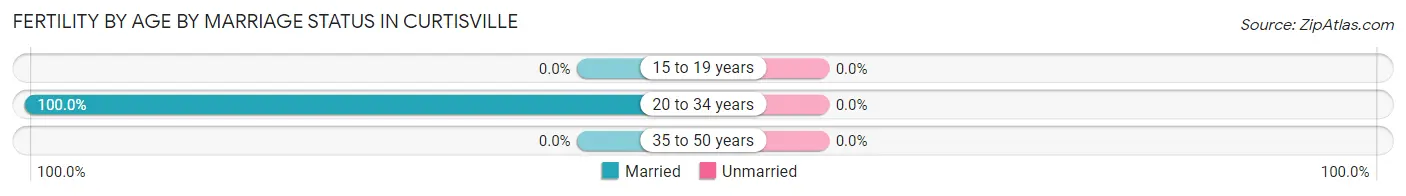
| Age Bracket | Married | Unmarried |
| 15 to 19 years | 0 (0.0%) | 0 (0.0%) |
| 20 to 34 years | 6 (100.0%) | 0 (0.0%) |
| 35 to 50 years | 0 (0.0%) | 0 (0.0%) |
| Total | 6 (100.0%) | 0 (0.0%) |
Fertility by Education in Curtisville
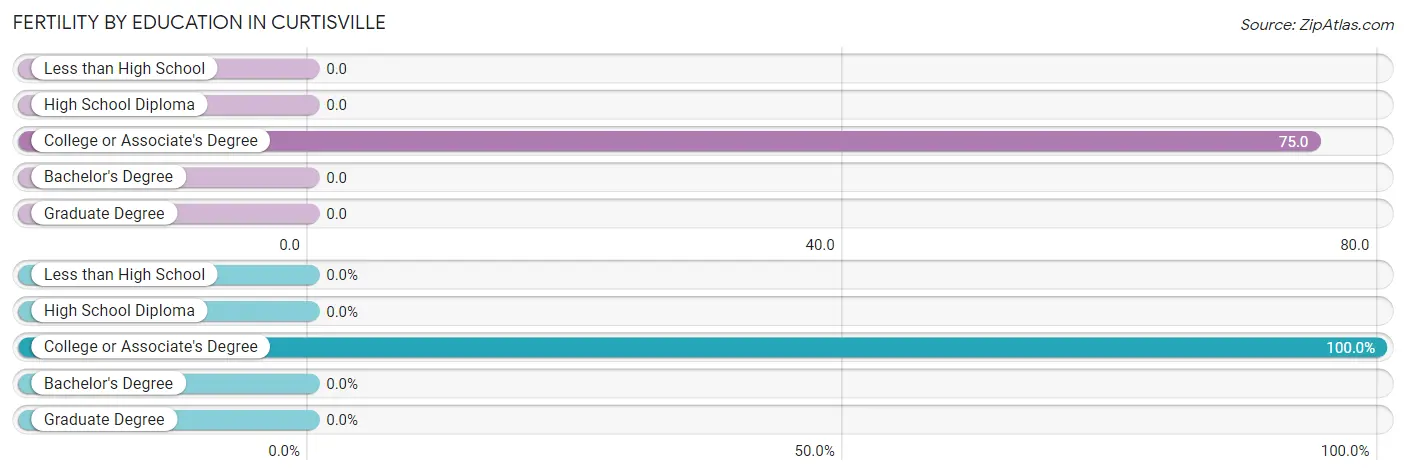
| Educational Attainment | Women with Births | Births / 1,000 Women |
| Less than High School | 0 (0.0%) | 0.0 |
| High School Diploma | 0 (0.0%) | 0.0 |
| College or Associate's Degree | 6 (100.0%) | 75.0 |
| Bachelor's Degree | 0 (0.0%) | 0.0 |
| Graduate Degree | 0 (0.0%) | 0.0 |
| Total | 6 (100.0%) | 29.0 |
Fertility by Education by Marriage Status in Curtisville
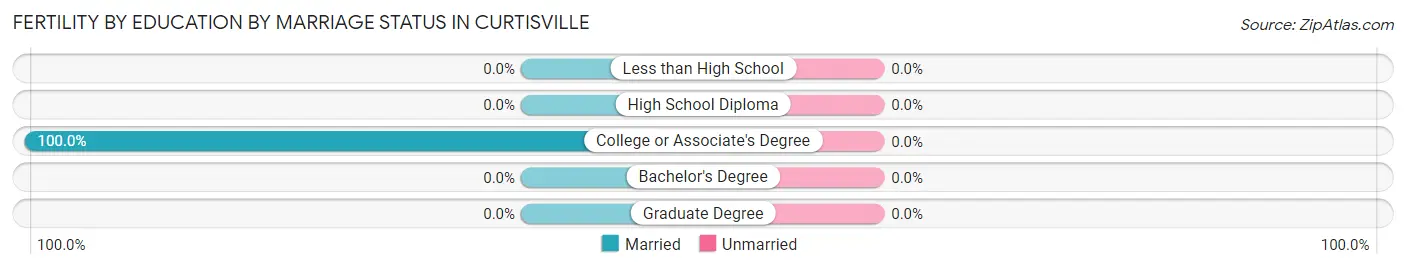
| Educational Attainment | Married | Unmarried |
| Less than High School | 0 (0.0%) | 0 (0.0%) |
| High School Diploma | 0 (0.0%) | 0 (0.0%) |
| College or Associate's Degree | 6 (100.0%) | 0 (0.0%) |
| Bachelor's Degree | 0 (0.0%) | 0 (0.0%) |
| Graduate Degree | 0 (0.0%) | 0 (0.0%) |
| Total | 6 (100.0%) | 0 (0.0%) |
Employment Characteristics in Curtisville
Employment by Class of Employer in Curtisville
Among the 641 employed individuals in Curtisville, private company employees (464 | 72.4%), not-for-profit organizations (67 | 10.4%), and self-employed (incorporated) (49 | 7.6%) make up the most common classes of employment.
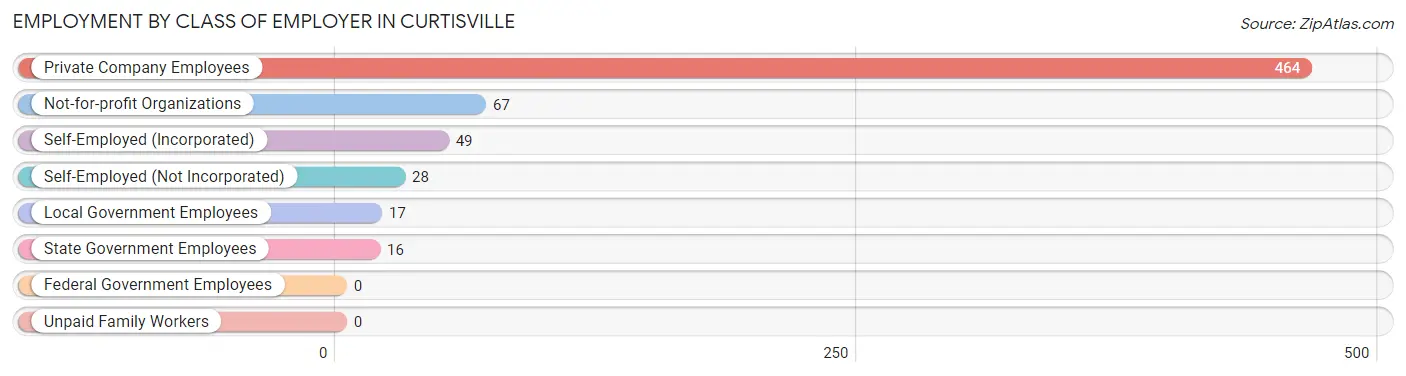
| Employer Class | # Employees | % Employees |
| Private Company Employees | 464 | 72.4% |
| Self-Employed (Incorporated) | 49 | 7.6% |
| Self-Employed (Not Incorporated) | 28 | 4.4% |
| Not-for-profit Organizations | 67 | 10.4% |
| Local Government Employees | 17 | 2.6% |
| State Government Employees | 16 | 2.5% |
| Federal Government Employees | 0 | 0.0% |
| Unpaid Family Workers | 0 | 0.0% |
| Total | 641 | 100.0% |
Employment Status by Age in Curtisville
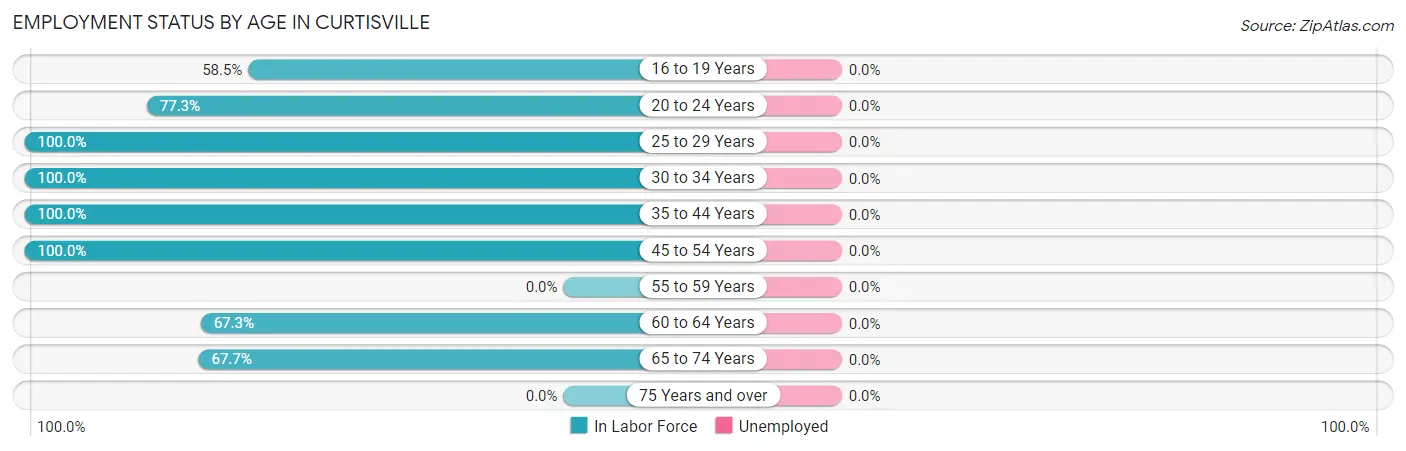
| Age Bracket | In Labor Force | Unemployed |
| 16 to 19 Years | 31 (58.5%) | 0 (0.0%) |
| 20 to 24 Years | 34 (77.3%) | 0 (0.0%) |
| 25 to 29 Years | 41 (100.0%) | 0 (0.0%) |
| 30 to 34 Years | 115 (100.0%) | 0 (0.0%) |
| 35 to 44 Years | 60 (100.0%) | 0 (0.0%) |
| 45 to 54 Years | 231 (100.0%) | 0 (0.0%) |
| 55 to 59 Years | 0 (0.0%) | 0 (0.0%) |
| 60 to 64 Years | 66 (67.3%) | 0 (0.0%) |
| 65 to 74 Years | 63 (67.7%) | 0 (0.0%) |
| 75 Years and over | 0 (0.0%) | 0 (0.0%) |
| Total | 641 (84.8%) | 0 (0.0%) |
Employment Status by Educational Attainment in Curtisville
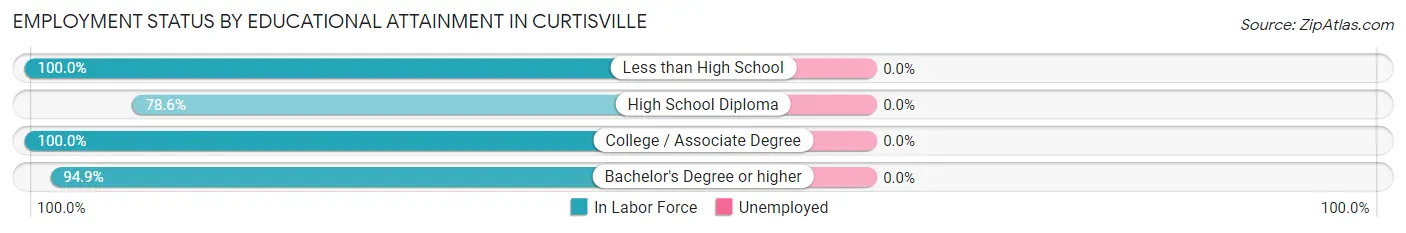
| Educational Attainment | In Labor Force | Unemployed |
| Less than High School | 17 (100.0%) | 0 (0.0%) |
| High School Diploma | 66 (78.6%) | 0 (0.0%) |
| College / Associate Degree | 167 (100.0%) | 0 (0.0%) |
| Bachelor's Degree or higher | 263 (94.9%) | 0 (0.0%) |
| Total | 513 (94.1%) | 0 (0.0%) |
Employment Occupations by Sex in Curtisville
Management, Business, Science and Arts Occupations
The most common Management, Business, Science and Arts occupations in Curtisville are Management (119 | 18.6%), Health Diagnosing & Treating (86 | 13.4%), Health Technologists (86 | 13.4%), Community & Social Service (26 | 4.1%), and Education Instruction & Library (26 | 4.1%).
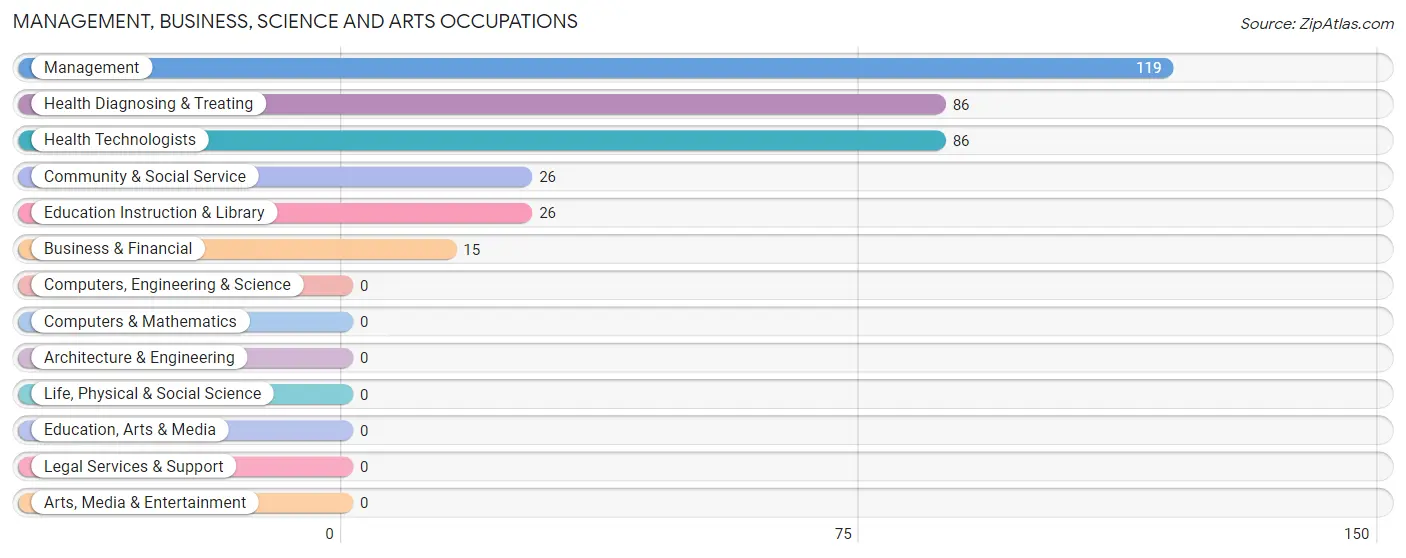
Management, Business, Science and Arts Occupations by Sex
Within the Management, Business, Science and Arts occupations in Curtisville, the most male-oriented occupations are Business & Financial (100.0%), and Management (70.6%), while the most female-oriented occupations are Community & Social Service (100.0%), Education Instruction & Library (100.0%), and Health Diagnosing & Treating (100.0%).
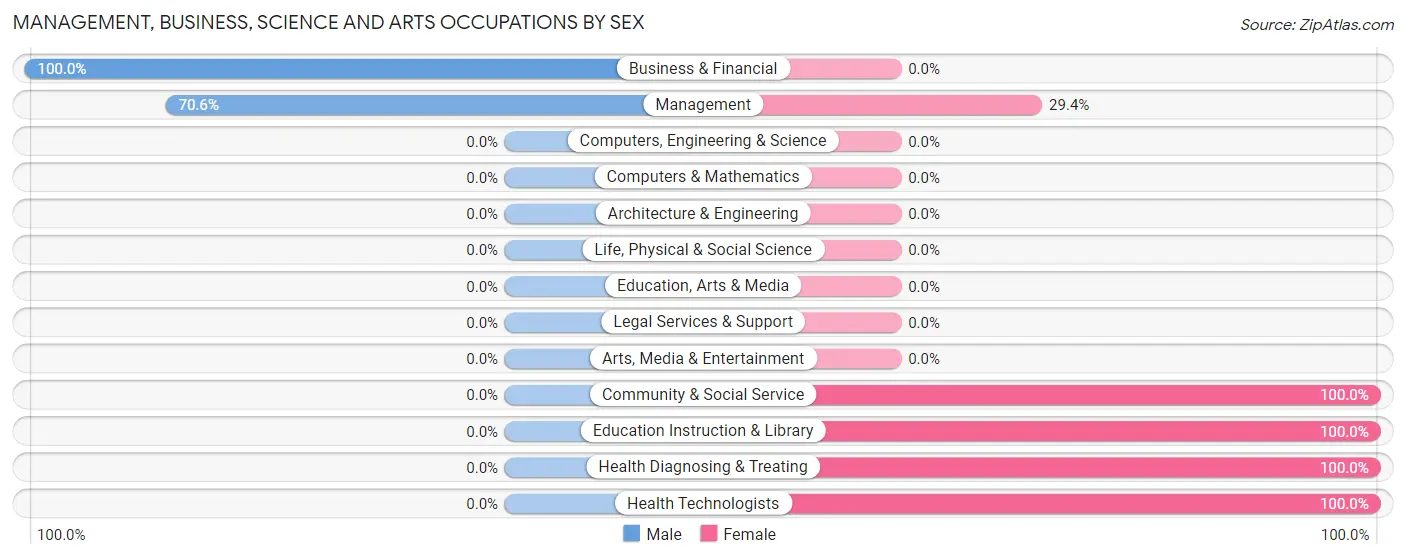
| Occupation | Male | Female |
| Management | 84 (70.6%) | 35 (29.4%) |
| Business & Financial | 15 (100.0%) | 0 (0.0%) |
| Computers, Engineering & Science | 0 (0.0%) | 0 (0.0%) |
| Computers & Mathematics | 0 (0.0%) | 0 (0.0%) |
| Architecture & Engineering | 0 (0.0%) | 0 (0.0%) |
| Life, Physical & Social Science | 0 (0.0%) | 0 (0.0%) |
| Community & Social Service | 0 (0.0%) | 26 (100.0%) |
| Education, Arts & Media | 0 (0.0%) | 0 (0.0%) |
| Legal Services & Support | 0 (0.0%) | 0 (0.0%) |
| Education Instruction & Library | 0 (0.0%) | 26 (100.0%) |
| Arts, Media & Entertainment | 0 (0.0%) | 0 (0.0%) |
| Health Diagnosing & Treating | 0 (0.0%) | 86 (100.0%) |
| Health Technologists | 0 (0.0%) | 86 (100.0%) |
| Total (Category) | 99 (40.2%) | 147 (59.8%) |
| Total (Overall) | 303 (47.3%) | 338 (52.7%) |
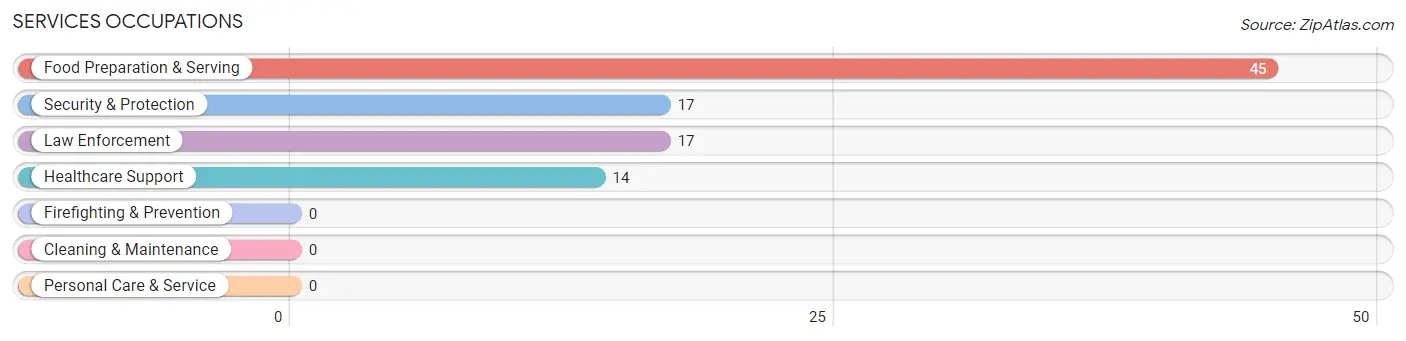
Services Occupations
The most common Services occupations in Curtisville are Food Preparation & Serving (45 | 7.0%), Security & Protection (17 | 2.6%), Law Enforcement (17 | 2.6%), and Healthcare Support (14 | 2.2%).
Services Occupations by Sex
Within the Services occupations in Curtisville, the most male-oriented occupations are Security & Protection (100.0%), and Law Enforcement (100.0%), while the most female-oriented occupations are Healthcare Support (100.0%), and Food Preparation & Serving (100.0%).
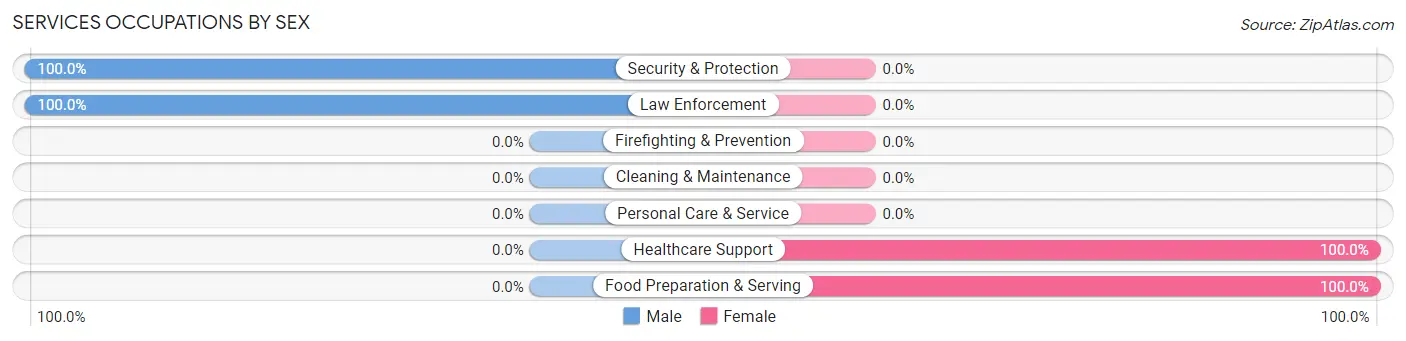
| Occupation | Male | Female |
| Healthcare Support | 0 (0.0%) | 14 (100.0%) |
| Security & Protection | 17 (100.0%) | 0 (0.0%) |
| Firefighting & Prevention | 0 (0.0%) | 0 (0.0%) |
| Law Enforcement | 17 (100.0%) | 0 (0.0%) |
| Food Preparation & Serving | 0 (0.0%) | 45 (100.0%) |
| Cleaning & Maintenance | 0 (0.0%) | 0 (0.0%) |
| Personal Care & Service | 0 (0.0%) | 0 (0.0%) |
| Total (Category) | 17 (22.4%) | 59 (77.6%) |
| Total (Overall) | 303 (47.3%) | 338 (52.7%) |
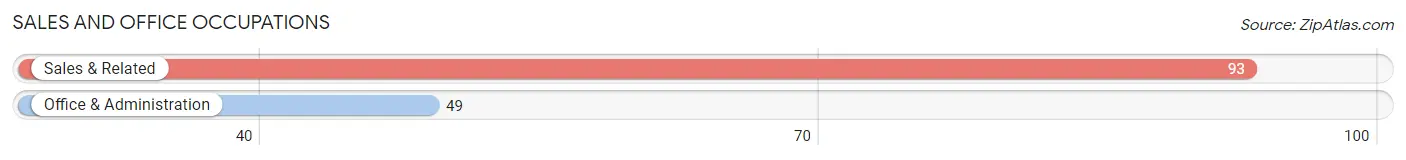
Sales and Office Occupations
The most common Sales and Office occupations in Curtisville are Sales & Related (93 | 14.5%), and Office & Administration (49 | 7.6%).
Sales and Office Occupations by Sex
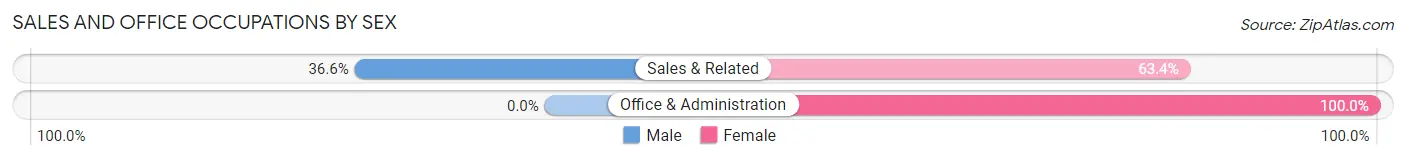
| Occupation | Male | Female |
| Sales & Related | 34 (36.6%) | 59 (63.4%) |
| Office & Administration | 0 (0.0%) | 49 (100.0%) |
| Total (Category) | 34 (23.9%) | 108 (76.1%) |
| Total (Overall) | 303 (47.3%) | 338 (52.7%) |
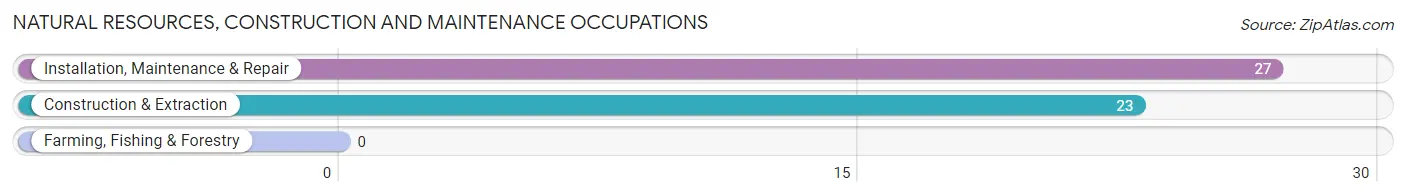
Natural Resources, Construction and Maintenance Occupations
The most common Natural Resources, Construction and Maintenance occupations in Curtisville are Installation, Maintenance & Repair (27 | 4.2%), and Construction & Extraction (23 | 3.6%).
Natural Resources, Construction and Maintenance Occupations by Sex
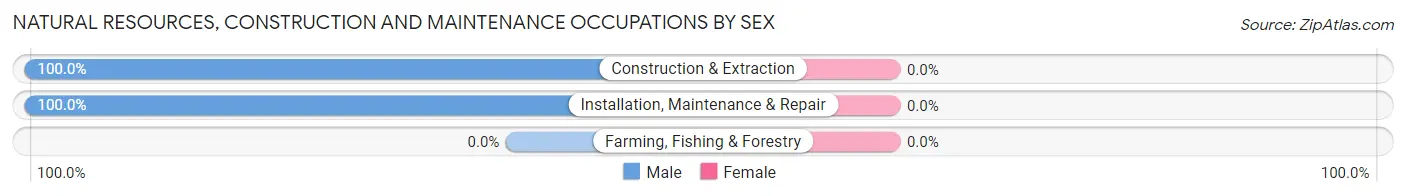
| Occupation | Male | Female |
| Farming, Fishing & Forestry | 0 (0.0%) | 0 (0.0%) |
| Construction & Extraction | 23 (100.0%) | 0 (0.0%) |
| Installation, Maintenance & Repair | 27 (100.0%) | 0 (0.0%) |
| Total (Category) | 50 (100.0%) | 0 (0.0%) |
| Total (Overall) | 303 (47.3%) | 338 (52.7%) |
Production, Transportation and Moving Occupations
The most common Production, Transportation and Moving occupations in Curtisville are Production (79 | 12.3%), and Material Moving (48 | 7.5%).
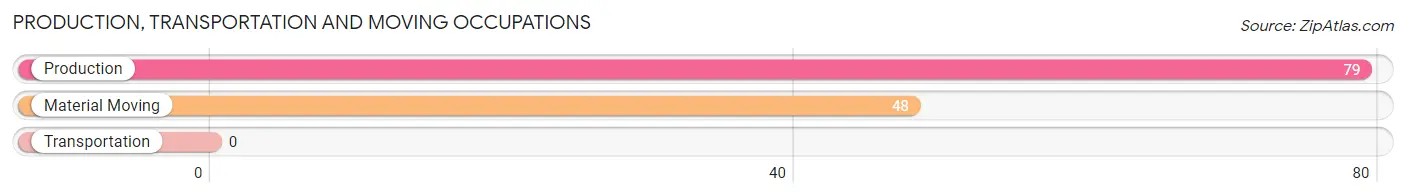
Production, Transportation and Moving Occupations by Sex
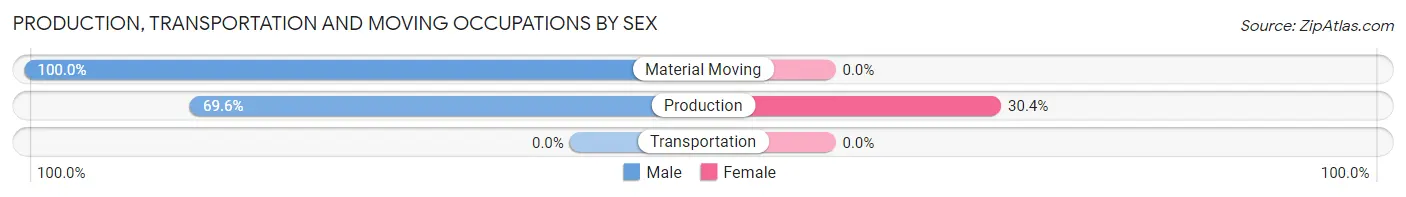
| Occupation | Male | Female |
| Production | 55 (69.6%) | 24 (30.4%) |
| Transportation | 0 (0.0%) | 0 (0.0%) |
| Material Moving | 48 (100.0%) | 0 (0.0%) |
| Total (Category) | 103 (81.1%) | 24 (18.9%) |
| Total (Overall) | 303 (47.3%) | 338 (52.7%) |
Employment Industries by Sex in Curtisville
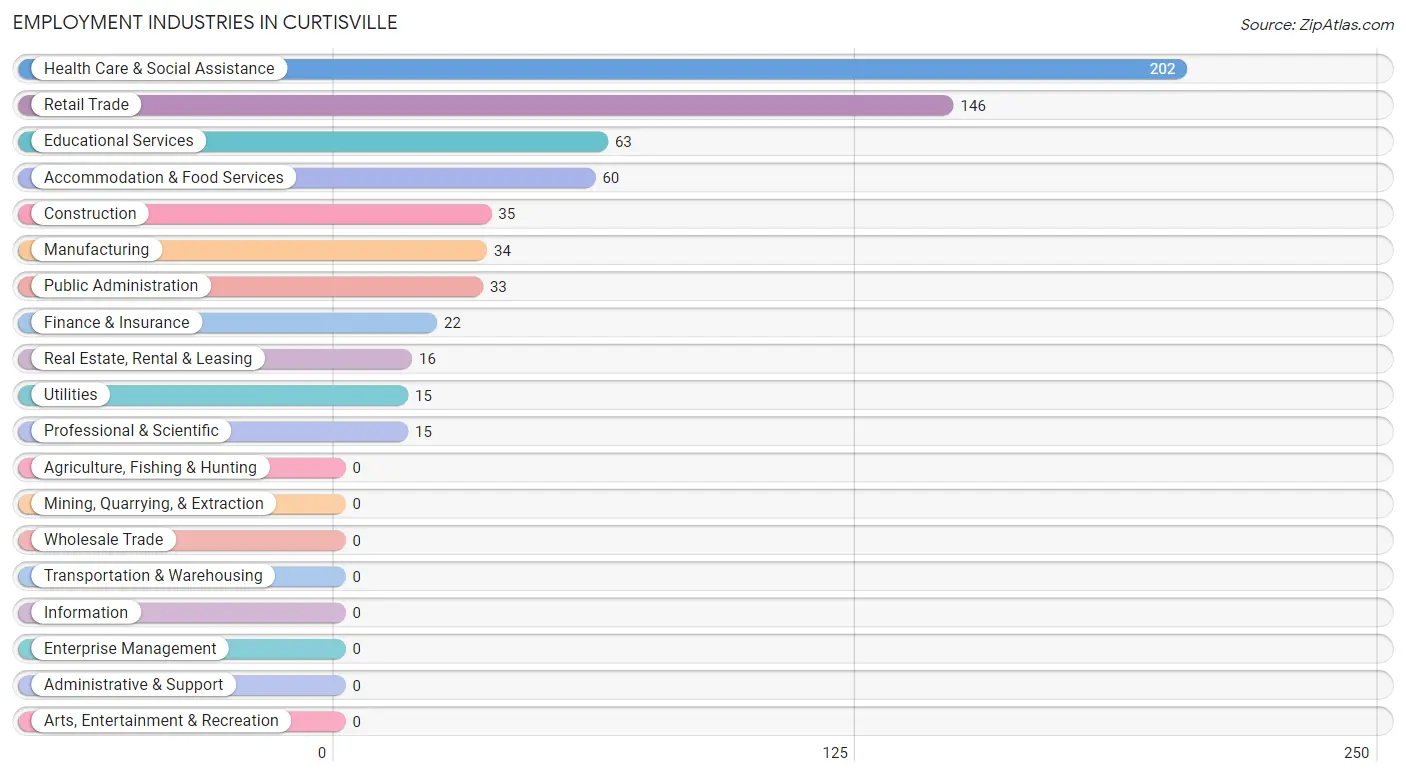
Employment Industries in Curtisville
The major employment industries in Curtisville include Health Care & Social Assistance (202 | 31.5%), Retail Trade (146 | 22.8%), Educational Services (63 | 9.8%), Accommodation & Food Services (60 | 9.4%), and Construction (35 | 5.5%).
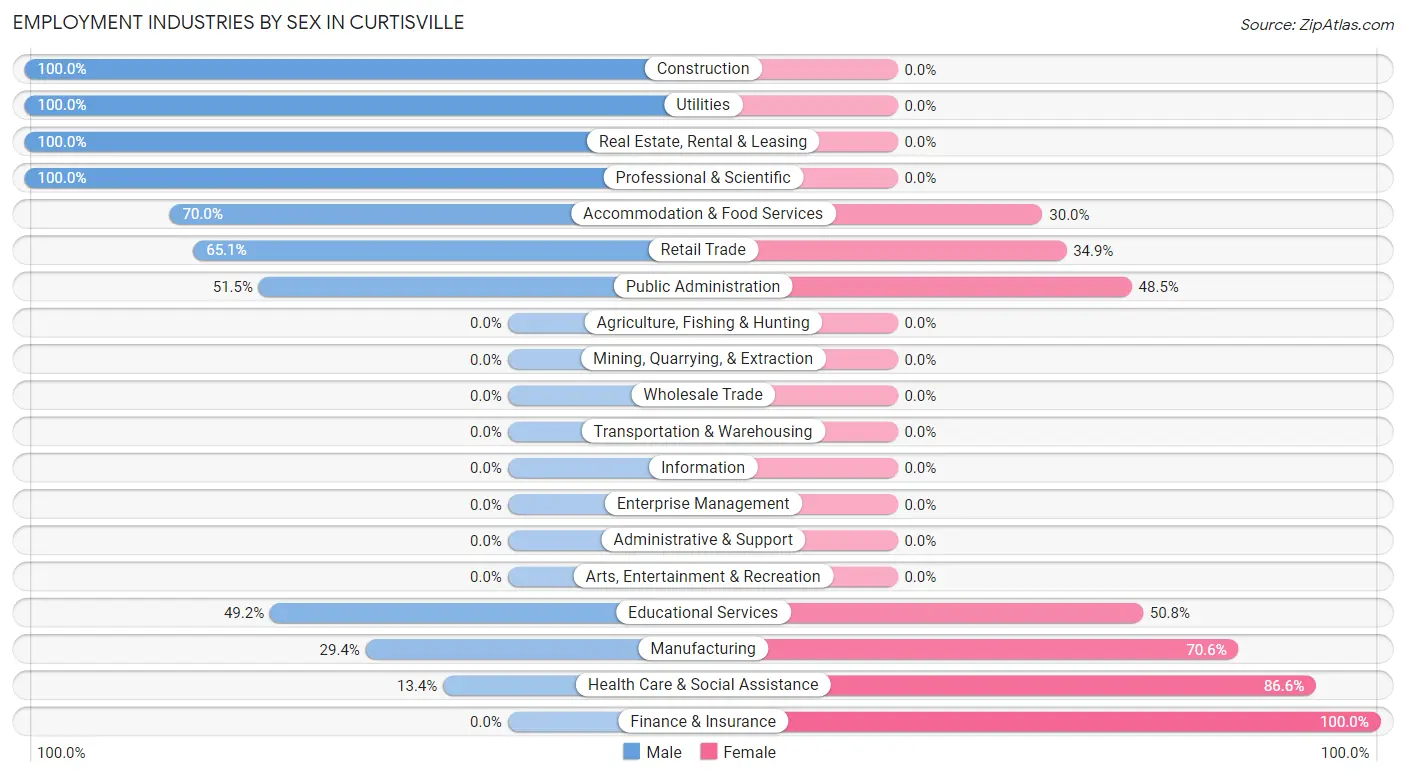
Employment Industries by Sex in Curtisville
The Curtisville industries that see more men than women are Construction (100.0%), Utilities (100.0%), and Real Estate, Rental & Leasing (100.0%), whereas the industries that tend to have a higher number of women are Finance & Insurance (100.0%), Health Care & Social Assistance (86.6%), and Manufacturing (70.6%).
| Industry | Male | Female |
| Agriculture, Fishing & Hunting | 0 (0.0%) | 0 (0.0%) |
| Mining, Quarrying, & Extraction | 0 (0.0%) | 0 (0.0%) |
| Construction | 35 (100.0%) | 0 (0.0%) |
| Manufacturing | 10 (29.4%) | 24 (70.6%) |
| Wholesale Trade | 0 (0.0%) | 0 (0.0%) |
| Retail Trade | 95 (65.1%) | 51 (34.9%) |
| Transportation & Warehousing | 0 (0.0%) | 0 (0.0%) |
| Utilities | 15 (100.0%) | 0 (0.0%) |
| Information | 0 (0.0%) | 0 (0.0%) |
| Finance & Insurance | 0 (0.0%) | 22 (100.0%) |
| Real Estate, Rental & Leasing | 16 (100.0%) | 0 (0.0%) |
| Professional & Scientific | 15 (100.0%) | 0 (0.0%) |
| Enterprise Management | 0 (0.0%) | 0 (0.0%) |
| Administrative & Support | 0 (0.0%) | 0 (0.0%) |
| Educational Services | 31 (49.2%) | 32 (50.8%) |
| Health Care & Social Assistance | 27 (13.4%) | 175 (86.6%) |
| Arts, Entertainment & Recreation | 0 (0.0%) | 0 (0.0%) |
| Accommodation & Food Services | 42 (70.0%) | 18 (30.0%) |
| Public Administration | 17 (51.5%) | 16 (48.5%) |
| Total | 303 (47.3%) | 338 (52.7%) |
Education in Curtisville
School Enrollment in Curtisville
The most common levels of schooling among the 89 students in Curtisville are middle school (36 | 40.5%), college / undergraduate (22 | 24.7%), and nursery / preschool (17 | 19.1%).
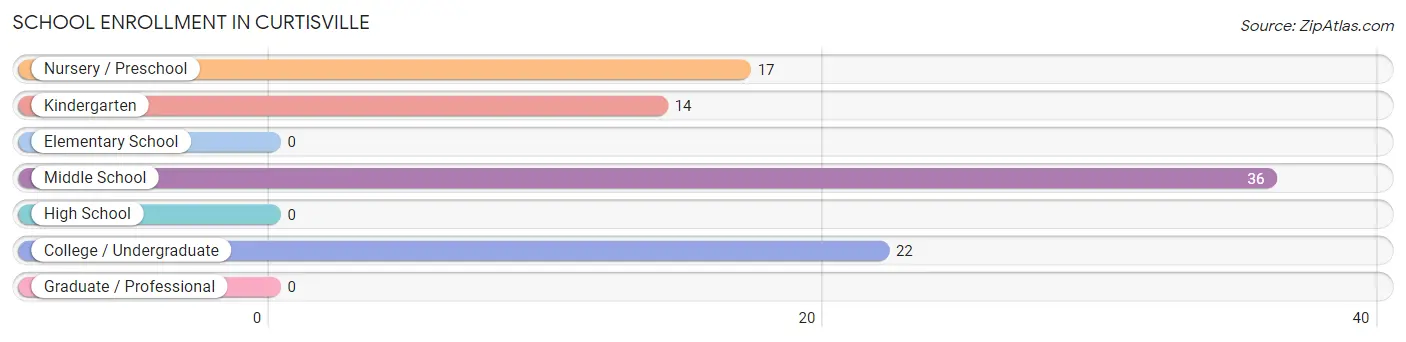
| School Level | # Students | % Students |
| Nursery / Preschool | 17 | 19.1% |
| Kindergarten | 14 | 15.7% |
| Elementary School | 0 | 0.0% |
| Middle School | 36 | 40.5% |
| High School | 0 | 0.0% |
| College / Undergraduate | 22 | 24.7% |
| Graduate / Professional | 0 | 0.0% |
| Total | 89 | 100.0% |
School Enrollment by Age by Funding Source in Curtisville
Out of a total of 89 students who are enrolled in schools in Curtisville, 22 (24.7%) attend a private institution, while the remaining 67 (75.3%) are enrolled in public schools. The age group of 18 to 19 year olds has the highest likelihood of being enrolled in private schools, with 22 (100.0% in the age bracket) enrolled. Conversely, the age group of 3 to 4 year olds has the lowest likelihood of being enrolled in a private school, with 17 (100.0% in the age bracket) attending a public institution.
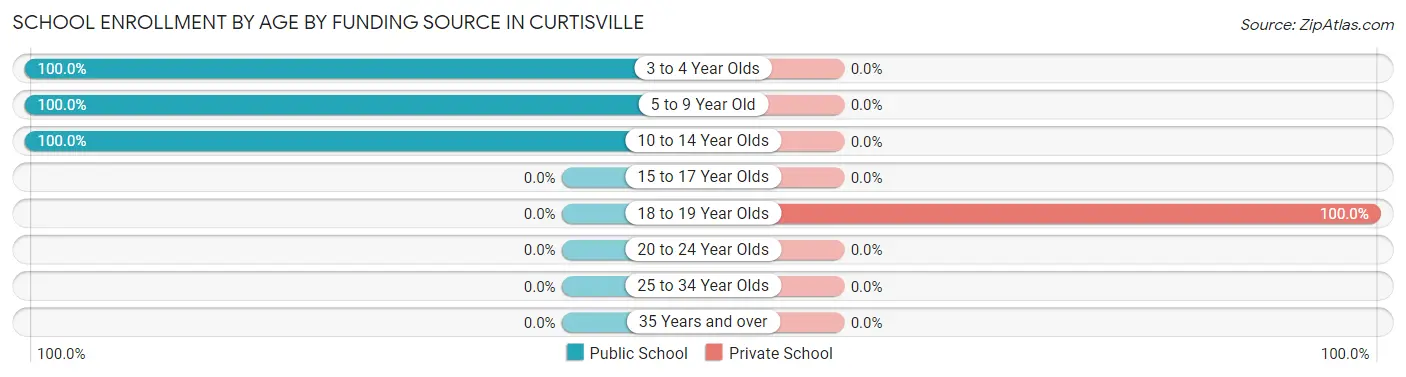
| Age Bracket | Public School | Private School |
| 3 to 4 Year Olds | 17 (100.0%) | 0 (0.0%) |
| 5 to 9 Year Old | 14 (100.0%) | 0 (0.0%) |
| 10 to 14 Year Olds | 36 (100.0%) | 0 (0.0%) |
| 15 to 17 Year Olds | 0 (0.0%) | 0 (0.0%) |
| 18 to 19 Year Olds | 0 (0.0%) | 22 (100.0%) |
| 20 to 24 Year Olds | 0 (0.0%) | 0 (0.0%) |
| 25 to 34 Year Olds | 0 (0.0%) | 0 (0.0%) |
| 35 Years and over | 0 (0.0%) | 0 (0.0%) |
| Total | 67 (75.3%) | 22 (24.7%) |
Educational Attainment by Field of Study in Curtisville
Business (139 | 47.4%), social sciences (40 | 13.7%), science & technology (32 | 10.9%), arts & humanities (28 | 9.6%), and bio, nature & agricultural (23 | 7.9%) are the most common fields of study among 293 individuals in Curtisville who have obtained a bachelor's degree or higher.
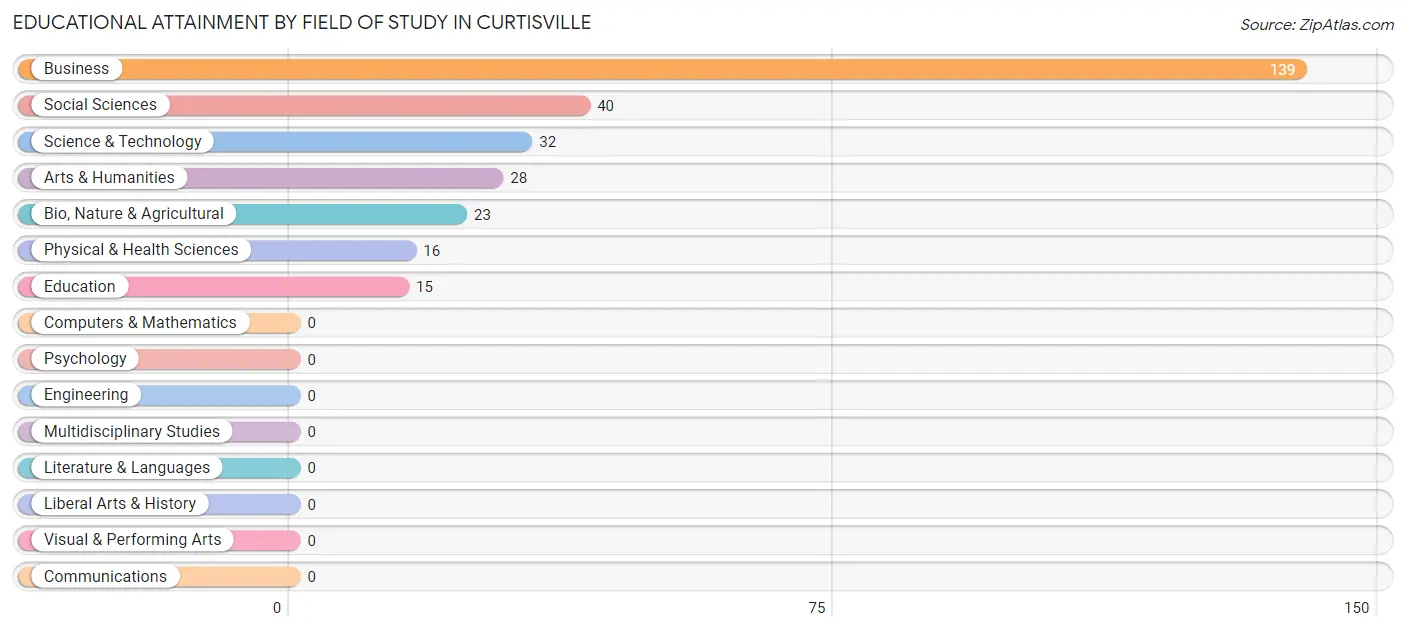
| Field of Study | # Graduates | % Graduates |
| Computers & Mathematics | 0 | 0.0% |
| Bio, Nature & Agricultural | 23 | 7.9% |
| Physical & Health Sciences | 16 | 5.5% |
| Psychology | 0 | 0.0% |
| Social Sciences | 40 | 13.7% |
| Engineering | 0 | 0.0% |
| Multidisciplinary Studies | 0 | 0.0% |
| Science & Technology | 32 | 10.9% |
| Business | 139 | 47.4% |
| Education | 15 | 5.1% |
| Literature & Languages | 0 | 0.0% |
| Liberal Arts & History | 0 | 0.0% |
| Visual & Performing Arts | 0 | 0.0% |
| Communications | 0 | 0.0% |
| Arts & Humanities | 28 | 9.6% |
| Total | 293 | 100.0% |
Transportation & Commute in Curtisville
Vehicle Availability by Sex in Curtisville
The most prevalent vehicle ownership categories in Curtisville are males with 1 vehicle (120, accounting for 39.6%) and females with 1 vehicle (75, making up 35.5%).
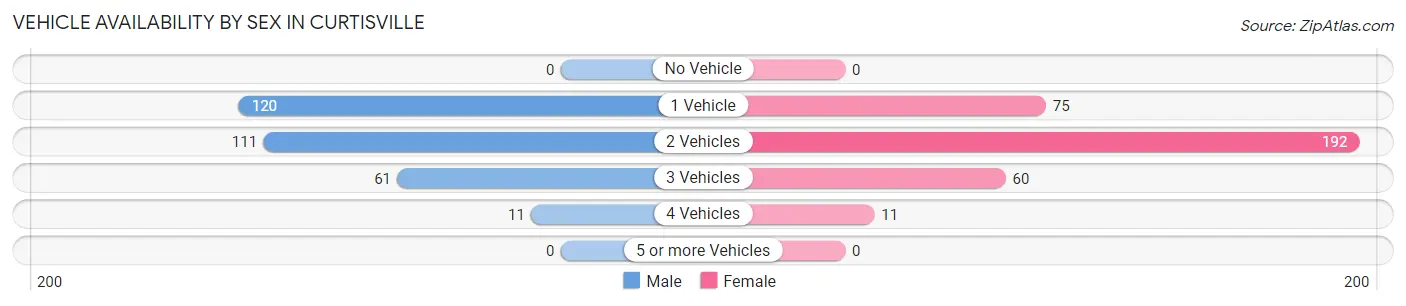
| Vehicles Available | Male | Female |
| No Vehicle | 0 (0.0%) | 0 (0.0%) |
| 1 Vehicle | 120 (39.6%) | 75 (22.2%) |
| 2 Vehicles | 111 (36.6%) | 192 (56.8%) |
| 3 Vehicles | 61 (20.1%) | 60 (17.7%) |
| 4 Vehicles | 11 (3.6%) | 11 (3.3%) |
| 5 or more Vehicles | 0 (0.0%) | 0 (0.0%) |
| Total | 303 (100.0%) | 338 (100.0%) |
Commute Time in Curtisville
The most frequently occuring commute durations in Curtisville are 45 to 59 minutes (137 commuters, 23.5%), 30 to 34 minutes (119 commuters, 20.4%), and 10 to 14 minutes (99 commuters, 17.0%).
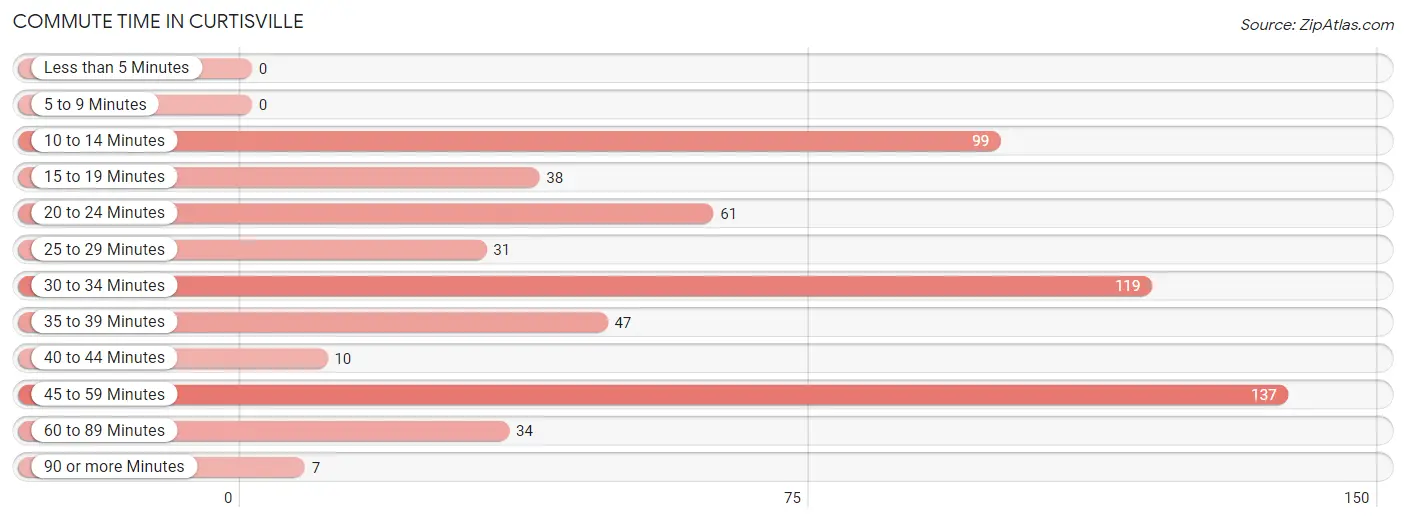
| Commute Time | # Commuters | % Commuters |
| Less than 5 Minutes | 0 | 0.0% |
| 5 to 9 Minutes | 0 | 0.0% |
| 10 to 14 Minutes | 99 | 17.0% |
| 15 to 19 Minutes | 38 | 6.5% |
| 20 to 24 Minutes | 61 | 10.5% |
| 25 to 29 Minutes | 31 | 5.3% |
| 30 to 34 Minutes | 119 | 20.4% |
| 35 to 39 Minutes | 47 | 8.1% |
| 40 to 44 Minutes | 10 | 1.7% |
| 45 to 59 Minutes | 137 | 23.5% |
| 60 to 89 Minutes | 34 | 5.8% |
| 90 or more Minutes | 7 | 1.2% |
Commute Time by Sex in Curtisville
The most common commute times in Curtisville are 45 to 59 minutes (74 commuters, 28.3%) for males and 10 to 14 minutes (99 commuters, 30.7%) for females.
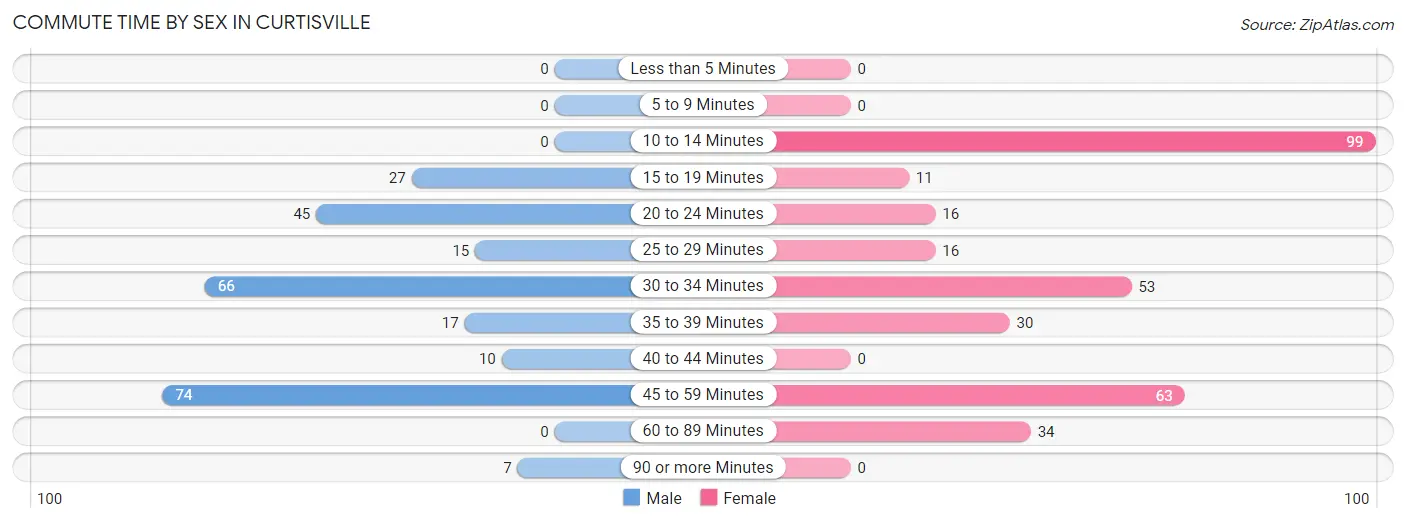
| Commute Time | Male | Female |
| Less than 5 Minutes | 0 (0.0%) | 0 (0.0%) |
| 5 to 9 Minutes | 0 (0.0%) | 0 (0.0%) |
| 10 to 14 Minutes | 0 (0.0%) | 99 (30.7%) |
| 15 to 19 Minutes | 27 (10.3%) | 11 (3.4%) |
| 20 to 24 Minutes | 45 (17.2%) | 16 (5.0%) |
| 25 to 29 Minutes | 15 (5.8%) | 16 (5.0%) |
| 30 to 34 Minutes | 66 (25.3%) | 53 (16.5%) |
| 35 to 39 Minutes | 17 (6.5%) | 30 (9.3%) |
| 40 to 44 Minutes | 10 (3.8%) | 0 (0.0%) |
| 45 to 59 Minutes | 74 (28.3%) | 63 (19.6%) |
| 60 to 89 Minutes | 0 (0.0%) | 34 (10.6%) |
| 90 or more Minutes | 7 (2.7%) | 0 (0.0%) |
Time of Departure to Work by Sex in Curtisville
The most frequent times of departure to work in Curtisville are 6:30 AM to 6:59 AM (106, 40.6%) for males and 6:00 AM to 6:29 AM (65, 20.2%) for females.
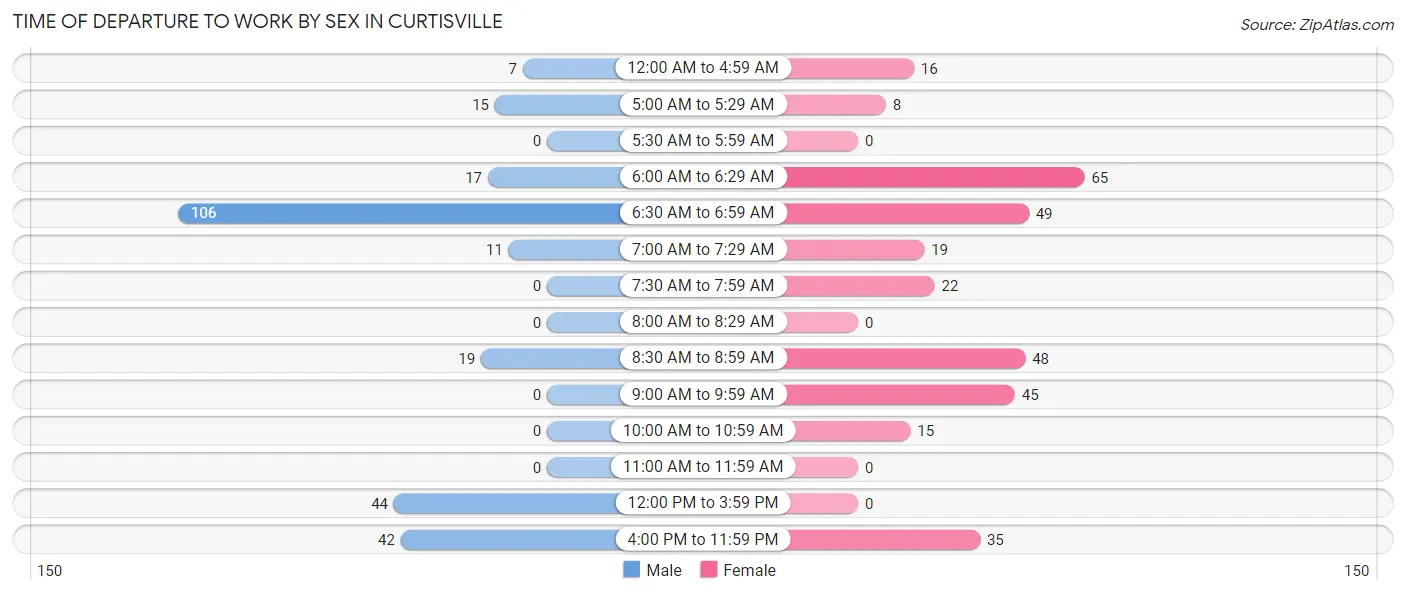
| Time of Departure | Male | Female |
| 12:00 AM to 4:59 AM | 7 (2.7%) | 16 (5.0%) |
| 5:00 AM to 5:29 AM | 15 (5.8%) | 8 (2.5%) |
| 5:30 AM to 5:59 AM | 0 (0.0%) | 0 (0.0%) |
| 6:00 AM to 6:29 AM | 17 (6.5%) | 65 (20.2%) |
| 6:30 AM to 6:59 AM | 106 (40.6%) | 49 (15.2%) |
| 7:00 AM to 7:29 AM | 11 (4.2%) | 19 (5.9%) |
| 7:30 AM to 7:59 AM | 0 (0.0%) | 22 (6.8%) |
| 8:00 AM to 8:29 AM | 0 (0.0%) | 0 (0.0%) |
| 8:30 AM to 8:59 AM | 19 (7.3%) | 48 (14.9%) |
| 9:00 AM to 9:59 AM | 0 (0.0%) | 45 (14.0%) |
| 10:00 AM to 10:59 AM | 0 (0.0%) | 15 (4.7%) |
| 11:00 AM to 11:59 AM | 0 (0.0%) | 0 (0.0%) |
| 12:00 PM to 3:59 PM | 44 (16.9%) | 0 (0.0%) |
| 4:00 PM to 11:59 PM | 42 (16.1%) | 35 (10.9%) |
| Total | 261 (100.0%) | 322 (100.0%) |
Housing Occupancy in Curtisville
Occupancy by Ownership in Curtisville
Of the total 464 dwellings in Curtisville, owner-occupied units account for 372 (80.2%), while renter-occupied units make up 92 (19.8%).
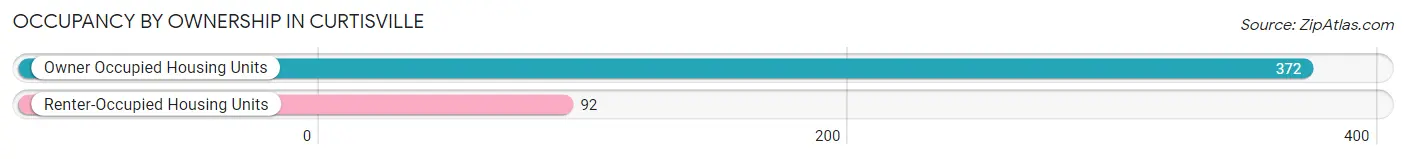
| Occupancy | # Housing Units | % Housing Units |
| Owner Occupied Housing Units | 372 | 80.2% |
| Renter-Occupied Housing Units | 92 | 19.8% |
| Total Occupied Housing Units | 464 | 100.0% |
Occupancy by Household Size in Curtisville
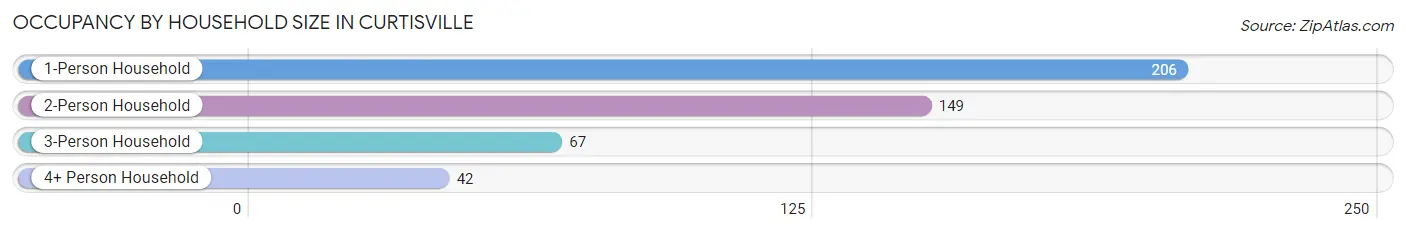
| Household Size | # Housing Units | % Housing Units |
| 1-Person Household | 206 | 44.4% |
| 2-Person Household | 149 | 32.1% |
| 3-Person Household | 67 | 14.4% |
| 4+ Person Household | 42 | 9.0% |
| Total Housing Units | 464 | 100.0% |
Occupancy by Ownership by Household Size in Curtisville
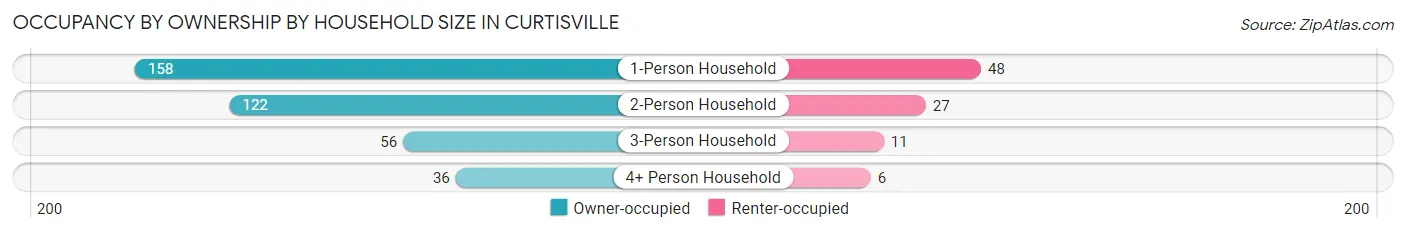
| Household Size | Owner-occupied | Renter-occupied |
| 1-Person Household | 158 (76.7%) | 48 (23.3%) |
| 2-Person Household | 122 (81.9%) | 27 (18.1%) |
| 3-Person Household | 56 (83.6%) | 11 (16.4%) |
| 4+ Person Household | 36 (85.7%) | 6 (14.3%) |
| Total Housing Units | 372 (80.2%) | 92 (19.8%) |
Occupancy by Educational Attainment in Curtisville
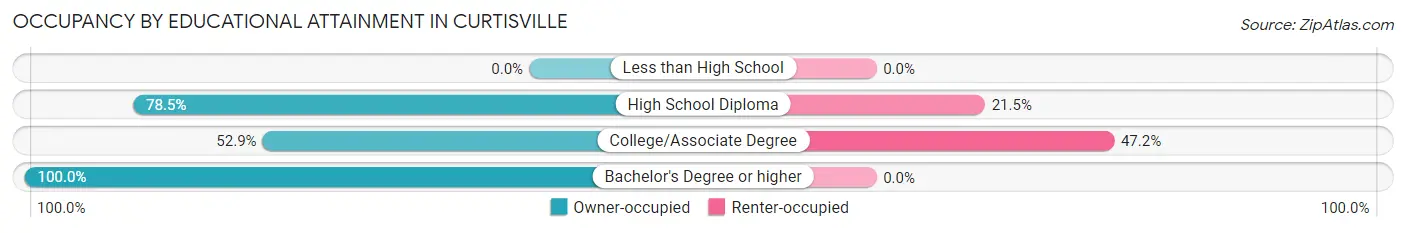
| Household Size | Owner-occupied | Renter-occupied |
| Less than High School | 0 (0.0%) | 0 (0.0%) |
| High School Diploma | 124 (78.5%) | 34 (21.5%) |
| College/Associate Degree | 65 (52.8%) | 58 (47.1%) |
| Bachelor's Degree or higher | 183 (100.0%) | 0 (0.0%) |
Occupancy by Age of Householder in Curtisville
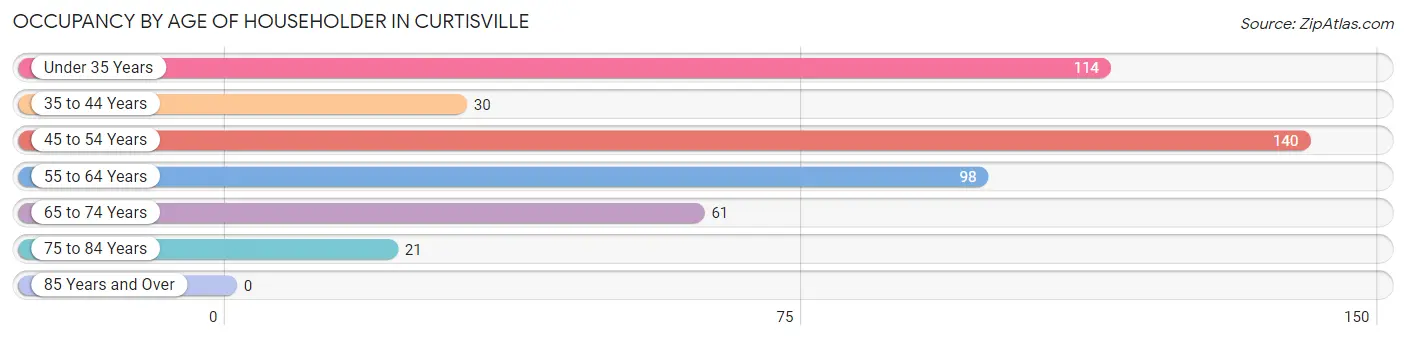
| Age Bracket | # Households | % Households |
| Under 35 Years | 114 | 24.6% |
| 35 to 44 Years | 30 | 6.5% |
| 45 to 54 Years | 140 | 30.2% |
| 55 to 64 Years | 98 | 21.1% |
| 65 to 74 Years | 61 | 13.2% |
| 75 to 84 Years | 21 | 4.5% |
| 85 Years and Over | 0 | 0.0% |
| Total | 464 | 100.0% |
Housing Finances in Curtisville
Median Income by Occupancy in Curtisville
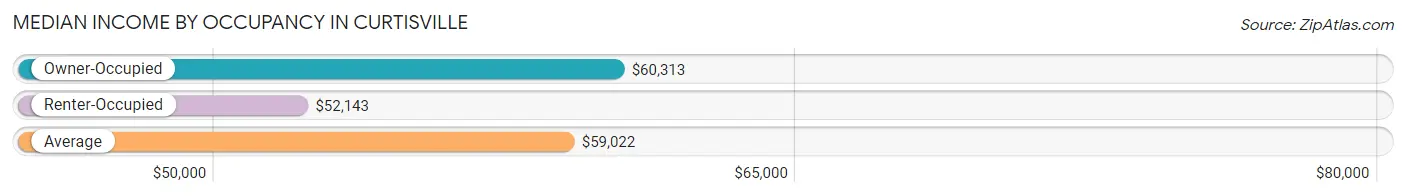
| Occupancy Type | # Households | Median Income |
| Owner-Occupied | 372 (80.2%) | $60,313 |
| Renter-Occupied | 92 (19.8%) | $52,143 |
| Average | 464 (100.0%) | $59,022 |
Occupancy by Householder Income Bracket in Curtisville
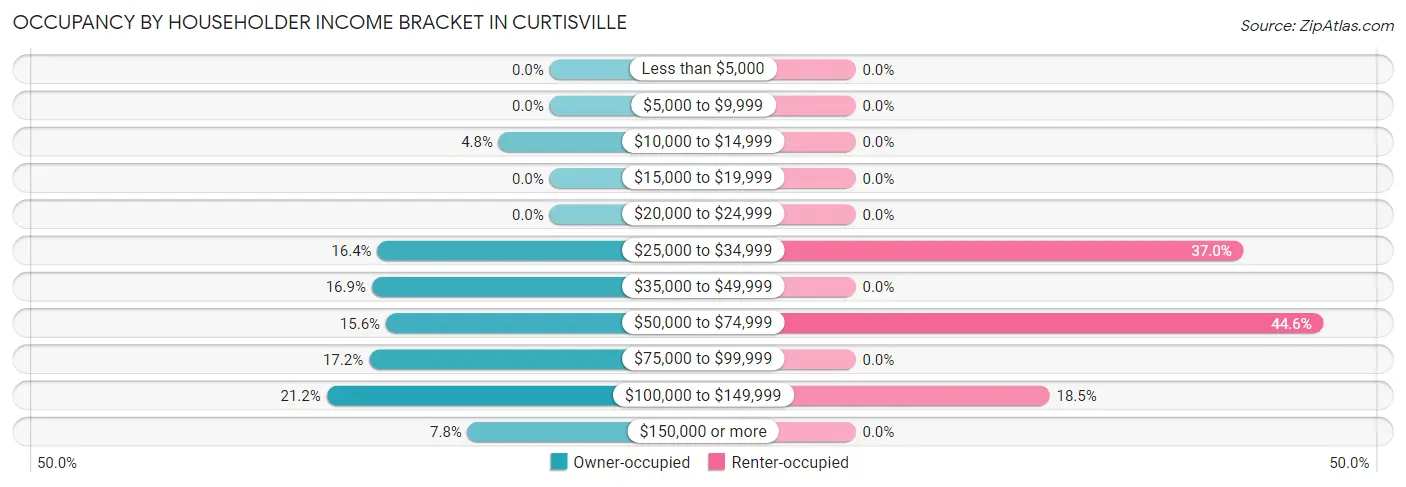
| Income Bracket | Owner-occupied | Renter-occupied |
| Less than $5,000 | 0 (0.0%) | 0 (0.0%) |
| $5,000 to $9,999 | 0 (0.0%) | 0 (0.0%) |
| $10,000 to $14,999 | 18 (4.8%) | 0 (0.0%) |
| $15,000 to $19,999 | 0 (0.0%) | 0 (0.0%) |
| $20,000 to $24,999 | 0 (0.0%) | 0 (0.0%) |
| $25,000 to $34,999 | 61 (16.4%) | 34 (37.0%) |
| $35,000 to $49,999 | 63 (16.9%) | 0 (0.0%) |
| $50,000 to $74,999 | 58 (15.6%) | 41 (44.6%) |
| $75,000 to $99,999 | 64 (17.2%) | 0 (0.0%) |
| $100,000 to $149,999 | 79 (21.2%) | 17 (18.5%) |
| $150,000 or more | 29 (7.8%) | 0 (0.0%) |
| Total | 372 (100.0%) | 92 (100.0%) |
Monthly Housing Cost Tiers in Curtisville
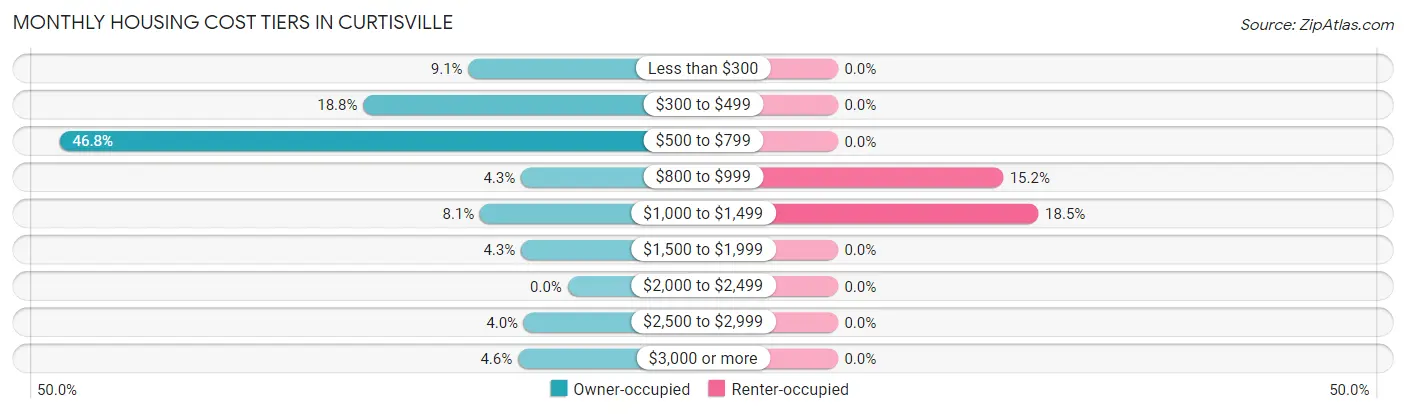
| Monthly Cost | Owner-occupied | Renter-occupied |
| Less than $300 | 34 (9.1%) | 0 (0.0%) |
| $300 to $499 | 70 (18.8%) | 0 (0.0%) |
| $500 to $799 | 174 (46.8%) | 0 (0.0%) |
| $800 to $999 | 16 (4.3%) | 14 (15.2%) |
| $1,000 to $1,499 | 30 (8.1%) | 17 (18.5%) |
| $1,500 to $1,999 | 16 (4.3%) | 0 (0.0%) |
| $2,000 to $2,499 | 0 (0.0%) | 0 (0.0%) |
| $2,500 to $2,999 | 15 (4.0%) | 0 (0.0%) |
| $3,000 or more | 17 (4.6%) | 0 (0.0%) |
| Total | 372 (100.0%) | 92 (100.0%) |
Physical Housing Characteristics in Curtisville
Housing Structures in Curtisville
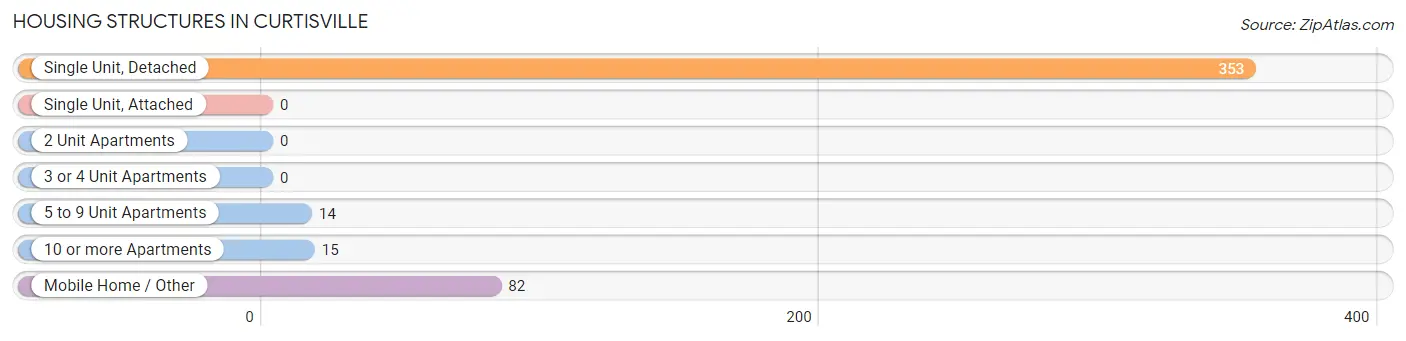
| Structure Type | # Housing Units | % Housing Units |
| Single Unit, Detached | 353 | 76.1% |
| Single Unit, Attached | 0 | 0.0% |
| 2 Unit Apartments | 0 | 0.0% |
| 3 or 4 Unit Apartments | 0 | 0.0% |
| 5 to 9 Unit Apartments | 14 | 3.0% |
| 10 or more Apartments | 15 | 3.2% |
| Mobile Home / Other | 82 | 17.7% |
| Total | 464 | 100.0% |
Housing Structures by Occupancy in Curtisville
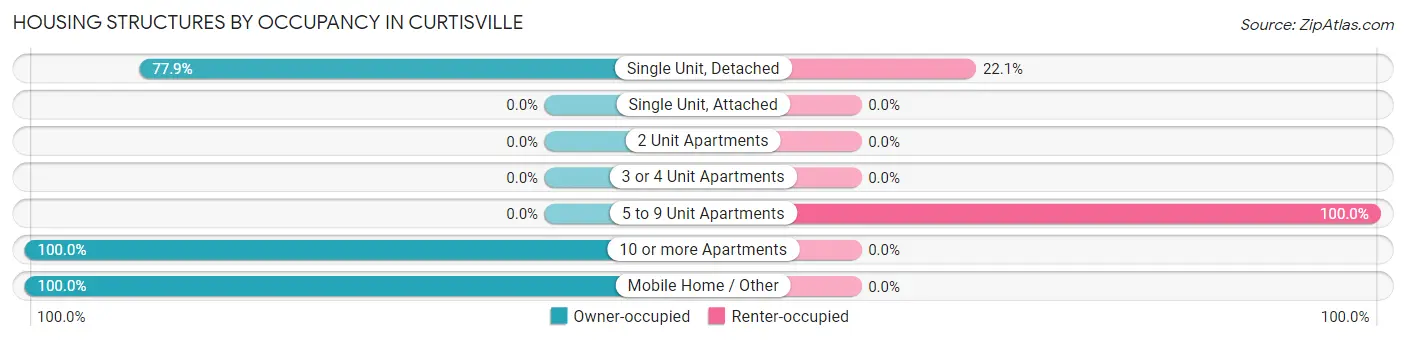
| Structure Type | Owner-occupied | Renter-occupied |
| Single Unit, Detached | 275 (77.9%) | 78 (22.1%) |
| Single Unit, Attached | 0 (0.0%) | 0 (0.0%) |
| 2 Unit Apartments | 0 (0.0%) | 0 (0.0%) |
| 3 or 4 Unit Apartments | 0 (0.0%) | 0 (0.0%) |
| 5 to 9 Unit Apartments | 0 (0.0%) | 14 (100.0%) |
| 10 or more Apartments | 15 (100.0%) | 0 (0.0%) |
| Mobile Home / Other | 82 (100.0%) | 0 (0.0%) |
| Total | 372 (80.2%) | 92 (19.8%) |
Housing Structures by Number of Rooms in Curtisville
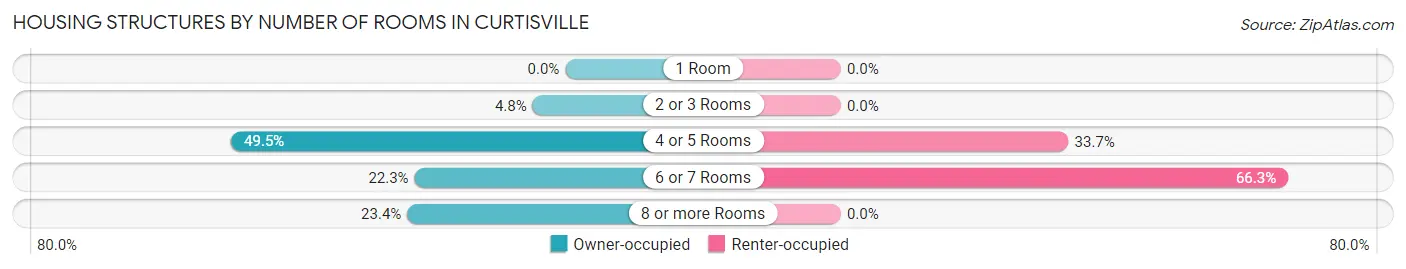
| Number of Rooms | Owner-occupied | Renter-occupied |
| 1 Room | 0 (0.0%) | 0 (0.0%) |
| 2 or 3 Rooms | 18 (4.8%) | 0 (0.0%) |
| 4 or 5 Rooms | 184 (49.5%) | 31 (33.7%) |
| 6 or 7 Rooms | 83 (22.3%) | 61 (66.3%) |
| 8 or more Rooms | 87 (23.4%) | 0 (0.0%) |
| Total | 372 (100.0%) | 92 (100.0%) |
Housing Structure by Heating Type in Curtisville
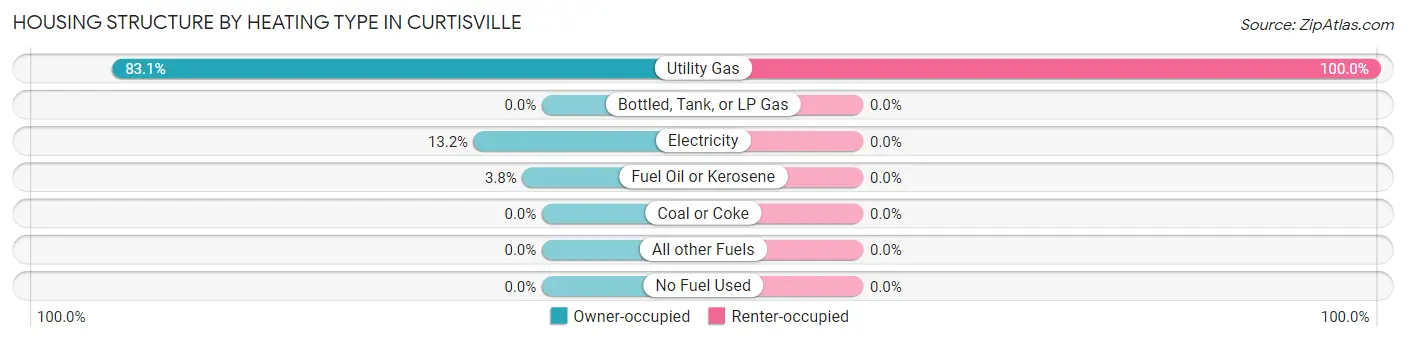
| Heating Type | Owner-occupied | Renter-occupied |
| Utility Gas | 309 (83.1%) | 92 (100.0%) |
| Bottled, Tank, or LP Gas | 0 (0.0%) | 0 (0.0%) |
| Electricity | 49 (13.2%) | 0 (0.0%) |
| Fuel Oil or Kerosene | 14 (3.8%) | 0 (0.0%) |
| Coal or Coke | 0 (0.0%) | 0 (0.0%) |
| All other Fuels | 0 (0.0%) | 0 (0.0%) |
| No Fuel Used | 0 (0.0%) | 0 (0.0%) |
| Total | 372 (100.0%) | 92 (100.0%) |
Household Vehicle Usage in Curtisville
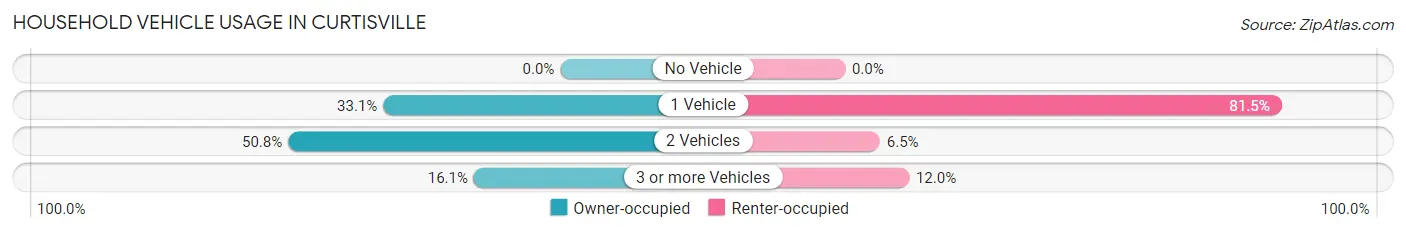
| Vehicles per Household | Owner-occupied | Renter-occupied |
| No Vehicle | 0 (0.0%) | 0 (0.0%) |
| 1 Vehicle | 123 (33.1%) | 75 (81.5%) |
| 2 Vehicles | 189 (50.8%) | 6 (6.5%) |
| 3 or more Vehicles | 60 (16.1%) | 11 (12.0%) |
| Total | 372 (100.0%) | 92 (100.0%) |
Real Estate & Mortgages in Curtisville
Real Estate and Mortgage Overview in Curtisville
| Characteristic | Without Mortgage | With Mortgage |
| Housing Units | 243 | 129 |
| Median Property Value | - | - |
| Median Household Income | $48,536 | $14 |
| Monthly Housing Costs | $516 | $17 |
| Real Estate Taxes | - | - |
Property Value by Mortgage Status in Curtisville
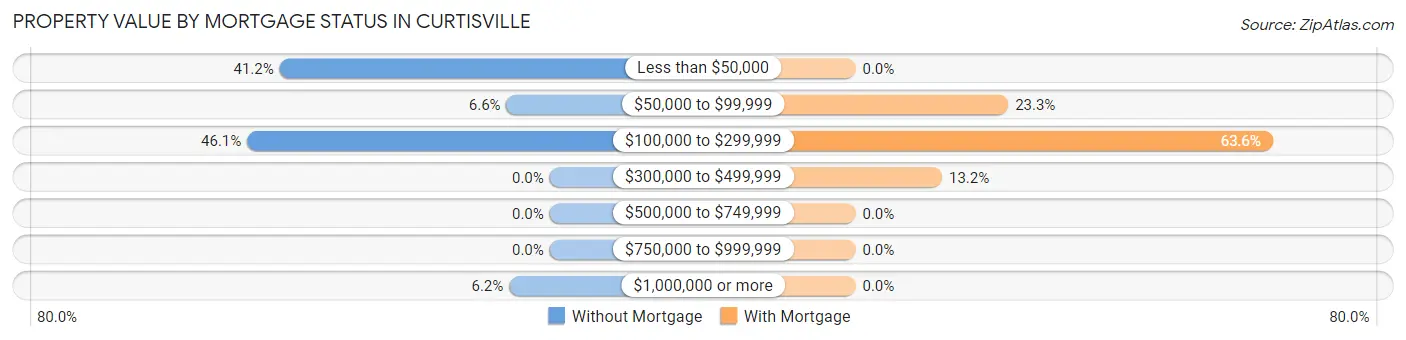
| Property Value | Without Mortgage | With Mortgage |
| Less than $50,000 | 100 (41.1%) | 0 (0.0%) |
| $50,000 to $99,999 | 16 (6.6%) | 30 (23.3%) |
| $100,000 to $299,999 | 112 (46.1%) | 82 (63.6%) |
| $300,000 to $499,999 | 0 (0.0%) | 17 (13.2%) |
| $500,000 to $749,999 | 0 (0.0%) | 0 (0.0%) |
| $750,000 to $999,999 | 0 (0.0%) | 0 (0.0%) |
| $1,000,000 or more | 15 (6.2%) | 0 (0.0%) |
| Total | 243 (100.0%) | 129 (100.0%) |
Household Income by Mortgage Status in Curtisville
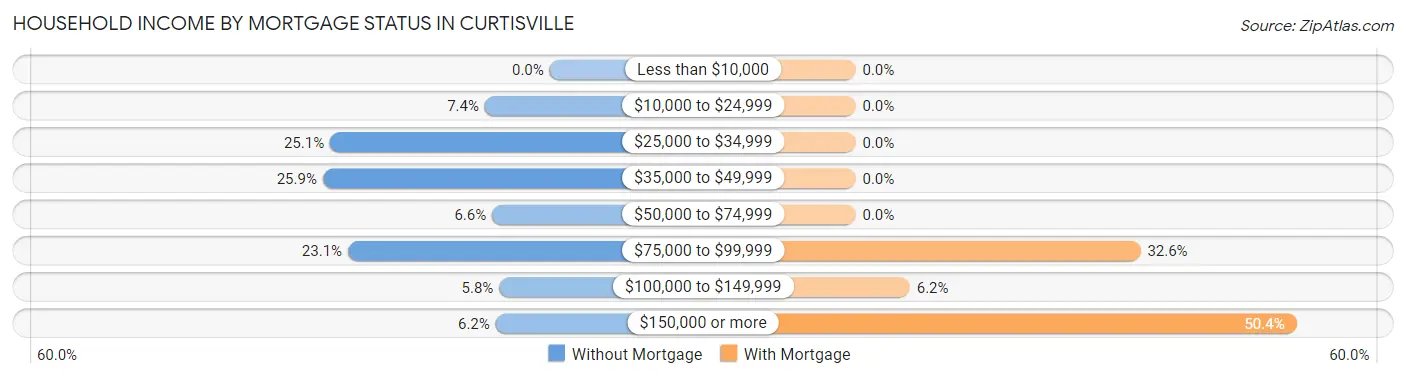
| Household Income | Without Mortgage | With Mortgage |
| Less than $10,000 | 0 (0.0%) | 0 (0.0%) |
| $10,000 to $24,999 | 18 (7.4%) | 0 (0.0%) |
| $25,000 to $34,999 | 61 (25.1%) | 0 (0.0%) |
| $35,000 to $49,999 | 63 (25.9%) | 0 (0.0%) |
| $50,000 to $74,999 | 16 (6.6%) | 0 (0.0%) |
| $75,000 to $99,999 | 56 (23.1%) | 42 (32.6%) |
| $100,000 to $149,999 | 14 (5.8%) | 8 (6.2%) |
| $150,000 or more | 15 (6.2%) | 65 (50.4%) |
| Total | 243 (100.0%) | 129 (100.0%) |
Property Value to Household Income Ratio in Curtisville
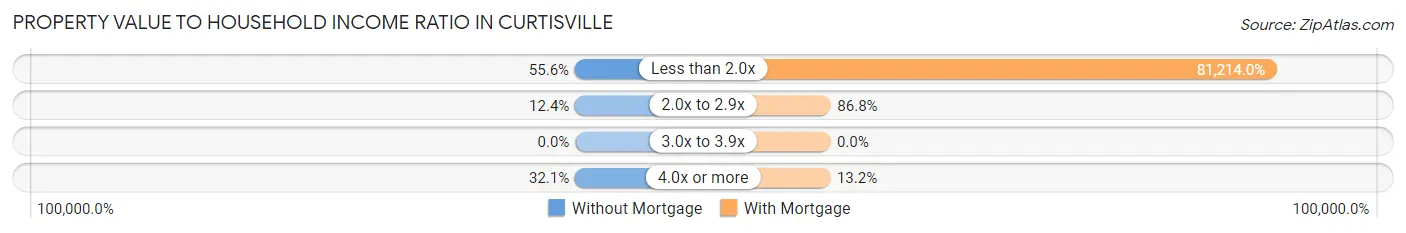
| Value-to-Income Ratio | Without Mortgage | With Mortgage |
| Less than 2.0x | 135 (55.6%) | 104,766 (81,213.9%) |
| 2.0x to 2.9x | 30 (12.3%) | 112 (86.8%) |
| 3.0x to 3.9x | 0 (0.0%) | 0 (0.0%) |
| 4.0x or more | 78 (32.1%) | 17 (13.2%) |
| Total | 243 (100.0%) | 129 (100.0%) |
Real Estate Taxes by Mortgage Status in Curtisville
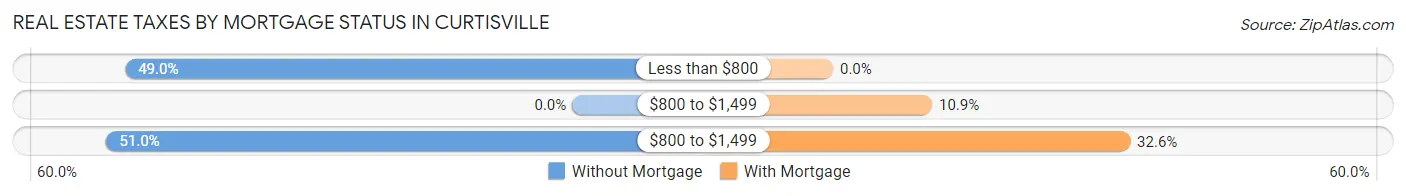
| Property Taxes | Without Mortgage | With Mortgage |
| Less than $800 | 119 (49.0%) | 0 (0.0%) |
| $800 to $1,499 | 0 (0.0%) | 14 (10.8%) |
| $800 to $1,499 | 124 (51.0%) | 42 (32.6%) |
| Total | 243 (100.0%) | 129 (100.0%) |
Health & Disability in Curtisville
Health Insurance Coverage by Age in Curtisville
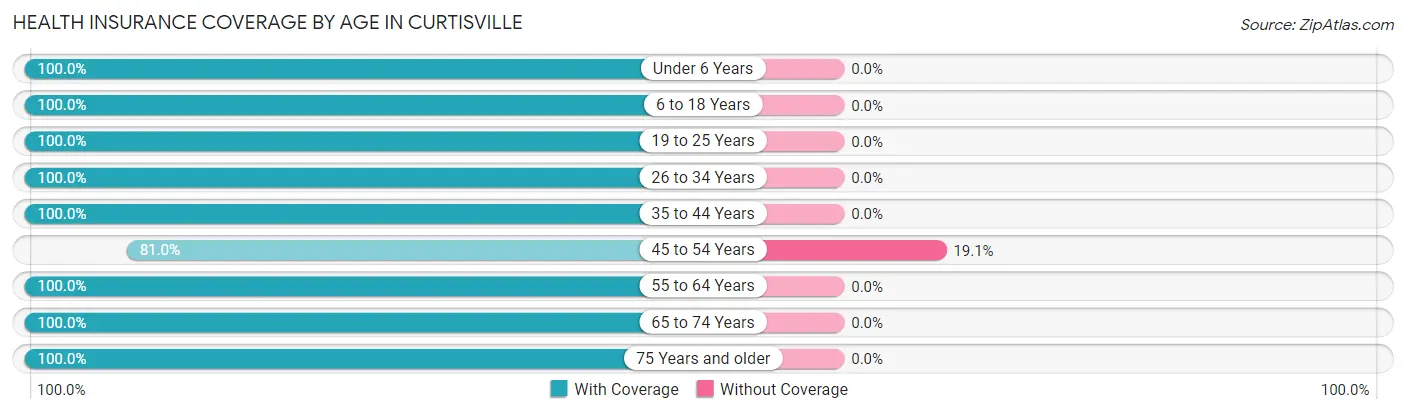
| Age Bracket | With Coverage | Without Coverage |
| Under 6 Years | 85 (100.0%) | 0 (0.0%) |
| 6 to 18 Years | 67 (100.0%) | 0 (0.0%) |
| 19 to 25 Years | 77 (100.0%) | 0 (0.0%) |
| 26 to 34 Years | 145 (100.0%) | 0 (0.0%) |
| 35 to 44 Years | 60 (100.0%) | 0 (0.0%) |
| 45 to 54 Years | 187 (80.9%) | 44 (19.1%) |
| 55 to 64 Years | 98 (100.0%) | 0 (0.0%) |
| 65 to 74 Years | 93 (100.0%) | 0 (0.0%) |
| 75 Years and older | 21 (100.0%) | 0 (0.0%) |
| Total | 833 (95.0%) | 44 (5.0%) |
Health Insurance Coverage by Citizenship Status in Curtisville
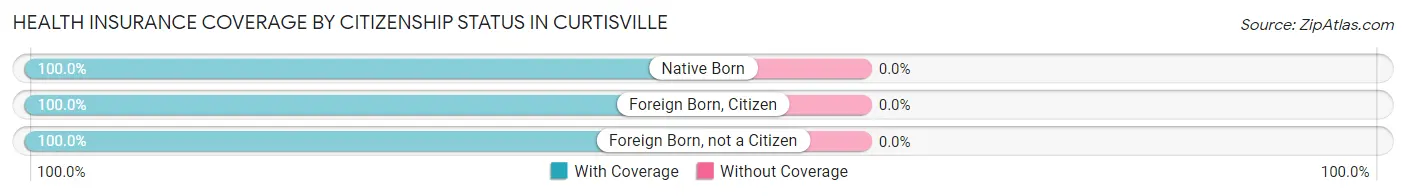
| Citizenship Status | With Coverage | Without Coverage |
| Native Born | 85 (100.0%) | 0 (0.0%) |
| Foreign Born, Citizen | 67 (100.0%) | 0 (0.0%) |
| Foreign Born, not a Citizen | 77 (100.0%) | 0 (0.0%) |
Health Insurance Coverage by Household Income in Curtisville
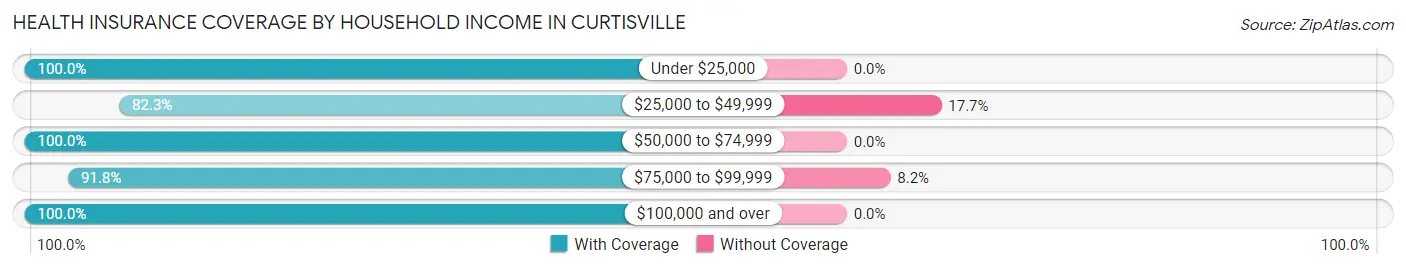
| Household Income | With Coverage | Without Coverage |
| Under $25,000 | 18 (100.0%) | 0 (0.0%) |
| $25,000 to $49,999 | 130 (82.3%) | 28 (17.7%) |
| $50,000 to $74,999 | 170 (100.0%) | 0 (0.0%) |
| $75,000 to $99,999 | 180 (91.8%) | 16 (8.2%) |
| $100,000 and over | 335 (100.0%) | 0 (0.0%) |
Public vs Private Health Insurance Coverage by Age in Curtisville
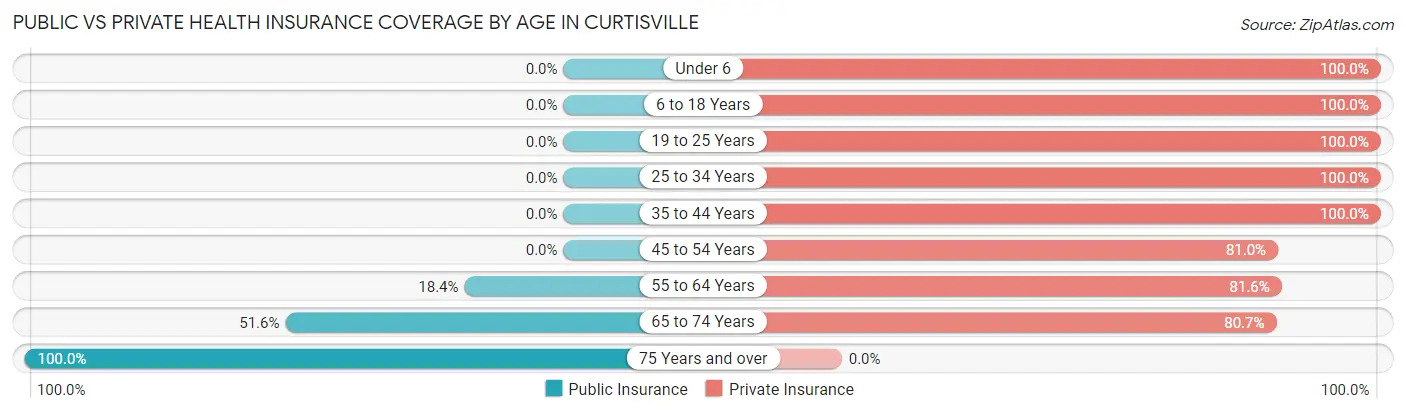
| Age Bracket | Public Insurance | Private Insurance |
| Under 6 | 0 (0.0%) | 85 (100.0%) |
| 6 to 18 Years | 0 (0.0%) | 67 (100.0%) |
| 19 to 25 Years | 0 (0.0%) | 77 (100.0%) |
| 25 to 34 Years | 0 (0.0%) | 145 (100.0%) |
| 35 to 44 Years | 0 (0.0%) | 60 (100.0%) |
| 45 to 54 Years | 0 (0.0%) | 187 (80.9%) |
| 55 to 64 Years | 18 (18.4%) | 80 (81.6%) |
| 65 to 74 Years | 48 (51.6%) | 75 (80.6%) |
| 75 Years and over | 21 (100.0%) | 0 (0.0%) |
| Total | 87 (9.9%) | 776 (88.5%) |
Disability Status by Sex by Age in Curtisville
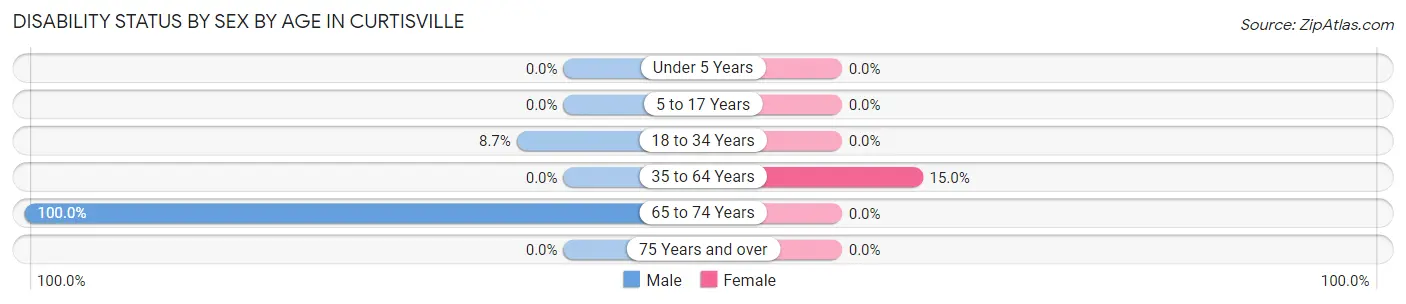
| Age Bracket | Male | Female |
| Under 5 Years | 0 (0.0%) | 0 (0.0%) |
| 5 to 17 Years | 0 (0.0%) | 0 (0.0%) |
| 18 to 34 Years | 15 (8.7%) | 0 (0.0%) |
| 35 to 64 Years | 0 (0.0%) | 34 (15.0%) |
| 65 to 74 Years | 14 (100.0%) | 0 (0.0%) |
| 75 Years and over | 0 (0.0%) | 0 (0.0%) |
Disability Class by Sex by Age in Curtisville
Disability Class: Hearing Difficulty
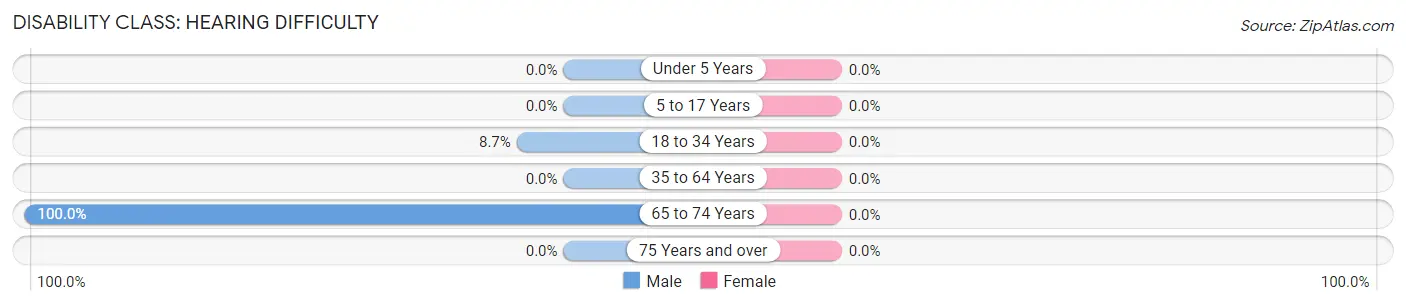
| Age Bracket | Male | Female |
| Under 5 Years | 0 (0.0%) | 0 (0.0%) |
| 5 to 17 Years | 0 (0.0%) | 0 (0.0%) |
| 18 to 34 Years | 15 (8.7%) | 0 (0.0%) |
| 35 to 64 Years | 0 (0.0%) | 0 (0.0%) |
| 65 to 74 Years | 14 (100.0%) | 0 (0.0%) |
| 75 Years and over | 0 (0.0%) | 0 (0.0%) |
Disability Class: Vision Difficulty
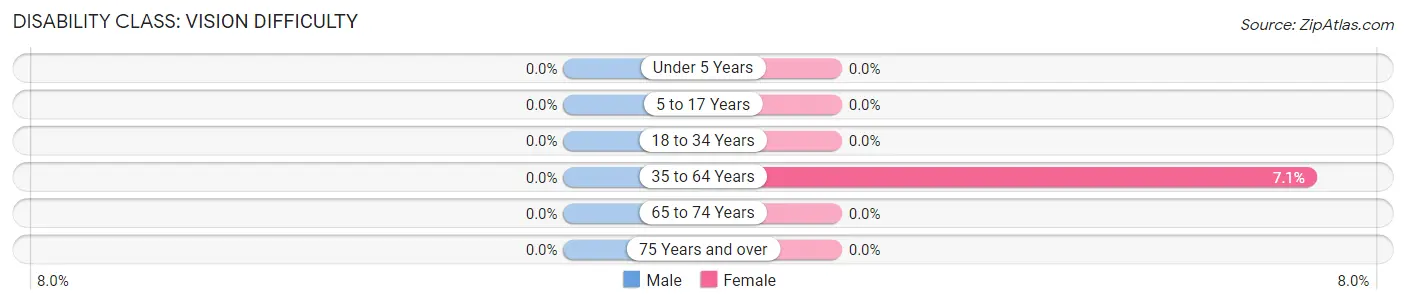
| Age Bracket | Male | Female |
| Under 5 Years | 0 (0.0%) | 0 (0.0%) |
| 5 to 17 Years | 0 (0.0%) | 0 (0.0%) |
| 18 to 34 Years | 0 (0.0%) | 0 (0.0%) |
| 35 to 64 Years | 0 (0.0%) | 16 (7.0%) |
| 65 to 74 Years | 0 (0.0%) | 0 (0.0%) |
| 75 Years and over | 0 (0.0%) | 0 (0.0%) |
Disability Class: Cognitive Difficulty
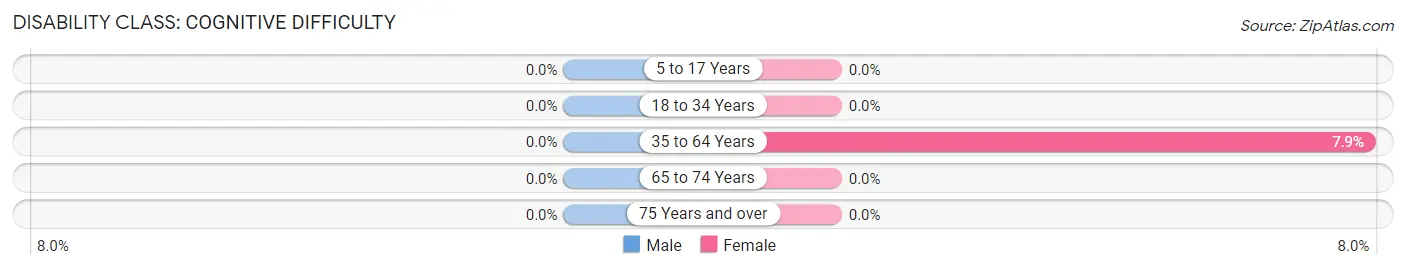
| Age Bracket | Male | Female |
| 5 to 17 Years | 0 (0.0%) | 0 (0.0%) |
| 18 to 34 Years | 0 (0.0%) | 0 (0.0%) |
| 35 to 64 Years | 0 (0.0%) | 18 (7.9%) |
| 65 to 74 Years | 0 (0.0%) | 0 (0.0%) |
| 75 Years and over | 0 (0.0%) | 0 (0.0%) |
Disability Class: Ambulatory Difficulty
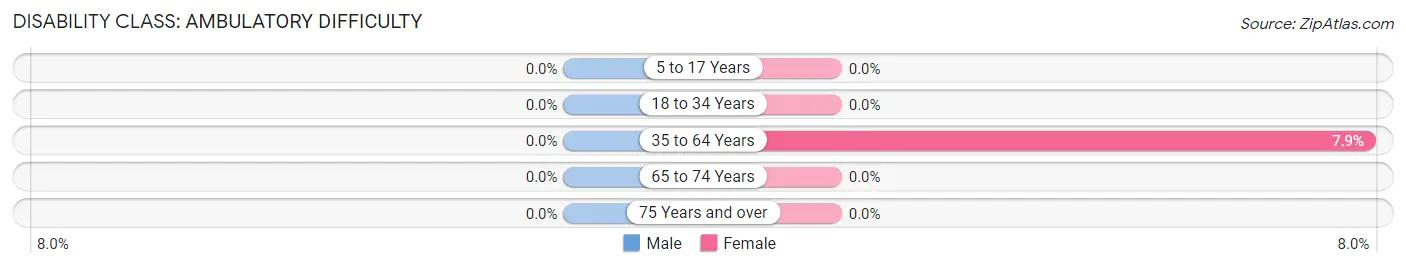
| Age Bracket | Male | Female |
| 5 to 17 Years | 0 (0.0%) | 0 (0.0%) |
| 18 to 34 Years | 0 (0.0%) | 0 (0.0%) |
| 35 to 64 Years | 0 (0.0%) | 18 (7.9%) |
| 65 to 74 Years | 0 (0.0%) | 0 (0.0%) |
| 75 Years and over | 0 (0.0%) | 0 (0.0%) |
Disability Class: Self-Care Difficulty
| Age Bracket | Male | Female |
| 5 to 17 Years | 0 (0.0%) | 0 (0.0%) |
| 18 to 34 Years | 0 (0.0%) | 0 (0.0%) |
| 35 to 64 Years | 0 (0.0%) | 0 (0.0%) |
| 65 to 74 Years | 0 (0.0%) | 0 (0.0%) |
| 75 Years and over | 0 (0.0%) | 0 (0.0%) |
Technology Access in Curtisville
Computing Device Access in Curtisville
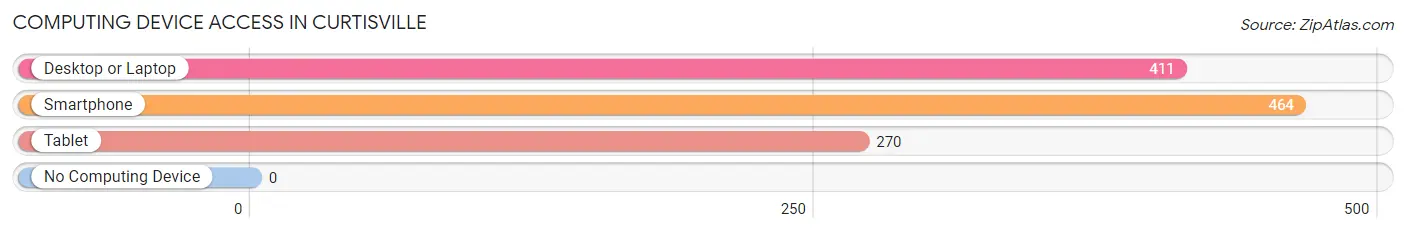
| Device Type | # Households | % Households |
| Desktop or Laptop | 411 | 88.6% |
| Smartphone | 464 | 100.0% |
| Tablet | 270 | 58.2% |
| No Computing Device | 0 | 0.0% |
| Total | 464 | 100.0% |
Internet Access in Curtisville
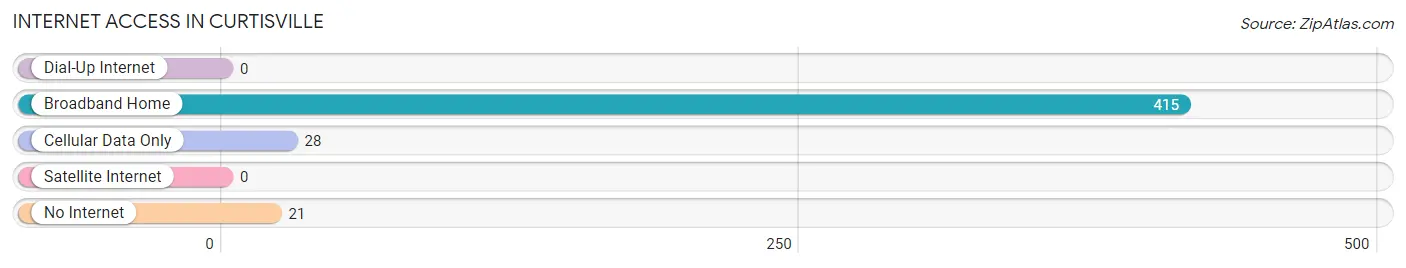
| Internet Type | # Households | % Households |
| Dial-Up Internet | 0 | 0.0% |
| Broadband Home | 415 | 89.4% |
| Cellular Data Only | 28 | 6.0% |
| Satellite Internet | 0 | 0.0% |
| No Internet | 21 | 4.5% |
| Total | 464 | 100.0% |
Curtisville Summary
Curtisville is a small unincorporated community located in Allegheny County, Pennsylvania. It is situated in the foothills of the Allegheny Mountains, approximately 20 miles northeast of Pittsburgh. The community is bordered by the townships of Frazer, Indiana, and West Deer.
History
Curtisville was founded in 1845 by William Curtis, a local farmer. The community was originally known as Curtisville Station, as it was a stop on the Pittsburgh, Fort Wayne and Chicago Railway. The railroad was built in 1851 and ran through the area until it was abandoned in the late 1950s.
The community was named after William Curtis, who was a prominent local farmer and businessman. He owned a large tract of land in the area and was a major contributor to the development of the community.
Geography
Curtisville is located in the foothills of the Allegheny Mountains, approximately 20 miles northeast of Pittsburgh. The community is bordered by the townships of Frazer, Indiana, and West Deer. The terrain is mostly hilly and wooded, with some open fields. The area is known for its scenic beauty and is a popular destination for outdoor recreation.
The climate in Curtisville is typical of the region, with cold winters and warm summers. The average annual temperature is around 50 degrees Fahrenheit. The average annual precipitation is around 40 inches.
Economy
Curtisville is a small, rural community with a limited economy. The primary industries in the area are agriculture and tourism. The community is home to several small farms, which produce a variety of crops, including corn, soybeans, and hay.
The area is also a popular destination for outdoor recreation, such as hiking, camping, fishing, and hunting. The community is home to several parks and recreational areas, including the Allegheny National Forest and the Allegheny River.
Demographics
As of the 2010 census, the population of Curtisville was 1,845. The racial makeup of the community was 97.3% White, 0.7% African American, 0.2% Native American, 0.2% Asian, and 1.6% from other races. The median household income was $45,000, and the median family income was $50,000.
Conclusion
Curtisville is a small, rural community located in Allegheny County, Pennsylvania. It is situated in the foothills of the Allegheny Mountains, approximately 20 miles northeast of Pittsburgh. The community was founded in 1845 by William Curtis, a local farmer, and was originally known as Curtisville Station. The primary industries in the area are agriculture and tourism, and the community is home to several small farms and parks. As of the 2010 census, the population of Curtisville was 1,845. The racial makeup of the community was 97.3% White, 0.7% African American, 0.2% Native American, 0.2% Asian, and 1.6% from other races. The median household income was $45,000, and the median family income was $50,000.
Common Questions
What is Per Capita Income in Curtisville?
Per Capita income in Curtisville is $38,109.
What is the Median Family Income in Curtisville?
Median Family Income in Curtisville is $98,421.
What is the Median Household income in Curtisville?
Median Household Income in Curtisville is $59,022.
What is Income or Wage Gap in Curtisville?
Income or Wage Gap in Curtisville is 8.8%.
Women in Curtisville earn 91.2 cents for every dollar earned by a man.
What is Inequality or Gini Index in Curtisville?
Inequality or Gini Index in Curtisville is 0.31.
What is the Total Population of Curtisville?
Total Population of Curtisville is 877.
What is the Total Male Population of Curtisville?
Total Male Population of Curtisville is 434.
What is the Total Female Population of Curtisville?
Total Female Population of Curtisville is 443.
What is the Ratio of Males per 100 Females in Curtisville?
There are 97.97 Males per 100 Females in Curtisville.
What is the Ratio of Females per 100 Males in Curtisville?
There are 102.07 Females per 100 Males in Curtisville.
What is the Median Population Age in Curtisville?
Median Population Age in Curtisville is 45.1 Years.
What is the Average Family Size in Curtisville
Average Family Size in Curtisville is 2.6 People.
What is the Average Household Size in Curtisville
Average Household Size in Curtisville is 1.9 People.
How Large is the Labor Force in Curtisville?
There are 641 People in the Labor Forcein in Curtisville.
What is the Percentage of People in the Labor Force in Curtisville?
84.8% of People are in the Labor Force in Curtisville.