West Falls, PA Map & Demographics
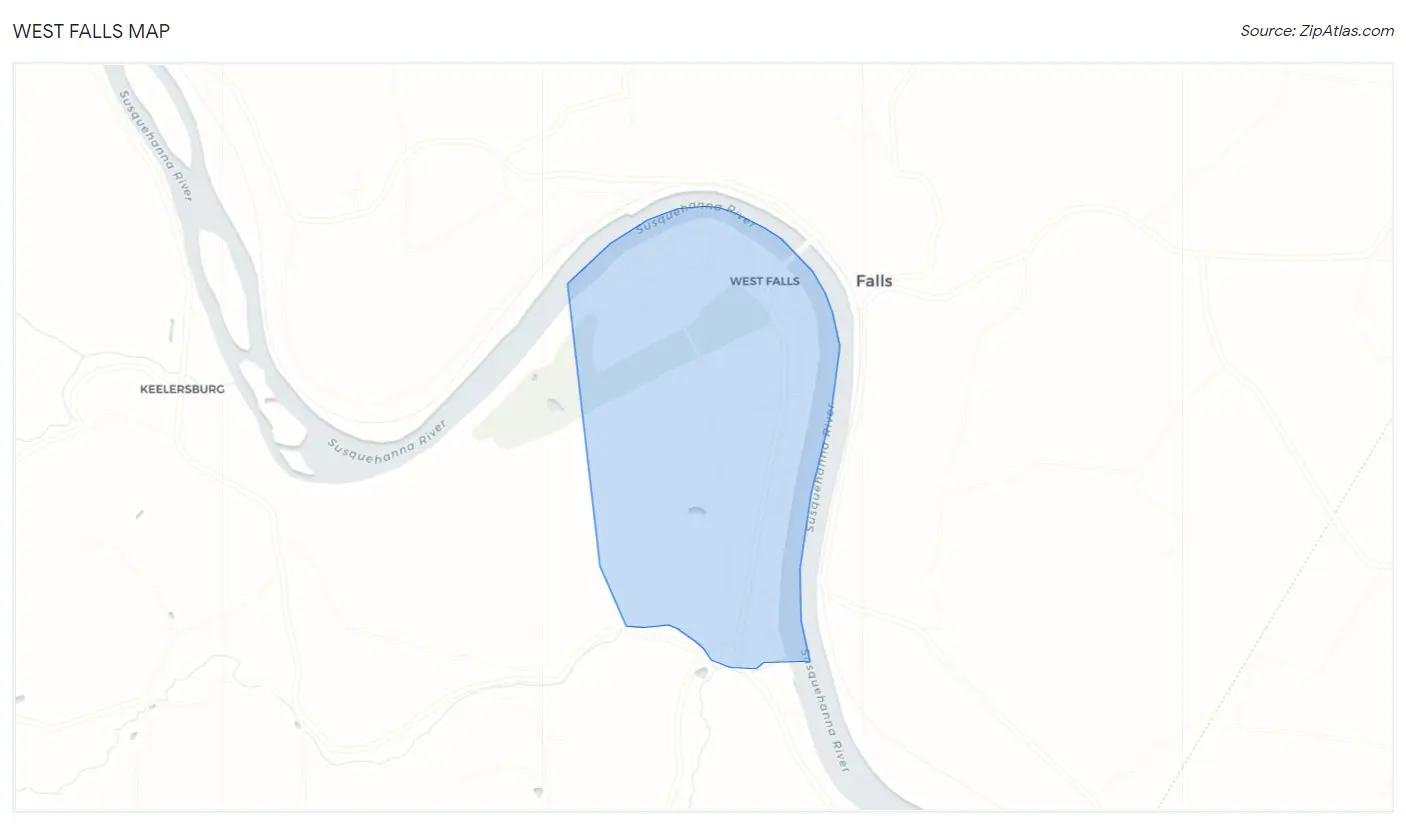
West Falls Map
West Falls Overview
$38,543
PER CAPITA INCOME
$73,125
AVG FAMILY INCOME
$52,422
AVG HOUSEHOLD INCOME
18.9%
WAGE / INCOME GAP [ % ]
81.1¢/ $1
WAGE / INCOME GAP [ $ ]
0.44
INEQUALITY / GINI INDEX
308
TOTAL POPULATION
152
MALE POPULATION
156
FEMALE POPULATION
97.44
MALES / 100 FEMALES
102.63
FEMALES / 100 MALES
59.2
MEDIAN AGE
2.5
AVG FAMILY SIZE
1.9
AVG HOUSEHOLD SIZE
150
LABOR FORCE [ PEOPLE ]
54.0%
PERCENT IN LABOR FORCE
8.8%
UNEMPLOYMENT RATE
Income in West Falls
Income Overview in West Falls
Per Capita Income in West Falls is $38,543, while median incomes of families and households are $73,125 and $52,422 respectively.
| Characteristic | Number | Measure |
| Per Capita Income | 308 | $38,543 |
| Median Family Income | 93 | $73,125 |
| Mean Family Income | 93 | $100,925 |
| Median Household Income | 159 | $52,422 |
| Mean Household Income | 159 | $76,670 |
| Income Deficit | 93 | $0 |
| Wage / Income Gap (%) | 308 | 18.88% |
| Wage / Income Gap ($) | 308 | 81.12¢ per $1 |
| Gini / Inequality Index | 308 | 0.44 |
Earnings by Sex in West Falls
Average Earnings in West Falls are $50,500, $42,250 for men and $52,083 for women, a difference of 18.9%.
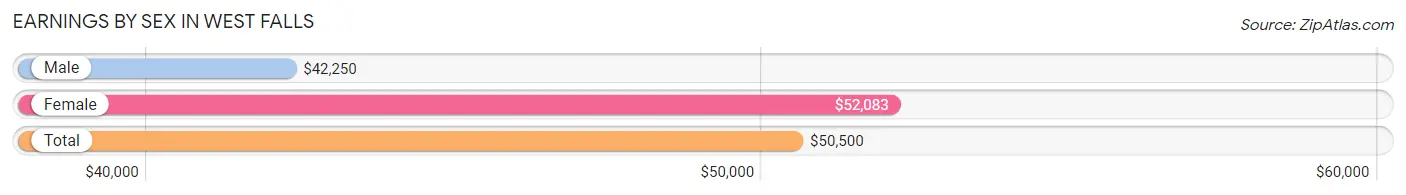
| Sex | Number | Average Earnings |
| Male | 81 (53.3%) | $42,250 |
| Female | 71 (46.7%) | $52,083 |
| Total | 152 (100.0%) | $50,500 |
Earnings by Sex by Income Bracket in West Falls
The most common earnings brackets in West Falls are $100,000+ for men (17 | 21.0%) and $50,000 to $54,999 for women (15 | 21.1%).
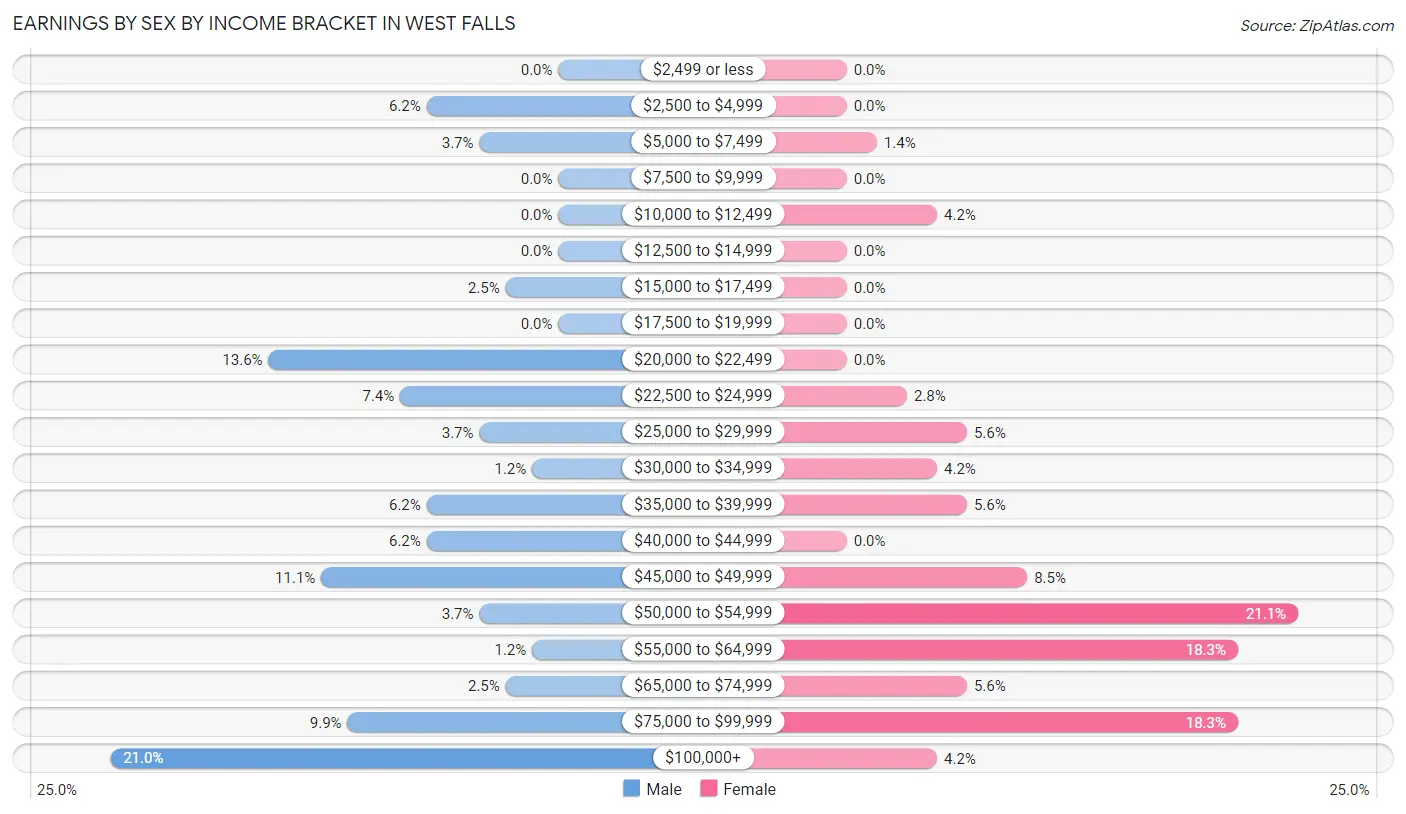
| Income | Male | Female |
| $2,499 or less | 0 (0.0%) | 0 (0.0%) |
| $2,500 to $4,999 | 5 (6.2%) | 0 (0.0%) |
| $5,000 to $7,499 | 3 (3.7%) | 1 (1.4%) |
| $7,500 to $9,999 | 0 (0.0%) | 0 (0.0%) |
| $10,000 to $12,499 | 0 (0.0%) | 3 (4.2%) |
| $12,500 to $14,999 | 0 (0.0%) | 0 (0.0%) |
| $15,000 to $17,499 | 2 (2.5%) | 0 (0.0%) |
| $17,500 to $19,999 | 0 (0.0%) | 0 (0.0%) |
| $20,000 to $22,499 | 11 (13.6%) | 0 (0.0%) |
| $22,500 to $24,999 | 6 (7.4%) | 2 (2.8%) |
| $25,000 to $29,999 | 3 (3.7%) | 4 (5.6%) |
| $30,000 to $34,999 | 1 (1.2%) | 3 (4.2%) |
| $35,000 to $39,999 | 5 (6.2%) | 4 (5.6%) |
| $40,000 to $44,999 | 5 (6.2%) | 0 (0.0%) |
| $45,000 to $49,999 | 9 (11.1%) | 6 (8.5%) |
| $50,000 to $54,999 | 3 (3.7%) | 15 (21.1%) |
| $55,000 to $64,999 | 1 (1.2%) | 13 (18.3%) |
| $65,000 to $74,999 | 2 (2.5%) | 4 (5.6%) |
| $75,000 to $99,999 | 8 (9.9%) | 13 (18.3%) |
| $100,000+ | 17 (21.0%) | 3 (4.2%) |
| Total | 81 (100.0%) | 71 (100.0%) |
Earnings by Sex by Educational Attainment in West Falls
Average earnings in West Falls are $46,111 for men and $52,083 for women, a difference of 11.5%. Men with an educational attainment of college or associate's degree enjoy the highest average annual earnings of $83,333, while those with high school diploma education earn the least with $41,750. Women with an educational attainment of bachelor's degree earn the most with the average annual earnings of $78,571, while those with high school diploma education have the smallest earnings of $50,673.
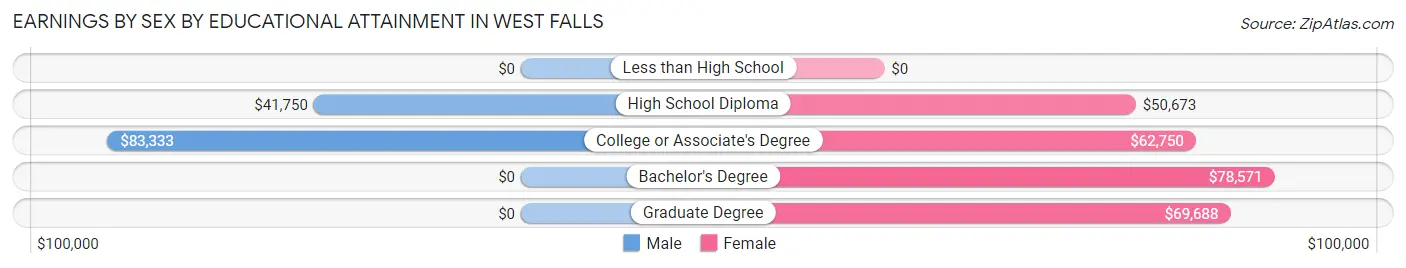
| Educational Attainment | Male Income | Female Income |
| Less than High School | - | - |
| High School Diploma | $41,750 | $50,673 |
| College or Associate's Degree | $83,333 | $62,750 |
| Bachelor's Degree | - | - |
| Graduate Degree | - | - |
| Total | $46,111 | $52,083 |
Family Income in West Falls
Family Income Brackets in West Falls
According to the West Falls family income data, there are 22 families falling into the $50,000 to $74,999 income range, which is the most common income bracket and makes up 23.7% of all families.
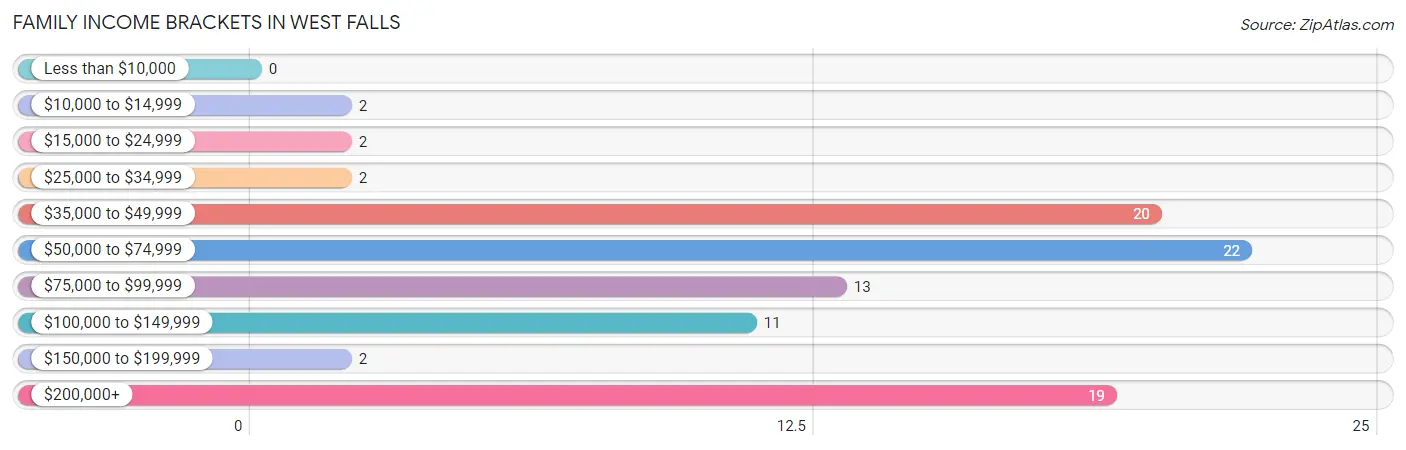
| Income Bracket | # Families | % Families |
| Less than $10,000 | 0 | 0.0% |
| $10,000 to $14,999 | 2 | 2.2% |
| $15,000 to $24,999 | 2 | 2.2% |
| $25,000 to $34,999 | 2 | 2.2% |
| $35,000 to $49,999 | 20 | 21.5% |
| $50,000 to $74,999 | 22 | 23.7% |
| $75,000 to $99,999 | 13 | 14.0% |
| $100,000 to $149,999 | 11 | 11.8% |
| $150,000 to $199,999 | 2 | 2.2% |
| $200,000+ | 19 | 20.4% |
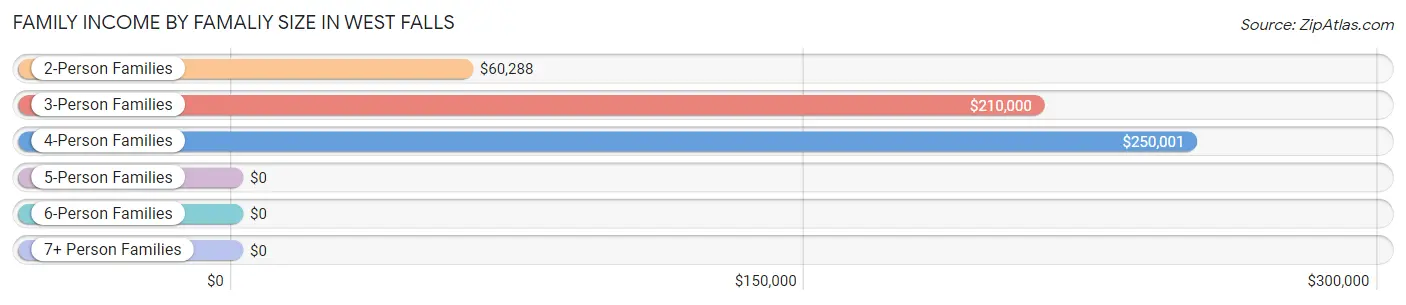
Family Income by Famaliy Size in West Falls
4-person families (7 | 7.5%) account for the highest median family income in West Falls with $250,001 per family, while 3-person families (26 | 28.0%) have the highest median income of $70,000 per family member.
| Income Bracket | # Families | Median Income |
| 2-Person Families | 57 (61.3%) | $60,288 |
| 3-Person Families | 26 (28.0%) | $210,000 |
| 4-Person Families | 7 (7.5%) | $250,001 |
| 5-Person Families | 3 (3.2%) | $0 |
| 6-Person Families | 0 (0.0%) | $0 |
| 7+ Person Families | 0 (0.0%) | $0 |
| Total | 93 (100.0%) | $73,125 |
Family Income by Number of Earners in West Falls
The median family income in West Falls is $73,125, with families comprising 2 earners (29) having the highest median family income of $214,583, while families with no earners (29) have the lowest median family income of $36,932, accounting for 31.2% and 31.2% of families, respectively.
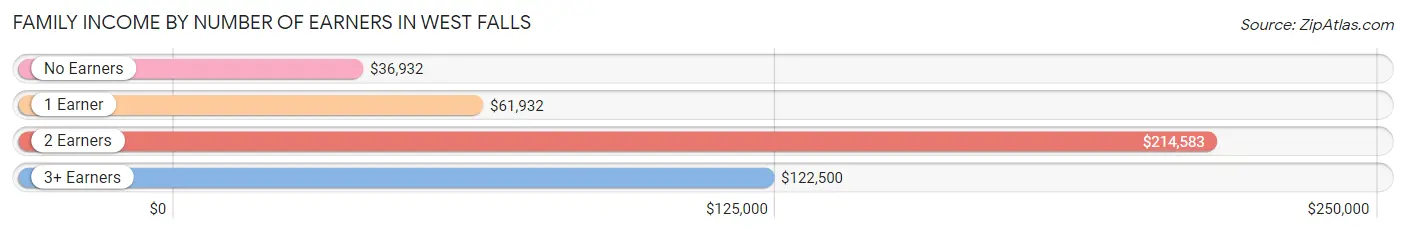
| Number of Earners | # Families | Median Income |
| No Earners | 29 (31.2%) | $36,932 |
| 1 Earner | 27 (29.0%) | $61,932 |
| 2 Earners | 29 (31.2%) | $214,583 |
| 3+ Earners | 8 (8.6%) | $122,500 |
| Total | 93 (100.0%) | $73,125 |
Household Income in West Falls
Household Income Brackets in West Falls
With 42 households falling in the category, the $50,000 to $74,999 income range is the most frequent in West Falls, accounting for 26.4% of all households. In contrast, only 2 households (1.3%) fall into the $150,000 to $199,999 income bracket, making it the least populous group.
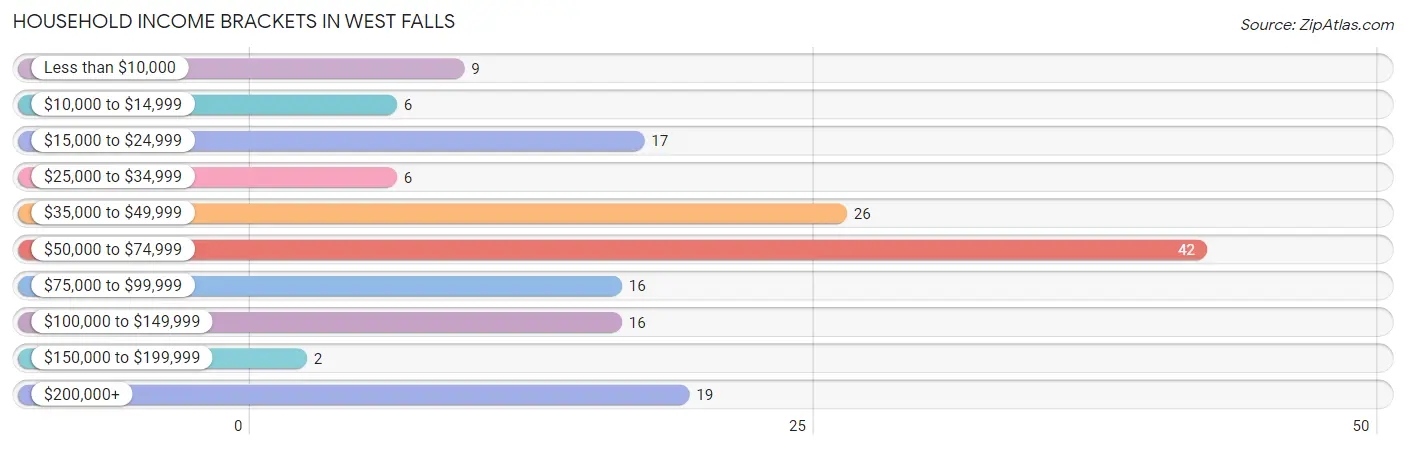
| Income Bracket | # Households | % Households |
| Less than $10,000 | 9 | 5.7% |
| $10,000 to $14,999 | 6 | 3.8% |
| $15,000 to $24,999 | 17 | 10.7% |
| $25,000 to $34,999 | 6 | 3.8% |
| $35,000 to $49,999 | 26 | 16.4% |
| $50,000 to $74,999 | 42 | 26.4% |
| $75,000 to $99,999 | 16 | 10.1% |
| $100,000 to $149,999 | 16 | 10.1% |
| $150,000 to $199,999 | 2 | 1.3% |
| $200,000+ | 19 | 11.9% |
Household Income by Householder Age in West Falls
The median household income in West Falls is $52,422, with the highest median household income of $225,125 found in the 25 to 44 years age bracket for the primary householder. A total of 19 households (11.9%) fall into this category.
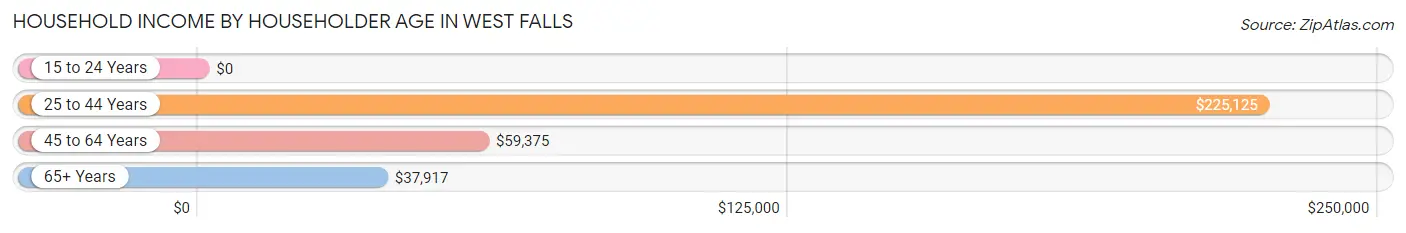
| Income Bracket | # Households | Median Income |
| 15 to 24 Years | 0 (0.0%) | $0 |
| 25 to 44 Years | 19 (11.9%) | $225,125 |
| 45 to 64 Years | 73 (45.9%) | $59,375 |
| 65+ Years | 67 (42.1%) | $37,917 |
| Total | 159 (100.0%) | $52,422 |
Poverty in West Falls
Income Below Poverty by Sex and Age in West Falls
With 6.6% poverty level for males and 10.9% for females among the residents of West Falls, 55 to 64 year old males and 18 to 24 year old females are the most vulnerable to poverty, with 7 males (23.3%) and 3 females (60.0%) in their respective age groups living below the poverty level.
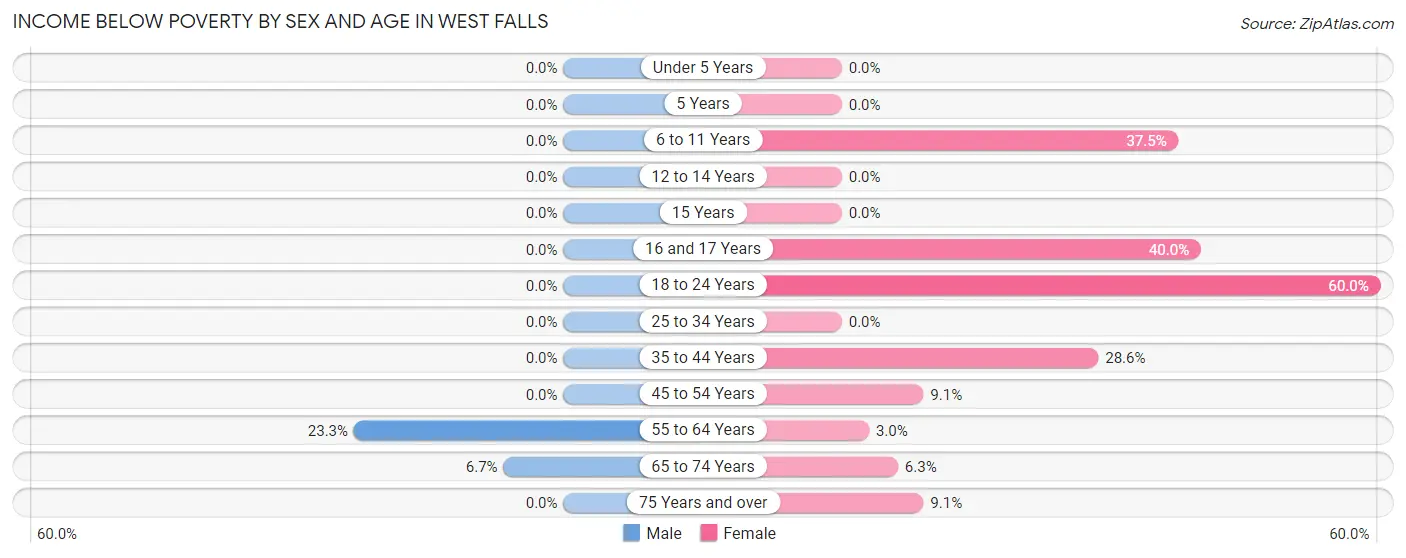
| Age Bracket | Male | Female |
| Under 5 Years | 0 (0.0%) | 0 (0.0%) |
| 5 Years | 0 (0.0%) | 0 (0.0%) |
| 6 to 11 Years | 0 (0.0%) | 3 (37.5%) |
| 12 to 14 Years | 0 (0.0%) | 0 (0.0%) |
| 15 Years | 0 (0.0%) | 0 (0.0%) |
| 16 and 17 Years | 0 (0.0%) | 2 (40.0%) |
| 18 to 24 Years | 0 (0.0%) | 3 (60.0%) |
| 25 to 34 Years | 0 (0.0%) | 0 (0.0%) |
| 35 to 44 Years | 0 (0.0%) | 2 (28.6%) |
| 45 to 54 Years | 0 (0.0%) | 2 (9.1%) |
| 55 to 64 Years | 7 (23.3%) | 1 (3.0%) |
| 65 to 74 Years | 3 (6.7%) | 2 (6.2%) |
| 75 Years and over | 0 (0.0%) | 2 (9.1%) |
| Total | 10 (6.6%) | 17 (10.9%) |
Income Above Poverty by Sex and Age in West Falls
According to the poverty statistics in West Falls, males aged under 5 years and females aged 12 to 14 years are the age groups that are most secure financially, with 100.0% of males and 100.0% of females in these age groups living above the poverty line.
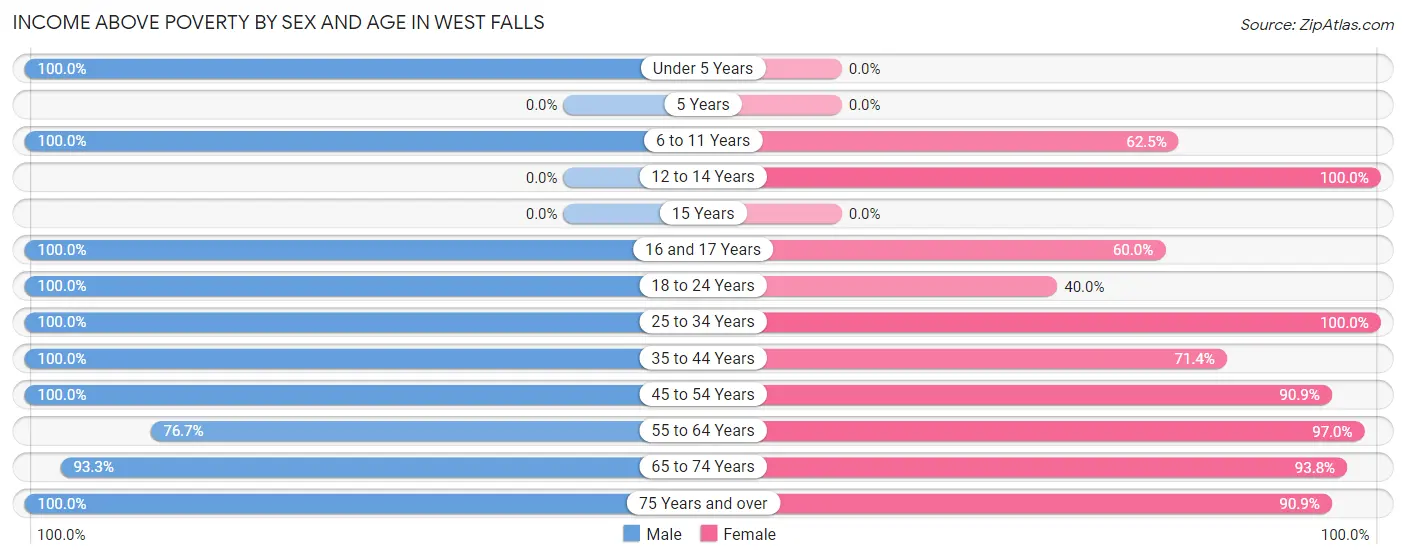
| Age Bracket | Male | Female |
| Under 5 Years | 5 (100.0%) | 0 (0.0%) |
| 5 Years | 0 (0.0%) | 0 (0.0%) |
| 6 to 11 Years | 9 (100.0%) | 5 (62.5%) |
| 12 to 14 Years | 0 (0.0%) | 8 (100.0%) |
| 15 Years | 0 (0.0%) | 0 (0.0%) |
| 16 and 17 Years | 3 (100.0%) | 3 (60.0%) |
| 18 to 24 Years | 11 (100.0%) | 2 (40.0%) |
| 25 to 34 Years | 8 (100.0%) | 14 (100.0%) |
| 35 to 44 Years | 8 (100.0%) | 5 (71.4%) |
| 45 to 54 Years | 24 (100.0%) | 20 (90.9%) |
| 55 to 64 Years | 23 (76.7%) | 32 (97.0%) |
| 65 to 74 Years | 42 (93.3%) | 30 (93.8%) |
| 75 Years and over | 9 (100.0%) | 20 (90.9%) |
| Total | 142 (93.4%) | 139 (89.1%) |
Income Below Poverty Among Married-Couple Families in West Falls
The poverty statistics for married-couple families in West Falls show that 2.4% or 2 of the total 84 families live below the poverty line. Families with no children have the highest poverty rate of 3.2%, comprising of 2 families. On the other hand, families with 1 or 2 children have the lowest poverty rate of 0.0%, which includes 0 families.
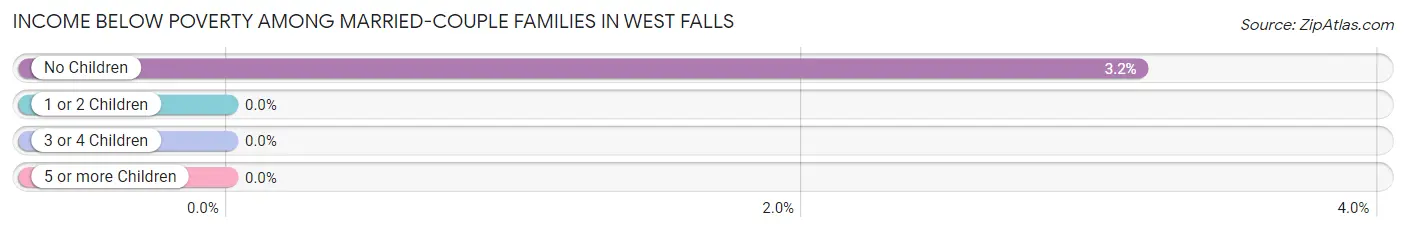
| Children | Above Poverty | Below Poverty |
| No Children | 61 (96.8%) | 2 (3.2%) |
| 1 or 2 Children | 21 (100.0%) | 0 (0.0%) |
| 3 or 4 Children | 0 (0.0%) | 0 (0.0%) |
| 5 or more Children | 0 (0.0%) | 0 (0.0%) |
| Total | 82 (97.6%) | 2 (2.4%) |
Income Below Poverty Among Single-Parent Households in West Falls
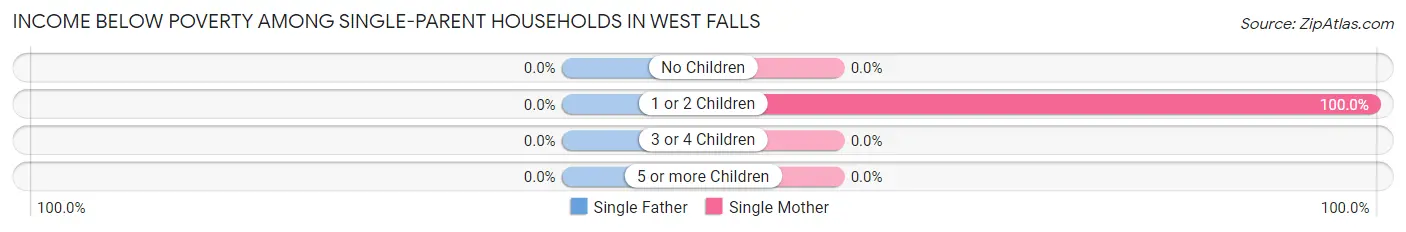
| Children | Single Father | Single Mother |
| No Children | 0 (0.0%) | 0 (0.0%) |
| 1 or 2 Children | 0 (0.0%) | 2 (100.0%) |
| 3 or 4 Children | 0 (0.0%) | 0 (0.0%) |
| 5 or more Children | 0 (0.0%) | 0 (0.0%) |
| Total | 0 (0.0%) | 2 (33.3%) |
Income Below Poverty Among Married-Couple vs Single-Parent Households in West Falls
The poverty data for West Falls shows that 2 of the married-couple family households (2.4%) and 2 of the single-parent households (22.2%) are living below the poverty level. Within the married-couple family households, those with no children have the highest poverty rate, with 2 households (3.2%) falling below the poverty line. Among the single-parent households, those with 1 or 2 children have the highest poverty rate, with 2 household (40.0%) living below poverty.
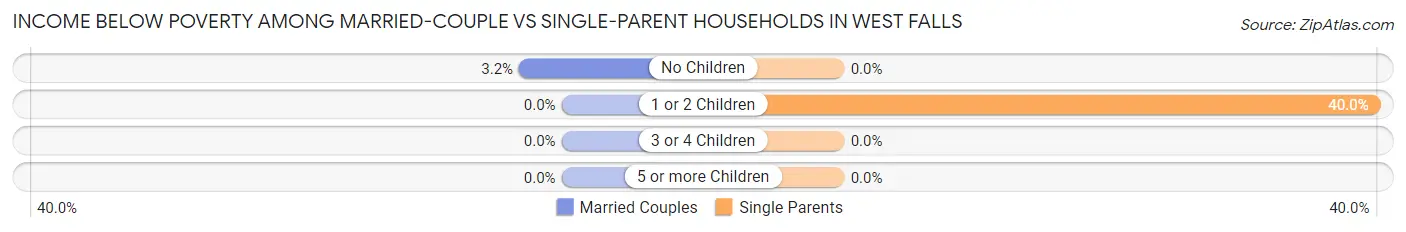
| Children | Married-Couple Families | Single-Parent Households |
| No Children | 2 (3.2%) | 0 (0.0%) |
| 1 or 2 Children | 0 (0.0%) | 2 (40.0%) |
| 3 or 4 Children | 0 (0.0%) | 0 (0.0%) |
| 5 or more Children | 0 (0.0%) | 0 (0.0%) |
| Total | 2 (2.4%) | 2 (22.2%) |
Race in West Falls
The most populous races in West Falls are White / Caucasian (304 | 98.7%), Hispanic or Latino (3 | 1.0%), and Two or more Races (3 | 1.0%).
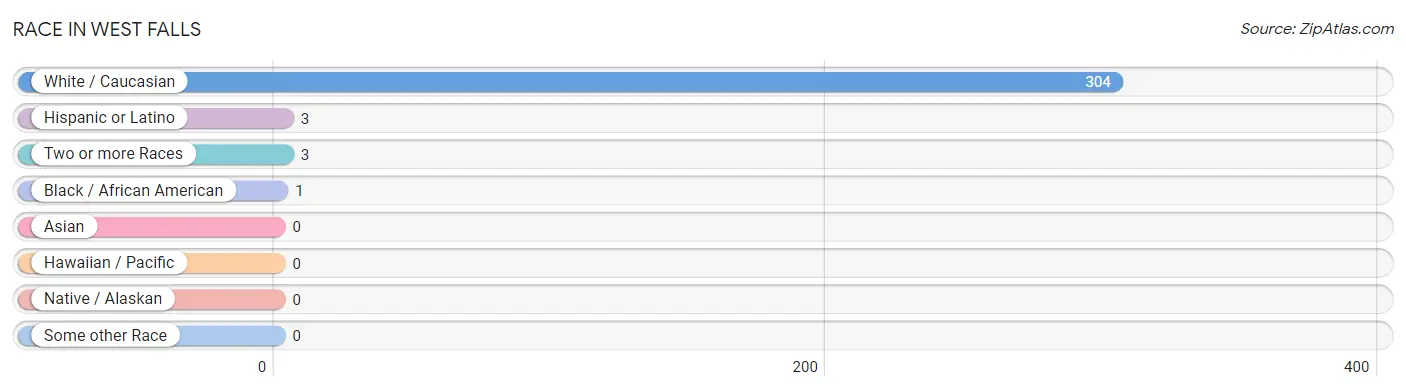
| Race | # Population | % Population |
| Asian | 0 | 0.0% |
| Black / African American | 1 | 0.3% |
| Hawaiian / Pacific | 0 | 0.0% |
| Hispanic or Latino | 3 | 1.0% |
| Native / Alaskan | 0 | 0.0% |
| White / Caucasian | 304 | 98.7% |
| Two or more Races | 3 | 1.0% |
| Some other Race | 0 | 0.0% |
| Total | 308 | 100.0% |
Ancestry in West Falls
The most populous ancestries reported in West Falls are Irish (58 | 18.8%), Polish (53 | 17.2%), German (51 | 16.6%), English (49 | 15.9%), and Welsh (34 | 11.0%), together accounting for 79.6% of all West Falls residents.
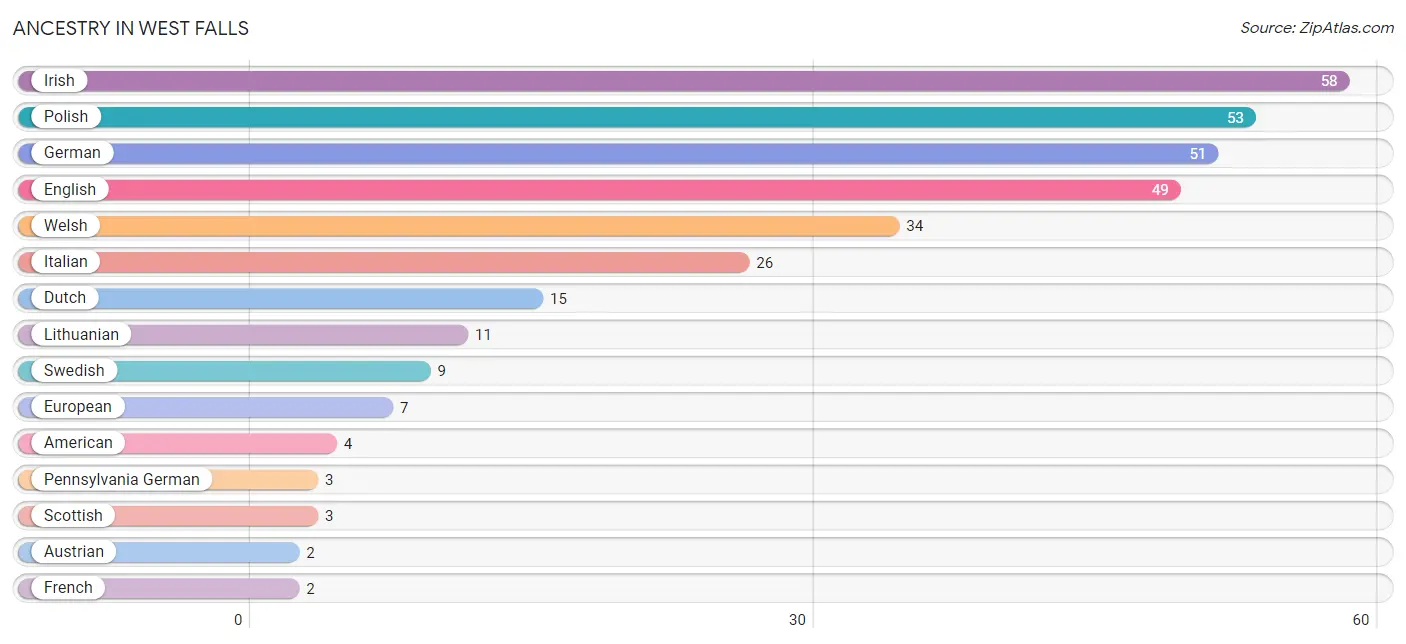
| Ancestry | # Population | % Population |
| African | 1 | 0.3% |
| American | 4 | 1.3% |
| Austrian | 2 | 0.6% |
| Cuban | 1 | 0.3% |
| Dutch | 15 | 4.9% |
| English | 49 | 15.9% |
| European | 7 | 2.3% |
| French | 2 | 0.6% |
| French Canadian | 2 | 0.6% |
| German | 51 | 16.6% |
| Irish | 58 | 18.8% |
| Italian | 26 | 8.4% |
| Lithuanian | 11 | 3.6% |
| Pennsylvania German | 3 | 1.0% |
| Polish | 53 | 17.2% |
| Puerto Rican | 2 | 0.6% |
| Scotch-Irish | 2 | 0.6% |
| Scottish | 3 | 1.0% |
| Slovak | 1 | 0.3% |
| Subsaharan African | 1 | 0.3% |
| Swedish | 9 | 2.9% |
| Welsh | 34 | 11.0% | View All 22 Rows |
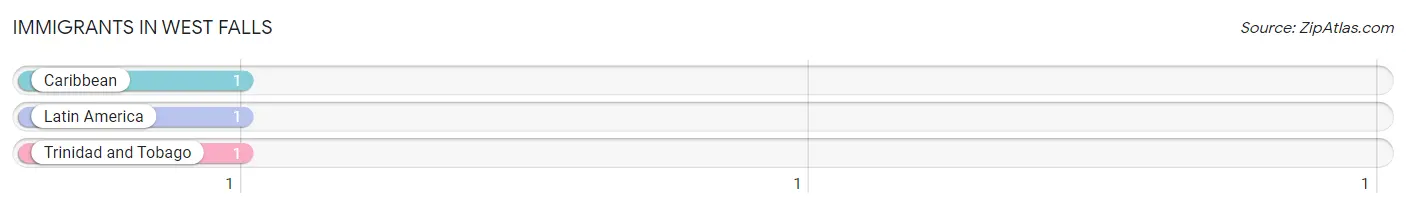
Immigrants in West Falls
The most numerous immigrant groups reported in West Falls came from Caribbean (1 | 0.3%), Latin America (1 | 0.3%), and Trinidad and Tobago (1 | 0.3%), together accounting for 1.0% of all West Falls residents.
| Immigration Origin | # Population | % Population |
| Caribbean | 1 | 0.3% |
| Latin America | 1 | 0.3% |
| Trinidad and Tobago | 1 | 0.3% | View All 3 Rows |
Sex and Age in West Falls
Sex and Age in West Falls
The most populous age groups in West Falls are 65 to 69 Years (31 | 20.4%) for men and 60 to 64 Years (25 | 16.0%) for women.
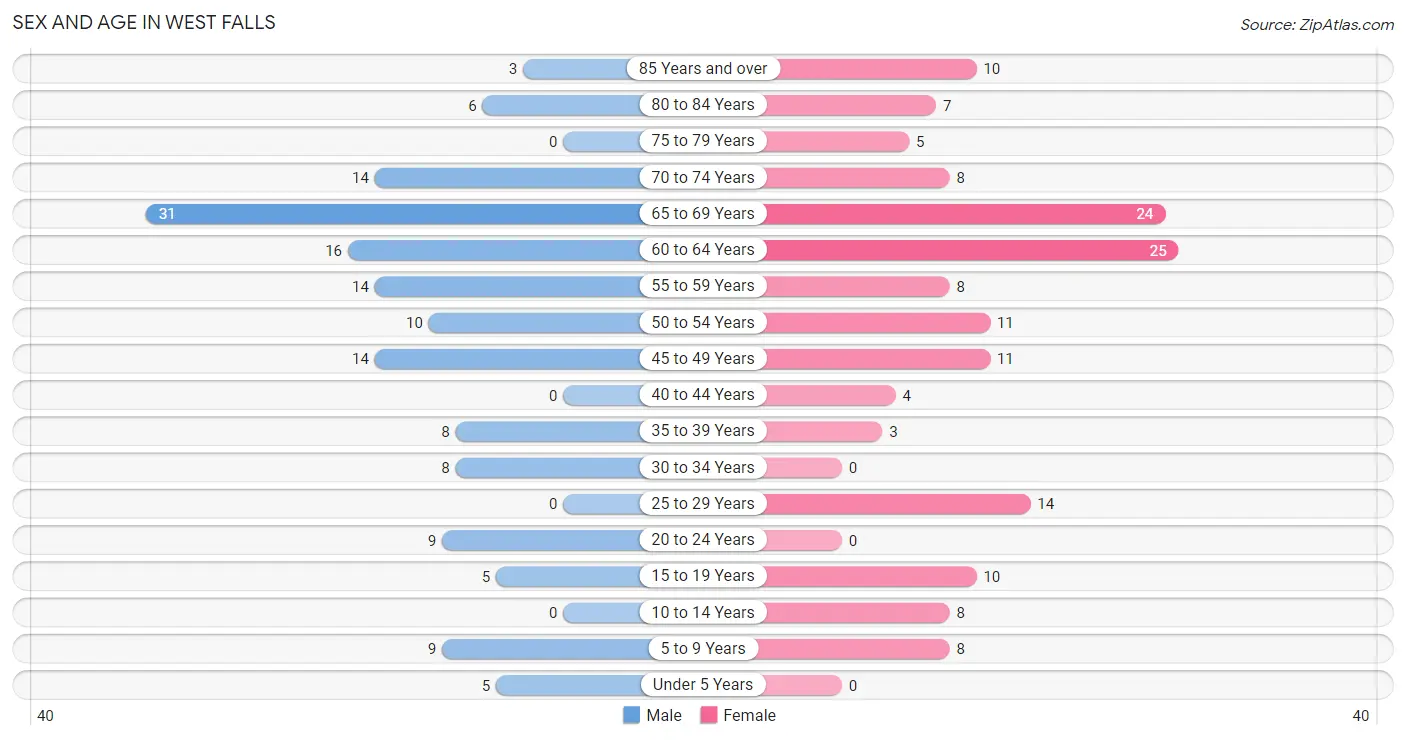
| Age Bracket | Male | Female |
| Under 5 Years | 5 (3.3%) | 0 (0.0%) |
| 5 to 9 Years | 9 (5.9%) | 8 (5.1%) |
| 10 to 14 Years | 0 (0.0%) | 8 (5.1%) |
| 15 to 19 Years | 5 (3.3%) | 10 (6.4%) |
| 20 to 24 Years | 9 (5.9%) | 0 (0.0%) |
| 25 to 29 Years | 0 (0.0%) | 14 (9.0%) |
| 30 to 34 Years | 8 (5.3%) | 0 (0.0%) |
| 35 to 39 Years | 8 (5.3%) | 3 (1.9%) |
| 40 to 44 Years | 0 (0.0%) | 4 (2.6%) |
| 45 to 49 Years | 14 (9.2%) | 11 (7.0%) |
| 50 to 54 Years | 10 (6.6%) | 11 (7.0%) |
| 55 to 59 Years | 14 (9.2%) | 8 (5.1%) |
| 60 to 64 Years | 16 (10.5%) | 25 (16.0%) |
| 65 to 69 Years | 31 (20.4%) | 24 (15.4%) |
| 70 to 74 Years | 14 (9.2%) | 8 (5.1%) |
| 75 to 79 Years | 0 (0.0%) | 5 (3.2%) |
| 80 to 84 Years | 6 (4.0%) | 7 (4.5%) |
| 85 Years and over | 3 (2.0%) | 10 (6.4%) |
| Total | 152 (100.0%) | 156 (100.0%) |
Families and Households in West Falls
Median Family Size in West Falls
The median family size in West Falls is 2.49 persons per family, with single male/father families (3 | 3.2%) accounting for the largest median family size of 4.33 persons per family. On the other hand, married-couple families (84 | 90.3%) represent the smallest median family size with 2.43 persons per family.
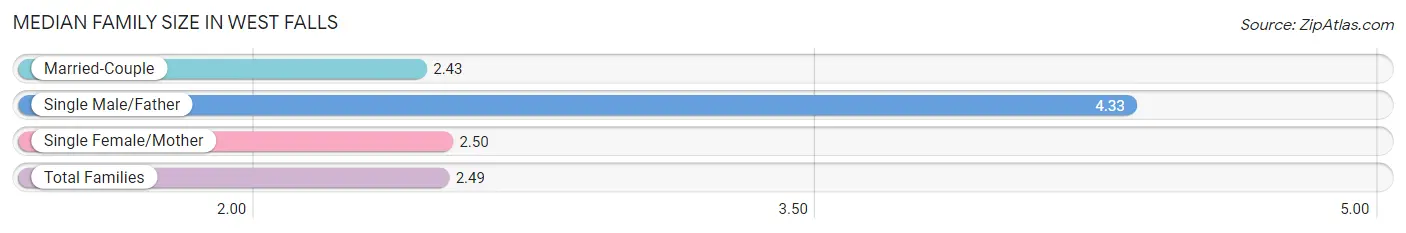
| Family Type | # Families | Family Size |
| Married-Couple | 84 (90.3%) | 2.43 |
| Single Male/Father | 3 (3.2%) | 4.33 |
| Single Female/Mother | 6 (6.5%) | 2.50 |
| Total Families | 93 (100.0%) | 2.49 |
Median Household Size in West Falls
The median household size in West Falls is 1.94 persons per household, with single male/father households (3 | 1.9%) accounting for the largest median household size of 4.33 persons per household. non-family households (66 | 41.5%) represent the smallest median household size with 1.11 persons per household.
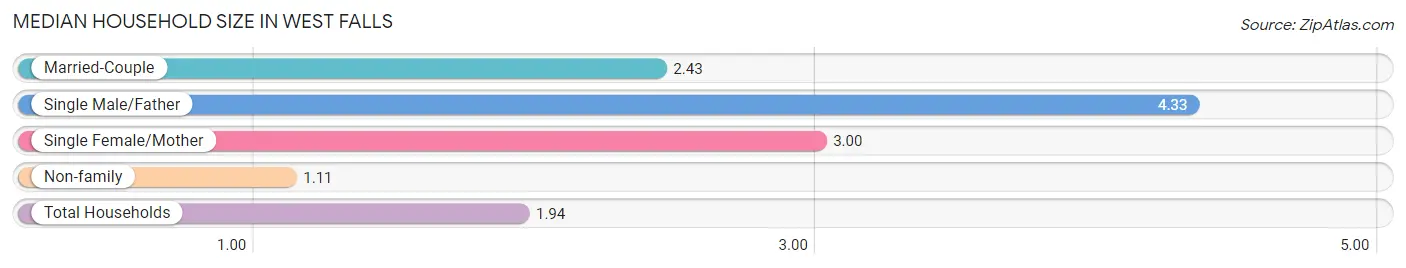
| Household Type | # Households | Household Size |
| Married-Couple | 84 (52.8%) | 2.43 |
| Single Male/Father | 3 (1.9%) | 4.33 |
| Single Female/Mother | 6 (3.8%) | 3.00 |
| Non-family | 66 (41.5%) | 1.11 |
| Total Households | 159 (100.0%) | 1.94 |
Household Size by Marriage Status in West Falls
Out of a total of 159 households in West Falls, 93 (58.5%) are family households, while 66 (41.5%) are nonfamily households. The most numerous type of family households are 2-person households, comprising 55, and the most common type of nonfamily households are 1-person households, comprising 63.
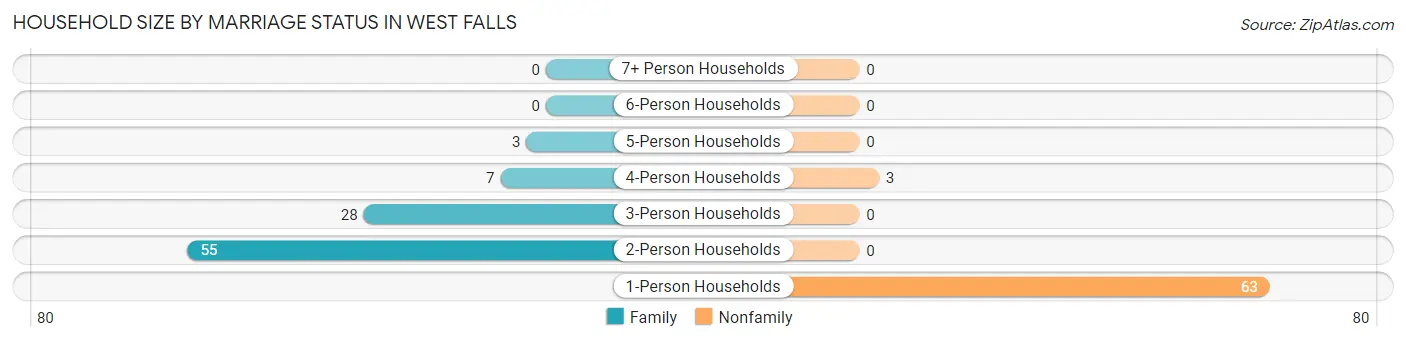
| Household Size | Family Households | Nonfamily Households |
| 1-Person Households | - | 63 (39.6%) |
| 2-Person Households | 55 (34.6%) | 0 (0.0%) |
| 3-Person Households | 28 (17.6%) | 0 (0.0%) |
| 4-Person Households | 7 (4.4%) | 3 (1.9%) |
| 5-Person Households | 3 (1.9%) | 0 (0.0%) |
| 6-Person Households | 0 (0.0%) | 0 (0.0%) |
| 7+ Person Households | 0 (0.0%) | 0 (0.0%) |
| Total | 93 (58.5%) | 66 (41.5%) |
Female Fertility in West Falls
Fertility by Age in West Falls
Average fertility rate in West Falls is 71.0 births per 1,000 women. Women in the age bracket of 35 to 50 years have the highest fertility rate with 167.0 births per 1,000 women. Women in the age bracket of 35 to 50 years acount for 100.0% of all women with births.
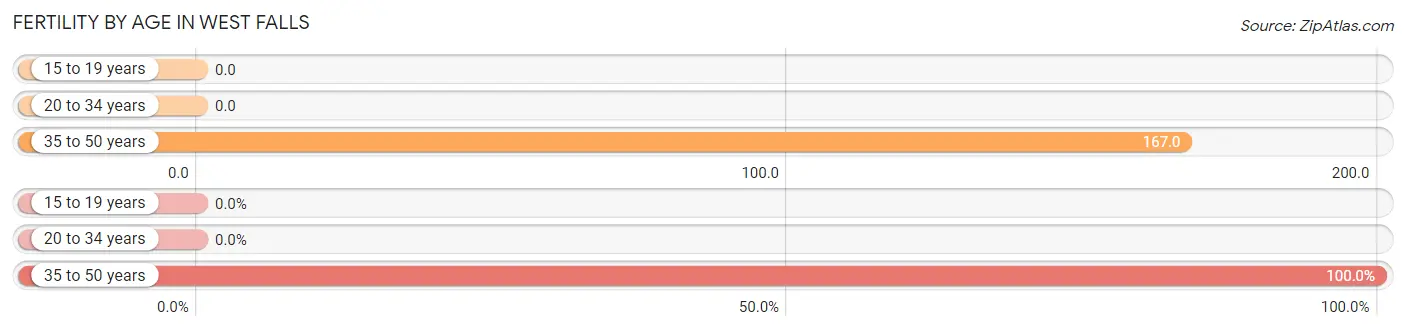
| Age Bracket | Women with Births | Births / 1,000 Women |
| 15 to 19 years | 0 (0.0%) | 0.0 |
| 20 to 34 years | 0 (0.0%) | 0.0 |
| 35 to 50 years | 3 (100.0%) | 167.0 |
| Total | 3 (100.0%) | 71.0 |
Fertility by Age by Marriage Status in West Falls
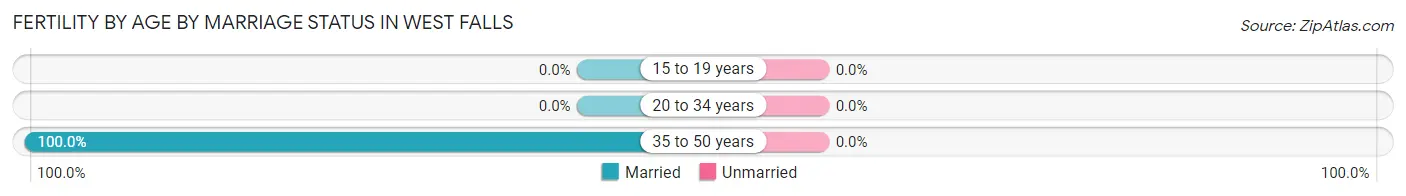
| Age Bracket | Married | Unmarried |
| 15 to 19 years | 0 (0.0%) | 0 (0.0%) |
| 20 to 34 years | 0 (0.0%) | 0 (0.0%) |
| 35 to 50 years | 3 (100.0%) | 0 (0.0%) |
| Total | 3 (100.0%) | 0 (0.0%) |
Fertility by Education in West Falls
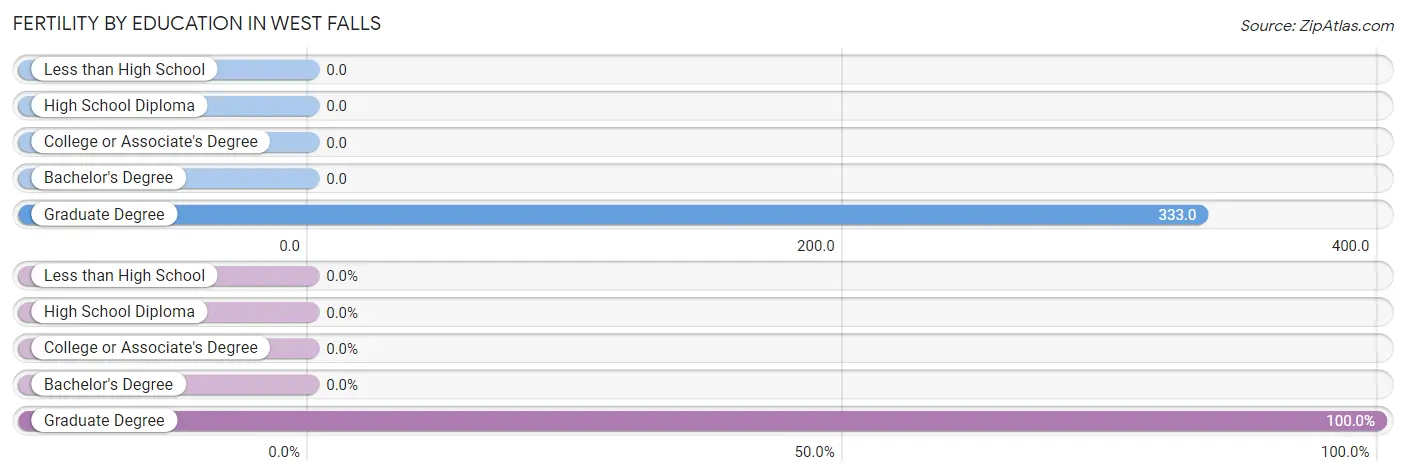
| Educational Attainment | Women with Births | Births / 1,000 Women |
| Less than High School | 0 (0.0%) | 0.0 |
| High School Diploma | 0 (0.0%) | 0.0 |
| College or Associate's Degree | 0 (0.0%) | 0.0 |
| Bachelor's Degree | 0 (0.0%) | 0.0 |
| Graduate Degree | 3 (100.0%) | 333.0 |
| Total | 3 (100.0%) | 71.0 |
Fertility by Education by Marriage Status in West Falls
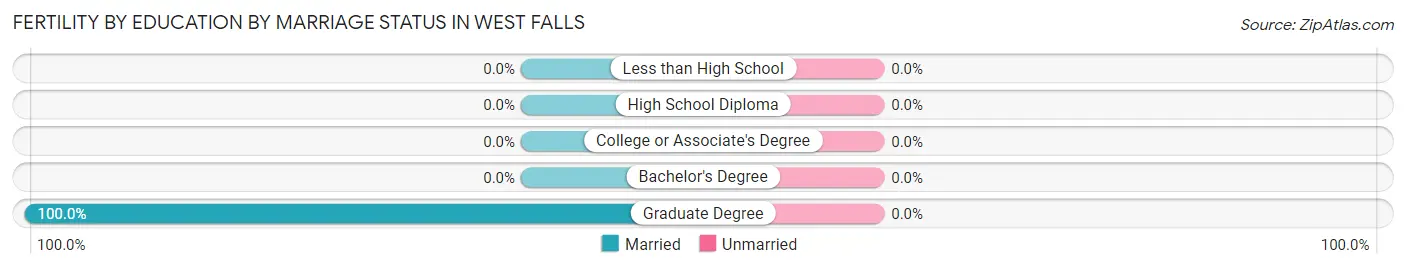
| Educational Attainment | Married | Unmarried |
| Less than High School | 0 (0.0%) | 0 (0.0%) |
| High School Diploma | 0 (0.0%) | 0 (0.0%) |
| College or Associate's Degree | 0 (0.0%) | 0 (0.0%) |
| Bachelor's Degree | 0 (0.0%) | 0 (0.0%) |
| Graduate Degree | 3 (100.0%) | 0 (0.0%) |
| Total | 3 (100.0%) | 0 (0.0%) |
Employment Characteristics in West Falls
Employment by Class of Employer in West Falls
Among the 137 employed individuals in West Falls, private company employees (106 | 77.4%), federal government employees (9 | 6.6%), and local government employees (6 | 4.4%) make up the most common classes of employment.
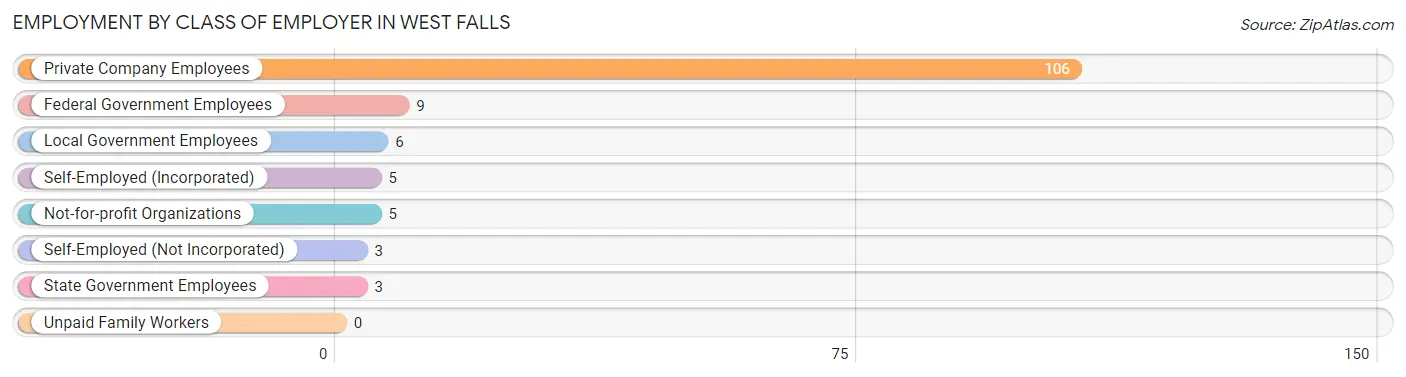
| Employer Class | # Employees | % Employees |
| Private Company Employees | 106 | 77.4% |
| Self-Employed (Incorporated) | 5 | 3.6% |
| Self-Employed (Not Incorporated) | 3 | 2.2% |
| Not-for-profit Organizations | 5 | 3.6% |
| Local Government Employees | 6 | 4.4% |
| State Government Employees | 3 | 2.2% |
| Federal Government Employees | 9 | 6.6% |
| Unpaid Family Workers | 0 | 0.0% |
| Total | 137 | 100.0% |
Employment Status by Age in West Falls
According to the labor force statistics for West Falls, out of the total population over 16 years of age (278), 54.0% or 150 individuals are in the labor force, with 8.8% or 13 of them unemployed. The age group with the highest labor force participation rate is 20 to 24 years, with 100.0% or 9 individuals in the labor force. Within the labor force, the 65 to 74 years age range has the highest percentage of unemployed individuals, with 61.1% or 11 of them being unemployed.
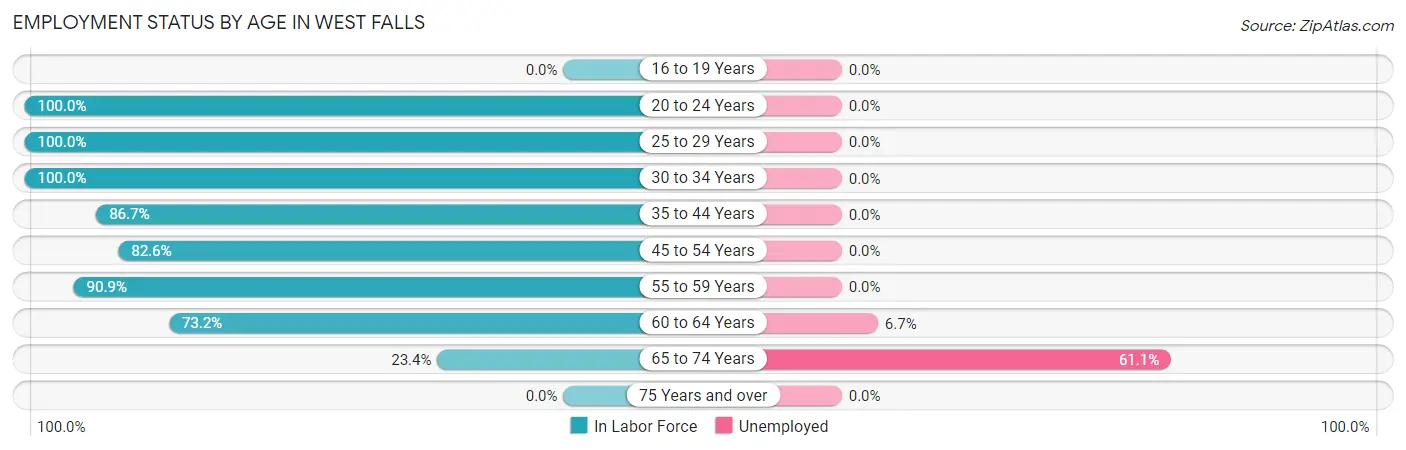
| Age Bracket | In Labor Force | Unemployed |
| 16 to 19 Years | 0 (0.0%) | 0 (0.0%) |
| 20 to 24 Years | 9 (100.0%) | 0 (0.0%) |
| 25 to 29 Years | 14 (100.0%) | 0 (0.0%) |
| 30 to 34 Years | 8 (100.0%) | 0 (0.0%) |
| 35 to 44 Years | 13 (86.7%) | 0 (0.0%) |
| 45 to 54 Years | 38 (82.6%) | 0 (0.0%) |
| 55 to 59 Years | 20 (90.9%) | 0 (0.0%) |
| 60 to 64 Years | 30 (73.2%) | 2 (6.7%) |
| 65 to 74 Years | 18 (23.4%) | 11 (61.1%) |
| 75 Years and over | 0 (0.0%) | 0 (0.0%) |
| Total | 150 (54.0%) | 13 (8.8%) |
Employment Status by Educational Attainment in West Falls
According to labor force statistics for West Falls, 84.2% of individuals (123) out of the total population between 25 and 64 years of age (146) are in the labor force, with 1.6% or 2 of them being unemployed. The group with the highest labor force participation rate are those with the educational attainment of bachelor's degree or higher, with 96.3% or 52 individuals in the labor force. Within the labor force, individuals with high school diploma education have the highest percentage of unemployment, with 4.9% or 2 of them being unemployed.
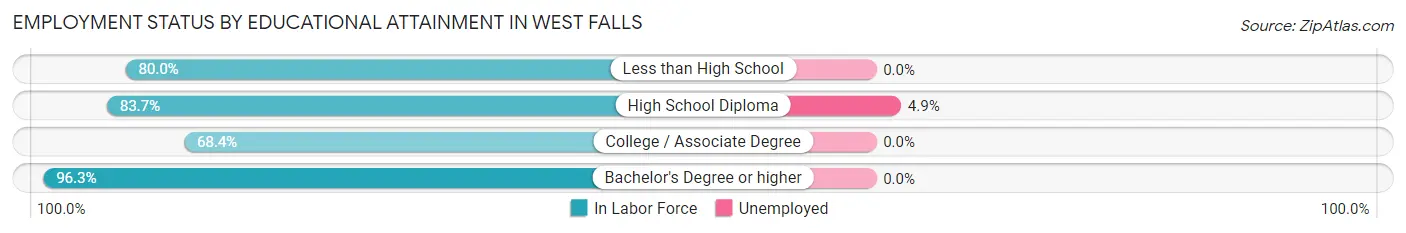
| Educational Attainment | In Labor Force | Unemployed |
| Less than High School | 4 (80.0%) | 0 (0.0%) |
| High School Diploma | 41 (83.7%) | 2 (4.9%) |
| College / Associate Degree | 26 (68.4%) | 0 (0.0%) |
| Bachelor's Degree or higher | 52 (96.3%) | 0 (0.0%) |
| Total | 123 (84.2%) | 2 (1.6%) |
Employment Occupations by Sex in West Falls
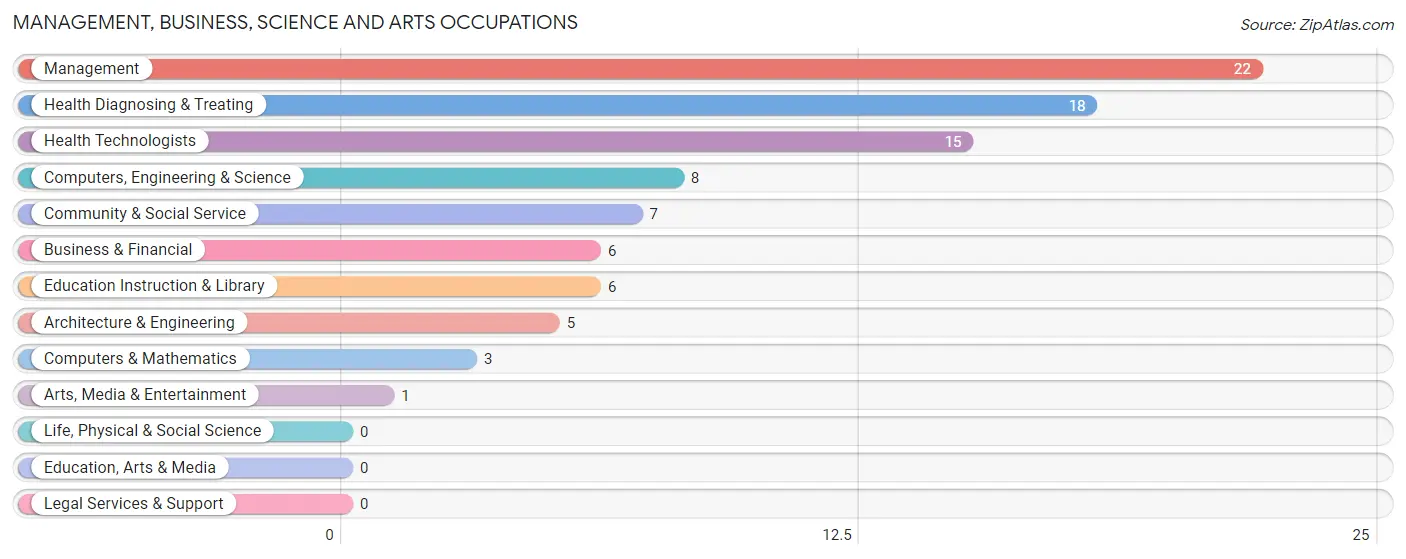
Management, Business, Science and Arts Occupations
The most common Management, Business, Science and Arts occupations in West Falls are Management (22 | 16.4%), Health Diagnosing & Treating (18 | 13.4%), Health Technologists (15 | 11.2%), Computers, Engineering & Science (8 | 6.0%), and Community & Social Service (7 | 5.2%).
Management, Business, Science and Arts Occupations by Sex
Within the Management, Business, Science and Arts occupations in West Falls, the most male-oriented occupations are Computers & Mathematics (100.0%), Computers, Engineering & Science (75.0%), and Management (72.7%), while the most female-oriented occupations are Arts, Media & Entertainment (100.0%), Health Technologists (100.0%), and Health Diagnosing & Treating (83.3%).
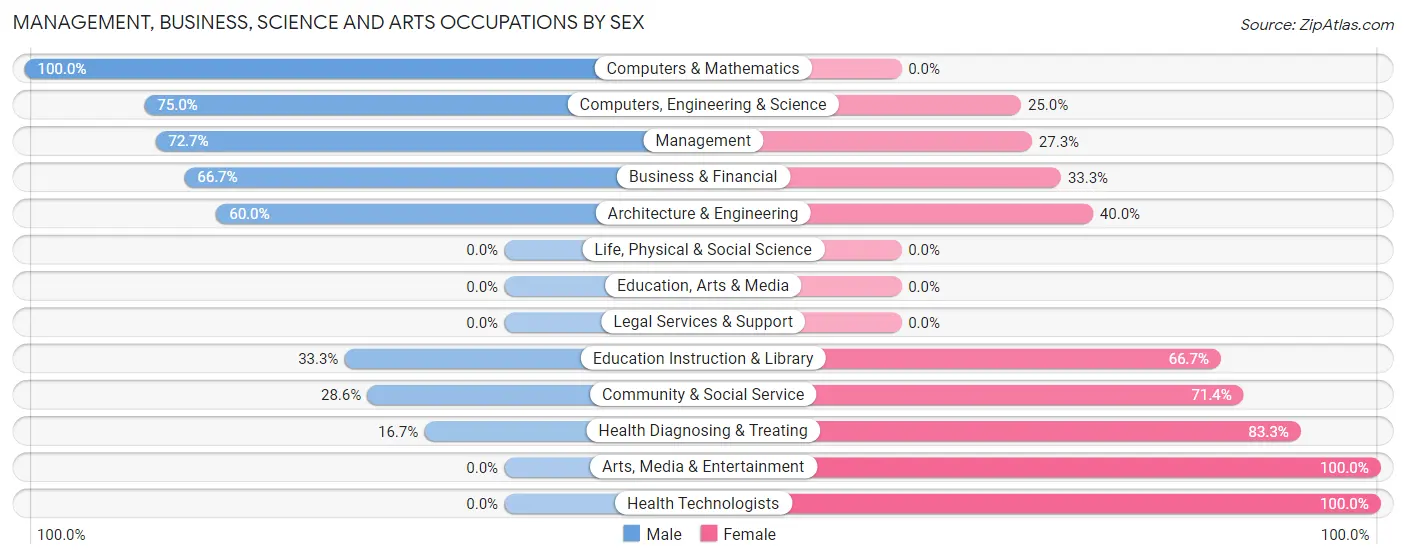
| Occupation | Male | Female |
| Management | 16 (72.7%) | 6 (27.3%) |
| Business & Financial | 4 (66.7%) | 2 (33.3%) |
| Computers, Engineering & Science | 6 (75.0%) | 2 (25.0%) |
| Computers & Mathematics | 3 (100.0%) | 0 (0.0%) |
| Architecture & Engineering | 3 (60.0%) | 2 (40.0%) |
| Life, Physical & Social Science | 0 (0.0%) | 0 (0.0%) |
| Community & Social Service | 2 (28.6%) | 5 (71.4%) |
| Education, Arts & Media | 0 (0.0%) | 0 (0.0%) |
| Legal Services & Support | 0 (0.0%) | 0 (0.0%) |
| Education Instruction & Library | 2 (33.3%) | 4 (66.7%) |
| Arts, Media & Entertainment | 0 (0.0%) | 1 (100.0%) |
| Health Diagnosing & Treating | 3 (16.7%) | 15 (83.3%) |
| Health Technologists | 0 (0.0%) | 15 (100.0%) |
| Total (Category) | 31 (50.8%) | 30 (49.2%) |
| Total (Overall) | 67 (50.0%) | 67 (50.0%) |
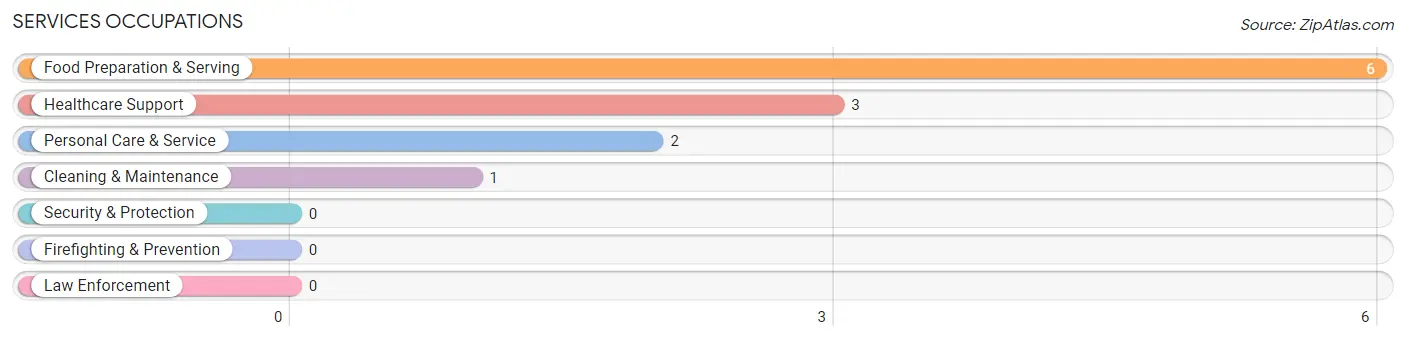
Services Occupations
The most common Services occupations in West Falls are Food Preparation & Serving (6 | 4.5%), Healthcare Support (3 | 2.2%), Personal Care & Service (2 | 1.5%), and Cleaning & Maintenance (1 | 0.7%).
Services Occupations by Sex
Within the Services occupations in West Falls, the most male-oriented occupations are Personal Care & Service (100.0%), and Food Preparation & Serving (83.3%), while the most female-oriented occupations are Healthcare Support (100.0%), Cleaning & Maintenance (100.0%), and Food Preparation & Serving (16.7%).
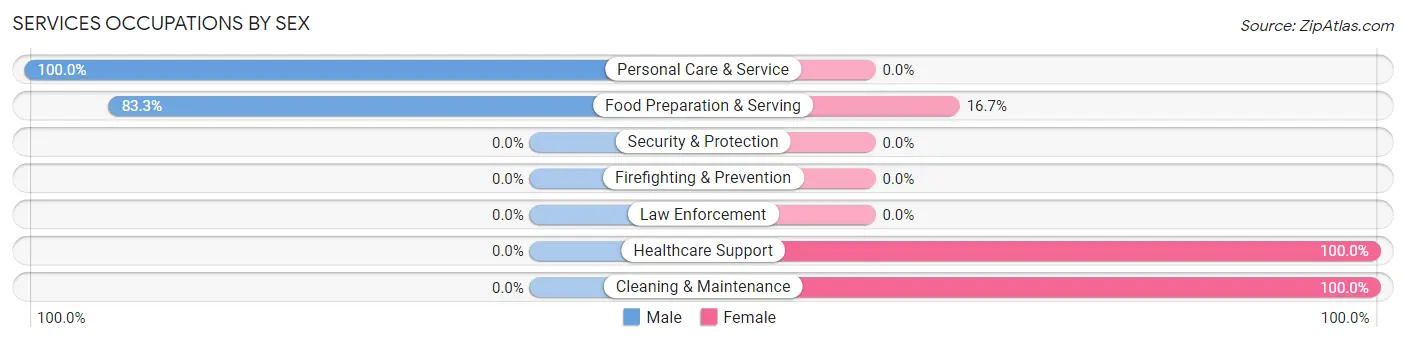
| Occupation | Male | Female |
| Healthcare Support | 0 (0.0%) | 3 (100.0%) |
| Security & Protection | 0 (0.0%) | 0 (0.0%) |
| Firefighting & Prevention | 0 (0.0%) | 0 (0.0%) |
| Law Enforcement | 0 (0.0%) | 0 (0.0%) |
| Food Preparation & Serving | 5 (83.3%) | 1 (16.7%) |
| Cleaning & Maintenance | 0 (0.0%) | 1 (100.0%) |
| Personal Care & Service | 2 (100.0%) | 0 (0.0%) |
| Total (Category) | 7 (58.3%) | 5 (41.7%) |
| Total (Overall) | 67 (50.0%) | 67 (50.0%) |
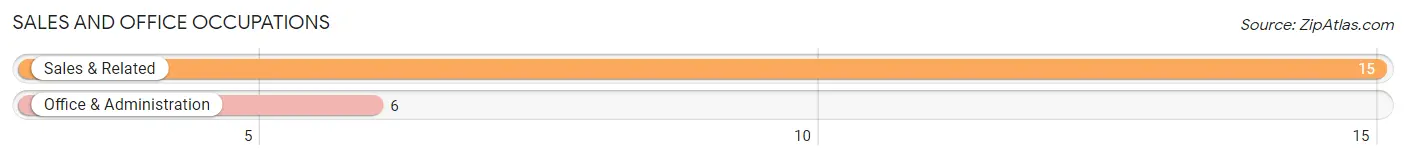
Sales and Office Occupations
The most common Sales and Office occupations in West Falls are Sales & Related (15 | 11.2%), and Office & Administration (6 | 4.5%).
Sales and Office Occupations by Sex
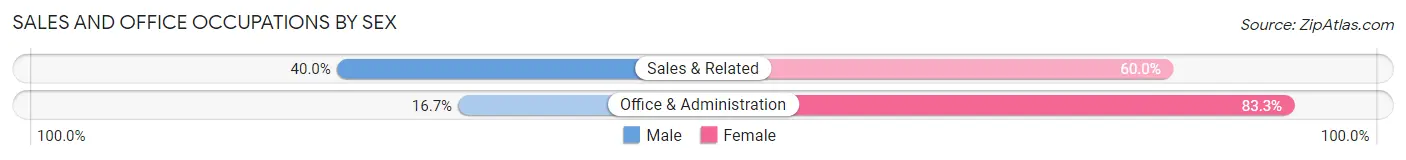
| Occupation | Male | Female |
| Sales & Related | 6 (40.0%) | 9 (60.0%) |
| Office & Administration | 1 (16.7%) | 5 (83.3%) |
| Total (Category) | 7 (33.3%) | 14 (66.7%) |
| Total (Overall) | 67 (50.0%) | 67 (50.0%) |
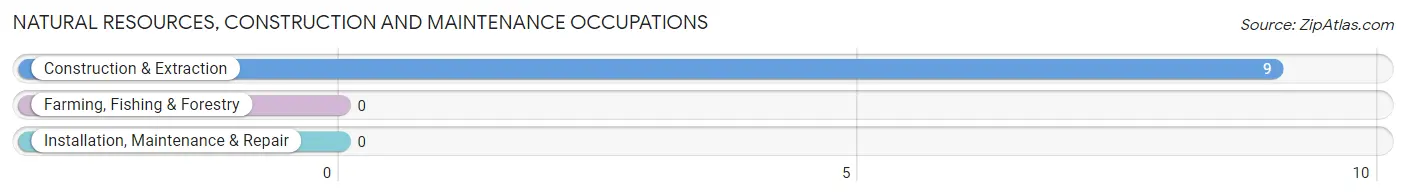
Natural Resources, Construction and Maintenance Occupations
The most common Natural Resources, Construction and Maintenance occupations in West Falls are , and Construction & Extraction (9 | 6.7%).
Natural Resources, Construction and Maintenance Occupations by Sex
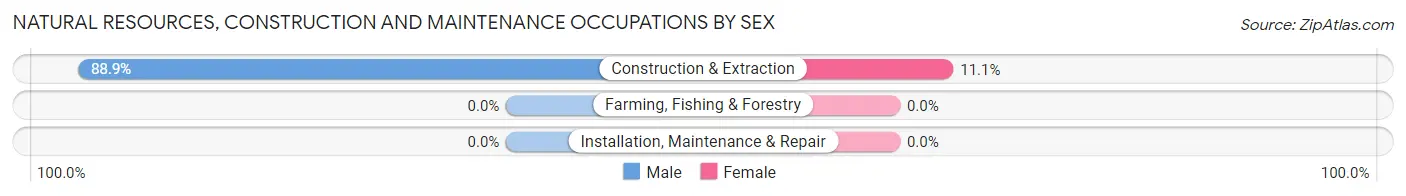
| Occupation | Male | Female |
| Farming, Fishing & Forestry | 0 (0.0%) | 0 (0.0%) |
| Construction & Extraction | 8 (88.9%) | 1 (11.1%) |
| Installation, Maintenance & Repair | 0 (0.0%) | 0 (0.0%) |
| Total (Category) | 8 (88.9%) | 1 (11.1%) |
| Total (Overall) | 67 (50.0%) | 67 (50.0%) |
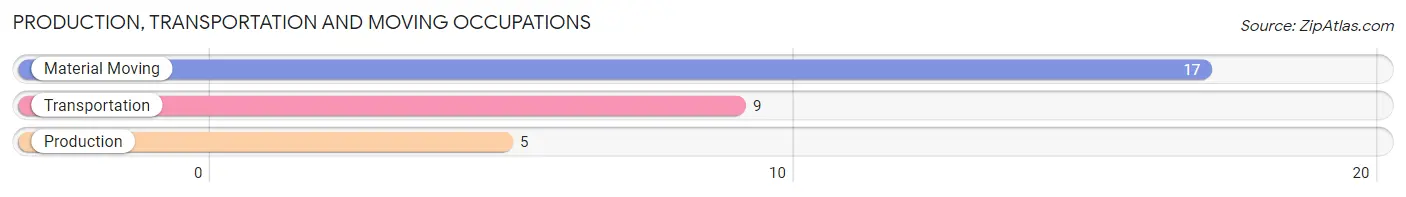
Production, Transportation and Moving Occupations
The most common Production, Transportation and Moving occupations in West Falls are Material Moving (17 | 12.7%), Transportation (9 | 6.7%), and Production (5 | 3.7%).
Production, Transportation and Moving Occupations by Sex
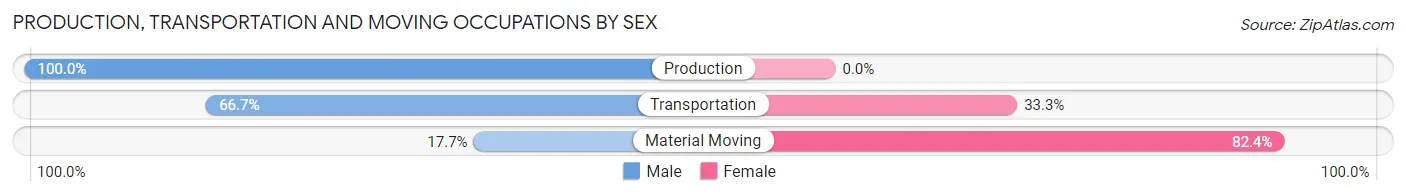
| Occupation | Male | Female |
| Production | 5 (100.0%) | 0 (0.0%) |
| Transportation | 6 (66.7%) | 3 (33.3%) |
| Material Moving | 3 (17.6%) | 14 (82.4%) |
| Total (Category) | 14 (45.2%) | 17 (54.8%) |
| Total (Overall) | 67 (50.0%) | 67 (50.0%) |
Employment Industries by Sex in West Falls
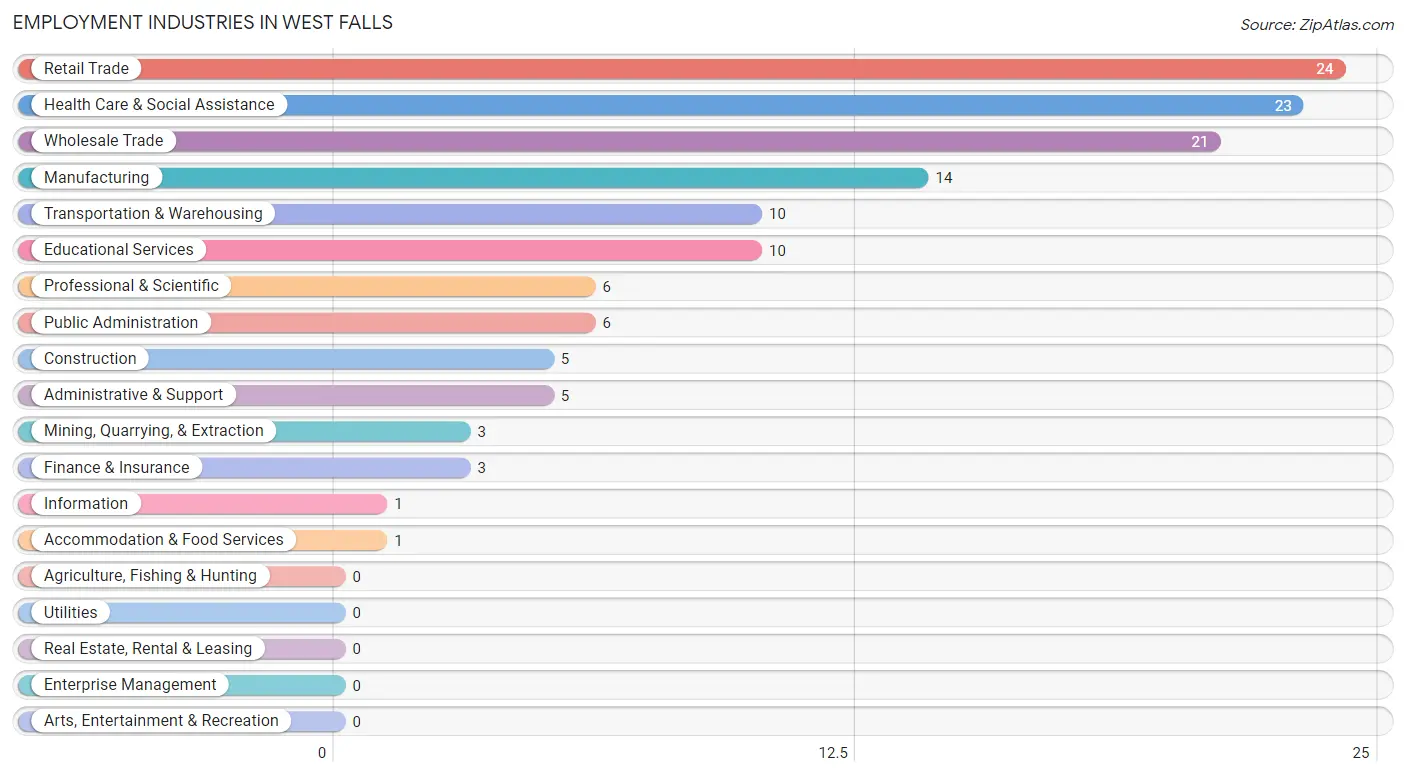
Employment Industries in West Falls
The major employment industries in West Falls include Retail Trade (24 | 17.9%), Health Care & Social Assistance (23 | 17.2%), Wholesale Trade (21 | 15.7%), Manufacturing (14 | 10.4%), and Transportation & Warehousing (10 | 7.5%).
Employment Industries by Sex in West Falls
The West Falls industries that see more men than women are Mining, Quarrying, & Extraction (100.0%), Finance & Insurance (100.0%), and Professional & Scientific (100.0%), whereas the industries that tend to have a higher number of women are Information (100.0%), Accommodation & Food Services (100.0%), and Educational Services (80.0%).
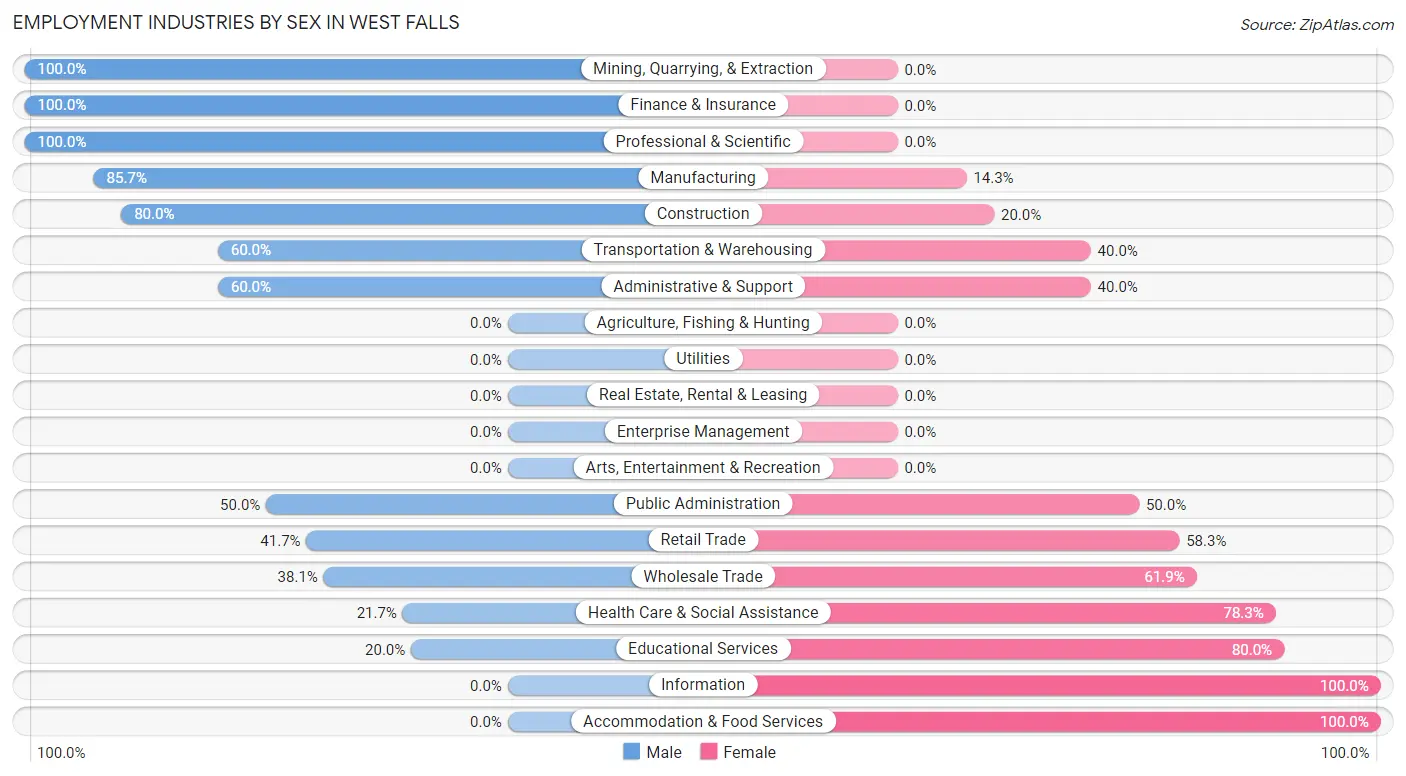
| Industry | Male | Female |
| Agriculture, Fishing & Hunting | 0 (0.0%) | 0 (0.0%) |
| Mining, Quarrying, & Extraction | 3 (100.0%) | 0 (0.0%) |
| Construction | 4 (80.0%) | 1 (20.0%) |
| Manufacturing | 12 (85.7%) | 2 (14.3%) |
| Wholesale Trade | 8 (38.1%) | 13 (61.9%) |
| Retail Trade | 10 (41.7%) | 14 (58.3%) |
| Transportation & Warehousing | 6 (60.0%) | 4 (40.0%) |
| Utilities | 0 (0.0%) | 0 (0.0%) |
| Information | 0 (0.0%) | 1 (100.0%) |
| Finance & Insurance | 3 (100.0%) | 0 (0.0%) |
| Real Estate, Rental & Leasing | 0 (0.0%) | 0 (0.0%) |
| Professional & Scientific | 6 (100.0%) | 0 (0.0%) |
| Enterprise Management | 0 (0.0%) | 0 (0.0%) |
| Administrative & Support | 3 (60.0%) | 2 (40.0%) |
| Educational Services | 2 (20.0%) | 8 (80.0%) |
| Health Care & Social Assistance | 5 (21.7%) | 18 (78.3%) |
| Arts, Entertainment & Recreation | 0 (0.0%) | 0 (0.0%) |
| Accommodation & Food Services | 0 (0.0%) | 1 (100.0%) |
| Public Administration | 3 (50.0%) | 3 (50.0%) |
| Total | 67 (50.0%) | 67 (50.0%) |
Education in West Falls
School Enrollment in West Falls
The most common levels of schooling among the 56 students in West Falls are college / undergraduate (18 | 32.1%), elementary school (17 | 30.4%), and high school (13 | 23.2%).
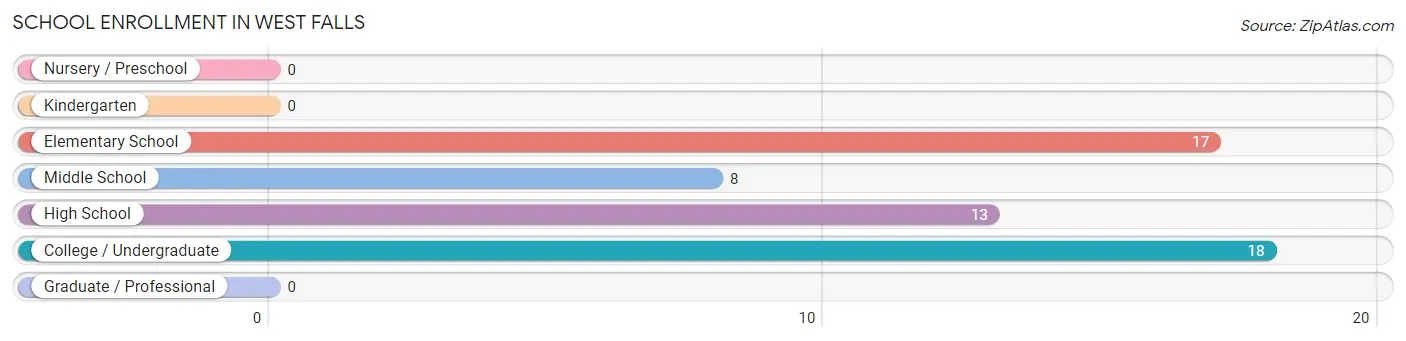
| School Level | # Students | % Students |
| Nursery / Preschool | 0 | 0.0% |
| Kindergarten | 0 | 0.0% |
| Elementary School | 17 | 30.4% |
| Middle School | 8 | 14.3% |
| High School | 13 | 23.2% |
| College / Undergraduate | 18 | 32.1% |
| Graduate / Professional | 0 | 0.0% |
| Total | 56 | 100.0% |
School Enrollment by Age by Funding Source in West Falls
Out of a total of 56 students who are enrolled in schools in West Falls, 15 (26.8%) attend a private institution, while the remaining 41 (73.2%) are enrolled in public schools. The age group of 10 to 14 year olds has the highest likelihood of being enrolled in private schools, with 8 (100.0% in the age bracket) enrolled. Conversely, the age group of 15 to 17 year olds has the lowest likelihood of being enrolled in a private school, with 8 (100.0% in the age bracket) attending a public institution.
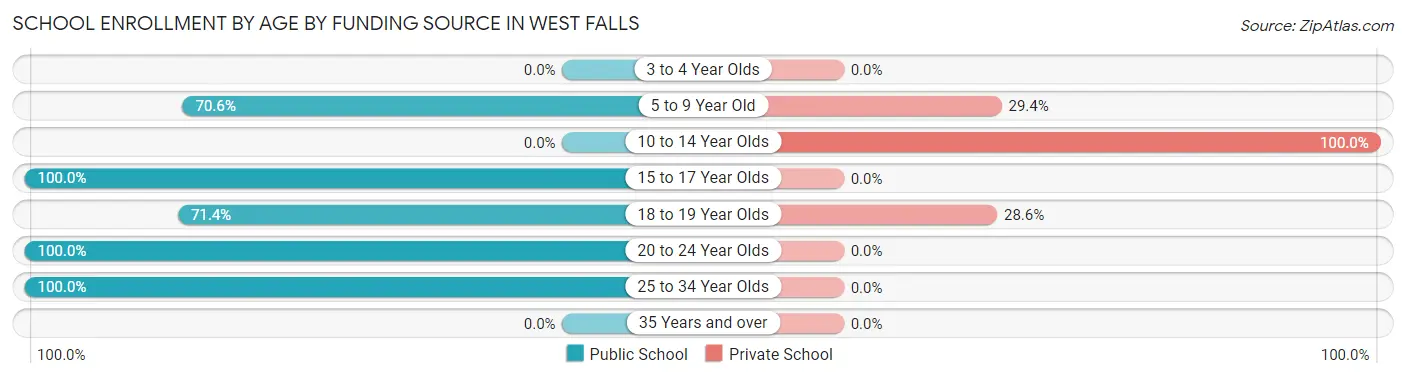
| Age Bracket | Public School | Private School |
| 3 to 4 Year Olds | 0 (0.0%) | 0 (0.0%) |
| 5 to 9 Year Old | 12 (70.6%) | 5 (29.4%) |
| 10 to 14 Year Olds | 0 (0.0%) | 8 (100.0%) |
| 15 to 17 Year Olds | 8 (100.0%) | 0 (0.0%) |
| 18 to 19 Year Olds | 5 (71.4%) | 2 (28.6%) |
| 20 to 24 Year Olds | 6 (100.0%) | 0 (0.0%) |
| 25 to 34 Year Olds | 10 (100.0%) | 0 (0.0%) |
| 35 Years and over | 0 (0.0%) | 0 (0.0%) |
| Total | 41 (73.2%) | 15 (26.8%) |
Educational Attainment by Field of Study in West Falls
Business (15 | 19.0%), arts & humanities (15 | 19.0%), science & technology (11 | 13.9%), education (10 | 12.7%), and engineering (9 | 11.4%) are the most common fields of study among 79 individuals in West Falls who have obtained a bachelor's degree or higher.
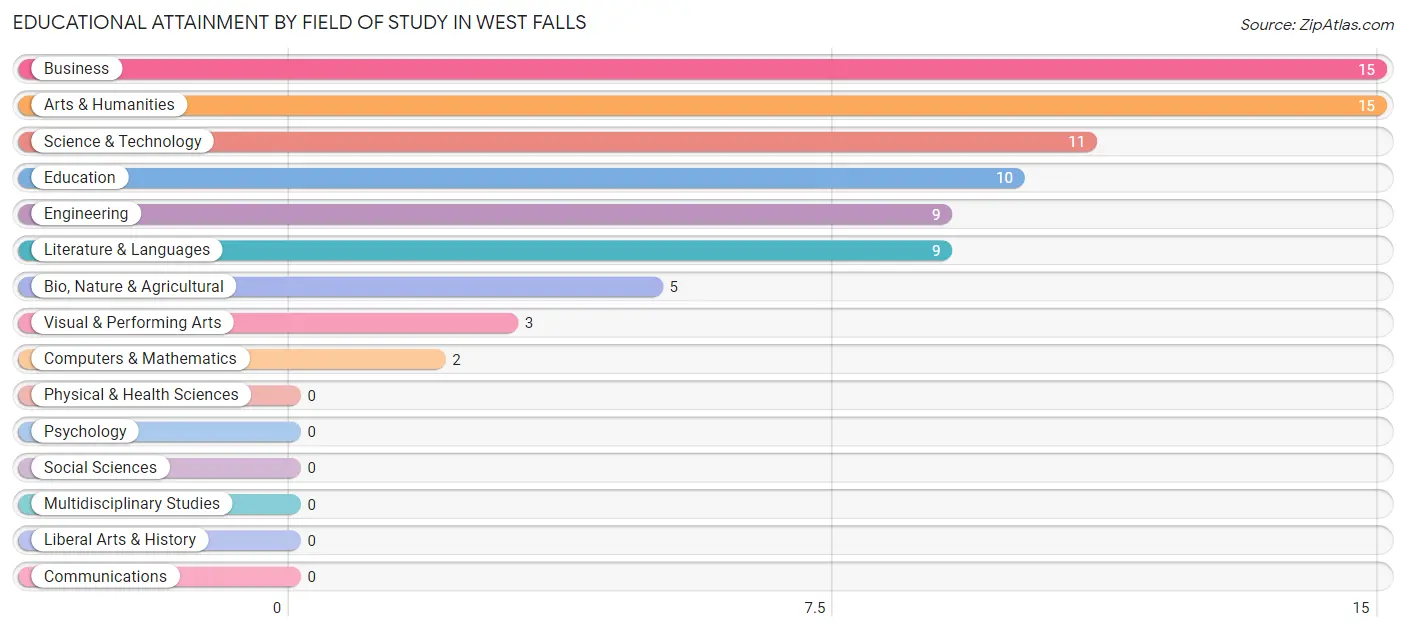
| Field of Study | # Graduates | % Graduates |
| Computers & Mathematics | 2 | 2.5% |
| Bio, Nature & Agricultural | 5 | 6.3% |
| Physical & Health Sciences | 0 | 0.0% |
| Psychology | 0 | 0.0% |
| Social Sciences | 0 | 0.0% |
| Engineering | 9 | 11.4% |
| Multidisciplinary Studies | 0 | 0.0% |
| Science & Technology | 11 | 13.9% |
| Business | 15 | 19.0% |
| Education | 10 | 12.7% |
| Literature & Languages | 9 | 11.4% |
| Liberal Arts & History | 0 | 0.0% |
| Visual & Performing Arts | 3 | 3.8% |
| Communications | 0 | 0.0% |
| Arts & Humanities | 15 | 19.0% |
| Total | 79 | 100.0% |
Transportation & Commute in West Falls
Vehicle Availability by Sex in West Falls
The most prevalent vehicle ownership categories in West Falls are males with 3 vehicles (20, accounting for 28.6%) and females with 3 vehicles (12, making up 29.8%).
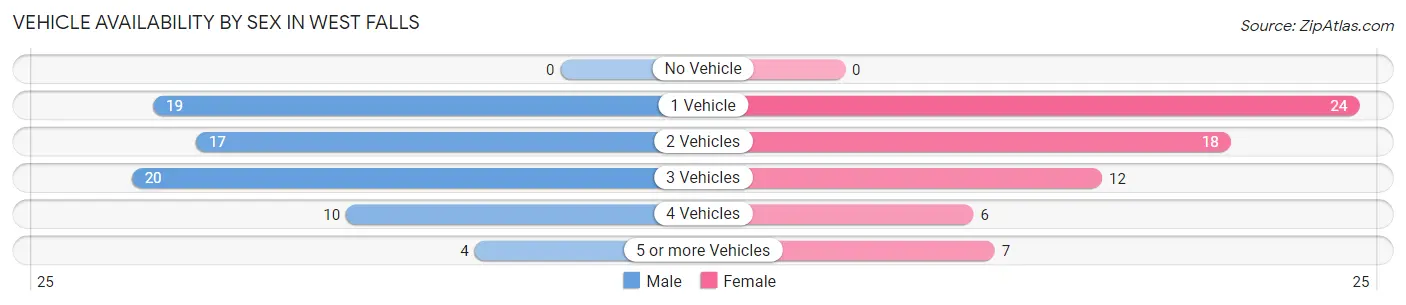
| Vehicles Available | Male | Female |
| No Vehicle | 0 (0.0%) | 0 (0.0%) |
| 1 Vehicle | 19 (27.1%) | 24 (35.8%) |
| 2 Vehicles | 17 (24.3%) | 18 (26.9%) |
| 3 Vehicles | 20 (28.6%) | 12 (17.9%) |
| 4 Vehicles | 10 (14.3%) | 6 (9.0%) |
| 5 or more Vehicles | 4 (5.7%) | 7 (10.4%) |
| Total | 70 (100.0%) | 67 (100.0%) |
Commute Time in West Falls
The most frequently occuring commute durations in West Falls are 25 to 29 minutes (36 commuters, 27.5%), 10 to 14 minutes (27 commuters, 20.6%), and 30 to 34 minutes (20 commuters, 15.3%).
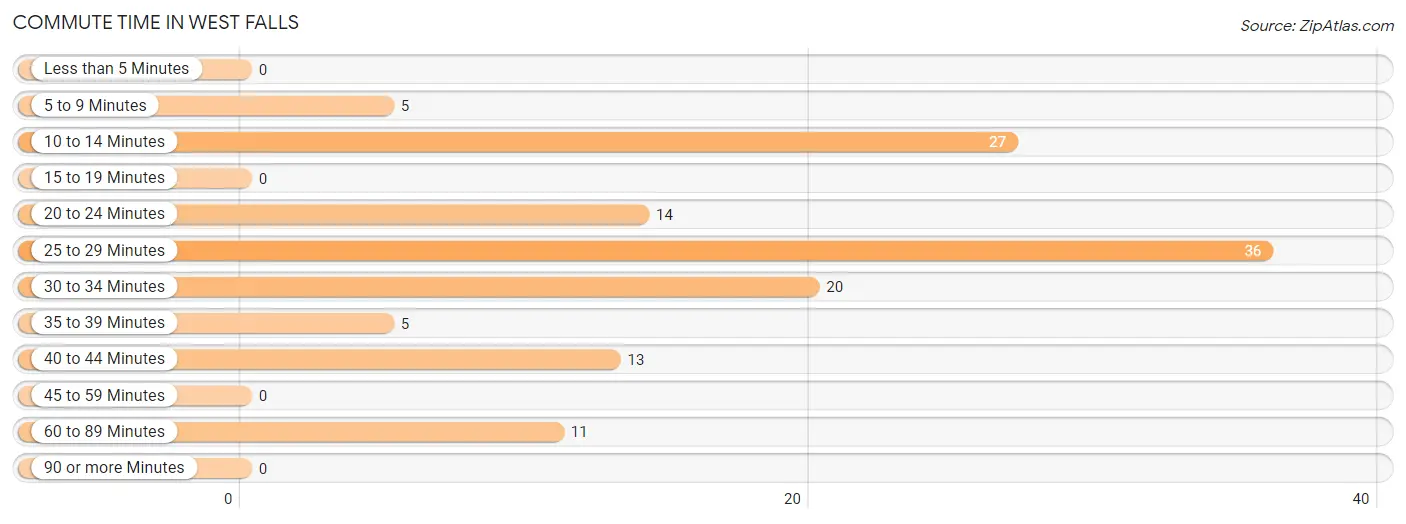
| Commute Time | # Commuters | % Commuters |
| Less than 5 Minutes | 0 | 0.0% |
| 5 to 9 Minutes | 5 | 3.8% |
| 10 to 14 Minutes | 27 | 20.6% |
| 15 to 19 Minutes | 0 | 0.0% |
| 20 to 24 Minutes | 14 | 10.7% |
| 25 to 29 Minutes | 36 | 27.5% |
| 30 to 34 Minutes | 20 | 15.3% |
| 35 to 39 Minutes | 5 | 3.8% |
| 40 to 44 Minutes | 13 | 9.9% |
| 45 to 59 Minutes | 0 | 0.0% |
| 60 to 89 Minutes | 11 | 8.4% |
| 90 or more Minutes | 0 | 0.0% |
Commute Time by Sex in West Falls
The most common commute times in West Falls are 25 to 29 minutes (25 commuters, 36.8%) for males and 10 to 14 minutes (18 commuters, 28.6%) for females.
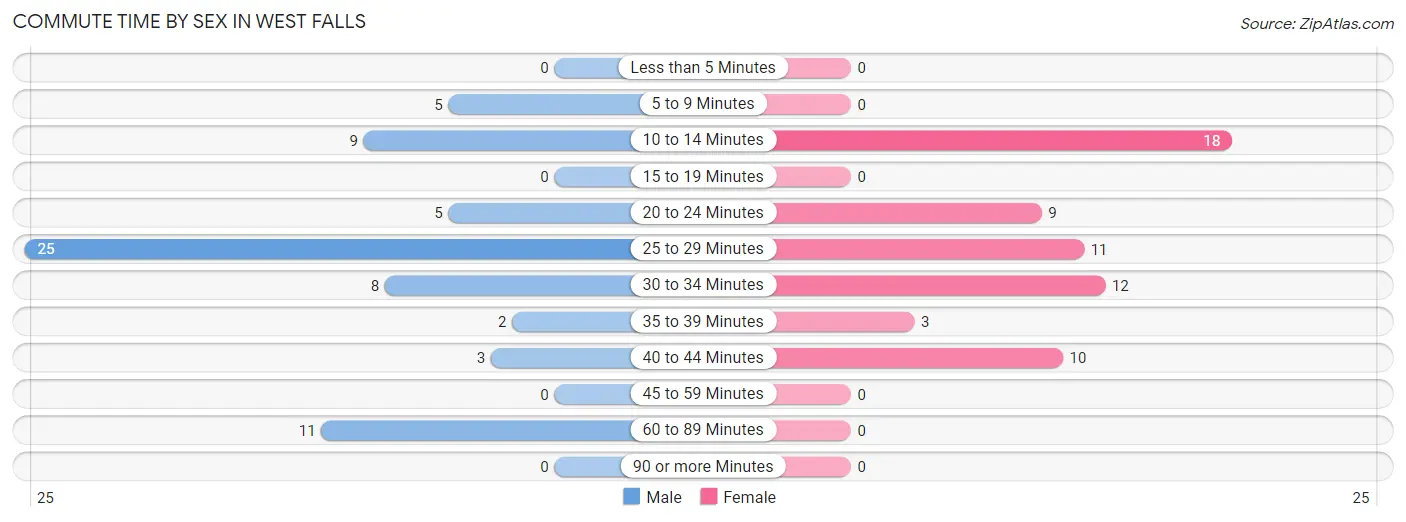
| Commute Time | Male | Female |
| Less than 5 Minutes | 0 (0.0%) | 0 (0.0%) |
| 5 to 9 Minutes | 5 (7.3%) | 0 (0.0%) |
| 10 to 14 Minutes | 9 (13.2%) | 18 (28.6%) |
| 15 to 19 Minutes | 0 (0.0%) | 0 (0.0%) |
| 20 to 24 Minutes | 5 (7.3%) | 9 (14.3%) |
| 25 to 29 Minutes | 25 (36.8%) | 11 (17.5%) |
| 30 to 34 Minutes | 8 (11.8%) | 12 (19.1%) |
| 35 to 39 Minutes | 2 (2.9%) | 3 (4.8%) |
| 40 to 44 Minutes | 3 (4.4%) | 10 (15.9%) |
| 45 to 59 Minutes | 0 (0.0%) | 0 (0.0%) |
| 60 to 89 Minutes | 11 (16.2%) | 0 (0.0%) |
| 90 or more Minutes | 0 (0.0%) | 0 (0.0%) |
Time of Departure to Work by Sex in West Falls
The most frequent times of departure to work in West Falls are 5:00 AM to 5:29 AM (15, 22.1%) for males and 4:00 PM to 11:59 PM (20, 31.8%) for females.
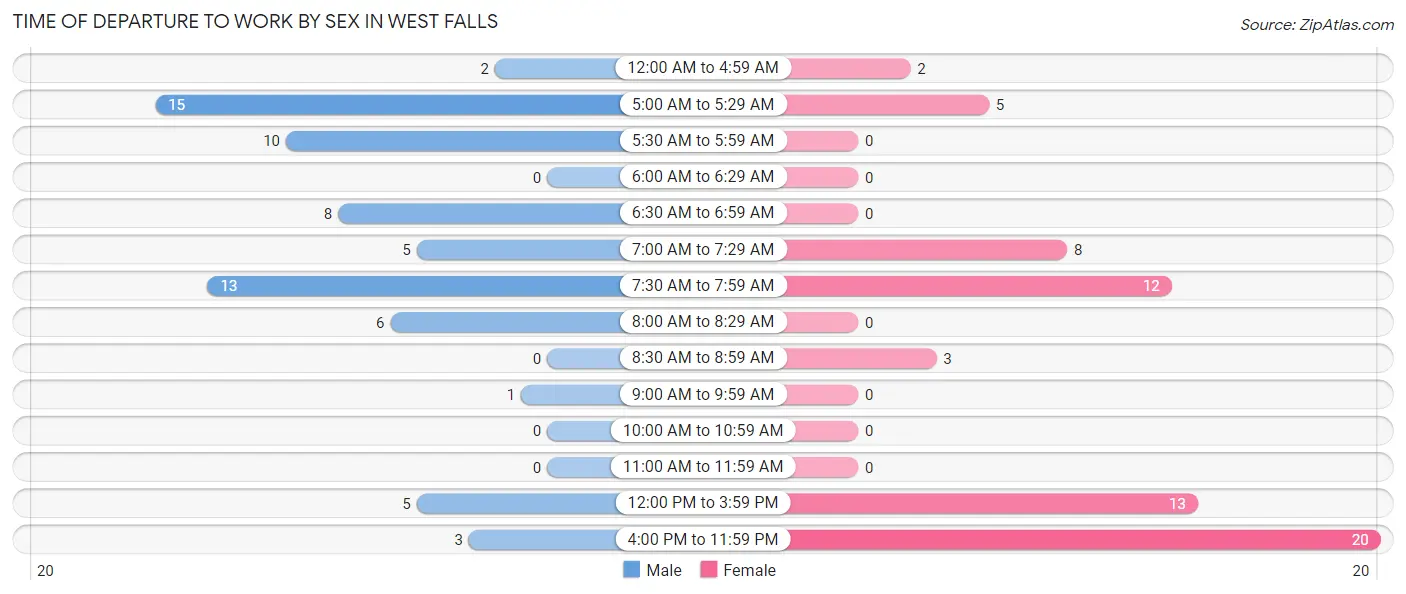
| Time of Departure | Male | Female |
| 12:00 AM to 4:59 AM | 2 (2.9%) | 2 (3.2%) |
| 5:00 AM to 5:29 AM | 15 (22.1%) | 5 (7.9%) |
| 5:30 AM to 5:59 AM | 10 (14.7%) | 0 (0.0%) |
| 6:00 AM to 6:29 AM | 0 (0.0%) | 0 (0.0%) |
| 6:30 AM to 6:59 AM | 8 (11.8%) | 0 (0.0%) |
| 7:00 AM to 7:29 AM | 5 (7.3%) | 8 (12.7%) |
| 7:30 AM to 7:59 AM | 13 (19.1%) | 12 (19.1%) |
| 8:00 AM to 8:29 AM | 6 (8.8%) | 0 (0.0%) |
| 8:30 AM to 8:59 AM | 0 (0.0%) | 3 (4.8%) |
| 9:00 AM to 9:59 AM | 1 (1.5%) | 0 (0.0%) |
| 10:00 AM to 10:59 AM | 0 (0.0%) | 0 (0.0%) |
| 11:00 AM to 11:59 AM | 0 (0.0%) | 0 (0.0%) |
| 12:00 PM to 3:59 PM | 5 (7.3%) | 13 (20.6%) |
| 4:00 PM to 11:59 PM | 3 (4.4%) | 20 (31.8%) |
| Total | 68 (100.0%) | 63 (100.0%) |
Housing Occupancy in West Falls
Occupancy by Ownership in West Falls
Of the total 159 dwellings in West Falls, owner-occupied units account for 138 (86.8%), while renter-occupied units make up 21 (13.2%).
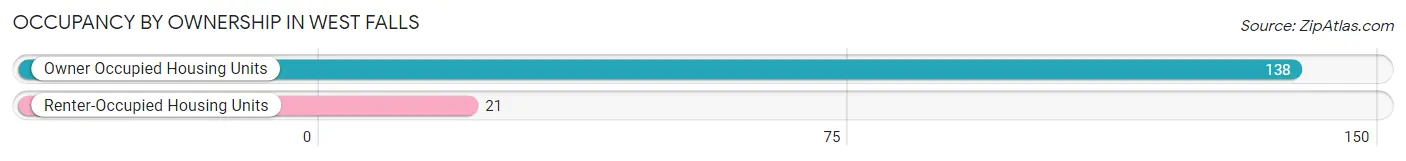
| Occupancy | # Housing Units | % Housing Units |
| Owner Occupied Housing Units | 138 | 86.8% |
| Renter-Occupied Housing Units | 21 | 13.2% |
| Total Occupied Housing Units | 159 | 100.0% |
Occupancy by Household Size in West Falls
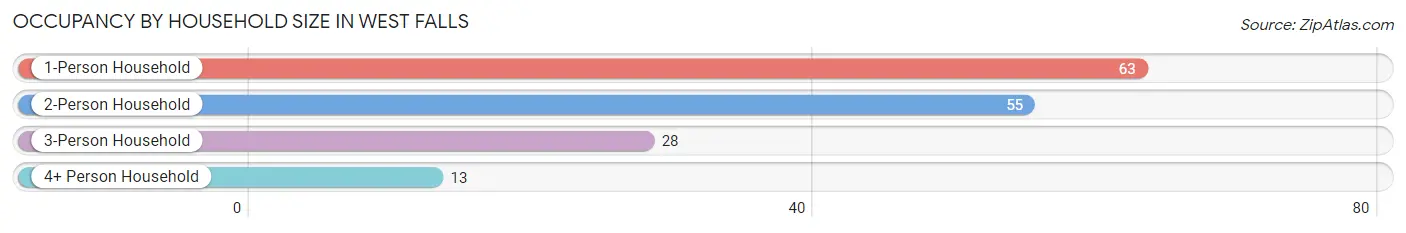
| Household Size | # Housing Units | % Housing Units |
| 1-Person Household | 63 | 39.6% |
| 2-Person Household | 55 | 34.6% |
| 3-Person Household | 28 | 17.6% |
| 4+ Person Household | 13 | 8.2% |
| Total Housing Units | 159 | 100.0% |
Occupancy by Ownership by Household Size in West Falls
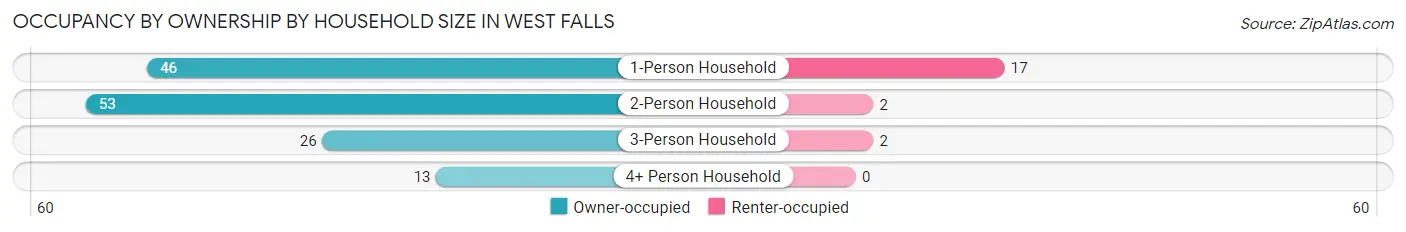
| Household Size | Owner-occupied | Renter-occupied |
| 1-Person Household | 46 (73.0%) | 17 (27.0%) |
| 2-Person Household | 53 (96.4%) | 2 (3.6%) |
| 3-Person Household | 26 (92.9%) | 2 (7.1%) |
| 4+ Person Household | 13 (100.0%) | 0 (0.0%) |
| Total Housing Units | 138 (86.8%) | 21 (13.2%) |
Occupancy by Educational Attainment in West Falls
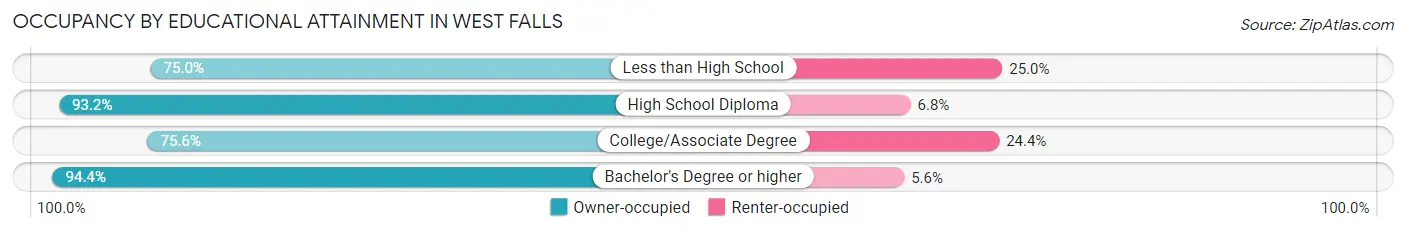
| Household Size | Owner-occupied | Renter-occupied |
| Less than High School | 15 (75.0%) | 5 (25.0%) |
| High School Diploma | 41 (93.2%) | 3 (6.8%) |
| College/Associate Degree | 31 (75.6%) | 10 (24.4%) |
| Bachelor's Degree or higher | 51 (94.4%) | 3 (5.6%) |
Occupancy by Age of Householder in West Falls
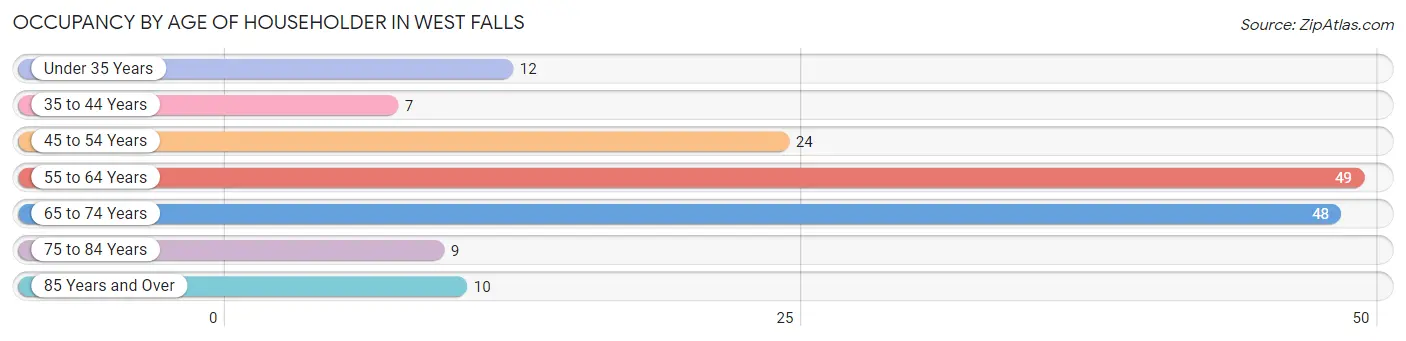
| Age Bracket | # Households | % Households |
| Under 35 Years | 12 | 7.5% |
| 35 to 44 Years | 7 | 4.4% |
| 45 to 54 Years | 24 | 15.1% |
| 55 to 64 Years | 49 | 30.8% |
| 65 to 74 Years | 48 | 30.2% |
| 75 to 84 Years | 9 | 5.7% |
| 85 Years and Over | 10 | 6.3% |
| Total | 159 | 100.0% |
Housing Finances in West Falls
Median Income by Occupancy in West Falls
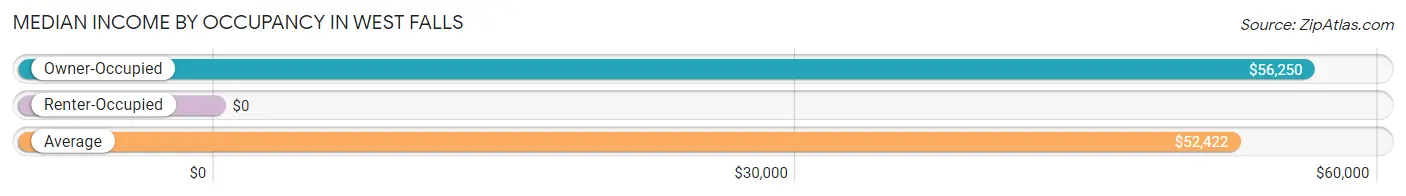
| Occupancy Type | # Households | Median Income |
| Owner-Occupied | 138 (86.8%) | $56,250 |
| Renter-Occupied | 21 (13.2%) | $0 |
| Average | 159 (100.0%) | $52,422 |
Occupancy by Householder Income Bracket in West Falls
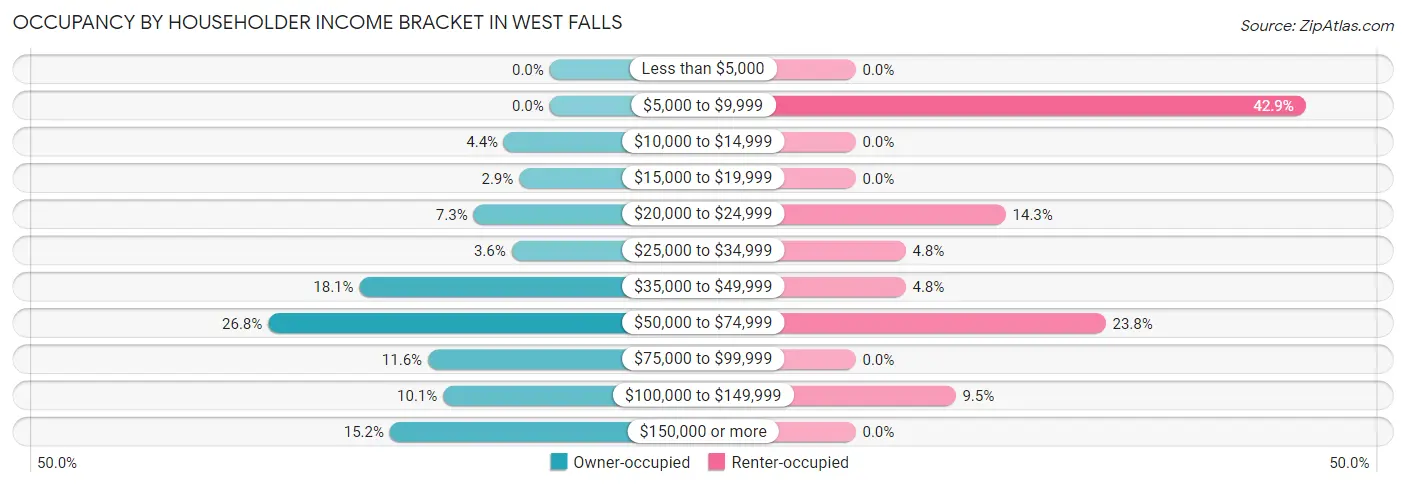
| Income Bracket | Owner-occupied | Renter-occupied |
| Less than $5,000 | 0 (0.0%) | 0 (0.0%) |
| $5,000 to $9,999 | 0 (0.0%) | 9 (42.9%) |
| $10,000 to $14,999 | 6 (4.3%) | 0 (0.0%) |
| $15,000 to $19,999 | 4 (2.9%) | 0 (0.0%) |
| $20,000 to $24,999 | 10 (7.2%) | 3 (14.3%) |
| $25,000 to $34,999 | 5 (3.6%) | 1 (4.8%) |
| $35,000 to $49,999 | 25 (18.1%) | 1 (4.8%) |
| $50,000 to $74,999 | 37 (26.8%) | 5 (23.8%) |
| $75,000 to $99,999 | 16 (11.6%) | 0 (0.0%) |
| $100,000 to $149,999 | 14 (10.1%) | 2 (9.5%) |
| $150,000 or more | 21 (15.2%) | 0 (0.0%) |
| Total | 138 (100.0%) | 21 (100.0%) |
Monthly Housing Cost Tiers in West Falls
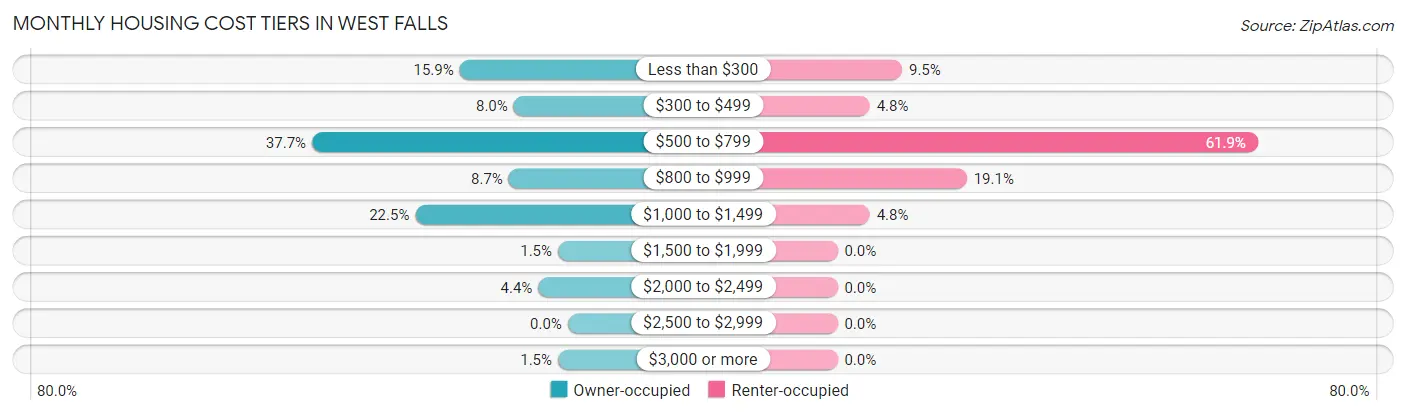
| Monthly Cost | Owner-occupied | Renter-occupied |
| Less than $300 | 22 (15.9%) | 2 (9.5%) |
| $300 to $499 | 11 (8.0%) | 1 (4.8%) |
| $500 to $799 | 52 (37.7%) | 13 (61.9%) |
| $800 to $999 | 12 (8.7%) | 4 (19.1%) |
| $1,000 to $1,499 | 31 (22.5%) | 1 (4.8%) |
| $1,500 to $1,999 | 2 (1.5%) | 0 (0.0%) |
| $2,000 to $2,499 | 6 (4.3%) | 0 (0.0%) |
| $2,500 to $2,999 | 0 (0.0%) | 0 (0.0%) |
| $3,000 or more | 2 (1.5%) | 0 (0.0%) |
| Total | 138 (100.0%) | 21 (100.0%) |
Physical Housing Characteristics in West Falls
Housing Structures in West Falls
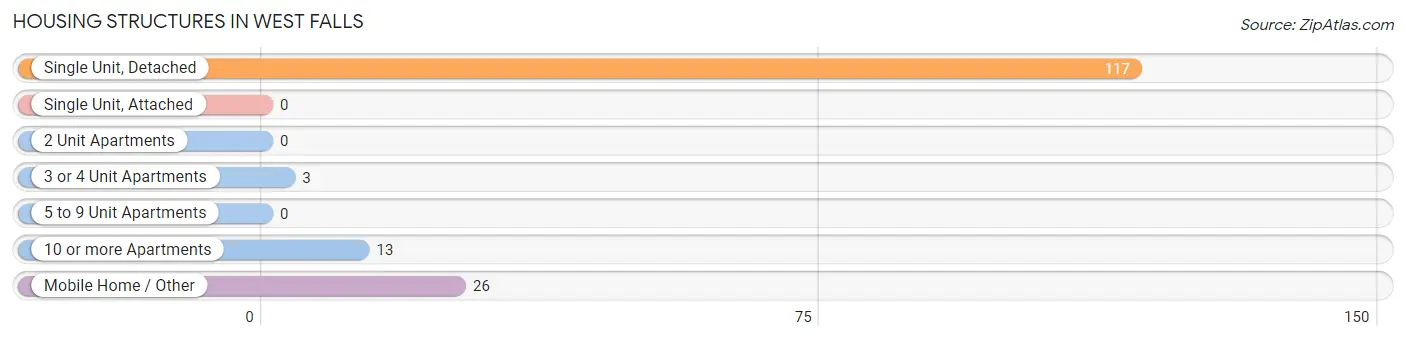
| Structure Type | # Housing Units | % Housing Units |
| Single Unit, Detached | 117 | 73.6% |
| Single Unit, Attached | 0 | 0.0% |
| 2 Unit Apartments | 0 | 0.0% |
| 3 or 4 Unit Apartments | 3 | 1.9% |
| 5 to 9 Unit Apartments | 0 | 0.0% |
| 10 or more Apartments | 13 | 8.2% |
| Mobile Home / Other | 26 | 16.4% |
| Total | 159 | 100.0% |
Housing Structures by Occupancy in West Falls
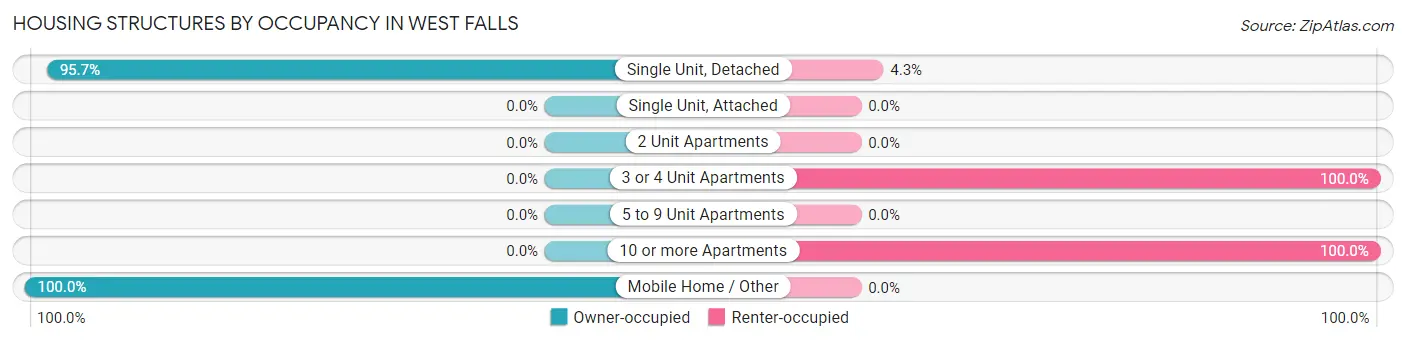
| Structure Type | Owner-occupied | Renter-occupied |
| Single Unit, Detached | 112 (95.7%) | 5 (4.3%) |
| Single Unit, Attached | 0 (0.0%) | 0 (0.0%) |
| 2 Unit Apartments | 0 (0.0%) | 0 (0.0%) |
| 3 or 4 Unit Apartments | 0 (0.0%) | 3 (100.0%) |
| 5 to 9 Unit Apartments | 0 (0.0%) | 0 (0.0%) |
| 10 or more Apartments | 0 (0.0%) | 13 (100.0%) |
| Mobile Home / Other | 26 (100.0%) | 0 (0.0%) |
| Total | 138 (86.8%) | 21 (13.2%) |
Housing Structures by Number of Rooms in West Falls
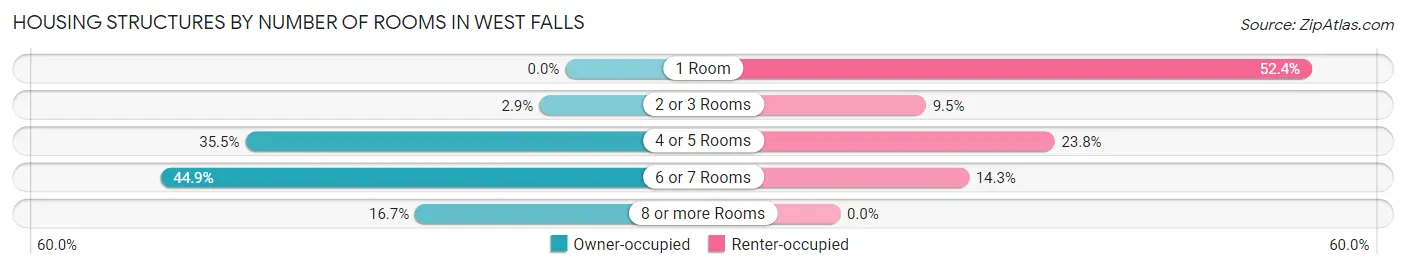
| Number of Rooms | Owner-occupied | Renter-occupied |
| 1 Room | 0 (0.0%) | 11 (52.4%) |
| 2 or 3 Rooms | 4 (2.9%) | 2 (9.5%) |
| 4 or 5 Rooms | 49 (35.5%) | 5 (23.8%) |
| 6 or 7 Rooms | 62 (44.9%) | 3 (14.3%) |
| 8 or more Rooms | 23 (16.7%) | 0 (0.0%) |
| Total | 138 (100.0%) | 21 (100.0%) |
Housing Structure by Heating Type in West Falls
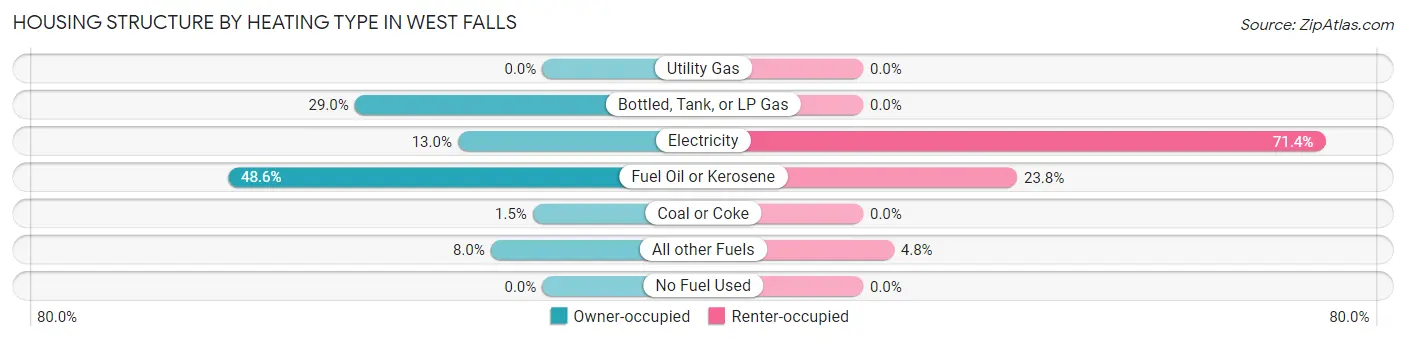
| Heating Type | Owner-occupied | Renter-occupied |
| Utility Gas | 0 (0.0%) | 0 (0.0%) |
| Bottled, Tank, or LP Gas | 40 (29.0%) | 0 (0.0%) |
| Electricity | 18 (13.0%) | 15 (71.4%) |
| Fuel Oil or Kerosene | 67 (48.5%) | 5 (23.8%) |
| Coal or Coke | 2 (1.5%) | 0 (0.0%) |
| All other Fuels | 11 (8.0%) | 1 (4.8%) |
| No Fuel Used | 0 (0.0%) | 0 (0.0%) |
| Total | 138 (100.0%) | 21 (100.0%) |
Household Vehicle Usage in West Falls
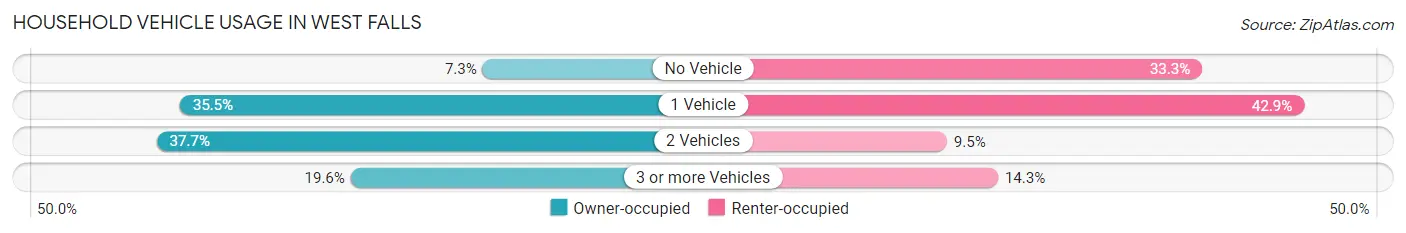
| Vehicles per Household | Owner-occupied | Renter-occupied |
| No Vehicle | 10 (7.2%) | 7 (33.3%) |
| 1 Vehicle | 49 (35.5%) | 9 (42.9%) |
| 2 Vehicles | 52 (37.7%) | 2 (9.5%) |
| 3 or more Vehicles | 27 (19.6%) | 3 (14.3%) |
| Total | 138 (100.0%) | 21 (100.0%) |
Real Estate & Mortgages in West Falls
Real Estate and Mortgage Overview in West Falls
| Characteristic | Without Mortgage | With Mortgage |
| Housing Units | 88 | 50 |
| Median Property Value | $154,000 | $158,300 |
| Median Household Income | $43,750 | $17 |
| Monthly Housing Costs | $569 | $2 |
| Real Estate Taxes | $2,111 | $0 |
Property Value by Mortgage Status in West Falls
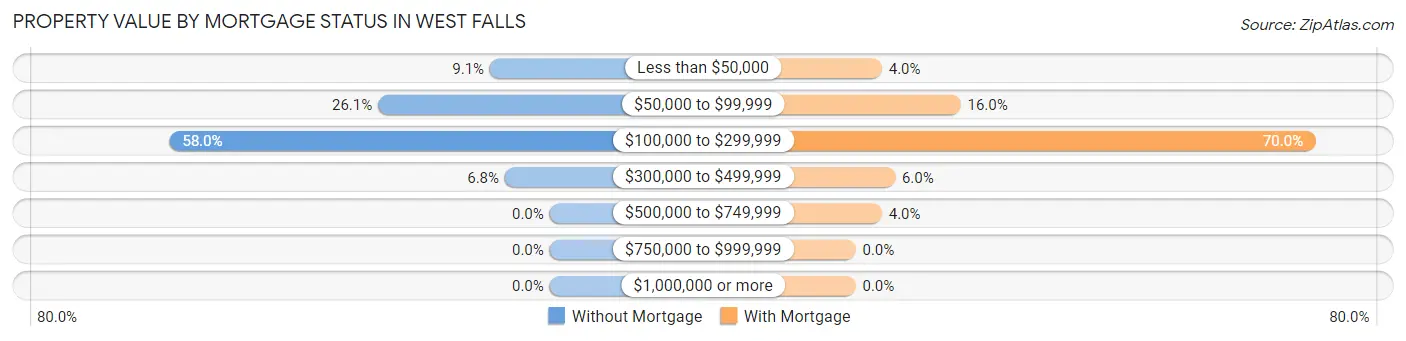
| Property Value | Without Mortgage | With Mortgage |
| Less than $50,000 | 8 (9.1%) | 2 (4.0%) |
| $50,000 to $99,999 | 23 (26.1%) | 8 (16.0%) |
| $100,000 to $299,999 | 51 (58.0%) | 35 (70.0%) |
| $300,000 to $499,999 | 6 (6.8%) | 3 (6.0%) |
| $500,000 to $749,999 | 0 (0.0%) | 2 (4.0%) |
| $750,000 to $999,999 | 0 (0.0%) | 0 (0.0%) |
| $1,000,000 or more | 0 (0.0%) | 0 (0.0%) |
| Total | 88 (100.0%) | 50 (100.0%) |
Household Income by Mortgage Status in West Falls
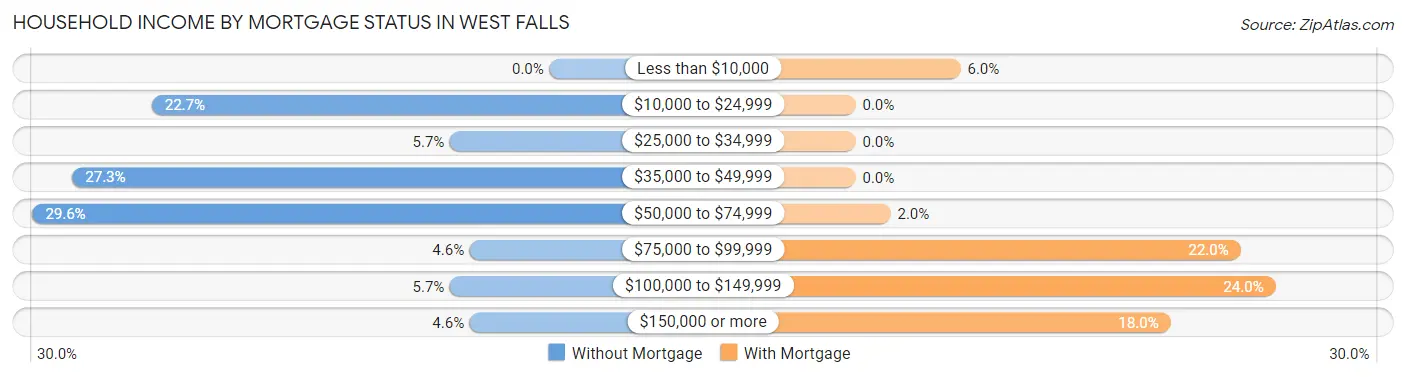
| Household Income | Without Mortgage | With Mortgage |
| Less than $10,000 | 0 (0.0%) | 3 (6.0%) |
| $10,000 to $24,999 | 20 (22.7%) | 0 (0.0%) |
| $25,000 to $34,999 | 5 (5.7%) | 0 (0.0%) |
| $35,000 to $49,999 | 24 (27.3%) | 0 (0.0%) |
| $50,000 to $74,999 | 26 (29.5%) | 1 (2.0%) |
| $75,000 to $99,999 | 4 (4.5%) | 11 (22.0%) |
| $100,000 to $149,999 | 5 (5.7%) | 12 (24.0%) |
| $150,000 or more | 4 (4.5%) | 9 (18.0%) |
| Total | 88 (100.0%) | 50 (100.0%) |
Property Value to Household Income Ratio in West Falls
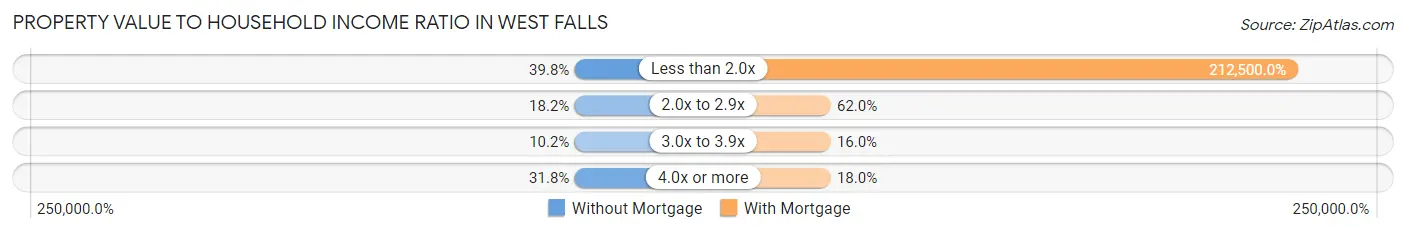
| Value-to-Income Ratio | Without Mortgage | With Mortgage |
| Less than 2.0x | 35 (39.8%) | 106,250 (212,500.0%) |
| 2.0x to 2.9x | 16 (18.2%) | 31 (62.0%) |
| 3.0x to 3.9x | 9 (10.2%) | 8 (16.0%) |
| 4.0x or more | 28 (31.8%) | 9 (18.0%) |
| Total | 88 (100.0%) | 50 (100.0%) |
Real Estate Taxes by Mortgage Status in West Falls
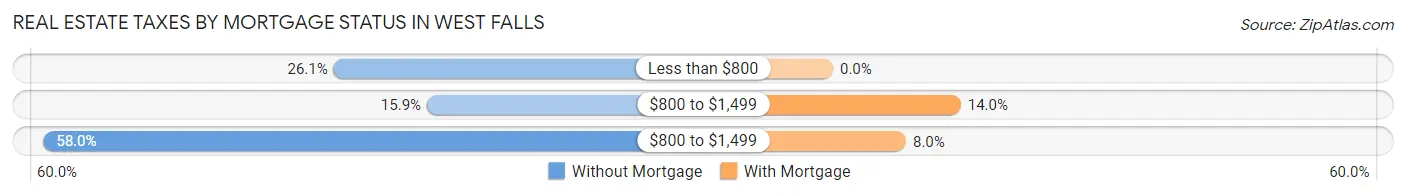
| Property Taxes | Without Mortgage | With Mortgage |
| Less than $800 | 23 (26.1%) | 0 (0.0%) |
| $800 to $1,499 | 14 (15.9%) | 7 (14.0%) |
| $800 to $1,499 | 51 (58.0%) | 4 (8.0%) |
| Total | 88 (100.0%) | 50 (100.0%) |
Health & Disability in West Falls
Health Insurance Coverage by Age in West Falls
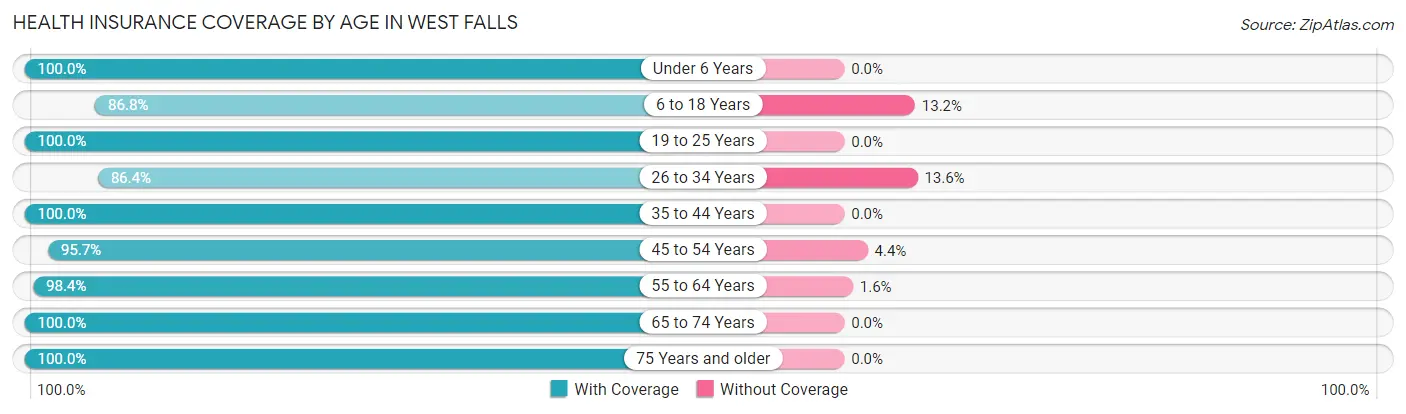
| Age Bracket | With Coverage | Without Coverage |
| Under 6 Years | 5 (100.0%) | 0 (0.0%) |
| 6 to 18 Years | 33 (86.8%) | 5 (13.2%) |
| 19 to 25 Years | 8 (100.0%) | 0 (0.0%) |
| 26 to 34 Years | 19 (86.4%) | 3 (13.6%) |
| 35 to 44 Years | 15 (100.0%) | 0 (0.0%) |
| 45 to 54 Years | 44 (95.7%) | 2 (4.3%) |
| 55 to 64 Years | 62 (98.4%) | 1 (1.6%) |
| 65 to 74 Years | 77 (100.0%) | 0 (0.0%) |
| 75 Years and older | 31 (100.0%) | 0 (0.0%) |
| Total | 294 (96.4%) | 11 (3.6%) |
Health Insurance Coverage by Citizenship Status in West Falls
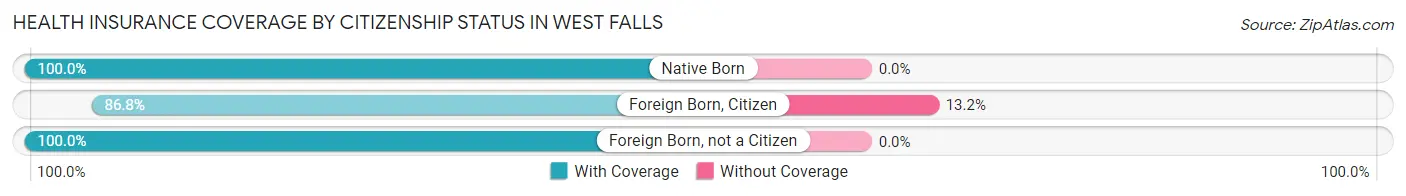
| Citizenship Status | With Coverage | Without Coverage |
| Native Born | 5 (100.0%) | 0 (0.0%) |
| Foreign Born, Citizen | 33 (86.8%) | 5 (13.2%) |
| Foreign Born, not a Citizen | 8 (100.0%) | 0 (0.0%) |
Health Insurance Coverage by Household Income in West Falls
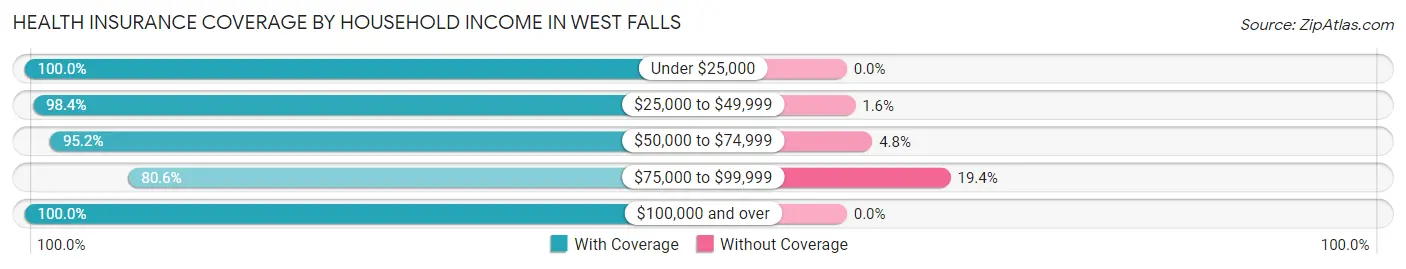
| Household Income | With Coverage | Without Coverage |
| Under $25,000 | 37 (100.0%) | 0 (0.0%) |
| $25,000 to $49,999 | 62 (98.4%) | 1 (1.6%) |
| $50,000 to $74,999 | 60 (95.2%) | 3 (4.8%) |
| $75,000 to $99,999 | 29 (80.6%) | 7 (19.4%) |
| $100,000 and over | 106 (100.0%) | 0 (0.0%) |
Public vs Private Health Insurance Coverage by Age in West Falls
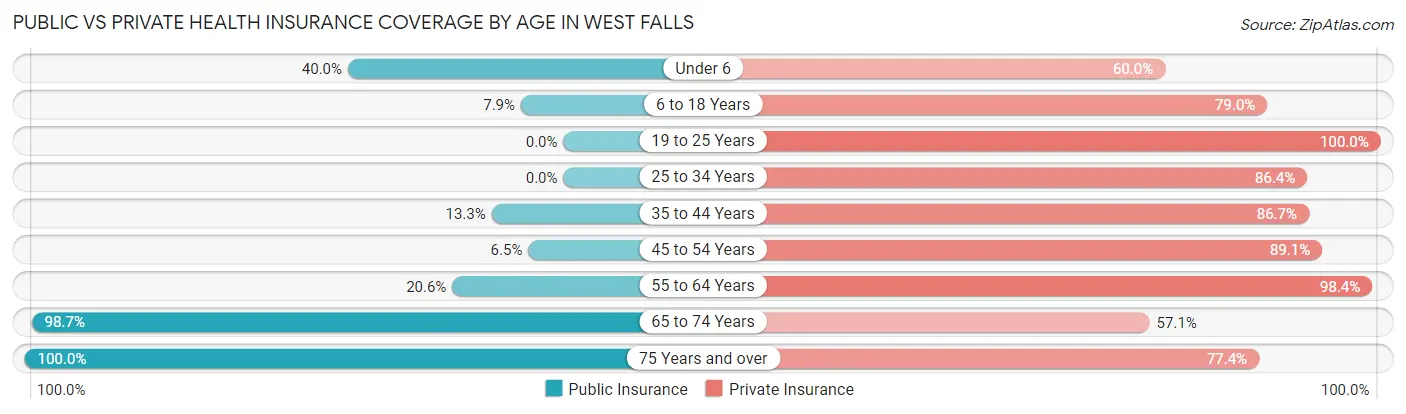
| Age Bracket | Public Insurance | Private Insurance |
| Under 6 | 2 (40.0%) | 3 (60.0%) |
| 6 to 18 Years | 3 (7.9%) | 30 (78.9%) |
| 19 to 25 Years | 0 (0.0%) | 8 (100.0%) |
| 25 to 34 Years | 0 (0.0%) | 19 (86.4%) |
| 35 to 44 Years | 2 (13.3%) | 13 (86.7%) |
| 45 to 54 Years | 3 (6.5%) | 41 (89.1%) |
| 55 to 64 Years | 13 (20.6%) | 62 (98.4%) |
| 65 to 74 Years | 76 (98.7%) | 44 (57.1%) |
| 75 Years and over | 31 (100.0%) | 24 (77.4%) |
| Total | 130 (42.6%) | 244 (80.0%) |
Disability Status by Sex by Age in West Falls
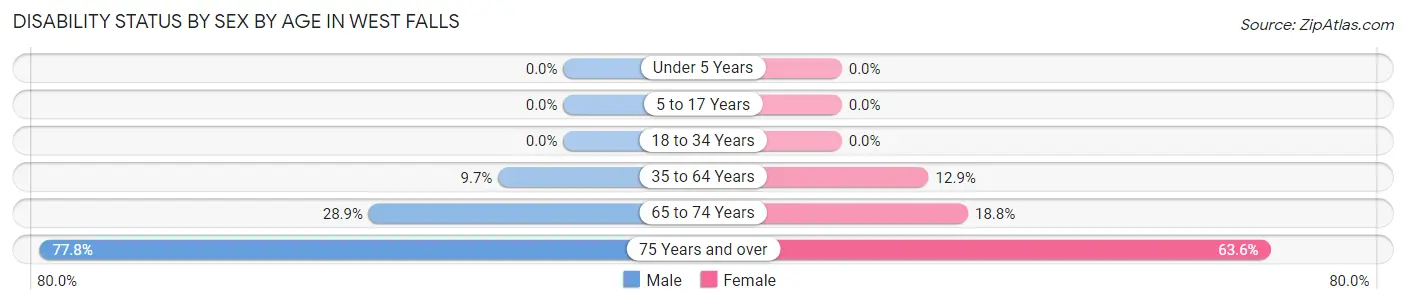
| Age Bracket | Male | Female |
| Under 5 Years | 0 (0.0%) | 0 (0.0%) |
| 5 to 17 Years | 0 (0.0%) | 0 (0.0%) |
| 18 to 34 Years | 0 (0.0%) | 0 (0.0%) |
| 35 to 64 Years | 6 (9.7%) | 8 (12.9%) |
| 65 to 74 Years | 13 (28.9%) | 6 (18.8%) |
| 75 Years and over | 7 (77.8%) | 14 (63.6%) |
Disability Class by Sex by Age in West Falls
Disability Class: Hearing Difficulty
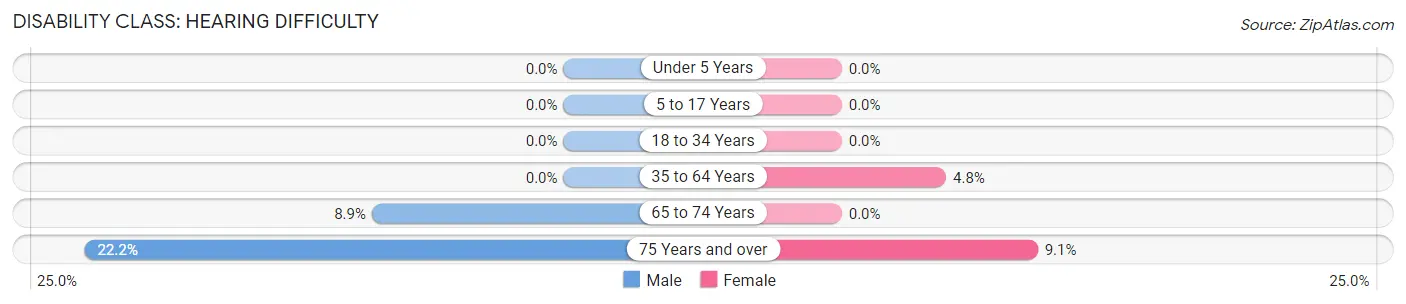
| Age Bracket | Male | Female |
| Under 5 Years | 0 (0.0%) | 0 (0.0%) |
| 5 to 17 Years | 0 (0.0%) | 0 (0.0%) |
| 18 to 34 Years | 0 (0.0%) | 0 (0.0%) |
| 35 to 64 Years | 0 (0.0%) | 3 (4.8%) |
| 65 to 74 Years | 4 (8.9%) | 0 (0.0%) |
| 75 Years and over | 2 (22.2%) | 2 (9.1%) |
Disability Class: Vision Difficulty
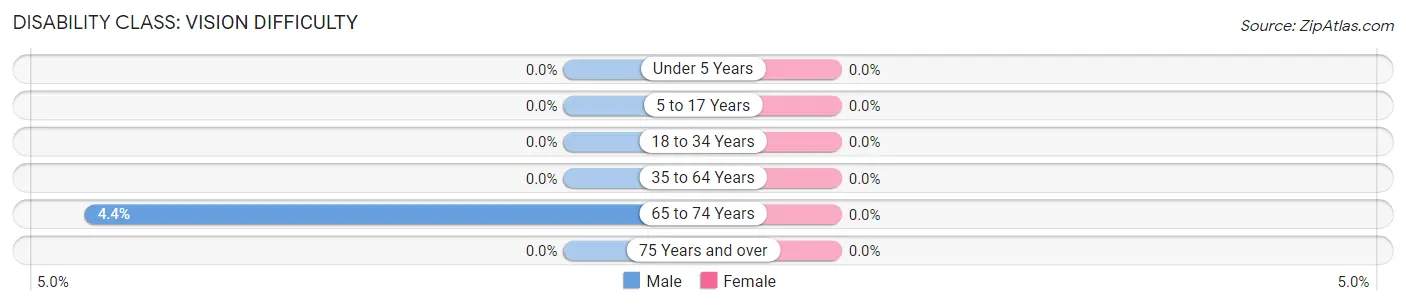
| Age Bracket | Male | Female |
| Under 5 Years | 0 (0.0%) | 0 (0.0%) |
| 5 to 17 Years | 0 (0.0%) | 0 (0.0%) |
| 18 to 34 Years | 0 (0.0%) | 0 (0.0%) |
| 35 to 64 Years | 0 (0.0%) | 0 (0.0%) |
| 65 to 74 Years | 2 (4.4%) | 0 (0.0%) |
| 75 Years and over | 0 (0.0%) | 0 (0.0%) |
Disability Class: Cognitive Difficulty
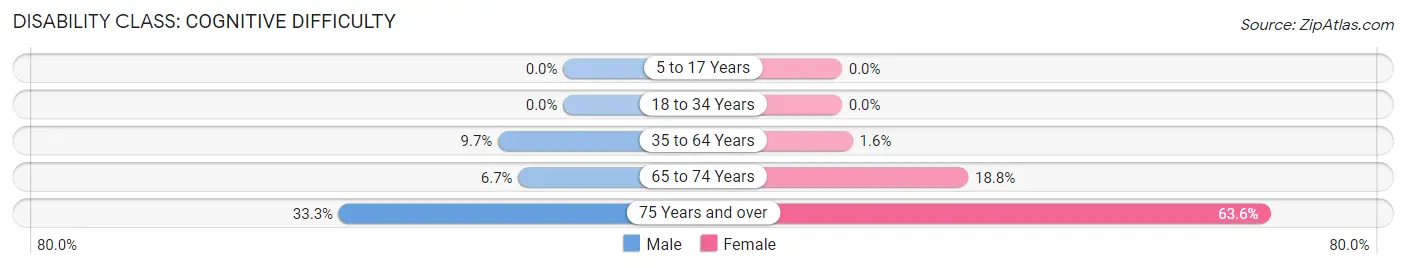
| Age Bracket | Male | Female |
| 5 to 17 Years | 0 (0.0%) | 0 (0.0%) |
| 18 to 34 Years | 0 (0.0%) | 0 (0.0%) |
| 35 to 64 Years | 6 (9.7%) | 1 (1.6%) |
| 65 to 74 Years | 3 (6.7%) | 6 (18.8%) |
| 75 Years and over | 3 (33.3%) | 14 (63.6%) |
Disability Class: Ambulatory Difficulty
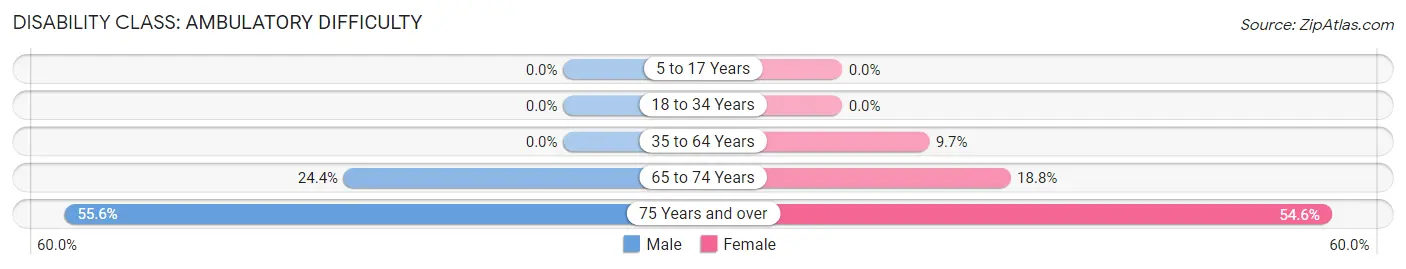
| Age Bracket | Male | Female |
| 5 to 17 Years | 0 (0.0%) | 0 (0.0%) |
| 18 to 34 Years | 0 (0.0%) | 0 (0.0%) |
| 35 to 64 Years | 0 (0.0%) | 6 (9.7%) |
| 65 to 74 Years | 11 (24.4%) | 6 (18.8%) |
| 75 Years and over | 5 (55.6%) | 12 (54.5%) |
Disability Class: Self-Care Difficulty
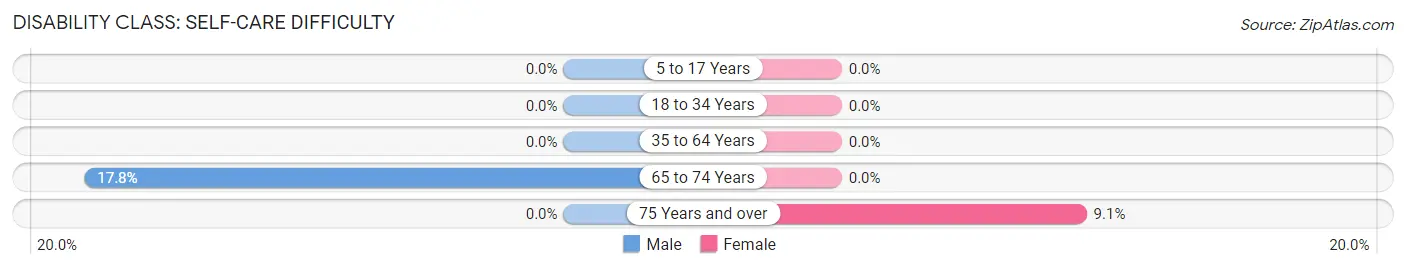
| Age Bracket | Male | Female |
| 5 to 17 Years | 0 (0.0%) | 0 (0.0%) |
| 18 to 34 Years | 0 (0.0%) | 0 (0.0%) |
| 35 to 64 Years | 0 (0.0%) | 0 (0.0%) |
| 65 to 74 Years | 8 (17.8%) | 0 (0.0%) |
| 75 Years and over | 0 (0.0%) | 2 (9.1%) |
Technology Access in West Falls
Computing Device Access in West Falls
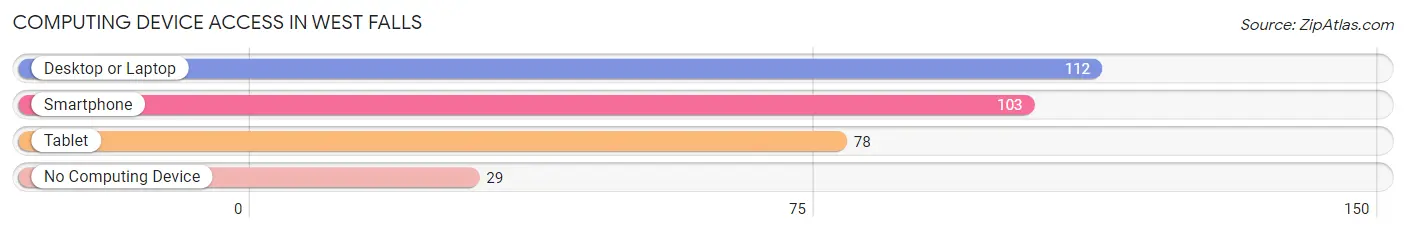
| Device Type | # Households | % Households |
| Desktop or Laptop | 112 | 70.4% |
| Smartphone | 103 | 64.8% |
| Tablet | 78 | 49.1% |
| No Computing Device | 29 | 18.2% |
| Total | 159 | 100.0% |
Internet Access in West Falls
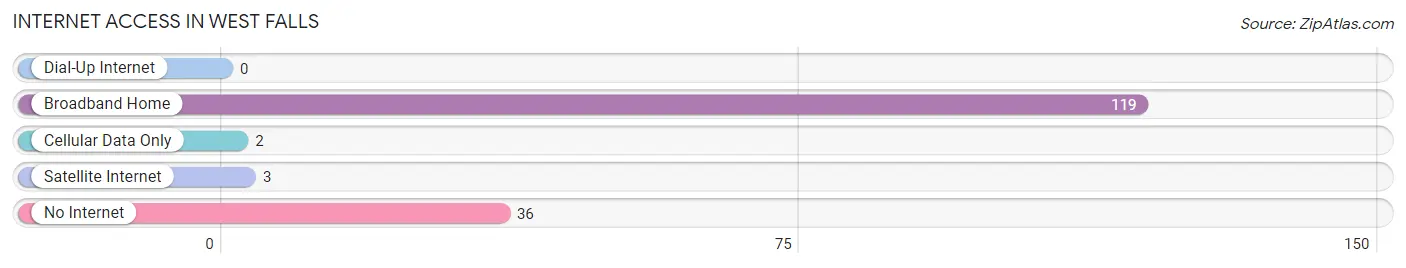
| Internet Type | # Households | % Households |
| Dial-Up Internet | 0 | 0.0% |
| Broadband Home | 119 | 74.8% |
| Cellular Data Only | 2 | 1.3% |
| Satellite Internet | 3 | 1.9% |
| No Internet | 36 | 22.6% |
| Total | 159 | 100.0% |
West Falls Summary
History
West Falls, Pennsylvania is a small borough located in the northwest corner of Bucks County. It was originally part of the larger Falls Township, which was established in 1725. The area was first settled by Quakers in the early 1700s, and the first recorded deed in the area was in 1737. The area was known as “Falls of the Delaware” and was part of the larger Falls Township until 1876, when it was incorporated as a borough.
The area was primarily agricultural until the late 19th century, when the railroad arrived and the area began to industrialize. The first industry in the area was a paper mill, which was established in 1876. This was followed by a brickyard, a sawmill, and a gristmill. The area also became a popular summer resort destination, with several hotels and resorts being built in the late 19th and early 20th centuries.
Geography
West Falls is located in the northwest corner of Bucks County, Pennsylvania. It is bordered by Falls Township to the north, Middletown Township to the east, Warwick Township to the south, and Nockamixon Township to the west. The borough is situated on the Delaware River, and is approximately 25 miles north of Philadelphia.
The borough has a total area of 1.2 square miles, all of which is land. The terrain is mostly flat, with some rolling hills in the northern part of the borough. The climate is humid continental, with hot, humid summers and cold, snowy winters.
Economy
West Falls has a diverse economy, with a mix of manufacturing, retail, and service industries. The largest employers in the borough are the paper mill, the brickyard, and the sawmill. Other major employers include a variety of retail stores, restaurants, and professional services.
The borough also has a thriving tourism industry, with several hotels and resorts located in the area. The Delaware River is a popular destination for fishing, boating, and other outdoor activities.
Demographics
As of the 2010 census, West Falls had a population of 1,845. The racial makeup of the borough was 94.3% White, 2.2% African American, 0.3% Native American, 0.7% Asian, 0.1% Pacific Islander, and 2.4% from other races. Hispanic or Latino of any race were 3.2% of the population.
The median household income in West Falls was $50,938, and the median family income was $60,938. The per capita income was $25,938. About 6.3% of families and 8.2% of the population were below the poverty line, including 10.2% of those under age 18 and 5.2% of those age 65 or over.
Common Questions
What is Per Capita Income in West Falls?
Per Capita income in West Falls is $38,543.
What is the Median Family Income in West Falls?
Median Family Income in West Falls is $73,125.
What is the Median Household income in West Falls?
Median Household Income in West Falls is $52,422.
What is Income or Wage Gap in West Falls?
Income or Wage Gap in West Falls is 18.9%.
Women in West Falls earn 81.1 cents for every dollar earned by a man.
What is Inequality or Gini Index in West Falls?
Inequality or Gini Index in West Falls is 0.44.
What is the Total Population of West Falls?
Total Population of West Falls is 308.
What is the Total Male Population of West Falls?
Total Male Population of West Falls is 152.
What is the Total Female Population of West Falls?
Total Female Population of West Falls is 156.
What is the Ratio of Males per 100 Females in West Falls?
There are 97.44 Males per 100 Females in West Falls.
What is the Ratio of Females per 100 Males in West Falls?
There are 102.63 Females per 100 Males in West Falls.
What is the Median Population Age in West Falls?
Median Population Age in West Falls is 59.2 Years.
What is the Average Family Size in West Falls
Average Family Size in West Falls is 2.5 People.
What is the Average Household Size in West Falls
Average Household Size in West Falls is 1.9 People.
How Large is the Labor Force in West Falls?
There are 150 People in the Labor Forcein in West Falls.
What is the Percentage of People in the Labor Force in West Falls?
54.0% of People are in the Labor Force in West Falls.
What is the Unemployment Rate in West Falls?
Unemployment Rate in West Falls is 8.8%.