Allport, PA Map & Demographics
Allport Map
Allport Overview
$34,032
PER CAPITA INCOME
$115,688
AVG FAMILY INCOME
$115,688
AVG HOUSEHOLD INCOME
22.9%
WAGE / INCOME GAP [ % ]
77.1¢/ $1
WAGE / INCOME GAP [ $ ]
0.15
INEQUALITY / GINI INDEX
280
TOTAL POPULATION
112
MALE POPULATION
168
FEMALE POPULATION
66.67
MALES / 100 FEMALES
150.00
FEMALES / 100 MALES
40.4
MEDIAN AGE
3.3
AVG FAMILY SIZE
3.3
AVG HOUSEHOLD SIZE
203
LABOR FORCE [ PEOPLE ]
85.3%
PERCENT IN LABOR FORCE
Allport Zip Codes
Allport Area Codes
Income in Allport
Income Overview in Allport
Per Capita Income in Allport is $34,032, while median incomes of families and households are $115,688 and $115,688 respectively.
| Characteristic | Number | Measure |
| Per Capita Income | 280 | $34,032 |
| Median Family Income | 85 | $115,688 |
| Mean Family Income | 85 | $110,465 |
| Median Household Income | 85 | $115,688 |
| Mean Household Income | 85 | $110,465 |
| Income Deficit | 85 | $0 |
| Wage / Income Gap (%) | 280 | 22.87% |
| Wage / Income Gap ($) | 280 | 77.13¢ per $1 |
| Gini / Inequality Index | 280 | 0.15 |
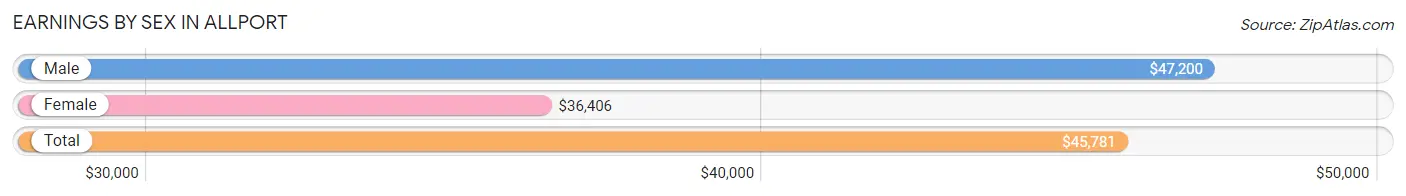
Earnings by Sex in Allport
Average Earnings in Allport are $45,781, $47,200 for men and $36,406 for women, a difference of 22.9%.
| Sex | Number | Average Earnings |
| Male | 100 (44.3%) | $47,200 |
| Female | 126 (55.7%) | $36,406 |
| Total | 226 (100.0%) | $45,781 |
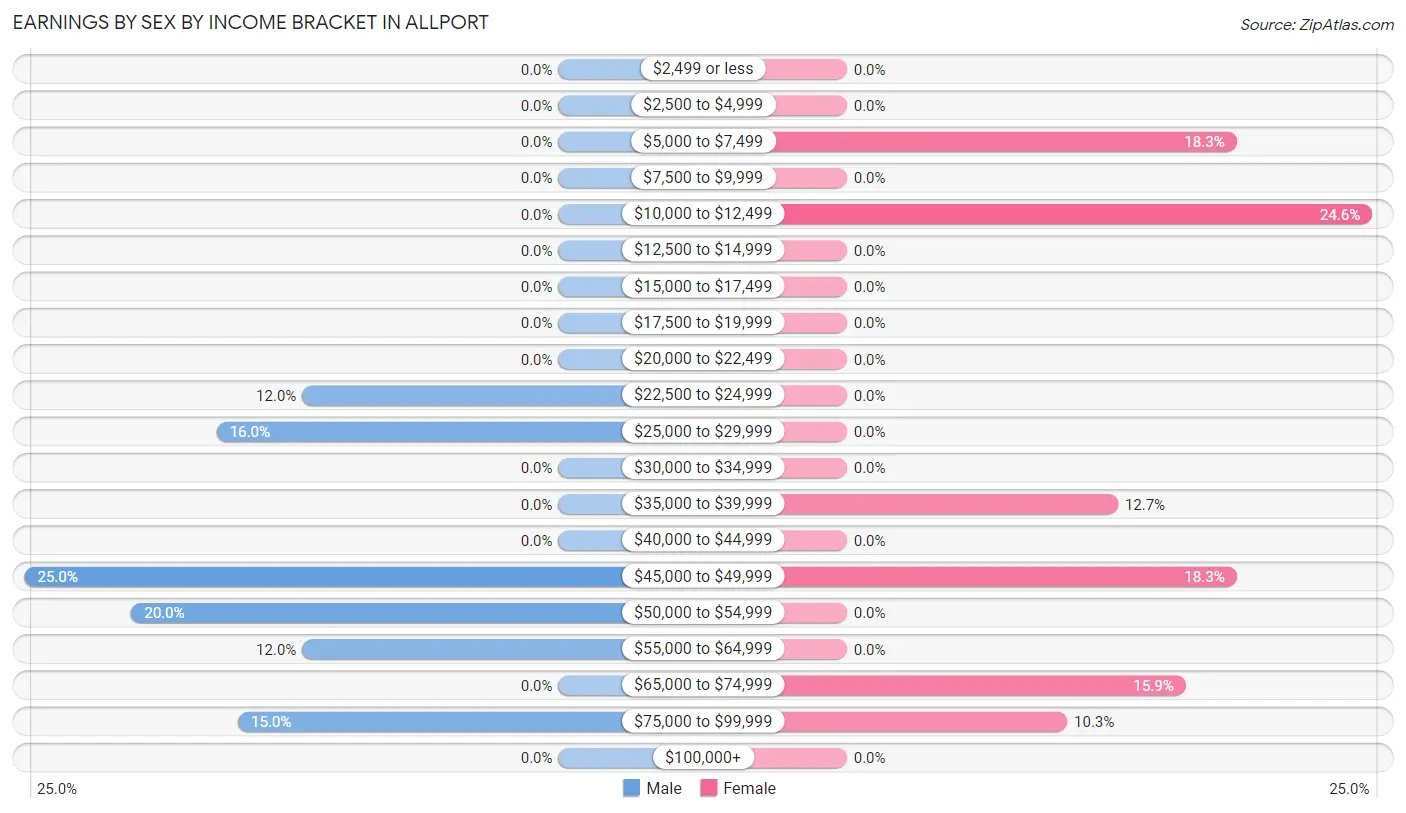
Earnings by Sex by Income Bracket in Allport
The most common earnings brackets in Allport are $45,000 to $49,999 for men (25 | 25.0%) and $10,000 to $12,499 for women (31 | 24.6%).
| Income | Male | Female |
| $2,499 or less | 0 (0.0%) | 0 (0.0%) |
| $2,500 to $4,999 | 0 (0.0%) | 0 (0.0%) |
| $5,000 to $7,499 | 0 (0.0%) | 23 (18.2%) |
| $7,500 to $9,999 | 0 (0.0%) | 0 (0.0%) |
| $10,000 to $12,499 | 0 (0.0%) | 31 (24.6%) |
| $12,500 to $14,999 | 0 (0.0%) | 0 (0.0%) |
| $15,000 to $17,499 | 0 (0.0%) | 0 (0.0%) |
| $17,500 to $19,999 | 0 (0.0%) | 0 (0.0%) |
| $20,000 to $22,499 | 0 (0.0%) | 0 (0.0%) |
| $22,500 to $24,999 | 12 (12.0%) | 0 (0.0%) |
| $25,000 to $29,999 | 16 (16.0%) | 0 (0.0%) |
| $30,000 to $34,999 | 0 (0.0%) | 0 (0.0%) |
| $35,000 to $39,999 | 0 (0.0%) | 16 (12.7%) |
| $40,000 to $44,999 | 0 (0.0%) | 0 (0.0%) |
| $45,000 to $49,999 | 25 (25.0%) | 23 (18.2%) |
| $50,000 to $54,999 | 20 (20.0%) | 0 (0.0%) |
| $55,000 to $64,999 | 12 (12.0%) | 0 (0.0%) |
| $65,000 to $74,999 | 0 (0.0%) | 20 (15.9%) |
| $75,000 to $99,999 | 15 (15.0%) | 13 (10.3%) |
| $100,000+ | 0 (0.0%) | 0 (0.0%) |
| Total | 100 (100.0%) | 126 (100.0%) |
Earnings by Sex by Educational Attainment in Allport

| Educational Attainment | Male Income | Female Income |
| Less than High School | - | - |
| High School Diploma | $46,850 | $0 |
| College or Associate's Degree | - | - |
| Bachelor's Degree | - | - |
| Graduate Degree | - | - |
| Total | $50,375 | $45,489 |
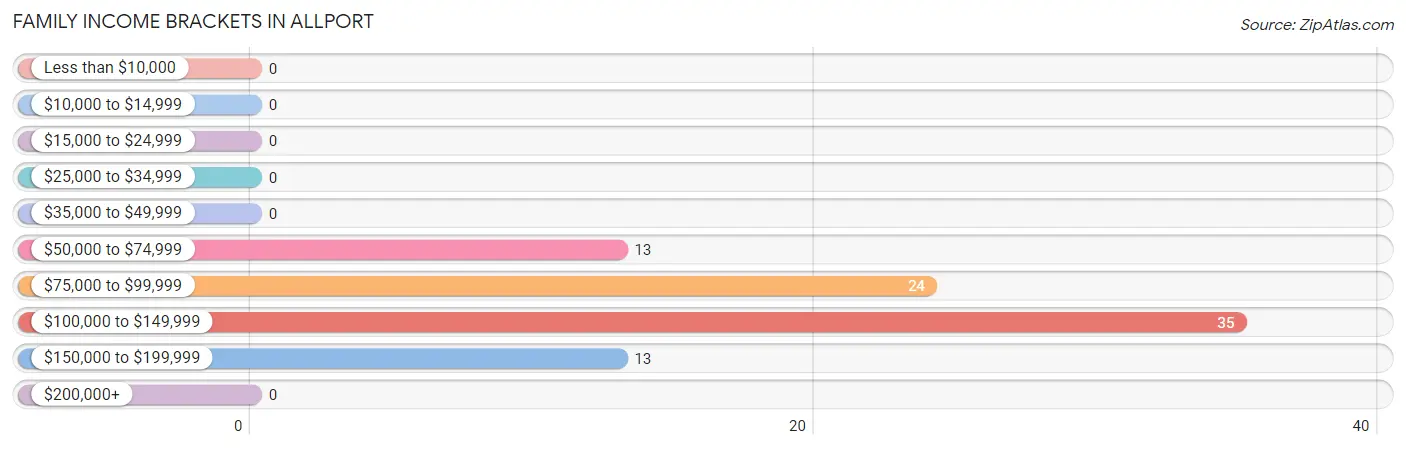
Family Income in Allport
Family Income Brackets in Allport
According to the Allport family income data, there are 35 families falling into the $100,000 to $149,999 income range, which is the most common income bracket and makes up 41.2% of all families.
| Income Bracket | # Families | % Families |
| Less than $10,000 | 0 | 0.0% |
| $10,000 to $14,999 | 0 | 0.0% |
| $15,000 to $24,999 | 0 | 0.0% |
| $25,000 to $34,999 | 0 | 0.0% |
| $35,000 to $49,999 | 0 | 0.0% |
| $50,000 to $74,999 | 13 | 15.3% |
| $75,000 to $99,999 | 24 | 28.2% |
| $100,000 to $149,999 | 35 | 41.2% |
| $150,000 to $199,999 | 13 | 15.3% |
| $200,000+ | 0 | 0.0% |
Family Income by Famaliy Size in Allport
| Income Bracket | # Families | Median Income |
| 2-Person Families | 25 (29.4%) | $0 |
| 3-Person Families | 27 (31.8%) | $0 |
| 4-Person Families | 33 (38.8%) | $0 |
| 5-Person Families | 0 (0.0%) | $0 |
| 6-Person Families | 0 (0.0%) | $0 |
| 7+ Person Families | 0 (0.0%) | $0 |
| Total | 85 (100.0%) | $115,688 |
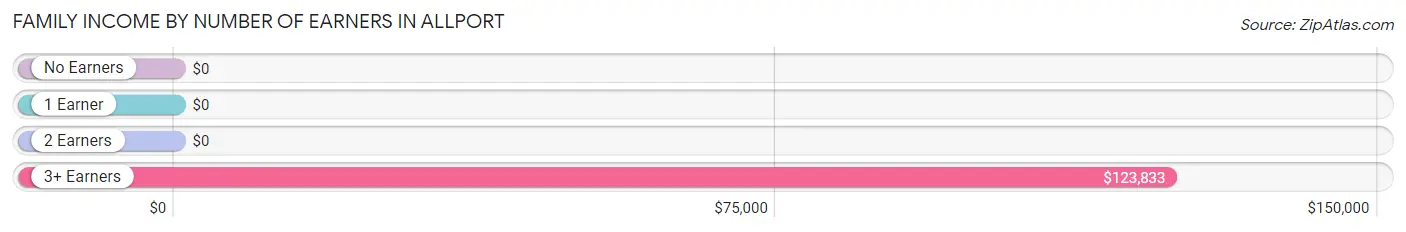
Family Income by Number of Earners in Allport
| Number of Earners | # Families | Median Income |
| No Earners | 0 (0.0%) | $0 |
| 1 Earner | 13 (15.3%) | $0 |
| 2 Earners | 32 (37.7%) | $0 |
| 3+ Earners | 40 (47.1%) | $123,833 |
| Total | 85 (100.0%) | $115,688 |
Household Income in Allport
Household Income Brackets in Allport
With 35 households falling in the category, the $100,000 to $149,999 income range is the most frequent in Allport, accounting for 41.2% of all households.
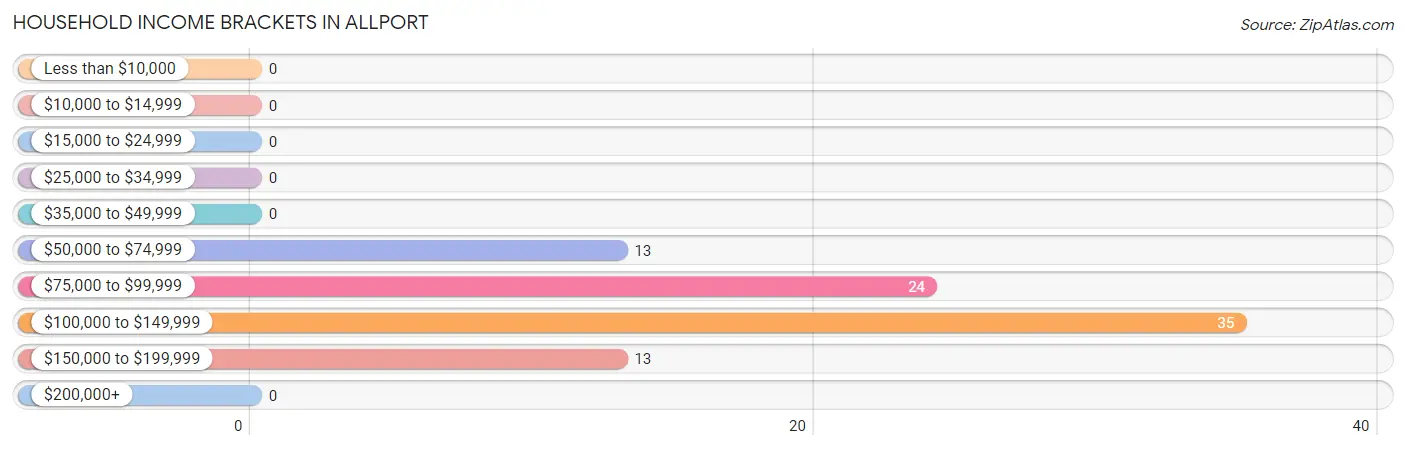
| Income Bracket | # Households | % Households |
| Less than $10,000 | 0 | 0.0% |
| $10,000 to $14,999 | 0 | 0.0% |
| $15,000 to $24,999 | 0 | 0.0% |
| $25,000 to $34,999 | 0 | 0.0% |
| $35,000 to $49,999 | 0 | 0.0% |
| $50,000 to $74,999 | 13 | 15.3% |
| $75,000 to $99,999 | 24 | 28.2% |
| $100,000 to $149,999 | 35 | 41.2% |
| $150,000 to $199,999 | 13 | 15.3% |
| $200,000+ | 0 | 0.0% |
Household Income by Householder Age in Allport
The median household income in Allport is $115,688, with the highest median household income of $96,563 found in the 45 to 64 years age bracket for the primary householder. A total of 65 households (76.5%) fall into this category.
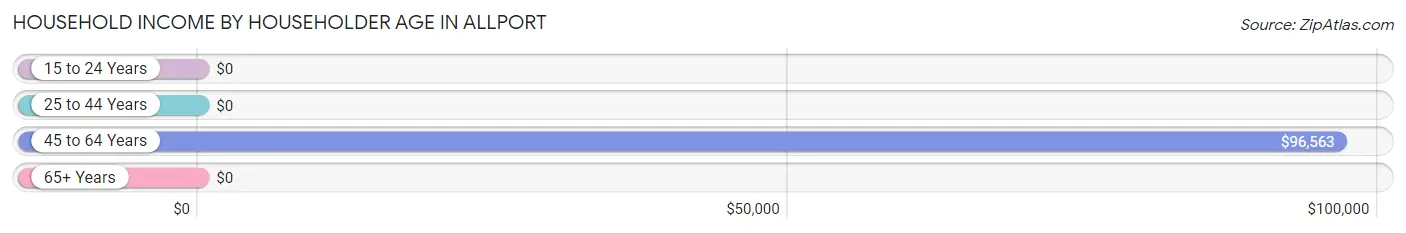
| Income Bracket | # Households | Median Income |
| 15 to 24 Years | 0 (0.0%) | $0 |
| 25 to 44 Years | 20 (23.5%) | $0 |
| 45 to 64 Years | 65 (76.5%) | $96,563 |
| 65+ Years | 0 (0.0%) | $0 |
| Total | 85 (100.0%) | $115,688 |
Poverty in Allport
Income Below Poverty by Sex and Age in Allport
| Age Bracket | Male | Female |
| Under 5 Years | 0 (0.0%) | 0 (0.0%) |
| 5 Years | 0 (0.0%) | 0 (0.0%) |
| 6 to 11 Years | 0 (0.0%) | 0 (0.0%) |
| 12 to 14 Years | 0 (0.0%) | 0 (0.0%) |
| 15 Years | 0 (0.0%) | 0 (0.0%) |
| 16 and 17 Years | 0 (0.0%) | 0 (0.0%) |
| 18 to 24 Years | 0 (0.0%) | 0 (0.0%) |
| 25 to 34 Years | 0 (0.0%) | 0 (0.0%) |
| 35 to 44 Years | 0 (0.0%) | 0 (0.0%) |
| 45 to 54 Years | 0 (0.0%) | 0 (0.0%) |
| 55 to 64 Years | 0 (0.0%) | 0 (0.0%) |
| 65 to 74 Years | 0 (0.0%) | 0 (0.0%) |
| 75 Years and over | 0 (0.0%) | 0 (0.0%) |
| Total | 0 (0.0%) | 0 (0.0%) |
Income Above Poverty by Sex and Age in Allport
According to the poverty statistics in Allport, males aged 18 to 24 years and females aged 6 to 11 years are the age groups that are most secure financially, with 100.0% of males and 100.0% of females in these age groups living above the poverty line.
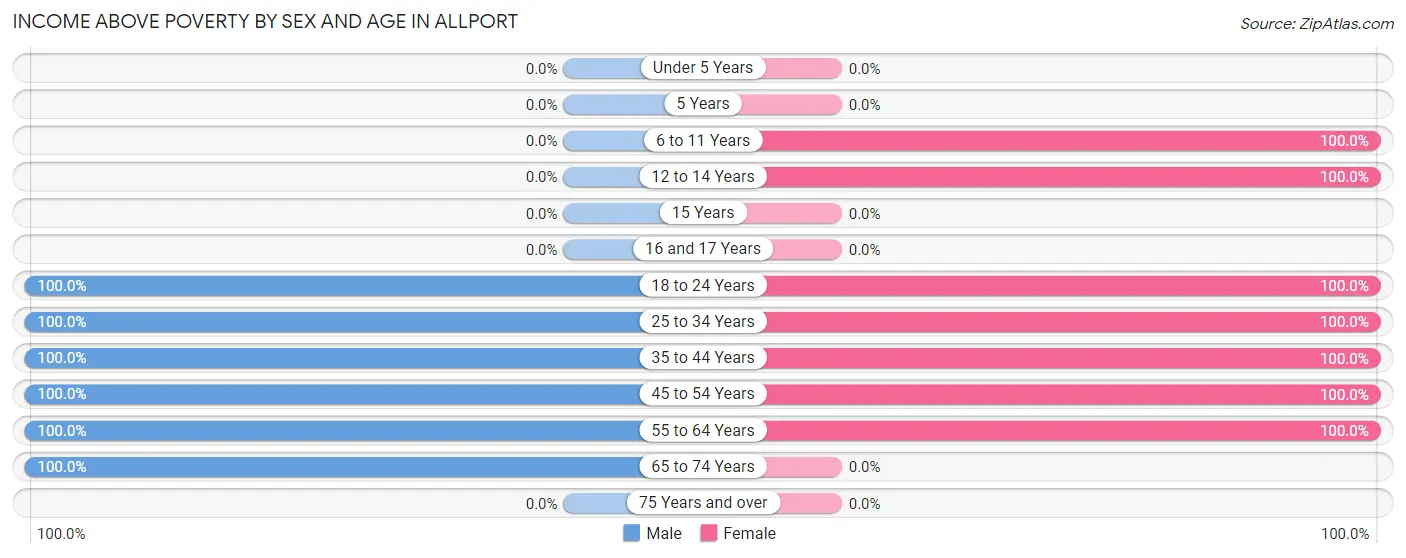
| Age Bracket | Male | Female |
| Under 5 Years | 0 (0.0%) | 0 (0.0%) |
| 5 Years | 0 (0.0%) | 0 (0.0%) |
| 6 to 11 Years | 0 (0.0%) | 21 (100.0%) |
| 12 to 14 Years | 0 (0.0%) | 21 (100.0%) |
| 15 Years | 0 (0.0%) | 0 (0.0%) |
| 16 and 17 Years | 0 (0.0%) | 0 (0.0%) |
| 18 to 24 Years | 12 (100.0%) | 23 (100.0%) |
| 25 to 34 Years | 16 (100.0%) | 19 (100.0%) |
| 35 to 44 Years | 20 (100.0%) | 36 (100.0%) |
| 45 to 54 Years | 27 (100.0%) | 10 (100.0%) |
| 55 to 64 Years | 25 (100.0%) | 38 (100.0%) |
| 65 to 74 Years | 12 (100.0%) | 0 (0.0%) |
| 75 Years and over | 0 (0.0%) | 0 (0.0%) |
| Total | 112 (100.0%) | 168 (100.0%) |
Income Below Poverty Among Married-Couple Families in Allport
| Children | Above Poverty | Below Poverty |
| No Children | 65 (100.0%) | 0 (0.0%) |
| 1 or 2 Children | 20 (100.0%) | 0 (0.0%) |
| 3 or 4 Children | 0 (0.0%) | 0 (0.0%) |
| 5 or more Children | 0 (0.0%) | 0 (0.0%) |
| Total | 85 (100.0%) | 0 (0.0%) |
Income Below Poverty Among Single-Parent Households in Allport
| Children | Single Father | Single Mother |
| No Children | 0 (0.0%) | 0 (0.0%) |
| 1 or 2 Children | 0 (0.0%) | 0 (0.0%) |
| 3 or 4 Children | 0 (0.0%) | 0 (0.0%) |
| 5 or more Children | 0 (0.0%) | 0 (0.0%) |
| Total | 0 (0.0%) | 0 (0.0%) |
Income Below Poverty Among Married-Couple vs Single-Parent Households in Allport
| Children | Married-Couple Families | Single-Parent Households |
| No Children | 0 (0.0%) | 0 (0.0%) |
| 1 or 2 Children | 0 (0.0%) | 0 (0.0%) |
| 3 or 4 Children | 0 (0.0%) | 0 (0.0%) |
| 5 or more Children | 0 (0.0%) | 0 (0.0%) |
| Total | 0 (0.0%) | 0 (0.0%) |
Race in Allport
The most populous races in Allport are , and White / Caucasian (280 | 100.0%).
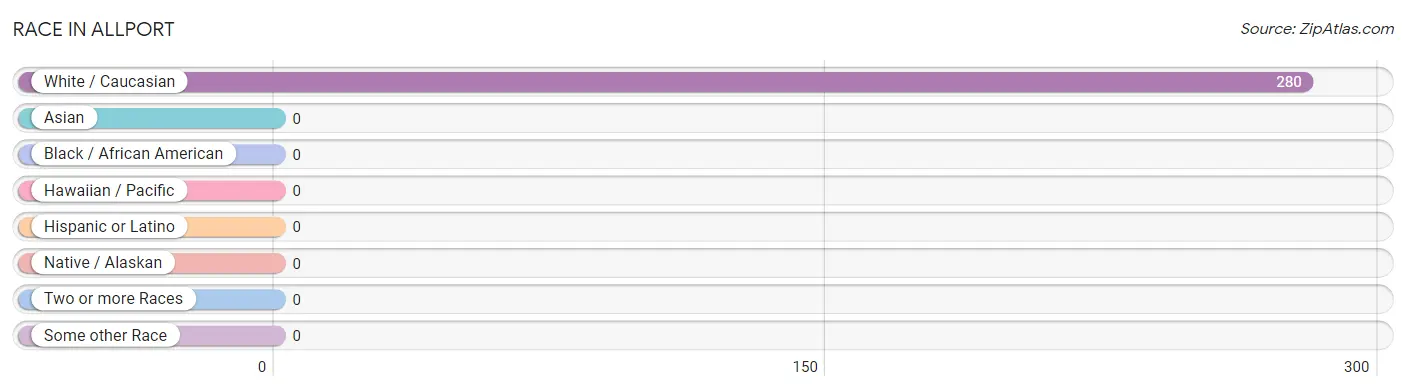
| Race | # Population | % Population |
| Asian | 0 | 0.0% |
| Black / African American | 0 | 0.0% |
| Hawaiian / Pacific | 0 | 0.0% |
| Hispanic or Latino | 0 | 0.0% |
| Native / Alaskan | 0 | 0.0% |
| White / Caucasian | 280 | 100.0% |
| Two or more Races | 0 | 0.0% |
| Some other Race | 0 | 0.0% |
| Total | 280 | 100.0% |
Ancestry in Allport
The most populous ancestries reported in Allport are Dutch (38 | 13.6%), English (25 | 8.9%), American (22 | 7.9%), German (16 | 5.7%), and Polish (16 | 5.7%), together accounting for 41.8% of all Allport residents.
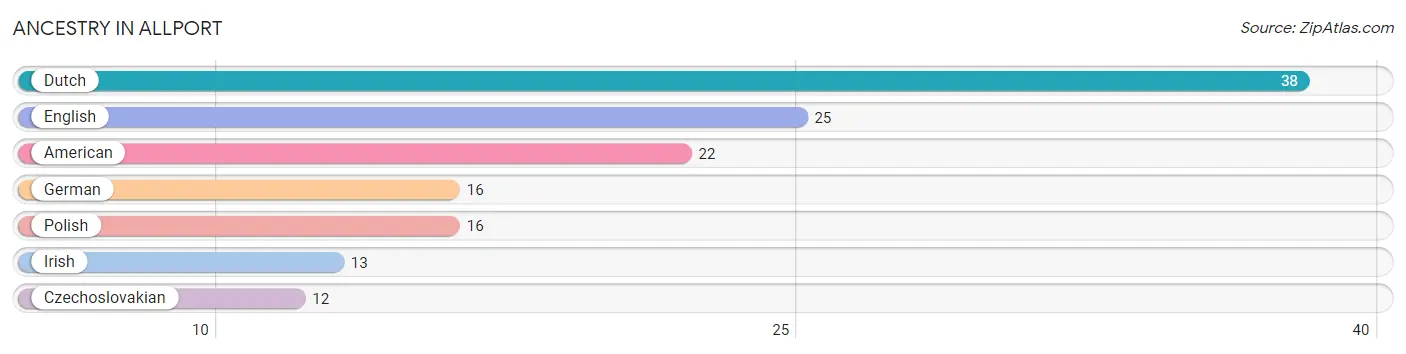
| Ancestry | # Population | % Population |
| American | 22 | 7.9% |
| Czechoslovakian | 12 | 4.3% |
| Dutch | 38 | 13.6% |
| English | 25 | 8.9% |
| German | 16 | 5.7% |
| Irish | 13 | 4.6% |
| Polish | 16 | 5.7% | View All 7 Rows |
Immigrants in Allport

| Immigration Origin | # Population | % Population | View All 0 Rows |
Sex and Age in Allport
Sex and Age in Allport
The most populous age groups in Allport are 40 to 44 Years (20 | 17.9%) for men and 10 to 14 Years (42 | 25.0%) for women.
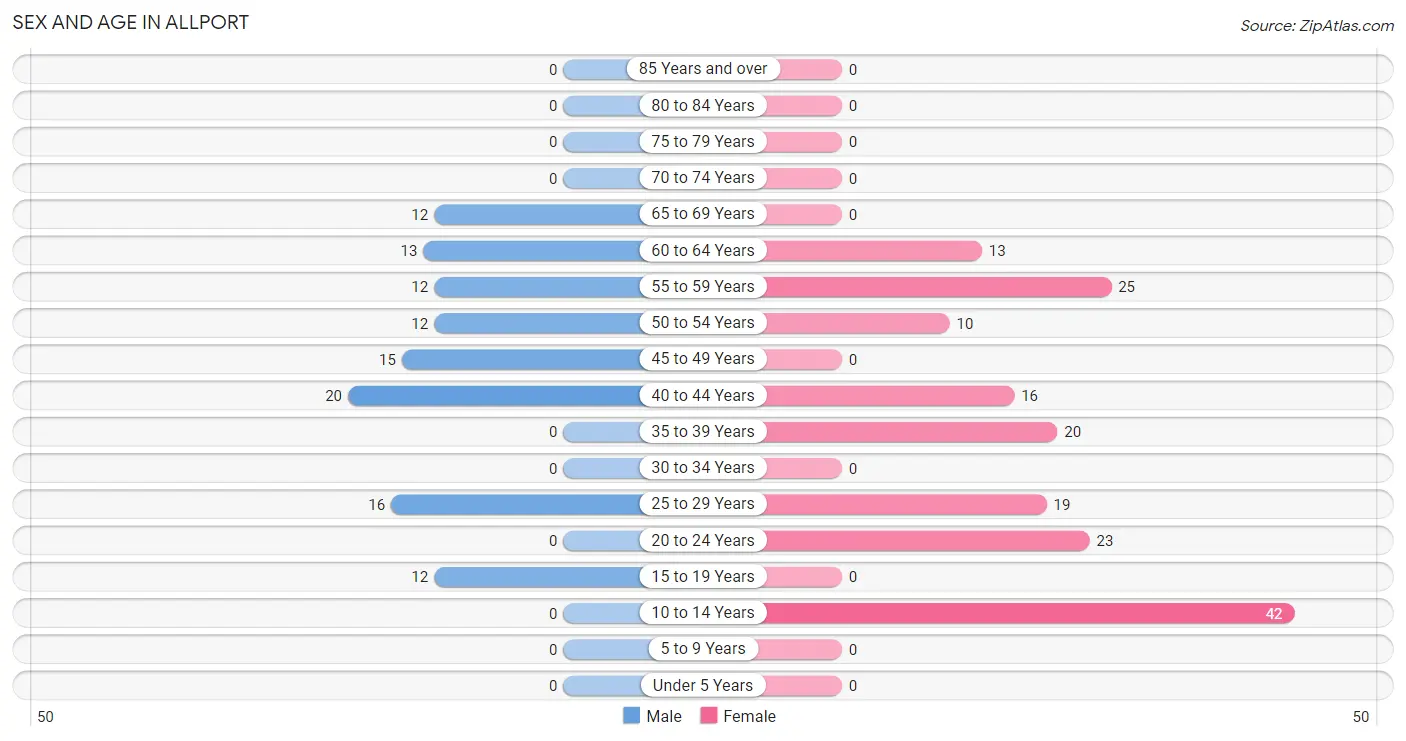
| Age Bracket | Male | Female |
| Under 5 Years | 0 (0.0%) | 0 (0.0%) |
| 5 to 9 Years | 0 (0.0%) | 0 (0.0%) |
| 10 to 14 Years | 0 (0.0%) | 42 (25.0%) |
| 15 to 19 Years | 12 (10.7%) | 0 (0.0%) |
| 20 to 24 Years | 0 (0.0%) | 23 (13.7%) |
| 25 to 29 Years | 16 (14.3%) | 19 (11.3%) |
| 30 to 34 Years | 0 (0.0%) | 0 (0.0%) |
| 35 to 39 Years | 0 (0.0%) | 20 (11.9%) |
| 40 to 44 Years | 20 (17.9%) | 16 (9.5%) |
| 45 to 49 Years | 15 (13.4%) | 0 (0.0%) |
| 50 to 54 Years | 12 (10.7%) | 10 (5.9%) |
| 55 to 59 Years | 12 (10.7%) | 25 (14.9%) |
| 60 to 64 Years | 13 (11.6%) | 13 (7.7%) |
| 65 to 69 Years | 12 (10.7%) | 0 (0.0%) |
| 70 to 74 Years | 0 (0.0%) | 0 (0.0%) |
| 75 to 79 Years | 0 (0.0%) | 0 (0.0%) |
| 80 to 84 Years | 0 (0.0%) | 0 (0.0%) |
| 85 Years and over | 0 (0.0%) | 0 (0.0%) |
| Total | 112 (100.0%) | 168 (100.0%) |
Families and Households in Allport
Median Family Size in Allport
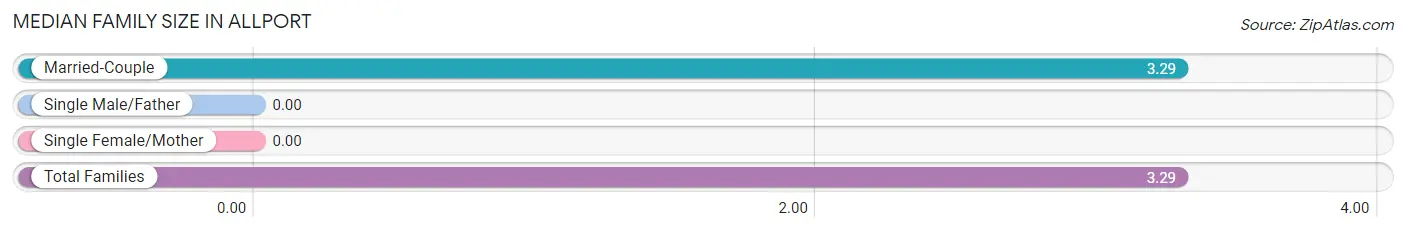
| Family Type | # Families | Family Size |
| Married-Couple | 85 (100.0%) | 3.29 |
| Single Male/Father | 0 (0.0%) | - |
| Single Female/Mother | 0 (0.0%) | - |
| Total Families | 85 (100.0%) | 3.29 |
Median Household Size in Allport
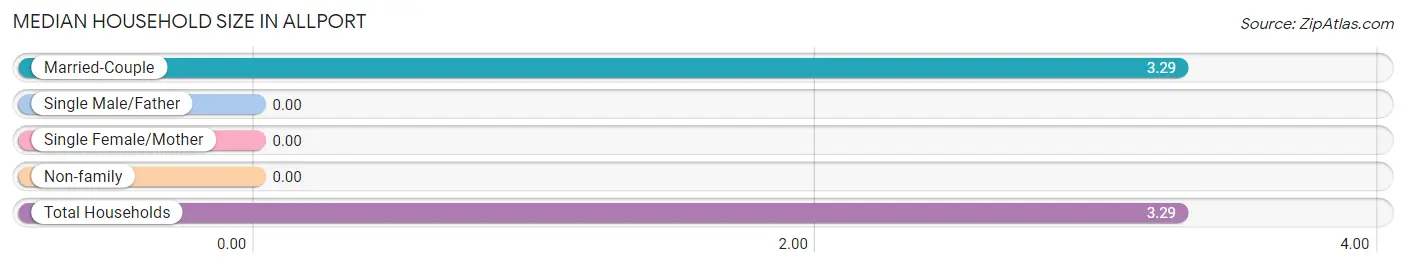
| Household Type | # Households | Household Size |
| Married-Couple | 85 (100.0%) | 3.29 |
| Single Male/Father | 0 (0.0%) | - |
| Single Female/Mother | 0 (0.0%) | - |
| Non-family | 0 (0.0%) | - |
| Total Households | 85 (100.0%) | 3.29 |
Household Size by Marriage Status in Allport
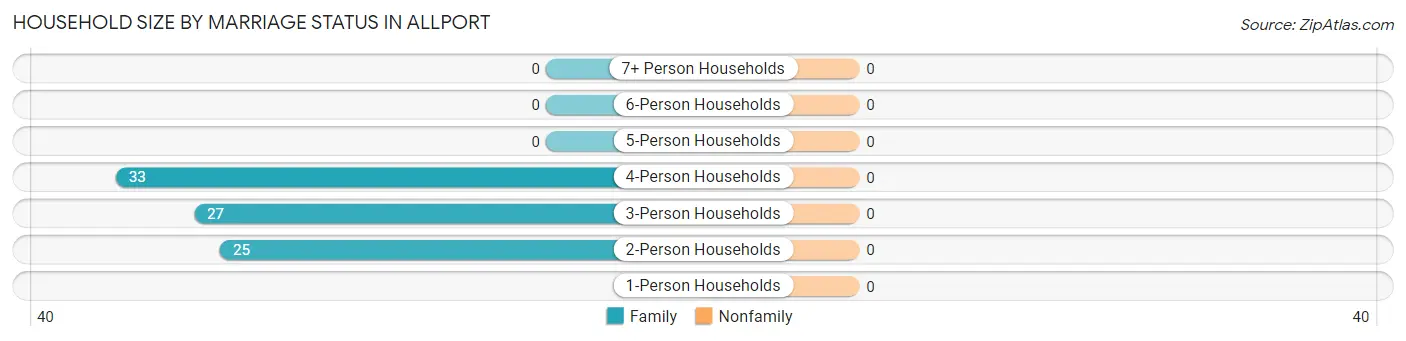
| Household Size | Family Households | Nonfamily Households |
| 1-Person Households | - | 0 (0.0%) |
| 2-Person Households | 25 (29.4%) | 0 (0.0%) |
| 3-Person Households | 27 (31.8%) | 0 (0.0%) |
| 4-Person Households | 33 (38.8%) | 0 (0.0%) |
| 5-Person Households | 0 (0.0%) | 0 (0.0%) |
| 6-Person Households | 0 (0.0%) | 0 (0.0%) |
| 7+ Person Households | 0 (0.0%) | 0 (0.0%) |
| Total | 85 (100.0%) | 0 (0.0%) |
Female Fertility in Allport
Fertility by Age in Allport
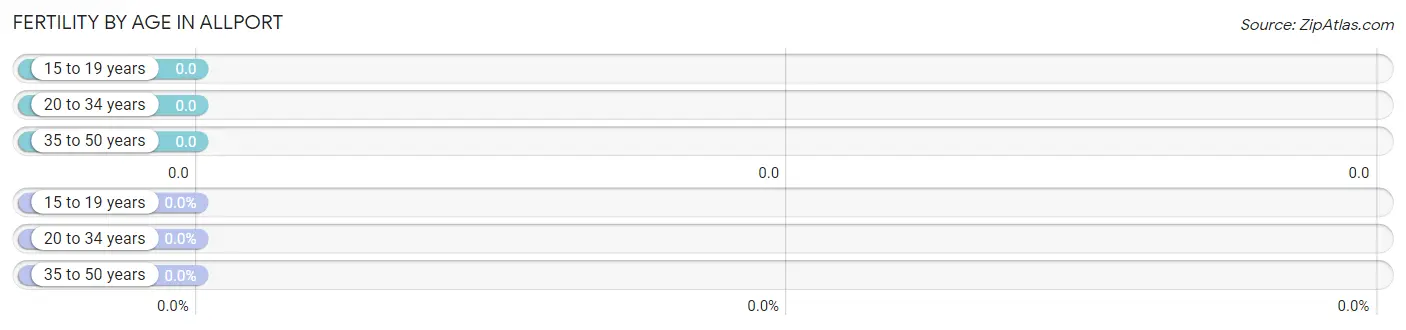
| Age Bracket | Women with Births | Births / 1,000 Women |
| 15 to 19 years | 0 (0.0%) | 0.0 |
| 20 to 34 years | 0 (0.0%) | 0.0 |
| 35 to 50 years | 0 (0.0%) | 0.0 |
| Total | 0 (0.0%) | 0.0 |
Fertility by Age by Marriage Status in Allport
| Age Bracket | Married | Unmarried |
| 15 to 19 years | 0 (0.0%) | 0 (0.0%) |
| 20 to 34 years | 0 (0.0%) | 0 (0.0%) |
| 35 to 50 years | 0 (0.0%) | 0 (0.0%) |
| Total | 0 (0.0%) | 0 (0.0%) |
Fertility by Education in Allport
| Educational Attainment | Women with Births | Births / 1,000 Women |
| Less than High School | 0 (0.0%) | 0.0 |
| High School Diploma | 0 (0.0%) | 0.0 |
| College or Associate's Degree | 0 (0.0%) | 0.0 |
| Bachelor's Degree | 0 (0.0%) | 0.0 |
| Graduate Degree | 0 (0.0%) | 0.0 |
| Total | 0 (0.0%) | 0.0 |
Fertility by Education by Marriage Status in Allport
| Educational Attainment | Married | Unmarried |
| Less than High School | 0 (0.0%) | 0 (0.0%) |
| High School Diploma | 0 (0.0%) | 0 (0.0%) |
| College or Associate's Degree | 0 (0.0%) | 0 (0.0%) |
| Bachelor's Degree | 0 (0.0%) | 0 (0.0%) |
| Graduate Degree | 0 (0.0%) | 0 (0.0%) |
| Total | 0 (0.0%) | 0 (0.0%) |
Employment Characteristics in Allport
Employment by Class of Employer in Allport
Among the 203 employed individuals in Allport, private company employees (106 | 52.2%), not-for-profit organizations (44 | 21.7%), and state government employees (33 | 16.3%) make up the most common classes of employment.
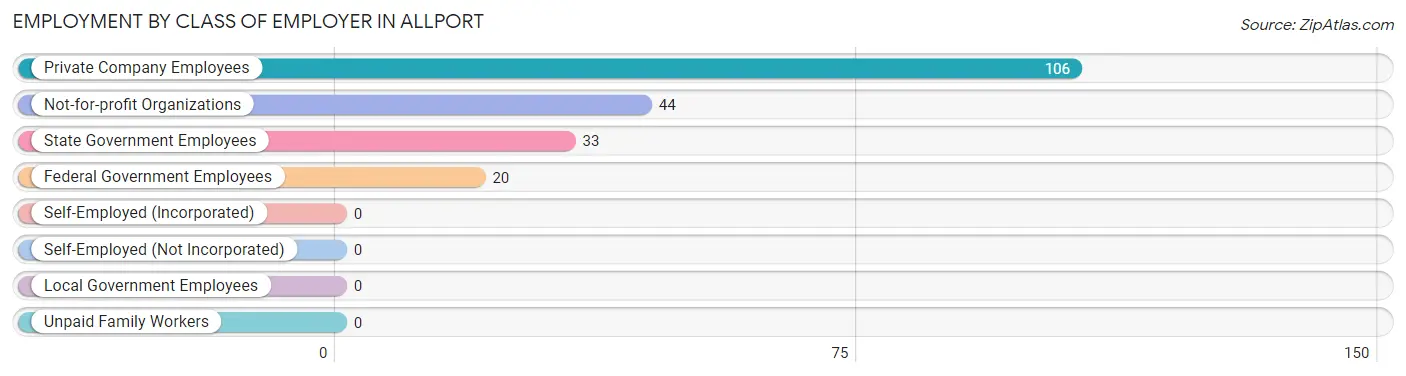
| Employer Class | # Employees | % Employees |
| Private Company Employees | 106 | 52.2% |
| Self-Employed (Incorporated) | 0 | 0.0% |
| Self-Employed (Not Incorporated) | 0 | 0.0% |
| Not-for-profit Organizations | 44 | 21.7% |
| Local Government Employees | 0 | 0.0% |
| State Government Employees | 33 | 16.3% |
| Federal Government Employees | 20 | 9.9% |
| Unpaid Family Workers | 0 | 0.0% |
| Total | 203 | 100.0% |
Employment Status by Age in Allport
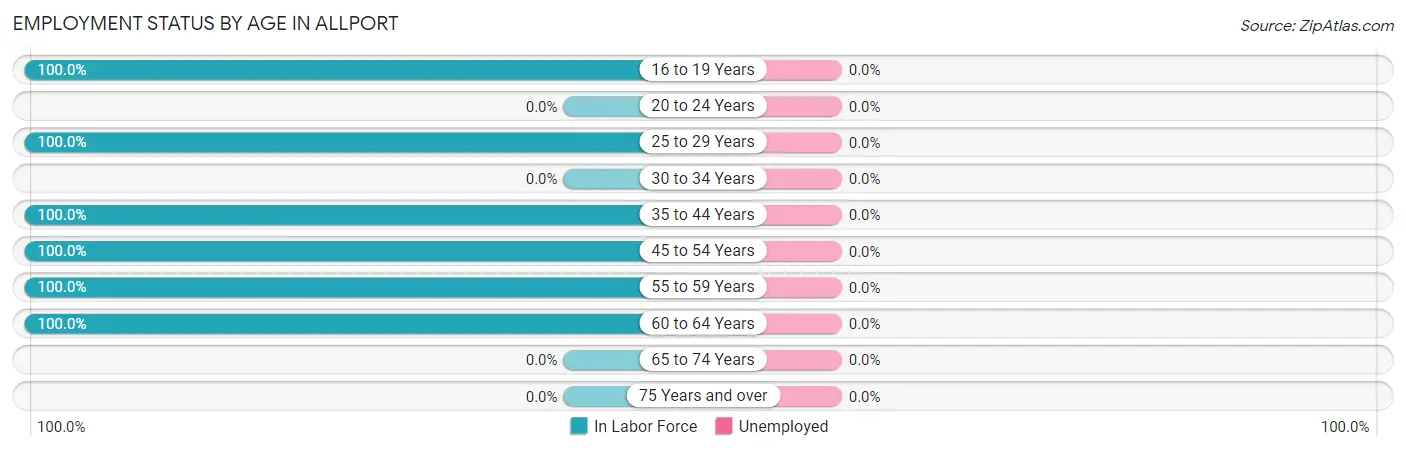
| Age Bracket | In Labor Force | Unemployed |
| 16 to 19 Years | 12 (100.0%) | 0 (0.0%) |
| 20 to 24 Years | 0 (0.0%) | 0 (0.0%) |
| 25 to 29 Years | 35 (100.0%) | 0 (0.0%) |
| 30 to 34 Years | 0 (0.0%) | 0 (0.0%) |
| 35 to 44 Years | 56 (100.0%) | 0 (0.0%) |
| 45 to 54 Years | 37 (100.0%) | 0 (0.0%) |
| 55 to 59 Years | 37 (100.0%) | 0 (0.0%) |
| 60 to 64 Years | 26 (100.0%) | 0 (0.0%) |
| 65 to 74 Years | 0 (0.0%) | 0 (0.0%) |
| 75 Years and over | 0 (0.0%) | 0 (0.0%) |
| Total | 203 (85.3%) | 0 (0.0%) |
Employment Status by Educational Attainment in Allport
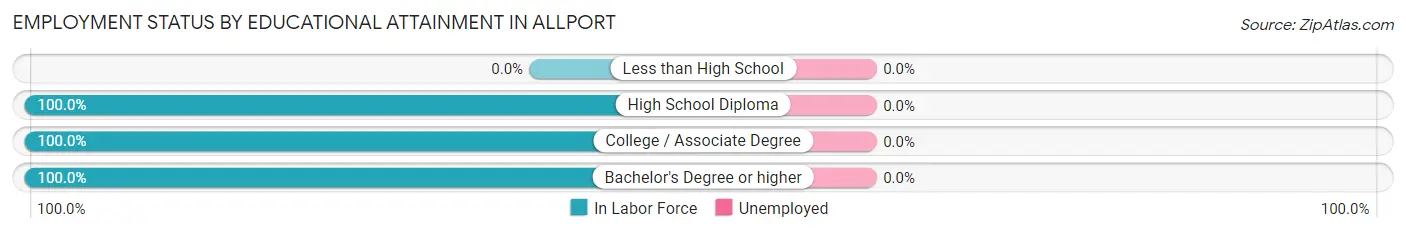
| Educational Attainment | In Labor Force | Unemployed |
| Less than High School | 0 (0.0%) | 0 (0.0%) |
| High School Diploma | 66 (100.0%) | 0 (0.0%) |
| College / Associate Degree | 56 (100.0%) | 0 (0.0%) |
| Bachelor's Degree or higher | 69 (100.0%) | 0 (0.0%) |
| Total | 191 (100.0%) | 0 (0.0%) |
Employment Occupations by Sex in Allport
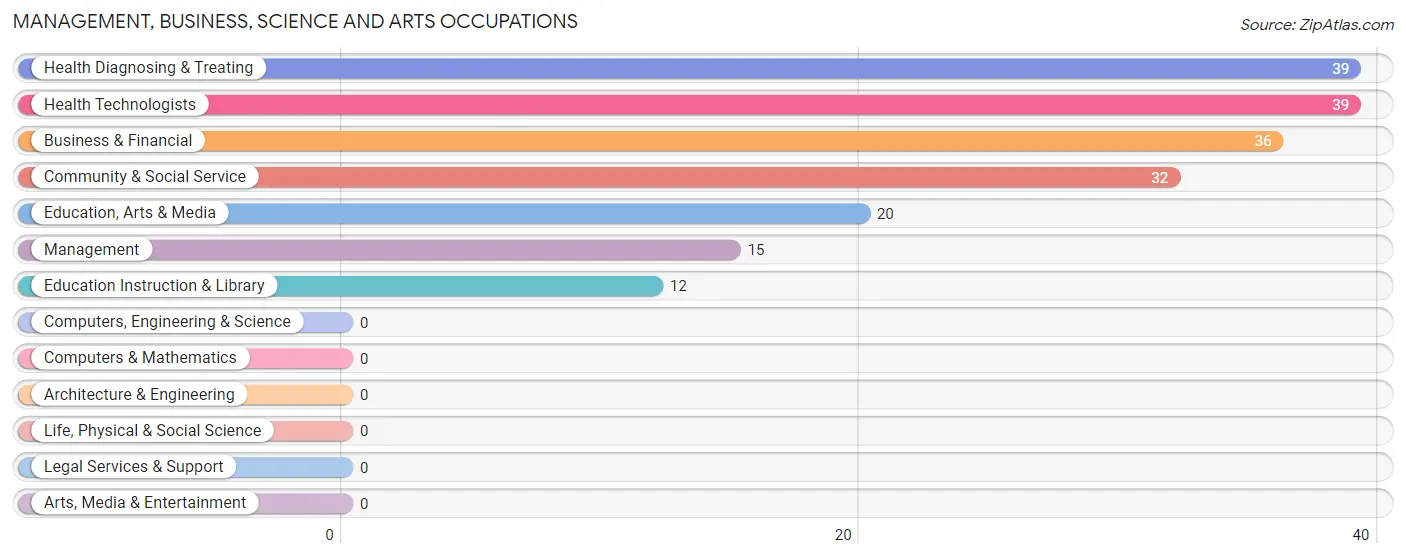
Management, Business, Science and Arts Occupations
The most common Management, Business, Science and Arts occupations in Allport are Health Diagnosing & Treating (39 | 19.2%), Health Technologists (39 | 19.2%), Business & Financial (36 | 17.7%), Community & Social Service (32 | 15.8%), and Education, Arts & Media (20 | 9.9%).
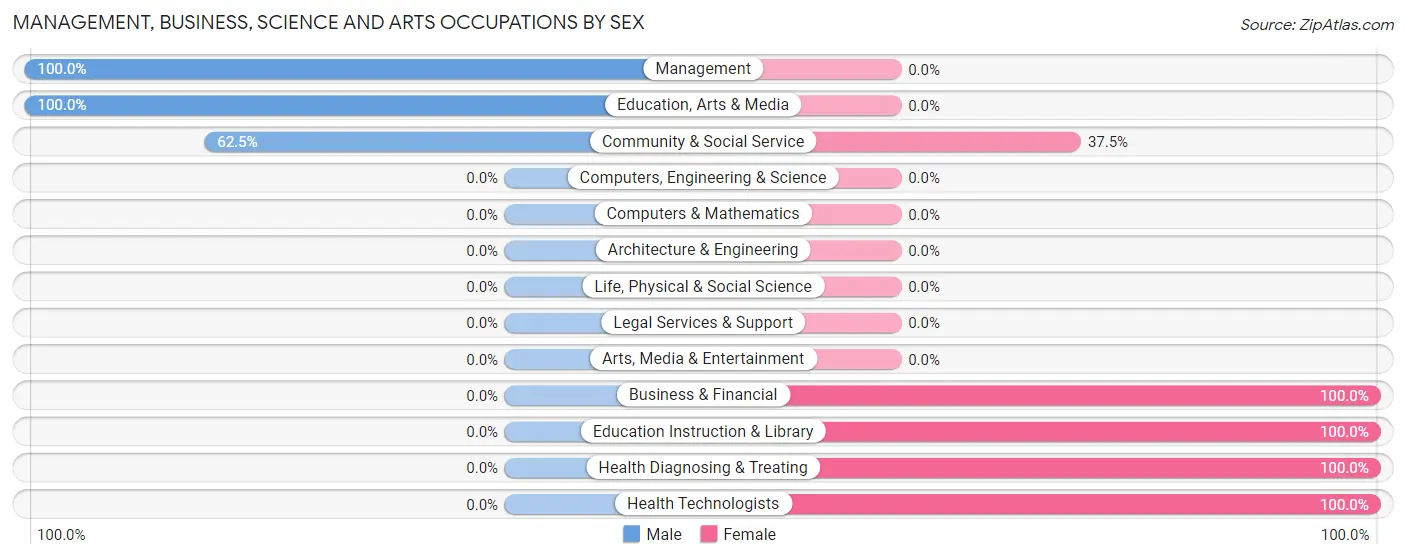
Management, Business, Science and Arts Occupations by Sex
Within the Management, Business, Science and Arts occupations in Allport, the most male-oriented occupations are Management (100.0%), Education, Arts & Media (100.0%), and Community & Social Service (62.5%), while the most female-oriented occupations are Business & Financial (100.0%), Education Instruction & Library (100.0%), and Health Diagnosing & Treating (100.0%).
| Occupation | Male | Female |
| Management | 15 (100.0%) | 0 (0.0%) |
| Business & Financial | 0 (0.0%) | 36 (100.0%) |
| Computers, Engineering & Science | 0 (0.0%) | 0 (0.0%) |
| Computers & Mathematics | 0 (0.0%) | 0 (0.0%) |
| Architecture & Engineering | 0 (0.0%) | 0 (0.0%) |
| Life, Physical & Social Science | 0 (0.0%) | 0 (0.0%) |
| Community & Social Service | 20 (62.5%) | 12 (37.5%) |
| Education, Arts & Media | 20 (100.0%) | 0 (0.0%) |
| Legal Services & Support | 0 (0.0%) | 0 (0.0%) |
| Education Instruction & Library | 0 (0.0%) | 12 (100.0%) |
| Arts, Media & Entertainment | 0 (0.0%) | 0 (0.0%) |
| Health Diagnosing & Treating | 0 (0.0%) | 39 (100.0%) |
| Health Technologists | 0 (0.0%) | 39 (100.0%) |
| Total (Category) | 35 (28.7%) | 87 (71.3%) |
| Total (Overall) | 100 (49.3%) | 103 (50.7%) |
Services Occupations
The most common Services occupations in Allport are , and Cleaning & Maintenance (13 | 6.4%).
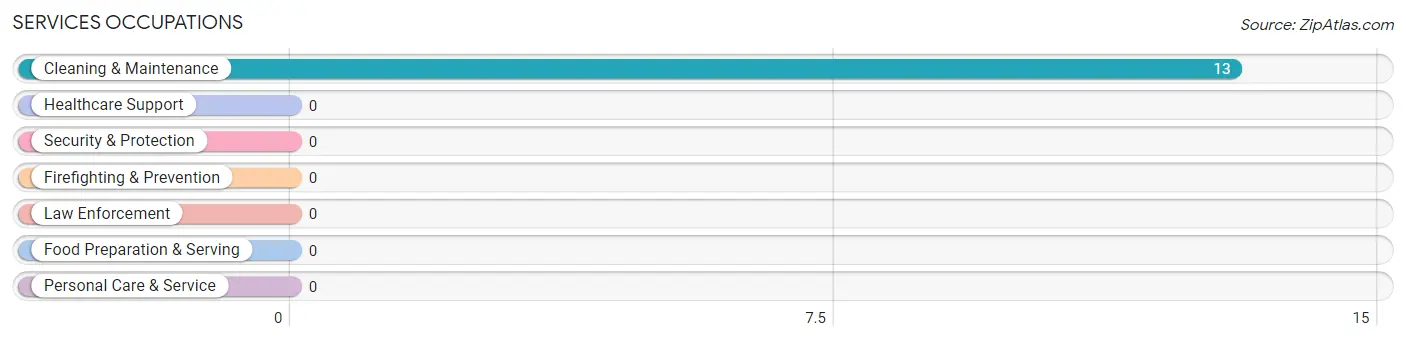
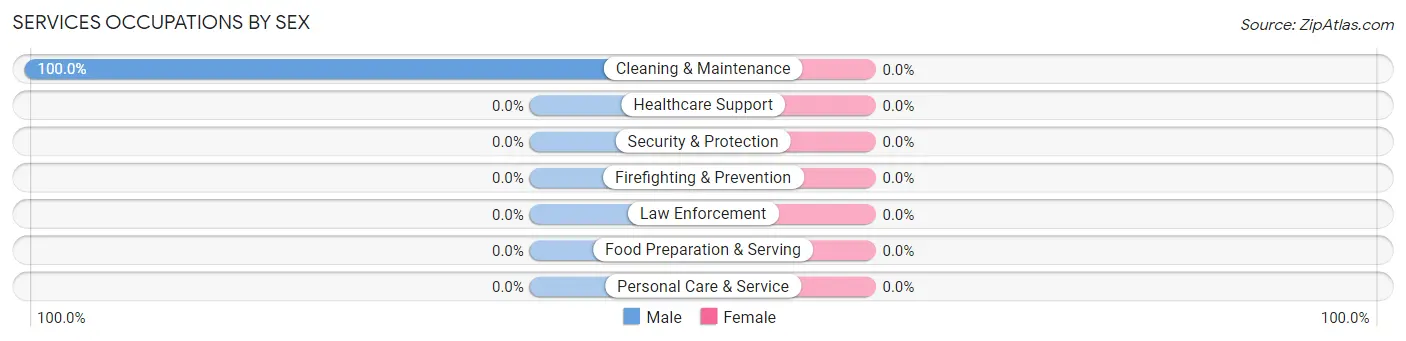
Services Occupations by Sex
| Occupation | Male | Female |
| Healthcare Support | 0 (0.0%) | 0 (0.0%) |
| Security & Protection | 0 (0.0%) | 0 (0.0%) |
| Firefighting & Prevention | 0 (0.0%) | 0 (0.0%) |
| Law Enforcement | 0 (0.0%) | 0 (0.0%) |
| Food Preparation & Serving | 0 (0.0%) | 0 (0.0%) |
| Cleaning & Maintenance | 13 (100.0%) | 0 (0.0%) |
| Personal Care & Service | 0 (0.0%) | 0 (0.0%) |
| Total (Category) | 13 (100.0%) | 0 (0.0%) |
| Total (Overall) | 100 (49.3%) | 103 (50.7%) |
Sales and Office Occupations
The most common Sales and Office occupations in Allport are , and Office & Administration (16 | 7.9%).
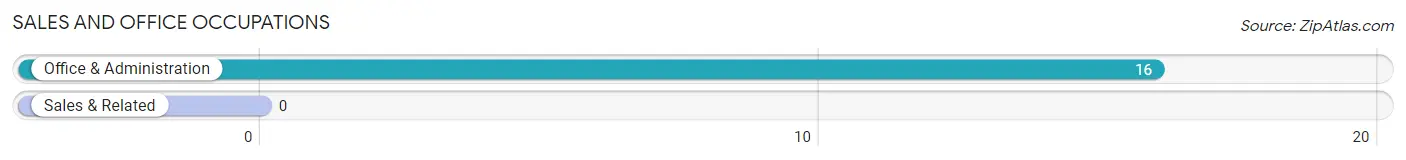
Sales and Office Occupations by Sex

| Occupation | Male | Female |
| Sales & Related | 0 (0.0%) | 0 (0.0%) |
| Office & Administration | 0 (0.0%) | 16 (100.0%) |
| Total (Category) | 0 (0.0%) | 16 (100.0%) |
| Total (Overall) | 100 (49.3%) | 103 (50.7%) |
Natural Resources, Construction and Maintenance Occupations
The most common Natural Resources, Construction and Maintenance occupations in Allport are , and Construction & Extraction (12 | 5.9%).
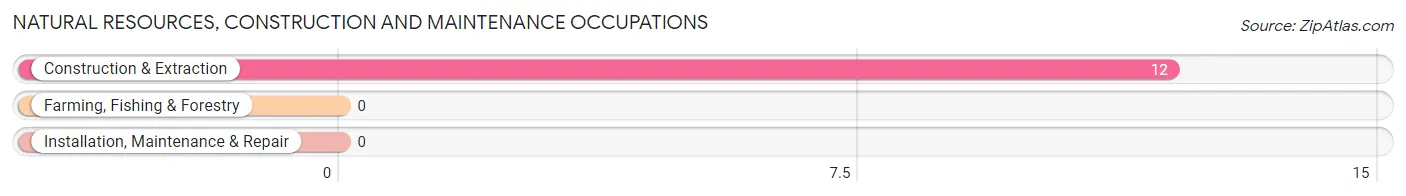
Natural Resources, Construction and Maintenance Occupations by Sex

| Occupation | Male | Female |
| Farming, Fishing & Forestry | 0 (0.0%) | 0 (0.0%) |
| Construction & Extraction | 12 (100.0%) | 0 (0.0%) |
| Installation, Maintenance & Repair | 0 (0.0%) | 0 (0.0%) |
| Total (Category) | 12 (100.0%) | 0 (0.0%) |
| Total (Overall) | 100 (49.3%) | 103 (50.7%) |
Production, Transportation and Moving Occupations
The most common Production, Transportation and Moving occupations in Allport are Material Moving (28 | 13.8%), and Production (12 | 5.9%).
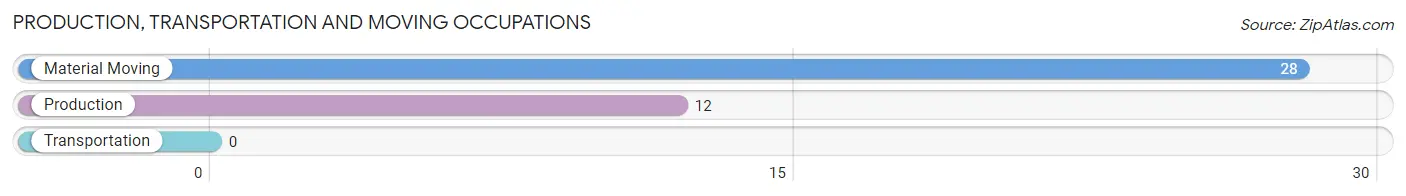
Production, Transportation and Moving Occupations by Sex
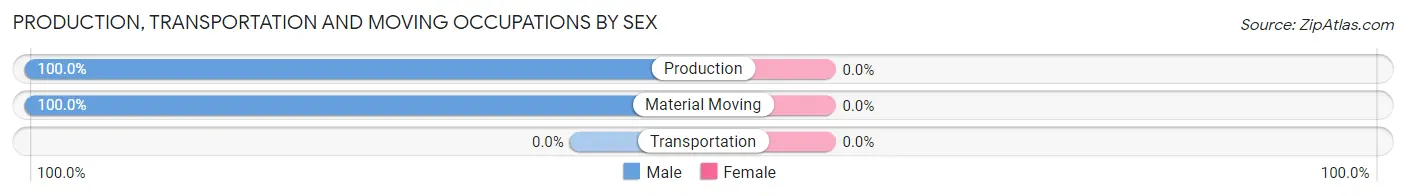
| Occupation | Male | Female |
| Production | 12 (100.0%) | 0 (0.0%) |
| Transportation | 0 (0.0%) | 0 (0.0%) |
| Material Moving | 28 (100.0%) | 0 (0.0%) |
| Total (Category) | 40 (100.0%) | 0 (0.0%) |
| Total (Overall) | 100 (49.3%) | 103 (50.7%) |
Employment Industries by Sex in Allport
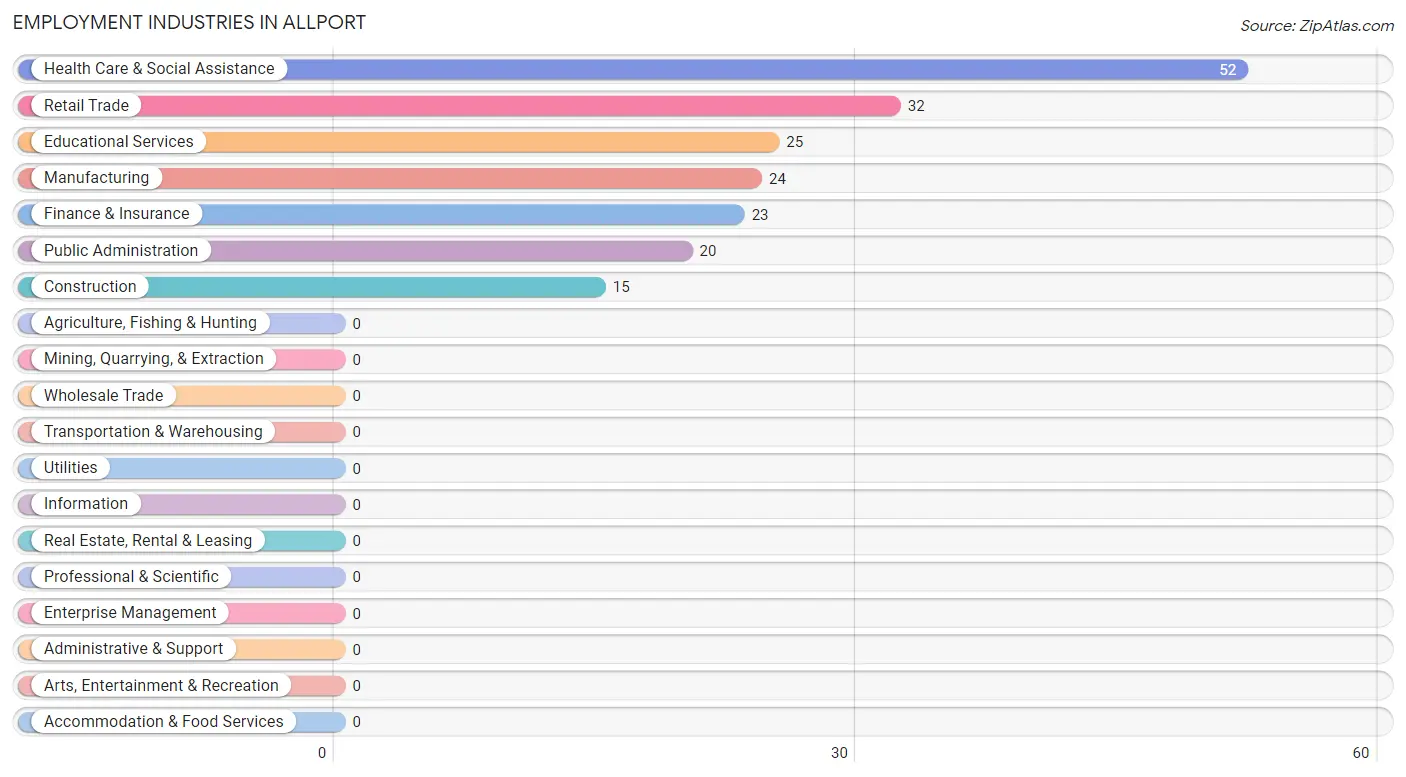
Employment Industries in Allport
The major employment industries in Allport include Health Care & Social Assistance (52 | 25.6%), Retail Trade (32 | 15.8%), Educational Services (25 | 12.3%), Manufacturing (24 | 11.8%), and Finance & Insurance (23 | 11.3%).
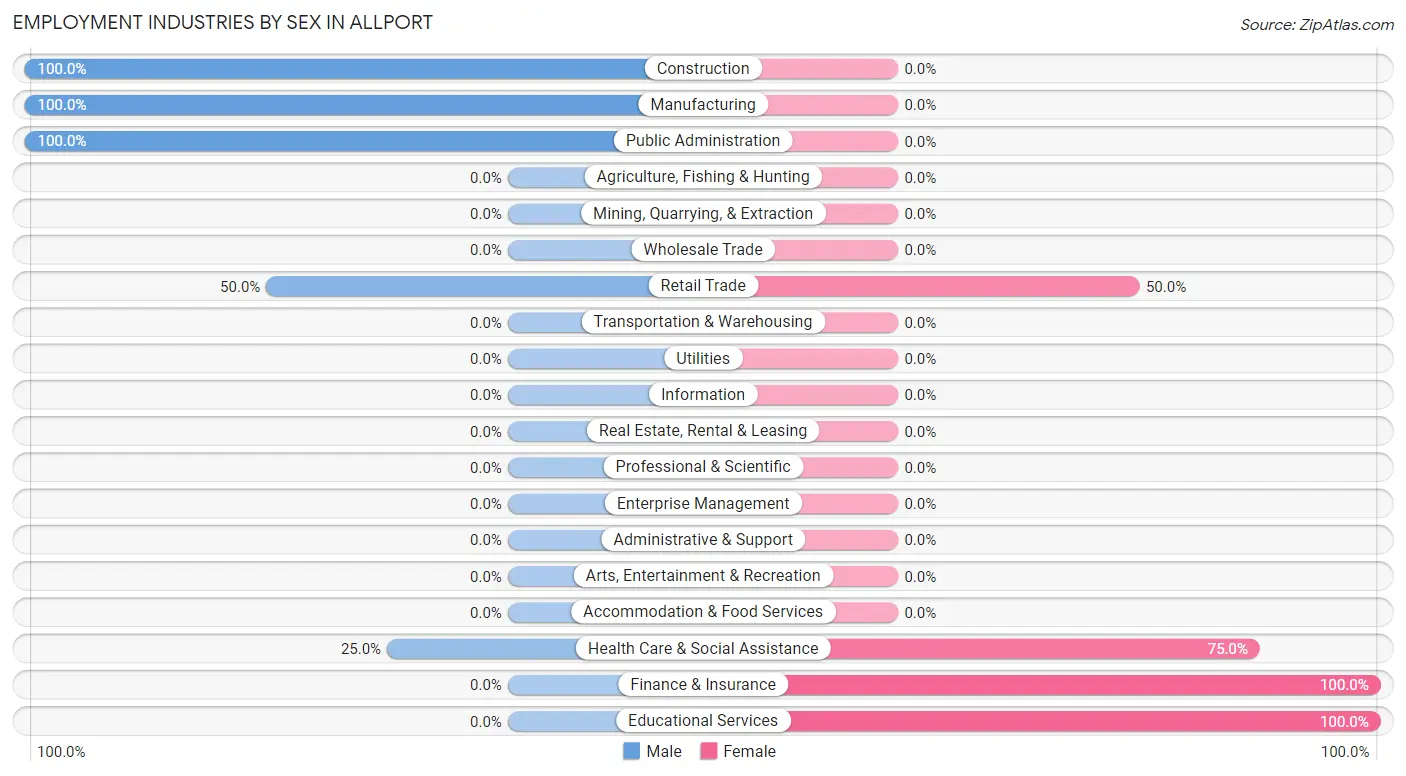
Employment Industries by Sex in Allport
The Allport industries that see more men than women are Construction (100.0%), Manufacturing (100.0%), and Public Administration (100.0%), whereas the industries that tend to have a higher number of women are Finance & Insurance (100.0%), Educational Services (100.0%), and Health Care & Social Assistance (75.0%).
| Industry | Male | Female |
| Agriculture, Fishing & Hunting | 0 (0.0%) | 0 (0.0%) |
| Mining, Quarrying, & Extraction | 0 (0.0%) | 0 (0.0%) |
| Construction | 15 (100.0%) | 0 (0.0%) |
| Manufacturing | 24 (100.0%) | 0 (0.0%) |
| Wholesale Trade | 0 (0.0%) | 0 (0.0%) |
| Retail Trade | 16 (50.0%) | 16 (50.0%) |
| Transportation & Warehousing | 0 (0.0%) | 0 (0.0%) |
| Utilities | 0 (0.0%) | 0 (0.0%) |
| Information | 0 (0.0%) | 0 (0.0%) |
| Finance & Insurance | 0 (0.0%) | 23 (100.0%) |
| Real Estate, Rental & Leasing | 0 (0.0%) | 0 (0.0%) |
| Professional & Scientific | 0 (0.0%) | 0 (0.0%) |
| Enterprise Management | 0 (0.0%) | 0 (0.0%) |
| Administrative & Support | 0 (0.0%) | 0 (0.0%) |
| Educational Services | 0 (0.0%) | 25 (100.0%) |
| Health Care & Social Assistance | 13 (25.0%) | 39 (75.0%) |
| Arts, Entertainment & Recreation | 0 (0.0%) | 0 (0.0%) |
| Accommodation & Food Services | 0 (0.0%) | 0 (0.0%) |
| Public Administration | 20 (100.0%) | 0 (0.0%) |
| Total | 100 (49.3%) | 103 (50.7%) |
Education in Allport
School Enrollment in Allport
The most common levels of schooling among the 65 students in Allport are college / undergraduate (23 | 35.4%), elementary school (21 | 32.3%), and middle school (21 | 32.3%).
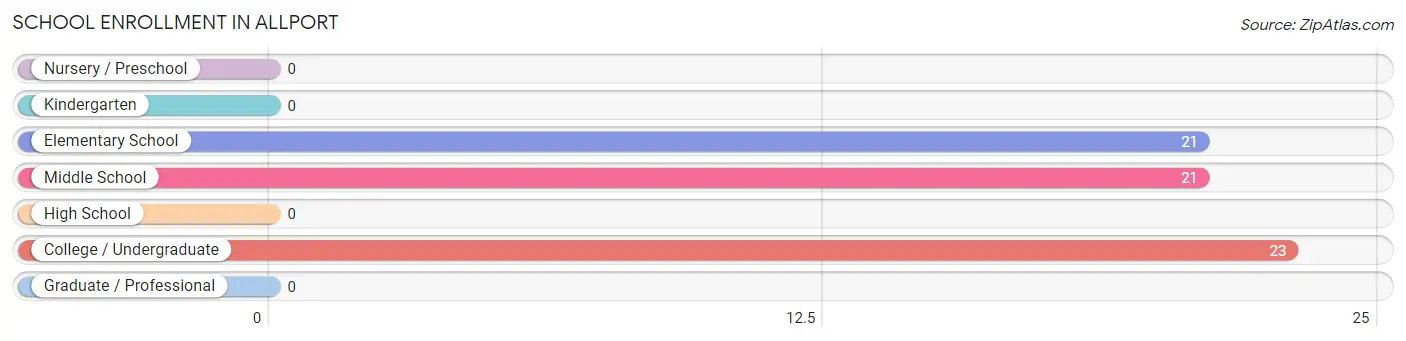
| School Level | # Students | % Students |
| Nursery / Preschool | 0 | 0.0% |
| Kindergarten | 0 | 0.0% |
| Elementary School | 21 | 32.3% |
| Middle School | 21 | 32.3% |
| High School | 0 | 0.0% |
| College / Undergraduate | 23 | 35.4% |
| Graduate / Professional | 0 | 0.0% |
| Total | 65 | 100.0% |
School Enrollment by Age by Funding Source in Allport
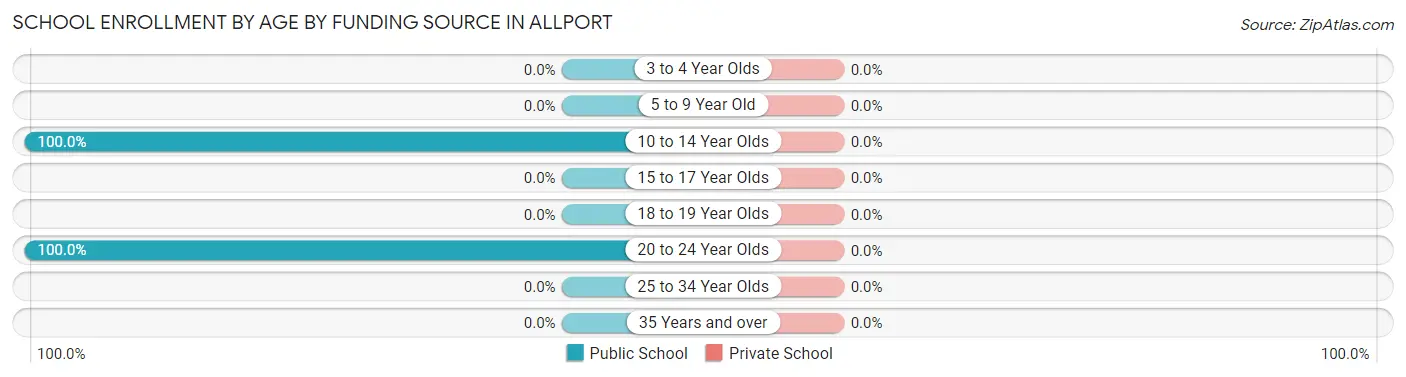
| Age Bracket | Public School | Private School |
| 3 to 4 Year Olds | 0 (0.0%) | 0 (0.0%) |
| 5 to 9 Year Old | 0 (0.0%) | 0 (0.0%) |
| 10 to 14 Year Olds | 42 (100.0%) | 0 (0.0%) |
| 15 to 17 Year Olds | 0 (0.0%) | 0 (0.0%) |
| 18 to 19 Year Olds | 0 (0.0%) | 0 (0.0%) |
| 20 to 24 Year Olds | 23 (100.0%) | 0 (0.0%) |
| 25 to 34 Year Olds | 0 (0.0%) | 0 (0.0%) |
| 35 Years and over | 0 (0.0%) | 0 (0.0%) |
| Total | 65 (100.0%) | 0 (0.0%) |
Educational Attainment by Field of Study in Allport
Arts & humanities (40 | 58.0%), science & technology (19 | 27.5%), and business (10 | 14.5%) are the most common fields of study among 69 individuals in Allport who have obtained a bachelor's degree or higher.
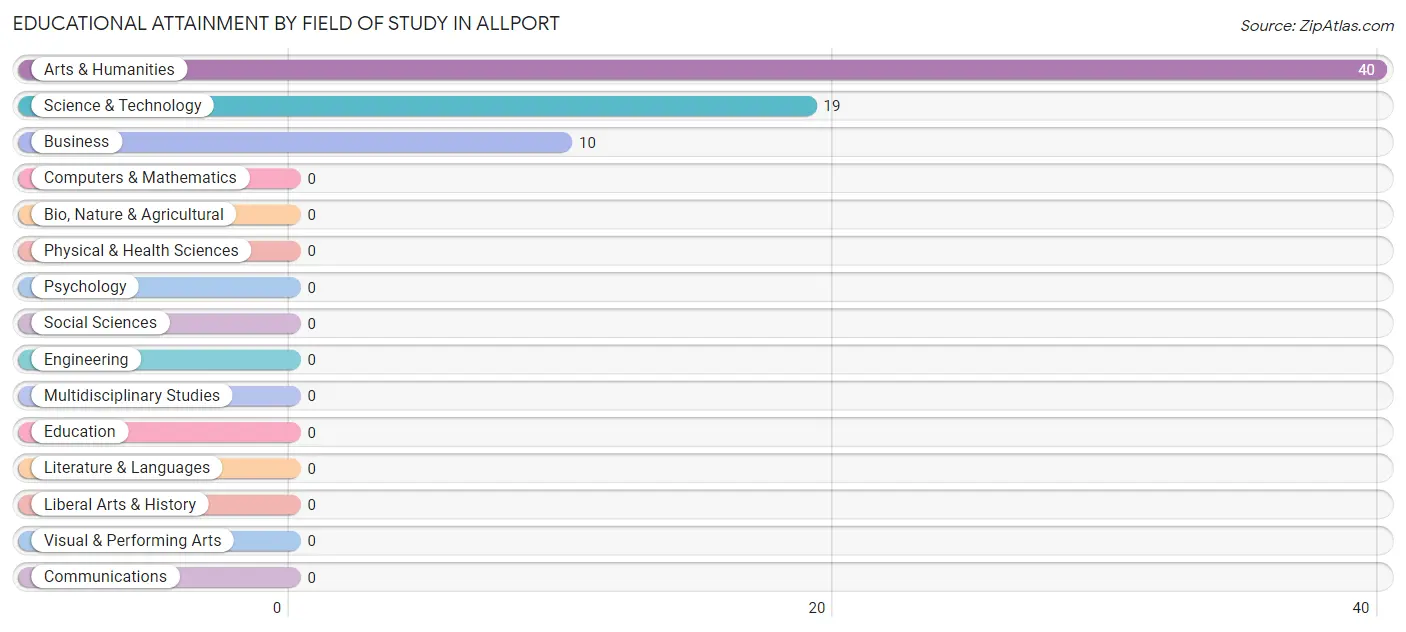
| Field of Study | # Graduates | % Graduates |
| Computers & Mathematics | 0 | 0.0% |
| Bio, Nature & Agricultural | 0 | 0.0% |
| Physical & Health Sciences | 0 | 0.0% |
| Psychology | 0 | 0.0% |
| Social Sciences | 0 | 0.0% |
| Engineering | 0 | 0.0% |
| Multidisciplinary Studies | 0 | 0.0% |
| Science & Technology | 19 | 27.5% |
| Business | 10 | 14.5% |
| Education | 0 | 0.0% |
| Literature & Languages | 0 | 0.0% |
| Liberal Arts & History | 0 | 0.0% |
| Visual & Performing Arts | 0 | 0.0% |
| Communications | 0 | 0.0% |
| Arts & Humanities | 40 | 58.0% |
| Total | 69 | 100.0% |
Transportation & Commute in Allport
Vehicle Availability by Sex in Allport
The most prevalent vehicle ownership categories in Allport are males with 4 vehicles (65, accounting for 65.0%) and females with 4 vehicles (54, making up 63.1%).
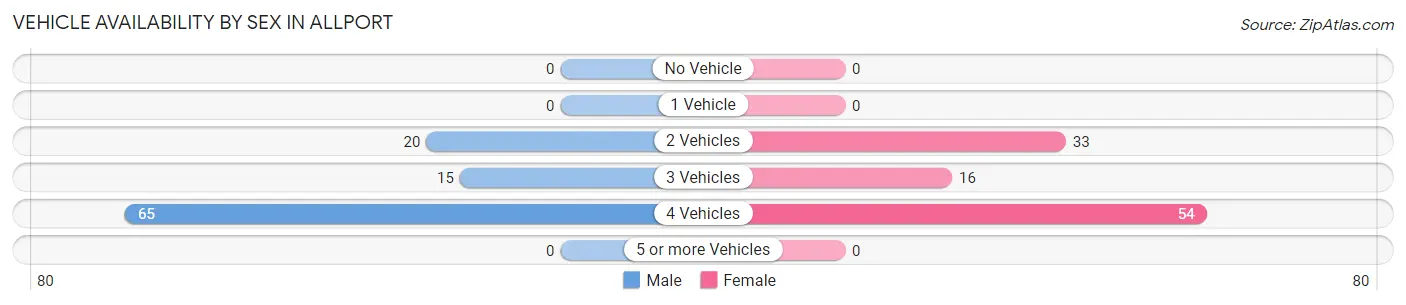
| Vehicles Available | Male | Female |
| No Vehicle | 0 (0.0%) | 0 (0.0%) |
| 1 Vehicle | 0 (0.0%) | 0 (0.0%) |
| 2 Vehicles | 20 (20.0%) | 33 (32.0%) |
| 3 Vehicles | 15 (15.0%) | 16 (15.5%) |
| 4 Vehicles | 65 (65.0%) | 54 (52.4%) |
| 5 or more Vehicles | 0 (0.0%) | 0 (0.0%) |
| Total | 100 (100.0%) | 103 (100.0%) |
Commute Time in Allport
The most frequently occuring commute durations in Allport are 35 to 39 minutes (32 commuters, 19.6%), 30 to 34 minutes (29 commuters, 17.8%), and 20 to 24 minutes (16 commuters, 9.8%).
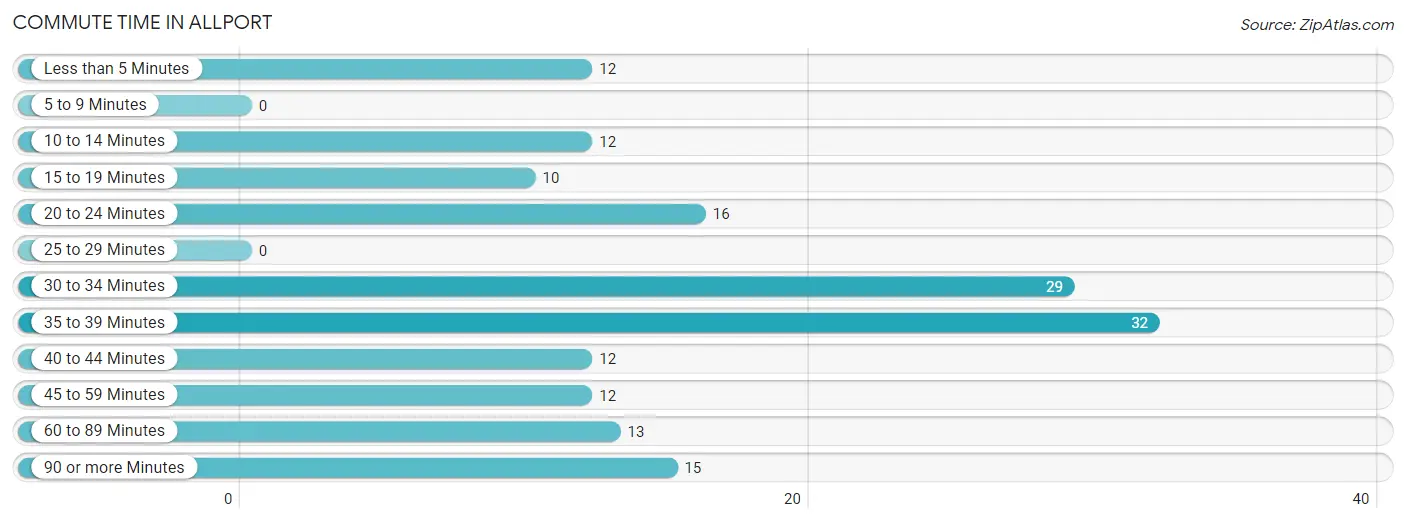
| Commute Time | # Commuters | % Commuters |
| Less than 5 Minutes | 12 | 7.4% |
| 5 to 9 Minutes | 0 | 0.0% |
| 10 to 14 Minutes | 12 | 7.4% |
| 15 to 19 Minutes | 10 | 6.1% |
| 20 to 24 Minutes | 16 | 9.8% |
| 25 to 29 Minutes | 0 | 0.0% |
| 30 to 34 Minutes | 29 | 17.8% |
| 35 to 39 Minutes | 32 | 19.6% |
| 40 to 44 Minutes | 12 | 7.4% |
| 45 to 59 Minutes | 12 | 7.4% |
| 60 to 89 Minutes | 13 | 8.0% |
| 90 or more Minutes | 15 | 9.2% |
Commute Time by Sex in Allport
The most common commute times in Allport are 30 to 34 minutes (16 commuters, 20.0%) for males and 35 to 39 minutes (19 commuters, 22.9%) for females.
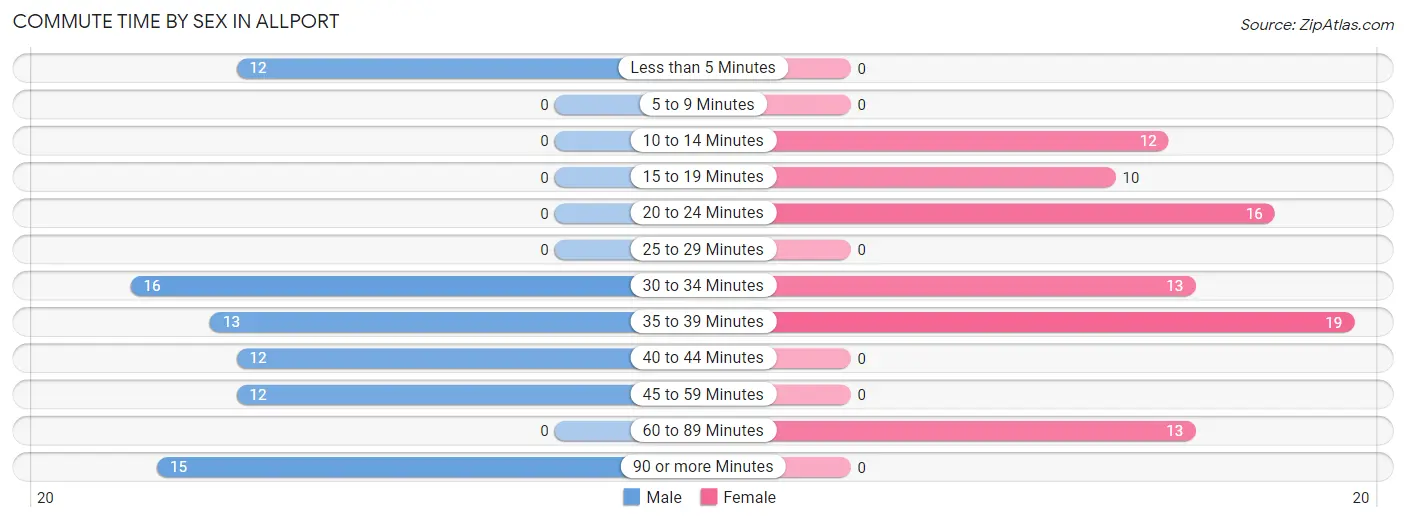
| Commute Time | Male | Female |
| Less than 5 Minutes | 12 (15.0%) | 0 (0.0%) |
| 5 to 9 Minutes | 0 (0.0%) | 0 (0.0%) |
| 10 to 14 Minutes | 0 (0.0%) | 12 (14.5%) |
| 15 to 19 Minutes | 0 (0.0%) | 10 (12.0%) |
| 20 to 24 Minutes | 0 (0.0%) | 16 (19.3%) |
| 25 to 29 Minutes | 0 (0.0%) | 0 (0.0%) |
| 30 to 34 Minutes | 16 (20.0%) | 13 (15.7%) |
| 35 to 39 Minutes | 13 (16.3%) | 19 (22.9%) |
| 40 to 44 Minutes | 12 (15.0%) | 0 (0.0%) |
| 45 to 59 Minutes | 12 (15.0%) | 0 (0.0%) |
| 60 to 89 Minutes | 0 (0.0%) | 13 (15.7%) |
| 90 or more Minutes | 15 (18.8%) | 0 (0.0%) |
Time of Departure to Work by Sex in Allport
The most frequent times of departure to work in Allport are 12:00 AM to 4:59 AM (31, 38.8%) for males and 7:30 AM to 7:59 AM (28, 33.7%) for females.
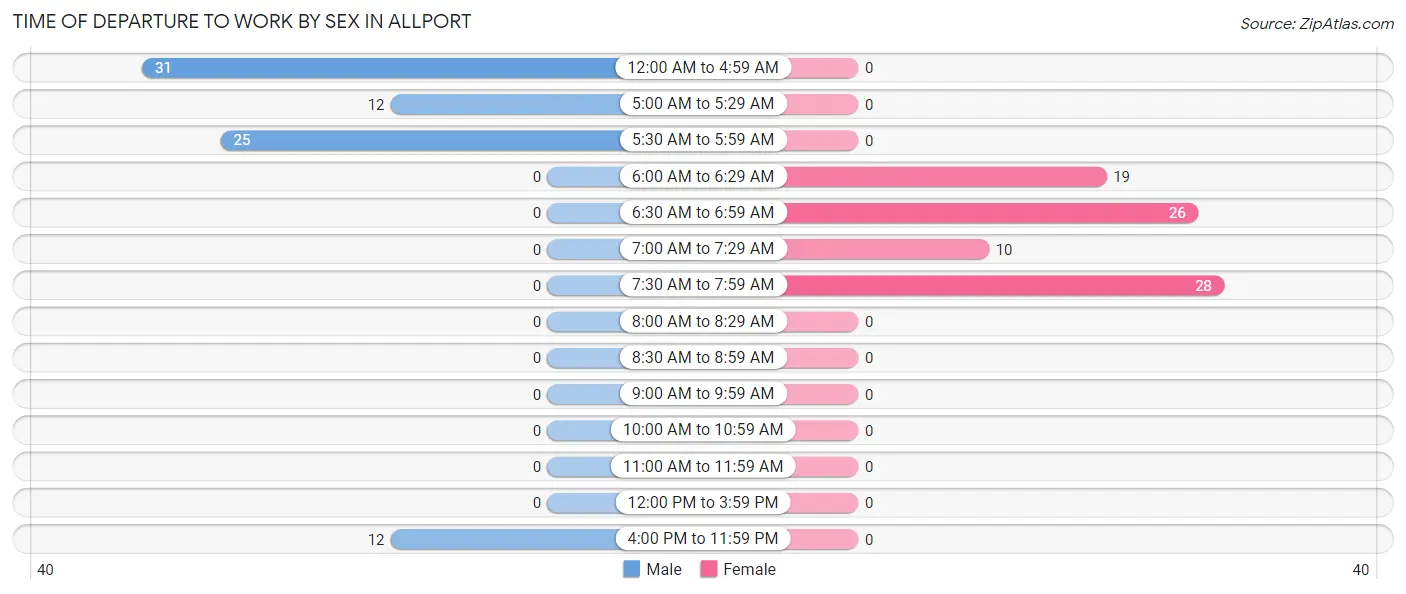
| Time of Departure | Male | Female |
| 12:00 AM to 4:59 AM | 31 (38.8%) | 0 (0.0%) |
| 5:00 AM to 5:29 AM | 12 (15.0%) | 0 (0.0%) |
| 5:30 AM to 5:59 AM | 25 (31.2%) | 0 (0.0%) |
| 6:00 AM to 6:29 AM | 0 (0.0%) | 19 (22.9%) |
| 6:30 AM to 6:59 AM | 0 (0.0%) | 26 (31.3%) |
| 7:00 AM to 7:29 AM | 0 (0.0%) | 10 (12.0%) |
| 7:30 AM to 7:59 AM | 0 (0.0%) | 28 (33.7%) |
| 8:00 AM to 8:29 AM | 0 (0.0%) | 0 (0.0%) |
| 8:30 AM to 8:59 AM | 0 (0.0%) | 0 (0.0%) |
| 9:00 AM to 9:59 AM | 0 (0.0%) | 0 (0.0%) |
| 10:00 AM to 10:59 AM | 0 (0.0%) | 0 (0.0%) |
| 11:00 AM to 11:59 AM | 0 (0.0%) | 0 (0.0%) |
| 12:00 PM to 3:59 PM | 0 (0.0%) | 0 (0.0%) |
| 4:00 PM to 11:59 PM | 12 (15.0%) | 0 (0.0%) |
| Total | 80 (100.0%) | 83 (100.0%) |
Housing Occupancy in Allport
Occupancy by Ownership in Allport
Of the total 85 dwellings in Allport, owner-occupied units account for 85 (100.0%), while renter-occupied units make up 0 (0.0%).
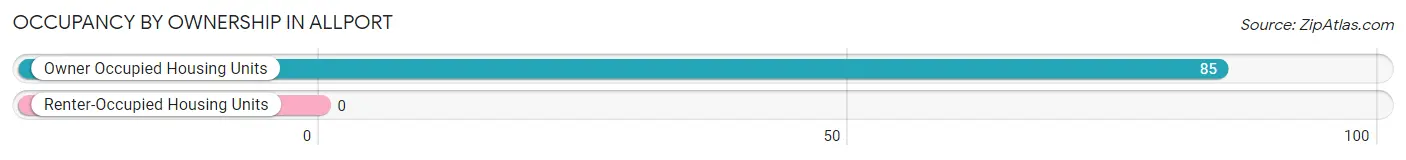
| Occupancy | # Housing Units | % Housing Units |
| Owner Occupied Housing Units | 85 | 100.0% |
| Renter-Occupied Housing Units | 0 | 0.0% |
| Total Occupied Housing Units | 85 | 100.0% |
Occupancy by Household Size in Allport
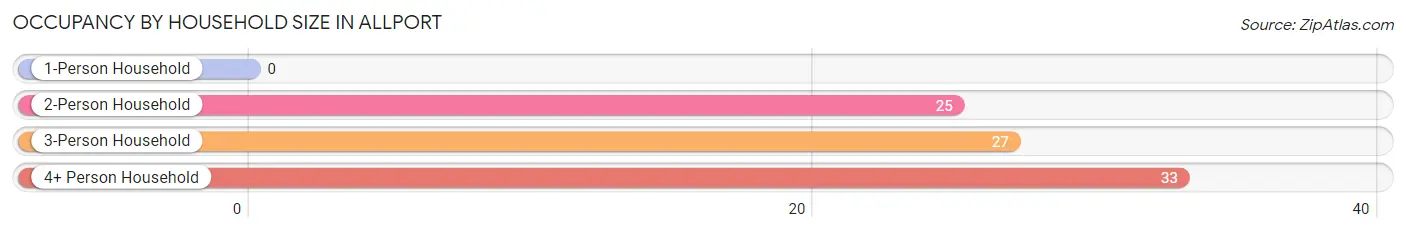
| Household Size | # Housing Units | % Housing Units |
| 1-Person Household | 0 | 0.0% |
| 2-Person Household | 25 | 29.4% |
| 3-Person Household | 27 | 31.8% |
| 4+ Person Household | 33 | 38.8% |
| Total Housing Units | 85 | 100.0% |
Occupancy by Ownership by Household Size in Allport
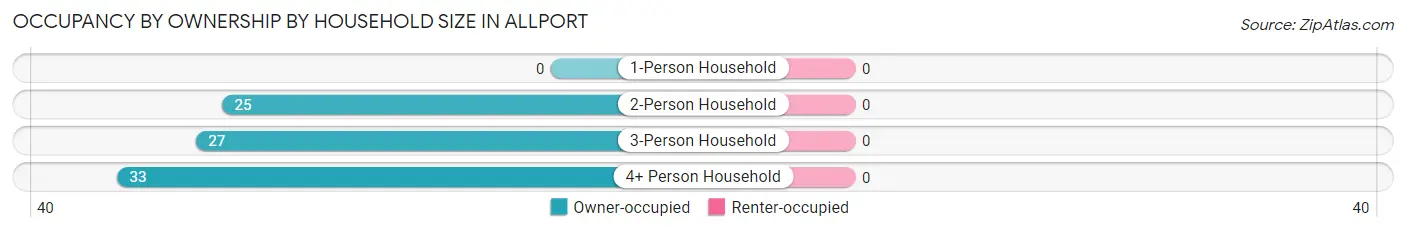
| Household Size | Owner-occupied | Renter-occupied |
| 1-Person Household | 0 (0.0%) | 0 (0.0%) |
| 2-Person Household | 25 (100.0%) | 0 (0.0%) |
| 3-Person Household | 27 (100.0%) | 0 (0.0%) |
| 4+ Person Household | 33 (100.0%) | 0 (0.0%) |
| Total Housing Units | 85 (100.0%) | 0 (0.0%) |
Occupancy by Educational Attainment in Allport
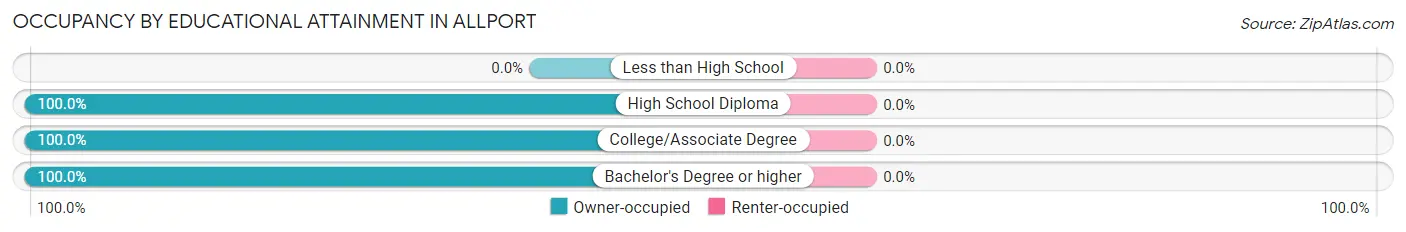
| Household Size | Owner-occupied | Renter-occupied |
| Less than High School | 0 (0.0%) | 0 (0.0%) |
| High School Diploma | 37 (100.0%) | 0 (0.0%) |
| College/Associate Degree | 28 (100.0%) | 0 (0.0%) |
| Bachelor's Degree or higher | 20 (100.0%) | 0 (0.0%) |
Occupancy by Age of Householder in Allport
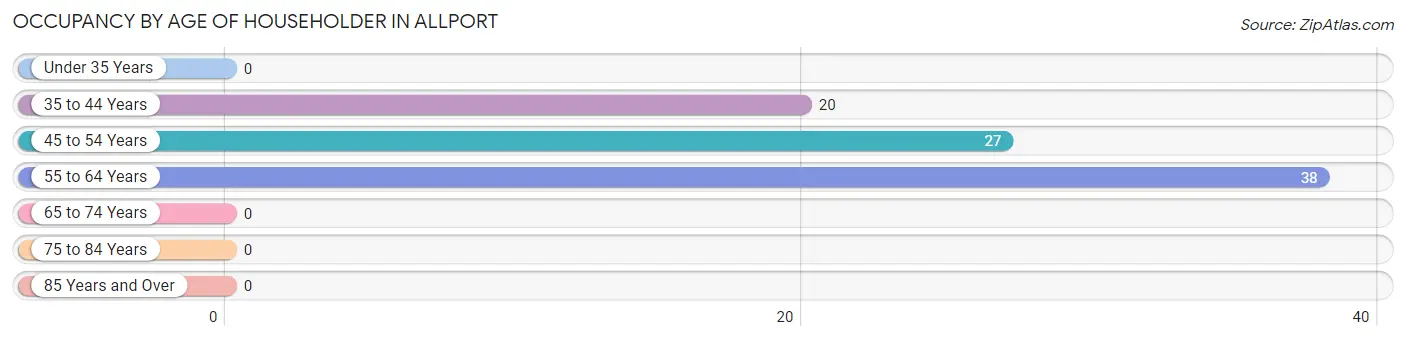
| Age Bracket | # Households | % Households |
| Under 35 Years | 0 | 0.0% |
| 35 to 44 Years | 20 | 23.5% |
| 45 to 54 Years | 27 | 31.8% |
| 55 to 64 Years | 38 | 44.7% |
| 65 to 74 Years | 0 | 0.0% |
| 75 to 84 Years | 0 | 0.0% |
| 85 Years and Over | 0 | 0.0% |
| Total | 85 | 100.0% |
Housing Finances in Allport
Median Income by Occupancy in Allport
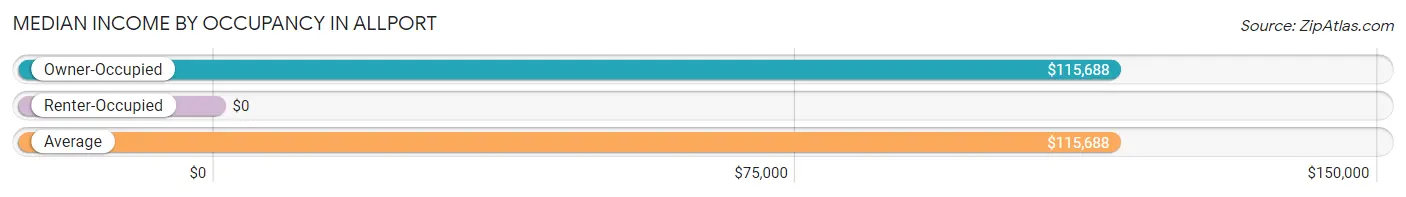
| Occupancy Type | # Households | Median Income |
| Owner-Occupied | 85 (100.0%) | $115,688 |
| Renter-Occupied | 0 (0.0%) | $0 |
| Average | 85 (100.0%) | $115,688 |
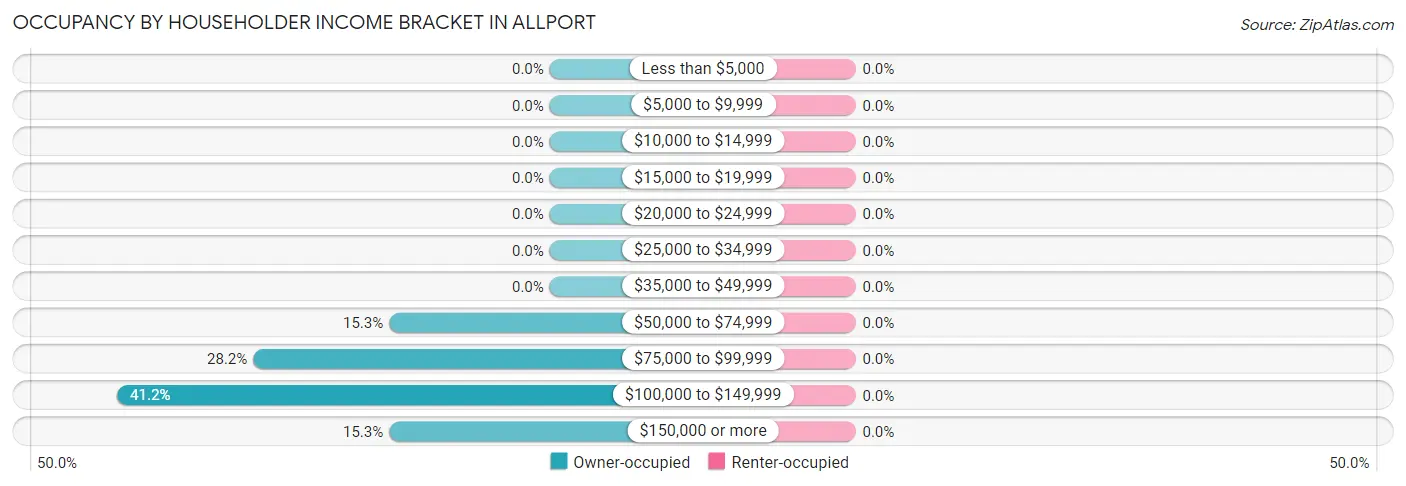
Occupancy by Householder Income Bracket in Allport
| Income Bracket | Owner-occupied | Renter-occupied |
| Less than $5,000 | 0 (0.0%) | 0 (0.0%) |
| $5,000 to $9,999 | 0 (0.0%) | 0 (0.0%) |
| $10,000 to $14,999 | 0 (0.0%) | 0 (0.0%) |
| $15,000 to $19,999 | 0 (0.0%) | 0 (0.0%) |
| $20,000 to $24,999 | 0 (0.0%) | 0 (0.0%) |
| $25,000 to $34,999 | 0 (0.0%) | 0 (0.0%) |
| $35,000 to $49,999 | 0 (0.0%) | 0 (0.0%) |
| $50,000 to $74,999 | 13 (15.3%) | 0 (0.0%) |
| $75,000 to $99,999 | 24 (28.2%) | 0 (0.0%) |
| $100,000 to $149,999 | 35 (41.2%) | 0 (0.0%) |
| $150,000 or more | 13 (15.3%) | 0 (0.0%) |
| Total | 85 (100.0%) | 0 (0.0%) |
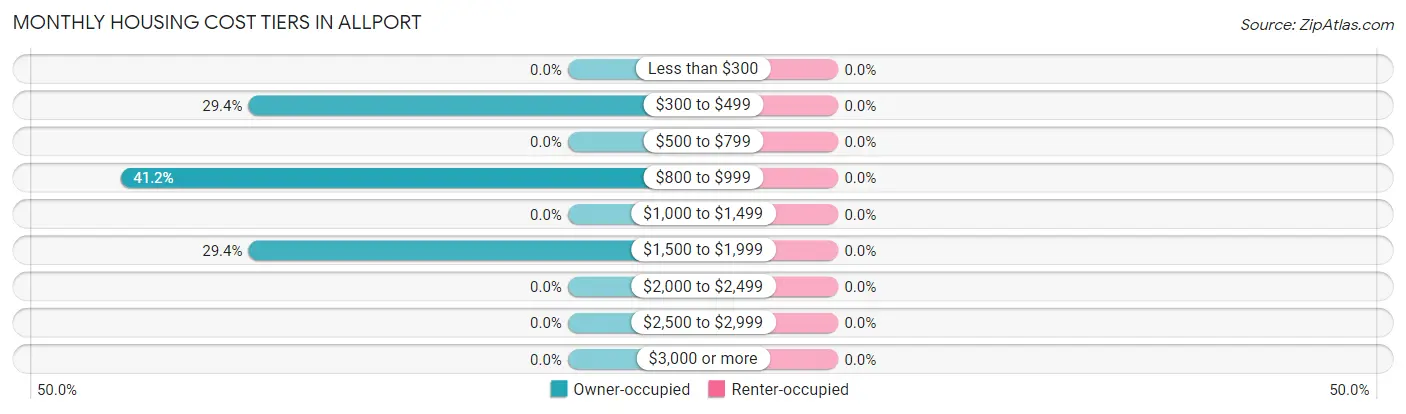
Monthly Housing Cost Tiers in Allport
| Monthly Cost | Owner-occupied | Renter-occupied |
| Less than $300 | 0 (0.0%) | 0 (0.0%) |
| $300 to $499 | 25 (29.4%) | 0 (0.0%) |
| $500 to $799 | 0 (0.0%) | 0 (0.0%) |
| $800 to $999 | 35 (41.2%) | 0 (0.0%) |
| $1,000 to $1,499 | 0 (0.0%) | 0 (0.0%) |
| $1,500 to $1,999 | 25 (29.4%) | 0 (0.0%) |
| $2,000 to $2,499 | 0 (0.0%) | 0 (0.0%) |
| $2,500 to $2,999 | 0 (0.0%) | 0 (0.0%) |
| $3,000 or more | 0 (0.0%) | 0 (0.0%) |
| Total | 85 (100.0%) | 0 (0.0%) |
Physical Housing Characteristics in Allport
Housing Structures in Allport
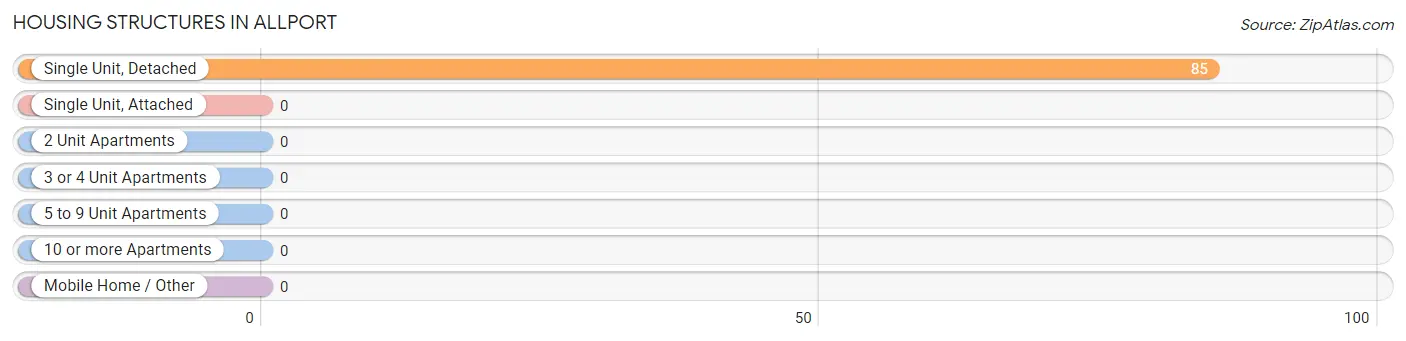
| Structure Type | # Housing Units | % Housing Units |
| Single Unit, Detached | 85 | 100.0% |
| Single Unit, Attached | 0 | 0.0% |
| 2 Unit Apartments | 0 | 0.0% |
| 3 or 4 Unit Apartments | 0 | 0.0% |
| 5 to 9 Unit Apartments | 0 | 0.0% |
| 10 or more Apartments | 0 | 0.0% |
| Mobile Home / Other | 0 | 0.0% |
| Total | 85 | 100.0% |
Housing Structures by Occupancy in Allport
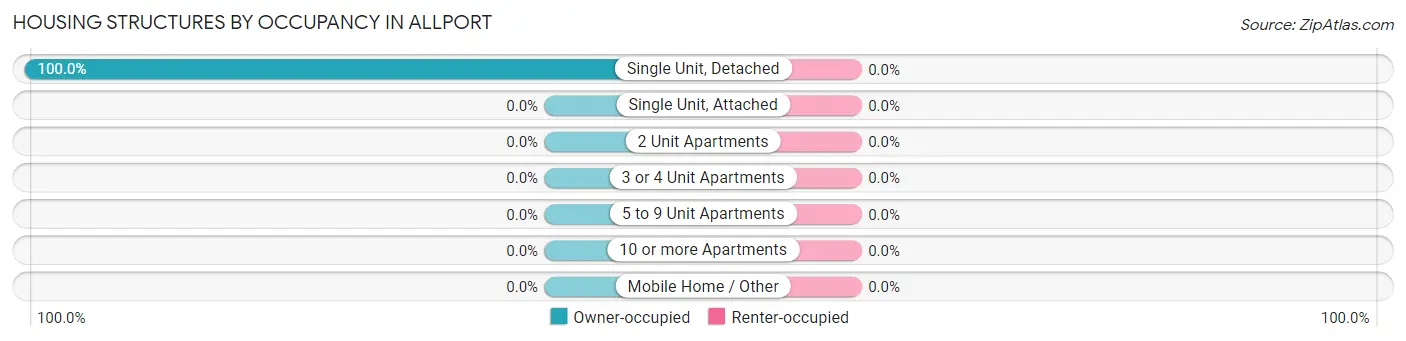
| Structure Type | Owner-occupied | Renter-occupied |
| Single Unit, Detached | 85 (100.0%) | 0 (0.0%) |
| Single Unit, Attached | 0 (0.0%) | 0 (0.0%) |
| 2 Unit Apartments | 0 (0.0%) | 0 (0.0%) |
| 3 or 4 Unit Apartments | 0 (0.0%) | 0 (0.0%) |
| 5 to 9 Unit Apartments | 0 (0.0%) | 0 (0.0%) |
| 10 or more Apartments | 0 (0.0%) | 0 (0.0%) |
| Mobile Home / Other | 0 (0.0%) | 0 (0.0%) |
| Total | 85 (100.0%) | 0 (0.0%) |
Housing Structures by Number of Rooms in Allport
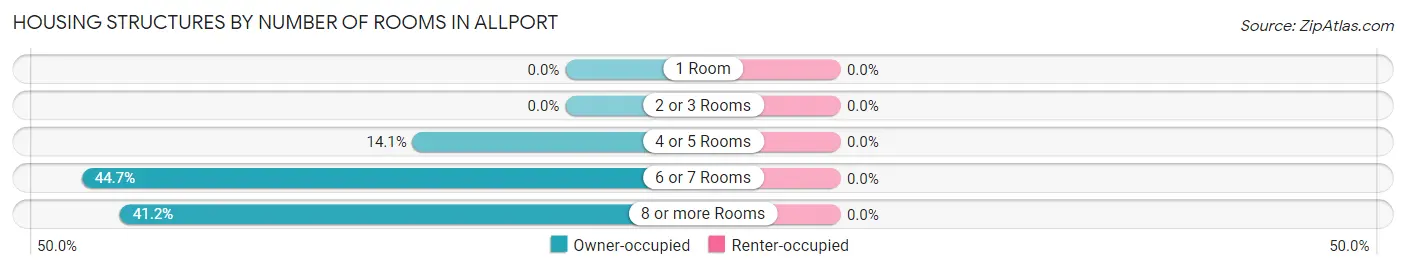
| Number of Rooms | Owner-occupied | Renter-occupied |
| 1 Room | 0 (0.0%) | 0 (0.0%) |
| 2 or 3 Rooms | 0 (0.0%) | 0 (0.0%) |
| 4 or 5 Rooms | 12 (14.1%) | 0 (0.0%) |
| 6 or 7 Rooms | 38 (44.7%) | 0 (0.0%) |
| 8 or more Rooms | 35 (41.2%) | 0 (0.0%) |
| Total | 85 (100.0%) | 0 (0.0%) |
Housing Structure by Heating Type in Allport
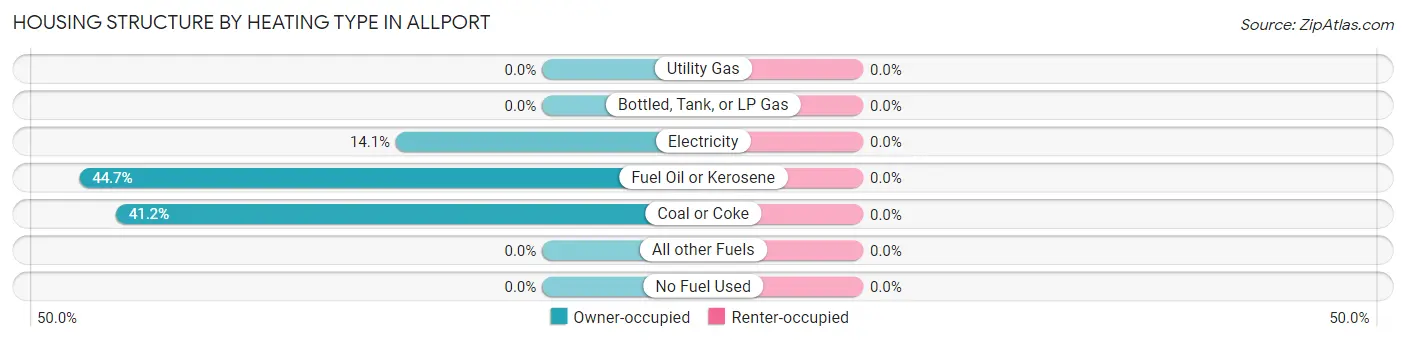
| Heating Type | Owner-occupied | Renter-occupied |
| Utility Gas | 0 (0.0%) | 0 (0.0%) |
| Bottled, Tank, or LP Gas | 0 (0.0%) | 0 (0.0%) |
| Electricity | 12 (14.1%) | 0 (0.0%) |
| Fuel Oil or Kerosene | 38 (44.7%) | 0 (0.0%) |
| Coal or Coke | 35 (41.2%) | 0 (0.0%) |
| All other Fuels | 0 (0.0%) | 0 (0.0%) |
| No Fuel Used | 0 (0.0%) | 0 (0.0%) |
| Total | 85 (100.0%) | 0 (0.0%) |
Household Vehicle Usage in Allport
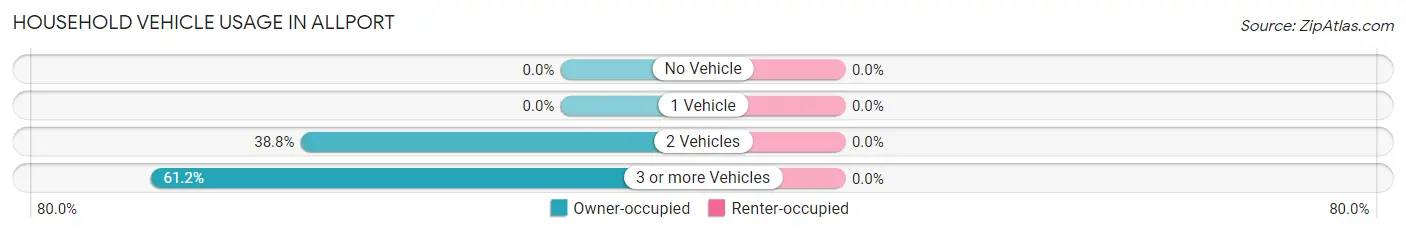
| Vehicles per Household | Owner-occupied | Renter-occupied |
| No Vehicle | 0 (0.0%) | 0 (0.0%) |
| 1 Vehicle | 0 (0.0%) | 0 (0.0%) |
| 2 Vehicles | 33 (38.8%) | 0 (0.0%) |
| 3 or more Vehicles | 52 (61.2%) | 0 (0.0%) |
| Total | 85 (100.0%) | 0 (0.0%) |
Real Estate & Mortgages in Allport
Real Estate and Mortgage Overview in Allport
| Characteristic | Without Mortgage | With Mortgage |
| Housing Units | 25 | 60 |
| Median Property Value | - | - |
| Median Household Income | - | - |
| Monthly Housing Costs | - | - |
| Real Estate Taxes | - | - |
Property Value by Mortgage Status in Allport
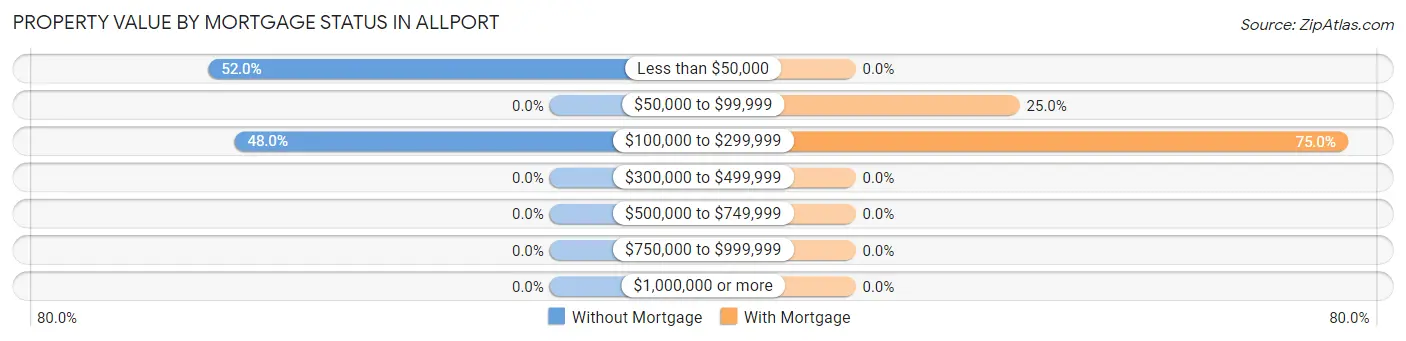
| Property Value | Without Mortgage | With Mortgage |
| Less than $50,000 | 13 (52.0%) | 0 (0.0%) |
| $50,000 to $99,999 | 0 (0.0%) | 15 (25.0%) |
| $100,000 to $299,999 | 12 (48.0%) | 45 (75.0%) |
| $300,000 to $499,999 | 0 (0.0%) | 0 (0.0%) |
| $500,000 to $749,999 | 0 (0.0%) | 0 (0.0%) |
| $750,000 to $999,999 | 0 (0.0%) | 0 (0.0%) |
| $1,000,000 or more | 0 (0.0%) | 0 (0.0%) |
| Total | 25 (100.0%) | 60 (100.0%) |
Household Income by Mortgage Status in Allport
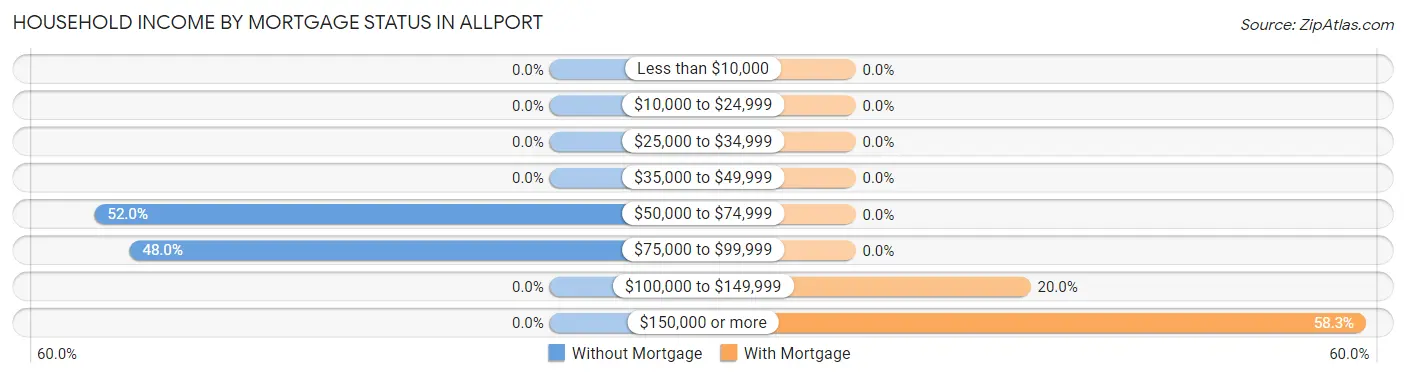
| Household Income | Without Mortgage | With Mortgage |
| Less than $10,000 | 0 (0.0%) | 0 (0.0%) |
| $10,000 to $24,999 | 0 (0.0%) | 0 (0.0%) |
| $25,000 to $34,999 | 0 (0.0%) | 0 (0.0%) |
| $35,000 to $49,999 | 0 (0.0%) | 0 (0.0%) |
| $50,000 to $74,999 | 13 (52.0%) | 0 (0.0%) |
| $75,000 to $99,999 | 12 (48.0%) | 0 (0.0%) |
| $100,000 to $149,999 | 0 (0.0%) | 12 (20.0%) |
| $150,000 or more | 0 (0.0%) | 35 (58.3%) |
| Total | 25 (100.0%) | 60 (100.0%) |
Property Value to Household Income Ratio in Allport
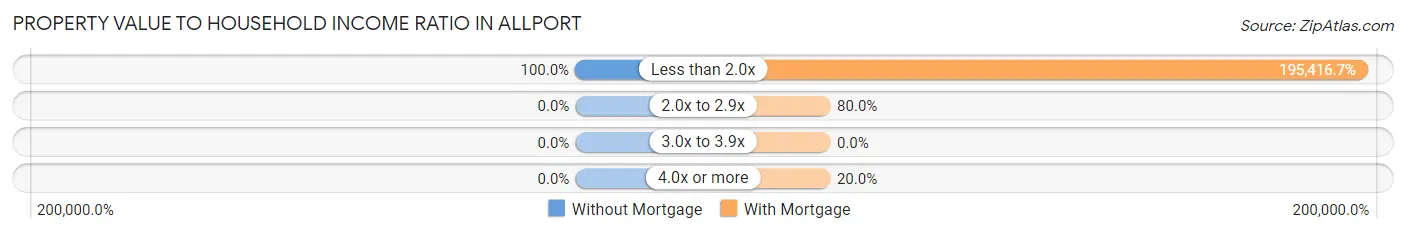
| Value-to-Income Ratio | Without Mortgage | With Mortgage |
| Less than 2.0x | 25 (100.0%) | 117,250 (195,416.7%) |
| 2.0x to 2.9x | 0 (0.0%) | 48 (80.0%) |
| 3.0x to 3.9x | 0 (0.0%) | 0 (0.0%) |
| 4.0x or more | 0 (0.0%) | 12 (20.0%) |
| Total | 25 (100.0%) | 60 (100.0%) |
Real Estate Taxes by Mortgage Status in Allport
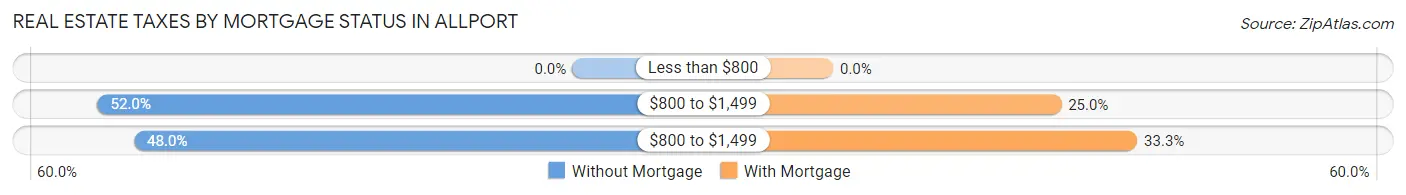
| Property Taxes | Without Mortgage | With Mortgage |
| Less than $800 | 0 (0.0%) | 0 (0.0%) |
| $800 to $1,499 | 13 (52.0%) | 15 (25.0%) |
| $800 to $1,499 | 12 (48.0%) | 20 (33.3%) |
| Total | 25 (100.0%) | 60 (100.0%) |
Health & Disability in Allport
Health Insurance Coverage by Age in Allport
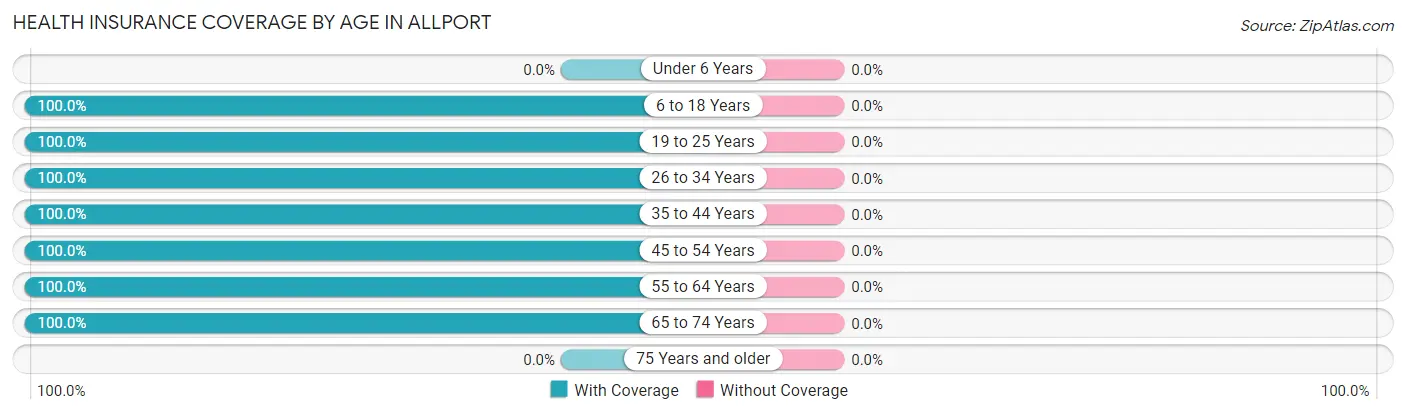
| Age Bracket | With Coverage | Without Coverage |
| Under 6 Years | 0 (0.0%) | 0 (0.0%) |
| 6 to 18 Years | 54 (100.0%) | 0 (0.0%) |
| 19 to 25 Years | 42 (100.0%) | 0 (0.0%) |
| 26 to 34 Years | 16 (100.0%) | 0 (0.0%) |
| 35 to 44 Years | 56 (100.0%) | 0 (0.0%) |
| 45 to 54 Years | 37 (100.0%) | 0 (0.0%) |
| 55 to 64 Years | 63 (100.0%) | 0 (0.0%) |
| 65 to 74 Years | 12 (100.0%) | 0 (0.0%) |
| 75 Years and older | 0 (0.0%) | 0 (0.0%) |
| Total | 280 (100.0%) | 0 (0.0%) |
Health Insurance Coverage by Citizenship Status in Allport
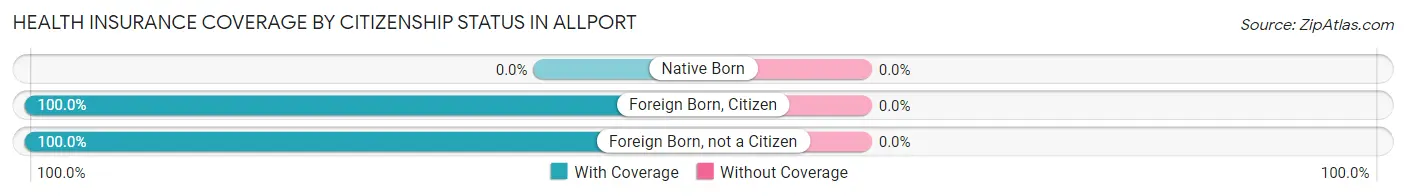
| Citizenship Status | With Coverage | Without Coverage |
| Native Born | 0 (0.0%) | 0 (0.0%) |
| Foreign Born, Citizen | 54 (100.0%) | 0 (0.0%) |
| Foreign Born, not a Citizen | 42 (100.0%) | 0 (0.0%) |
Health Insurance Coverage by Household Income in Allport
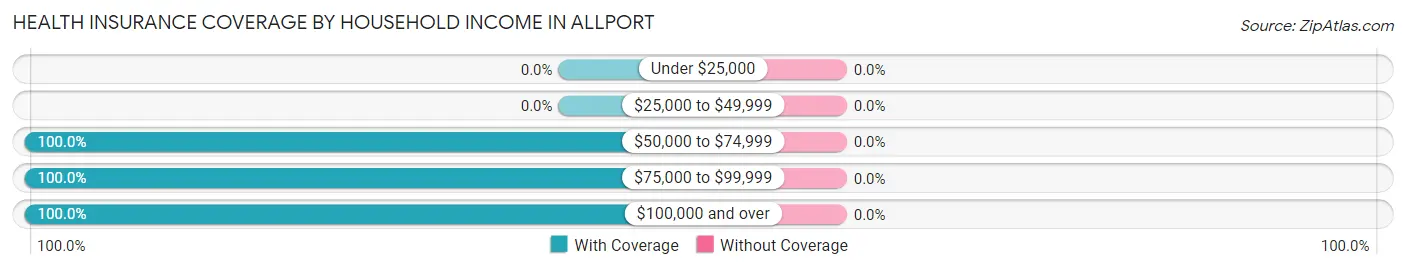
| Household Income | With Coverage | Without Coverage |
| Under $25,000 | 0 (0.0%) | 0 (0.0%) |
| $25,000 to $49,999 | 0 (0.0%) | 0 (0.0%) |
| $50,000 to $74,999 | 25 (100.0%) | 0 (0.0%) |
| $75,000 to $99,999 | 58 (100.0%) | 0 (0.0%) |
| $100,000 and over | 197 (100.0%) | 0 (0.0%) |
Public vs Private Health Insurance Coverage by Age in Allport
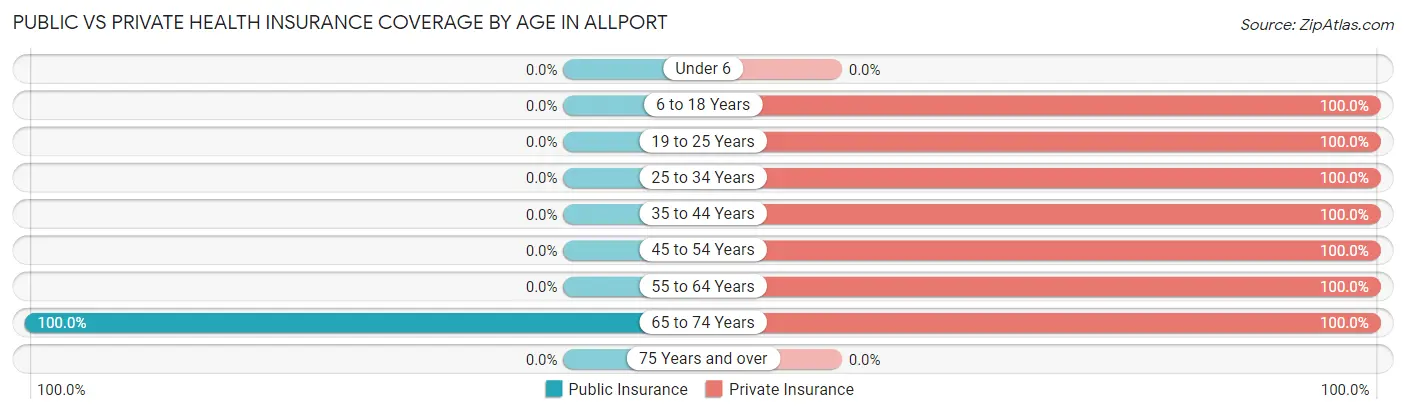
| Age Bracket | Public Insurance | Private Insurance |
| Under 6 | 0 (0.0%) | 0 (0.0%) |
| 6 to 18 Years | 0 (0.0%) | 54 (100.0%) |
| 19 to 25 Years | 0 (0.0%) | 42 (100.0%) |
| 25 to 34 Years | 0 (0.0%) | 16 (100.0%) |
| 35 to 44 Years | 0 (0.0%) | 56 (100.0%) |
| 45 to 54 Years | 0 (0.0%) | 37 (100.0%) |
| 55 to 64 Years | 0 (0.0%) | 63 (100.0%) |
| 65 to 74 Years | 12 (100.0%) | 12 (100.0%) |
| 75 Years and over | 0 (0.0%) | 0 (0.0%) |
| Total | 12 (4.3%) | 280 (100.0%) |
Disability Status by Sex by Age in Allport
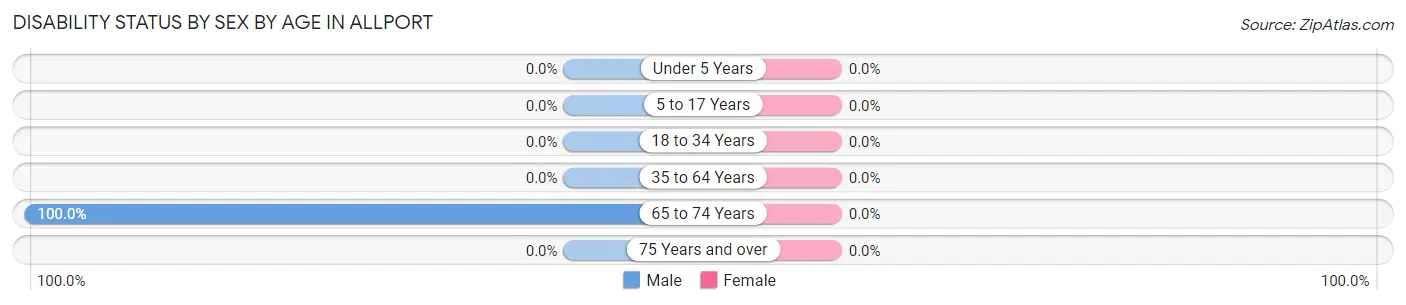
| Age Bracket | Male | Female |
| Under 5 Years | 0 (0.0%) | 0 (0.0%) |
| 5 to 17 Years | 0 (0.0%) | 0 (0.0%) |
| 18 to 34 Years | 0 (0.0%) | 0 (0.0%) |
| 35 to 64 Years | 0 (0.0%) | 0 (0.0%) |
| 65 to 74 Years | 12 (100.0%) | 0 (0.0%) |
| 75 Years and over | 0 (0.0%) | 0 (0.0%) |
Disability Class by Sex by Age in Allport
Disability Class: Hearing Difficulty

| Age Bracket | Male | Female |
| Under 5 Years | 0 (0.0%) | 0 (0.0%) |
| 5 to 17 Years | 0 (0.0%) | 0 (0.0%) |
| 18 to 34 Years | 0 (0.0%) | 0 (0.0%) |
| 35 to 64 Years | 0 (0.0%) | 0 (0.0%) |
| 65 to 74 Years | 12 (100.0%) | 0 (0.0%) |
| 75 Years and over | 0 (0.0%) | 0 (0.0%) |
Disability Class: Vision Difficulty
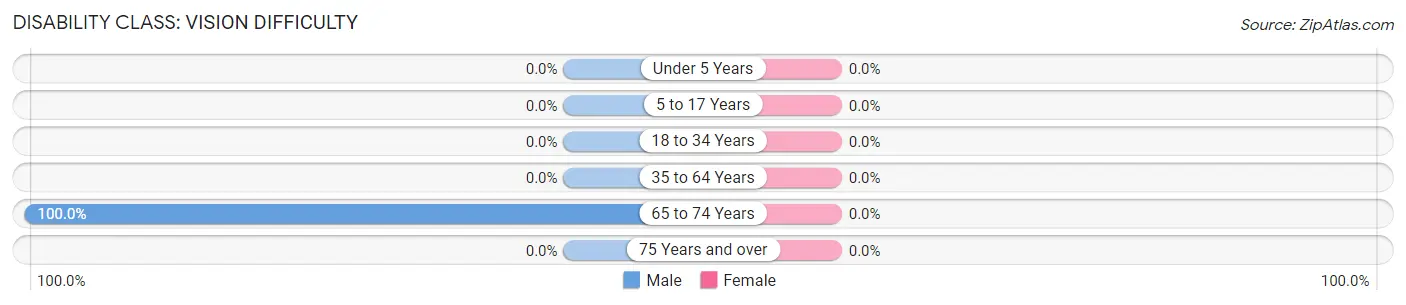
| Age Bracket | Male | Female |
| Under 5 Years | 0 (0.0%) | 0 (0.0%) |
| 5 to 17 Years | 0 (0.0%) | 0 (0.0%) |
| 18 to 34 Years | 0 (0.0%) | 0 (0.0%) |
| 35 to 64 Years | 0 (0.0%) | 0 (0.0%) |
| 65 to 74 Years | 12 (100.0%) | 0 (0.0%) |
| 75 Years and over | 0 (0.0%) | 0 (0.0%) |
Disability Class: Cognitive Difficulty
| Age Bracket | Male | Female |
| 5 to 17 Years | 0 (0.0%) | 0 (0.0%) |
| 18 to 34 Years | 0 (0.0%) | 0 (0.0%) |
| 35 to 64 Years | 0 (0.0%) | 0 (0.0%) |
| 65 to 74 Years | 0 (0.0%) | 0 (0.0%) |
| 75 Years and over | 0 (0.0%) | 0 (0.0%) |
Disability Class: Ambulatory Difficulty

| Age Bracket | Male | Female |
| 5 to 17 Years | 0 (0.0%) | 0 (0.0%) |
| 18 to 34 Years | 0 (0.0%) | 0 (0.0%) |
| 35 to 64 Years | 0 (0.0%) | 0 (0.0%) |
| 65 to 74 Years | 12 (100.0%) | 0 (0.0%) |
| 75 Years and over | 0 (0.0%) | 0 (0.0%) |
Disability Class: Self-Care Difficulty
| Age Bracket | Male | Female |
| 5 to 17 Years | 0 (0.0%) | 0 (0.0%) |
| 18 to 34 Years | 0 (0.0%) | 0 (0.0%) |
| 35 to 64 Years | 0 (0.0%) | 0 (0.0%) |
| 65 to 74 Years | 0 (0.0%) | 0 (0.0%) |
| 75 Years and over | 0 (0.0%) | 0 (0.0%) |
Technology Access in Allport
Computing Device Access in Allport
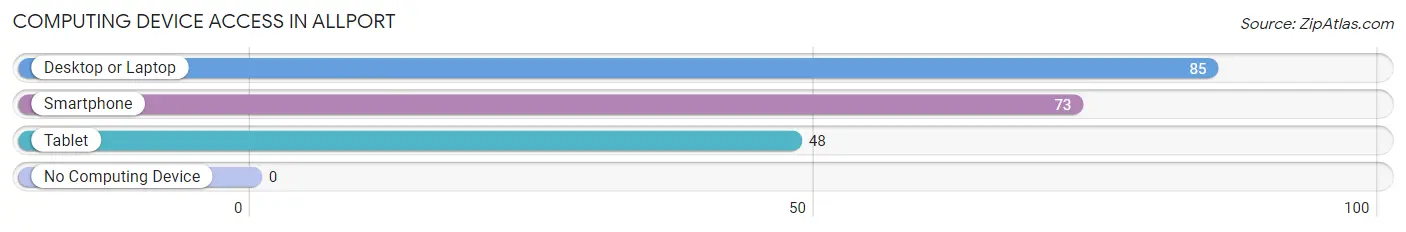
| Device Type | # Households | % Households |
| Desktop or Laptop | 85 | 100.0% |
| Smartphone | 73 | 85.9% |
| Tablet | 48 | 56.5% |
| No Computing Device | 0 | 0.0% |
| Total | 85 | 100.0% |
Internet Access in Allport
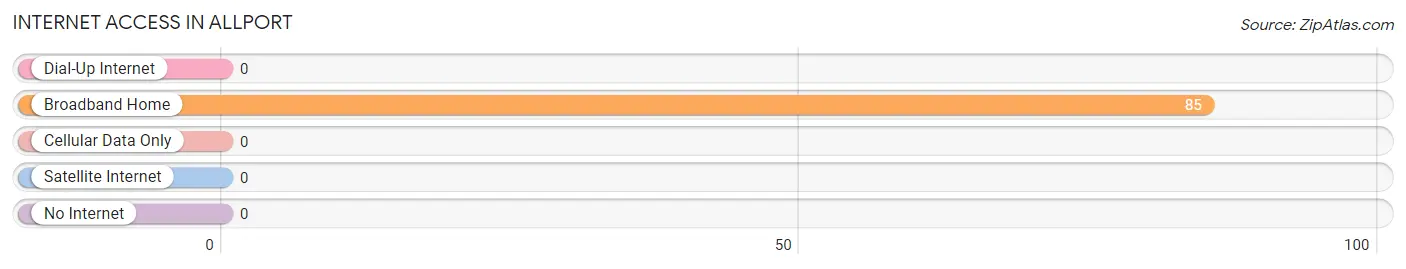
| Internet Type | # Households | % Households |
| Dial-Up Internet | 0 | 0.0% |
| Broadband Home | 85 | 100.0% |
| Cellular Data Only | 0 | 0.0% |
| Satellite Internet | 0 | 0.0% |
| No Internet | 0 | 0.0% |
| Total | 85 | 100.0% |
Allport Summary
Allport is a small borough located in Clearfield County, Pennsylvania. It is situated in the western part of the state, approximately two miles east of the city of Clearfield. The population of Allport was 1,093 at the 2010 census.
History
Allport was founded in 1872 by a group of settlers from the nearby town of Clearfield. The town was named after the Allport family, who were among the first settlers. The Allport family had a large farm in the area and the town was built around it.
The first post office in Allport was established in 1873. The town was incorporated in 1876 and the first mayor was elected in 1877.
The town grew slowly over the years, but it was not until the 1950s that it began to experience significant growth. This was due to the development of the nearby Clearfield County Airport, which brought in new businesses and residents.
Geography
Allport is located at 40°59'45" North, 78°25'45" West (40.995833, -78.429167). It is situated in the western part of Clearfield County, approximately two miles east of the city of Clearfield.
The borough is located in a valley surrounded by hills. The terrain is mostly flat, with some rolling hills. The area is mostly wooded, with some open fields.
Economy
The economy of Allport is largely based on agriculture and tourism. The town is home to several farms, which produce a variety of crops, including corn, soybeans, hay, and wheat.
The town is also home to several small businesses, including a grocery store, a hardware store, and a few restaurants. The town also has a few small manufacturing companies, which produce a variety of products, including furniture, clothing, and electronics.
The town is also home to the Clearfield County Airport, which serves as a hub for air travel in the region. The airport is home to several small airlines, which provide service to several major cities in the region.
Demographics
As of the 2010 census, the population of Allport was 1,093. The racial makeup of the town was 97.3% White, 0.7% African American, 0.2% Native American, 0.2% Asian, 0.2% from other races, and 1.6% from two or more races. Hispanic or Latino of any race were 0.7% of the population.
The median income for a household in Allport was $37,500, and the median income for a family was $41,250. The per capita income for the town was $17,845. About 11.2% of families and 13.2% of the population were below the poverty line, including 16.7% of those under age 18 and 8.3% of those age 65 or over.
Common Questions
What is Per Capita Income in Allport?
Per Capita income in Allport is $34,032.
What is the Median Family Income in Allport?
Median Family Income in Allport is $115,688.
What is the Median Household income in Allport?
Median Household Income in Allport is $115,688.
What is Income or Wage Gap in Allport?
Income or Wage Gap in Allport is 22.9%.
Women in Allport earn 77.1 cents for every dollar earned by a man.
What is Inequality or Gini Index in Allport?
Inequality or Gini Index in Allport is 0.15.
What is the Total Population of Allport?
Total Population of Allport is 280.
What is the Total Male Population of Allport?
Total Male Population of Allport is 112.
What is the Total Female Population of Allport?
Total Female Population of Allport is 168.
What is the Ratio of Males per 100 Females in Allport?
There are 66.67 Males per 100 Females in Allport.
What is the Ratio of Females per 100 Males in Allport?
There are 150.00 Females per 100 Males in Allport.
What is the Median Population Age in Allport?
Median Population Age in Allport is 40.4 Years.
What is the Average Family Size in Allport
Average Family Size in Allport is 3.3 People.
What is the Average Household Size in Allport
Average Household Size in Allport is 3.3 People.
How Large is the Labor Force in Allport?
There are 203 People in the Labor Forcein in Allport.
What is the Percentage of People in the Labor Force in Allport?
85.3% of People are in the Labor Force in Allport.