Oley, PA Map & Demographics
Oley Map
Oley Overview
$36,802
PER CAPITA INCOME
$81,123
AVG FAMILY INCOME
$76,000
AVG HOUSEHOLD INCOME
31.8%
WAGE / INCOME GAP [ % ]
68.2¢/ $1
WAGE / INCOME GAP [ $ ]
0.35
INEQUALITY / GINI INDEX
1,131
TOTAL POPULATION
504
MALE POPULATION
627
FEMALE POPULATION
80.38
MALES / 100 FEMALES
124.40
FEMALES / 100 MALES
49.2
MEDIAN AGE
3.0
AVG FAMILY SIZE
2.2
AVG HOUSEHOLD SIZE
558
LABOR FORCE [ PEOPLE ]
58.1%
PERCENT IN LABOR FORCE
Oley Zip Codes
Income in Oley
Income Overview in Oley
Per Capita Income in Oley is $36,802, while median incomes of families and households are $81,123 and $76,000 respectively.
| Characteristic | Number | Measure |
| Per Capita Income | 1,131 | $36,802 |
| Median Family Income | 262 | $81,123 |
| Mean Family Income | 262 | $103,616 |
| Median Household Income | 508 | $76,000 |
| Mean Household Income | 508 | $81,586 |
| Income Deficit | 262 | $0 |
| Wage / Income Gap (%) | 1,131 | 31.78% |
| Wage / Income Gap ($) | 1,131 | 68.22¢ per $1 |
| Gini / Inequality Index | 1,131 | 0.35 |
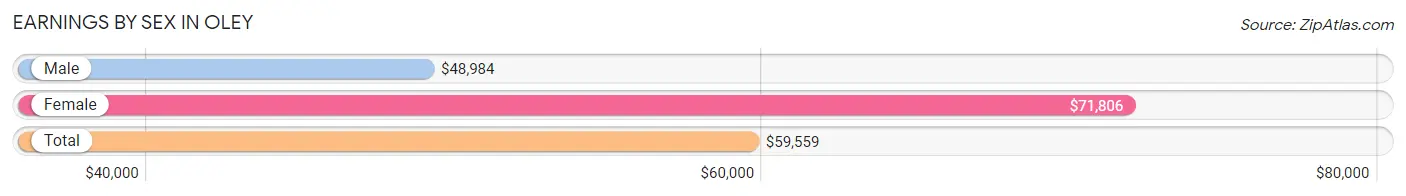
Earnings by Sex in Oley
Average Earnings in Oley are $59,559, $48,984 for men and $71,806 for women, a difference of 31.8%.
| Sex | Number | Average Earnings |
| Male | 268 (48.0%) | $48,984 |
| Female | 290 (52.0%) | $71,806 |
| Total | 558 (100.0%) | $59,559 |
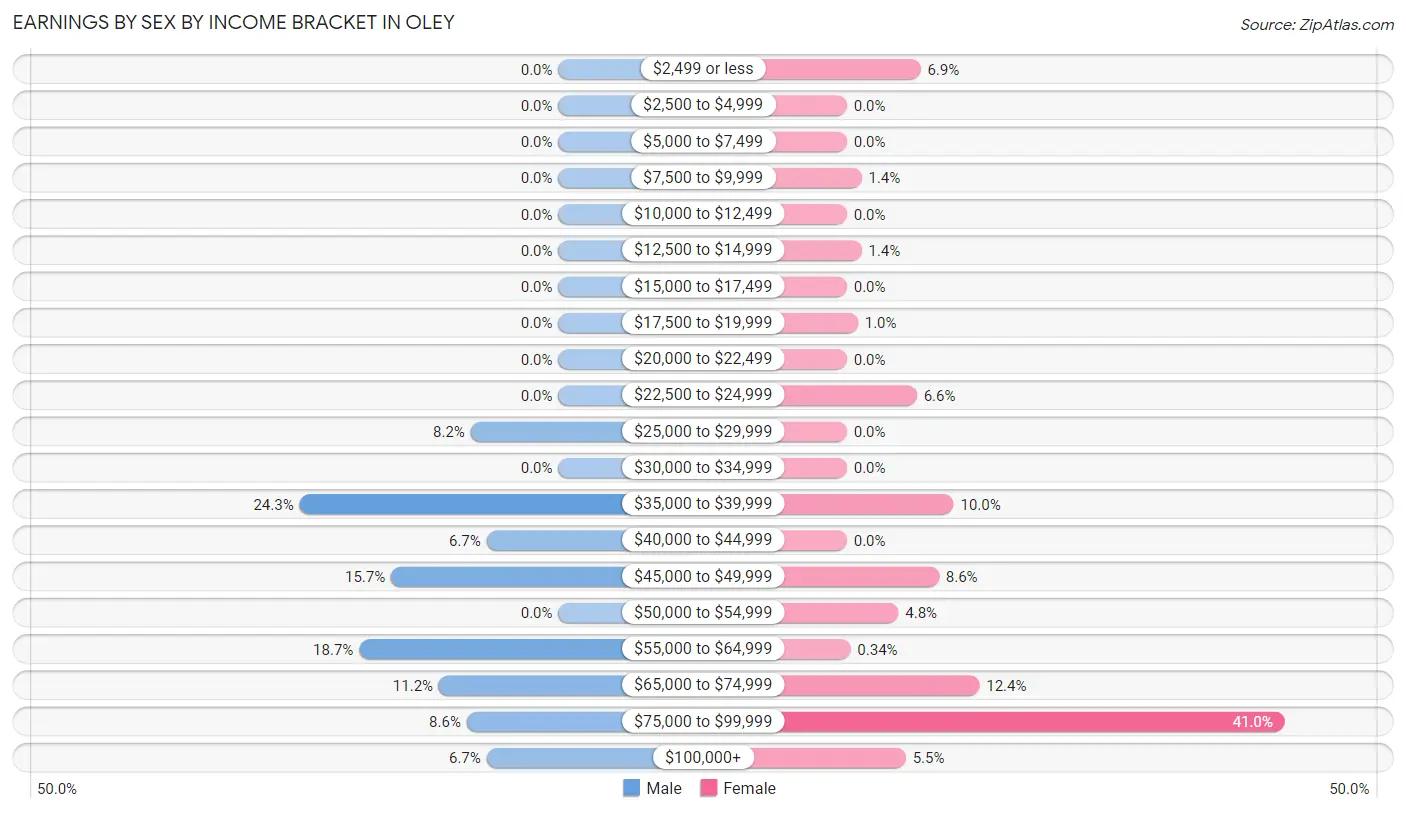
Earnings by Sex by Income Bracket in Oley
The most common earnings brackets in Oley are $35,000 to $39,999 for men (65 | 24.2%) and $75,000 to $99,999 for women (119 | 41.0%).
| Income | Male | Female |
| $2,499 or less | 0 (0.0%) | 20 (6.9%) |
| $2,500 to $4,999 | 0 (0.0%) | 0 (0.0%) |
| $5,000 to $7,499 | 0 (0.0%) | 0 (0.0%) |
| $7,500 to $9,999 | 0 (0.0%) | 4 (1.4%) |
| $10,000 to $12,499 | 0 (0.0%) | 0 (0.0%) |
| $12,500 to $14,999 | 0 (0.0%) | 4 (1.4%) |
| $15,000 to $17,499 | 0 (0.0%) | 0 (0.0%) |
| $17,500 to $19,999 | 0 (0.0%) | 3 (1.0%) |
| $20,000 to $22,499 | 0 (0.0%) | 0 (0.0%) |
| $22,500 to $24,999 | 0 (0.0%) | 19 (6.6%) |
| $25,000 to $29,999 | 22 (8.2%) | 0 (0.0%) |
| $30,000 to $34,999 | 0 (0.0%) | 0 (0.0%) |
| $35,000 to $39,999 | 65 (24.2%) | 29 (10.0%) |
| $40,000 to $44,999 | 18 (6.7%) | 0 (0.0%) |
| $45,000 to $49,999 | 42 (15.7%) | 25 (8.6%) |
| $50,000 to $54,999 | 0 (0.0%) | 14 (4.8%) |
| $55,000 to $64,999 | 50 (18.7%) | 1 (0.3%) |
| $65,000 to $74,999 | 30 (11.2%) | 36 (12.4%) |
| $75,000 to $99,999 | 23 (8.6%) | 119 (41.0%) |
| $100,000+ | 18 (6.7%) | 16 (5.5%) |
| Total | 268 (100.0%) | 290 (100.0%) |
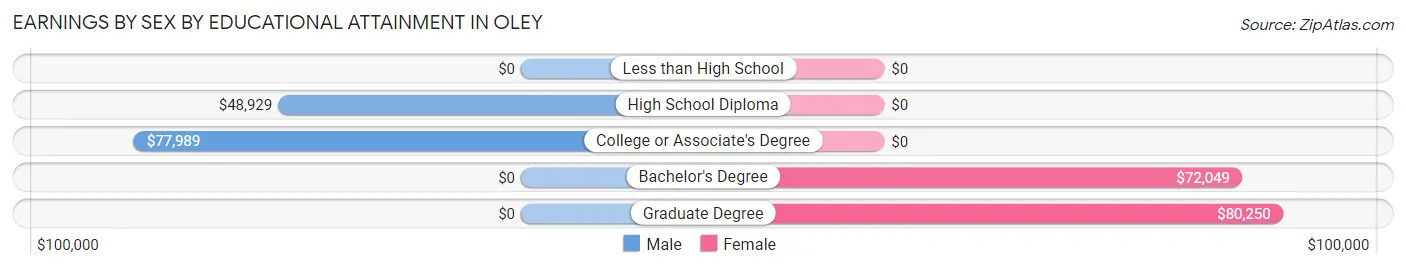
Earnings by Sex by Educational Attainment in Oley
Average earnings in Oley are $49,196 for men and $71,944 for women, a difference of 31.6%. Men with an educational attainment of college or associate's degree enjoy the highest average annual earnings of $77,989, while those with high school diploma education earn the least with $48,929. Women with an educational attainment of graduate degree earn the most with the average annual earnings of $80,250, while those with bachelor's degree education have the smallest earnings of $72,049.
| Educational Attainment | Male Income | Female Income |
| Less than High School | - | - |
| High School Diploma | $48,929 | $0 |
| College or Associate's Degree | $77,989 | $0 |
| Bachelor's Degree | - | - |
| Graduate Degree | - | - |
| Total | $49,196 | $71,944 |
Family Income in Oley
Family Income Brackets in Oley
According to the Oley family income data, there are 132 families falling into the $75,000 to $99,999 income range, which is the most common income bracket and makes up 50.4% of all families.
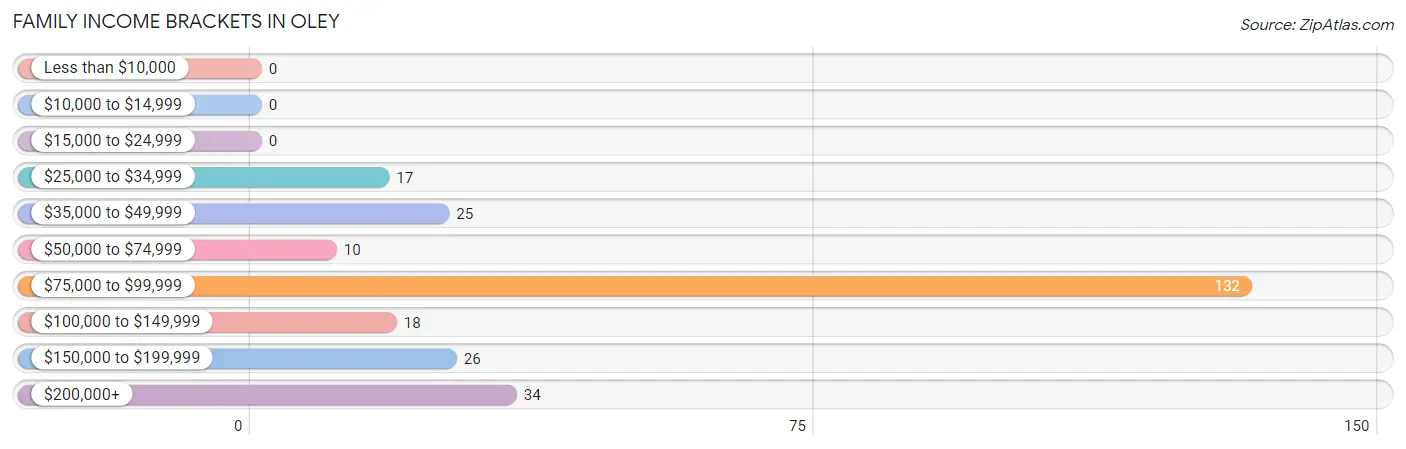
| Income Bracket | # Families | % Families |
| Less than $10,000 | 0 | 0.0% |
| $10,000 to $14,999 | 0 | 0.0% |
| $15,000 to $24,999 | 0 | 0.0% |
| $25,000 to $34,999 | 17 | 6.5% |
| $35,000 to $49,999 | 25 | 9.5% |
| $50,000 to $74,999 | 10 | 3.8% |
| $75,000 to $99,999 | 132 | 50.4% |
| $100,000 to $149,999 | 18 | 6.9% |
| $150,000 to $199,999 | 26 | 9.9% |
| $200,000+ | 34 | 13.0% |
Family Income by Famaliy Size in Oley
4-person families (23 | 8.8%) account for the highest median family income in Oley with $250,001 per family, while 4-person families (23 | 8.8%) have the highest median income of $62,500 per family member.
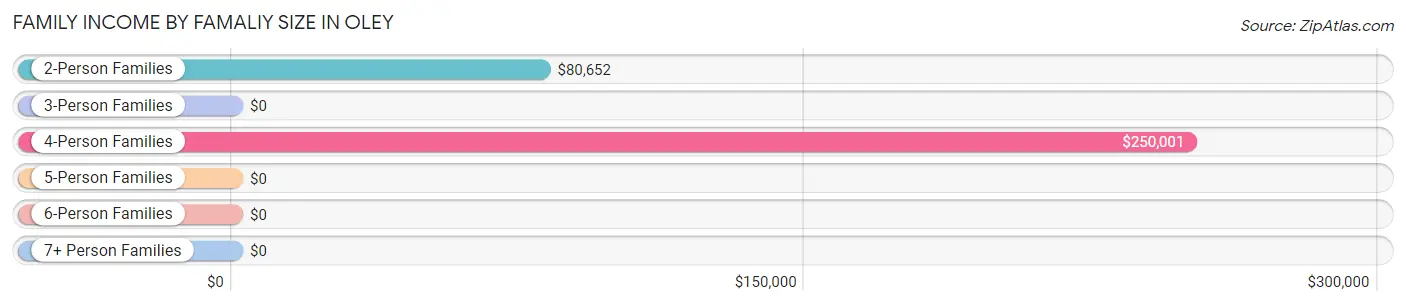
| Income Bracket | # Families | Median Income |
| 2-Person Families | 138 (52.7%) | $80,652 |
| 3-Person Families | 84 (32.1%) | $0 |
| 4-Person Families | 23 (8.8%) | $250,001 |
| 5-Person Families | 17 (6.5%) | $0 |
| 6-Person Families | 0 (0.0%) | $0 |
| 7+ Person Families | 0 (0.0%) | $0 |
| Total | 262 (100.0%) | $81,123 |
Family Income by Number of Earners in Oley
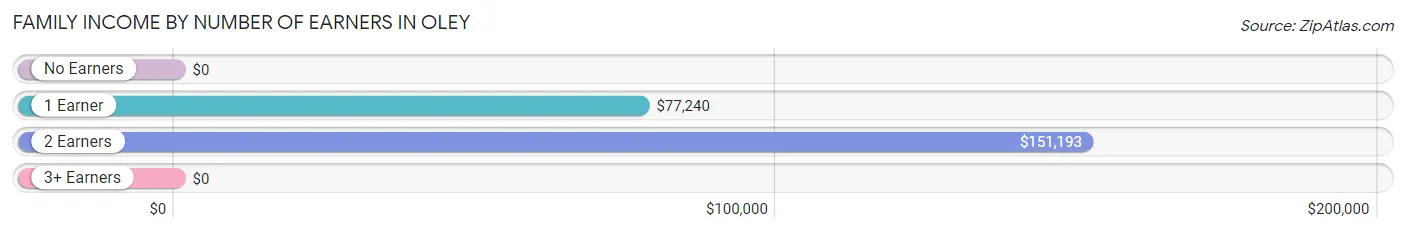
| Number of Earners | # Families | Median Income |
| No Earners | 14 (5.3%) | $0 |
| 1 Earner | 156 (59.5%) | $77,240 |
| 2 Earners | 85 (32.4%) | $151,193 |
| 3+ Earners | 7 (2.7%) | $0 |
| Total | 262 (100.0%) | $81,123 |
Household Income in Oley
Household Income Brackets in Oley
With 149 households falling in the category, the $75,000 to $99,999 income range is the most frequent in Oley, accounting for 29.3% of all households.
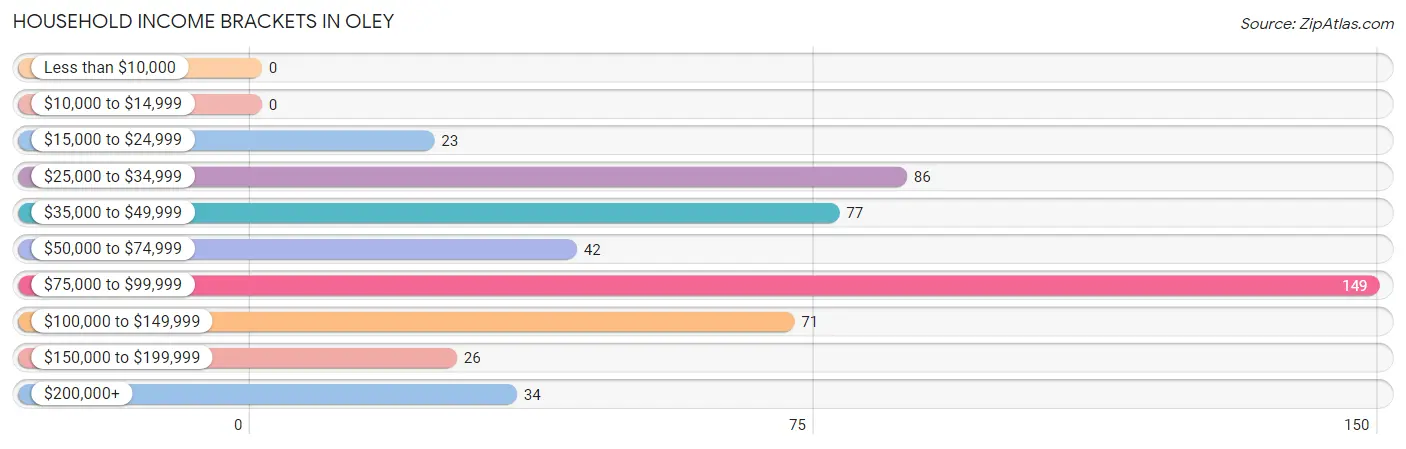
| Income Bracket | # Households | % Households |
| Less than $10,000 | 0 | 0.0% |
| $10,000 to $14,999 | 0 | 0.0% |
| $15,000 to $24,999 | 23 | 4.5% |
| $25,000 to $34,999 | 86 | 16.9% |
| $35,000 to $49,999 | 77 | 15.2% |
| $50,000 to $74,999 | 42 | 8.3% |
| $75,000 to $99,999 | 149 | 29.3% |
| $100,000 to $149,999 | 71 | 14.0% |
| $150,000 to $199,999 | 26 | 5.1% |
| $200,000+ | 34 | 6.7% |
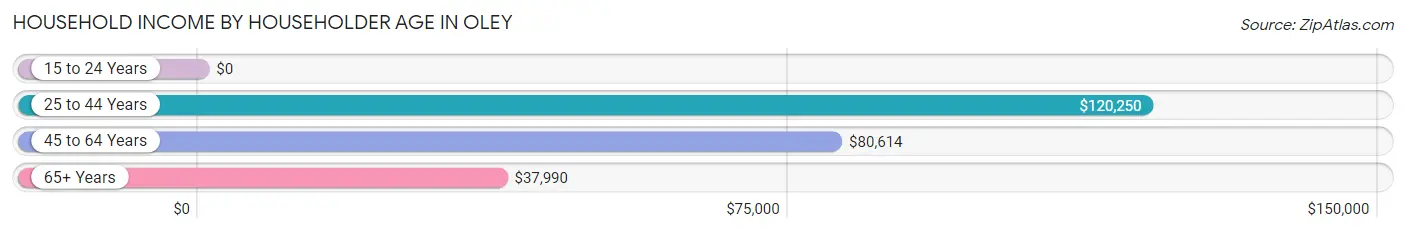
Household Income by Householder Age in Oley
The median household income in Oley is $76,000, with the highest median household income of $120,250 found in the 25 to 44 years age bracket for the primary householder. A total of 107 households (21.1%) fall into this category.
| Income Bracket | # Households | Median Income |
| 15 to 24 Years | 0 (0.0%) | $0 |
| 25 to 44 Years | 107 (21.1%) | $120,250 |
| 45 to 64 Years | 197 (38.8%) | $80,614 |
| 65+ Years | 204 (40.2%) | $37,990 |
| Total | 508 (100.0%) | $76,000 |
Poverty in Oley
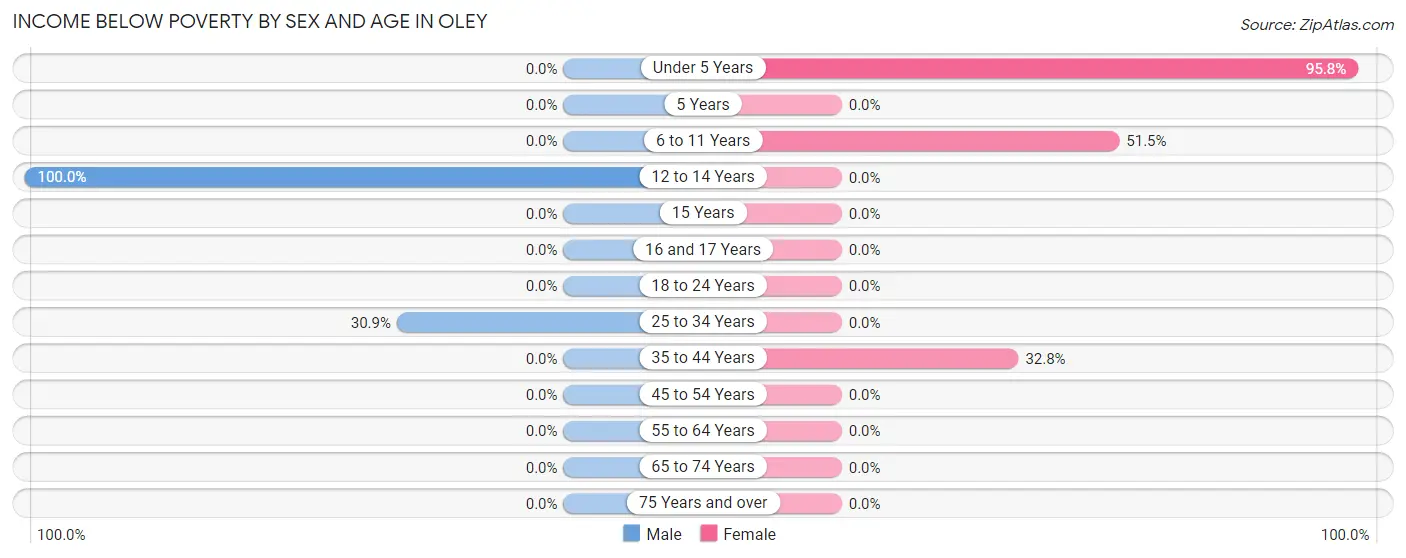
Income Below Poverty by Sex and Age in Oley
With 7.1% poverty level for males and 10.3% for females among the residents of Oley, 12 to 14 year old males and under 5 year old females are the most vulnerable to poverty, with 19 males (100.0%) and 23 females (95.8%) in their respective age groups living below the poverty level.
| Age Bracket | Male | Female |
| Under 5 Years | 0 (0.0%) | 23 (95.8%) |
| 5 Years | 0 (0.0%) | 0 (0.0%) |
| 6 to 11 Years | 0 (0.0%) | 17 (51.5%) |
| 12 to 14 Years | 19 (100.0%) | 0 (0.0%) |
| 15 Years | 0 (0.0%) | 0 (0.0%) |
| 16 and 17 Years | 0 (0.0%) | 0 (0.0%) |
| 18 to 24 Years | 0 (0.0%) | 0 (0.0%) |
| 25 to 34 Years | 17 (30.9%) | 0 (0.0%) |
| 35 to 44 Years | 0 (0.0%) | 20 (32.8%) |
| 45 to 54 Years | 0 (0.0%) | 0 (0.0%) |
| 55 to 64 Years | 0 (0.0%) | 0 (0.0%) |
| 65 to 74 Years | 0 (0.0%) | 0 (0.0%) |
| 75 Years and over | 0 (0.0%) | 0 (0.0%) |
| Total | 36 (7.1%) | 60 (10.3%) |
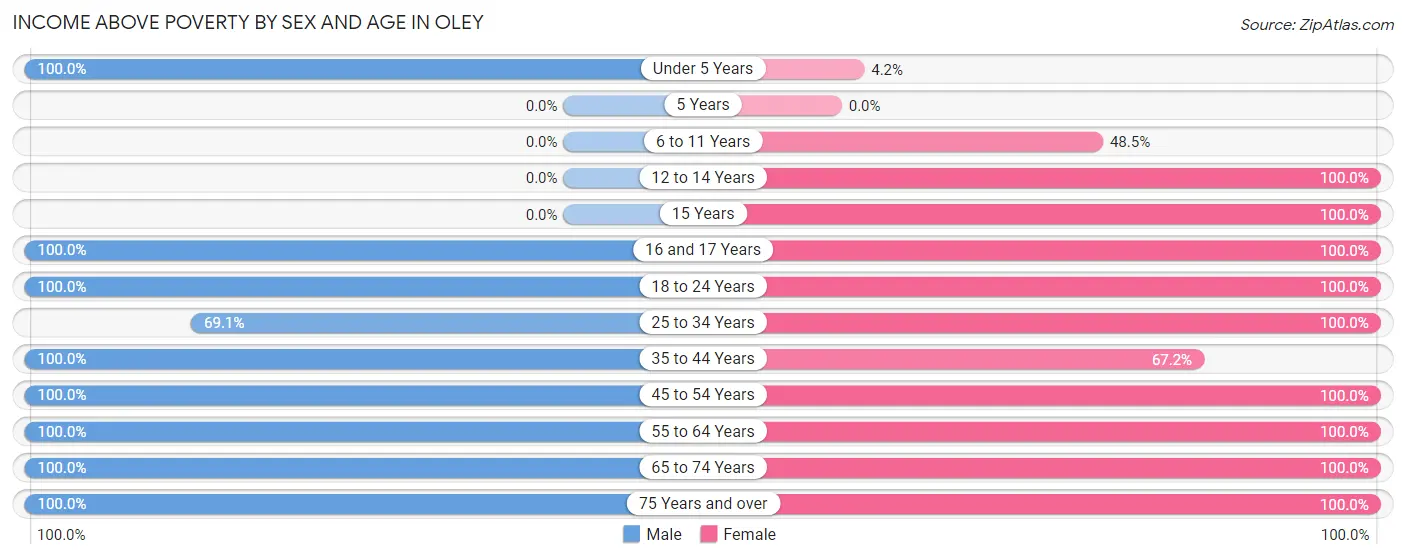
Income Above Poverty by Sex and Age in Oley
According to the poverty statistics in Oley, males aged under 5 years and females aged 12 to 14 years are the age groups that are most secure financially, with 100.0% of males and 100.0% of females in these age groups living above the poverty line.
| Age Bracket | Male | Female |
| Under 5 Years | 11 (100.0%) | 1 (4.2%) |
| 5 Years | 0 (0.0%) | 0 (0.0%) |
| 6 to 11 Years | 0 (0.0%) | 16 (48.5%) |
| 12 to 14 Years | 0 (0.0%) | 16 (100.0%) |
| 15 Years | 0 (0.0%) | 23 (100.0%) |
| 16 and 17 Years | 27 (100.0%) | 31 (100.0%) |
| 18 to 24 Years | 8 (100.0%) | 94 (100.0%) |
| 25 to 34 Years | 38 (69.1%) | 48 (100.0%) |
| 35 to 44 Years | 35 (100.0%) | 41 (67.2%) |
| 45 to 54 Years | 52 (100.0%) | 89 (100.0%) |
| 55 to 64 Years | 145 (100.0%) | 78 (100.0%) |
| 65 to 74 Years | 65 (100.0%) | 73 (100.0%) |
| 75 Years and over | 87 (100.0%) | 13 (100.0%) |
| Total | 468 (92.9%) | 523 (89.7%) |
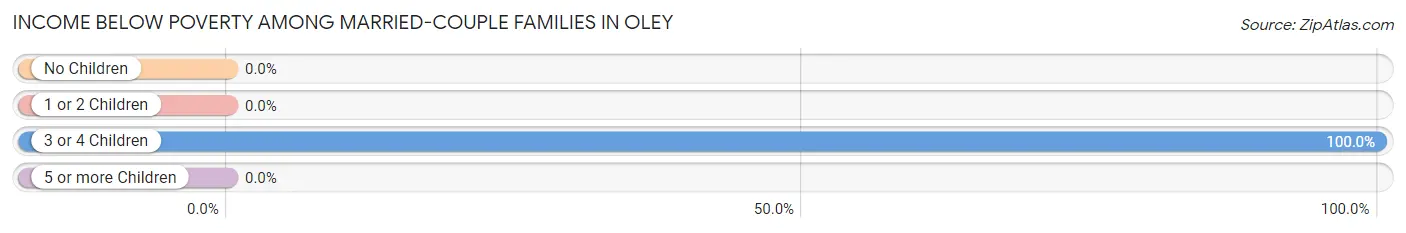
Income Below Poverty Among Married-Couple Families in Oley
The poverty statistics for married-couple families in Oley show that 9.4% or 17 of the total 180 families live below the poverty line. Families with 3 or 4 children have the highest poverty rate of 100.0%, comprising of 17 families. On the other hand, families with no children have the lowest poverty rate of 0.0%, which includes 0 families.
| Children | Above Poverty | Below Poverty |
| No Children | 77 (100.0%) | 0 (0.0%) |
| 1 or 2 Children | 86 (100.0%) | 0 (0.0%) |
| 3 or 4 Children | 0 (0.0%) | 17 (100.0%) |
| 5 or more Children | 0 (0.0%) | 0 (0.0%) |
| Total | 163 (90.6%) | 17 (9.4%) |
Income Below Poverty Among Single-Parent Households in Oley
| Children | Single Father | Single Mother |
| No Children | 0 (0.0%) | 0 (0.0%) |
| 1 or 2 Children | 0 (0.0%) | 0 (0.0%) |
| 3 or 4 Children | 0 (0.0%) | 0 (0.0%) |
| 5 or more Children | 0 (0.0%) | 0 (0.0%) |
| Total | 0 (0.0%) | 0 (0.0%) |
Income Below Poverty Among Married-Couple vs Single-Parent Households in Oley
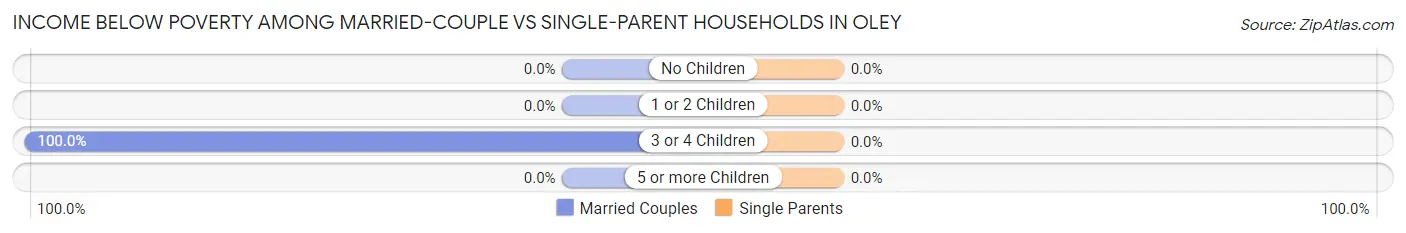
| Children | Married-Couple Families | Single-Parent Households |
| No Children | 0 (0.0%) | 0 (0.0%) |
| 1 or 2 Children | 0 (0.0%) | 0 (0.0%) |
| 3 or 4 Children | 17 (100.0%) | 0 (0.0%) |
| 5 or more Children | 0 (0.0%) | 0 (0.0%) |
| Total | 17 (9.4%) | 0 (0.0%) |
Race in Oley
The most populous races in Oley are , and White / Caucasian (1,131 | 100.0%).
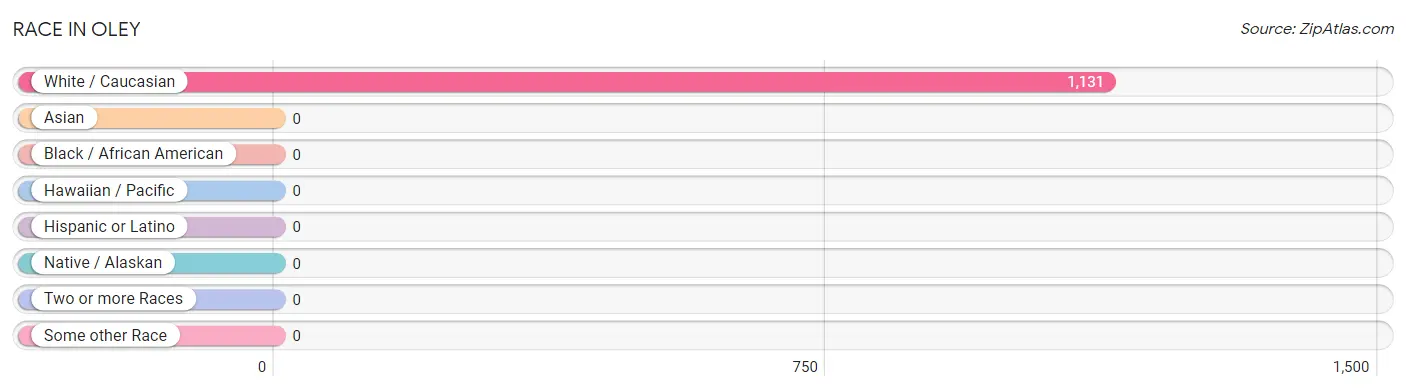
| Race | # Population | % Population |
| Asian | 0 | 0.0% |
| Black / African American | 0 | 0.0% |
| Hawaiian / Pacific | 0 | 0.0% |
| Hispanic or Latino | 0 | 0.0% |
| Native / Alaskan | 0 | 0.0% |
| White / Caucasian | 1,131 | 100.0% |
| Two or more Races | 0 | 0.0% |
| Some other Race | 0 | 0.0% |
| Total | 1,131 | 100.0% |
Ancestry in Oley
The most populous ancestries reported in Oley are German (533 | 47.1%), Italian (181 | 16.0%), Pennsylvania German (111 | 9.8%), Irish (81 | 7.2%), and Lithuanian (50 | 4.4%), together accounting for 84.5% of all Oley residents.
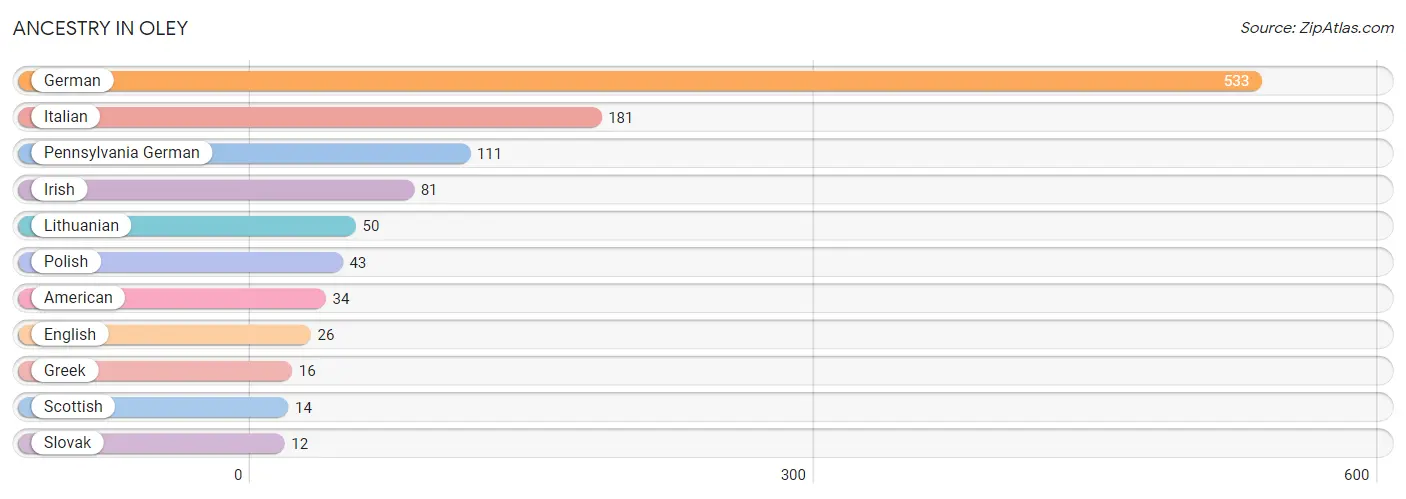
| Ancestry | # Population | % Population |
| American | 34 | 3.0% |
| English | 26 | 2.3% |
| German | 533 | 47.1% |
| Greek | 16 | 1.4% |
| Irish | 81 | 7.2% |
| Italian | 181 | 16.0% |
| Lithuanian | 50 | 4.4% |
| Pennsylvania German | 111 | 9.8% |
| Polish | 43 | 3.8% |
| Scottish | 14 | 1.2% |
| Slovak | 12 | 1.1% | View All 11 Rows |
Immigrants in Oley

| Immigration Origin | # Population | % Population | View All 0 Rows |
Sex and Age in Oley
Sex and Age in Oley
The most populous age groups in Oley are 55 to 59 Years (81 | 16.1%) for men and 15 to 19 Years (144 | 23.0%) for women.
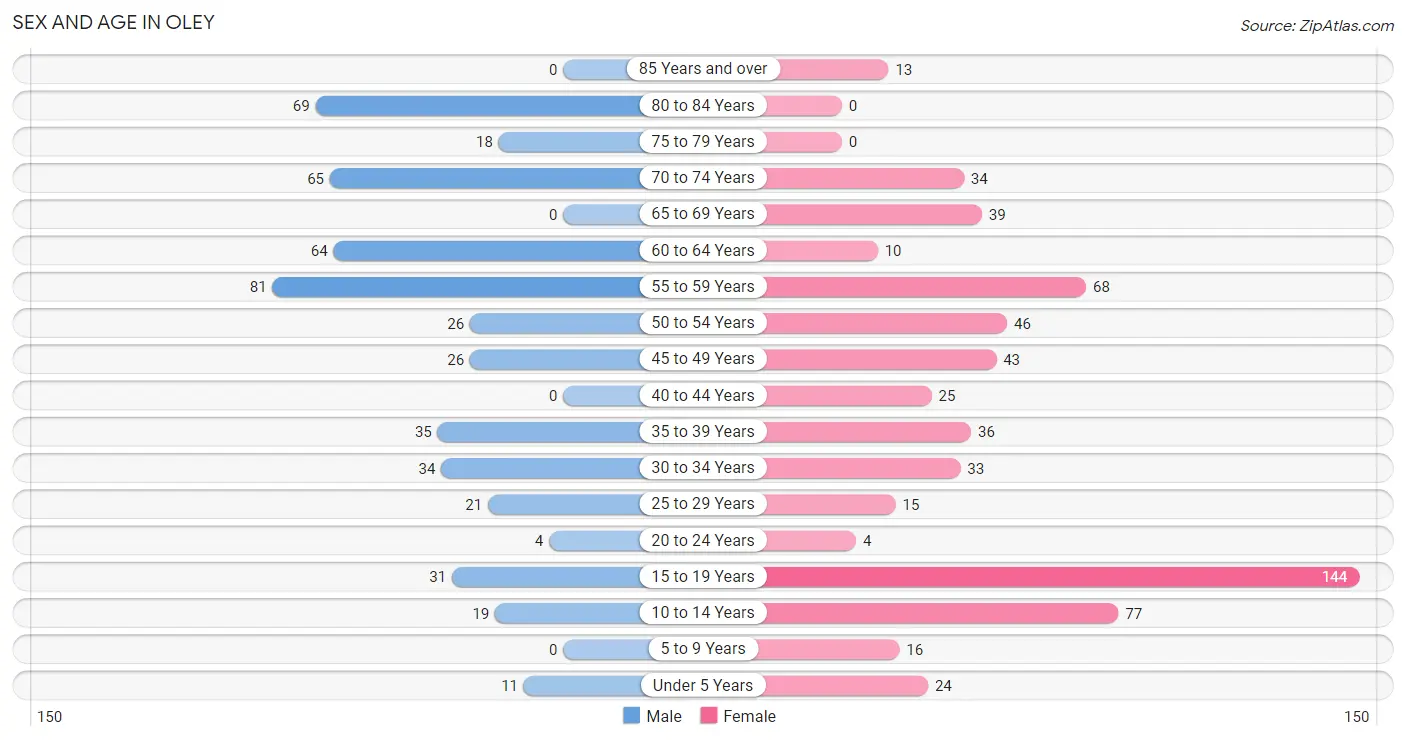
| Age Bracket | Male | Female |
| Under 5 Years | 11 (2.2%) | 24 (3.8%) |
| 5 to 9 Years | 0 (0.0%) | 16 (2.5%) |
| 10 to 14 Years | 19 (3.8%) | 77 (12.3%) |
| 15 to 19 Years | 31 (6.1%) | 144 (23.0%) |
| 20 to 24 Years | 4 (0.8%) | 4 (0.6%) |
| 25 to 29 Years | 21 (4.2%) | 15 (2.4%) |
| 30 to 34 Years | 34 (6.8%) | 33 (5.3%) |
| 35 to 39 Years | 35 (6.9%) | 36 (5.7%) |
| 40 to 44 Years | 0 (0.0%) | 25 (4.0%) |
| 45 to 49 Years | 26 (5.2%) | 43 (6.9%) |
| 50 to 54 Years | 26 (5.2%) | 46 (7.3%) |
| 55 to 59 Years | 81 (16.1%) | 68 (10.8%) |
| 60 to 64 Years | 64 (12.7%) | 10 (1.6%) |
| 65 to 69 Years | 0 (0.0%) | 39 (6.2%) |
| 70 to 74 Years | 65 (12.9%) | 34 (5.4%) |
| 75 to 79 Years | 18 (3.6%) | 0 (0.0%) |
| 80 to 84 Years | 69 (13.7%) | 0 (0.0%) |
| 85 Years and over | 0 (0.0%) | 13 (2.1%) |
| Total | 504 (100.0%) | 627 (100.0%) |
Families and Households in Oley
Median Family Size in Oley
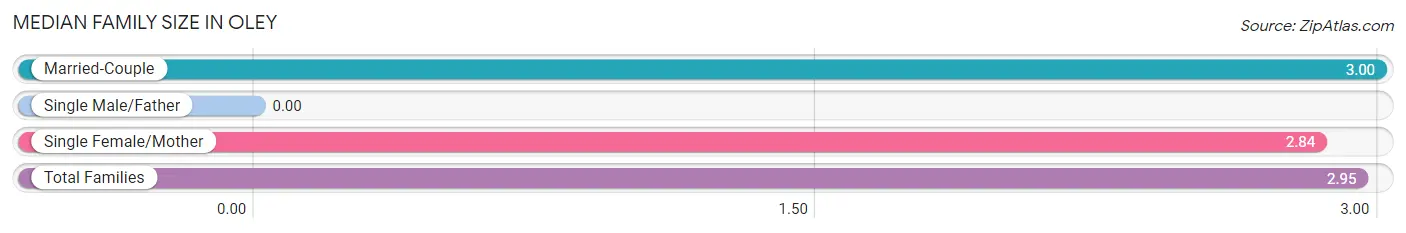
| Family Type | # Families | Family Size |
| Married-Couple | 180 (68.7%) | 3.00 |
| Single Male/Father | 0 (0.0%) | - |
| Single Female/Mother | 82 (31.3%) | 2.84 |
| Total Families | 262 (100.0%) | 2.95 |
Median Household Size in Oley
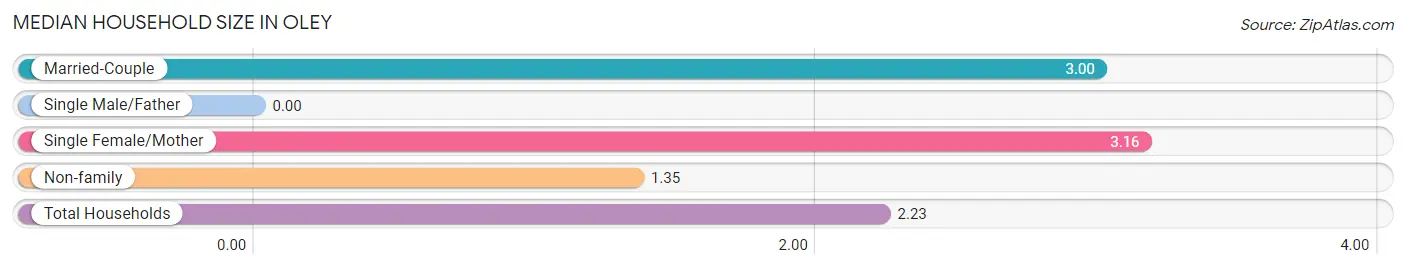
| Household Type | # Households | Household Size |
| Married-Couple | 180 (35.4%) | 3.00 |
| Single Male/Father | 0 (0.0%) | - |
| Single Female/Mother | 82 (16.1%) | 3.16 |
| Non-family | 246 (48.4%) | 1.35 |
| Total Households | 508 (100.0%) | 2.23 |
Household Size by Marriage Status in Oley
Out of a total of 508 households in Oley, 262 (51.6%) are family households, while 246 (48.4%) are nonfamily households. The most numerous type of family households are 2-person households, comprising 113, and the most common type of nonfamily households are 1-person households, comprising 199.
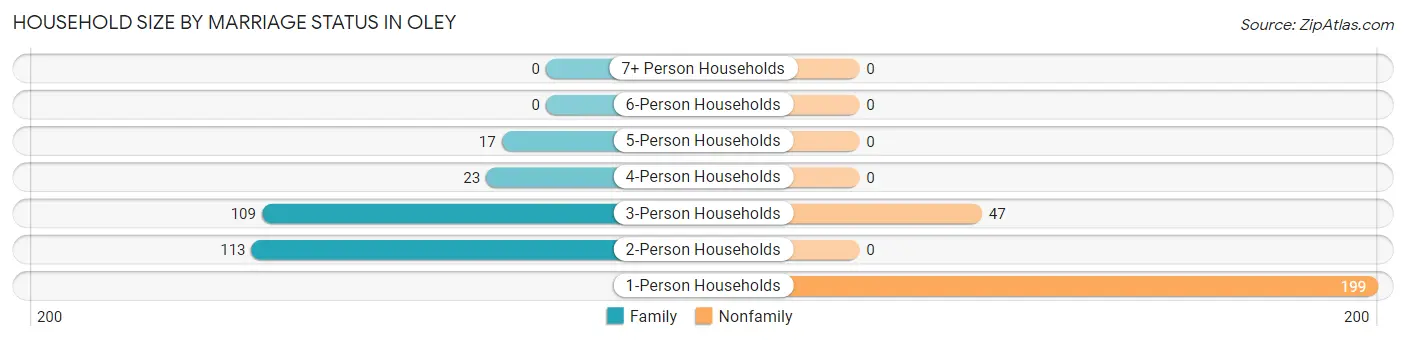
| Household Size | Family Households | Nonfamily Households |
| 1-Person Households | - | 199 (39.2%) |
| 2-Person Households | 113 (22.2%) | 0 (0.0%) |
| 3-Person Households | 109 (21.5%) | 47 (9.2%) |
| 4-Person Households | 23 (4.5%) | 0 (0.0%) |
| 5-Person Households | 17 (3.4%) | 0 (0.0%) |
| 6-Person Households | 0 (0.0%) | 0 (0.0%) |
| 7+ Person Households | 0 (0.0%) | 0 (0.0%) |
| Total | 262 (51.6%) | 246 (48.4%) |
Female Fertility in Oley
Fertility by Age in Oley
Average fertility rate in Oley is 70.0 births per 1,000 women. Women in the age bracket of 35 to 50 years have the highest fertility rate with 192.0 births per 1,000 women. Women in the age bracket of 35 to 50 years acount for 95.2% of all women with births.
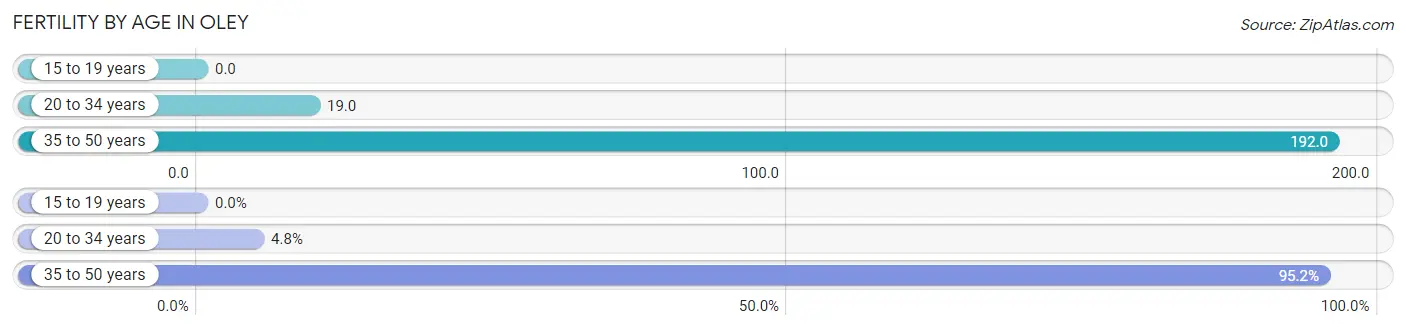
| Age Bracket | Women with Births | Births / 1,000 Women |
| 15 to 19 years | 0 (0.0%) | 0.0 |
| 20 to 34 years | 1 (4.8%) | 19.0 |
| 35 to 50 years | 20 (95.2%) | 192.0 |
| Total | 21 (100.0%) | 70.0 |
Fertility by Age by Marriage Status in Oley
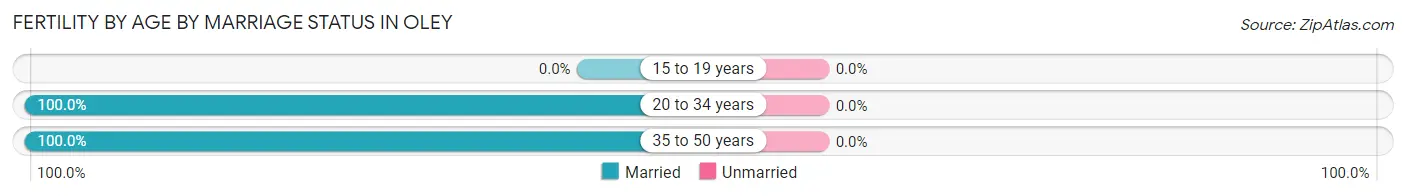
| Age Bracket | Married | Unmarried |
| 15 to 19 years | 0 (0.0%) | 0 (0.0%) |
| 20 to 34 years | 1 (100.0%) | 0 (0.0%) |
| 35 to 50 years | 20 (100.0%) | 0 (0.0%) |
| Total | 21 (100.0%) | 0 (0.0%) |
Fertility by Education in Oley
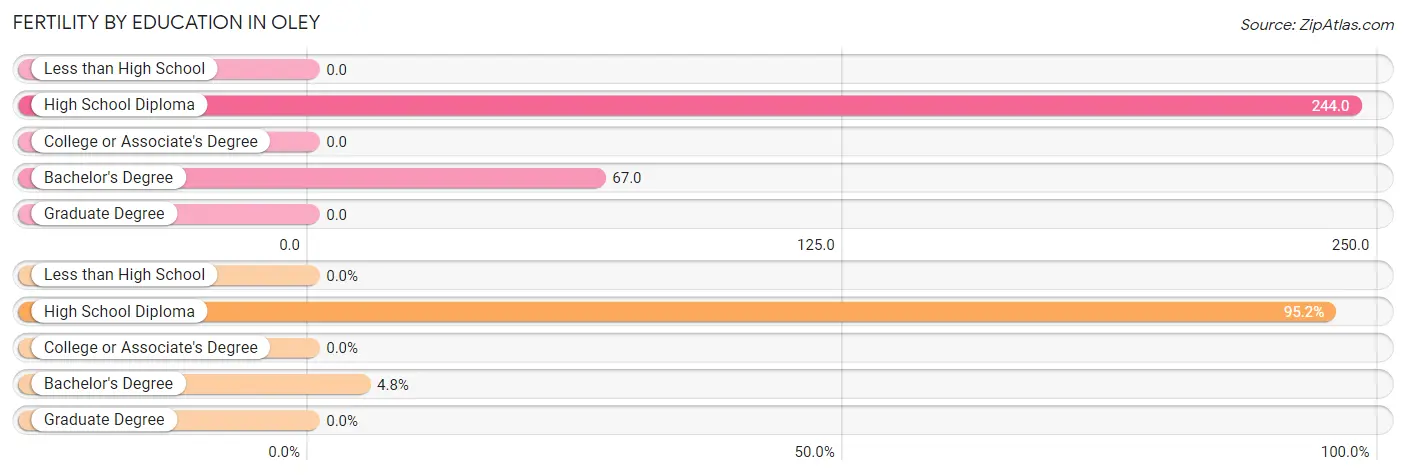
| Educational Attainment | Women with Births | Births / 1,000 Women |
| Less than High School | 0 (0.0%) | 0.0 |
| High School Diploma | 20 (95.2%) | 244.0 |
| College or Associate's Degree | 0 (0.0%) | 0.0 |
| Bachelor's Degree | 1 (4.8%) | 67.0 |
| Graduate Degree | 0 (0.0%) | 0.0 |
| Total | 21 (100.0%) | 70.0 |
Fertility by Education by Marriage Status in Oley
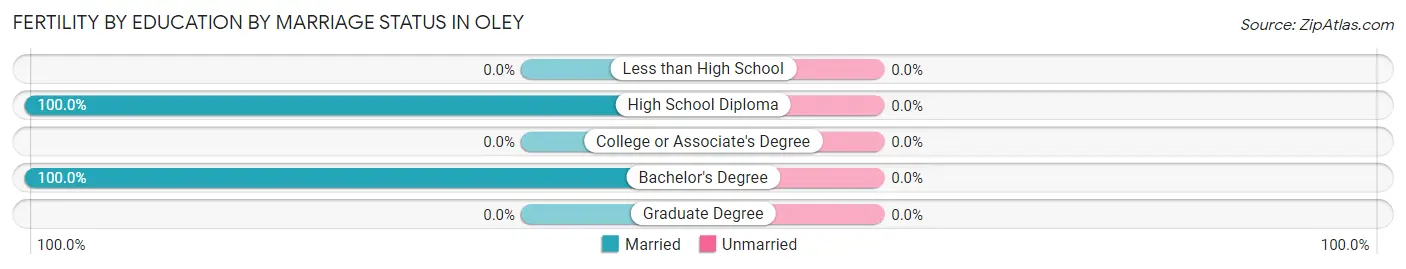
| Educational Attainment | Married | Unmarried |
| Less than High School | 0 (0.0%) | 0 (0.0%) |
| High School Diploma | 20 (100.0%) | 0 (0.0%) |
| College or Associate's Degree | 0 (0.0%) | 0 (0.0%) |
| Bachelor's Degree | 1 (100.0%) | 0 (0.0%) |
| Graduate Degree | 0 (0.0%) | 0 (0.0%) |
| Total | 21 (100.0%) | 0 (0.0%) |
Employment Characteristics in Oley
Employment by Class of Employer in Oley
Among the 513 employed individuals in Oley, private company employees (210 | 40.9%), self-employed (incorporated) (102 | 19.9%), and local government employees (85 | 16.6%) make up the most common classes of employment.
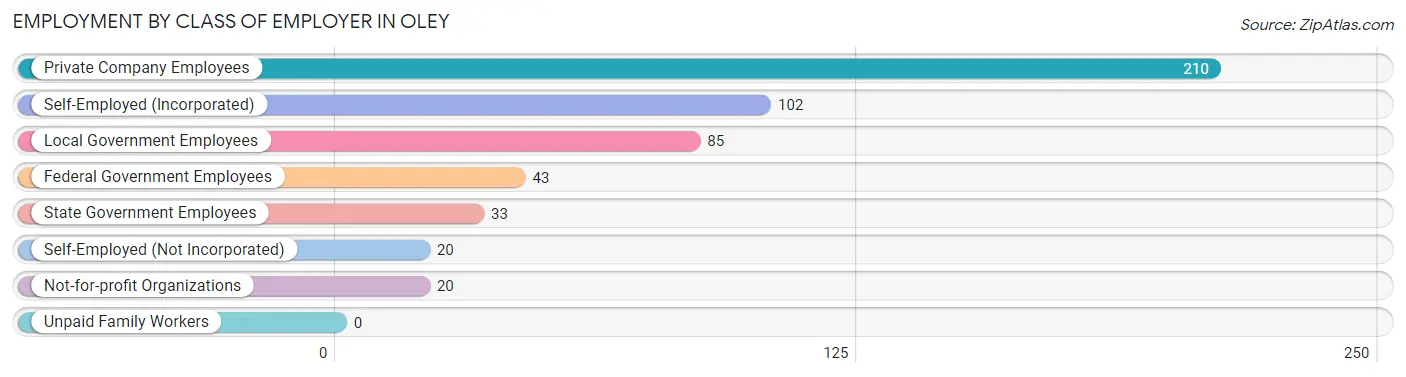
| Employer Class | # Employees | % Employees |
| Private Company Employees | 210 | 40.9% |
| Self-Employed (Incorporated) | 102 | 19.9% |
| Self-Employed (Not Incorporated) | 20 | 3.9% |
| Not-for-profit Organizations | 20 | 3.9% |
| Local Government Employees | 85 | 16.6% |
| State Government Employees | 33 | 6.4% |
| Federal Government Employees | 43 | 8.4% |
| Unpaid Family Workers | 0 | 0.0% |
| Total | 513 | 100.0% |
Employment Status by Age in Oley
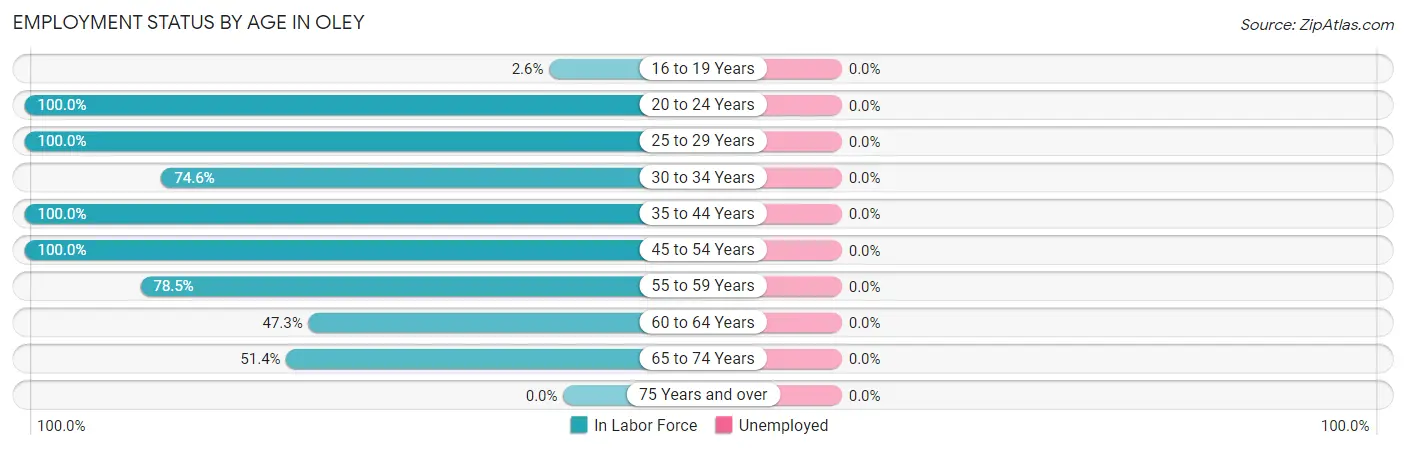
| Age Bracket | In Labor Force | Unemployed |
| 16 to 19 Years | 4 (2.6%) | 0 (0.0%) |
| 20 to 24 Years | 8 (100.0%) | 0 (0.0%) |
| 25 to 29 Years | 36 (100.0%) | 0 (0.0%) |
| 30 to 34 Years | 50 (74.6%) | 0 (0.0%) |
| 35 to 44 Years | 96 (100.0%) | 0 (0.0%) |
| 45 to 54 Years | 141 (100.0%) | 0 (0.0%) |
| 55 to 59 Years | 117 (78.5%) | 0 (0.0%) |
| 60 to 64 Years | 35 (47.3%) | 0 (0.0%) |
| 65 to 74 Years | 71 (51.4%) | 0 (0.0%) |
| 75 Years and over | 0 (0.0%) | 0 (0.0%) |
| Total | 558 (58.1%) | 0 (0.0%) |
Employment Status by Educational Attainment in Oley
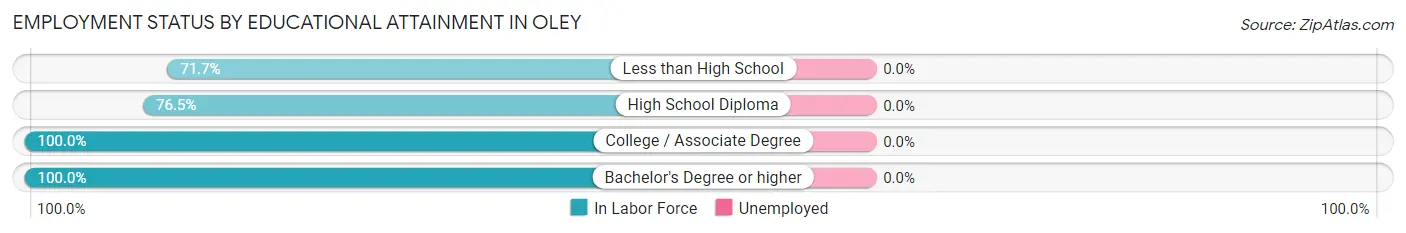
| Educational Attainment | In Labor Force | Unemployed |
| Less than High School | 43 (71.7%) | 0 (0.0%) |
| High School Diploma | 231 (76.5%) | 0 (0.0%) |
| College / Associate Degree | 60 (100.0%) | 0 (0.0%) |
| Bachelor's Degree or higher | 141 (100.0%) | 0 (0.0%) |
| Total | 475 (84.4%) | 0 (0.0%) |
Employment Occupations by Sex in Oley
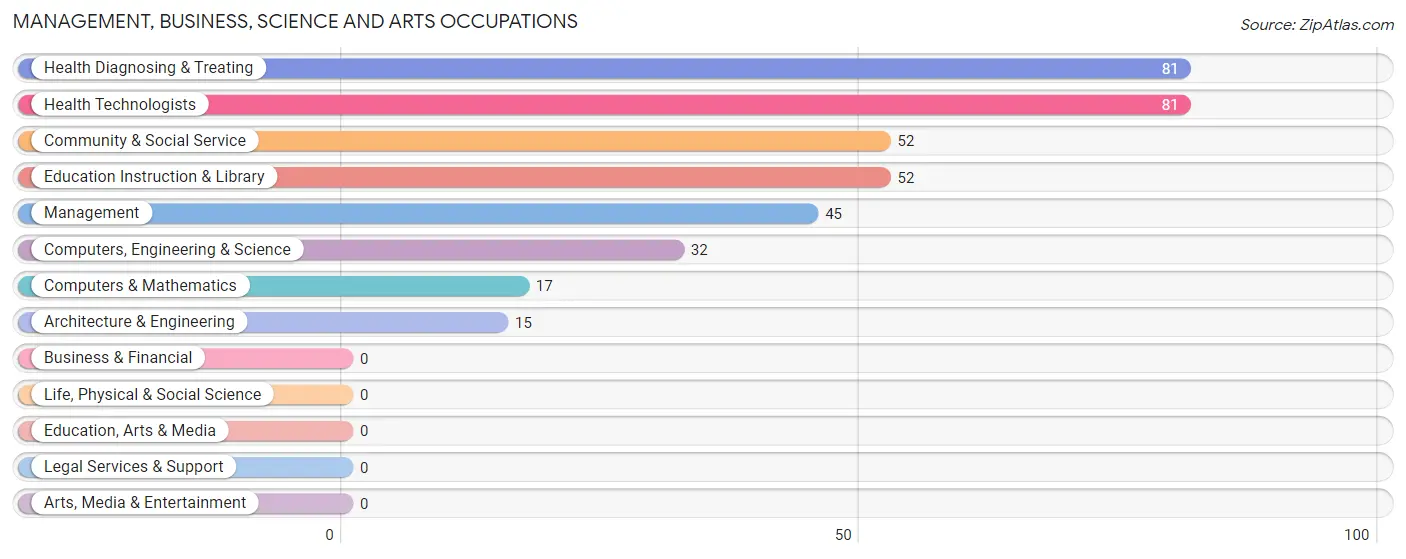
Management, Business, Science and Arts Occupations
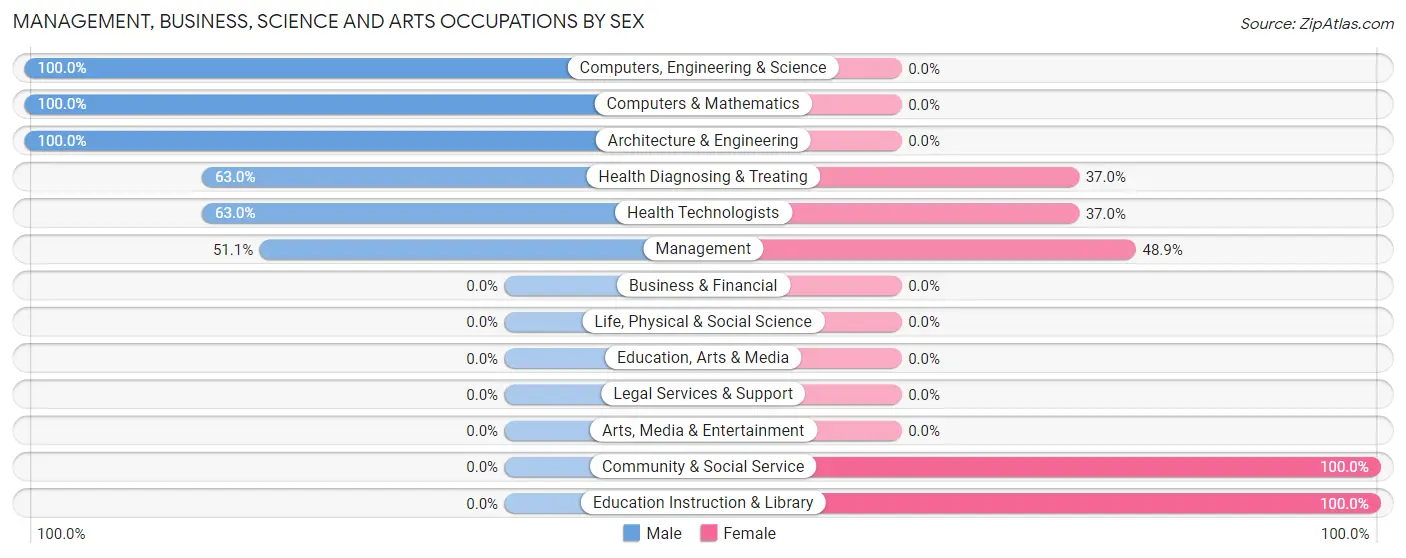
The most common Management, Business, Science and Arts occupations in Oley are Health Diagnosing & Treating (81 | 14.5%), Health Technologists (81 | 14.5%), Community & Social Service (52 | 9.3%), Education Instruction & Library (52 | 9.3%), and Management (45 | 8.1%).
Management, Business, Science and Arts Occupations by Sex
Within the Management, Business, Science and Arts occupations in Oley, the most male-oriented occupations are Computers, Engineering & Science (100.0%), Computers & Mathematics (100.0%), and Architecture & Engineering (100.0%), while the most female-oriented occupations are Community & Social Service (100.0%), Education Instruction & Library (100.0%), and Management (48.9%).
| Occupation | Male | Female |
| Management | 23 (51.1%) | 22 (48.9%) |
| Business & Financial | 0 (0.0%) | 0 (0.0%) |
| Computers, Engineering & Science | 32 (100.0%) | 0 (0.0%) |
| Computers & Mathematics | 17 (100.0%) | 0 (0.0%) |
| Architecture & Engineering | 15 (100.0%) | 0 (0.0%) |
| Life, Physical & Social Science | 0 (0.0%) | 0 (0.0%) |
| Community & Social Service | 0 (0.0%) | 52 (100.0%) |
| Education, Arts & Media | 0 (0.0%) | 0 (0.0%) |
| Legal Services & Support | 0 (0.0%) | 0 (0.0%) |
| Education Instruction & Library | 0 (0.0%) | 52 (100.0%) |
| Arts, Media & Entertainment | 0 (0.0%) | 0 (0.0%) |
| Health Diagnosing & Treating | 51 (63.0%) | 30 (37.0%) |
| Health Technologists | 51 (63.0%) | 30 (37.0%) |
| Total (Category) | 106 (50.5%) | 104 (49.5%) |
| Total (Overall) | 268 (48.0%) | 290 (52.0%) |
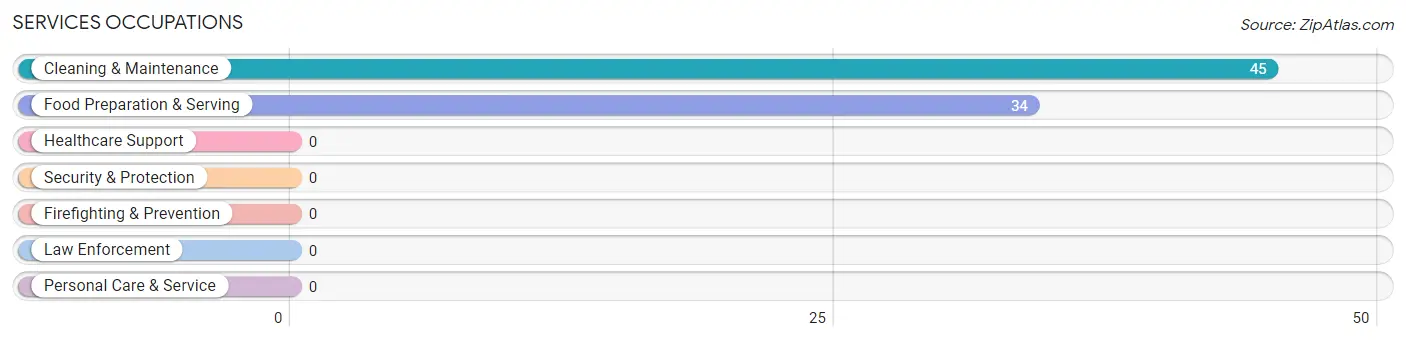
Services Occupations
The most common Services occupations in Oley are Cleaning & Maintenance (45 | 8.1%), and Food Preparation & Serving (34 | 6.1%).
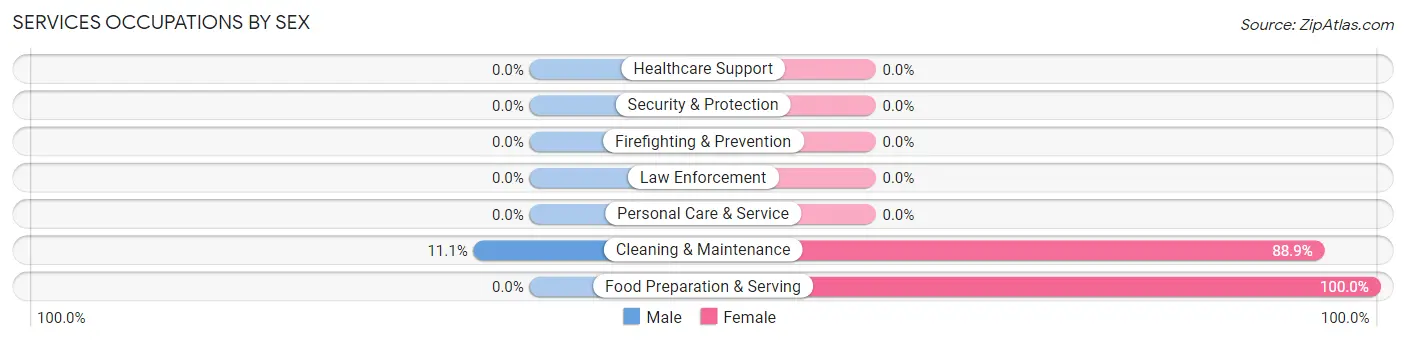
Services Occupations by Sex
| Occupation | Male | Female |
| Healthcare Support | 0 (0.0%) | 0 (0.0%) |
| Security & Protection | 0 (0.0%) | 0 (0.0%) |
| Firefighting & Prevention | 0 (0.0%) | 0 (0.0%) |
| Law Enforcement | 0 (0.0%) | 0 (0.0%) |
| Food Preparation & Serving | 0 (0.0%) | 34 (100.0%) |
| Cleaning & Maintenance | 5 (11.1%) | 40 (88.9%) |
| Personal Care & Service | 0 (0.0%) | 0 (0.0%) |
| Total (Category) | 5 (6.3%) | 74 (93.7%) |
| Total (Overall) | 268 (48.0%) | 290 (52.0%) |
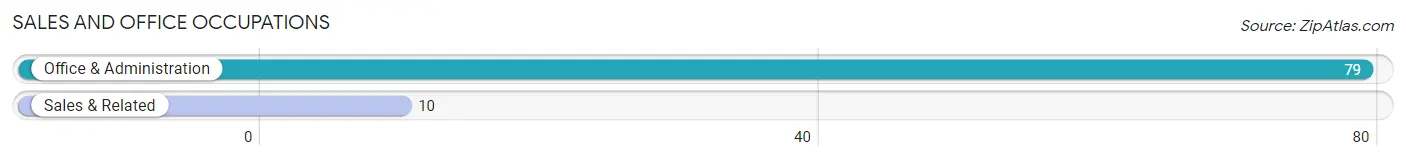
Sales and Office Occupations
The most common Sales and Office occupations in Oley are Office & Administration (79 | 14.2%), and Sales & Related (10 | 1.8%).
Sales and Office Occupations by Sex
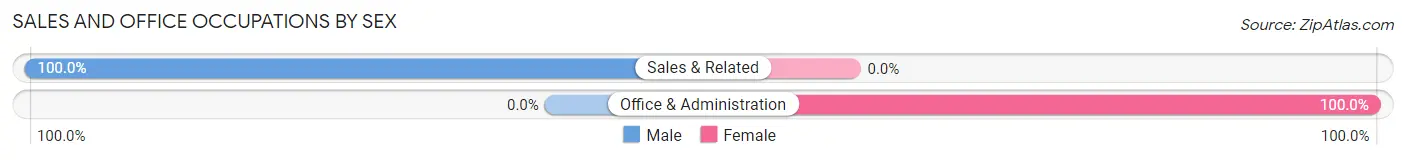
| Occupation | Male | Female |
| Sales & Related | 10 (100.0%) | 0 (0.0%) |
| Office & Administration | 0 (0.0%) | 79 (100.0%) |
| Total (Category) | 10 (11.2%) | 79 (88.8%) |
| Total (Overall) | 268 (48.0%) | 290 (52.0%) |
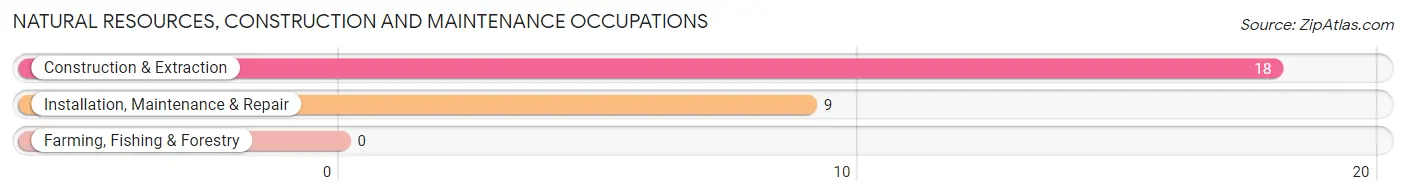
Natural Resources, Construction and Maintenance Occupations
The most common Natural Resources, Construction and Maintenance occupations in Oley are Construction & Extraction (18 | 3.2%), and Installation, Maintenance & Repair (9 | 1.6%).
Natural Resources, Construction and Maintenance Occupations by Sex
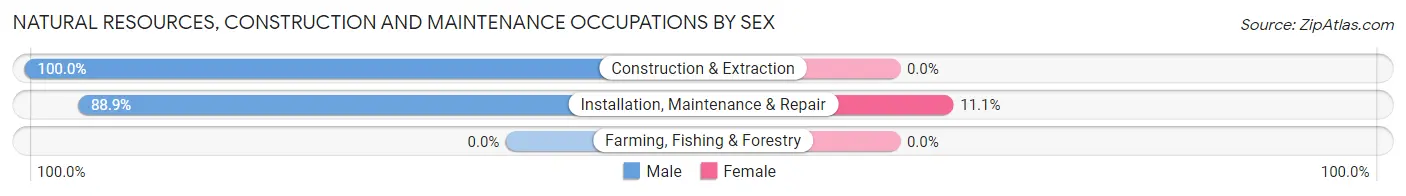
| Occupation | Male | Female |
| Farming, Fishing & Forestry | 0 (0.0%) | 0 (0.0%) |
| Construction & Extraction | 18 (100.0%) | 0 (0.0%) |
| Installation, Maintenance & Repair | 8 (88.9%) | 1 (11.1%) |
| Total (Category) | 26 (96.3%) | 1 (3.7%) |
| Total (Overall) | 268 (48.0%) | 290 (52.0%) |
Production, Transportation and Moving Occupations
The most common Production, Transportation and Moving occupations in Oley are Material Moving (82 | 14.7%), Transportation (45 | 8.1%), and Production (26 | 4.7%).
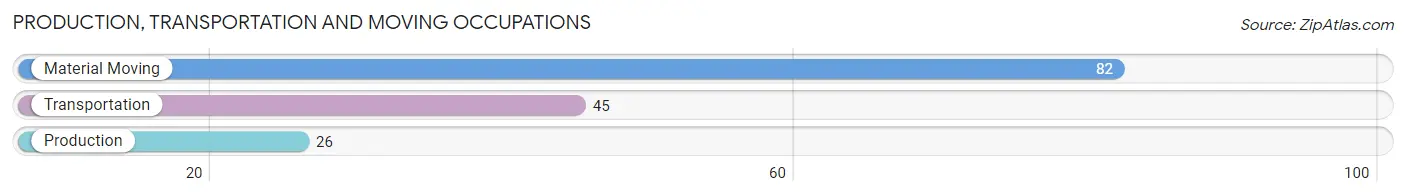
Production, Transportation and Moving Occupations by Sex
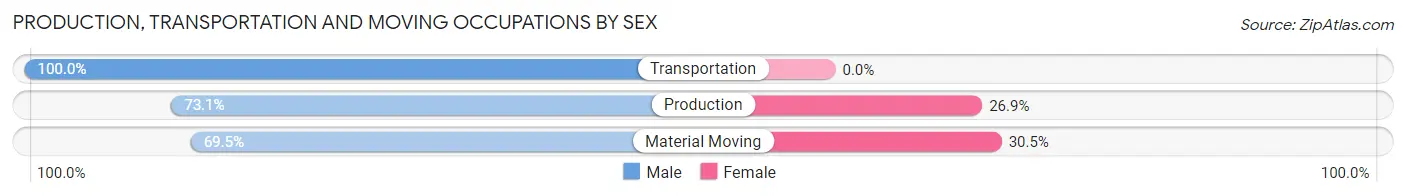
| Occupation | Male | Female |
| Production | 19 (73.1%) | 7 (26.9%) |
| Transportation | 45 (100.0%) | 0 (0.0%) |
| Material Moving | 57 (69.5%) | 25 (30.5%) |
| Total (Category) | 121 (79.1%) | 32 (20.9%) |
| Total (Overall) | 268 (48.0%) | 290 (52.0%) |
Employment Industries by Sex in Oley
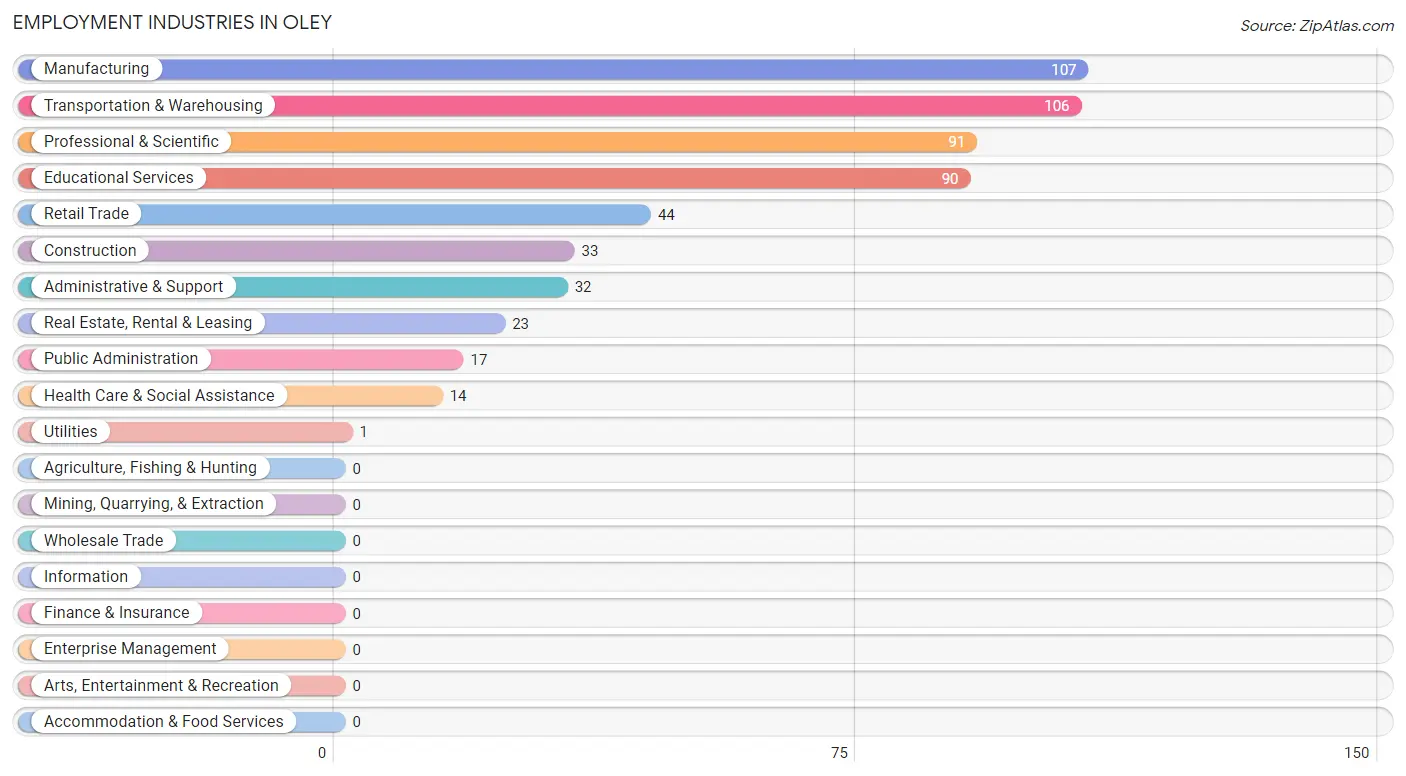
Employment Industries in Oley
The major employment industries in Oley include Manufacturing (107 | 19.2%), Transportation & Warehousing (106 | 19.0%), Professional & Scientific (91 | 16.3%), Educational Services (90 | 16.1%), and Retail Trade (44 | 7.9%).
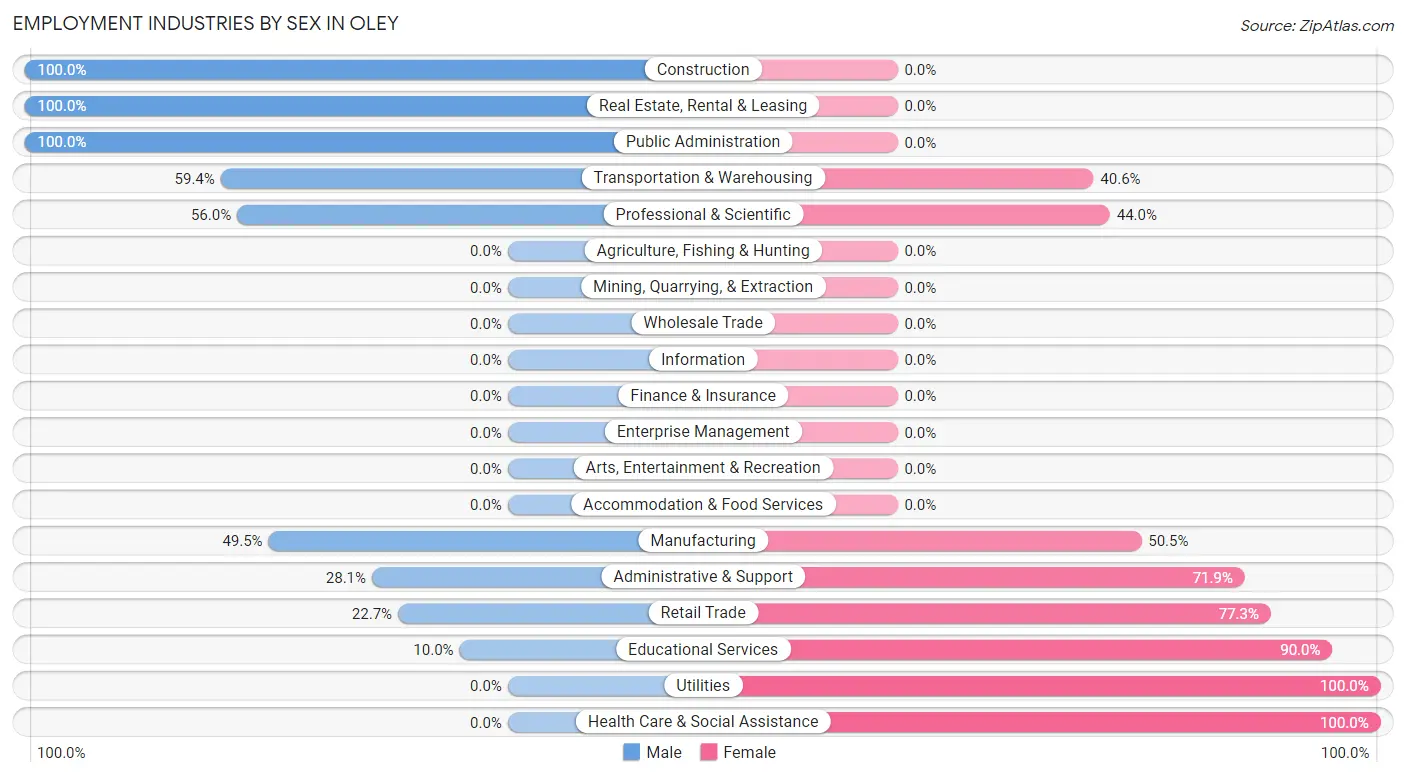
Employment Industries by Sex in Oley
The Oley industries that see more men than women are Construction (100.0%), Real Estate, Rental & Leasing (100.0%), and Public Administration (100.0%), whereas the industries that tend to have a higher number of women are Utilities (100.0%), Health Care & Social Assistance (100.0%), and Educational Services (90.0%).
| Industry | Male | Female |
| Agriculture, Fishing & Hunting | 0 (0.0%) | 0 (0.0%) |
| Mining, Quarrying, & Extraction | 0 (0.0%) | 0 (0.0%) |
| Construction | 33 (100.0%) | 0 (0.0%) |
| Manufacturing | 53 (49.5%) | 54 (50.5%) |
| Wholesale Trade | 0 (0.0%) | 0 (0.0%) |
| Retail Trade | 10 (22.7%) | 34 (77.3%) |
| Transportation & Warehousing | 63 (59.4%) | 43 (40.6%) |
| Utilities | 0 (0.0%) | 1 (100.0%) |
| Information | 0 (0.0%) | 0 (0.0%) |
| Finance & Insurance | 0 (0.0%) | 0 (0.0%) |
| Real Estate, Rental & Leasing | 23 (100.0%) | 0 (0.0%) |
| Professional & Scientific | 51 (56.0%) | 40 (44.0%) |
| Enterprise Management | 0 (0.0%) | 0 (0.0%) |
| Administrative & Support | 9 (28.1%) | 23 (71.9%) |
| Educational Services | 9 (10.0%) | 81 (90.0%) |
| Health Care & Social Assistance | 0 (0.0%) | 14 (100.0%) |
| Arts, Entertainment & Recreation | 0 (0.0%) | 0 (0.0%) |
| Accommodation & Food Services | 0 (0.0%) | 0 (0.0%) |
| Public Administration | 17 (100.0%) | 0 (0.0%) |
| Total | 268 (48.0%) | 290 (52.0%) |
Education in Oley
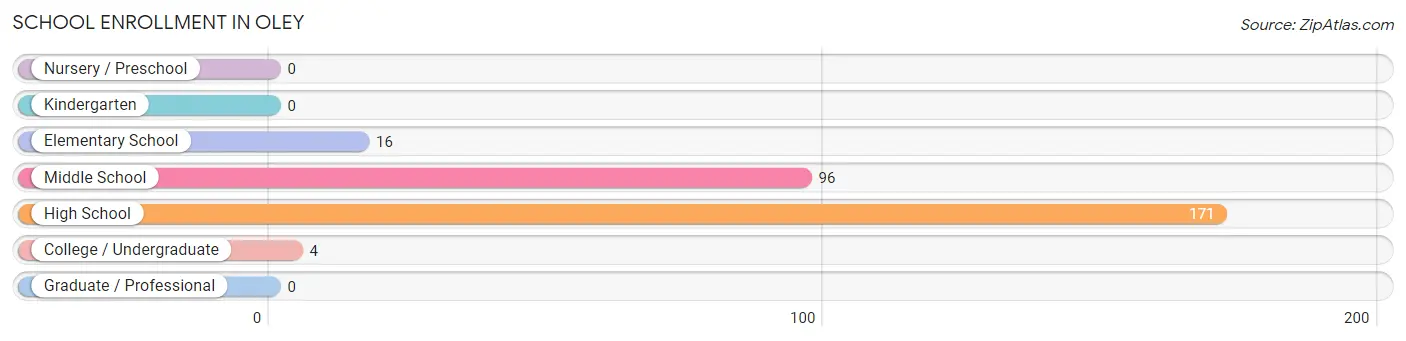
School Enrollment in Oley
The most common levels of schooling among the 287 students in Oley are high school (171 | 59.6%), middle school (96 | 33.5%), and elementary school (16 | 5.6%).
| School Level | # Students | % Students |
| Nursery / Preschool | 0 | 0.0% |
| Kindergarten | 0 | 0.0% |
| Elementary School | 16 | 5.6% |
| Middle School | 96 | 33.5% |
| High School | 171 | 59.6% |
| College / Undergraduate | 4 | 1.4% |
| Graduate / Professional | 0 | 0.0% |
| Total | 287 | 100.0% |
School Enrollment by Age by Funding Source in Oley
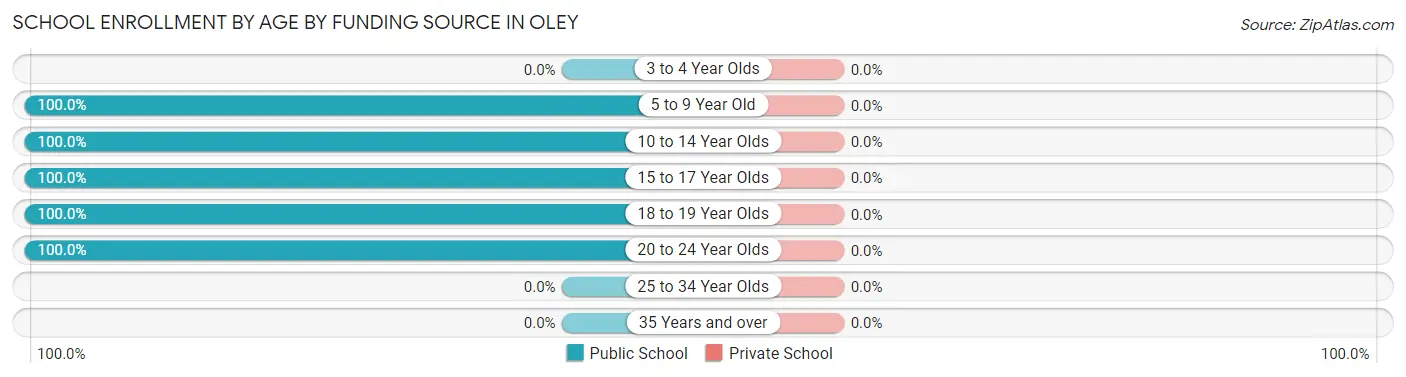
| Age Bracket | Public School | Private School |
| 3 to 4 Year Olds | 0 (0.0%) | 0 (0.0%) |
| 5 to 9 Year Old | 16 (100.0%) | 0 (0.0%) |
| 10 to 14 Year Olds | 96 (100.0%) | 0 (0.0%) |
| 15 to 17 Year Olds | 81 (100.0%) | 0 (0.0%) |
| 18 to 19 Year Olds | 90 (100.0%) | 0 (0.0%) |
| 20 to 24 Year Olds | 4 (100.0%) | 0 (0.0%) |
| 25 to 34 Year Olds | 0 (0.0%) | 0 (0.0%) |
| 35 Years and over | 0 (0.0%) | 0 (0.0%) |
| Total | 287 (100.0%) | 0 (0.0%) |
Educational Attainment by Field of Study in Oley
Bio, nature & agricultural (51 | 22.7%), arts & humanities (48 | 21.3%), computers & mathematics (24 | 10.7%), communications (22 | 9.8%), and business (21 | 9.3%) are the most common fields of study among 225 individuals in Oley who have obtained a bachelor's degree or higher.
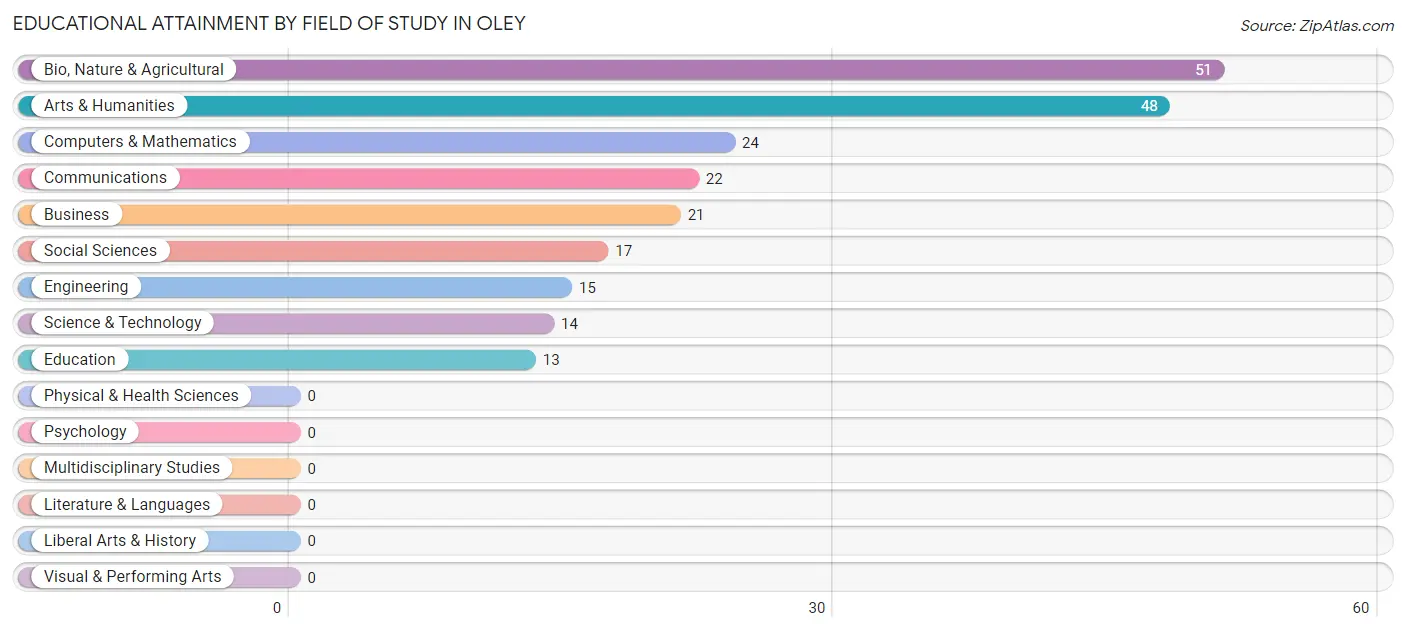
| Field of Study | # Graduates | % Graduates |
| Computers & Mathematics | 24 | 10.7% |
| Bio, Nature & Agricultural | 51 | 22.7% |
| Physical & Health Sciences | 0 | 0.0% |
| Psychology | 0 | 0.0% |
| Social Sciences | 17 | 7.6% |
| Engineering | 15 | 6.7% |
| Multidisciplinary Studies | 0 | 0.0% |
| Science & Technology | 14 | 6.2% |
| Business | 21 | 9.3% |
| Education | 13 | 5.8% |
| Literature & Languages | 0 | 0.0% |
| Liberal Arts & History | 0 | 0.0% |
| Visual & Performing Arts | 0 | 0.0% |
| Communications | 22 | 9.8% |
| Arts & Humanities | 48 | 21.3% |
| Total | 225 | 100.0% |
Transportation & Commute in Oley
Vehicle Availability by Sex in Oley
The most prevalent vehicle ownership categories in Oley are males with 2 vehicles (107, accounting for 48.0%) and females with 2 vehicles (116, making up 36.9%).
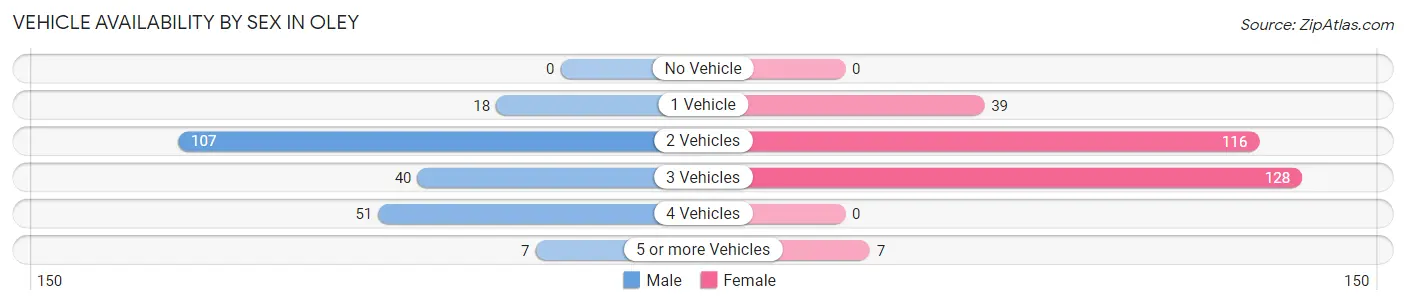
| Vehicles Available | Male | Female |
| No Vehicle | 0 (0.0%) | 0 (0.0%) |
| 1 Vehicle | 18 (8.1%) | 39 (13.5%) |
| 2 Vehicles | 107 (48.0%) | 116 (40.0%) |
| 3 Vehicles | 40 (17.9%) | 128 (44.1%) |
| 4 Vehicles | 51 (22.9%) | 0 (0.0%) |
| 5 or more Vehicles | 7 (3.1%) | 7 (2.4%) |
| Total | 223 (100.0%) | 290 (100.0%) |
Commute Time in Oley
The most frequently occuring commute durations in Oley are 20 to 24 minutes (157 commuters, 31.7%), 15 to 19 minutes (110 commuters, 22.2%), and 30 to 34 minutes (75 commuters, 15.1%).
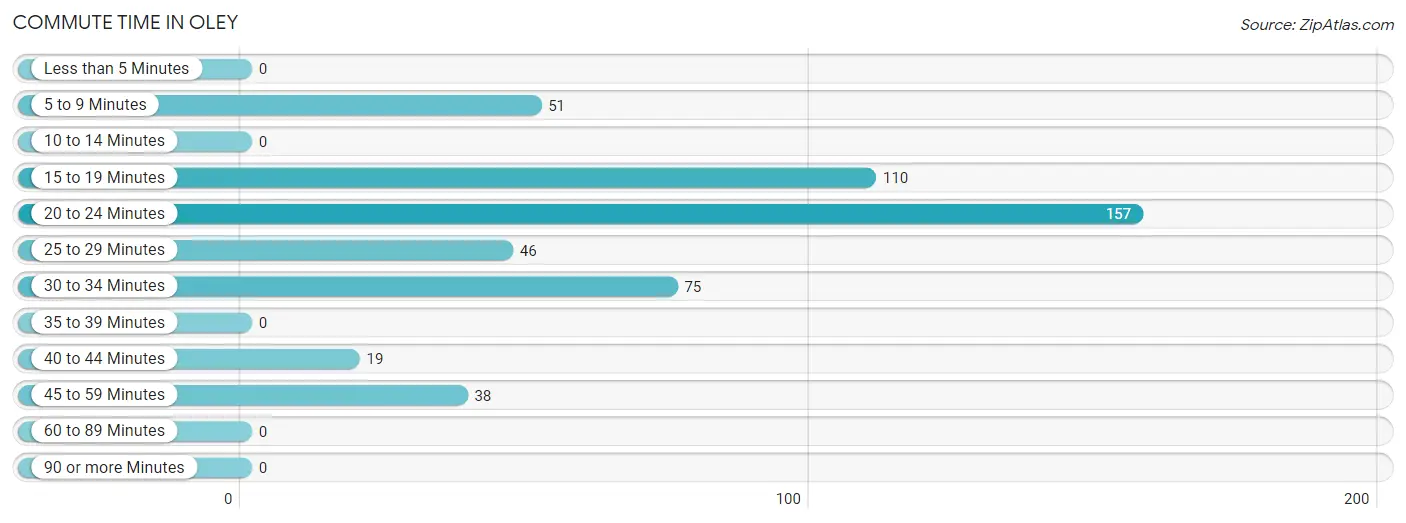
| Commute Time | # Commuters | % Commuters |
| Less than 5 Minutes | 0 | 0.0% |
| 5 to 9 Minutes | 51 | 10.3% |
| 10 to 14 Minutes | 0 | 0.0% |
| 15 to 19 Minutes | 110 | 22.2% |
| 20 to 24 Minutes | 157 | 31.7% |
| 25 to 29 Minutes | 46 | 9.3% |
| 30 to 34 Minutes | 75 | 15.1% |
| 35 to 39 Minutes | 0 | 0.0% |
| 40 to 44 Minutes | 19 | 3.8% |
| 45 to 59 Minutes | 38 | 7.7% |
| 60 to 89 Minutes | 0 | 0.0% |
| 90 or more Minutes | 0 | 0.0% |
Commute Time by Sex in Oley
The most common commute times in Oley are 20 to 24 minutes (111 commuters, 49.8%) for males and 15 to 19 minutes (103 commuters, 37.7%) for females.
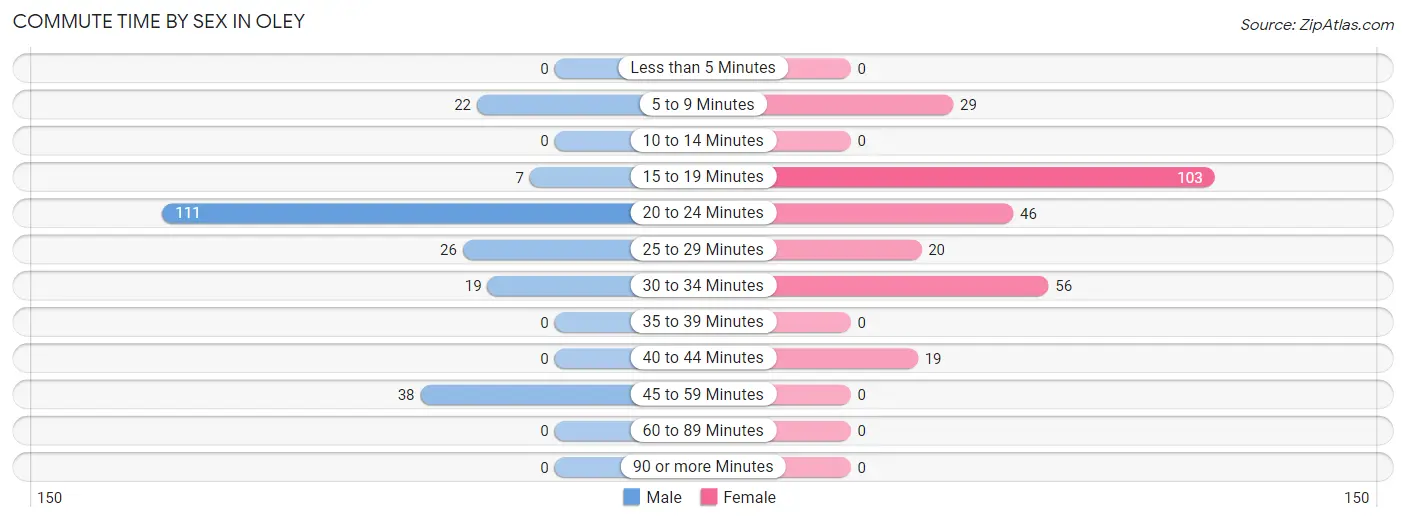
| Commute Time | Male | Female |
| Less than 5 Minutes | 0 (0.0%) | 0 (0.0%) |
| 5 to 9 Minutes | 22 (9.9%) | 29 (10.6%) |
| 10 to 14 Minutes | 0 (0.0%) | 0 (0.0%) |
| 15 to 19 Minutes | 7 (3.1%) | 103 (37.7%) |
| 20 to 24 Minutes | 111 (49.8%) | 46 (16.9%) |
| 25 to 29 Minutes | 26 (11.7%) | 20 (7.3%) |
| 30 to 34 Minutes | 19 (8.5%) | 56 (20.5%) |
| 35 to 39 Minutes | 0 (0.0%) | 0 (0.0%) |
| 40 to 44 Minutes | 0 (0.0%) | 19 (7.0%) |
| 45 to 59 Minutes | 38 (17.0%) | 0 (0.0%) |
| 60 to 89 Minutes | 0 (0.0%) | 0 (0.0%) |
| 90 or more Minutes | 0 (0.0%) | 0 (0.0%) |
Time of Departure to Work by Sex in Oley
The most frequent times of departure to work in Oley are 7:00 AM to 7:29 AM (91, 40.8%) for males and 7:00 AM to 7:29 AM (93, 34.1%) for females.
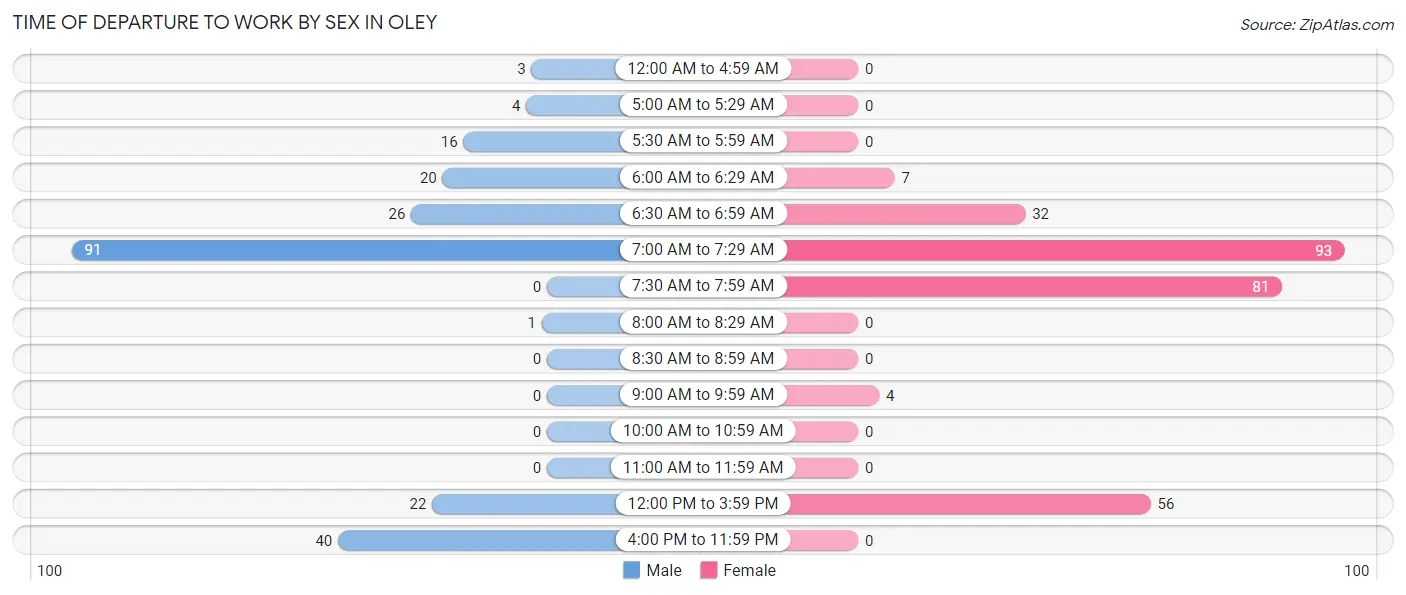
| Time of Departure | Male | Female |
| 12:00 AM to 4:59 AM | 3 (1.3%) | 0 (0.0%) |
| 5:00 AM to 5:29 AM | 4 (1.8%) | 0 (0.0%) |
| 5:30 AM to 5:59 AM | 16 (7.2%) | 0 (0.0%) |
| 6:00 AM to 6:29 AM | 20 (9.0%) | 7 (2.6%) |
| 6:30 AM to 6:59 AM | 26 (11.7%) | 32 (11.7%) |
| 7:00 AM to 7:29 AM | 91 (40.8%) | 93 (34.1%) |
| 7:30 AM to 7:59 AM | 0 (0.0%) | 81 (29.7%) |
| 8:00 AM to 8:29 AM | 1 (0.4%) | 0 (0.0%) |
| 8:30 AM to 8:59 AM | 0 (0.0%) | 0 (0.0%) |
| 9:00 AM to 9:59 AM | 0 (0.0%) | 4 (1.5%) |
| 10:00 AM to 10:59 AM | 0 (0.0%) | 0 (0.0%) |
| 11:00 AM to 11:59 AM | 0 (0.0%) | 0 (0.0%) |
| 12:00 PM to 3:59 PM | 22 (9.9%) | 56 (20.5%) |
| 4:00 PM to 11:59 PM | 40 (17.9%) | 0 (0.0%) |
| Total | 223 (100.0%) | 273 (100.0%) |
Housing Occupancy in Oley
Occupancy by Ownership in Oley
Of the total 508 dwellings in Oley, owner-occupied units account for 354 (69.7%), while renter-occupied units make up 154 (30.3%).
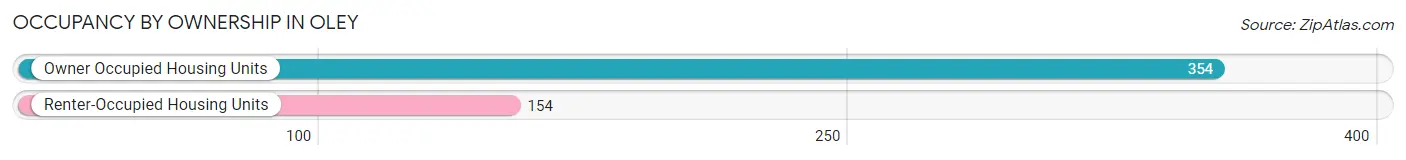
| Occupancy | # Housing Units | % Housing Units |
| Owner Occupied Housing Units | 354 | 69.7% |
| Renter-Occupied Housing Units | 154 | 30.3% |
| Total Occupied Housing Units | 508 | 100.0% |
Occupancy by Household Size in Oley
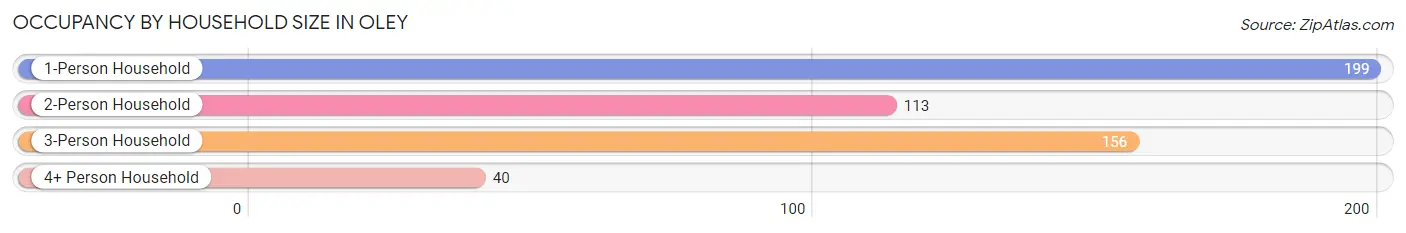
| Household Size | # Housing Units | % Housing Units |
| 1-Person Household | 199 | 39.2% |
| 2-Person Household | 113 | 22.2% |
| 3-Person Household | 156 | 30.7% |
| 4+ Person Household | 40 | 7.9% |
| Total Housing Units | 508 | 100.0% |
Occupancy by Ownership by Household Size in Oley
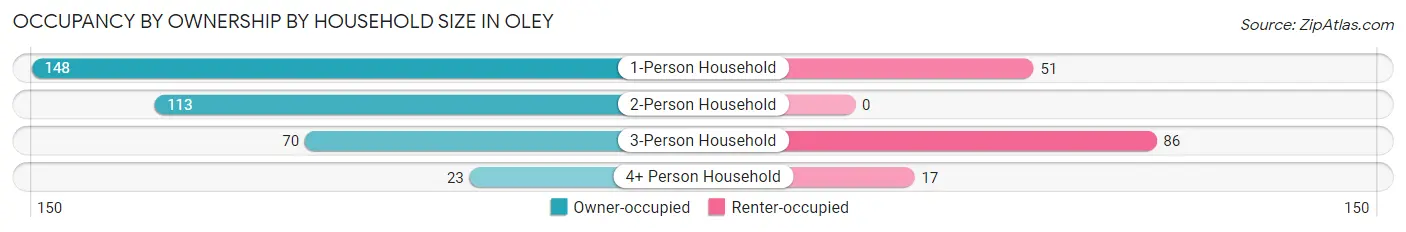
| Household Size | Owner-occupied | Renter-occupied |
| 1-Person Household | 148 (74.4%) | 51 (25.6%) |
| 2-Person Household | 113 (100.0%) | 0 (0.0%) |
| 3-Person Household | 70 (44.9%) | 86 (55.1%) |
| 4+ Person Household | 23 (57.5%) | 17 (42.5%) |
| Total Housing Units | 354 (69.7%) | 154 (30.3%) |
Occupancy by Educational Attainment in Oley
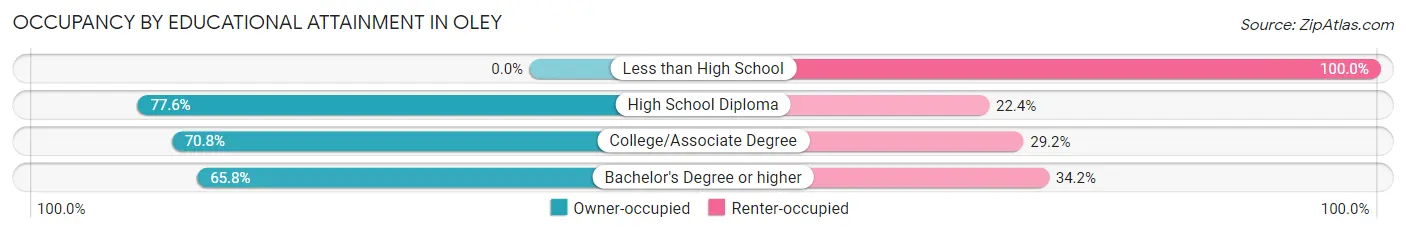
| Household Size | Owner-occupied | Renter-occupied |
| Less than High School | 0 (0.0%) | 25 (100.0%) |
| High School Diploma | 222 (77.6%) | 64 (22.4%) |
| College/Associate Degree | 34 (70.8%) | 14 (29.2%) |
| Bachelor's Degree or higher | 98 (65.8%) | 51 (34.2%) |
Occupancy by Age of Householder in Oley
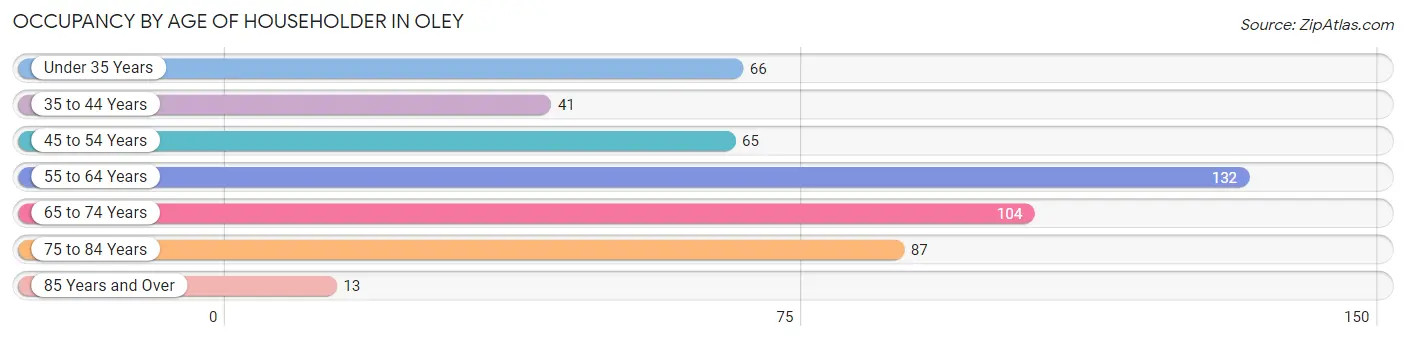
| Age Bracket | # Households | % Households |
| Under 35 Years | 66 | 13.0% |
| 35 to 44 Years | 41 | 8.1% |
| 45 to 54 Years | 65 | 12.8% |
| 55 to 64 Years | 132 | 26.0% |
| 65 to 74 Years | 104 | 20.5% |
| 75 to 84 Years | 87 | 17.1% |
| 85 Years and Over | 13 | 2.6% |
| Total | 508 | 100.0% |
Housing Finances in Oley
Median Income by Occupancy in Oley
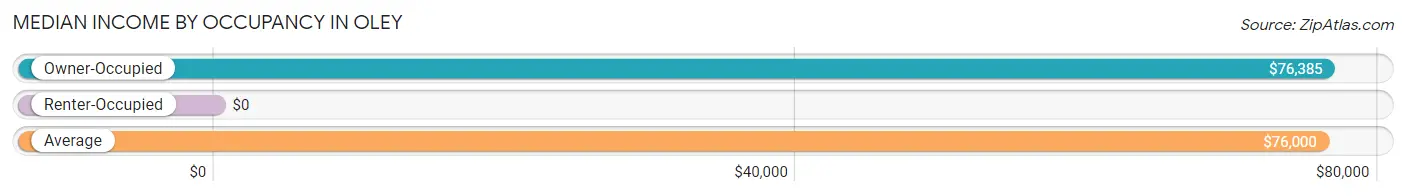
| Occupancy Type | # Households | Median Income |
| Owner-Occupied | 354 (69.7%) | $76,385 |
| Renter-Occupied | 154 (30.3%) | $0 |
| Average | 508 (100.0%) | $76,000 |
Occupancy by Householder Income Bracket in Oley
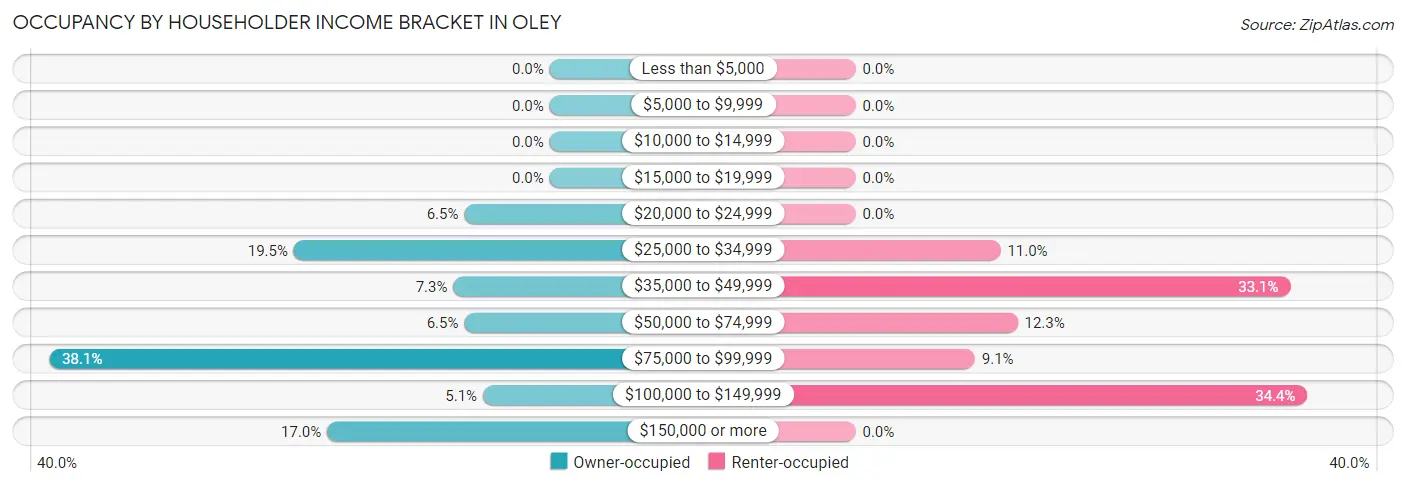
| Income Bracket | Owner-occupied | Renter-occupied |
| Less than $5,000 | 0 (0.0%) | 0 (0.0%) |
| $5,000 to $9,999 | 0 (0.0%) | 0 (0.0%) |
| $10,000 to $14,999 | 0 (0.0%) | 0 (0.0%) |
| $15,000 to $19,999 | 0 (0.0%) | 0 (0.0%) |
| $20,000 to $24,999 | 23 (6.5%) | 0 (0.0%) |
| $25,000 to $34,999 | 69 (19.5%) | 17 (11.0%) |
| $35,000 to $49,999 | 26 (7.3%) | 51 (33.1%) |
| $50,000 to $74,999 | 23 (6.5%) | 19 (12.3%) |
| $75,000 to $99,999 | 135 (38.1%) | 14 (9.1%) |
| $100,000 to $149,999 | 18 (5.1%) | 53 (34.4%) |
| $150,000 or more | 60 (17.0%) | 0 (0.0%) |
| Total | 354 (100.0%) | 154 (100.0%) |
Monthly Housing Cost Tiers in Oley
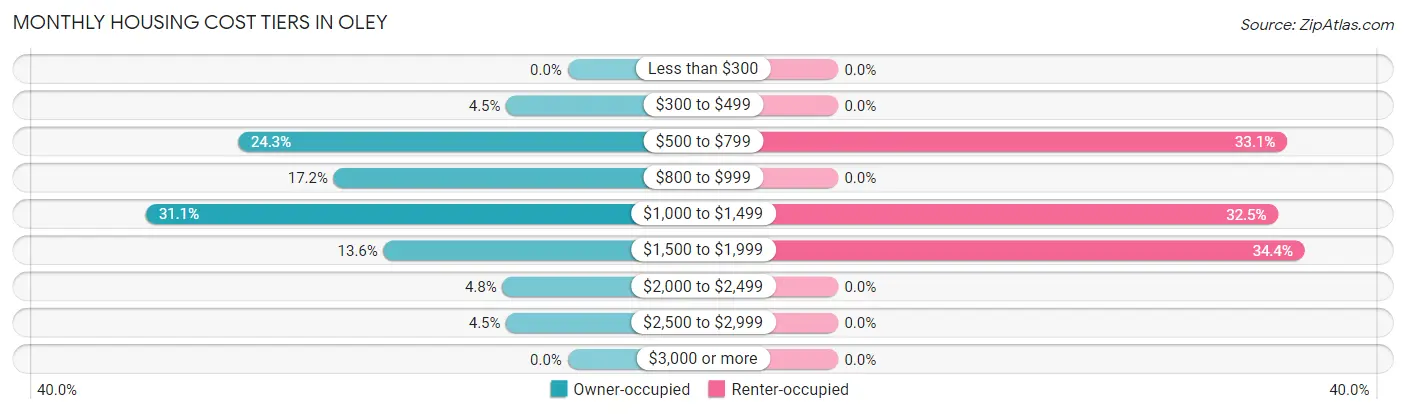
| Monthly Cost | Owner-occupied | Renter-occupied |
| Less than $300 | 0 (0.0%) | 0 (0.0%) |
| $300 to $499 | 16 (4.5%) | 0 (0.0%) |
| $500 to $799 | 86 (24.3%) | 51 (33.1%) |
| $800 to $999 | 61 (17.2%) | 0 (0.0%) |
| $1,000 to $1,499 | 110 (31.1%) | 50 (32.5%) |
| $1,500 to $1,999 | 48 (13.6%) | 53 (34.4%) |
| $2,000 to $2,499 | 17 (4.8%) | 0 (0.0%) |
| $2,500 to $2,999 | 16 (4.5%) | 0 (0.0%) |
| $3,000 or more | 0 (0.0%) | 0 (0.0%) |
| Total | 354 (100.0%) | 154 (100.0%) |
Physical Housing Characteristics in Oley
Housing Structures in Oley
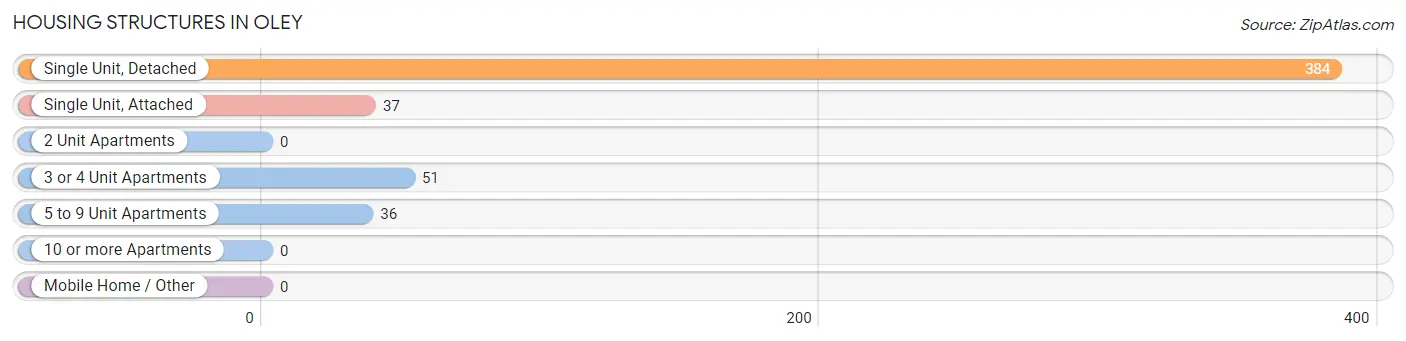
| Structure Type | # Housing Units | % Housing Units |
| Single Unit, Detached | 384 | 75.6% |
| Single Unit, Attached | 37 | 7.3% |
| 2 Unit Apartments | 0 | 0.0% |
| 3 or 4 Unit Apartments | 51 | 10.0% |
| 5 to 9 Unit Apartments | 36 | 7.1% |
| 10 or more Apartments | 0 | 0.0% |
| Mobile Home / Other | 0 | 0.0% |
| Total | 508 | 100.0% |
Housing Structures by Occupancy in Oley
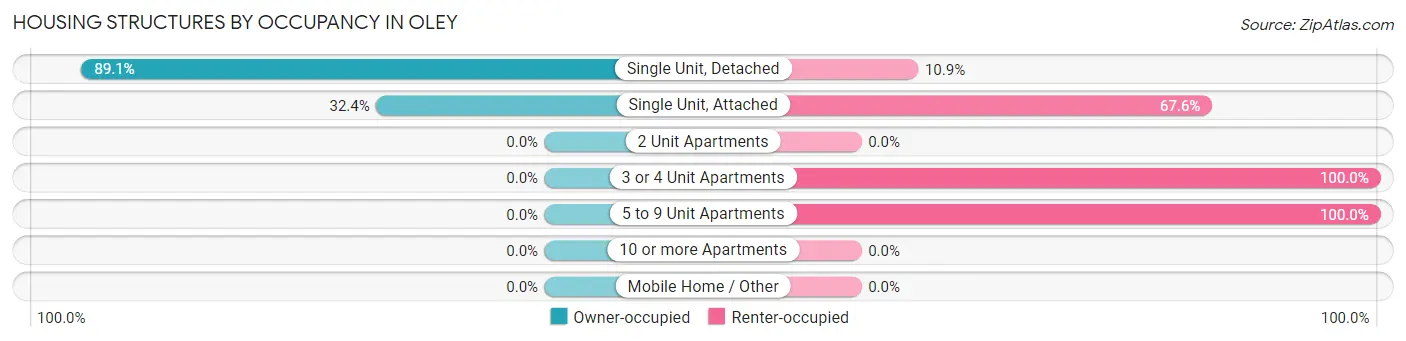
| Structure Type | Owner-occupied | Renter-occupied |
| Single Unit, Detached | 342 (89.1%) | 42 (10.9%) |
| Single Unit, Attached | 12 (32.4%) | 25 (67.6%) |
| 2 Unit Apartments | 0 (0.0%) | 0 (0.0%) |
| 3 or 4 Unit Apartments | 0 (0.0%) | 51 (100.0%) |
| 5 to 9 Unit Apartments | 0 (0.0%) | 36 (100.0%) |
| 10 or more Apartments | 0 (0.0%) | 0 (0.0%) |
| Mobile Home / Other | 0 (0.0%) | 0 (0.0%) |
| Total | 354 (69.7%) | 154 (30.3%) |
Housing Structures by Number of Rooms in Oley
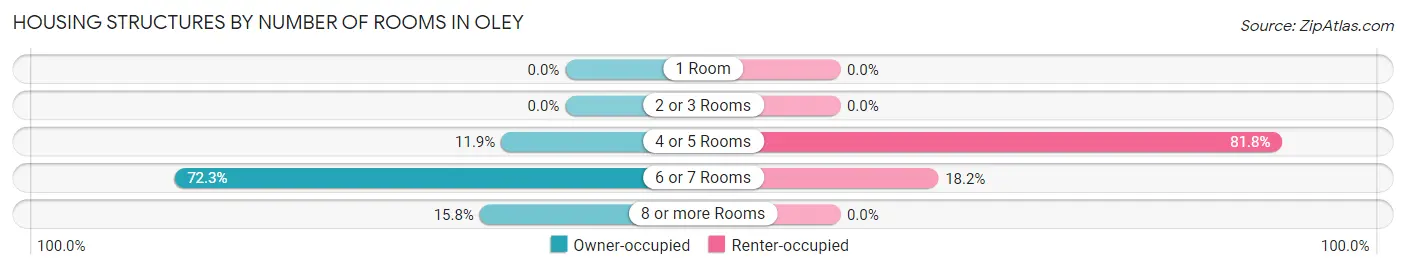
| Number of Rooms | Owner-occupied | Renter-occupied |
| 1 Room | 0 (0.0%) | 0 (0.0%) |
| 2 or 3 Rooms | 0 (0.0%) | 0 (0.0%) |
| 4 or 5 Rooms | 42 (11.9%) | 126 (81.8%) |
| 6 or 7 Rooms | 256 (72.3%) | 28 (18.2%) |
| 8 or more Rooms | 56 (15.8%) | 0 (0.0%) |
| Total | 354 (100.0%) | 154 (100.0%) |
Housing Structure by Heating Type in Oley
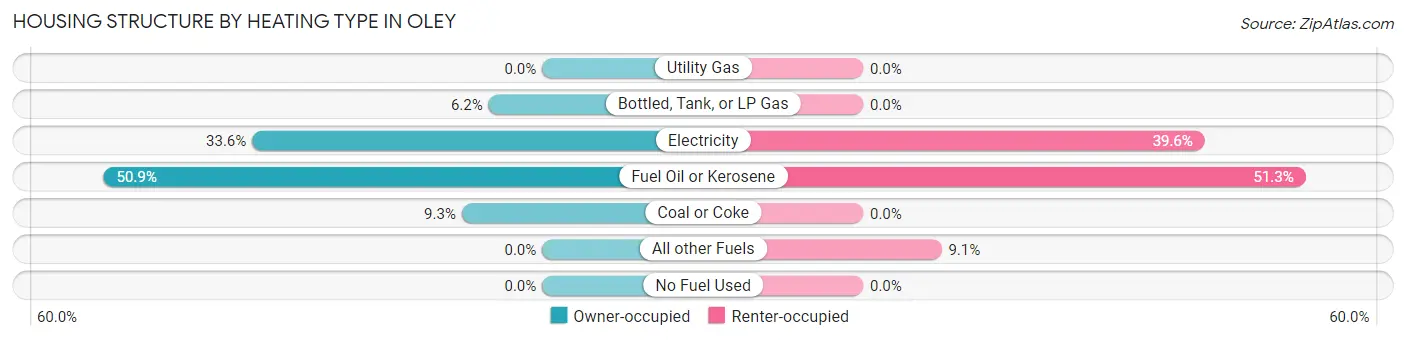
| Heating Type | Owner-occupied | Renter-occupied |
| Utility Gas | 0 (0.0%) | 0 (0.0%) |
| Bottled, Tank, or LP Gas | 22 (6.2%) | 0 (0.0%) |
| Electricity | 119 (33.6%) | 61 (39.6%) |
| Fuel Oil or Kerosene | 180 (50.8%) | 79 (51.3%) |
| Coal or Coke | 33 (9.3%) | 0 (0.0%) |
| All other Fuels | 0 (0.0%) | 14 (9.1%) |
| No Fuel Used | 0 (0.0%) | 0 (0.0%) |
| Total | 354 (100.0%) | 154 (100.0%) |
Household Vehicle Usage in Oley
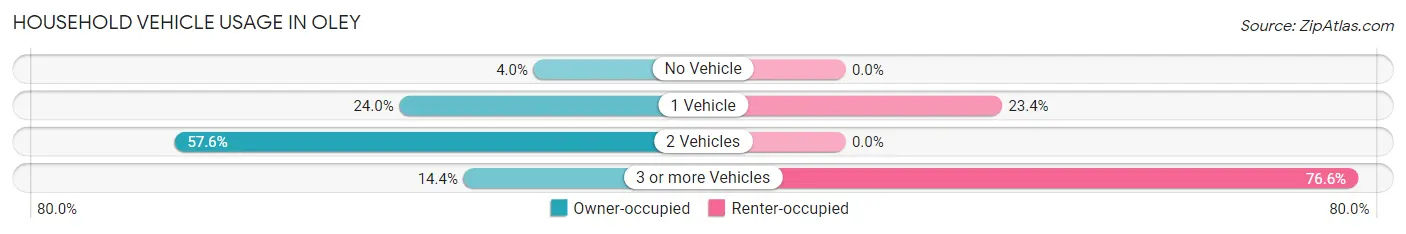
| Vehicles per Household | Owner-occupied | Renter-occupied |
| No Vehicle | 14 (4.0%) | 0 (0.0%) |
| 1 Vehicle | 85 (24.0%) | 36 (23.4%) |
| 2 Vehicles | 204 (57.6%) | 0 (0.0%) |
| 3 or more Vehicles | 51 (14.4%) | 118 (76.6%) |
| Total | 354 (100.0%) | 154 (100.0%) |
Real Estate & Mortgages in Oley
Real Estate and Mortgage Overview in Oley
| Characteristic | Without Mortgage | With Mortgage |
| Housing Units | 186 | 168 |
| Median Property Value | $201,900 | $174,000 |
| Median Household Income | $35,278 | $56 |
| Monthly Housing Costs | $755 | $0 |
| Real Estate Taxes | $3,097 | $0 |
Property Value by Mortgage Status in Oley
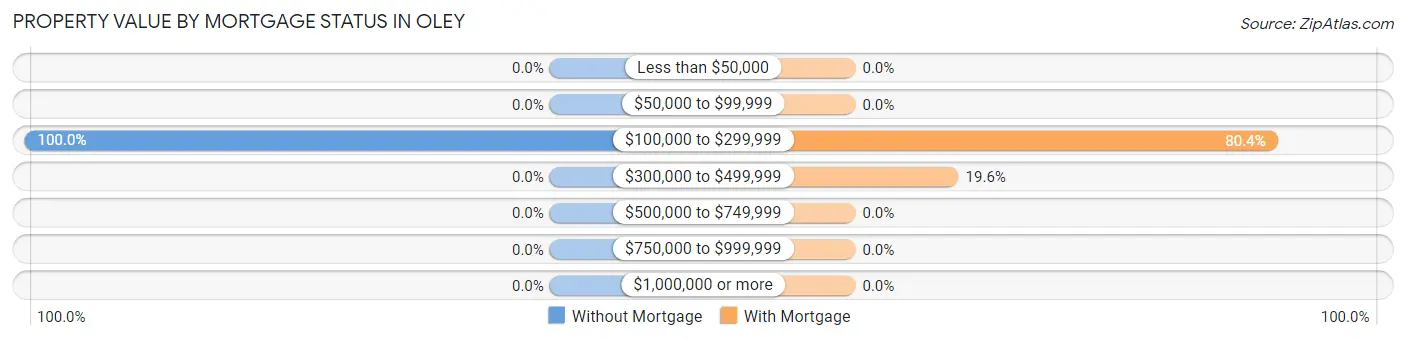
| Property Value | Without Mortgage | With Mortgage |
| Less than $50,000 | 0 (0.0%) | 0 (0.0%) |
| $50,000 to $99,999 | 0 (0.0%) | 0 (0.0%) |
| $100,000 to $299,999 | 186 (100.0%) | 135 (80.4%) |
| $300,000 to $499,999 | 0 (0.0%) | 33 (19.6%) |
| $500,000 to $749,999 | 0 (0.0%) | 0 (0.0%) |
| $750,000 to $999,999 | 0 (0.0%) | 0 (0.0%) |
| $1,000,000 or more | 0 (0.0%) | 0 (0.0%) |
| Total | 186 (100.0%) | 168 (100.0%) |
Household Income by Mortgage Status in Oley
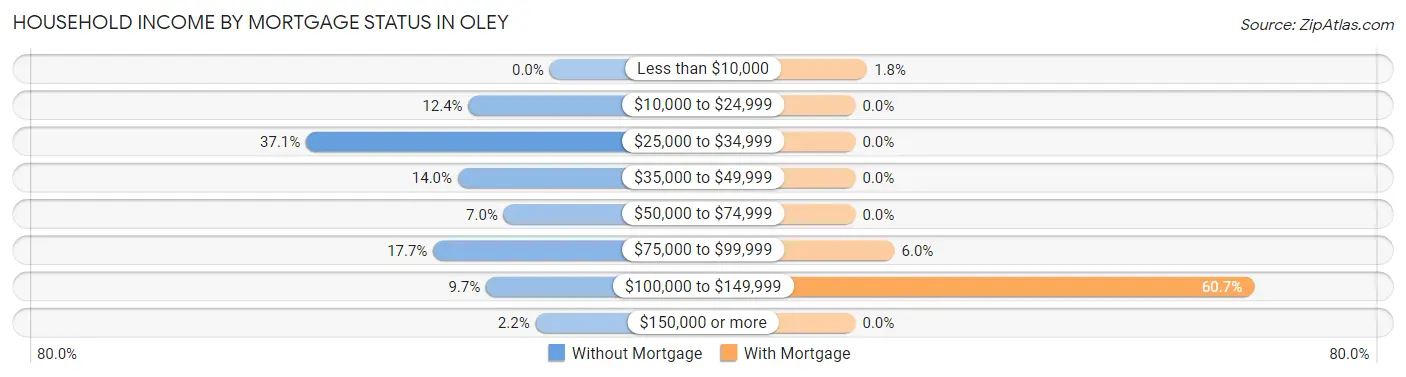
| Household Income | Without Mortgage | With Mortgage |
| Less than $10,000 | 0 (0.0%) | 3 (1.8%) |
| $10,000 to $24,999 | 23 (12.4%) | 0 (0.0%) |
| $25,000 to $34,999 | 69 (37.1%) | 0 (0.0%) |
| $35,000 to $49,999 | 26 (14.0%) | 0 (0.0%) |
| $50,000 to $74,999 | 13 (7.0%) | 0 (0.0%) |
| $75,000 to $99,999 | 33 (17.7%) | 10 (5.9%) |
| $100,000 to $149,999 | 18 (9.7%) | 102 (60.7%) |
| $150,000 or more | 4 (2.1%) | 0 (0.0%) |
| Total | 186 (100.0%) | 168 (100.0%) |
Property Value to Household Income Ratio in Oley
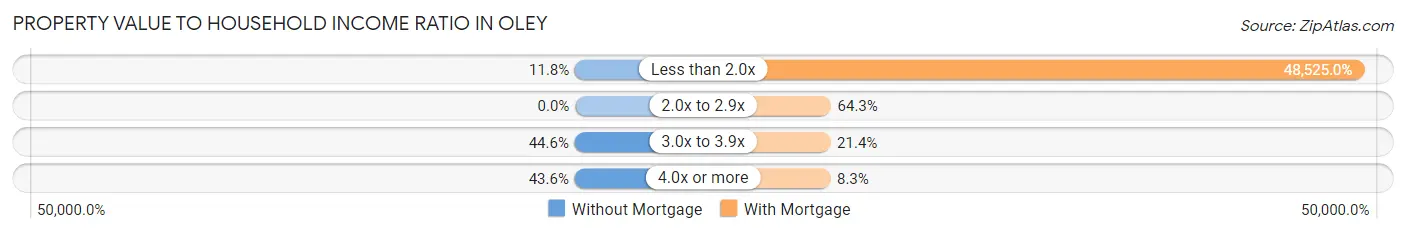
| Value-to-Income Ratio | Without Mortgage | With Mortgage |
| Less than 2.0x | 22 (11.8%) | 81,522 (48,525.0%) |
| 2.0x to 2.9x | 0 (0.0%) | 108 (64.3%) |
| 3.0x to 3.9x | 83 (44.6%) | 36 (21.4%) |
| 4.0x or more | 81 (43.5%) | 14 (8.3%) |
| Total | 186 (100.0%) | 168 (100.0%) |
Real Estate Taxes by Mortgage Status in Oley
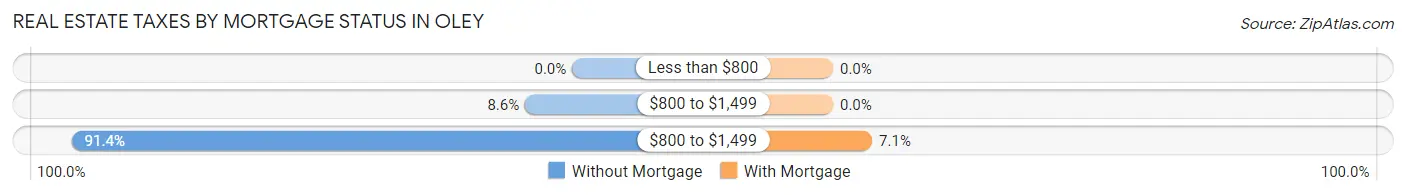
| Property Taxes | Without Mortgage | With Mortgage |
| Less than $800 | 0 (0.0%) | 0 (0.0%) |
| $800 to $1,499 | 16 (8.6%) | 0 (0.0%) |
| $800 to $1,499 | 170 (91.4%) | 12 (7.1%) |
| Total | 186 (100.0%) | 168 (100.0%) |
Health & Disability in Oley
Health Insurance Coverage by Age in Oley
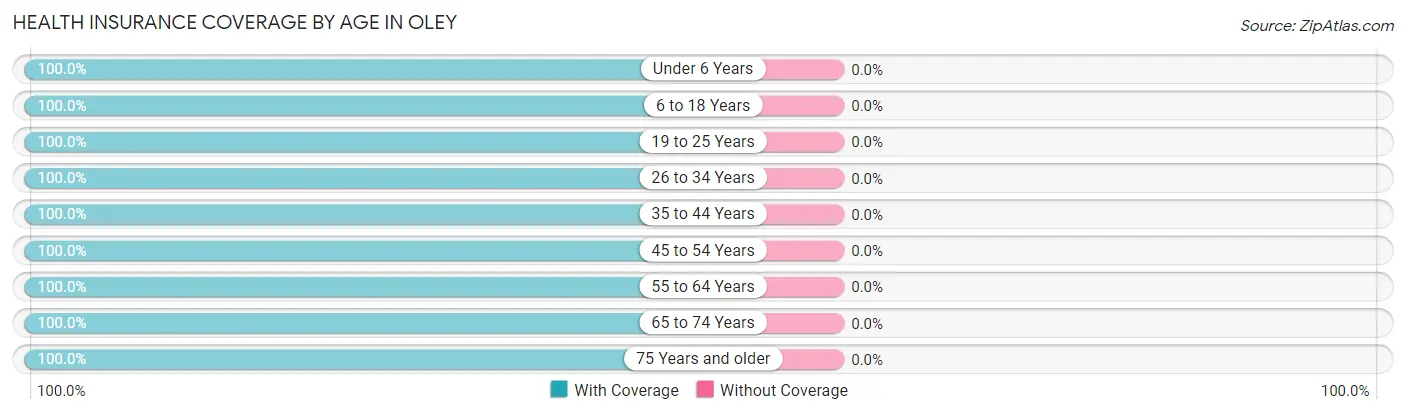
| Age Bracket | With Coverage | Without Coverage |
| Under 6 Years | 35 (100.0%) | 0 (0.0%) |
| 6 to 18 Years | 283 (100.0%) | 0 (0.0%) |
| 19 to 25 Years | 12 (100.0%) | 0 (0.0%) |
| 26 to 34 Years | 103 (100.0%) | 0 (0.0%) |
| 35 to 44 Years | 96 (100.0%) | 0 (0.0%) |
| 45 to 54 Years | 141 (100.0%) | 0 (0.0%) |
| 55 to 64 Years | 223 (100.0%) | 0 (0.0%) |
| 65 to 74 Years | 138 (100.0%) | 0 (0.0%) |
| 75 Years and older | 100 (100.0%) | 0 (0.0%) |
| Total | 1,131 (100.0%) | 0 (0.0%) |
Health Insurance Coverage by Citizenship Status in Oley
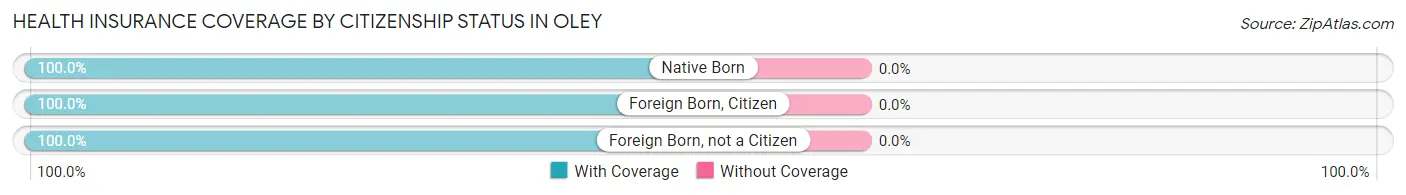
| Citizenship Status | With Coverage | Without Coverage |
| Native Born | 35 (100.0%) | 0 (0.0%) |
| Foreign Born, Citizen | 283 (100.0%) | 0 (0.0%) |
| Foreign Born, not a Citizen | 12 (100.0%) | 0 (0.0%) |
Health Insurance Coverage by Household Income in Oley
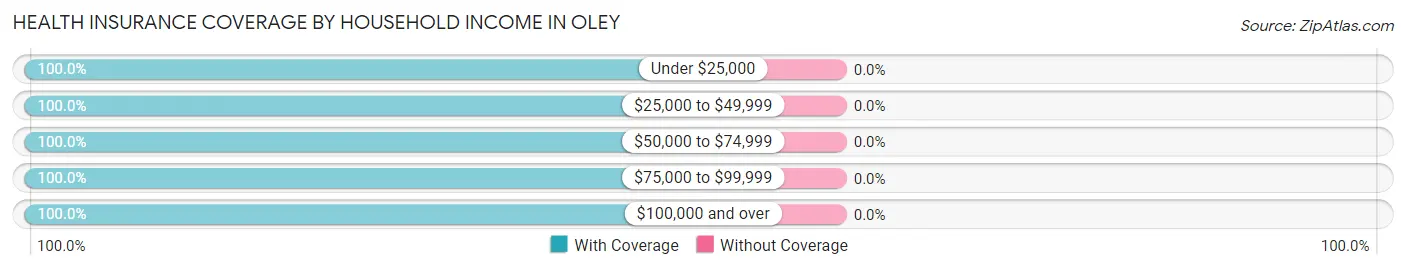
| Household Income | With Coverage | Without Coverage |
| Under $25,000 | 23 (100.0%) | 0 (0.0%) |
| $25,000 to $49,999 | 242 (100.0%) | 0 (0.0%) |
| $50,000 to $74,999 | 88 (100.0%) | 0 (0.0%) |
| $75,000 to $99,999 | 380 (100.0%) | 0 (0.0%) |
| $100,000 and over | 398 (100.0%) | 0 (0.0%) |
Public vs Private Health Insurance Coverage by Age in Oley
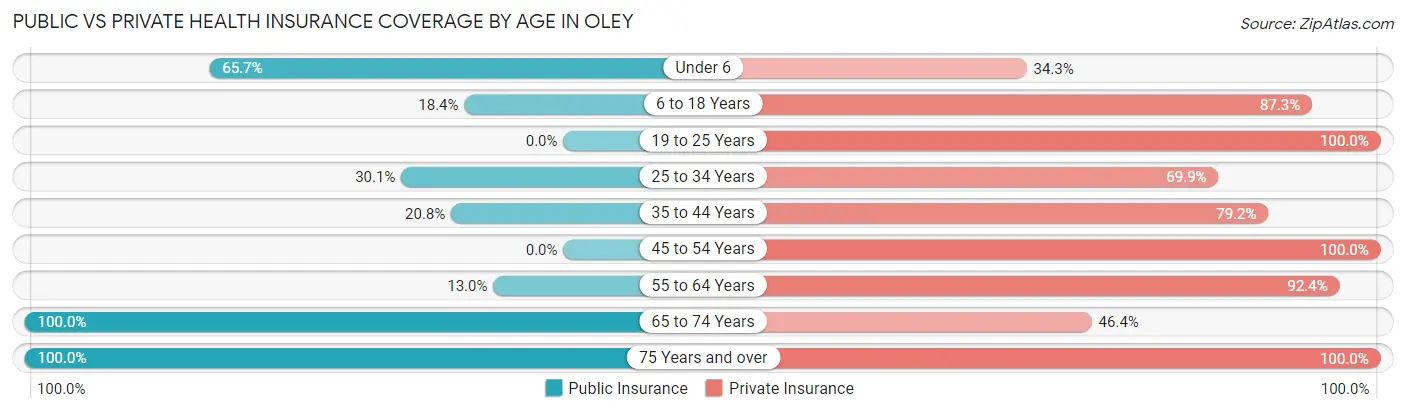
| Age Bracket | Public Insurance | Private Insurance |
| Under 6 | 23 (65.7%) | 12 (34.3%) |
| 6 to 18 Years | 52 (18.4%) | 247 (87.3%) |
| 19 to 25 Years | 0 (0.0%) | 12 (100.0%) |
| 25 to 34 Years | 31 (30.1%) | 72 (69.9%) |
| 35 to 44 Years | 20 (20.8%) | 76 (79.2%) |
| 45 to 54 Years | 0 (0.0%) | 141 (100.0%) |
| 55 to 64 Years | 29 (13.0%) | 206 (92.4%) |
| 65 to 74 Years | 138 (100.0%) | 64 (46.4%) |
| 75 Years and over | 100 (100.0%) | 100 (100.0%) |
| Total | 393 (34.7%) | 930 (82.2%) |
Disability Status by Sex by Age in Oley
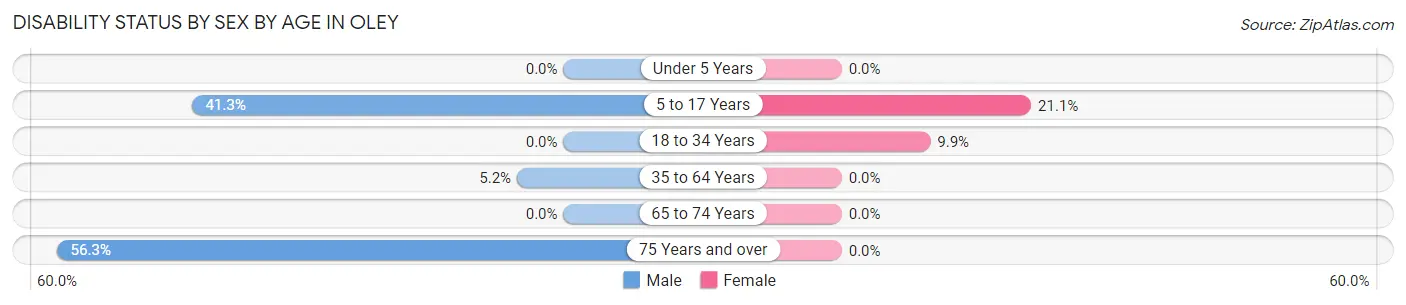
| Age Bracket | Male | Female |
| Under 5 Years | 0 (0.0%) | 0 (0.0%) |
| 5 to 17 Years | 19 (41.3%) | 31 (21.1%) |
| 18 to 34 Years | 0 (0.0%) | 14 (9.9%) |
| 35 to 64 Years | 12 (5.2%) | 0 (0.0%) |
| 65 to 74 Years | 0 (0.0%) | 0 (0.0%) |
| 75 Years and over | 49 (56.3%) | 0 (0.0%) |
Disability Class by Sex by Age in Oley
Disability Class: Hearing Difficulty
| Age Bracket | Male | Female |
| Under 5 Years | 0 (0.0%) | 0 (0.0%) |
| 5 to 17 Years | 0 (0.0%) | 0 (0.0%) |
| 18 to 34 Years | 0 (0.0%) | 0 (0.0%) |
| 35 to 64 Years | 0 (0.0%) | 0 (0.0%) |
| 65 to 74 Years | 0 (0.0%) | 0 (0.0%) |
| 75 Years and over | 0 (0.0%) | 0 (0.0%) |
Disability Class: Vision Difficulty
| Age Bracket | Male | Female |
| Under 5 Years | 0 (0.0%) | 0 (0.0%) |
| 5 to 17 Years | 0 (0.0%) | 0 (0.0%) |
| 18 to 34 Years | 0 (0.0%) | 0 (0.0%) |
| 35 to 64 Years | 0 (0.0%) | 0 (0.0%) |
| 65 to 74 Years | 0 (0.0%) | 0 (0.0%) |
| 75 Years and over | 0 (0.0%) | 0 (0.0%) |
Disability Class: Cognitive Difficulty
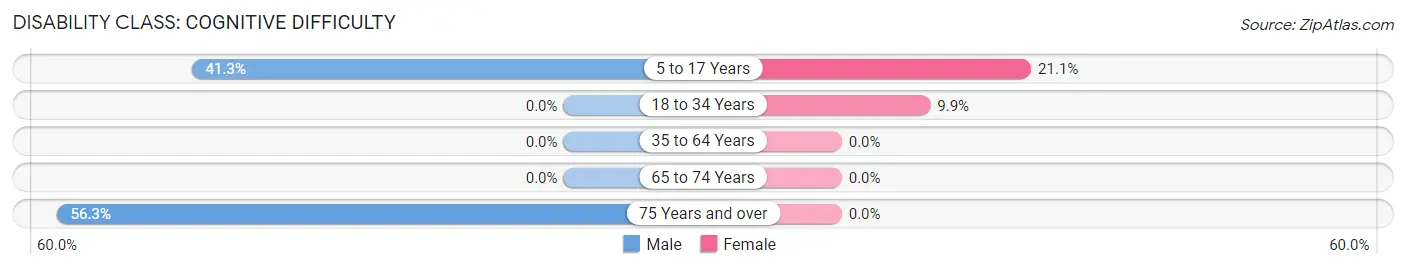
| Age Bracket | Male | Female |
| 5 to 17 Years | 19 (41.3%) | 31 (21.1%) |
| 18 to 34 Years | 0 (0.0%) | 14 (9.9%) |
| 35 to 64 Years | 0 (0.0%) | 0 (0.0%) |
| 65 to 74 Years | 0 (0.0%) | 0 (0.0%) |
| 75 Years and over | 49 (56.3%) | 0 (0.0%) |
Disability Class: Ambulatory Difficulty
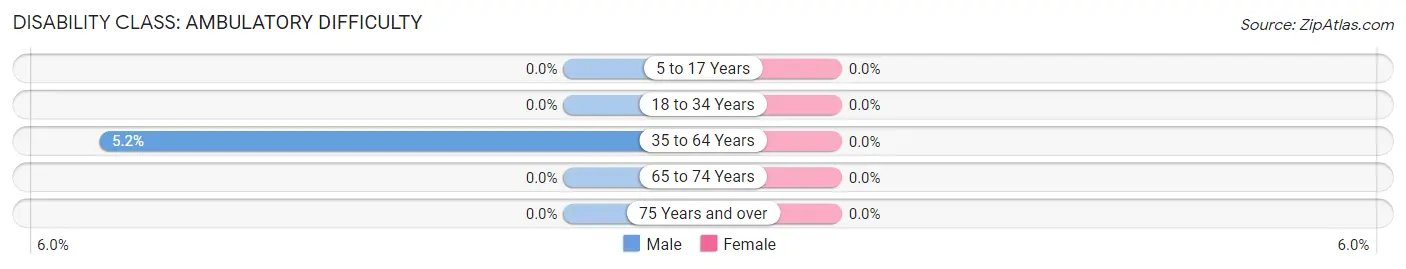
| Age Bracket | Male | Female |
| 5 to 17 Years | 0 (0.0%) | 0 (0.0%) |
| 18 to 34 Years | 0 (0.0%) | 0 (0.0%) |
| 35 to 64 Years | 12 (5.2%) | 0 (0.0%) |
| 65 to 74 Years | 0 (0.0%) | 0 (0.0%) |
| 75 Years and over | 0 (0.0%) | 0 (0.0%) |
Disability Class: Self-Care Difficulty
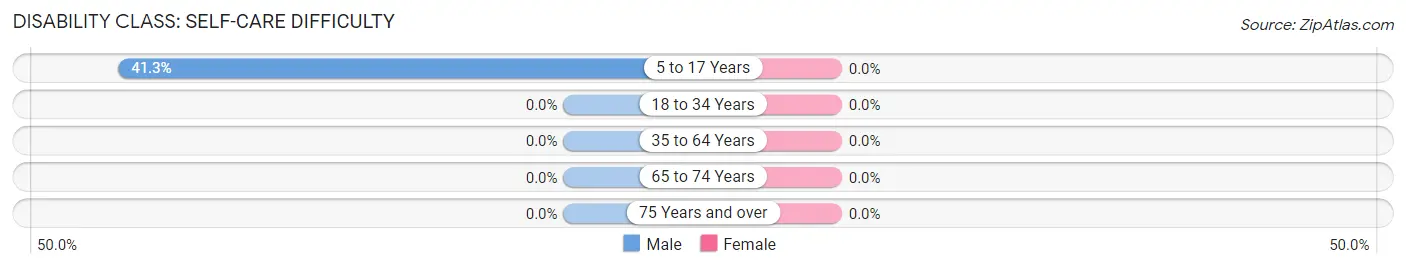
| Age Bracket | Male | Female |
| 5 to 17 Years | 19 (41.3%) | 0 (0.0%) |
| 18 to 34 Years | 0 (0.0%) | 0 (0.0%) |
| 35 to 64 Years | 0 (0.0%) | 0 (0.0%) |
| 65 to 74 Years | 0 (0.0%) | 0 (0.0%) |
| 75 Years and over | 0 (0.0%) | 0 (0.0%) |
Technology Access in Oley
Computing Device Access in Oley
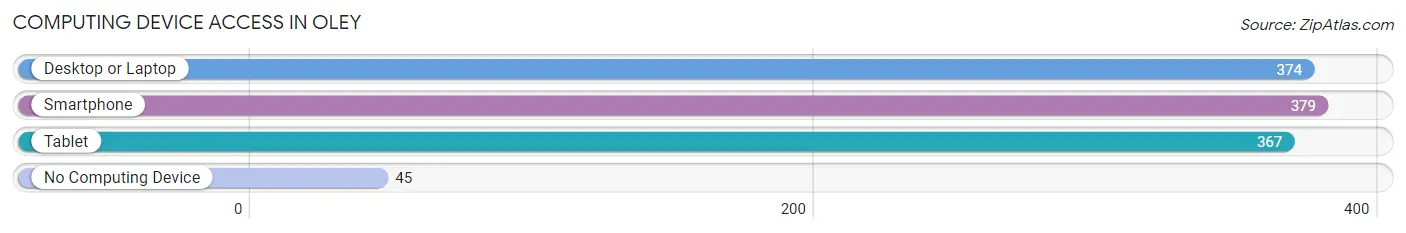
| Device Type | # Households | % Households |
| Desktop or Laptop | 374 | 73.6% |
| Smartphone | 379 | 74.6% |
| Tablet | 367 | 72.2% |
| No Computing Device | 45 | 8.9% |
| Total | 508 | 100.0% |
Internet Access in Oley
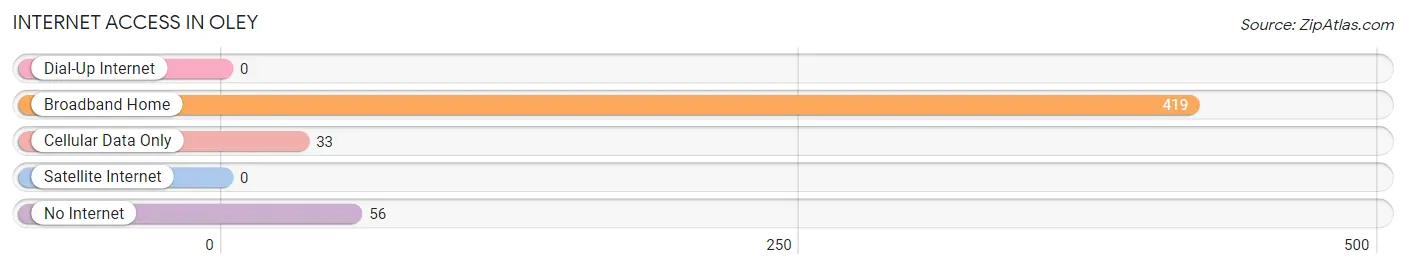
| Internet Type | # Households | % Households |
| Dial-Up Internet | 0 | 0.0% |
| Broadband Home | 419 | 82.5% |
| Cellular Data Only | 33 | 6.5% |
| Satellite Internet | 0 | 0.0% |
| No Internet | 56 | 11.0% |
| Total | 508 | 100.0% |
Oley Summary
Oley, Pennsylvania is a small borough located in Berks County, Pennsylvania. It is situated in the southeastern part of the state, approximately 40 miles northwest of Philadelphia. The population of Oley was 1,845 as of the 2010 census.
History
Oley was founded in 1740 by a group of German settlers who had migrated from the Palatinate region of Germany. The settlers named the town after the Oley Valley, which was named after the Oley Creek that ran through it. The creek was named after the Oley family, who were among the first settlers in the area.
The town was originally part of the Oley Township, which was established in 1741. The township was divided into two parts in 1819, with the northern part becoming Oley Township and the southern part becoming Richmond Township. Oley was incorporated as a borough in 1845.
Geography
Oley is located in southeastern Pennsylvania, approximately 40 miles northwest of Philadelphia. It is situated in the Oley Valley, which is part of the Great Valley region of Pennsylvania. The borough is bordered by Oley Township to the north, Richmond Township to the south, and Earl Township to the east.
The borough covers an area of 1.2 square miles, all of which is land. The terrain is mostly flat, with some rolling hills. The Oley Creek runs through the borough, and there are several small ponds and lakes in the area.
Economy
The economy of Oley is largely based on agriculture. The borough is home to several farms, which produce a variety of crops, including corn, wheat, hay, and soybeans. There are also several small businesses in the area, including a few restaurants, a hardware store, and a few retail stores.
Demographics
As of the 2010 census, the population of Oley was 1,845. The racial makeup of the borough was 97.3% White, 0.9% African American, 0.2% Native American, 0.3% Asian, 0.2% from other races, and 1.1% from two or more races. Hispanic or Latino of any race were 1.2% of the population.
The median household income in Oley was $50,938, and the median family income was $60,938. The per capita income was $25,938. About 5.3% of families and 6.7% of the population were below the poverty line, including 8.3% of those under age 18 and 4.2% of those age 65 or over.
The population of Oley is largely Christian, with the majority of residents belonging to the Lutheran Church. There is also a small Jewish community in the borough. The majority of residents speak English, although there is a small population of Spanish-speaking residents.
Common Questions
What is Per Capita Income in Oley?
Per Capita income in Oley is $36,802.
What is the Median Family Income in Oley?
Median Family Income in Oley is $81,123.
What is the Median Household income in Oley?
Median Household Income in Oley is $76,000.
What is Income or Wage Gap in Oley?
Income or Wage Gap in Oley is 31.8%.
Women in Oley earn 68.2 cents for every dollar earned by a man.
What is Inequality or Gini Index in Oley?
Inequality or Gini Index in Oley is 0.35.
What is the Total Population of Oley?
Total Population of Oley is 1,131.
What is the Total Male Population of Oley?
Total Male Population of Oley is 504.
What is the Total Female Population of Oley?
Total Female Population of Oley is 627.
What is the Ratio of Males per 100 Females in Oley?
There are 80.38 Males per 100 Females in Oley.
What is the Ratio of Females per 100 Males in Oley?
There are 124.40 Females per 100 Males in Oley.
What is the Median Population Age in Oley?
Median Population Age in Oley is 49.2 Years.
What is the Average Family Size in Oley
Average Family Size in Oley is 3.0 People.
What is the Average Household Size in Oley
Average Household Size in Oley is 2.2 People.
How Large is the Labor Force in Oley?
There are 558 People in the Labor Forcein in Oley.
What is the Percentage of People in the Labor Force in Oley?
58.1% of People are in the Labor Force in Oley.