New Jerusalem, PA Map & Demographics
New Jerusalem Map
New Jerusalem Overview
$54,838
PER CAPITA INCOME
$104,500
AVG FAMILY INCOME
$94,948
AVG HOUSEHOLD INCOME
15.6%
WAGE / INCOME GAP [ % ]
84.4¢/ $1
WAGE / INCOME GAP [ $ ]
0.35
INEQUALITY / GINI INDEX
630
TOTAL POPULATION
318
MALE POPULATION
312
FEMALE POPULATION
101.92
MALES / 100 FEMALES
98.11
FEMALES / 100 MALES
60.4
MEDIAN AGE
2.5
AVG FAMILY SIZE
2.2
AVG HOUSEHOLD SIZE
373
LABOR FORCE [ PEOPLE ]
64.0%
PERCENT IN LABOR FORCE
Income in New Jerusalem
Income Overview in New Jerusalem
Per Capita Income in New Jerusalem is $54,838, while median incomes of families and households are $104,500 and $94,948 respectively.
| Characteristic | Number | Measure |
| Per Capita Income | 630 | $54,838 |
| Median Family Income | 234 | $104,500 |
| Mean Family Income | 234 | $128,590 |
| Median Household Income | 291 | $94,948 |
| Mean Household Income | 291 | $115,541 |
| Income Deficit | 234 | $0 |
| Wage / Income Gap (%) | 630 | 15.63% |
| Wage / Income Gap ($) | 630 | 84.37¢ per $1 |
| Gini / Inequality Index | 630 | 0.35 |
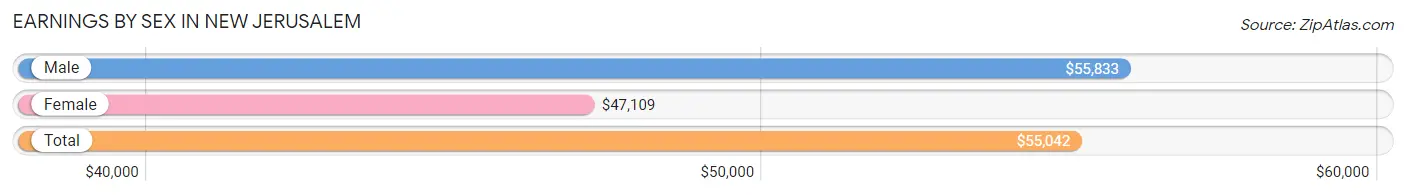
Earnings by Sex in New Jerusalem
Average Earnings in New Jerusalem are $55,042, $55,833 for men and $47,109 for women, a difference of 15.6%.
| Sex | Number | Average Earnings |
| Male | 204 (54.7%) | $55,833 |
| Female | 169 (45.3%) | $47,109 |
| Total | 373 (100.0%) | $55,042 |
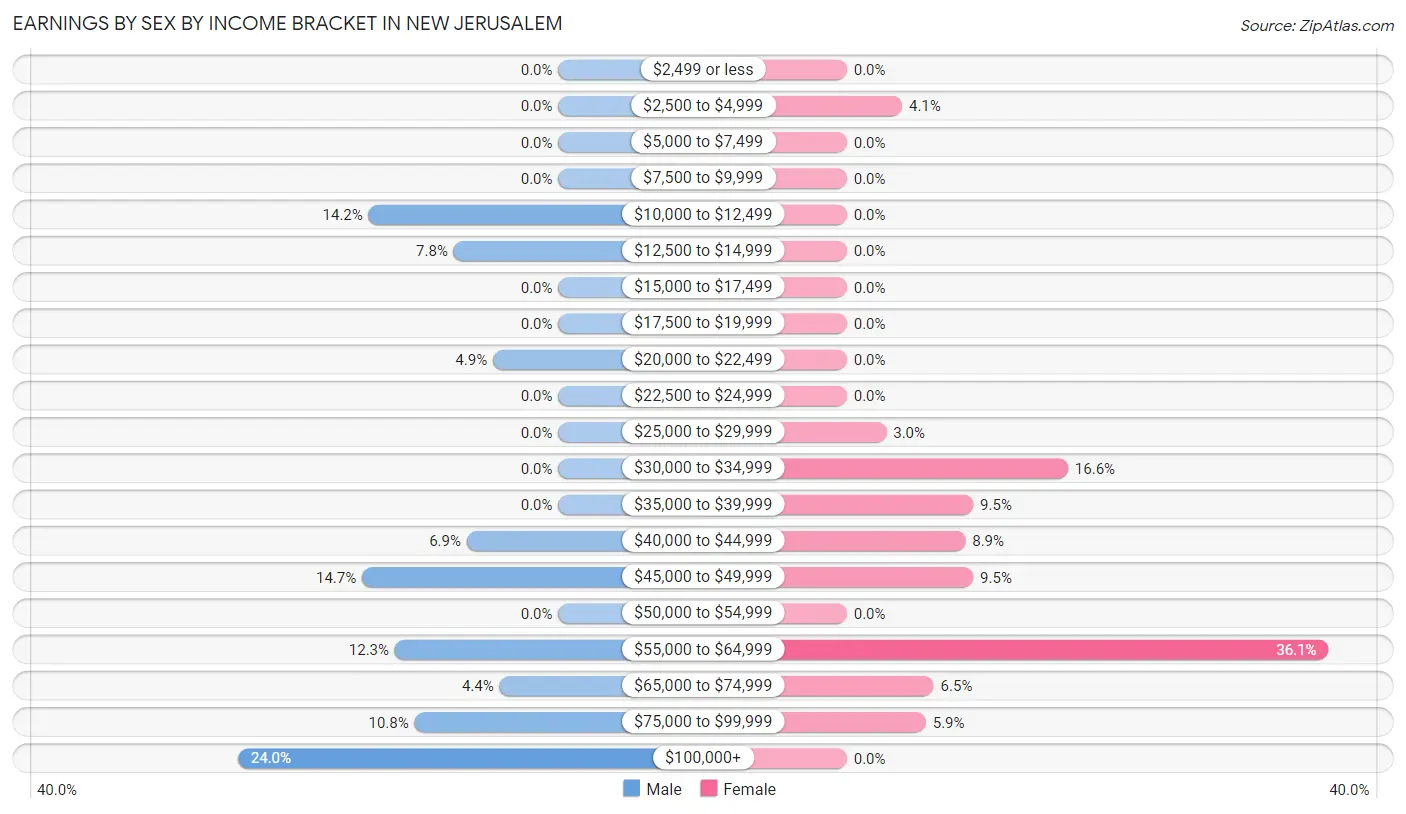
Earnings by Sex by Income Bracket in New Jerusalem
The most common earnings brackets in New Jerusalem are $100,000+ for men (49 | 24.0%) and $55,000 to $64,999 for women (61 | 36.1%).
| Income | Male | Female |
| $2,499 or less | 0 (0.0%) | 0 (0.0%) |
| $2,500 to $4,999 | 0 (0.0%) | 7 (4.1%) |
| $5,000 to $7,499 | 0 (0.0%) | 0 (0.0%) |
| $7,500 to $9,999 | 0 (0.0%) | 0 (0.0%) |
| $10,000 to $12,499 | 29 (14.2%) | 0 (0.0%) |
| $12,500 to $14,999 | 16 (7.8%) | 0 (0.0%) |
| $15,000 to $17,499 | 0 (0.0%) | 0 (0.0%) |
| $17,500 to $19,999 | 0 (0.0%) | 0 (0.0%) |
| $20,000 to $22,499 | 10 (4.9%) | 0 (0.0%) |
| $22,500 to $24,999 | 0 (0.0%) | 0 (0.0%) |
| $25,000 to $29,999 | 0 (0.0%) | 5 (3.0%) |
| $30,000 to $34,999 | 0 (0.0%) | 28 (16.6%) |
| $35,000 to $39,999 | 0 (0.0%) | 16 (9.5%) |
| $40,000 to $44,999 | 14 (6.9%) | 15 (8.9%) |
| $45,000 to $49,999 | 30 (14.7%) | 16 (9.5%) |
| $50,000 to $54,999 | 0 (0.0%) | 0 (0.0%) |
| $55,000 to $64,999 | 25 (12.2%) | 61 (36.1%) |
| $65,000 to $74,999 | 9 (4.4%) | 11 (6.5%) |
| $75,000 to $99,999 | 22 (10.8%) | 10 (5.9%) |
| $100,000+ | 49 (24.0%) | 0 (0.0%) |
| Total | 204 (100.0%) | 169 (100.0%) |
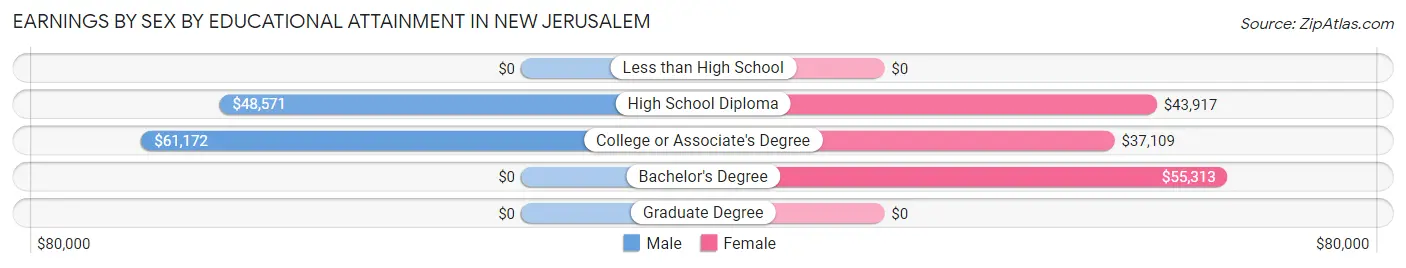
Earnings by Sex by Educational Attainment in New Jerusalem
Average earnings in New Jerusalem are $62,109 for men and $47,109 for women, a difference of 24.1%. Men with an educational attainment of college or associate's degree enjoy the highest average annual earnings of $61,172, while those with high school diploma education earn the least with $48,571. Women with an educational attainment of bachelor's degree earn the most with the average annual earnings of $55,313, while those with college or associate's degree education have the smallest earnings of $37,109.
| Educational Attainment | Male Income | Female Income |
| Less than High School | - | - |
| High School Diploma | $48,571 | $43,917 |
| College or Associate's Degree | $61,172 | $37,109 |
| Bachelor's Degree | - | - |
| Graduate Degree | - | - |
| Total | $62,109 | $47,109 |
Family Income in New Jerusalem
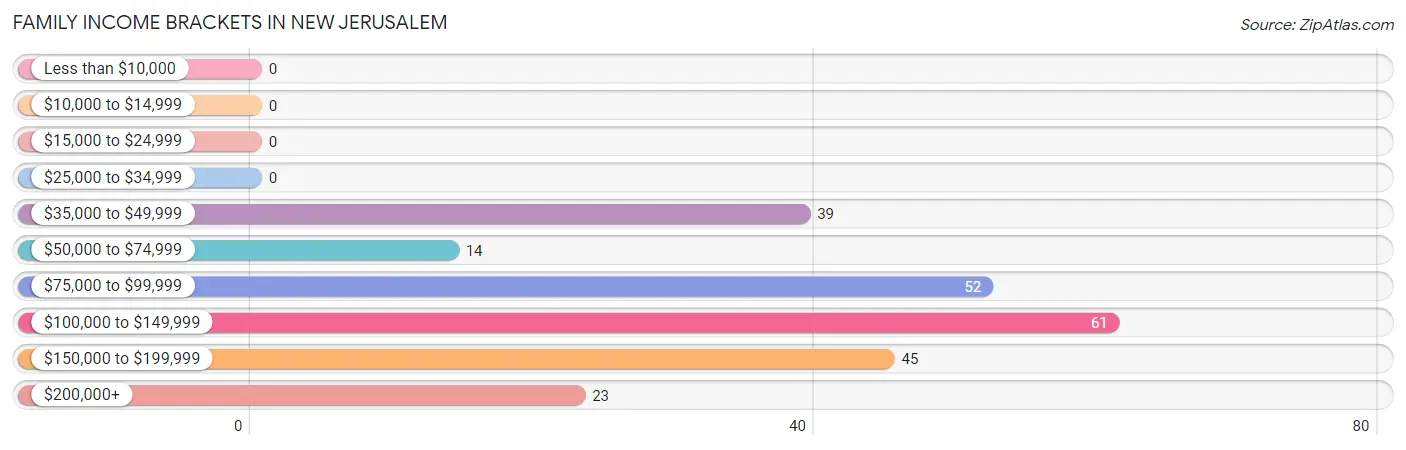
Family Income Brackets in New Jerusalem
According to the New Jerusalem family income data, there are 61 families falling into the $100,000 to $149,999 income range, which is the most common income bracket and makes up 26.1% of all families.
| Income Bracket | # Families | % Families |
| Less than $10,000 | 0 | 0.0% |
| $10,000 to $14,999 | 0 | 0.0% |
| $15,000 to $24,999 | 0 | 0.0% |
| $25,000 to $34,999 | 0 | 0.0% |
| $35,000 to $49,999 | 39 | 16.7% |
| $50,000 to $74,999 | 14 | 6.0% |
| $75,000 to $99,999 | 52 | 22.2% |
| $100,000 to $149,999 | 61 | 26.1% |
| $150,000 to $199,999 | 45 | 19.2% |
| $200,000+ | 23 | 9.8% |
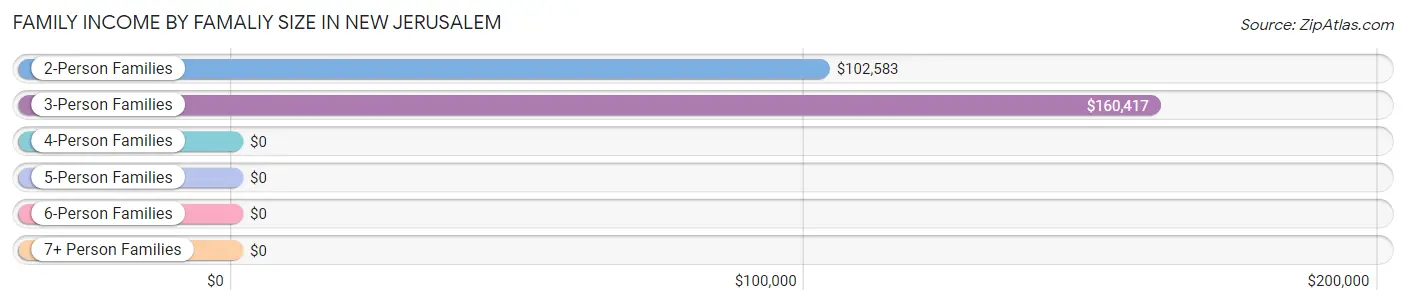
Family Income by Famaliy Size in New Jerusalem
3-person families (53 | 22.7%) account for the highest median family income in New Jerusalem with $160,417 per family, while 3-person families (53 | 22.7%) have the highest median income of $53,472 per family member.
| Income Bracket | # Families | Median Income |
| 2-Person Families | 163 (69.7%) | $102,583 |
| 3-Person Families | 53 (22.7%) | $160,417 |
| 4-Person Families | 18 (7.7%) | $0 |
| 5-Person Families | 0 (0.0%) | $0 |
| 6-Person Families | 0 (0.0%) | $0 |
| 7+ Person Families | 0 (0.0%) | $0 |
| Total | 234 (100.0%) | $104,500 |
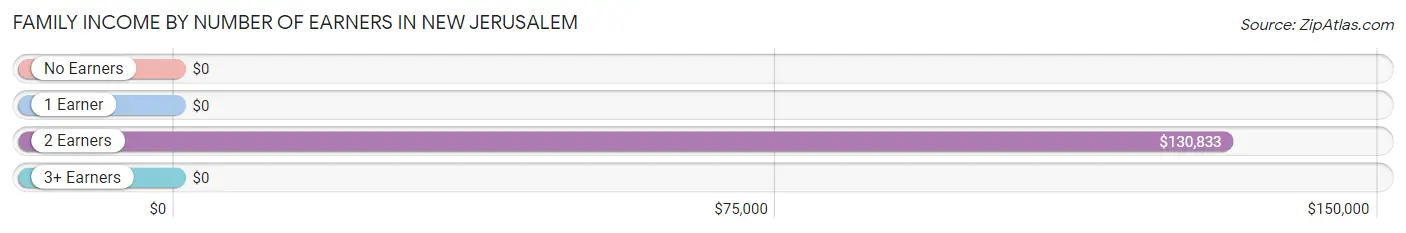
Family Income by Number of Earners in New Jerusalem
| Number of Earners | # Families | Median Income |
| No Earners | 40 (17.1%) | $0 |
| 1 Earner | 67 (28.6%) | $0 |
| 2 Earners | 118 (50.4%) | $130,833 |
| 3+ Earners | 9 (3.8%) | $0 |
| Total | 234 (100.0%) | $104,500 |
Household Income in New Jerusalem
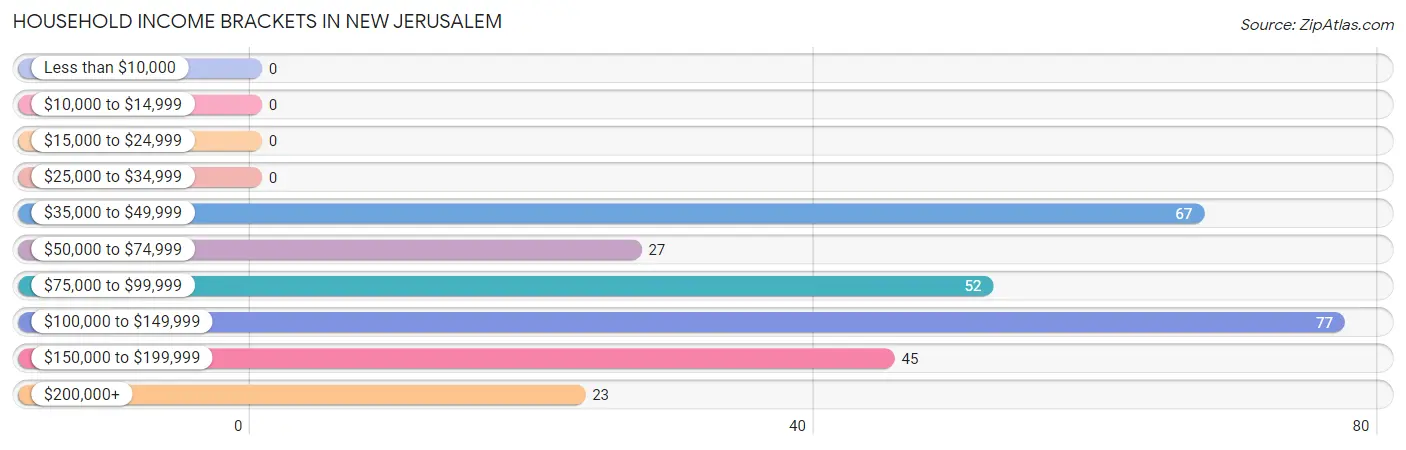
Household Income Brackets in New Jerusalem
With 77 households falling in the category, the $100,000 to $149,999 income range is the most frequent in New Jerusalem, accounting for 26.5% of all households.
| Income Bracket | # Households | % Households |
| Less than $10,000 | 0 | 0.0% |
| $10,000 to $14,999 | 0 | 0.0% |
| $15,000 to $24,999 | 0 | 0.0% |
| $25,000 to $34,999 | 0 | 0.0% |
| $35,000 to $49,999 | 67 | 23.0% |
| $50,000 to $74,999 | 27 | 9.3% |
| $75,000 to $99,999 | 52 | 17.9% |
| $100,000 to $149,999 | 77 | 26.5% |
| $150,000 to $199,999 | 45 | 15.5% |
| $200,000+ | 23 | 7.9% |
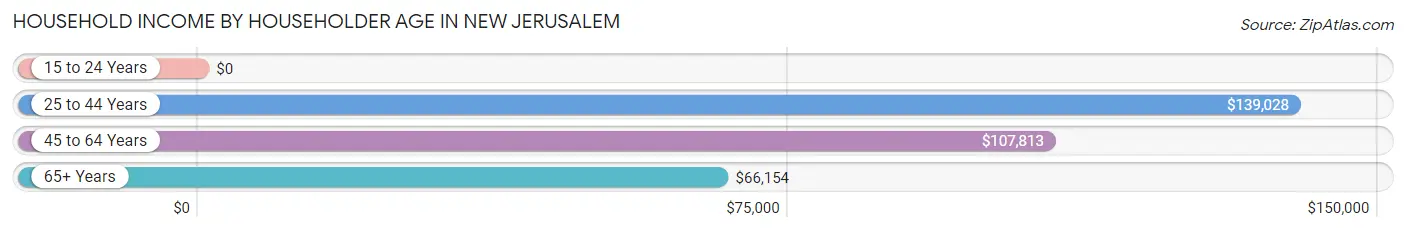
Household Income by Householder Age in New Jerusalem
The median household income in New Jerusalem is $94,948, with the highest median household income of $139,028 found in the 25 to 44 years age bracket for the primary householder. A total of 35 households (12.0%) fall into this category.
| Income Bracket | # Households | Median Income |
| 15 to 24 Years | 0 (0.0%) | $0 |
| 25 to 44 Years | 35 (12.0%) | $139,028 |
| 45 to 64 Years | 136 (46.7%) | $107,813 |
| 65+ Years | 120 (41.2%) | $66,154 |
| Total | 291 (100.0%) | $94,948 |
Poverty in New Jerusalem
Income Below Poverty by Sex and Age in New Jerusalem
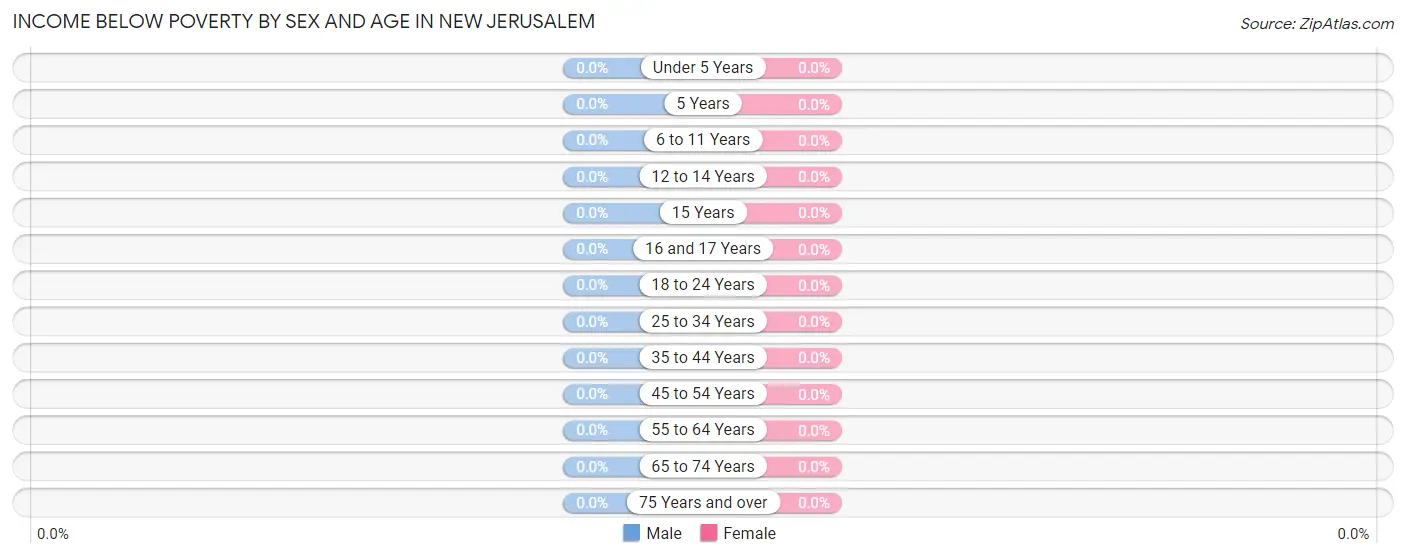
| Age Bracket | Male | Female |
| Under 5 Years | 0 (0.0%) | 0 (0.0%) |
| 5 Years | 0 (0.0%) | 0 (0.0%) |
| 6 to 11 Years | 0 (0.0%) | 0 (0.0%) |
| 12 to 14 Years | 0 (0.0%) | 0 (0.0%) |
| 15 Years | 0 (0.0%) | 0 (0.0%) |
| 16 and 17 Years | 0 (0.0%) | 0 (0.0%) |
| 18 to 24 Years | 0 (0.0%) | 0 (0.0%) |
| 25 to 34 Years | 0 (0.0%) | 0 (0.0%) |
| 35 to 44 Years | 0 (0.0%) | 0 (0.0%) |
| 45 to 54 Years | 0 (0.0%) | 0 (0.0%) |
| 55 to 64 Years | 0 (0.0%) | 0 (0.0%) |
| 65 to 74 Years | 0 (0.0%) | 0 (0.0%) |
| 75 Years and over | 0 (0.0%) | 0 (0.0%) |
| Total | 0 (0.0%) | 0 (0.0%) |
Income Above Poverty by Sex and Age in New Jerusalem
According to the poverty statistics in New Jerusalem, males aged 6 to 11 years and females aged under 5 years are the age groups that are most secure financially, with 100.0% of males and 100.0% of females in these age groups living above the poverty line.
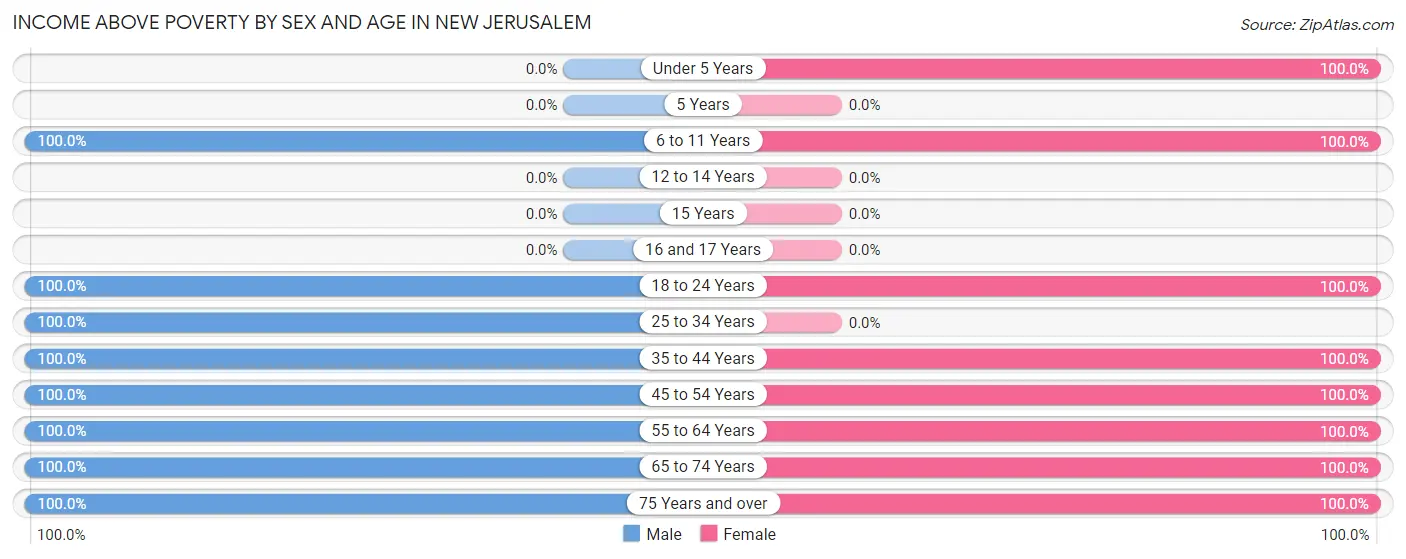
| Age Bracket | Male | Female |
| Under 5 Years | 0 (0.0%) | 15 (100.0%) |
| 5 Years | 0 (0.0%) | 0 (0.0%) |
| 6 to 11 Years | 23 (100.0%) | 9 (100.0%) |
| 12 to 14 Years | 0 (0.0%) | 0 (0.0%) |
| 15 Years | 0 (0.0%) | 0 (0.0%) |
| 16 and 17 Years | 0 (0.0%) | 0 (0.0%) |
| 18 to 24 Years | 39 (100.0%) | 9 (100.0%) |
| 25 to 34 Years | 16 (100.0%) | 0 (0.0%) |
| 35 to 44 Years | 36 (100.0%) | 37 (100.0%) |
| 45 to 54 Years | 32 (100.0%) | 55 (100.0%) |
| 55 to 64 Years | 58 (100.0%) | 81 (100.0%) |
| 65 to 74 Years | 56 (100.0%) | 52 (100.0%) |
| 75 Years and over | 58 (100.0%) | 54 (100.0%) |
| Total | 318 (100.0%) | 312 (100.0%) |
Income Below Poverty Among Married-Couple Families in New Jerusalem
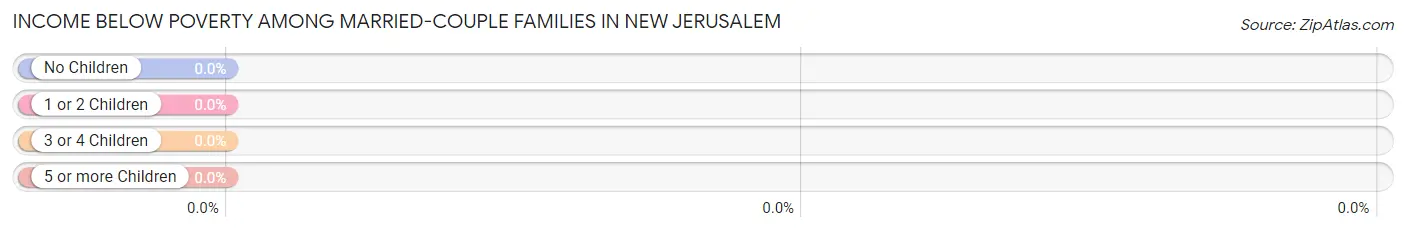
| Children | Above Poverty | Below Poverty |
| No Children | 160 (100.0%) | 0 (0.0%) |
| 1 or 2 Children | 38 (100.0%) | 0 (0.0%) |
| 3 or 4 Children | 0 (0.0%) | 0 (0.0%) |
| 5 or more Children | 0 (0.0%) | 0 (0.0%) |
| Total | 198 (100.0%) | 0 (0.0%) |
Income Below Poverty Among Single-Parent Households in New Jerusalem
| Children | Single Father | Single Mother |
| No Children | 0 (0.0%) | 0 (0.0%) |
| 1 or 2 Children | 0 (0.0%) | 0 (0.0%) |
| 3 or 4 Children | 0 (0.0%) | 0 (0.0%) |
| 5 or more Children | 0 (0.0%) | 0 (0.0%) |
| Total | 0 (0.0%) | 0 (0.0%) |
Income Below Poverty Among Married-Couple vs Single-Parent Households in New Jerusalem
| Children | Married-Couple Families | Single-Parent Households |
| No Children | 0 (0.0%) | 0 (0.0%) |
| 1 or 2 Children | 0 (0.0%) | 0 (0.0%) |
| 3 or 4 Children | 0 (0.0%) | 0 (0.0%) |
| 5 or more Children | 0 (0.0%) | 0 (0.0%) |
| Total | 0 (0.0%) | 0 (0.0%) |
Race in New Jerusalem
The most populous races in New Jerusalem are White / Caucasian (623 | 98.9%), Hispanic or Latino (7 | 1.1%), and Two or more Races (7 | 1.1%).
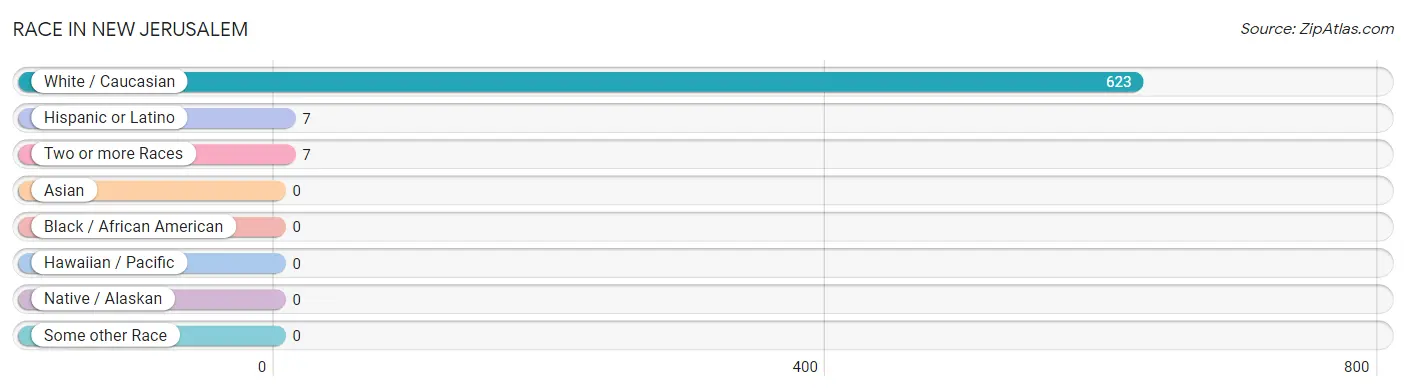
| Race | # Population | % Population |
| Asian | 0 | 0.0% |
| Black / African American | 0 | 0.0% |
| Hawaiian / Pacific | 0 | 0.0% |
| Hispanic or Latino | 7 | 1.1% |
| Native / Alaskan | 0 | 0.0% |
| White / Caucasian | 623 | 98.9% |
| Two or more Races | 7 | 1.1% |
| Some other Race | 0 | 0.0% |
| Total | 630 | 100.0% |
Ancestry in New Jerusalem
The most populous ancestries reported in New Jerusalem are German (230 | 36.5%), Irish (96 | 15.2%), English (78 | 12.4%), Pennsylvania German (70 | 11.1%), and French (29 | 4.6%), together accounting for 79.8% of all New Jerusalem residents.
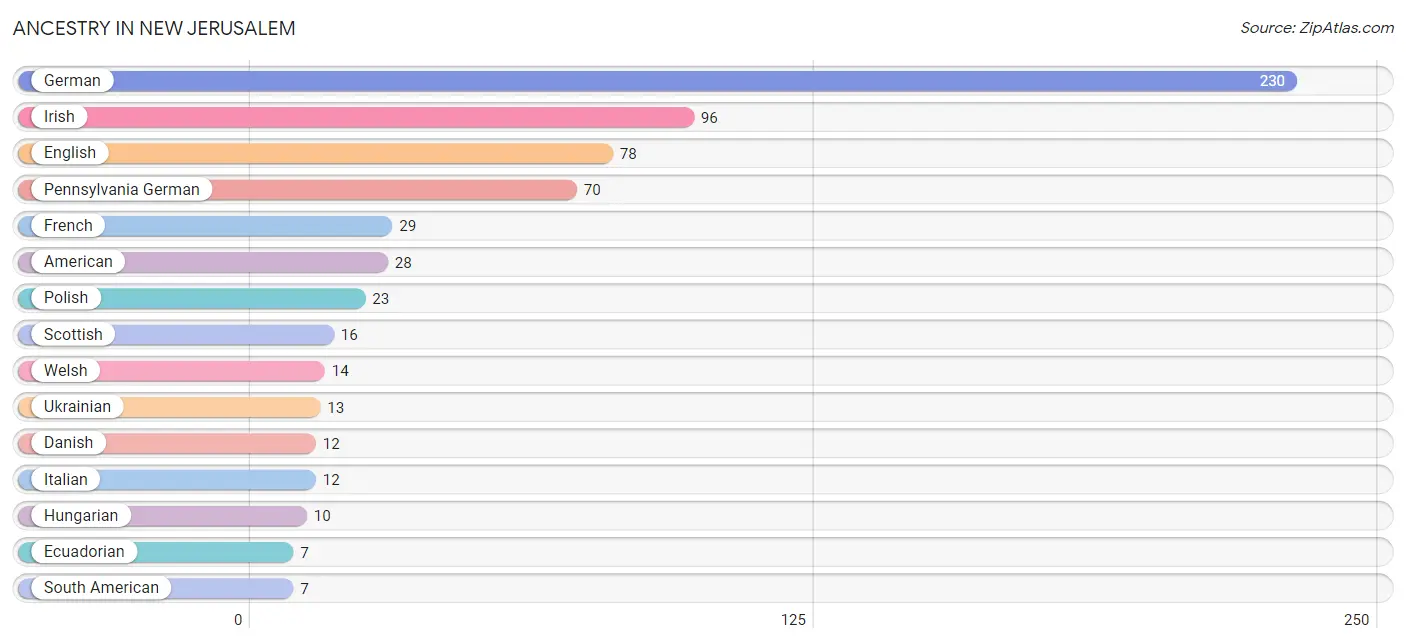
| Ancestry | # Population | % Population |
| American | 28 | 4.4% |
| Danish | 12 | 1.9% |
| Ecuadorian | 7 | 1.1% |
| English | 78 | 12.4% |
| French | 29 | 4.6% |
| German | 230 | 36.5% |
| Hungarian | 10 | 1.6% |
| Irish | 96 | 15.2% |
| Italian | 12 | 1.9% |
| Pennsylvania German | 70 | 11.1% |
| Polish | 23 | 3.6% |
| Scottish | 16 | 2.5% |
| South American | 7 | 1.1% |
| Ukrainian | 13 | 2.1% |
| Welsh | 14 | 2.2% | View All 15 Rows |
Immigrants in New Jerusalem
The most numerous immigrant groups reported in New Jerusalem came from Ecuador (7 | 1.1%), Latin America (7 | 1.1%), and South America (7 | 1.1%), together accounting for 3.3% of all New Jerusalem residents.
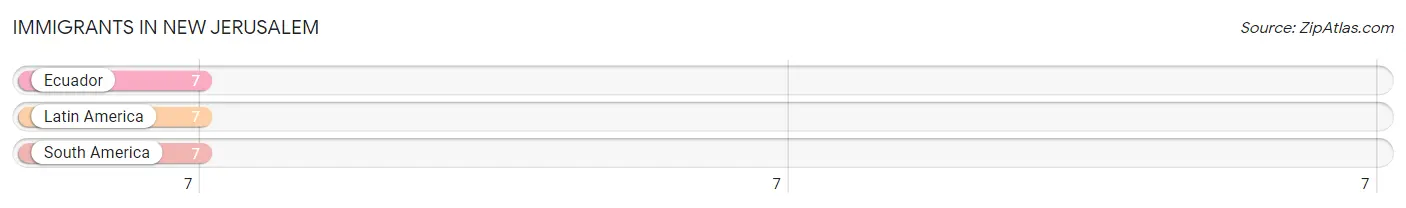
| Immigration Origin | # Population | % Population |
| Ecuador | 7 | 1.1% |
| Latin America | 7 | 1.1% |
| South America | 7 | 1.1% | View All 3 Rows |
Sex and Age in New Jerusalem
Sex and Age in New Jerusalem
The most populous age groups in New Jerusalem are 65 to 69 Years (56 | 17.6%) for men and 60 to 64 Years (58 | 18.6%) for women.
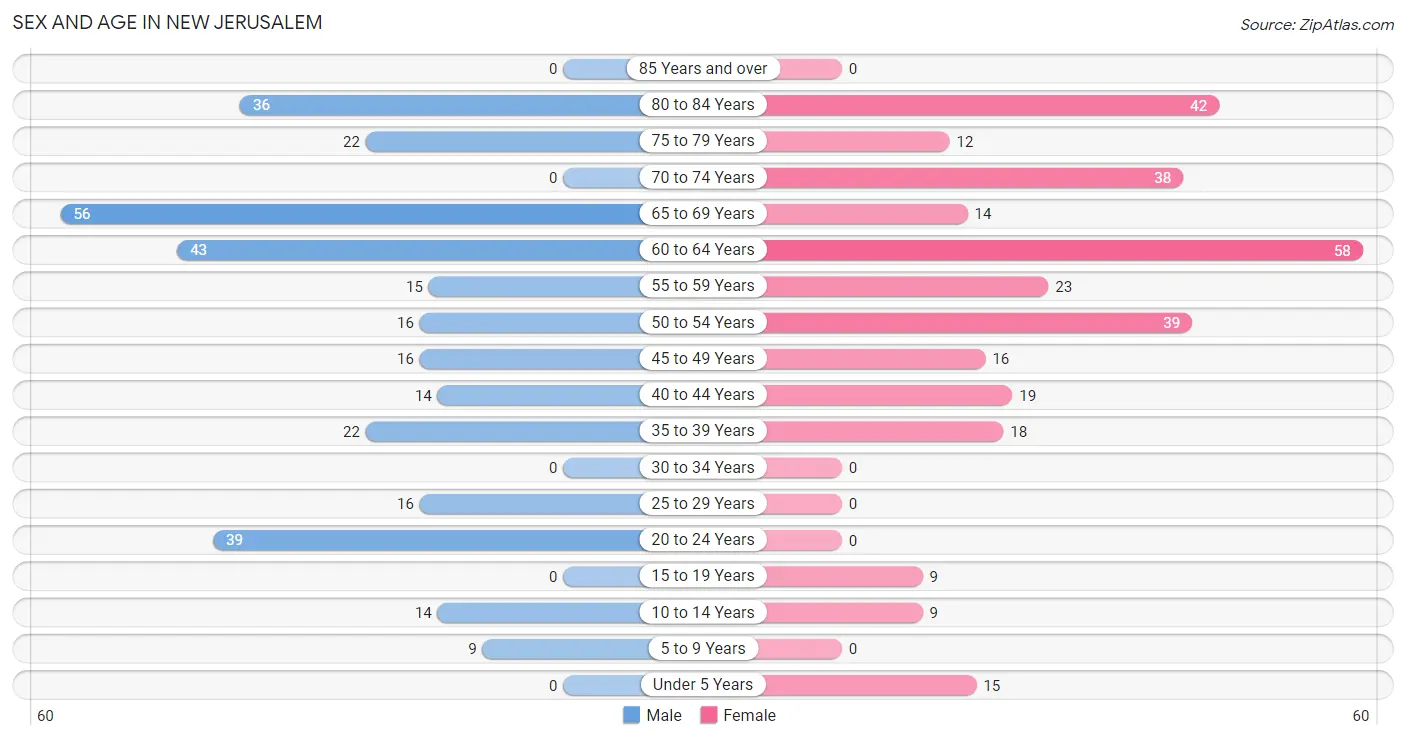
| Age Bracket | Male | Female |
| Under 5 Years | 0 (0.0%) | 15 (4.8%) |
| 5 to 9 Years | 9 (2.8%) | 0 (0.0%) |
| 10 to 14 Years | 14 (4.4%) | 9 (2.9%) |
| 15 to 19 Years | 0 (0.0%) | 9 (2.9%) |
| 20 to 24 Years | 39 (12.3%) | 0 (0.0%) |
| 25 to 29 Years | 16 (5.0%) | 0 (0.0%) |
| 30 to 34 Years | 0 (0.0%) | 0 (0.0%) |
| 35 to 39 Years | 22 (6.9%) | 18 (5.8%) |
| 40 to 44 Years | 14 (4.4%) | 19 (6.1%) |
| 45 to 49 Years | 16 (5.0%) | 16 (5.1%) |
| 50 to 54 Years | 16 (5.0%) | 39 (12.5%) |
| 55 to 59 Years | 15 (4.7%) | 23 (7.4%) |
| 60 to 64 Years | 43 (13.5%) | 58 (18.6%) |
| 65 to 69 Years | 56 (17.6%) | 14 (4.5%) |
| 70 to 74 Years | 0 (0.0%) | 38 (12.2%) |
| 75 to 79 Years | 22 (6.9%) | 12 (3.8%) |
| 80 to 84 Years | 36 (11.3%) | 42 (13.5%) |
| 85 Years and over | 0 (0.0%) | 0 (0.0%) |
| Total | 318 (100.0%) | 312 (100.0%) |
Families and Households in New Jerusalem
Median Family Size in New Jerusalem
The median family size in New Jerusalem is 2.45 persons per family, with married-couple families (198 | 84.6%) accounting for the largest median family size of 2.5 persons per family. On the other hand, single male/father families (12 | 5.1%) represent the smallest median family size with 2.17 persons per family.
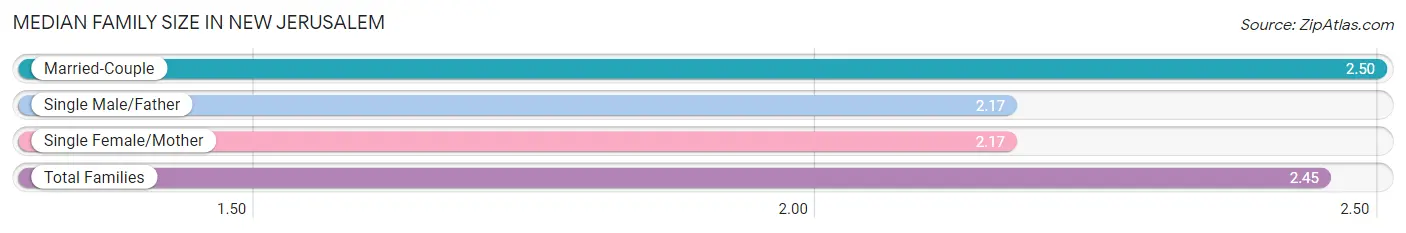
| Family Type | # Families | Family Size |
| Married-Couple | 198 (84.6%) | 2.50 |
| Single Male/Father | 12 (5.1%) | 2.17 |
| Single Female/Mother | 24 (10.3%) | 2.17 |
| Total Families | 234 (100.0%) | 2.45 |
Median Household Size in New Jerusalem
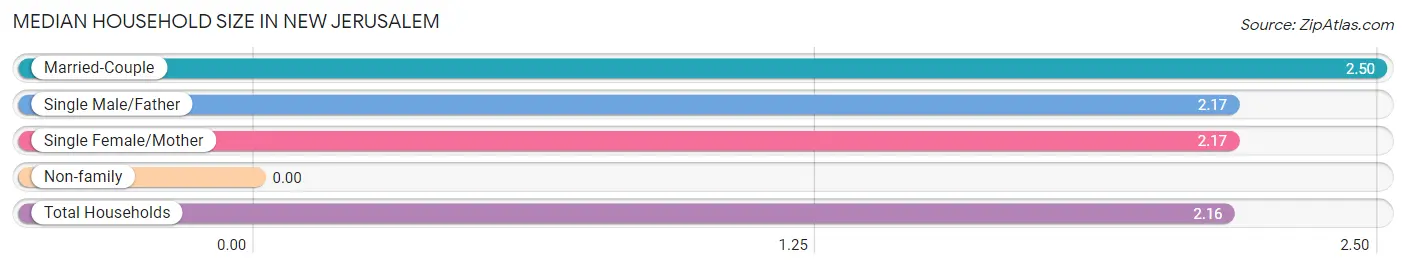
| Household Type | # Households | Household Size |
| Married-Couple | 198 (68.0%) | 2.50 |
| Single Male/Father | 12 (4.1%) | 2.17 |
| Single Female/Mother | 24 (8.3%) | 2.17 |
| Non-family | 57 (19.6%) | - |
| Total Households | 291 (100.0%) | 2.16 |
Household Size by Marriage Status in New Jerusalem
Out of a total of 291 households in New Jerusalem, 234 (80.4%) are family households, while 57 (19.6%) are nonfamily households. The most numerous type of family households are 2-person households, comprising 163, and the most common type of nonfamily households are 1-person households, comprising 57.
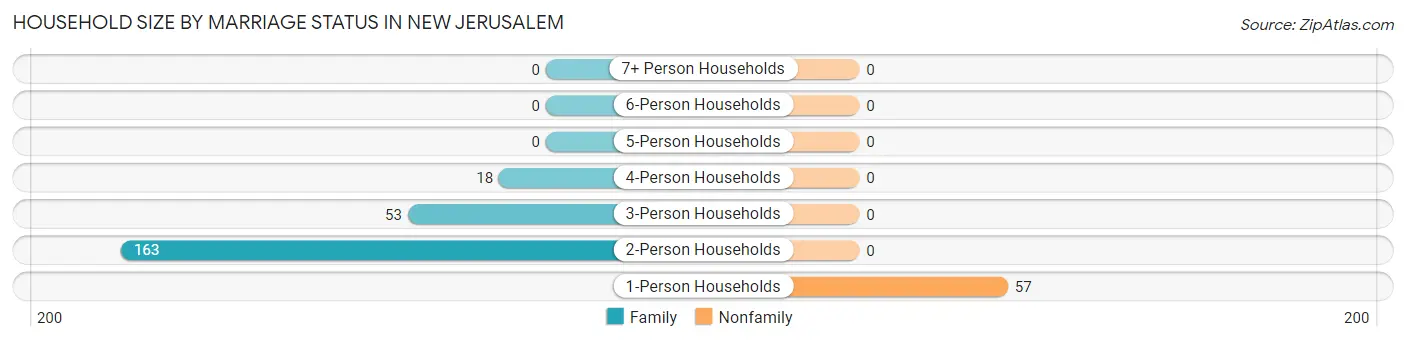
| Household Size | Family Households | Nonfamily Households |
| 1-Person Households | - | 57 (19.6%) |
| 2-Person Households | 163 (56.0%) | 0 (0.0%) |
| 3-Person Households | 53 (18.2%) | 0 (0.0%) |
| 4-Person Households | 18 (6.2%) | 0 (0.0%) |
| 5-Person Households | 0 (0.0%) | 0 (0.0%) |
| 6-Person Households | 0 (0.0%) | 0 (0.0%) |
| 7+ Person Households | 0 (0.0%) | 0 (0.0%) |
| Total | 234 (80.4%) | 57 (19.6%) |
Female Fertility in New Jerusalem
Fertility by Age in New Jerusalem
| Age Bracket | Women with Births | Births / 1,000 Women |
| 15 to 19 years | 0 (0.0%) | 0.0 |
| 20 to 34 years | 0 (0.0%) | 0.0 |
| 35 to 50 years | 0 (0.0%) | 0.0 |
| Total | 0 (0.0%) | 0.0 |
Fertility by Age by Marriage Status in New Jerusalem
| Age Bracket | Married | Unmarried |
| 15 to 19 years | 0 (0.0%) | 0 (0.0%) |
| 20 to 34 years | 0 (0.0%) | 0 (0.0%) |
| 35 to 50 years | 0 (0.0%) | 0 (0.0%) |
| Total | 0 (0.0%) | 0 (0.0%) |
Fertility by Education in New Jerusalem
| Educational Attainment | Women with Births | Births / 1,000 Women |
| Less than High School | 0 (0.0%) | 0.0 |
| High School Diploma | 0 (0.0%) | 0.0 |
| College or Associate's Degree | 0 (0.0%) | 0.0 |
| Bachelor's Degree | 0 (0.0%) | 0.0 |
| Graduate Degree | 0 (0.0%) | 0.0 |
| Total | 0 (0.0%) | 0.0 |
Fertility by Education by Marriage Status in New Jerusalem
| Educational Attainment | Married | Unmarried |
| Less than High School | 0 (0.0%) | 0 (0.0%) |
| High School Diploma | 0 (0.0%) | 0 (0.0%) |
| College or Associate's Degree | 0 (0.0%) | 0 (0.0%) |
| Bachelor's Degree | 0 (0.0%) | 0 (0.0%) |
| Graduate Degree | 0 (0.0%) | 0 (0.0%) |
| Total | 0 (0.0%) | 0 (0.0%) |
Employment Characteristics in New Jerusalem
Employment by Class of Employer in New Jerusalem
Among the 373 employed individuals in New Jerusalem, private company employees (299 | 80.2%), local government employees (33 | 8.8%), and not-for-profit organizations (19 | 5.1%) make up the most common classes of employment.
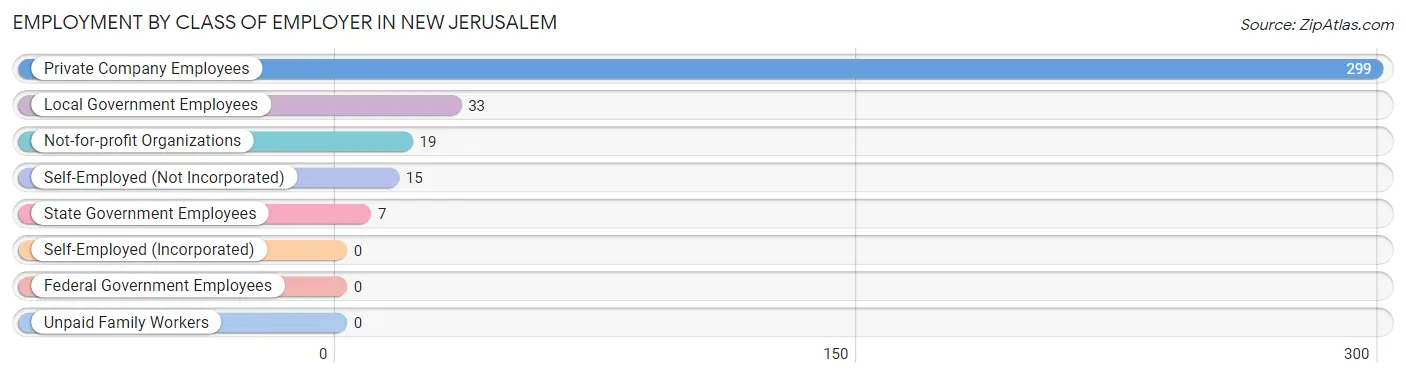
| Employer Class | # Employees | % Employees |
| Private Company Employees | 299 | 80.2% |
| Self-Employed (Incorporated) | 0 | 0.0% |
| Self-Employed (Not Incorporated) | 15 | 4.0% |
| Not-for-profit Organizations | 19 | 5.1% |
| Local Government Employees | 33 | 8.8% |
| State Government Employees | 7 | 1.9% |
| Federal Government Employees | 0 | 0.0% |
| Unpaid Family Workers | 0 | 0.0% |
| Total | 373 | 100.0% |
Employment Status by Age in New Jerusalem
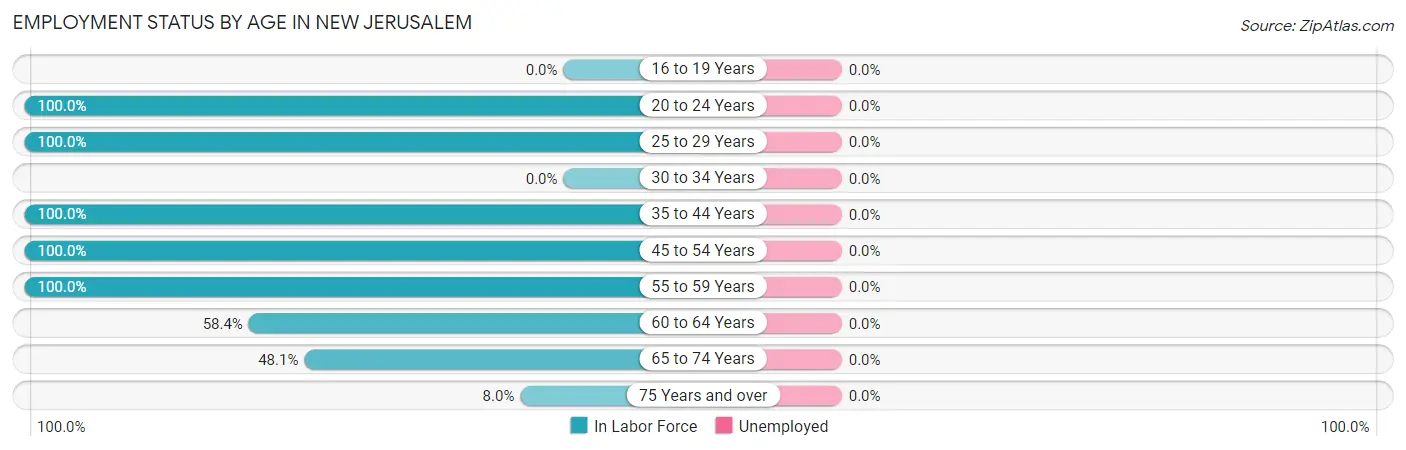
| Age Bracket | In Labor Force | Unemployed |
| 16 to 19 Years | 0 (0.0%) | 0 (0.0%) |
| 20 to 24 Years | 39 (100.0%) | 0 (0.0%) |
| 25 to 29 Years | 16 (100.0%) | 0 (0.0%) |
| 30 to 34 Years | 0 (0.0%) | 0 (0.0%) |
| 35 to 44 Years | 73 (100.0%) | 0 (0.0%) |
| 45 to 54 Years | 87 (100.0%) | 0 (0.0%) |
| 55 to 59 Years | 38 (100.0%) | 0 (0.0%) |
| 60 to 64 Years | 59 (58.4%) | 0 (0.0%) |
| 65 to 74 Years | 52 (48.1%) | 0 (0.0%) |
| 75 Years and over | 9 (8.0%) | 0 (0.0%) |
| Total | 373 (64.0%) | 0 (0.0%) |
Employment Status by Educational Attainment in New Jerusalem
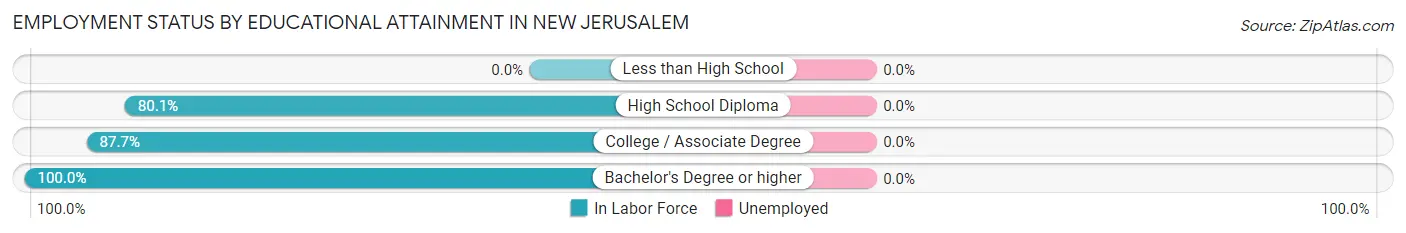
| Educational Attainment | In Labor Force | Unemployed |
| Less than High School | 0 (0.0%) | 0 (0.0%) |
| High School Diploma | 117 (80.1%) | 0 (0.0%) |
| College / Associate Degree | 93 (87.7%) | 0 (0.0%) |
| Bachelor's Degree or higher | 63 (100.0%) | 0 (0.0%) |
| Total | 273 (86.7%) | 0 (0.0%) |
Employment Occupations by Sex in New Jerusalem
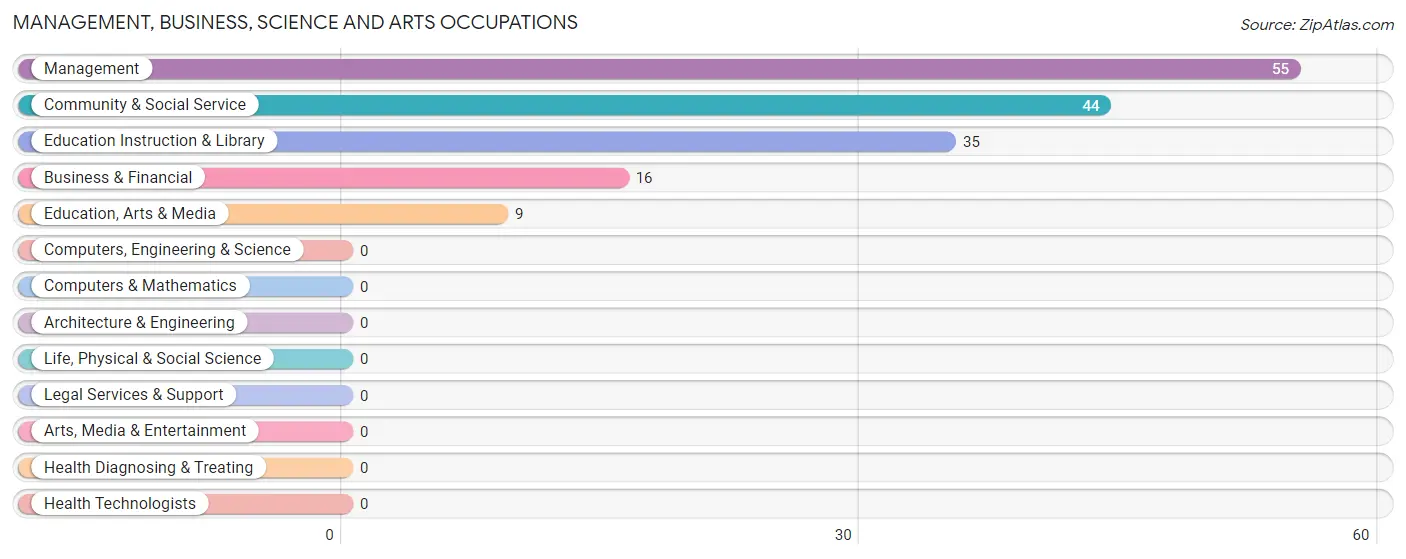
Management, Business, Science and Arts Occupations
The most common Management, Business, Science and Arts occupations in New Jerusalem are Management (55 | 14.7%), Community & Social Service (44 | 11.8%), Education Instruction & Library (35 | 9.4%), Business & Financial (16 | 4.3%), and Education, Arts & Media (9 | 2.4%).
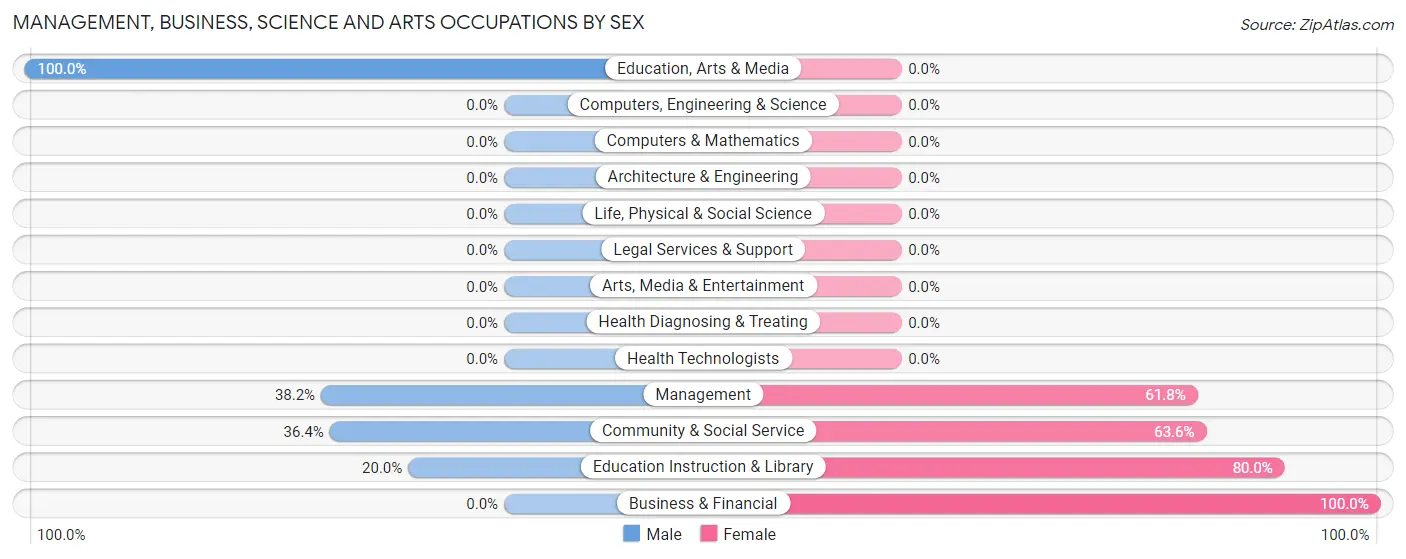
Management, Business, Science and Arts Occupations by Sex
Within the Management, Business, Science and Arts occupations in New Jerusalem, the most male-oriented occupations are Education, Arts & Media (100.0%), Management (38.2%), and Community & Social Service (36.4%), while the most female-oriented occupations are Business & Financial (100.0%), Education Instruction & Library (80.0%), and Community & Social Service (63.6%).
| Occupation | Male | Female |
| Management | 21 (38.2%) | 34 (61.8%) |
| Business & Financial | 0 (0.0%) | 16 (100.0%) |
| Computers, Engineering & Science | 0 (0.0%) | 0 (0.0%) |
| Computers & Mathematics | 0 (0.0%) | 0 (0.0%) |
| Architecture & Engineering | 0 (0.0%) | 0 (0.0%) |
| Life, Physical & Social Science | 0 (0.0%) | 0 (0.0%) |
| Community & Social Service | 16 (36.4%) | 28 (63.6%) |
| Education, Arts & Media | 9 (100.0%) | 0 (0.0%) |
| Legal Services & Support | 0 (0.0%) | 0 (0.0%) |
| Education Instruction & Library | 7 (20.0%) | 28 (80.0%) |
| Arts, Media & Entertainment | 0 (0.0%) | 0 (0.0%) |
| Health Diagnosing & Treating | 0 (0.0%) | 0 (0.0%) |
| Health Technologists | 0 (0.0%) | 0 (0.0%) |
| Total (Category) | 37 (32.2%) | 78 (67.8%) |
| Total (Overall) | 204 (54.7%) | 169 (45.3%) |
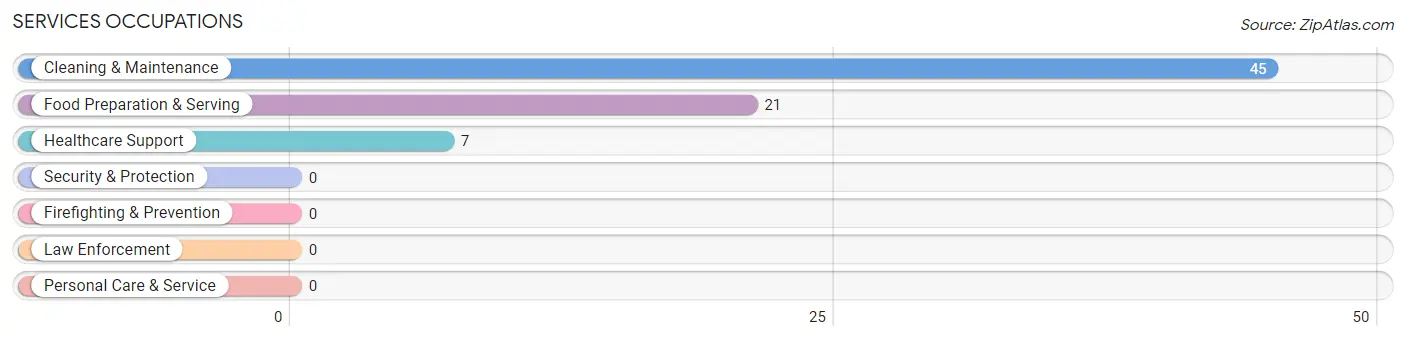
Services Occupations
The most common Services occupations in New Jerusalem are Cleaning & Maintenance (45 | 12.1%), Food Preparation & Serving (21 | 5.6%), and Healthcare Support (7 | 1.9%).
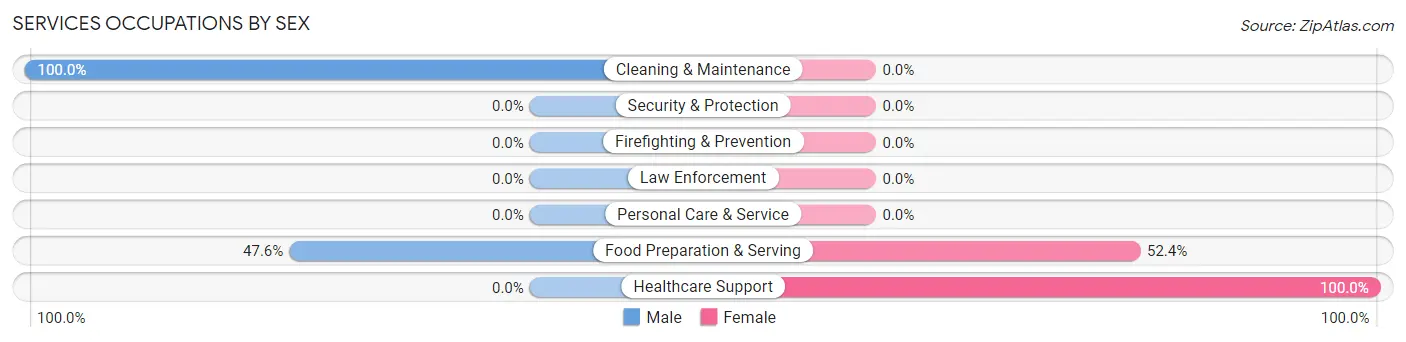
Services Occupations by Sex
Within the Services occupations in New Jerusalem, the most male-oriented occupations are Cleaning & Maintenance (100.0%), and Food Preparation & Serving (47.6%), while the most female-oriented occupations are Healthcare Support (100.0%), and Food Preparation & Serving (52.4%).
| Occupation | Male | Female |
| Healthcare Support | 0 (0.0%) | 7 (100.0%) |
| Security & Protection | 0 (0.0%) | 0 (0.0%) |
| Firefighting & Prevention | 0 (0.0%) | 0 (0.0%) |
| Law Enforcement | 0 (0.0%) | 0 (0.0%) |
| Food Preparation & Serving | 10 (47.6%) | 11 (52.4%) |
| Cleaning & Maintenance | 45 (100.0%) | 0 (0.0%) |
| Personal Care & Service | 0 (0.0%) | 0 (0.0%) |
| Total (Category) | 55 (75.3%) | 18 (24.7%) |
| Total (Overall) | 204 (54.7%) | 169 (45.3%) |
Sales and Office Occupations
The most common Sales and Office occupations in New Jerusalem are , and Office & Administration (68 | 18.2%).
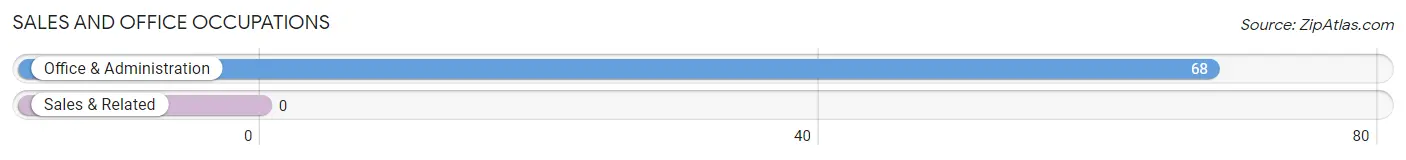
Sales and Office Occupations by Sex
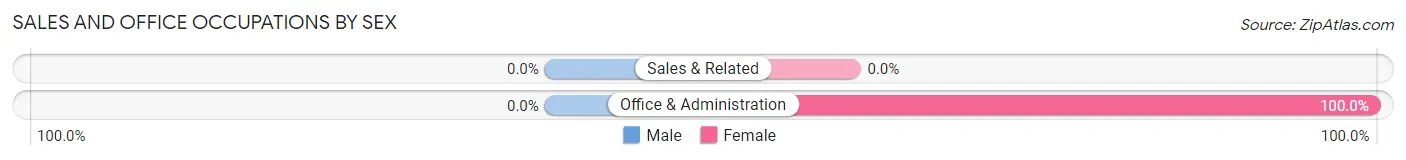
| Occupation | Male | Female |
| Sales & Related | 0 (0.0%) | 0 (0.0%) |
| Office & Administration | 0 (0.0%) | 68 (100.0%) |
| Total (Category) | 0 (0.0%) | 68 (100.0%) |
| Total (Overall) | 204 (54.7%) | 169 (45.3%) |
Natural Resources, Construction and Maintenance Occupations
The most common Natural Resources, Construction and Maintenance occupations in New Jerusalem are , and Installation, Maintenance & Repair (28 | 7.5%).
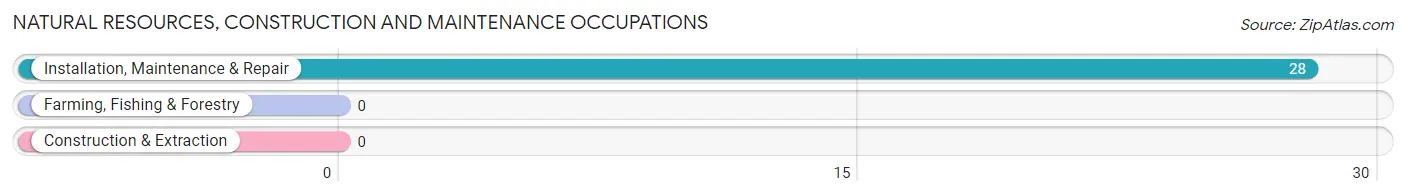
Natural Resources, Construction and Maintenance Occupations by Sex
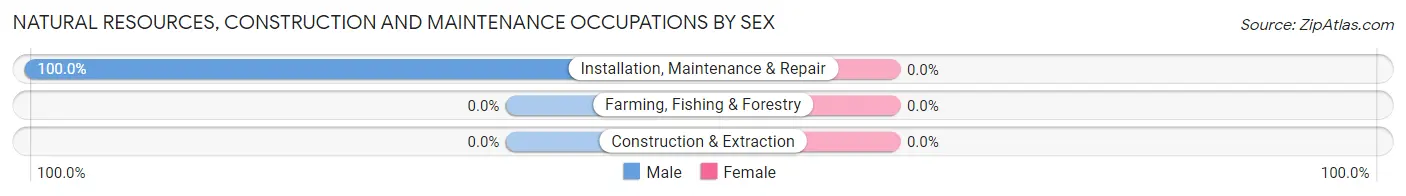
| Occupation | Male | Female |
| Farming, Fishing & Forestry | 0 (0.0%) | 0 (0.0%) |
| Construction & Extraction | 0 (0.0%) | 0 (0.0%) |
| Installation, Maintenance & Repair | 28 (100.0%) | 0 (0.0%) |
| Total (Category) | 28 (100.0%) | 0 (0.0%) |
| Total (Overall) | 204 (54.7%) | 169 (45.3%) |
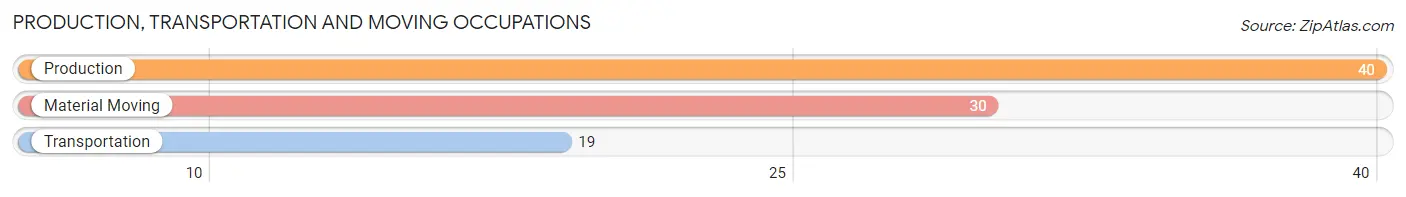
Production, Transportation and Moving Occupations
The most common Production, Transportation and Moving occupations in New Jerusalem are Production (40 | 10.7%), Material Moving (30 | 8.0%), and Transportation (19 | 5.1%).
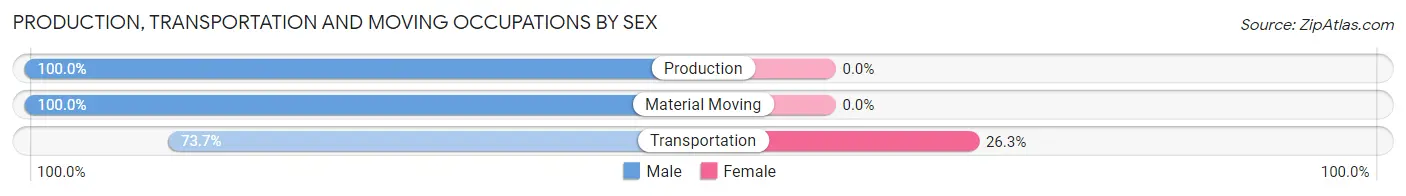
Production, Transportation and Moving Occupations by Sex
| Occupation | Male | Female |
| Production | 40 (100.0%) | 0 (0.0%) |
| Transportation | 14 (73.7%) | 5 (26.3%) |
| Material Moving | 30 (100.0%) | 0 (0.0%) |
| Total (Category) | 84 (94.4%) | 5 (5.6%) |
| Total (Overall) | 204 (54.7%) | 169 (45.3%) |
Employment Industries by Sex in New Jerusalem
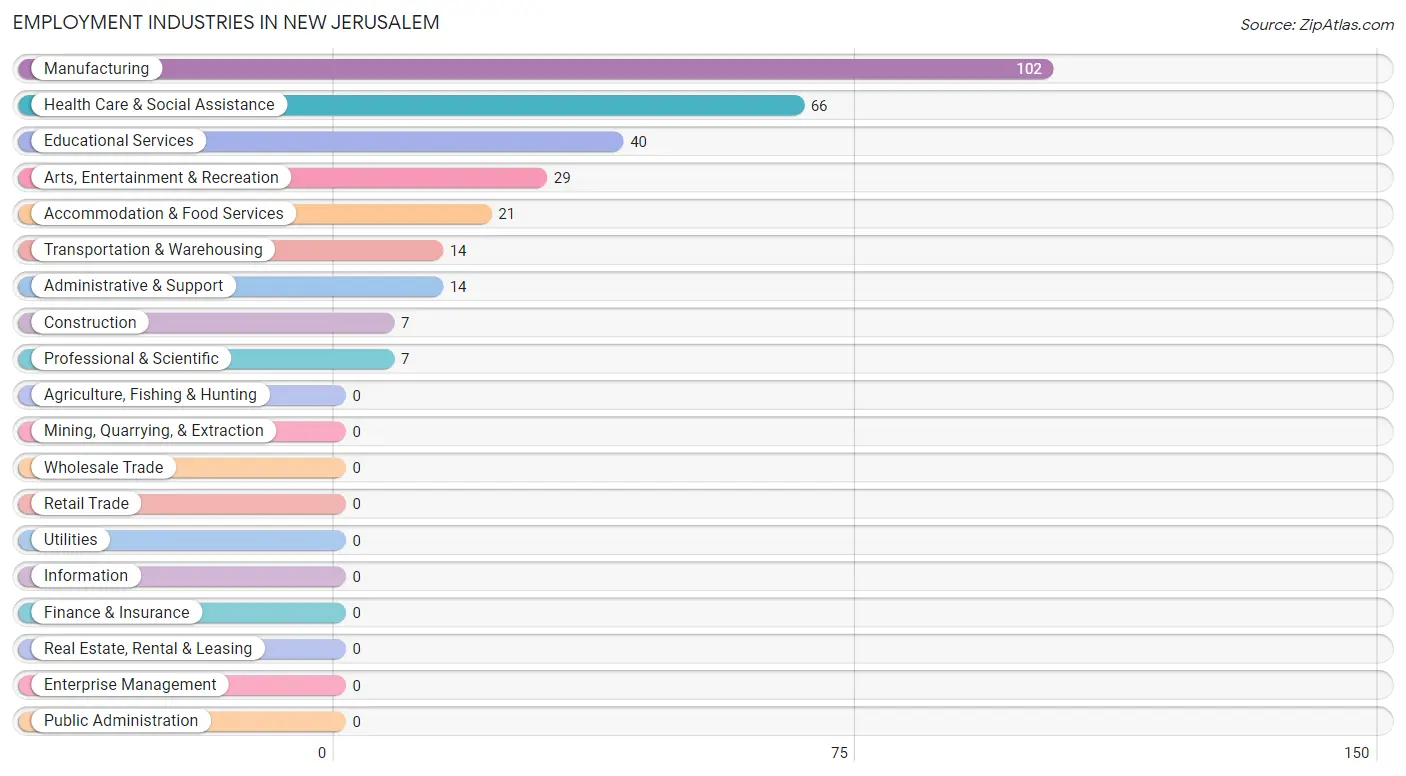
Employment Industries in New Jerusalem
The major employment industries in New Jerusalem include Manufacturing (102 | 27.4%), Health Care & Social Assistance (66 | 17.7%), Educational Services (40 | 10.7%), Arts, Entertainment & Recreation (29 | 7.8%), and Accommodation & Food Services (21 | 5.6%).
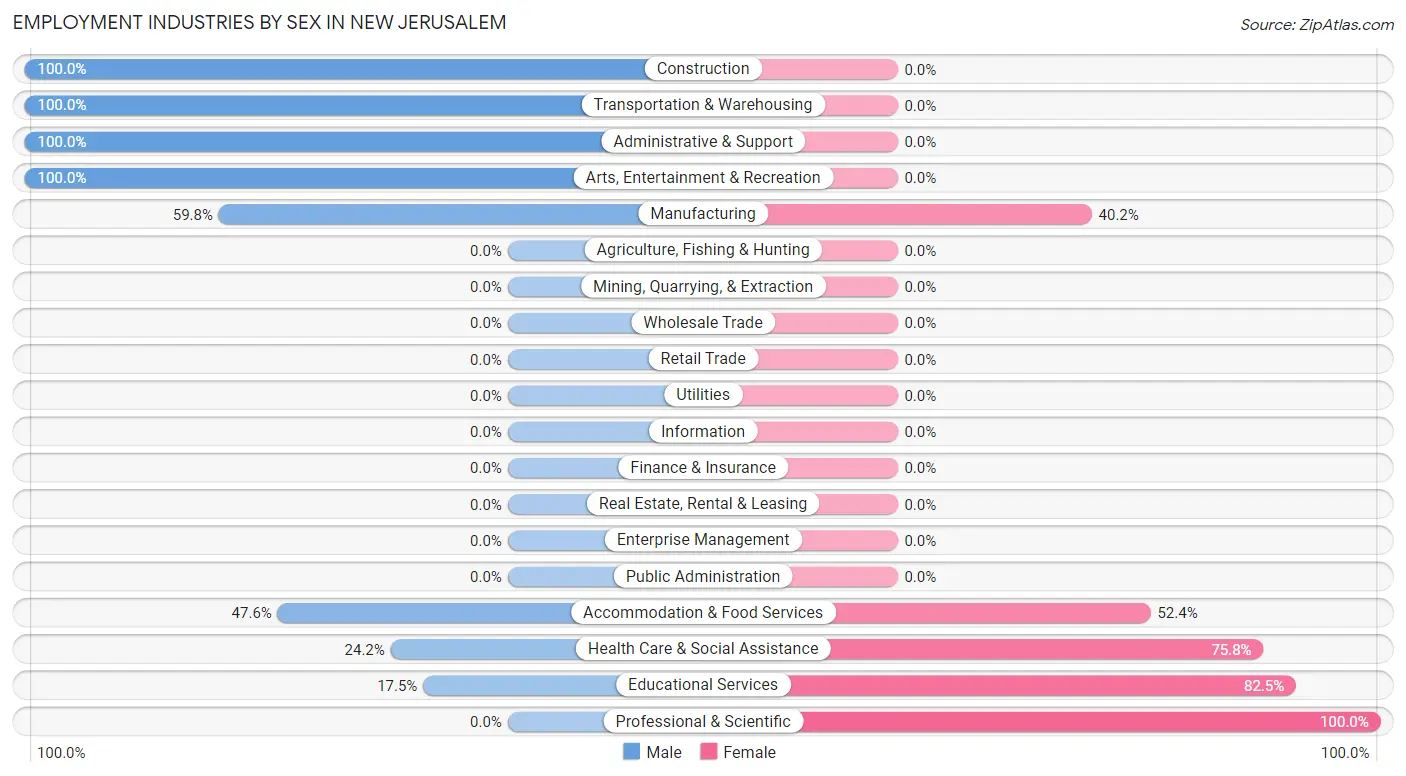
Employment Industries by Sex in New Jerusalem
The New Jerusalem industries that see more men than women are Construction (100.0%), Transportation & Warehousing (100.0%), and Administrative & Support (100.0%), whereas the industries that tend to have a higher number of women are Professional & Scientific (100.0%), Educational Services (82.5%), and Health Care & Social Assistance (75.8%).
| Industry | Male | Female |
| Agriculture, Fishing & Hunting | 0 (0.0%) | 0 (0.0%) |
| Mining, Quarrying, & Extraction | 0 (0.0%) | 0 (0.0%) |
| Construction | 7 (100.0%) | 0 (0.0%) |
| Manufacturing | 61 (59.8%) | 41 (40.2%) |
| Wholesale Trade | 0 (0.0%) | 0 (0.0%) |
| Retail Trade | 0 (0.0%) | 0 (0.0%) |
| Transportation & Warehousing | 14 (100.0%) | 0 (0.0%) |
| Utilities | 0 (0.0%) | 0 (0.0%) |
| Information | 0 (0.0%) | 0 (0.0%) |
| Finance & Insurance | 0 (0.0%) | 0 (0.0%) |
| Real Estate, Rental & Leasing | 0 (0.0%) | 0 (0.0%) |
| Professional & Scientific | 0 (0.0%) | 7 (100.0%) |
| Enterprise Management | 0 (0.0%) | 0 (0.0%) |
| Administrative & Support | 14 (100.0%) | 0 (0.0%) |
| Educational Services | 7 (17.5%) | 33 (82.5%) |
| Health Care & Social Assistance | 16 (24.2%) | 50 (75.8%) |
| Arts, Entertainment & Recreation | 29 (100.0%) | 0 (0.0%) |
| Accommodation & Food Services | 10 (47.6%) | 11 (52.4%) |
| Public Administration | 0 (0.0%) | 0 (0.0%) |
| Total | 204 (54.7%) | 169 (45.3%) |
Education in New Jerusalem
School Enrollment in New Jerusalem
The most common levels of schooling among the 60 students in New Jerusalem are college / undergraduate (19 | 31.7%), elementary school (18 | 30.0%), and middle school (14 | 23.3%).
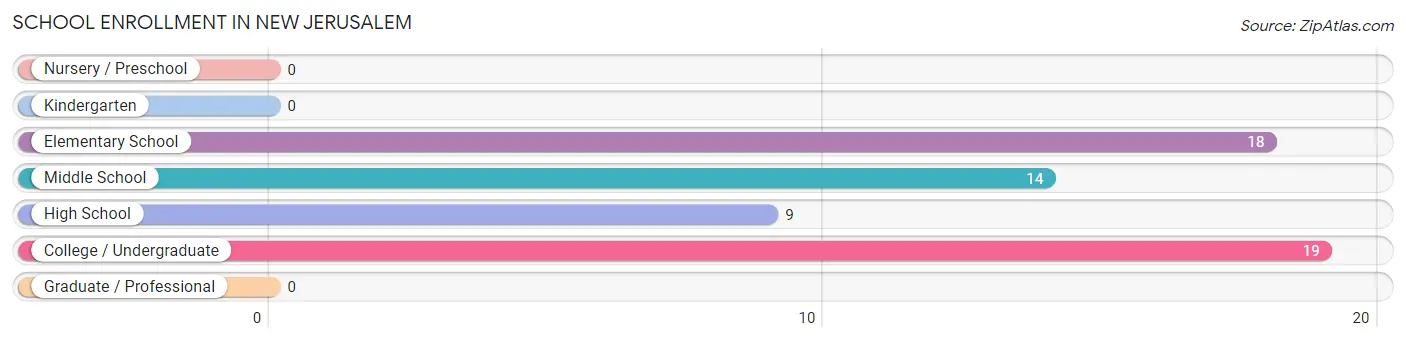
| School Level | # Students | % Students |
| Nursery / Preschool | 0 | 0.0% |
| Kindergarten | 0 | 0.0% |
| Elementary School | 18 | 30.0% |
| Middle School | 14 | 23.3% |
| High School | 9 | 15.0% |
| College / Undergraduate | 19 | 31.7% |
| Graduate / Professional | 0 | 0.0% |
| Total | 60 | 100.0% |
School Enrollment by Age by Funding Source in New Jerusalem
Out of a total of 60 students who are enrolled in schools in New Jerusalem, 19 (31.7%) attend a private institution, while the remaining 41 (68.3%) are enrolled in public schools. The age group of 20 to 24 year olds has the highest likelihood of being enrolled in private schools, with 10 (100.0% in the age bracket) enrolled. Conversely, the age group of 5 to 9 year old has the lowest likelihood of being enrolled in a private school, with 9 (100.0% in the age bracket) attending a public institution.
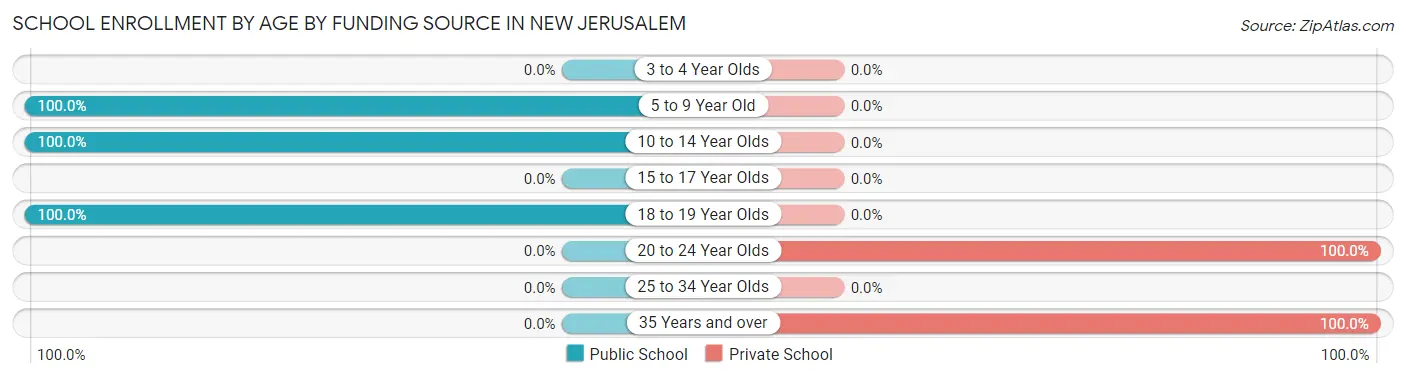
| Age Bracket | Public School | Private School |
| 3 to 4 Year Olds | 0 (0.0%) | 0 (0.0%) |
| 5 to 9 Year Old | 9 (100.0%) | 0 (0.0%) |
| 10 to 14 Year Olds | 23 (100.0%) | 0 (0.0%) |
| 15 to 17 Year Olds | 0 (0.0%) | 0 (0.0%) |
| 18 to 19 Year Olds | 9 (100.0%) | 0 (0.0%) |
| 20 to 24 Year Olds | 0 (0.0%) | 10 (100.0%) |
| 25 to 34 Year Olds | 0 (0.0%) | 0 (0.0%) |
| 35 Years and over | 0 (0.0%) | 9 (100.0%) |
| Total | 41 (68.3%) | 19 (31.7%) |
Educational Attainment by Field of Study in New Jerusalem
Arts & humanities (32 | 27.4%), business (28 | 23.9%), science & technology (26 | 22.2%), social sciences (12 | 10.3%), and literature & languages (12 | 10.3%) are the most common fields of study among 117 individuals in New Jerusalem who have obtained a bachelor's degree or higher.
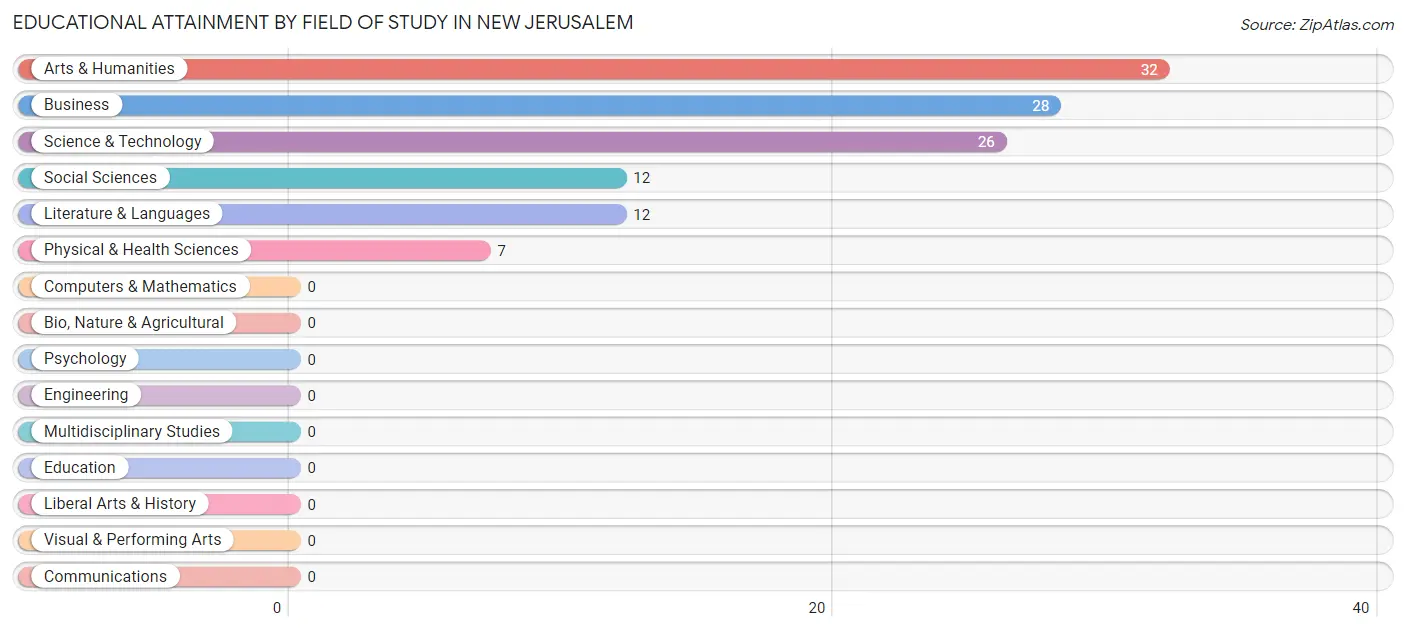
| Field of Study | # Graduates | % Graduates |
| Computers & Mathematics | 0 | 0.0% |
| Bio, Nature & Agricultural | 0 | 0.0% |
| Physical & Health Sciences | 7 | 6.0% |
| Psychology | 0 | 0.0% |
| Social Sciences | 12 | 10.3% |
| Engineering | 0 | 0.0% |
| Multidisciplinary Studies | 0 | 0.0% |
| Science & Technology | 26 | 22.2% |
| Business | 28 | 23.9% |
| Education | 0 | 0.0% |
| Literature & Languages | 12 | 10.3% |
| Liberal Arts & History | 0 | 0.0% |
| Visual & Performing Arts | 0 | 0.0% |
| Communications | 0 | 0.0% |
| Arts & Humanities | 32 | 27.4% |
| Total | 117 | 100.0% |
Transportation & Commute in New Jerusalem
Vehicle Availability by Sex in New Jerusalem
The most prevalent vehicle ownership categories in New Jerusalem are males with 2 vehicles (75, accounting for 36.8%) and females with 2 vehicles (68, making up 44.4%).
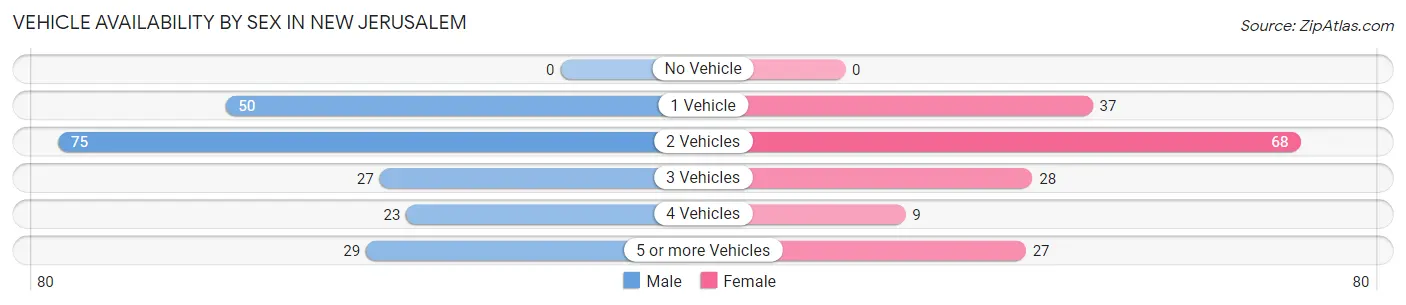
| Vehicles Available | Male | Female |
| No Vehicle | 0 (0.0%) | 0 (0.0%) |
| 1 Vehicle | 50 (24.5%) | 37 (21.9%) |
| 2 Vehicles | 75 (36.8%) | 68 (40.2%) |
| 3 Vehicles | 27 (13.2%) | 28 (16.6%) |
| 4 Vehicles | 23 (11.3%) | 9 (5.3%) |
| 5 or more Vehicles | 29 (14.2%) | 27 (16.0%) |
| Total | 204 (100.0%) | 169 (100.0%) |
Commute Time in New Jerusalem
The most frequently occuring commute durations in New Jerusalem are 10 to 14 minutes (114 commuters, 30.6%), 25 to 29 minutes (60 commuters, 16.1%), and 20 to 24 minutes (54 commuters, 14.5%).
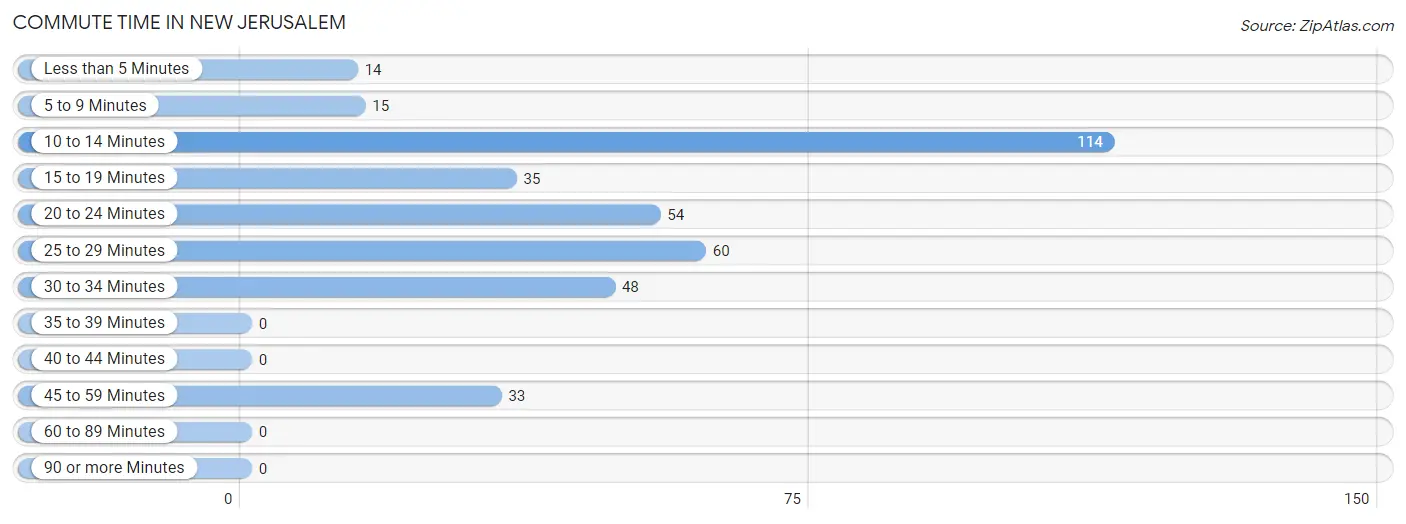
| Commute Time | # Commuters | % Commuters |
| Less than 5 Minutes | 14 | 3.7% |
| 5 to 9 Minutes | 15 | 4.0% |
| 10 to 14 Minutes | 114 | 30.6% |
| 15 to 19 Minutes | 35 | 9.4% |
| 20 to 24 Minutes | 54 | 14.5% |
| 25 to 29 Minutes | 60 | 16.1% |
| 30 to 34 Minutes | 48 | 12.9% |
| 35 to 39 Minutes | 0 | 0.0% |
| 40 to 44 Minutes | 0 | 0.0% |
| 45 to 59 Minutes | 33 | 8.8% |
| 60 to 89 Minutes | 0 | 0.0% |
| 90 or more Minutes | 0 | 0.0% |
Commute Time by Sex in New Jerusalem
The most common commute times in New Jerusalem are 30 to 34 minutes (39 commuters, 19.1%) for males and 10 to 14 minutes (82 commuters, 48.5%) for females.
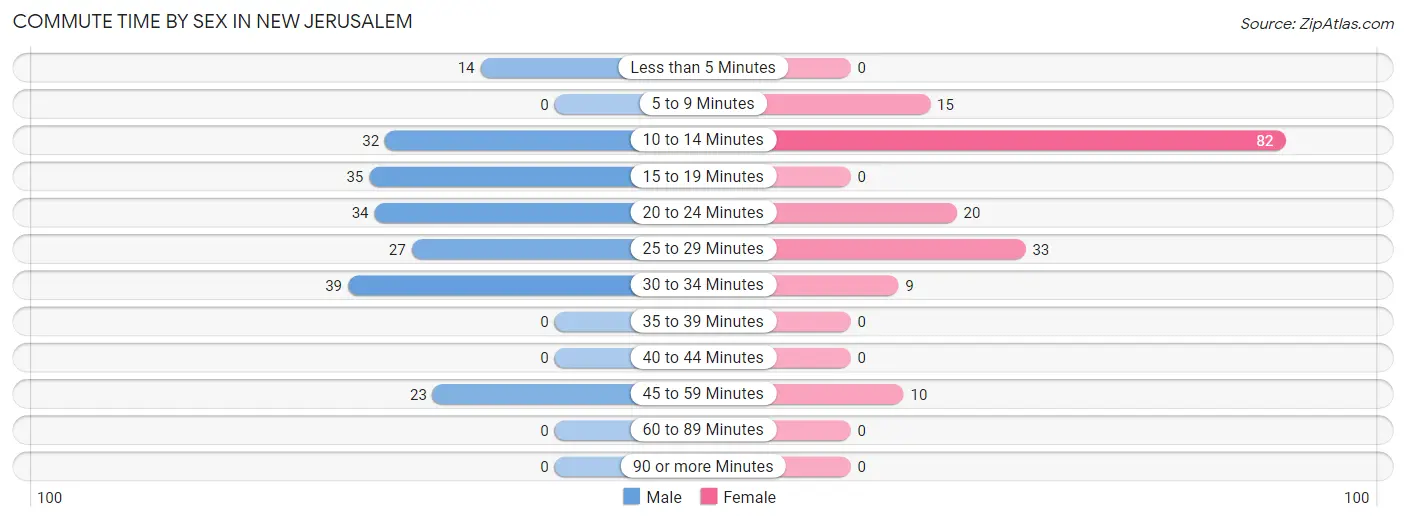
| Commute Time | Male | Female |
| Less than 5 Minutes | 14 (6.9%) | 0 (0.0%) |
| 5 to 9 Minutes | 0 (0.0%) | 15 (8.9%) |
| 10 to 14 Minutes | 32 (15.7%) | 82 (48.5%) |
| 15 to 19 Minutes | 35 (17.2%) | 0 (0.0%) |
| 20 to 24 Minutes | 34 (16.7%) | 20 (11.8%) |
| 25 to 29 Minutes | 27 (13.2%) | 33 (19.5%) |
| 30 to 34 Minutes | 39 (19.1%) | 9 (5.3%) |
| 35 to 39 Minutes | 0 (0.0%) | 0 (0.0%) |
| 40 to 44 Minutes | 0 (0.0%) | 0 (0.0%) |
| 45 to 59 Minutes | 23 (11.3%) | 10 (5.9%) |
| 60 to 89 Minutes | 0 (0.0%) | 0 (0.0%) |
| 90 or more Minutes | 0 (0.0%) | 0 (0.0%) |
Time of Departure to Work by Sex in New Jerusalem
The most frequent times of departure to work in New Jerusalem are 7:00 AM to 7:29 AM (59, 28.9%) for males and 8:00 AM to 8:29 AM (42, 24.8%) for females.
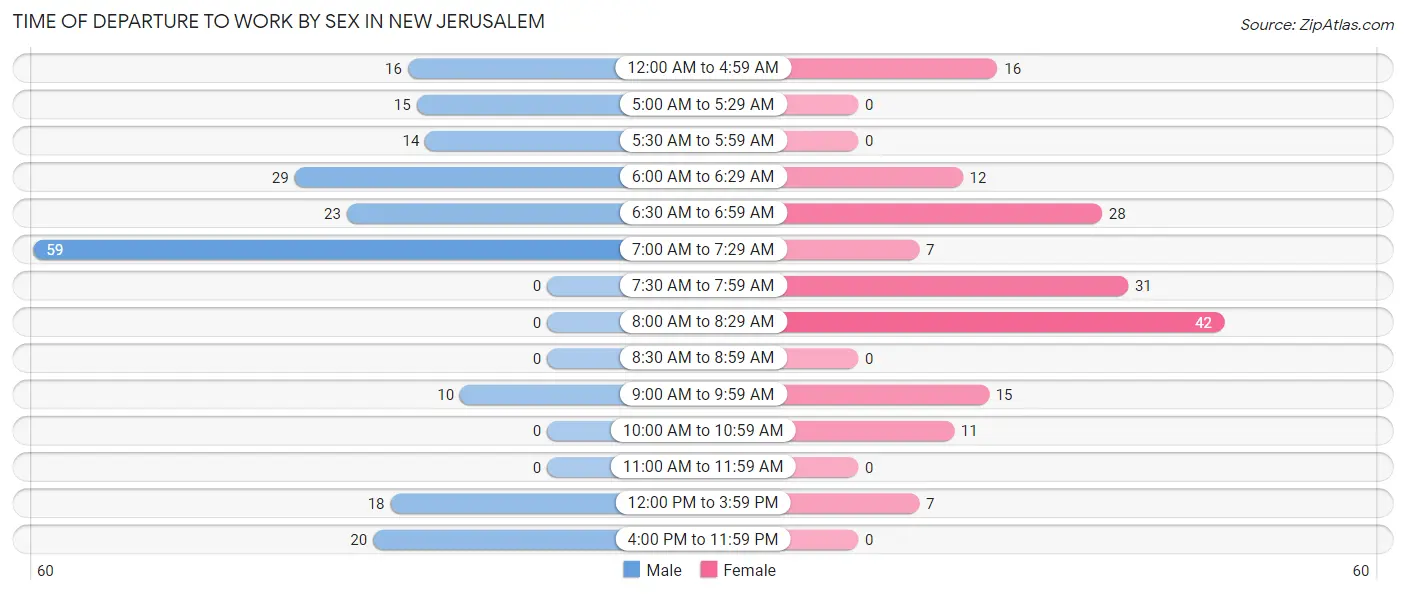
| Time of Departure | Male | Female |
| 12:00 AM to 4:59 AM | 16 (7.8%) | 16 (9.5%) |
| 5:00 AM to 5:29 AM | 15 (7.3%) | 0 (0.0%) |
| 5:30 AM to 5:59 AM | 14 (6.9%) | 0 (0.0%) |
| 6:00 AM to 6:29 AM | 29 (14.2%) | 12 (7.1%) |
| 6:30 AM to 6:59 AM | 23 (11.3%) | 28 (16.6%) |
| 7:00 AM to 7:29 AM | 59 (28.9%) | 7 (4.1%) |
| 7:30 AM to 7:59 AM | 0 (0.0%) | 31 (18.3%) |
| 8:00 AM to 8:29 AM | 0 (0.0%) | 42 (24.8%) |
| 8:30 AM to 8:59 AM | 0 (0.0%) | 0 (0.0%) |
| 9:00 AM to 9:59 AM | 10 (4.9%) | 15 (8.9%) |
| 10:00 AM to 10:59 AM | 0 (0.0%) | 11 (6.5%) |
| 11:00 AM to 11:59 AM | 0 (0.0%) | 0 (0.0%) |
| 12:00 PM to 3:59 PM | 18 (8.8%) | 7 (4.1%) |
| 4:00 PM to 11:59 PM | 20 (9.8%) | 0 (0.0%) |
| Total | 204 (100.0%) | 169 (100.0%) |
Housing Occupancy in New Jerusalem
Occupancy by Ownership in New Jerusalem
Of the total 291 dwellings in New Jerusalem, owner-occupied units account for 291 (100.0%), while renter-occupied units make up 0 (0.0%).
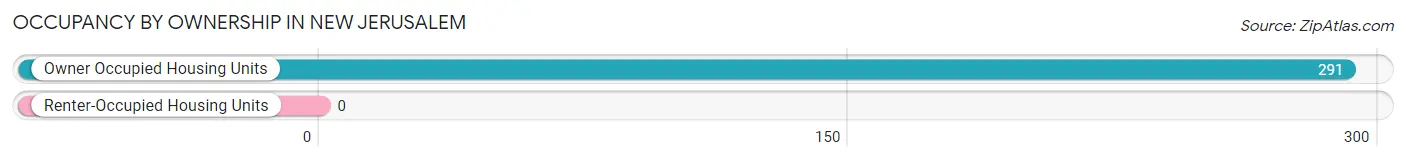
| Occupancy | # Housing Units | % Housing Units |
| Owner Occupied Housing Units | 291 | 100.0% |
| Renter-Occupied Housing Units | 0 | 0.0% |
| Total Occupied Housing Units | 291 | 100.0% |
Occupancy by Household Size in New Jerusalem
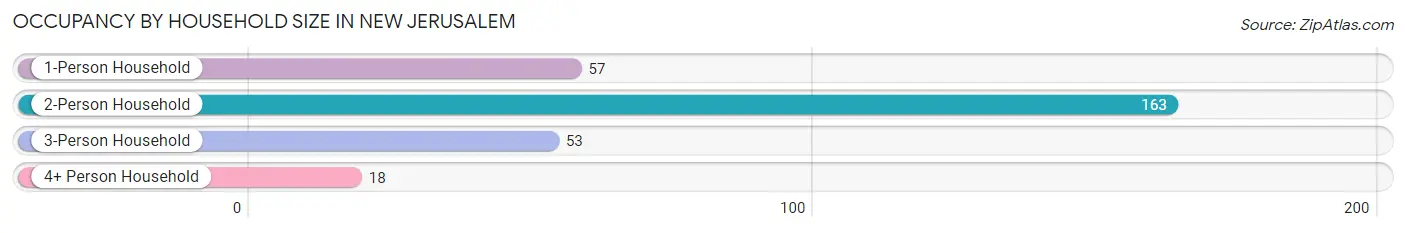
| Household Size | # Housing Units | % Housing Units |
| 1-Person Household | 57 | 19.6% |
| 2-Person Household | 163 | 56.0% |
| 3-Person Household | 53 | 18.2% |
| 4+ Person Household | 18 | 6.2% |
| Total Housing Units | 291 | 100.0% |
Occupancy by Ownership by Household Size in New Jerusalem
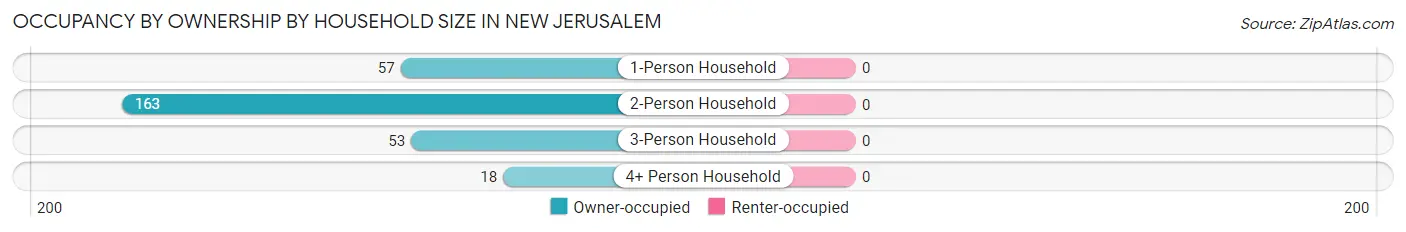
| Household Size | Owner-occupied | Renter-occupied |
| 1-Person Household | 57 (100.0%) | 0 (0.0%) |
| 2-Person Household | 163 (100.0%) | 0 (0.0%) |
| 3-Person Household | 53 (100.0%) | 0 (0.0%) |
| 4+ Person Household | 18 (100.0%) | 0 (0.0%) |
| Total Housing Units | 291 (100.0%) | 0 (0.0%) |
Occupancy by Educational Attainment in New Jerusalem
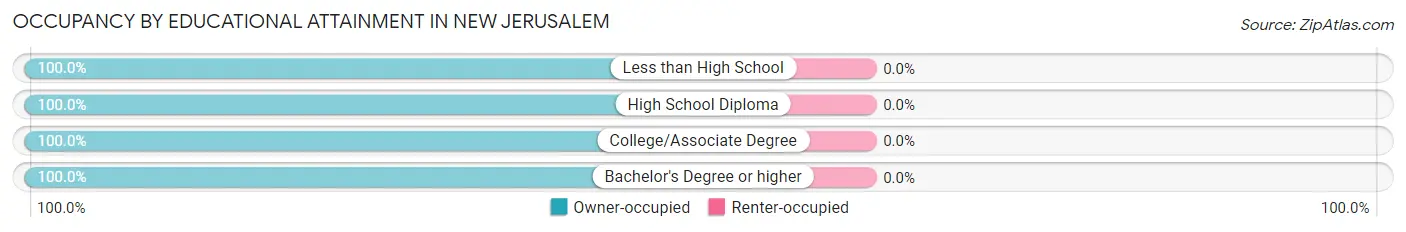
| Household Size | Owner-occupied | Renter-occupied |
| Less than High School | 12 (100.0%) | 0 (0.0%) |
| High School Diploma | 176 (100.0%) | 0 (0.0%) |
| College/Associate Degree | 47 (100.0%) | 0 (0.0%) |
| Bachelor's Degree or higher | 56 (100.0%) | 0 (0.0%) |
Occupancy by Age of Householder in New Jerusalem
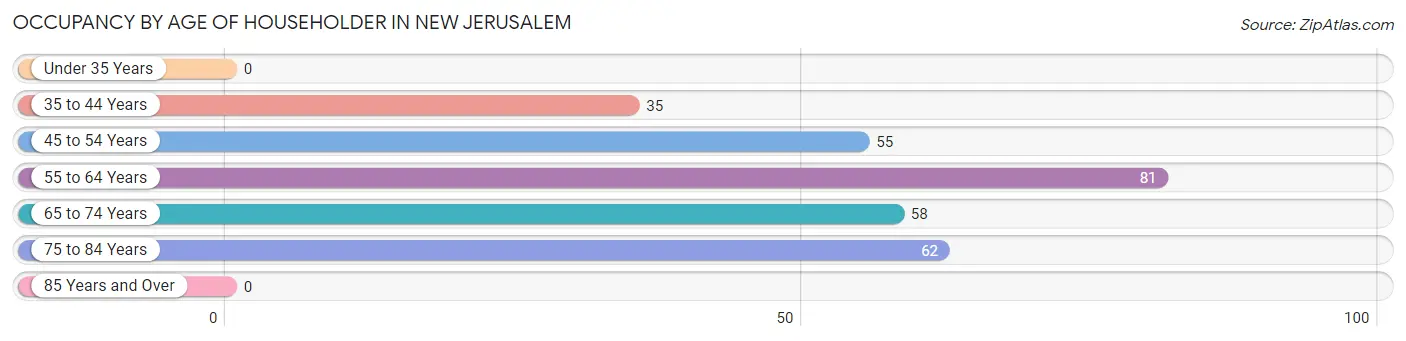
| Age Bracket | # Households | % Households |
| Under 35 Years | 0 | 0.0% |
| 35 to 44 Years | 35 | 12.0% |
| 45 to 54 Years | 55 | 18.9% |
| 55 to 64 Years | 81 | 27.8% |
| 65 to 74 Years | 58 | 19.9% |
| 75 to 84 Years | 62 | 21.3% |
| 85 Years and Over | 0 | 0.0% |
| Total | 291 | 100.0% |
Housing Finances in New Jerusalem
Median Income by Occupancy in New Jerusalem
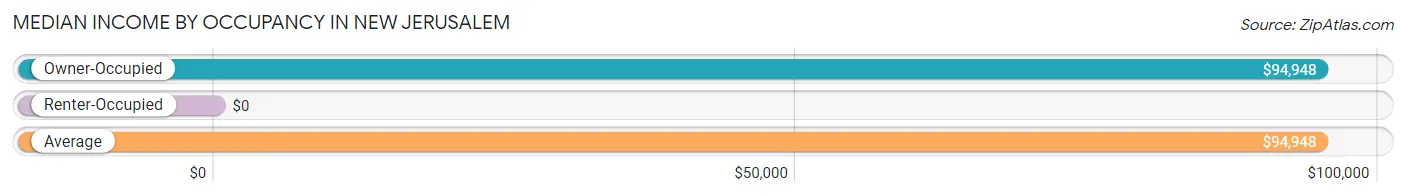
| Occupancy Type | # Households | Median Income |
| Owner-Occupied | 291 (100.0%) | $94,948 |
| Renter-Occupied | 0 (0.0%) | $0 |
| Average | 291 (100.0%) | $94,948 |
Occupancy by Householder Income Bracket in New Jerusalem
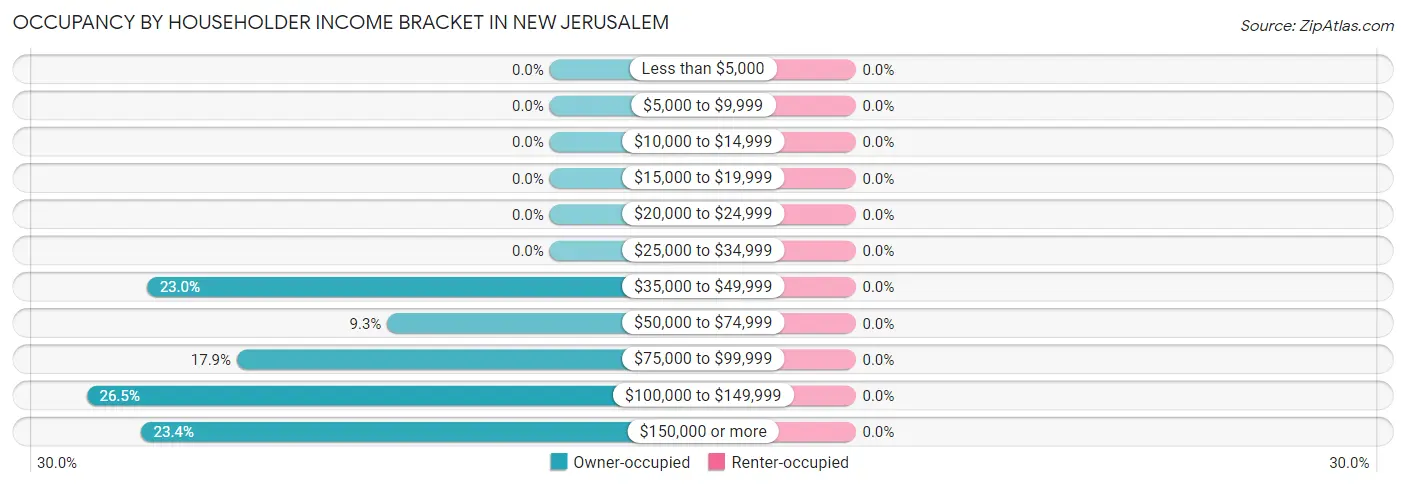
| Income Bracket | Owner-occupied | Renter-occupied |
| Less than $5,000 | 0 (0.0%) | 0 (0.0%) |
| $5,000 to $9,999 | 0 (0.0%) | 0 (0.0%) |
| $10,000 to $14,999 | 0 (0.0%) | 0 (0.0%) |
| $15,000 to $19,999 | 0 (0.0%) | 0 (0.0%) |
| $20,000 to $24,999 | 0 (0.0%) | 0 (0.0%) |
| $25,000 to $34,999 | 0 (0.0%) | 0 (0.0%) |
| $35,000 to $49,999 | 67 (23.0%) | 0 (0.0%) |
| $50,000 to $74,999 | 27 (9.3%) | 0 (0.0%) |
| $75,000 to $99,999 | 52 (17.9%) | 0 (0.0%) |
| $100,000 to $149,999 | 77 (26.5%) | 0 (0.0%) |
| $150,000 or more | 68 (23.4%) | 0 (0.0%) |
| Total | 291 (100.0%) | 0 (0.0%) |
Monthly Housing Cost Tiers in New Jerusalem
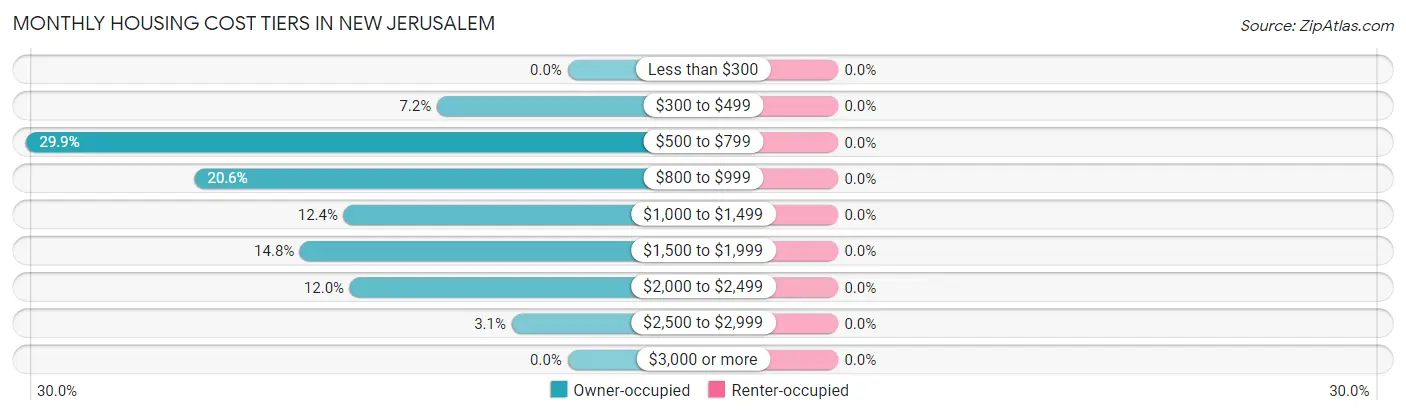
| Monthly Cost | Owner-occupied | Renter-occupied |
| Less than $300 | 0 (0.0%) | 0 (0.0%) |
| $300 to $499 | 21 (7.2%) | 0 (0.0%) |
| $500 to $799 | 87 (29.9%) | 0 (0.0%) |
| $800 to $999 | 60 (20.6%) | 0 (0.0%) |
| $1,000 to $1,499 | 36 (12.4%) | 0 (0.0%) |
| $1,500 to $1,999 | 43 (14.8%) | 0 (0.0%) |
| $2,000 to $2,499 | 35 (12.0%) | 0 (0.0%) |
| $2,500 to $2,999 | 9 (3.1%) | 0 (0.0%) |
| $3,000 or more | 0 (0.0%) | 0 (0.0%) |
| Total | 291 (100.0%) | 0 (0.0%) |
Physical Housing Characteristics in New Jerusalem
Housing Structures in New Jerusalem
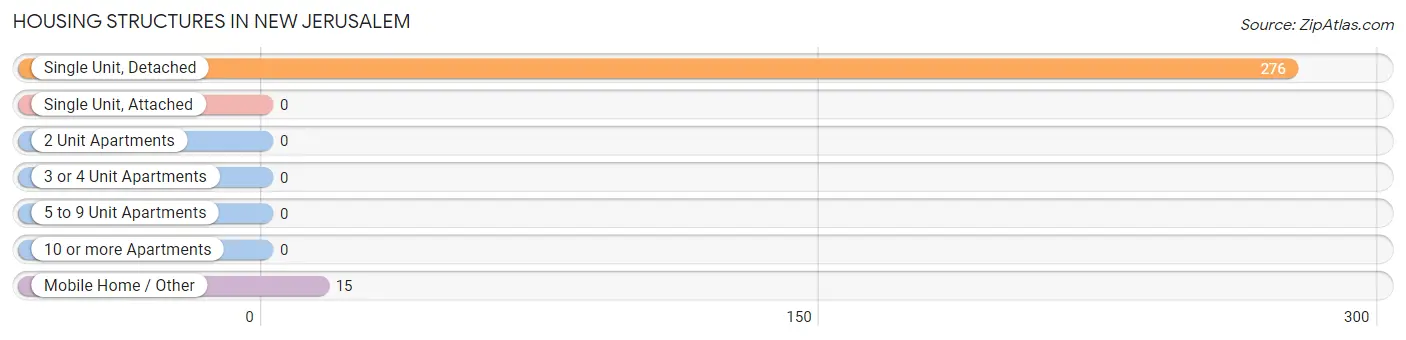
| Structure Type | # Housing Units | % Housing Units |
| Single Unit, Detached | 276 | 94.9% |
| Single Unit, Attached | 0 | 0.0% |
| 2 Unit Apartments | 0 | 0.0% |
| 3 or 4 Unit Apartments | 0 | 0.0% |
| 5 to 9 Unit Apartments | 0 | 0.0% |
| 10 or more Apartments | 0 | 0.0% |
| Mobile Home / Other | 15 | 5.1% |
| Total | 291 | 100.0% |
Housing Structures by Occupancy in New Jerusalem
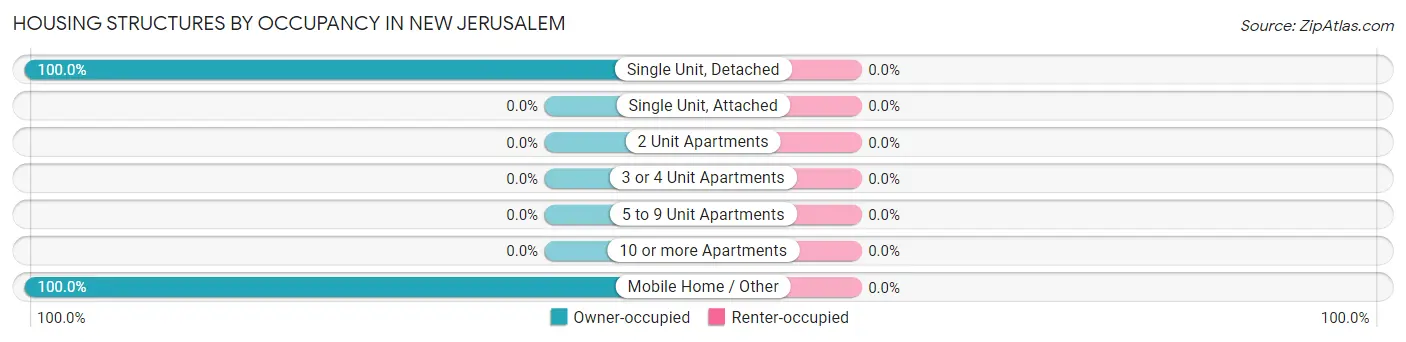
| Structure Type | Owner-occupied | Renter-occupied |
| Single Unit, Detached | 276 (100.0%) | 0 (0.0%) |
| Single Unit, Attached | 0 (0.0%) | 0 (0.0%) |
| 2 Unit Apartments | 0 (0.0%) | 0 (0.0%) |
| 3 or 4 Unit Apartments | 0 (0.0%) | 0 (0.0%) |
| 5 to 9 Unit Apartments | 0 (0.0%) | 0 (0.0%) |
| 10 or more Apartments | 0 (0.0%) | 0 (0.0%) |
| Mobile Home / Other | 15 (100.0%) | 0 (0.0%) |
| Total | 291 (100.0%) | 0 (0.0%) |
Housing Structures by Number of Rooms in New Jerusalem
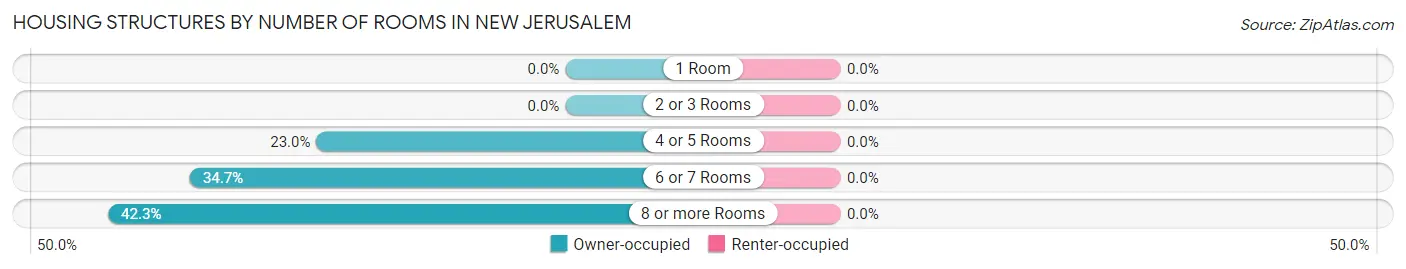
| Number of Rooms | Owner-occupied | Renter-occupied |
| 1 Room | 0 (0.0%) | 0 (0.0%) |
| 2 or 3 Rooms | 0 (0.0%) | 0 (0.0%) |
| 4 or 5 Rooms | 67 (23.0%) | 0 (0.0%) |
| 6 or 7 Rooms | 101 (34.7%) | 0 (0.0%) |
| 8 or more Rooms | 123 (42.3%) | 0 (0.0%) |
| Total | 291 (100.0%) | 0 (0.0%) |
Housing Structure by Heating Type in New Jerusalem
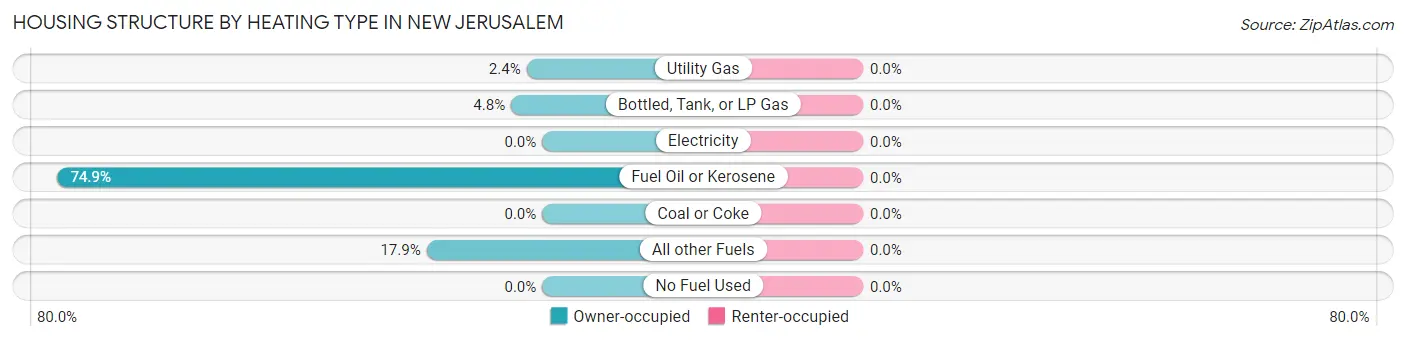
| Heating Type | Owner-occupied | Renter-occupied |
| Utility Gas | 7 (2.4%) | 0 (0.0%) |
| Bottled, Tank, or LP Gas | 14 (4.8%) | 0 (0.0%) |
| Electricity | 0 (0.0%) | 0 (0.0%) |
| Fuel Oil or Kerosene | 218 (74.9%) | 0 (0.0%) |
| Coal or Coke | 0 (0.0%) | 0 (0.0%) |
| All other Fuels | 52 (17.9%) | 0 (0.0%) |
| No Fuel Used | 0 (0.0%) | 0 (0.0%) |
| Total | 291 (100.0%) | 0 (0.0%) |
Household Vehicle Usage in New Jerusalem
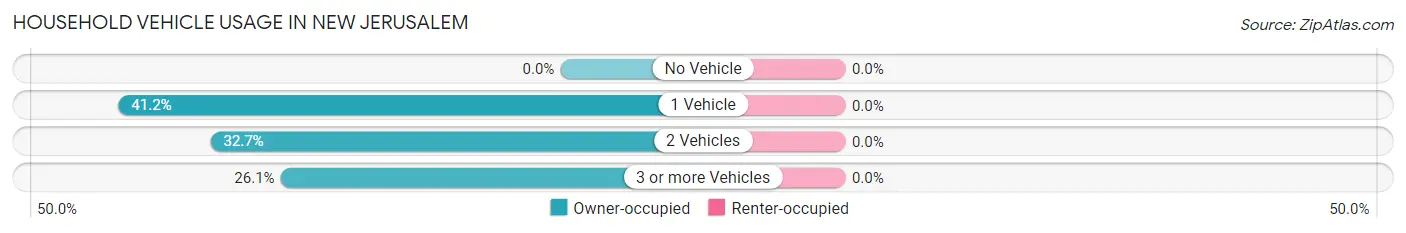
| Vehicles per Household | Owner-occupied | Renter-occupied |
| No Vehicle | 0 (0.0%) | 0 (0.0%) |
| 1 Vehicle | 120 (41.2%) | 0 (0.0%) |
| 2 Vehicles | 95 (32.7%) | 0 (0.0%) |
| 3 or more Vehicles | 76 (26.1%) | 0 (0.0%) |
| Total | 291 (100.0%) | 0 (0.0%) |
Real Estate & Mortgages in New Jerusalem
Real Estate and Mortgage Overview in New Jerusalem
| Characteristic | Without Mortgage | With Mortgage |
| Housing Units | 125 | 166 |
| Median Property Value | $196,100 | $289,000 |
| Median Household Income | $93,177 | $39 |
| Monthly Housing Costs | $570 | $0 |
| Real Estate Taxes | $3,693 | $0 |
Property Value by Mortgage Status in New Jerusalem
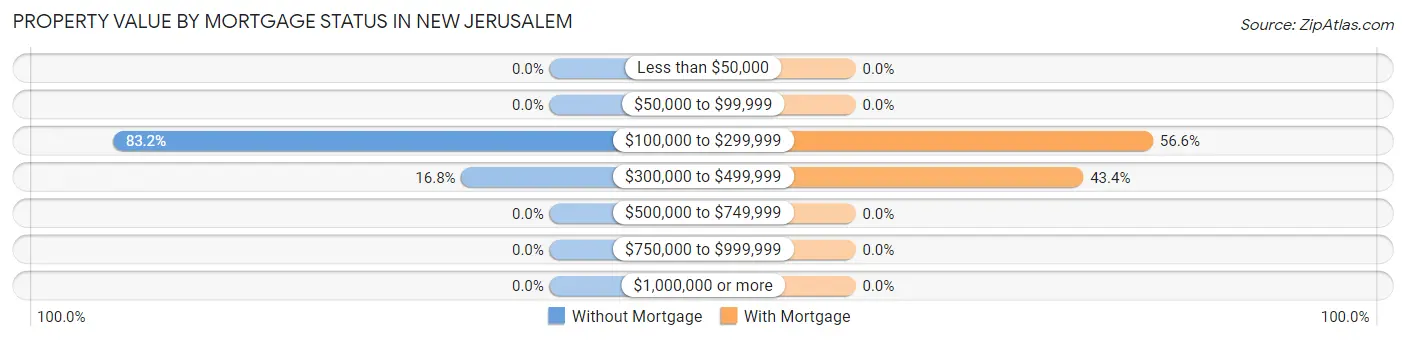
| Property Value | Without Mortgage | With Mortgage |
| Less than $50,000 | 0 (0.0%) | 0 (0.0%) |
| $50,000 to $99,999 | 0 (0.0%) | 0 (0.0%) |
| $100,000 to $299,999 | 104 (83.2%) | 94 (56.6%) |
| $300,000 to $499,999 | 21 (16.8%) | 72 (43.4%) |
| $500,000 to $749,999 | 0 (0.0%) | 0 (0.0%) |
| $750,000 to $999,999 | 0 (0.0%) | 0 (0.0%) |
| $1,000,000 or more | 0 (0.0%) | 0 (0.0%) |
| Total | 125 (100.0%) | 166 (100.0%) |
Household Income by Mortgage Status in New Jerusalem
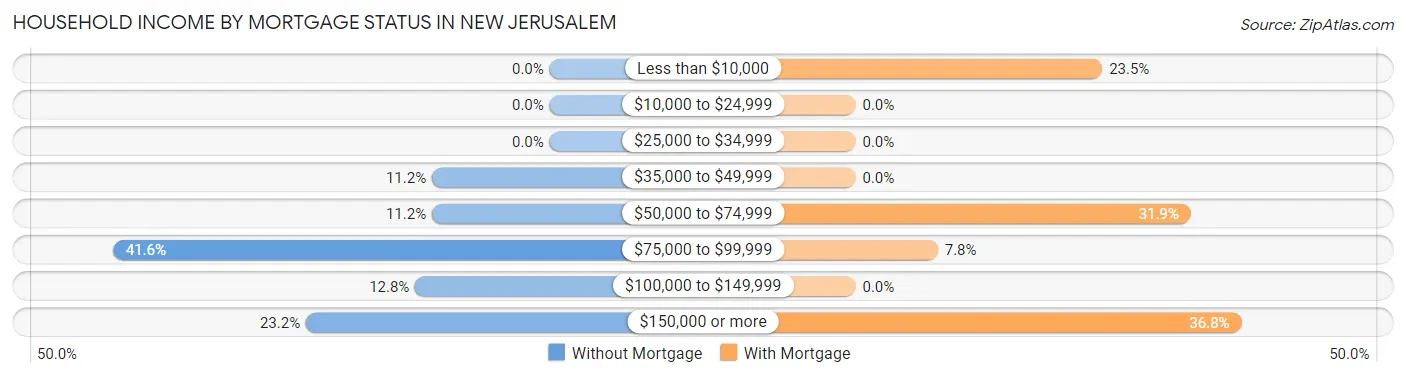
| Household Income | Without Mortgage | With Mortgage |
| Less than $10,000 | 0 (0.0%) | 39 (23.5%) |
| $10,000 to $24,999 | 0 (0.0%) | 0 (0.0%) |
| $25,000 to $34,999 | 0 (0.0%) | 0 (0.0%) |
| $35,000 to $49,999 | 14 (11.2%) | 0 (0.0%) |
| $50,000 to $74,999 | 14 (11.2%) | 53 (31.9%) |
| $75,000 to $99,999 | 52 (41.6%) | 13 (7.8%) |
| $100,000 to $149,999 | 16 (12.8%) | 0 (0.0%) |
| $150,000 or more | 29 (23.2%) | 61 (36.7%) |
| Total | 125 (100.0%) | 166 (100.0%) |
Property Value to Household Income Ratio in New Jerusalem
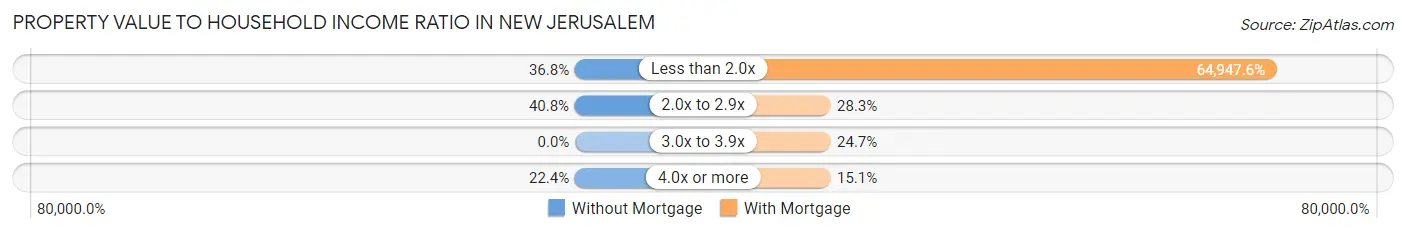
| Value-to-Income Ratio | Without Mortgage | With Mortgage |
| Less than 2.0x | 46 (36.8%) | 107,813 (64,947.6%) |
| 2.0x to 2.9x | 51 (40.8%) | 47 (28.3%) |
| 3.0x to 3.9x | 0 (0.0%) | 41 (24.7%) |
| 4.0x or more | 28 (22.4%) | 25 (15.1%) |
| Total | 125 (100.0%) | 166 (100.0%) |
Real Estate Taxes by Mortgage Status in New Jerusalem
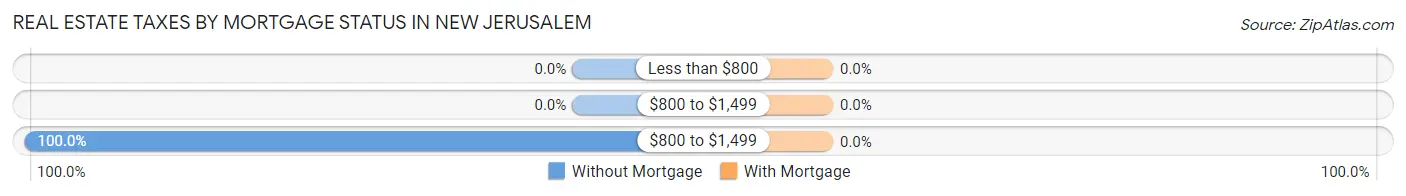
| Property Taxes | Without Mortgage | With Mortgage |
| Less than $800 | 0 (0.0%) | 0 (0.0%) |
| $800 to $1,499 | 0 (0.0%) | 0 (0.0%) |
| $800 to $1,499 | 125 (100.0%) | 0 (0.0%) |
| Total | 125 (100.0%) | 166 (100.0%) |
Health & Disability in New Jerusalem
Health Insurance Coverage by Age in New Jerusalem
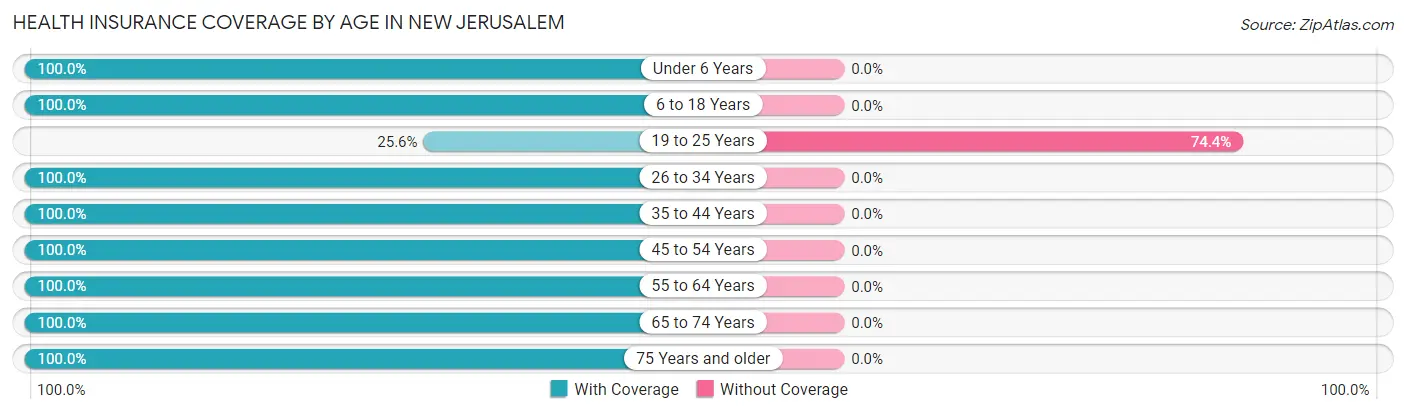
| Age Bracket | With Coverage | Without Coverage |
| Under 6 Years | 15 (100.0%) | 0 (0.0%) |
| 6 to 18 Years | 41 (100.0%) | 0 (0.0%) |
| 19 to 25 Years | 10 (25.6%) | 29 (74.4%) |
| 26 to 34 Years | 16 (100.0%) | 0 (0.0%) |
| 35 to 44 Years | 73 (100.0%) | 0 (0.0%) |
| 45 to 54 Years | 87 (100.0%) | 0 (0.0%) |
| 55 to 64 Years | 139 (100.0%) | 0 (0.0%) |
| 65 to 74 Years | 108 (100.0%) | 0 (0.0%) |
| 75 Years and older | 112 (100.0%) | 0 (0.0%) |
| Total | 601 (95.4%) | 29 (4.6%) |
Health Insurance Coverage by Citizenship Status in New Jerusalem
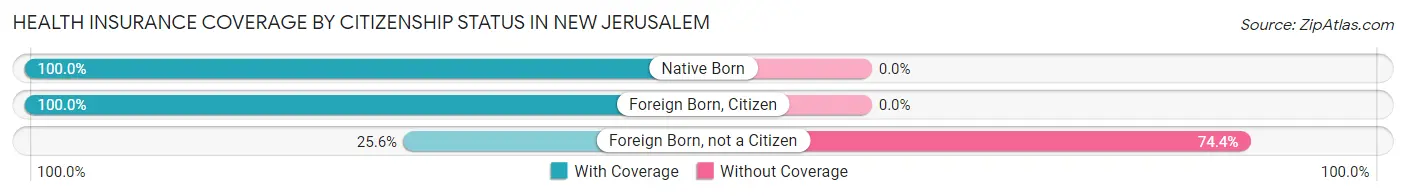
| Citizenship Status | With Coverage | Without Coverage |
| Native Born | 15 (100.0%) | 0 (0.0%) |
| Foreign Born, Citizen | 41 (100.0%) | 0 (0.0%) |
| Foreign Born, not a Citizen | 10 (25.6%) | 29 (74.4%) |
Health Insurance Coverage by Household Income in New Jerusalem
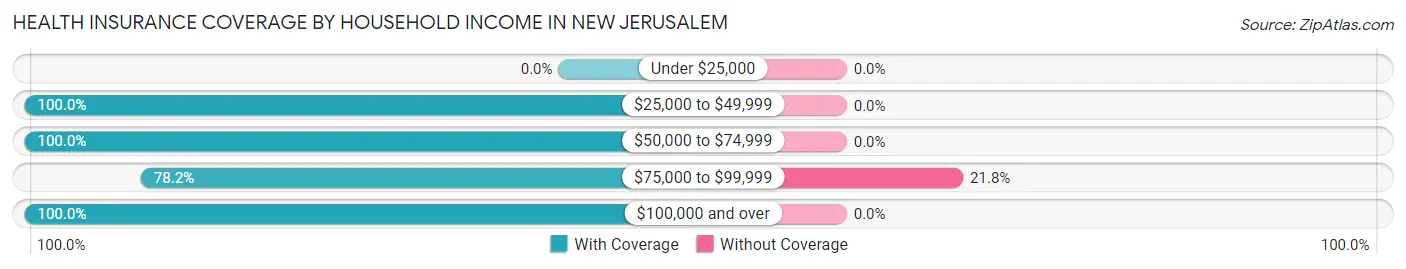
| Household Income | With Coverage | Without Coverage |
| Under $25,000 | 0 (0.0%) | 0 (0.0%) |
| $25,000 to $49,999 | 109 (100.0%) | 0 (0.0%) |
| $50,000 to $74,999 | 41 (100.0%) | 0 (0.0%) |
| $75,000 to $99,999 | 104 (78.2%) | 29 (21.8%) |
| $100,000 and over | 347 (100.0%) | 0 (0.0%) |
Public vs Private Health Insurance Coverage by Age in New Jerusalem
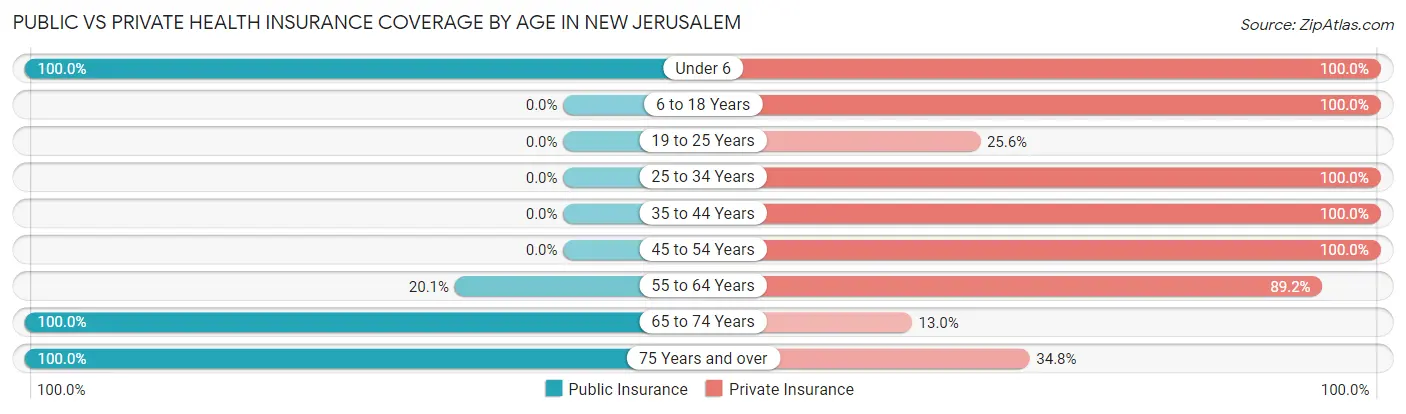
| Age Bracket | Public Insurance | Private Insurance |
| Under 6 | 15 (100.0%) | 15 (100.0%) |
| 6 to 18 Years | 0 (0.0%) | 41 (100.0%) |
| 19 to 25 Years | 0 (0.0%) | 10 (25.6%) |
| 25 to 34 Years | 0 (0.0%) | 16 (100.0%) |
| 35 to 44 Years | 0 (0.0%) | 73 (100.0%) |
| 45 to 54 Years | 0 (0.0%) | 87 (100.0%) |
| 55 to 64 Years | 28 (20.1%) | 124 (89.2%) |
| 65 to 74 Years | 108 (100.0%) | 14 (13.0%) |
| 75 Years and over | 112 (100.0%) | 39 (34.8%) |
| Total | 263 (41.7%) | 419 (66.5%) |
Disability Status by Sex by Age in New Jerusalem
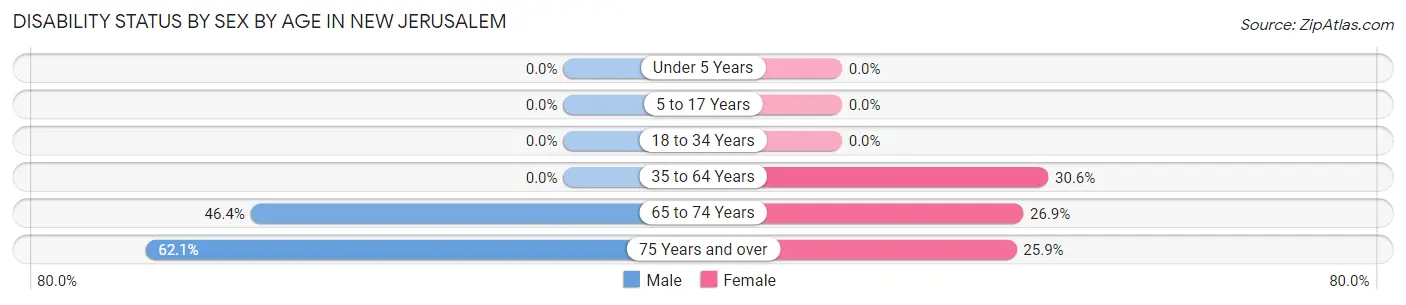
| Age Bracket | Male | Female |
| Under 5 Years | 0 (0.0%) | 0 (0.0%) |
| 5 to 17 Years | 0 (0.0%) | 0 (0.0%) |
| 18 to 34 Years | 0 (0.0%) | 0 (0.0%) |
| 35 to 64 Years | 0 (0.0%) | 53 (30.6%) |
| 65 to 74 Years | 26 (46.4%) | 14 (26.9%) |
| 75 Years and over | 36 (62.1%) | 14 (25.9%) |
Disability Class by Sex by Age in New Jerusalem
Disability Class: Hearing Difficulty
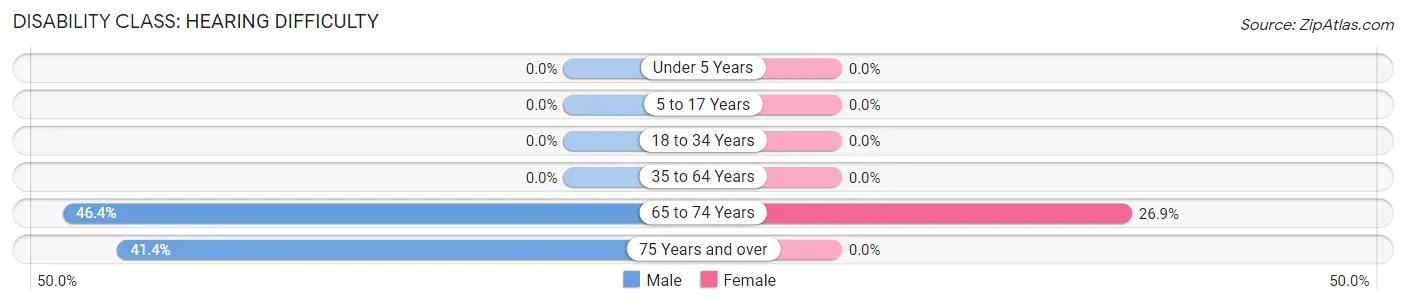
| Age Bracket | Male | Female |
| Under 5 Years | 0 (0.0%) | 0 (0.0%) |
| 5 to 17 Years | 0 (0.0%) | 0 (0.0%) |
| 18 to 34 Years | 0 (0.0%) | 0 (0.0%) |
| 35 to 64 Years | 0 (0.0%) | 0 (0.0%) |
| 65 to 74 Years | 26 (46.4%) | 14 (26.9%) |
| 75 Years and over | 24 (41.4%) | 0 (0.0%) |
Disability Class: Vision Difficulty
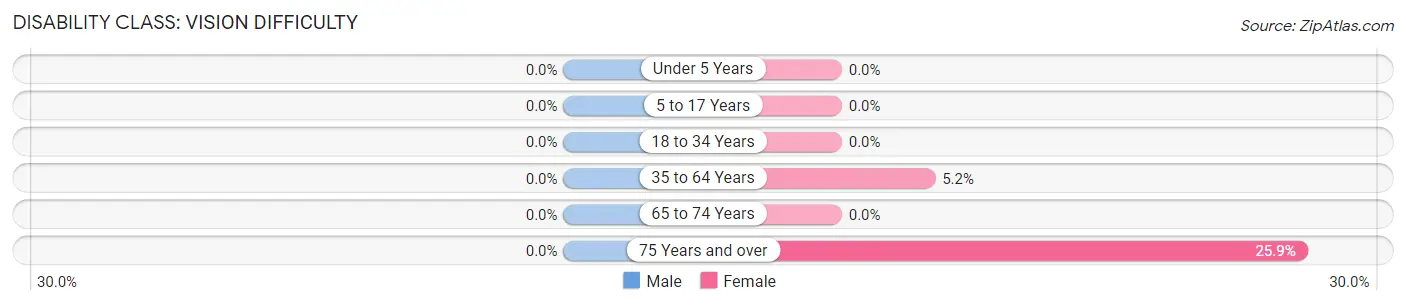
| Age Bracket | Male | Female |
| Under 5 Years | 0 (0.0%) | 0 (0.0%) |
| 5 to 17 Years | 0 (0.0%) | 0 (0.0%) |
| 18 to 34 Years | 0 (0.0%) | 0 (0.0%) |
| 35 to 64 Years | 0 (0.0%) | 9 (5.2%) |
| 65 to 74 Years | 0 (0.0%) | 0 (0.0%) |
| 75 Years and over | 0 (0.0%) | 14 (25.9%) |
Disability Class: Cognitive Difficulty

| Age Bracket | Male | Female |
| 5 to 17 Years | 0 (0.0%) | 0 (0.0%) |
| 18 to 34 Years | 0 (0.0%) | 0 (0.0%) |
| 35 to 64 Years | 0 (0.0%) | 0 (0.0%) |
| 65 to 74 Years | 0 (0.0%) | 0 (0.0%) |
| 75 Years and over | 12 (20.7%) | 0 (0.0%) |
Disability Class: Ambulatory Difficulty
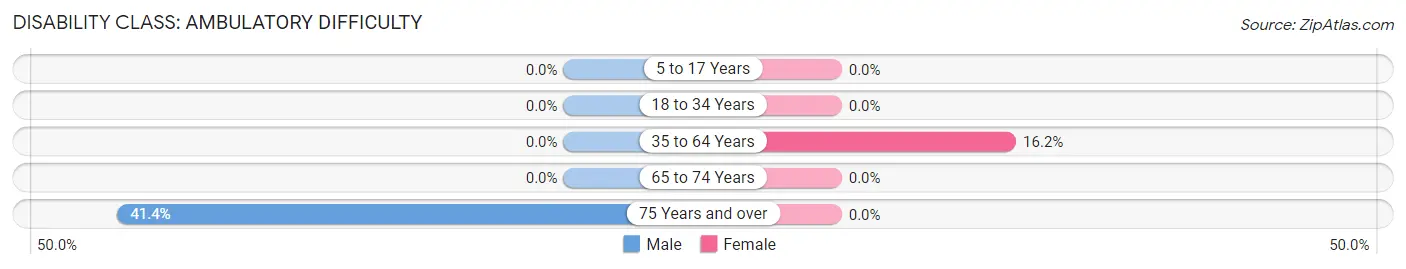
| Age Bracket | Male | Female |
| 5 to 17 Years | 0 (0.0%) | 0 (0.0%) |
| 18 to 34 Years | 0 (0.0%) | 0 (0.0%) |
| 35 to 64 Years | 0 (0.0%) | 28 (16.2%) |
| 65 to 74 Years | 0 (0.0%) | 0 (0.0%) |
| 75 Years and over | 24 (41.4%) | 0 (0.0%) |
Disability Class: Self-Care Difficulty
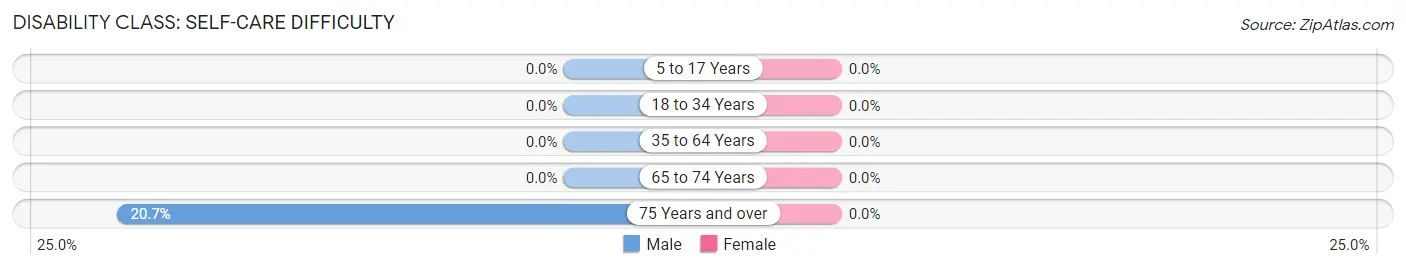
| Age Bracket | Male | Female |
| 5 to 17 Years | 0 (0.0%) | 0 (0.0%) |
| 18 to 34 Years | 0 (0.0%) | 0 (0.0%) |
| 35 to 64 Years | 0 (0.0%) | 0 (0.0%) |
| 65 to 74 Years | 0 (0.0%) | 0 (0.0%) |
| 75 Years and over | 12 (20.7%) | 0 (0.0%) |
Technology Access in New Jerusalem
Computing Device Access in New Jerusalem
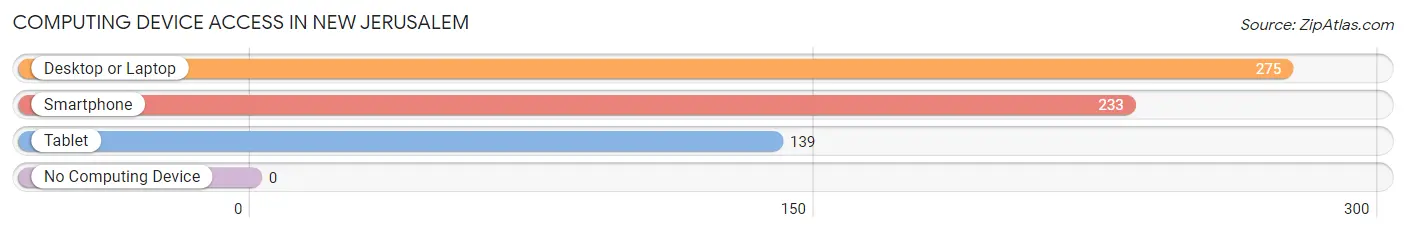
| Device Type | # Households | % Households |
| Desktop or Laptop | 275 | 94.5% |
| Smartphone | 233 | 80.1% |
| Tablet | 139 | 47.8% |
| No Computing Device | 0 | 0.0% |
| Total | 291 | 100.0% |
Internet Access in New Jerusalem
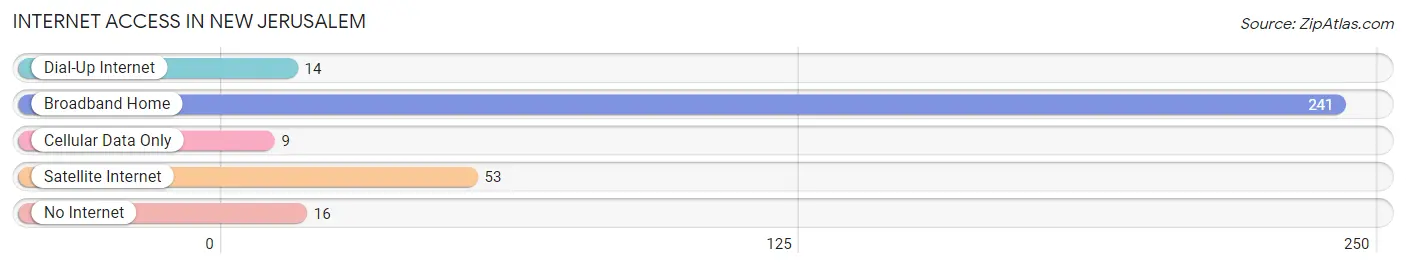
| Internet Type | # Households | % Households |
| Dial-Up Internet | 14 | 4.8% |
| Broadband Home | 241 | 82.8% |
| Cellular Data Only | 9 | 3.1% |
| Satellite Internet | 53 | 18.2% |
| No Internet | 16 | 5.5% |
| Total | 291 | 100.0% |
New Jerusalem Summary
New Jerusalem, Pennsylvania is a small borough located in the southeastern corner of Lancaster County. It is situated in the heart of Pennsylvania Dutch Country, and is surrounded by rolling hills and farmland. The borough was founded in 1845 by a group of Mennonites who had recently immigrated from Germany. The town was named after the New Jerusalem mentioned in the Bible, and the Mennonites hoped to create a community that was based on their religious beliefs.
Geography
New Jerusalem is located in the southeastern corner of Lancaster County, Pennsylvania. It is situated in the heart of Pennsylvania Dutch Country, and is surrounded by rolling hills and farmland. The borough is located approximately 10 miles east of the city of Lancaster, and is bordered by the townships of East Lampeter, West Lampeter, and Earl. The borough is situated on a small hill, and is surrounded by a number of small streams and creeks. The total area of the borough is 0.3 square miles, and the population was estimated to be 545 in 2020.
Economy
The economy of New Jerusalem is largely based on agriculture. The borough is surrounded by farmland, and many of the residents are involved in farming and related activities. The town also has a number of small businesses, including a grocery store, a hardware store, and a few restaurants. In addition, there are a number of small manufacturing businesses located in the borough.
Demographics
As of the 2010 census, the population of New Jerusalem was 545. The racial makeup of the borough was 97.3% White, 0.7% African American, 0.2% Native American, 0.2% Asian, 0.2% from other races, and 1.6% from two or more races. Hispanic or Latino of any race were 0.7% of the population.
The median income for a household in the borough was $45,833, and the median income for a family was $50,000. The per capita income for the borough was $20,845. About 4.3% of families and 5.2% of the population were below the poverty line, including 6.3% of those under age 18 and none of those age 65 or over.
Conclusion
New Jerusalem, Pennsylvania is a small borough located in the southeastern corner of Lancaster County. It is situated in the heart of Pennsylvania Dutch Country, and is surrounded by rolling hills and farmland. The borough was founded in 1845 by a group of Mennonites who had recently immigrated from Germany. The economy of New Jerusalem is largely based on agriculture, and the town also has a number of small businesses. The population of the borough was estimated to be 545 in 2020, and the racial makeup of the borough was 97.3% White, 0.7% African American, 0.2% Native American, 0.2% Asian, 0.2% from other races, and 1.6% from two or more races. The median income for a household in the borough was $45,833, and the median income for a family was $50,000. New Jerusalem is a small, rural community that is steeped in history and tradition.
Common Questions
What is Per Capita Income in New Jerusalem?
Per Capita income in New Jerusalem is $54,838.
What is the Median Family Income in New Jerusalem?
Median Family Income in New Jerusalem is $104,500.
What is the Median Household income in New Jerusalem?
Median Household Income in New Jerusalem is $94,948.
What is Income or Wage Gap in New Jerusalem?
Income or Wage Gap in New Jerusalem is 15.6%.
Women in New Jerusalem earn 84.4 cents for every dollar earned by a man.
What is Inequality or Gini Index in New Jerusalem?
Inequality or Gini Index in New Jerusalem is 0.35.
What is the Total Population of New Jerusalem?
Total Population of New Jerusalem is 630.
What is the Total Male Population of New Jerusalem?
Total Male Population of New Jerusalem is 318.
What is the Total Female Population of New Jerusalem?
Total Female Population of New Jerusalem is 312.
What is the Ratio of Males per 100 Females in New Jerusalem?
There are 101.92 Males per 100 Females in New Jerusalem.
What is the Ratio of Females per 100 Males in New Jerusalem?
There are 98.11 Females per 100 Males in New Jerusalem.
What is the Median Population Age in New Jerusalem?
Median Population Age in New Jerusalem is 60.4 Years.
What is the Average Family Size in New Jerusalem
Average Family Size in New Jerusalem is 2.5 People.
What is the Average Household Size in New Jerusalem
Average Household Size in New Jerusalem is 2.2 People.
How Large is the Labor Force in New Jerusalem?
There are 373 People in the Labor Forcein in New Jerusalem.
What is the Percentage of People in the Labor Force in New Jerusalem?
64.0% of People are in the Labor Force in New Jerusalem.