Zip Codes with the Highest Percentage of Population Employed in Health Diagnosing & Treating in Warren, OH
RELATED REPORTS & OPTIONS
Health Diagnosing & Treating
Warren
Compare Zip Codes
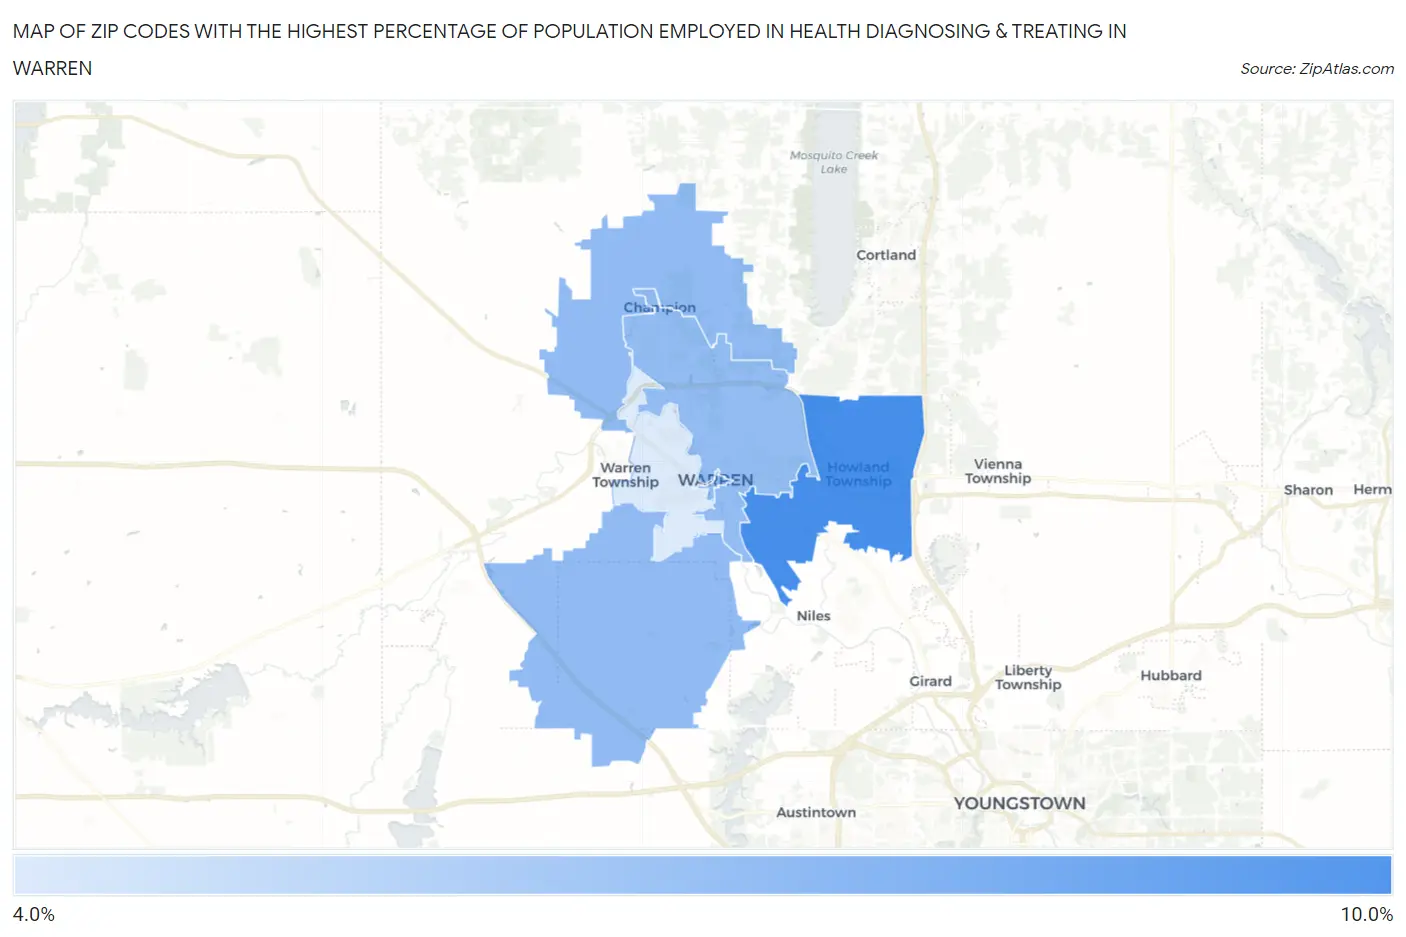
Map of Zip Codes with the Highest Percentage of Population Employed in Health Diagnosing & Treating in Warren
4.8%
9.1%
Zip Codes with the Highest Percentage of Population Employed in Health Diagnosing & Treating in Warren, OH
| Zip Code | % Employed | vs State | vs National | |
| 1. | 44484 | 9.1% | 7.2%(+2.00)#225 | 6.2%(+2.90)#5,107 |
| 2. | 44481 | 7.0% | 7.2%(-0.123)#470 | 6.2%(+0.784)#10,273 |
| 3. | 44483 | 7.0% | 7.2%(-0.181)#479 | 6.2%(+0.726)#10,447 |
| 4. | 44485 | 4.8% | 7.2%(-2.30)#771 | 6.2%(-1.40)#18,300 |
1
Common Questions
What are the Top 3 Zip Codes with the Highest Percentage of Population Employed in Health Diagnosing & Treating in Warren, OH?
Top 3 Zip Codes with the Highest Percentage of Population Employed in Health Diagnosing & Treating in Warren, OH are:
What zip code has the Highest Percentage of Population Employed in Health Diagnosing & Treating in Warren, OH?
44484 has the Highest Percentage of Population Employed in Health Diagnosing & Treating in Warren, OH with 9.1%.
What is the Percentage of Population Employed in Health Diagnosing & Treating in Warren, OH?
Percentage of Population Employed in Health Diagnosing & Treating in Warren is 6.5%.
What is the Percentage of Population Employed in Health Diagnosing & Treating in Ohio?
Percentage of Population Employed in Health Diagnosing & Treating in Ohio is 7.2%.
What is the Percentage of Population Employed in Health Diagnosing & Treating in the United States?
Percentage of Population Employed in Health Diagnosing & Treating in the United States is 6.2%.