Zip Codes with the Highest Percentage of Population Employed in Health Diagnosing & Treating in Canton, OH
RELATED REPORTS & OPTIONS
Health Diagnosing & Treating
Canton
Compare Zip Codes
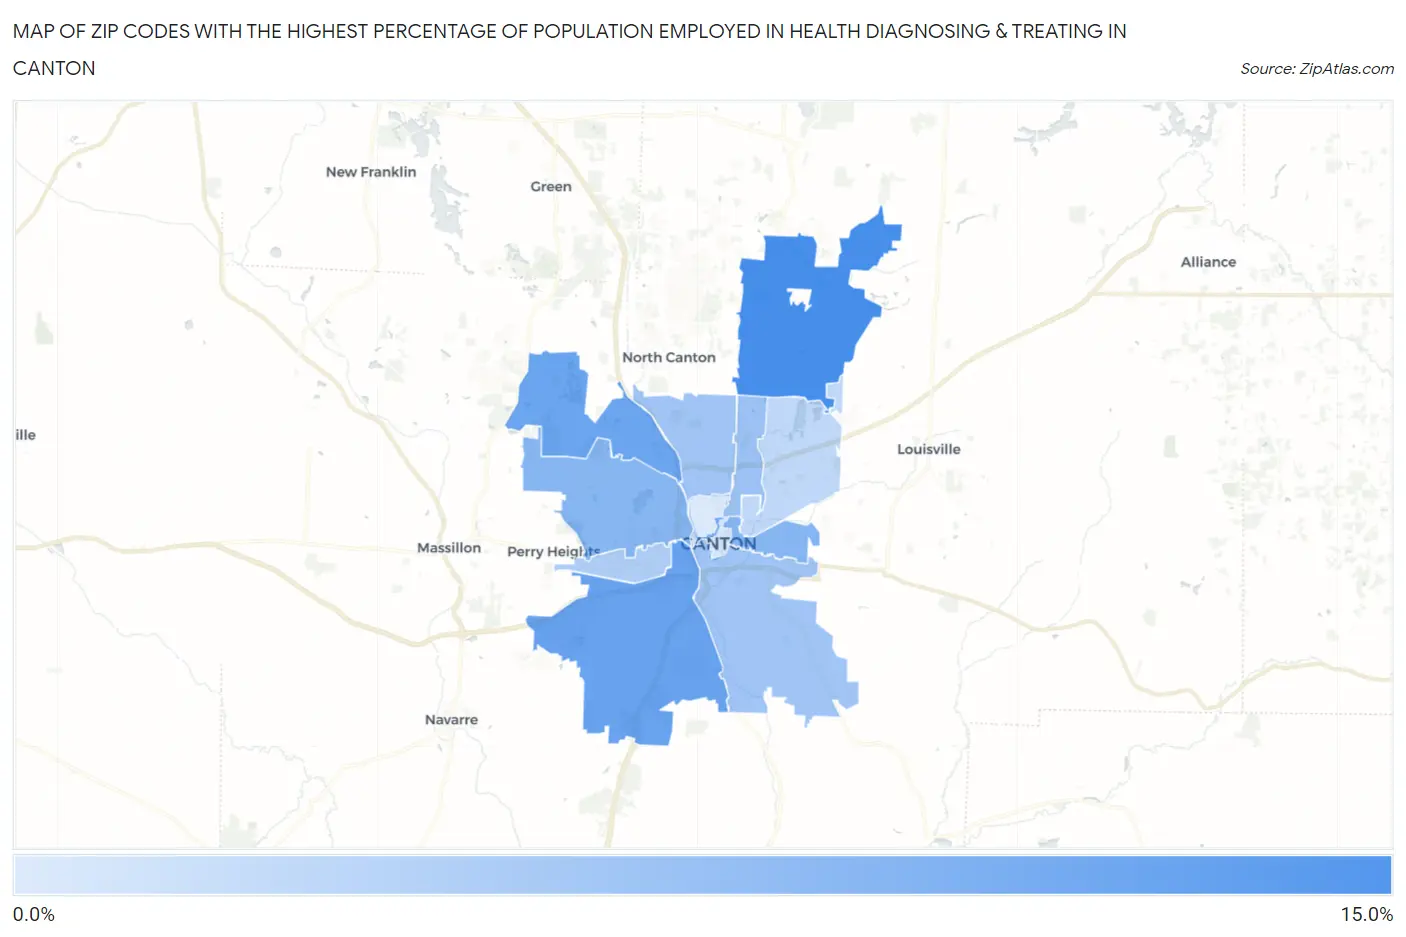
Map of Zip Codes with the Highest Percentage of Population Employed in Health Diagnosing & Treating in Canton
2.5%
10.5%
Zip Codes with the Highest Percentage of Population Employed in Health Diagnosing & Treating in Canton, OH
| Zip Code | % Employed | vs State | vs National | |
| 1. | 44721 | 10.5% | 7.2%(+3.40)#136 | 6.2%(+4.30)#3,263 |
| 2. | 44706 | 8.7% | 7.2%(+1.57)#261 | 6.2%(+2.48)#5,879 |
| 3. | 44718 | 8.5% | 7.2%(+1.35)#286 | 6.2%(+2.25)#6,336 |
| 4. | 44704 | 7.1% | 7.2%(-0.031)#449 | 6.2%(+0.876)#9,963 |
| 5. | 44708 | 7.1% | 7.2%(-0.100)#467 | 6.2%(+0.807)#10,189 |
| 6. | 44714 | 6.0% | 7.2%(-1.11)#605 | 6.2%(-0.199)#13,707 |
| 7. | 44709 | 5.7% | 7.2%(-1.50)#659 | 6.2%(-0.590)#15,160 |
| 8. | 44707 | 5.6% | 7.2%(-1.53)#665 | 6.2%(-0.624)#15,313 |
| 9. | 44710 | 4.9% | 7.2%(-2.26)#766 | 6.2%(-1.35)#18,140 |
| 10. | 44705 | 4.1% | 7.2%(-3.09)#881 | 6.2%(-2.18)#21,172 |
| 11. | 44702 | 2.9% | 7.2%(-4.21)#976 | 6.2%(-3.30)#24,465 |
| 12. | 44703 | 2.5% | 7.2%(-4.68)#1,016 | 6.2%(-3.77)#25,584 |
1
Common Questions
What are the Top 10 Zip Codes with the Highest Percentage of Population Employed in Health Diagnosing & Treating in Canton, OH?
Top 10 Zip Codes with the Highest Percentage of Population Employed in Health Diagnosing & Treating in Canton, OH are:
What zip code has the Highest Percentage of Population Employed in Health Diagnosing & Treating in Canton, OH?
44721 has the Highest Percentage of Population Employed in Health Diagnosing & Treating in Canton, OH with 10.5%.
What is the Percentage of Population Employed in Health Diagnosing & Treating in Canton, OH?
Percentage of Population Employed in Health Diagnosing & Treating in Canton is 5.1%.
What is the Percentage of Population Employed in Health Diagnosing & Treating in Ohio?
Percentage of Population Employed in Health Diagnosing & Treating in Ohio is 7.2%.
What is the Percentage of Population Employed in Health Diagnosing & Treating in the United States?
Percentage of Population Employed in Health Diagnosing & Treating in the United States is 6.2%.