Zip Codes with the Highest Percentage of Population Employed in Health Diagnosing & Treating in Cincinnati, OH
RELATED REPORTS & OPTIONS
Health Diagnosing & Treating
Cincinnati
Compare Zip Codes
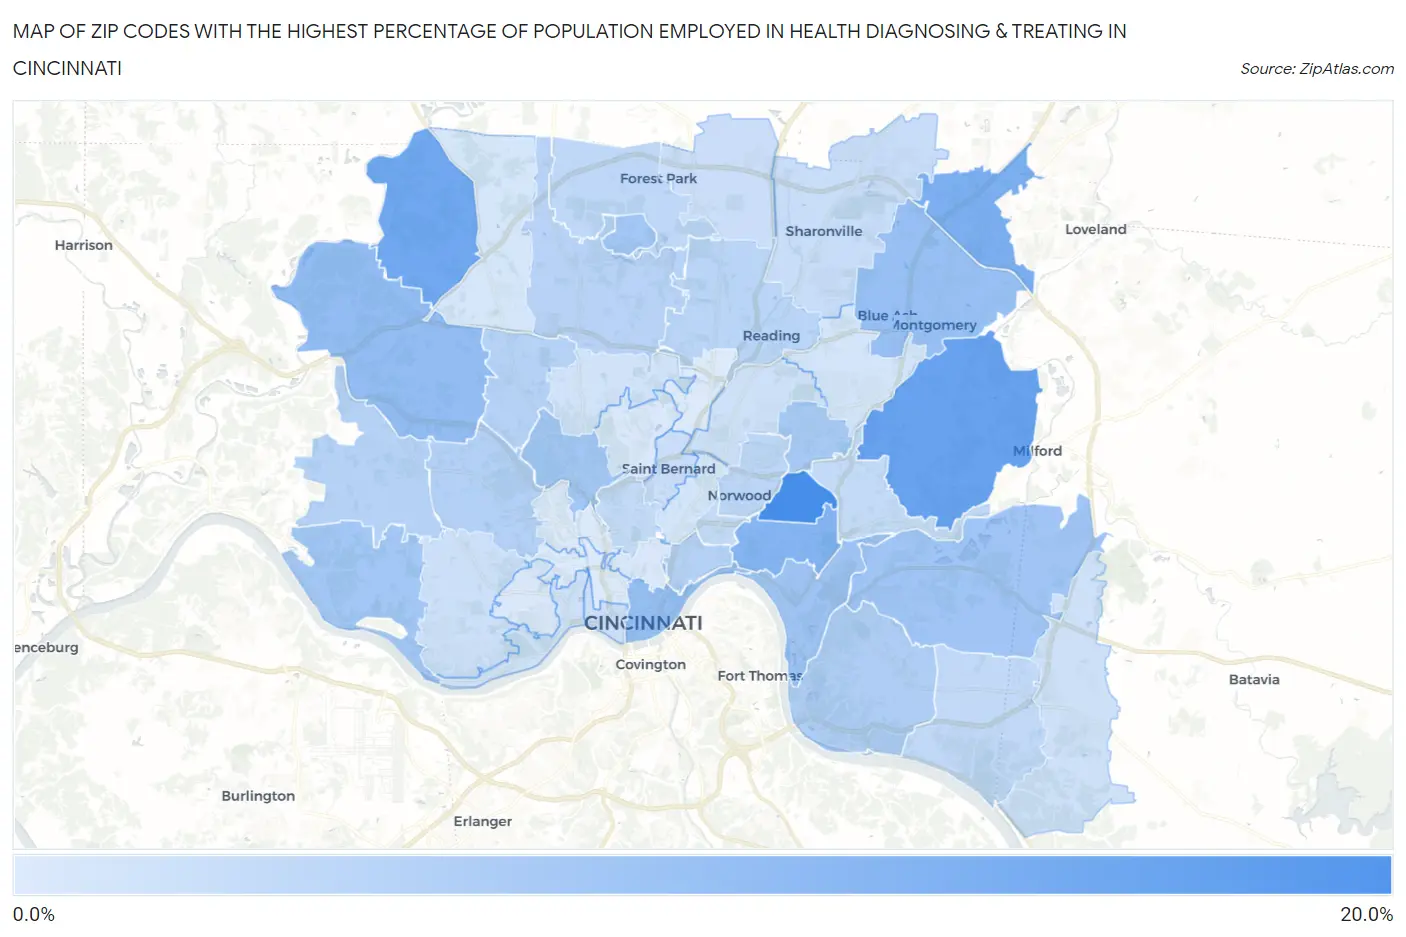
Map of Zip Codes with the Highest Percentage of Population Employed in Health Diagnosing & Treating in Cincinnati
4.3%
17.9%
Zip Codes with the Highest Percentage of Population Employed in Health Diagnosing & Treating in Cincinnati, OH
| Zip Code | % Employed | vs State | vs National | |
| 1. | 45209 | 17.9% | 7.2%(+10.8)#27 | 6.2%(+11.7)#714 |
| 2. | 45243 | 14.9% | 7.2%(+7.80)#44 | 6.2%(+8.71)#1,168 |
| 3. | 45252 | 13.9% | 7.2%(+6.76)#52 | 6.2%(+7.67)#1,432 |
| 4. | 45249 | 12.8% | 7.2%(+5.68)#66 | 6.2%(+6.58)#1,817 |
| 5. | 45208 | 12.0% | 7.2%(+4.87)#86 | 6.2%(+5.78)#2,217 |
| 6. | 45247 | 10.9% | 7.2%(+3.74)#123 | 6.2%(+4.65)#2,965 |
| 7. | 45202 | 10.7% | 7.2%(+3.56)#130 | 6.2%(+4.47)#3,133 |
| 8. | 45242 | 10.5% | 7.2%(+3.36)#139 | 6.2%(+4.26)#3,303 |
| 9. | 45226 | 9.6% | 7.2%(+2.49)#185 | 6.2%(+3.40)#4,337 |
| 10. | 45244 | 9.5% | 7.2%(+2.34)#197 | 6.2%(+3.25)#4,557 |
| 11. | 45233 | 9.4% | 7.2%(+2.27)#201 | 6.2%(+3.18)#4,651 |
| 12. | 45223 | 9.3% | 7.2%(+2.15)#208 | 6.2%(+3.05)#4,864 |
| 13. | 45218 | 9.3% | 7.2%(+2.13)#211 | 6.2%(+3.04)#4,890 |
| 14. | 45213 | 8.9% | 7.2%(+1.79)#243 | 6.2%(+2.70)#5,461 |
| 15. | 45230 | 8.4% | 7.2%(+1.29)#291 | 6.2%(+2.20)#6,449 |
| 16. | 45211 | 7.9% | 7.2%(+0.735)#347 | 6.2%(+1.64)#7,791 |
| 17. | 45248 | 7.7% | 7.2%(+0.514)#374 | 6.2%(+1.42)#8,331 |
| 18. | 45206 | 7.6% | 7.2%(+0.490)#376 | 6.2%(+1.40)#8,403 |
| 19. | 45239 | 7.6% | 7.2%(+0.489)#377 | 6.2%(+1.40)#8,408 |
| 20. | 45231 | 7.5% | 7.2%(+0.320)#397 | 6.2%(+1.23)#8,901 |
| 21. | 45215 | 7.4% | 7.2%(+0.201)#418 | 6.2%(+1.11)#9,247 |
| 22. | 45212 | 7.2% | 7.2%(+0.007)#447 | 6.2%(+0.914)#9,842 |
| 23. | 45240 | 7.0% | 7.2%(-0.164)#475 | 6.2%(+0.743)#10,388 |
| 24. | 45255 | 6.8% | 7.2%(-0.384)#509 | 6.2%(+0.523)#11,098 |
| 25. | 45227 | 6.5% | 7.2%(-0.687)#544 | 6.2%(+0.220)#12,146 |
| 26. | 45220 | 6.5% | 7.2%(-0.698)#547 | 6.2%(+0.209)#12,183 |
| 27. | 45207 | 6.4% | 7.2%(-0.723)#552 | 6.2%(+0.184)#12,280 |
| 28. | 45241 | 6.1% | 7.2%(-1.01)#594 | 6.2%(-0.108)#13,382 |
| 29. | 45217 | 6.0% | 7.2%(-1.14)#611 | 6.2%(-0.230)#13,822 |
| 30. | 45203 | 6.0% | 7.2%(-1.14)#612 | 6.2%(-0.234)#13,831 |
| 31. | 45246 | 5.9% | 7.2%(-1.25)#629 | 6.2%(-0.342)#14,210 |
| 32. | 45238 | 5.8% | 7.2%(-1.39)#648 | 6.2%(-0.488)#14,764 |
| 33. | 45204 | 5.6% | 7.2%(-1.53)#664 | 6.2%(-0.623)#15,308 |
| 34. | 45245 | 5.4% | 7.2%(-1.70)#685 | 6.2%(-0.795)#15,971 |
| 35. | 45237 | 5.4% | 7.2%(-1.71)#686 | 6.2%(-0.803)#16,003 |
| 36. | 45224 | 5.4% | 7.2%(-1.76)#696 | 6.2%(-0.854)#16,209 |
| 37. | 45236 | 5.2% | 7.2%(-1.94)#717 | 6.2%(-1.03)#16,888 |
| 38. | 45229 | 5.1% | 7.2%(-2.02)#728 | 6.2%(-1.11)#17,185 |
| 39. | 45251 | 4.9% | 7.2%(-2.23)#759 | 6.2%(-1.32)#17,991 |
| 40. | 45205 | 4.6% | 7.2%(-2.55)#807 | 6.2%(-1.65)#19,270 |
| 41. | 45232 | 4.6% | 7.2%(-2.56)#808 | 6.2%(-1.65)#19,279 |
| 42. | 45219 | 4.4% | 7.2%(-2.71)#832 | 6.2%(-1.81)#19,867 |
| 43. | 45214 | 4.4% | 7.2%(-2.77)#841 | 6.2%(-1.87)#20,063 |
| 44. | 45225 | 4.4% | 7.2%(-2.79)#843 | 6.2%(-1.88)#20,106 |
| 45. | 45216 | 4.3% | 7.2%(-2.81)#845 | 6.2%(-1.91)#20,210 |
1
Common Questions
What are the Top 10 Zip Codes with the Highest Percentage of Population Employed in Health Diagnosing & Treating in Cincinnati, OH?
Top 10 Zip Codes with the Highest Percentage of Population Employed in Health Diagnosing & Treating in Cincinnati, OH are:
What zip code has the Highest Percentage of Population Employed in Health Diagnosing & Treating in Cincinnati, OH?
45209 has the Highest Percentage of Population Employed in Health Diagnosing & Treating in Cincinnati, OH with 17.9%.
What is the Percentage of Population Employed in Health Diagnosing & Treating in Cincinnati, OH?
Percentage of Population Employed in Health Diagnosing & Treating in Cincinnati is 7.1%.
What is the Percentage of Population Employed in Health Diagnosing & Treating in Ohio?
Percentage of Population Employed in Health Diagnosing & Treating in Ohio is 7.2%.
What is the Percentage of Population Employed in Health Diagnosing & Treating in the United States?
Percentage of Population Employed in Health Diagnosing & Treating in the United States is 6.2%.