Hanover, OH Map & Demographics
Hanover Map
Hanover Overview
$35,680
PER CAPITA INCOME
$110,022
AVG FAMILY INCOME
$83,750
AVG HOUSEHOLD INCOME
29.8%
WAGE / INCOME GAP [ % ]
70.2¢/ $1
WAGE / INCOME GAP [ $ ]
0.32
INEQUALITY / GINI INDEX
1,123
TOTAL POPULATION
580
MALE POPULATION
543
FEMALE POPULATION
106.81
MALES / 100 FEMALES
93.62
FEMALES / 100 MALES
40.2
MEDIAN AGE
3.0
AVG FAMILY SIZE
2.6
AVG HOUSEHOLD SIZE
522
LABOR FORCE [ PEOPLE ]
60.6%
PERCENT IN LABOR FORCE
2.1%
UNEMPLOYMENT RATE
Hanover Area Codes
Income in Hanover
Income Overview in Hanover
Per Capita Income in Hanover is $35,680, while median incomes of families and households are $110,022 and $83,750 respectively.
| Characteristic | Number | Measure |
| Per Capita Income | 1,123 | $35,680 |
| Median Family Income | 317 | $110,022 |
| Mean Family Income | 317 | $105,085 |
| Median Household Income | 427 | $83,750 |
| Mean Household Income | 427 | $92,982 |
| Income Deficit | 317 | $0 |
| Wage / Income Gap (%) | 1,123 | 29.78% |
| Wage / Income Gap ($) | 1,123 | 70.22¢ per $1 |
| Gini / Inequality Index | 1,123 | 0.32 |
Earnings by Sex in Hanover
Average Earnings in Hanover are $51,034, $58,333 for men and $40,962 for women, a difference of 29.8%.
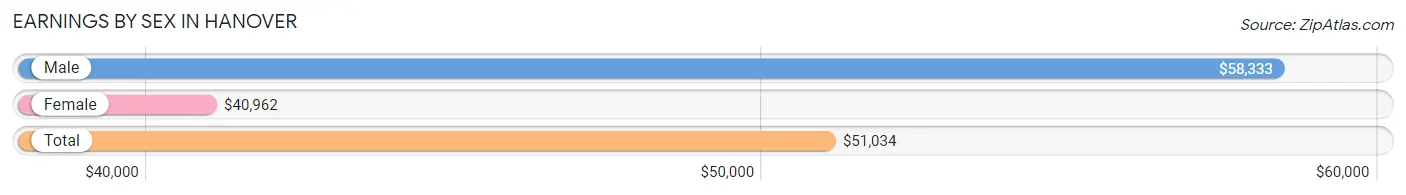
| Sex | Number | Average Earnings |
| Male | 258 (48.7%) | $58,333 |
| Female | 272 (51.3%) | $40,962 |
| Total | 530 (100.0%) | $51,034 |
Earnings by Sex by Income Bracket in Hanover
The most common earnings brackets in Hanover are $75,000 to $99,999 for men (44 | 17.1%) and $75,000 to $99,999 for women (75 | 27.6%).
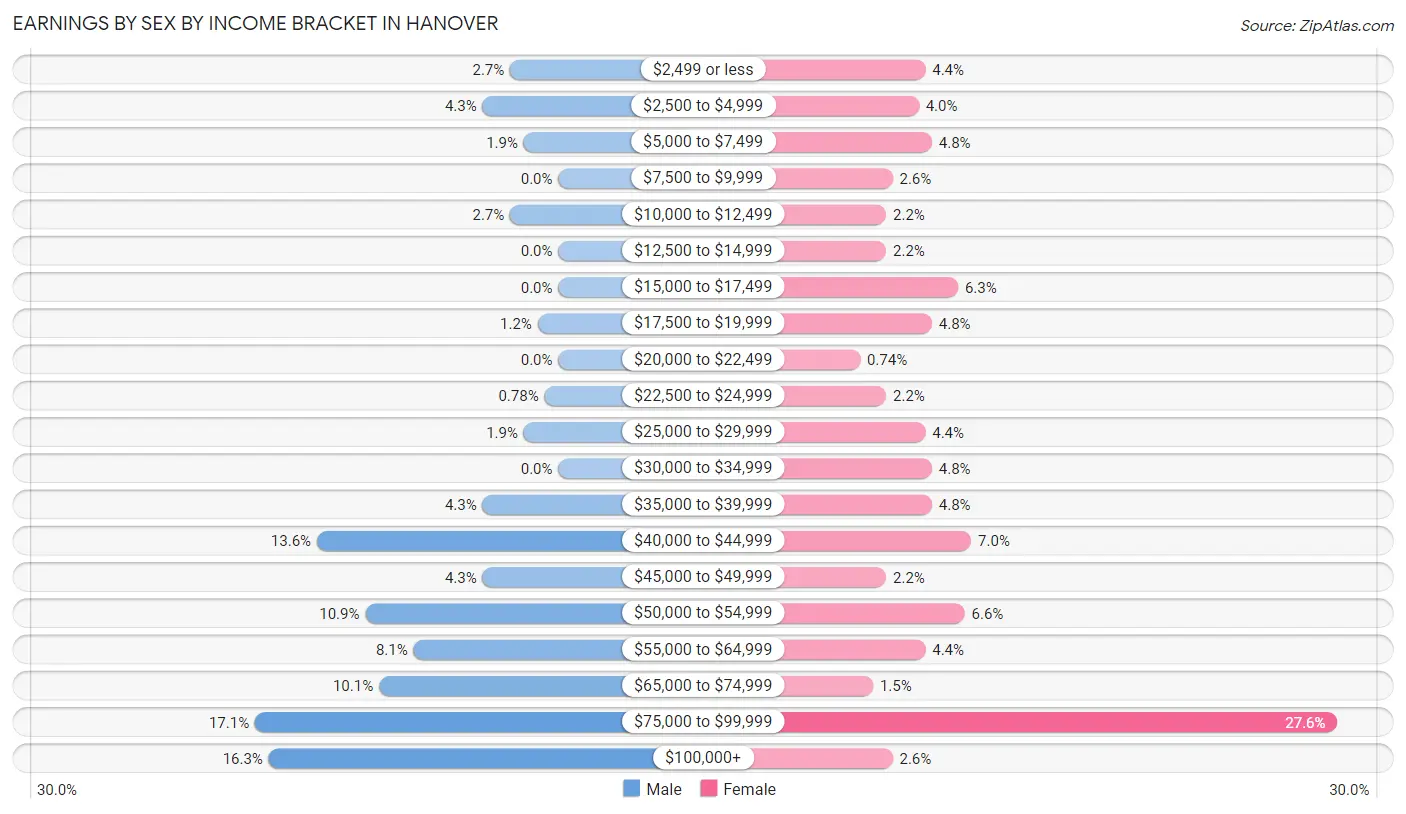
| Income | Male | Female |
| $2,499 or less | 7 (2.7%) | 12 (4.4%) |
| $2,500 to $4,999 | 11 (4.3%) | 11 (4.0%) |
| $5,000 to $7,499 | 5 (1.9%) | 13 (4.8%) |
| $7,500 to $9,999 | 0 (0.0%) | 7 (2.6%) |
| $10,000 to $12,499 | 7 (2.7%) | 6 (2.2%) |
| $12,500 to $14,999 | 0 (0.0%) | 6 (2.2%) |
| $15,000 to $17,499 | 0 (0.0%) | 17 (6.2%) |
| $17,500 to $19,999 | 3 (1.2%) | 13 (4.8%) |
| $20,000 to $22,499 | 0 (0.0%) | 2 (0.7%) |
| $22,500 to $24,999 | 2 (0.8%) | 6 (2.2%) |
| $25,000 to $29,999 | 5 (1.9%) | 12 (4.4%) |
| $30,000 to $34,999 | 0 (0.0%) | 13 (4.8%) |
| $35,000 to $39,999 | 11 (4.3%) | 13 (4.8%) |
| $40,000 to $44,999 | 35 (13.6%) | 19 (7.0%) |
| $45,000 to $49,999 | 11 (4.3%) | 6 (2.2%) |
| $50,000 to $54,999 | 28 (10.8%) | 18 (6.6%) |
| $55,000 to $64,999 | 21 (8.1%) | 12 (4.4%) |
| $65,000 to $74,999 | 26 (10.1%) | 4 (1.5%) |
| $75,000 to $99,999 | 44 (17.1%) | 75 (27.6%) |
| $100,000+ | 42 (16.3%) | 7 (2.6%) |
| Total | 258 (100.0%) | 272 (100.0%) |
Earnings by Sex by Educational Attainment in Hanover
Average earnings in Hanover are $64,028 for men and $43,750 for women, a difference of 31.7%. Men with an educational attainment of graduate degree enjoy the highest average annual earnings of $109,107, while those with high school diploma education earn the least with $46,250. Women with an educational attainment of graduate degree earn the most with the average annual earnings of $78,750, while those with high school diploma education have the smallest earnings of $25,938.
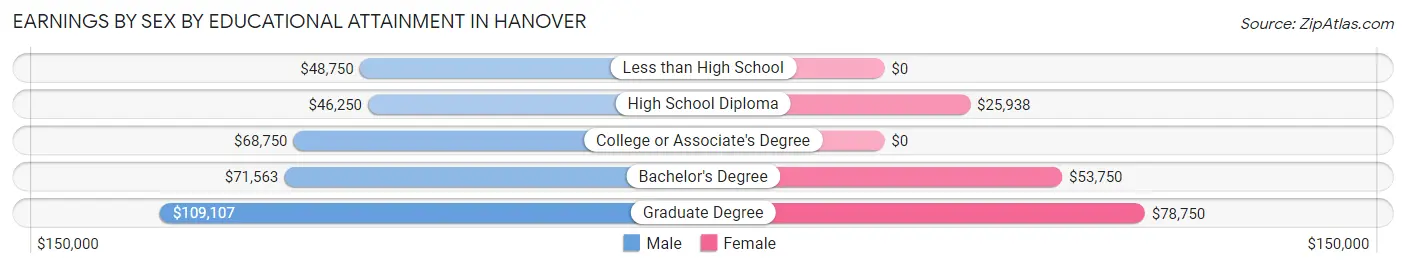
| Educational Attainment | Male Income | Female Income |
| Less than High School | $48,750 | $0 |
| High School Diploma | $46,250 | $25,938 |
| College or Associate's Degree | $68,750 | $0 |
| Bachelor's Degree | $71,563 | $53,750 |
| Graduate Degree | $109,107 | $78,750 |
| Total | $64,028 | $43,750 |
Family Income in Hanover
Family Income Brackets in Hanover
According to the Hanover family income data, there are 102 families falling into the $100,000 to $149,999 income range, which is the most common income bracket and makes up 32.2% of all families.
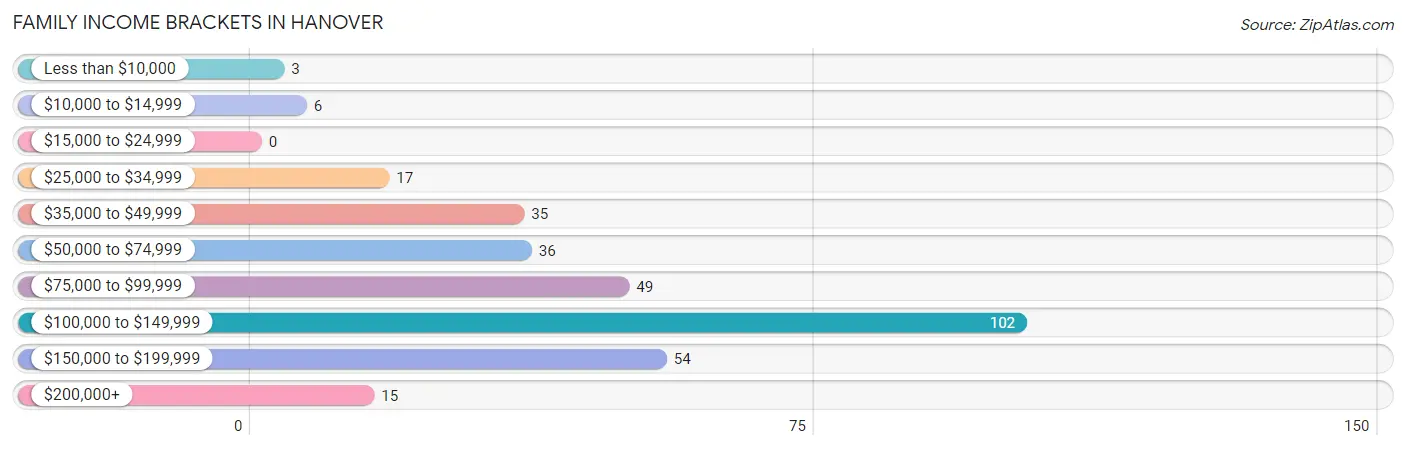
| Income Bracket | # Families | % Families |
| Less than $10,000 | 3 | 0.9% |
| $10,000 to $14,999 | 6 | 1.9% |
| $15,000 to $24,999 | 0 | 0.0% |
| $25,000 to $34,999 | 17 | 5.4% |
| $35,000 to $49,999 | 35 | 11.0% |
| $50,000 to $74,999 | 36 | 11.4% |
| $75,000 to $99,999 | 49 | 15.5% |
| $100,000 to $149,999 | 102 | 32.2% |
| $150,000 to $199,999 | 54 | 17.0% |
| $200,000+ | 15 | 4.7% |
Family Income by Famaliy Size in Hanover
4-person families (43 | 13.6%) account for the highest median family income in Hanover with $133,958 per family, while 2-person families (163 | 51.4%) have the highest median income of $55,081 per family member.
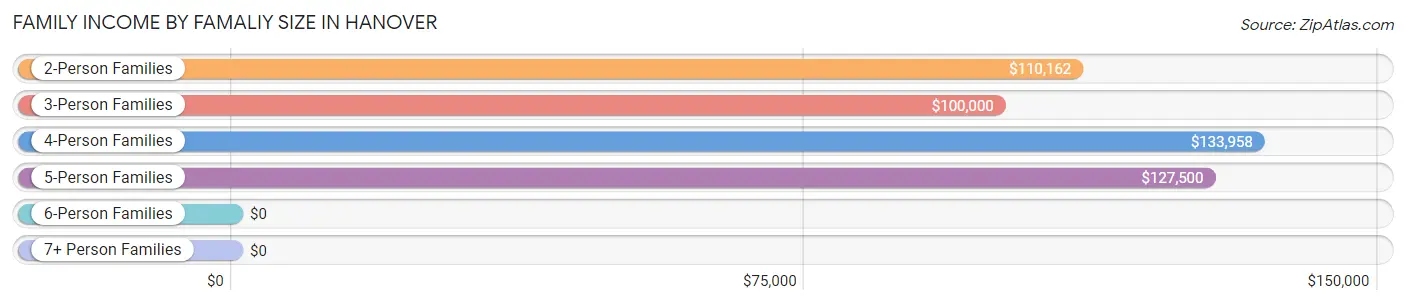
| Income Bracket | # Families | Median Income |
| 2-Person Families | 163 (51.4%) | $110,162 |
| 3-Person Families | 68 (21.4%) | $100,000 |
| 4-Person Families | 43 (13.6%) | $133,958 |
| 5-Person Families | 28 (8.8%) | $127,500 |
| 6-Person Families | 6 (1.9%) | $0 |
| 7+ Person Families | 9 (2.8%) | $0 |
| Total | 317 (100.0%) | $110,022 |
Family Income by Number of Earners in Hanover
The median family income in Hanover is $110,022, with families comprising 3+ earners (28) having the highest median family income of $157,500, while families with no earners (66) have the lowest median family income of $48,750, accounting for 8.8% and 20.8% of families, respectively.
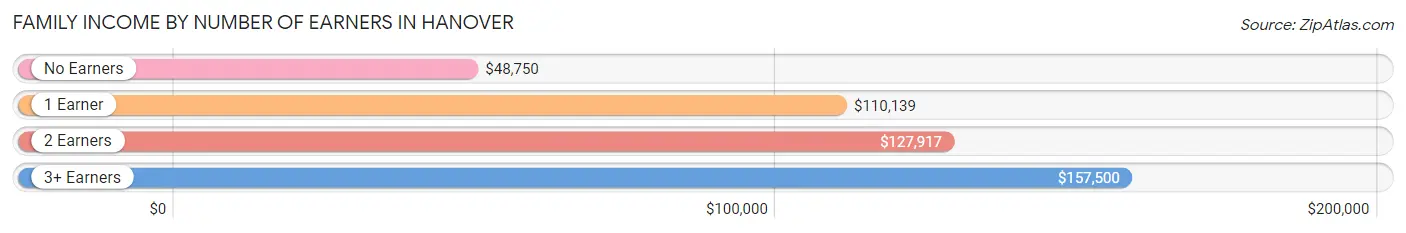
| Number of Earners | # Families | Median Income |
| No Earners | 66 (20.8%) | $48,750 |
| 1 Earner | 116 (36.6%) | $110,139 |
| 2 Earners | 107 (33.8%) | $127,917 |
| 3+ Earners | 28 (8.8%) | $157,500 |
| Total | 317 (100.0%) | $110,022 |
Household Income in Hanover
Household Income Brackets in Hanover
With 110 households falling in the category, the $100,000 to $149,999 income range is the most frequent in Hanover, accounting for 25.8% of all households. In contrast, only 5 households (1.2%) fall into the less than $10,000 income bracket, making it the least populous group.
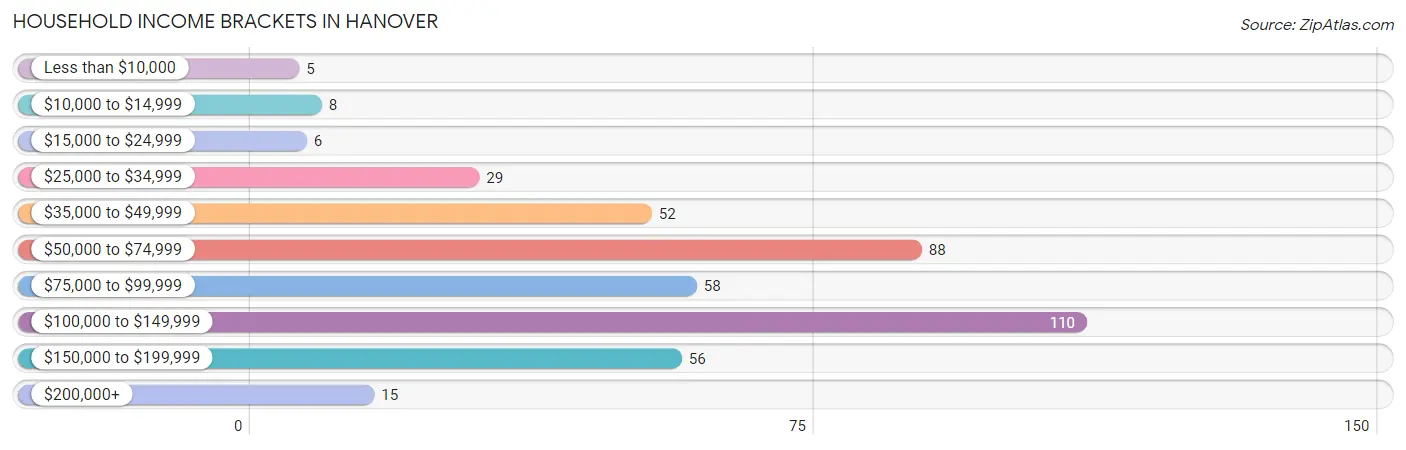
| Income Bracket | # Households | % Households |
| Less than $10,000 | 5 | 1.2% |
| $10,000 to $14,999 | 8 | 1.9% |
| $15,000 to $24,999 | 6 | 1.4% |
| $25,000 to $34,999 | 29 | 6.8% |
| $35,000 to $49,999 | 52 | 12.2% |
| $50,000 to $74,999 | 88 | 20.6% |
| $75,000 to $99,999 | 58 | 13.6% |
| $100,000 to $149,999 | 110 | 25.8% |
| $150,000 to $199,999 | 56 | 13.1% |
| $200,000+ | 15 | 3.5% |
Household Income by Householder Age in Hanover
The median household income in Hanover is $83,750, with the highest median household income of $111,027 found in the 45 to 64 years age bracket for the primary householder. A total of 154 households (36.1%) fall into this category. Meanwhile, the 15 to 24 years age bracket for the primary householder has the lowest median household income of $0, with 4 households (0.9%) in this group.
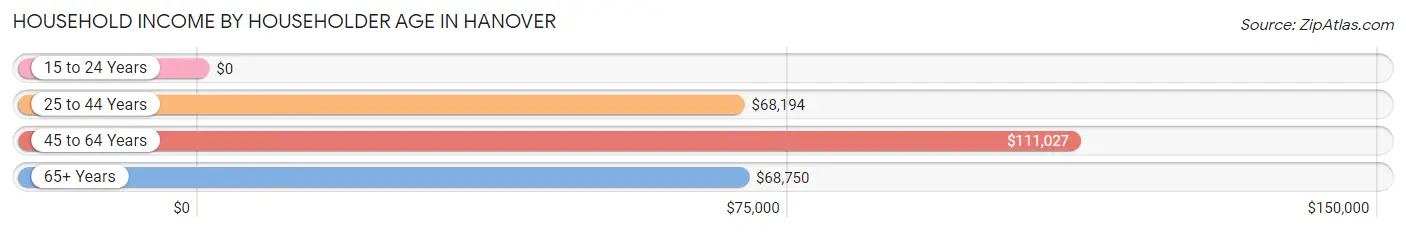
| Income Bracket | # Households | Median Income |
| 15 to 24 Years | 4 (0.9%) | $0 |
| 25 to 44 Years | 143 (33.5%) | $68,194 |
| 45 to 64 Years | 154 (36.1%) | $111,027 |
| 65+ Years | 126 (29.5%) | $68,750 |
| Total | 427 (100.0%) | $83,750 |
Poverty in Hanover
Income Below Poverty by Sex and Age in Hanover
With 5.2% poverty level for males and 5.0% for females among the residents of Hanover, 6 to 11 year old males and 18 to 24 year old females are the most vulnerable to poverty, with 18 males (33.3%) and 5 females (19.2%) in their respective age groups living below the poverty level.
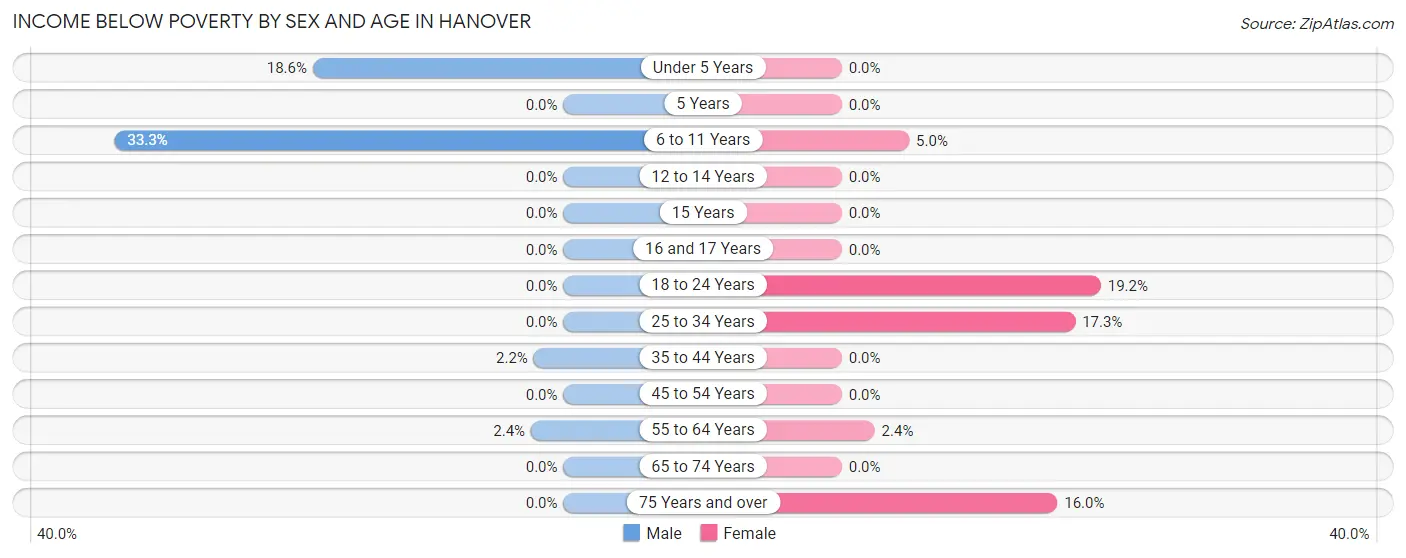
| Age Bracket | Male | Female |
| Under 5 Years | 8 (18.6%) | 0 (0.0%) |
| 5 Years | 0 (0.0%) | 0 (0.0%) |
| 6 to 11 Years | 18 (33.3%) | 3 (5.0%) |
| 12 to 14 Years | 0 (0.0%) | 0 (0.0%) |
| 15 Years | 0 (0.0%) | 0 (0.0%) |
| 16 and 17 Years | 0 (0.0%) | 0 (0.0%) |
| 18 to 24 Years | 0 (0.0%) | 5 (19.2%) |
| 25 to 34 Years | 0 (0.0%) | 13 (17.3%) |
| 35 to 44 Years | 2 (2.2%) | 0 (0.0%) |
| 45 to 54 Years | 0 (0.0%) | 0 (0.0%) |
| 55 to 64 Years | 2 (2.4%) | 1 (2.4%) |
| 65 to 74 Years | 0 (0.0%) | 0 (0.0%) |
| 75 Years and over | 0 (0.0%) | 4 (16.0%) |
| Total | 30 (5.2%) | 26 (5.0%) |
Income Above Poverty by Sex and Age in Hanover
According to the poverty statistics in Hanover, males aged 5 years and females aged under 5 years are the age groups that are most secure financially, with 100.0% of males and 100.0% of females in these age groups living above the poverty line.
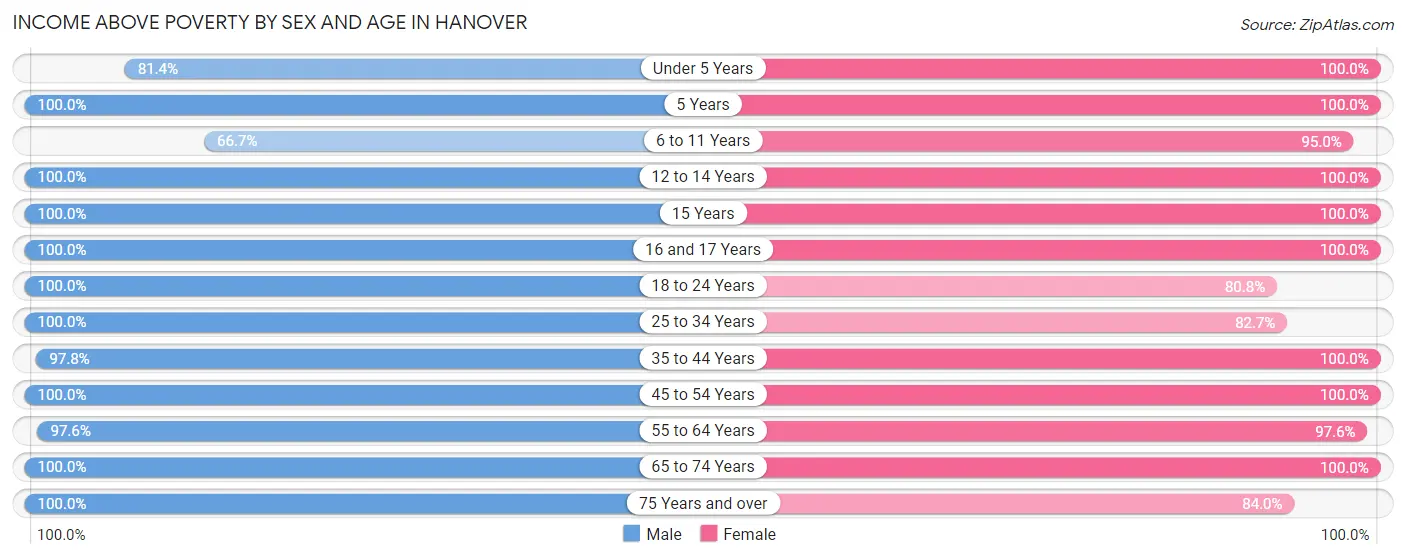
| Age Bracket | Male | Female |
| Under 5 Years | 35 (81.4%) | 32 (100.0%) |
| 5 Years | 4 (100.0%) | 7 (100.0%) |
| 6 to 11 Years | 36 (66.7%) | 57 (95.0%) |
| 12 to 14 Years | 15 (100.0%) | 12 (100.0%) |
| 15 Years | 10 (100.0%) | 6 (100.0%) |
| 16 and 17 Years | 2 (100.0%) | 6 (100.0%) |
| 18 to 24 Years | 40 (100.0%) | 21 (80.8%) |
| 25 to 34 Years | 77 (100.0%) | 62 (82.7%) |
| 35 to 44 Years | 89 (97.8%) | 57 (100.0%) |
| 45 to 54 Years | 54 (100.0%) | 97 (100.0%) |
| 55 to 64 Years | 81 (97.6%) | 40 (97.6%) |
| 65 to 74 Years | 79 (100.0%) | 81 (100.0%) |
| 75 Years and over | 28 (100.0%) | 21 (84.0%) |
| Total | 550 (94.8%) | 499 (95.1%) |
Income Below Poverty Among Married-Couple Families in Hanover
The poverty statistics for married-couple families in Hanover show that 0.4% or 1 of the total 289 families live below the poverty line. Families with no children have the highest poverty rate of 0.5%, comprising of 1 families. On the other hand, families with 1 or 2 children have the lowest poverty rate of 0.0%, which includes 0 families.
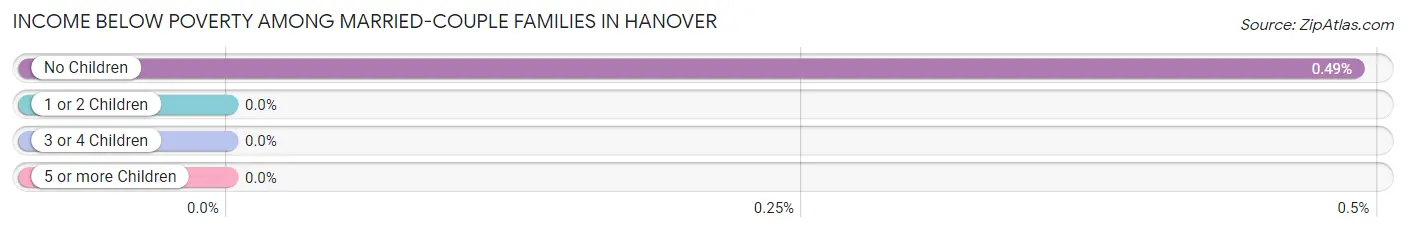
| Children | Above Poverty | Below Poverty |
| No Children | 202 (99.5%) | 1 (0.5%) |
| 1 or 2 Children | 59 (100.0%) | 0 (0.0%) |
| 3 or 4 Children | 18 (100.0%) | 0 (0.0%) |
| 5 or more Children | 9 (100.0%) | 0 (0.0%) |
| Total | 288 (99.7%) | 1 (0.4%) |
Income Below Poverty Among Single-Parent Households in Hanover
According to the poverty data in Hanover, 22.2% or 2 single-father households and 31.6% or 6 single-mother households are living below the poverty line. Among single-father households, those with 3 or 4 children have the highest poverty rate, with 2 households (100.0%) experiencing poverty. Likewise, among single-mother households, those with 3 or 4 children have the highest poverty rate, with 6 households (100.0%) falling below the poverty line.
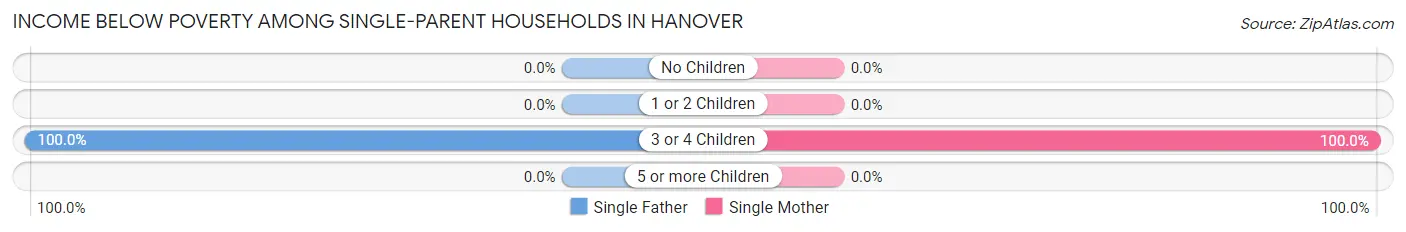
| Children | Single Father | Single Mother |
| No Children | 0 (0.0%) | 0 (0.0%) |
| 1 or 2 Children | 0 (0.0%) | 0 (0.0%) |
| 3 or 4 Children | 2 (100.0%) | 6 (100.0%) |
| 5 or more Children | 0 (0.0%) | 0 (0.0%) |
| Total | 2 (22.2%) | 6 (31.6%) |
Income Below Poverty Among Married-Couple vs Single-Parent Households in Hanover
The poverty data for Hanover shows that 1 of the married-couple family households (0.4%) and 8 of the single-parent households (28.6%) are living below the poverty level. Within the married-couple family households, those with no children have the highest poverty rate, with 1 households (0.5%) falling below the poverty line. Among the single-parent households, those with 3 or 4 children have the highest poverty rate, with 8 household (100.0%) living below poverty.
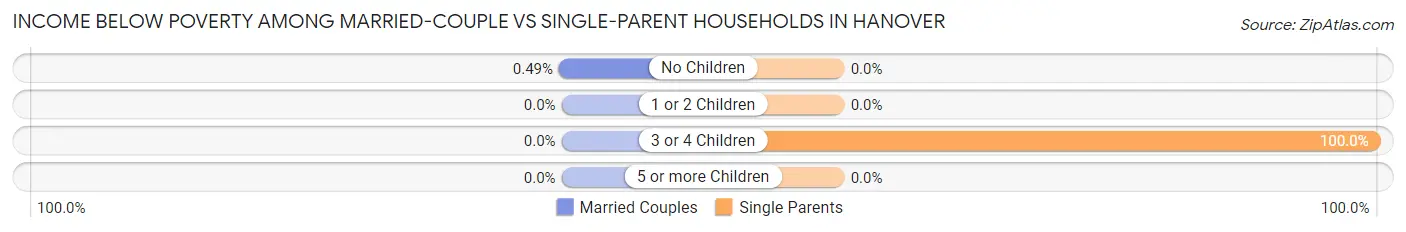
| Children | Married-Couple Families | Single-Parent Households |
| No Children | 1 (0.5%) | 0 (0.0%) |
| 1 or 2 Children | 0 (0.0%) | 0 (0.0%) |
| 3 or 4 Children | 0 (0.0%) | 8 (100.0%) |
| 5 or more Children | 0 (0.0%) | 0 (0.0%) |
| Total | 1 (0.4%) | 8 (28.6%) |
Race in Hanover
The most populous races in Hanover are White / Caucasian (1,091 | 97.2%), Two or more Races (21 | 1.9%), and Hispanic or Latino (10 | 0.9%).
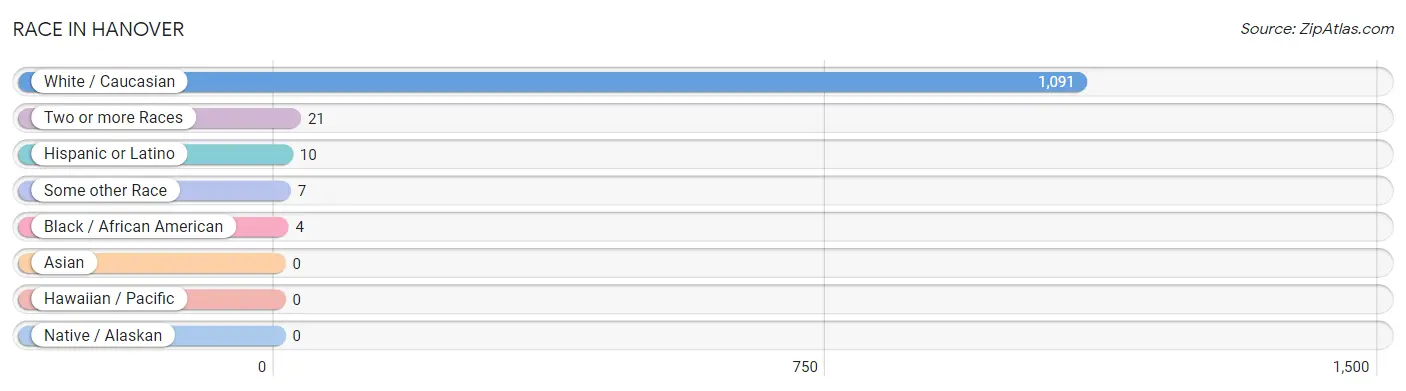
| Race | # Population | % Population |
| Asian | 0 | 0.0% |
| Black / African American | 4 | 0.4% |
| Hawaiian / Pacific | 0 | 0.0% |
| Hispanic or Latino | 10 | 0.9% |
| Native / Alaskan | 0 | 0.0% |
| White / Caucasian | 1,091 | 97.2% |
| Two or more Races | 21 | 1.9% |
| Some other Race | 7 | 0.6% |
| Total | 1,123 | 100.0% |
Ancestry in Hanover
The most populous ancestries reported in Hanover are German (283 | 25.2%), Irish (153 | 13.6%), English (137 | 12.2%), American (81 | 7.2%), and Italian (48 | 4.3%), together accounting for 62.5% of all Hanover residents.
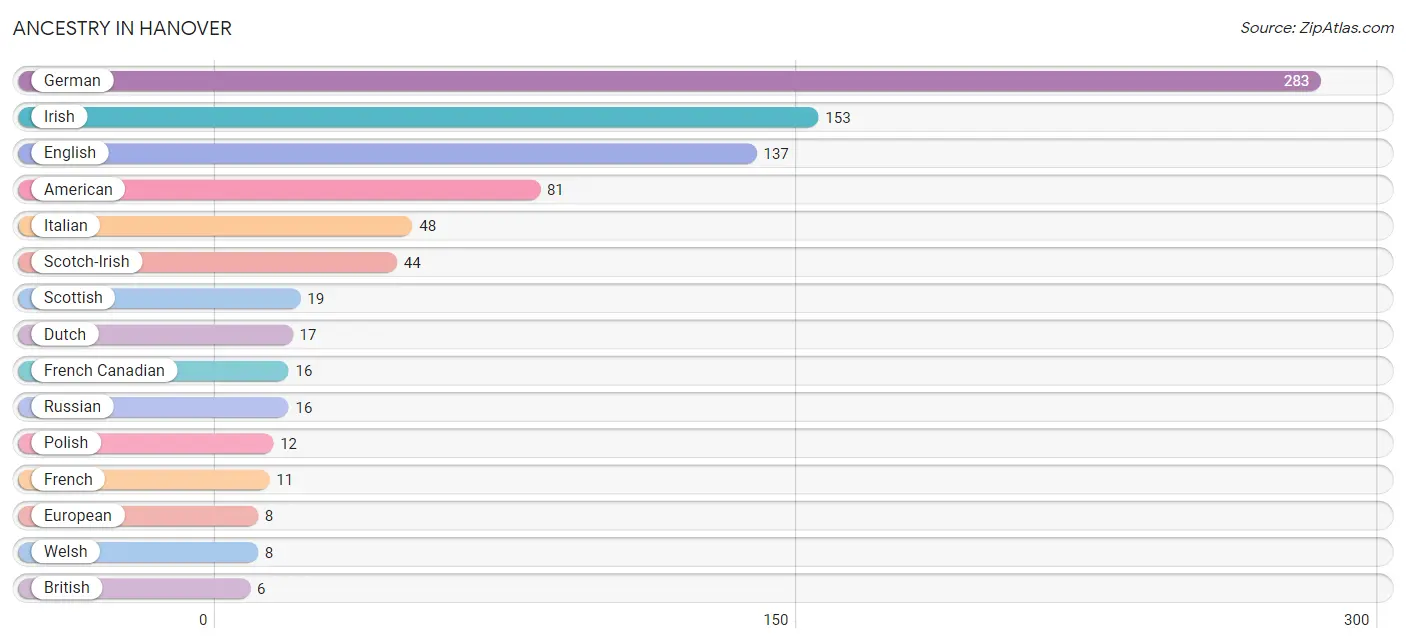
| Ancestry | # Population | % Population |
| American | 81 | 7.2% |
| British | 6 | 0.5% |
| Central American | 5 | 0.4% |
| Cherokee | 5 | 0.4% |
| Danish | 1 | 0.1% |
| Dutch | 17 | 1.5% |
| Eastern European | 4 | 0.4% |
| English | 137 | 12.2% |
| European | 8 | 0.7% |
| French | 11 | 1.0% |
| French Canadian | 16 | 1.4% |
| German | 283 | 25.2% |
| Honduran | 5 | 0.4% |
| Hungarian | 4 | 0.4% |
| Irish | 153 | 13.6% |
| Italian | 48 | 4.3% |
| Mexican | 5 | 0.4% |
| Polish | 12 | 1.1% |
| Russian | 16 | 1.4% |
| Scotch-Irish | 44 | 3.9% |
| Scottish | 19 | 1.7% |
| Swedish | 1 | 0.1% |
| Ukrainian | 2 | 0.2% |
| Welsh | 8 | 0.7% | View All 24 Rows |
Immigrants in Hanover
The most numerous immigrant groups reported in Hanover came from Central America (5 | 0.4%), Latin America (5 | 0.4%), and Mexico (5 | 0.4%), together accounting for 1.3% of all Hanover residents.
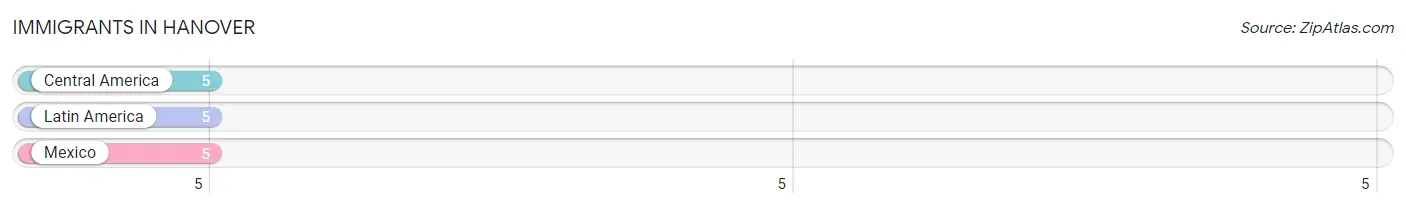
| Immigration Origin | # Population | % Population |
| Central America | 5 | 0.4% |
| Latin America | 5 | 0.4% |
| Mexico | 5 | 0.4% | View All 3 Rows |
Sex and Age in Hanover
Sex and Age in Hanover
The most populous age groups in Hanover are 60 to 64 Years (72 | 12.4%) for men and 50 to 54 Years (81 | 14.9%) for women.
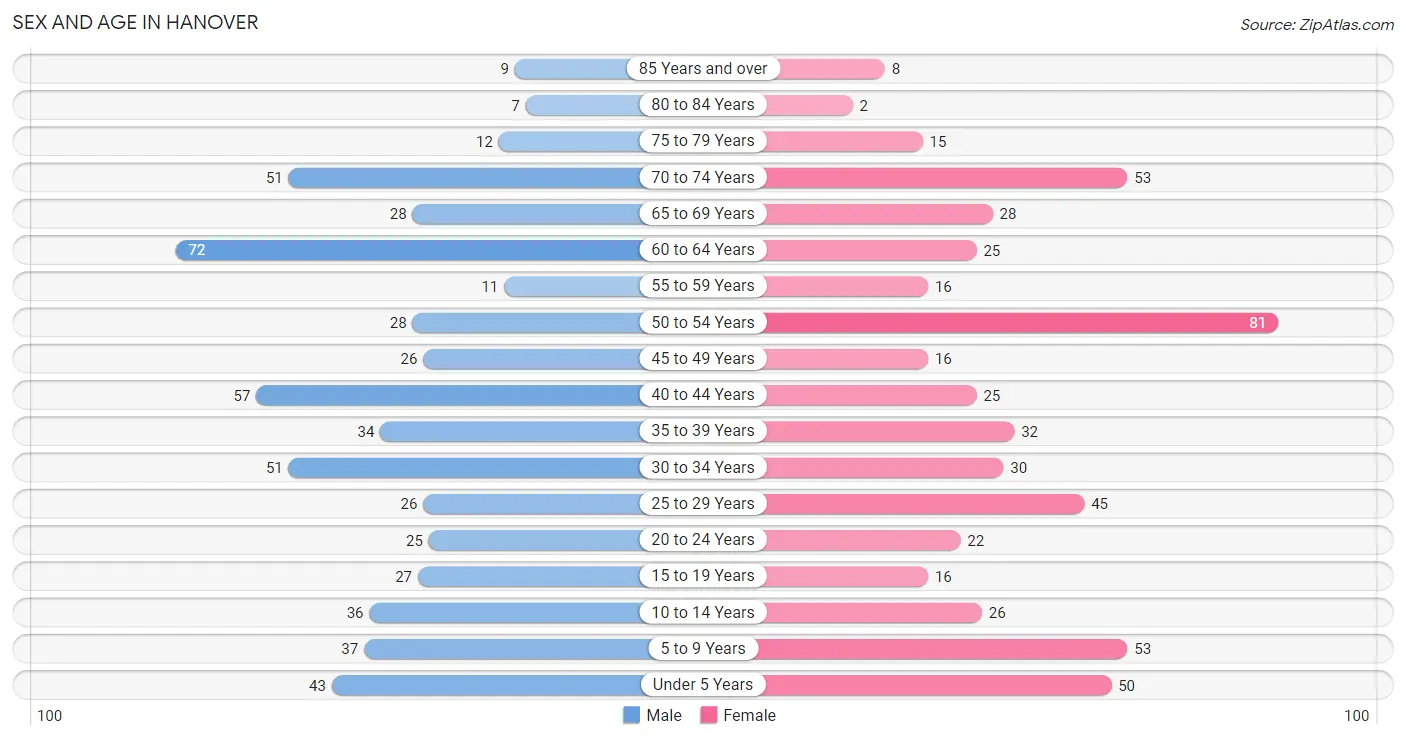
| Age Bracket | Male | Female |
| Under 5 Years | 43 (7.4%) | 50 (9.2%) |
| 5 to 9 Years | 37 (6.4%) | 53 (9.8%) |
| 10 to 14 Years | 36 (6.2%) | 26 (4.8%) |
| 15 to 19 Years | 27 (4.7%) | 16 (2.9%) |
| 20 to 24 Years | 25 (4.3%) | 22 (4.1%) |
| 25 to 29 Years | 26 (4.5%) | 45 (8.3%) |
| 30 to 34 Years | 51 (8.8%) | 30 (5.5%) |
| 35 to 39 Years | 34 (5.9%) | 32 (5.9%) |
| 40 to 44 Years | 57 (9.8%) | 25 (4.6%) |
| 45 to 49 Years | 26 (4.5%) | 16 (2.9%) |
| 50 to 54 Years | 28 (4.8%) | 81 (14.9%) |
| 55 to 59 Years | 11 (1.9%) | 16 (2.9%) |
| 60 to 64 Years | 72 (12.4%) | 25 (4.6%) |
| 65 to 69 Years | 28 (4.8%) | 28 (5.2%) |
| 70 to 74 Years | 51 (8.8%) | 53 (9.8%) |
| 75 to 79 Years | 12 (2.1%) | 15 (2.8%) |
| 80 to 84 Years | 7 (1.2%) | 2 (0.4%) |
| 85 Years and over | 9 (1.5%) | 8 (1.5%) |
| Total | 580 (100.0%) | 543 (100.0%) |
Families and Households in Hanover
Median Family Size in Hanover
The median family size in Hanover is 3.05 persons per family, with single male/father families (9 | 2.8%) accounting for the largest median family size of 3.67 persons per family. On the other hand, single female/mother families (19 | 6.0%) represent the smallest median family size with 2.95 persons per family.
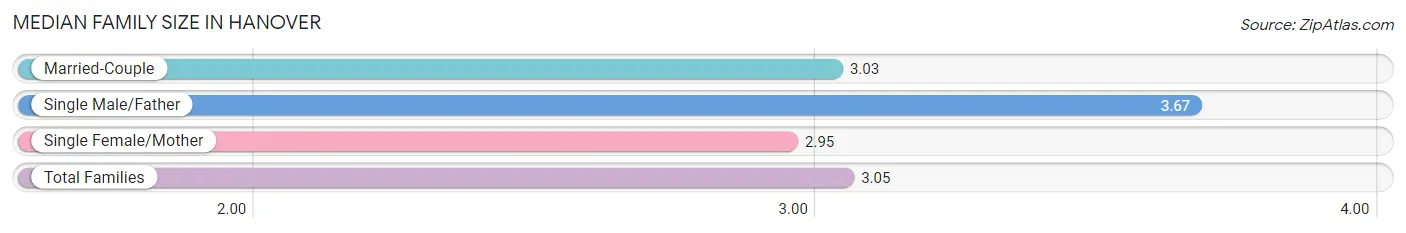
| Family Type | # Families | Family Size |
| Married-Couple | 289 (91.2%) | 3.03 |
| Single Male/Father | 9 (2.8%) | 3.67 |
| Single Female/Mother | 19 (6.0%) | 2.95 |
| Total Families | 317 (100.0%) | 3.05 |
Median Household Size in Hanover
The median household size in Hanover is 2.63 persons per household, with single male/father households (9 | 2.1%) accounting for the largest median household size of 4.44 persons per household. non-family households (110 | 25.8%) represent the smallest median household size with 1.35 persons per household.
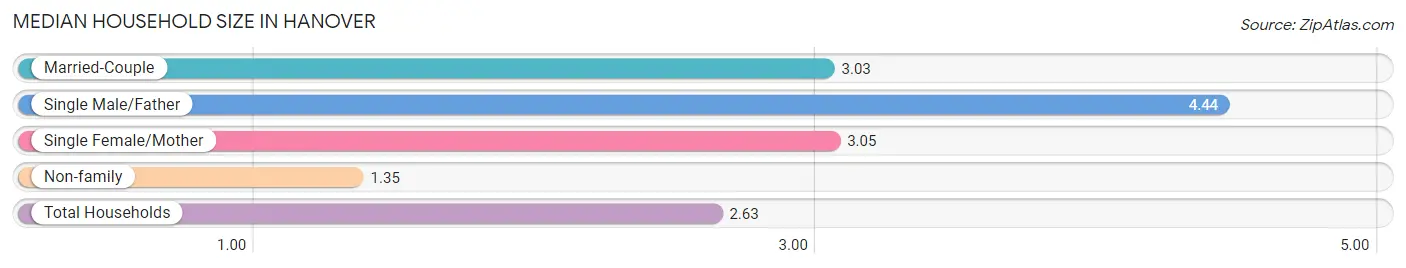
| Household Type | # Households | Household Size |
| Married-Couple | 289 (67.7%) | 3.03 |
| Single Male/Father | 9 (2.1%) | 4.44 |
| Single Female/Mother | 19 (4.4%) | 3.05 |
| Non-family | 110 (25.8%) | 1.35 |
| Total Households | 427 (100.0%) | 2.63 |
Household Size by Marriage Status in Hanover
Out of a total of 427 households in Hanover, 317 (74.2%) are family households, while 110 (25.8%) are nonfamily households. The most numerous type of family households are 2-person households, comprising 162, and the most common type of nonfamily households are 1-person households, comprising 83.
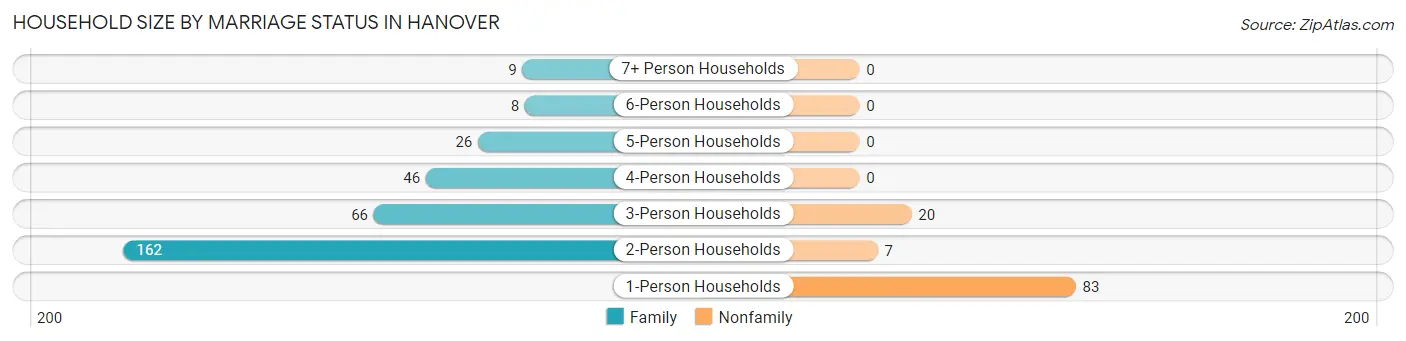
| Household Size | Family Households | Nonfamily Households |
| 1-Person Households | - | 83 (19.4%) |
| 2-Person Households | 162 (37.9%) | 7 (1.6%) |
| 3-Person Households | 66 (15.5%) | 20 (4.7%) |
| 4-Person Households | 46 (10.8%) | 0 (0.0%) |
| 5-Person Households | 26 (6.1%) | 0 (0.0%) |
| 6-Person Households | 8 (1.9%) | 0 (0.0%) |
| 7+ Person Households | 9 (2.1%) | 0 (0.0%) |
| Total | 317 (74.2%) | 110 (25.8%) |
Female Fertility in Hanover
Fertility by Age in Hanover
Average fertility rate in Hanover is 21.0 births per 1,000 women. Women in the age bracket of 20 to 34 years have the highest fertility rate with 41.0 births per 1,000 women. Women in the age bracket of 20 to 34 years acount for 100.0% of all women with births.
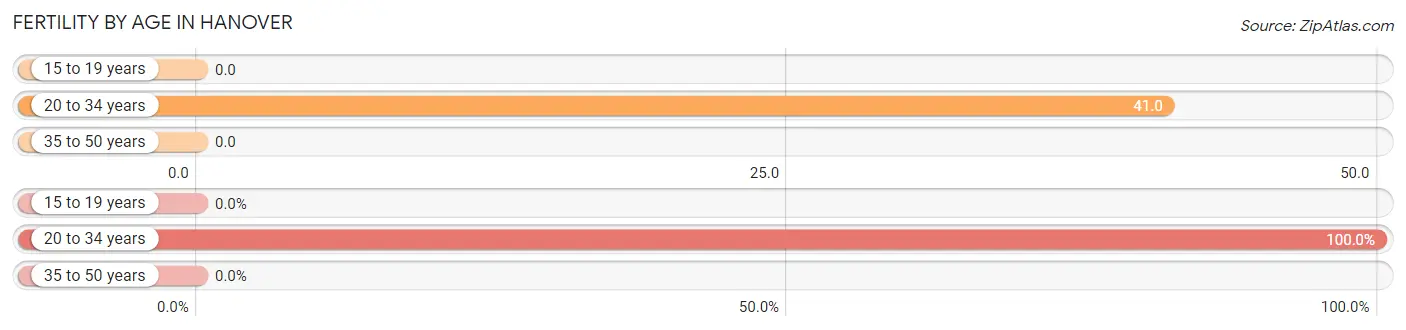
| Age Bracket | Women with Births | Births / 1,000 Women |
| 15 to 19 years | 0 (0.0%) | 0.0 |
| 20 to 34 years | 4 (100.0%) | 41.0 |
| 35 to 50 years | 0 (0.0%) | 0.0 |
| Total | 4 (100.0%) | 21.0 |
Fertility by Age by Marriage Status in Hanover
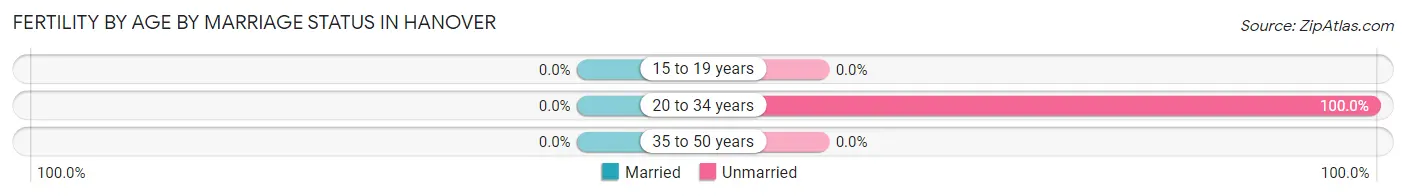
| Age Bracket | Married | Unmarried |
| 15 to 19 years | 0 (0.0%) | 0 (0.0%) |
| 20 to 34 years | 0 (0.0%) | 4 (100.0%) |
| 35 to 50 years | 0 (0.0%) | 0 (0.0%) |
| Total | 0 (0.0%) | 4 (100.0%) |
Fertility by Education in Hanover
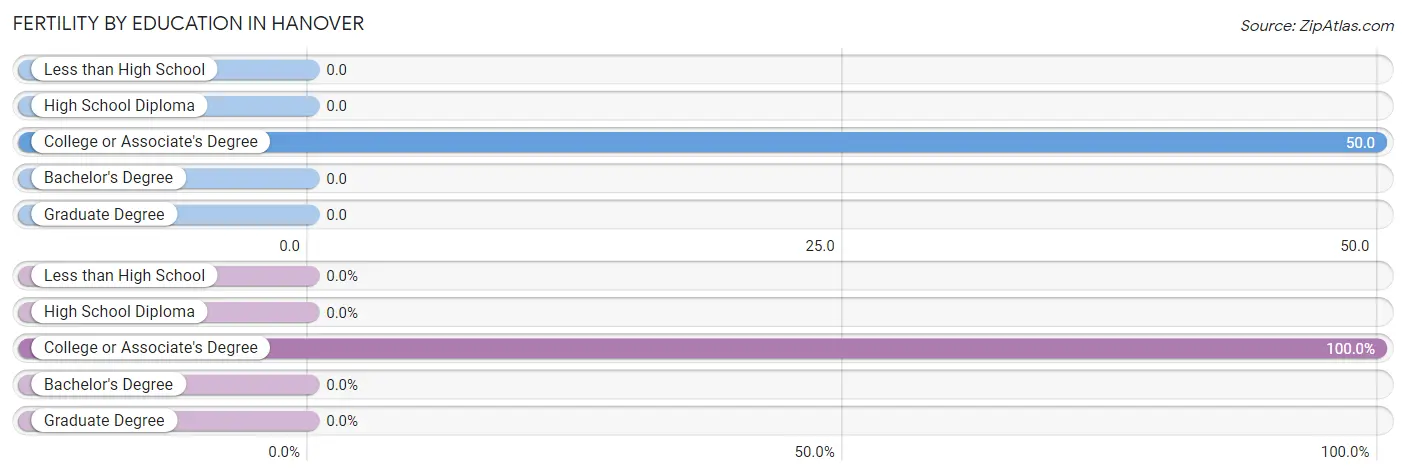
| Educational Attainment | Women with Births | Births / 1,000 Women |
| Less than High School | 0 (0.0%) | 0.0 |
| High School Diploma | 0 (0.0%) | 0.0 |
| College or Associate's Degree | 4 (100.0%) | 50.0 |
| Bachelor's Degree | 0 (0.0%) | 0.0 |
| Graduate Degree | 0 (0.0%) | 0.0 |
| Total | 4 (100.0%) | 21.0 |
Fertility by Education by Marriage Status in Hanover
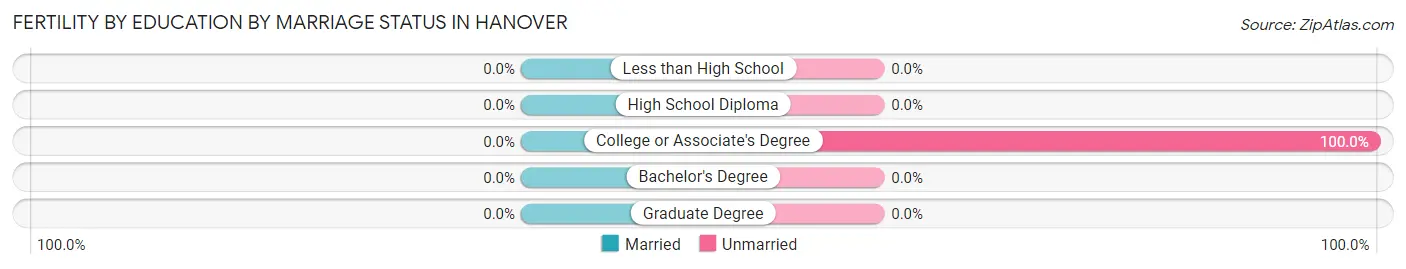
| Educational Attainment | Married | Unmarried |
| Less than High School | 0 (0.0%) | 0 (0.0%) |
| High School Diploma | 0 (0.0%) | 0 (0.0%) |
| College or Associate's Degree | 0 (0.0%) | 4 (100.0%) |
| Bachelor's Degree | 0 (0.0%) | 0 (0.0%) |
| Graduate Degree | 0 (0.0%) | 0 (0.0%) |
| Total | 0 (0.0%) | 4 (100.0%) |
Employment Characteristics in Hanover
Employment by Class of Employer in Hanover
Among the 505 employed individuals in Hanover, private company employees (321 | 63.6%), not-for-profit organizations (77 | 15.2%), and local government employees (44 | 8.7%) make up the most common classes of employment.
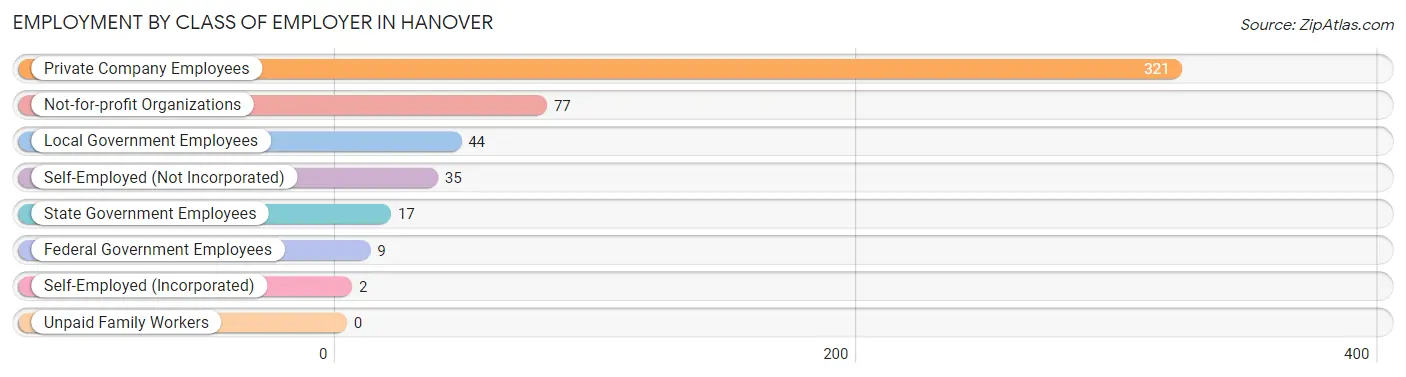
| Employer Class | # Employees | % Employees |
| Private Company Employees | 321 | 63.6% |
| Self-Employed (Incorporated) | 2 | 0.4% |
| Self-Employed (Not Incorporated) | 35 | 6.9% |
| Not-for-profit Organizations | 77 | 15.2% |
| Local Government Employees | 44 | 8.7% |
| State Government Employees | 17 | 3.4% |
| Federal Government Employees | 9 | 1.8% |
| Unpaid Family Workers | 0 | 0.0% |
| Total | 505 | 100.0% |
Employment Status by Age in Hanover
According to the labor force statistics for Hanover, out of the total population over 16 years of age (862), 60.6% or 522 individuals are in the labor force, with 2.1% or 11 of them unemployed. The age group with the highest labor force participation rate is 45 to 54 years, with 94.7% or 143 individuals in the labor force. Within the labor force, the 20 to 24 years age range has the highest percentage of unemployed individuals, with 7.0% or 3 of them being unemployed.
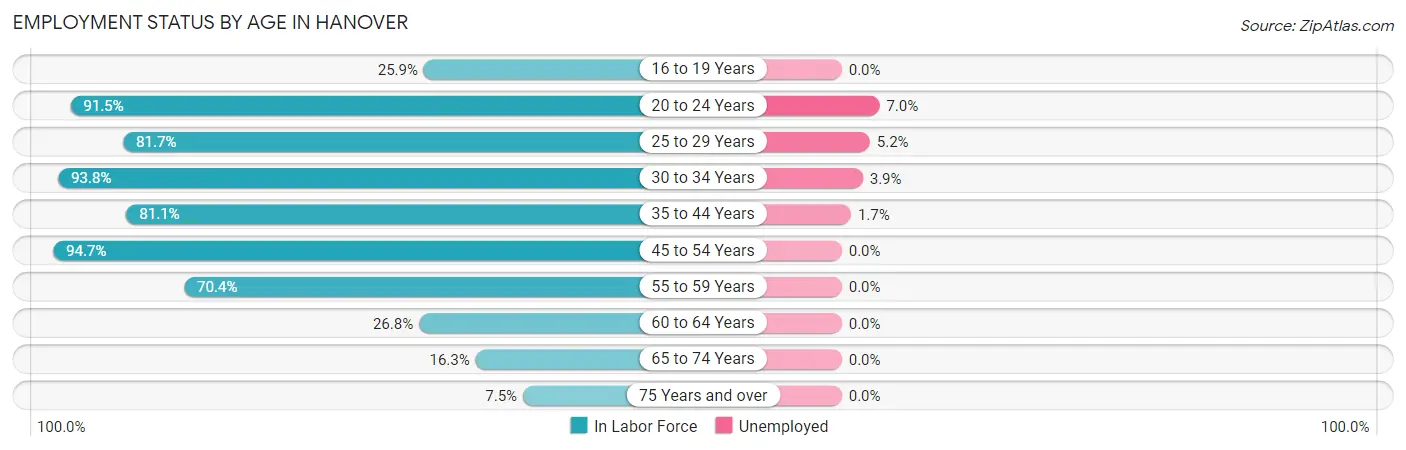
| Age Bracket | In Labor Force | Unemployed |
| 16 to 19 Years | 7 (25.9%) | 0 (0.0%) |
| 20 to 24 Years | 43 (91.5%) | 3 (7.0%) |
| 25 to 29 Years | 58 (81.7%) | 3 (5.2%) |
| 30 to 34 Years | 76 (93.8%) | 3 (3.9%) |
| 35 to 44 Years | 120 (81.1%) | 2 (1.7%) |
| 45 to 54 Years | 143 (94.7%) | 0 (0.0%) |
| 55 to 59 Years | 19 (70.4%) | 0 (0.0%) |
| 60 to 64 Years | 26 (26.8%) | 0 (0.0%) |
| 65 to 74 Years | 26 (16.3%) | 0 (0.0%) |
| 75 Years and over | 4 (7.5%) | 0 (0.0%) |
| Total | 522 (60.6%) | 11 (2.1%) |
Employment Status by Educational Attainment in Hanover
According to labor force statistics for Hanover, 76.9% of individuals (442) out of the total population between 25 and 64 years of age (575) are in the labor force, with 1.8% or 8 of them being unemployed. The group with the highest labor force participation rate are those with the educational attainment of college / associate degree, with 93.3% or 168 individuals in the labor force. Within the labor force, individuals with less than high school education have the highest percentage of unemployment, with 16.7% or 2 of them being unemployed.
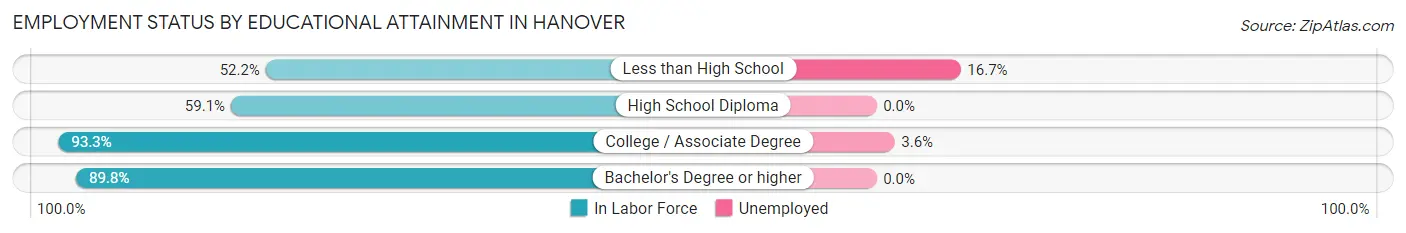
| Educational Attainment | In Labor Force | Unemployed |
| Less than High School | 12 (52.2%) | 4 (16.7%) |
| High School Diploma | 139 (59.1%) | 0 (0.0%) |
| College / Associate Degree | 168 (93.3%) | 6 (3.6%) |
| Bachelor's Degree or higher | 123 (89.8%) | 0 (0.0%) |
| Total | 442 (76.9%) | 10 (1.8%) |
Employment Occupations by Sex in Hanover
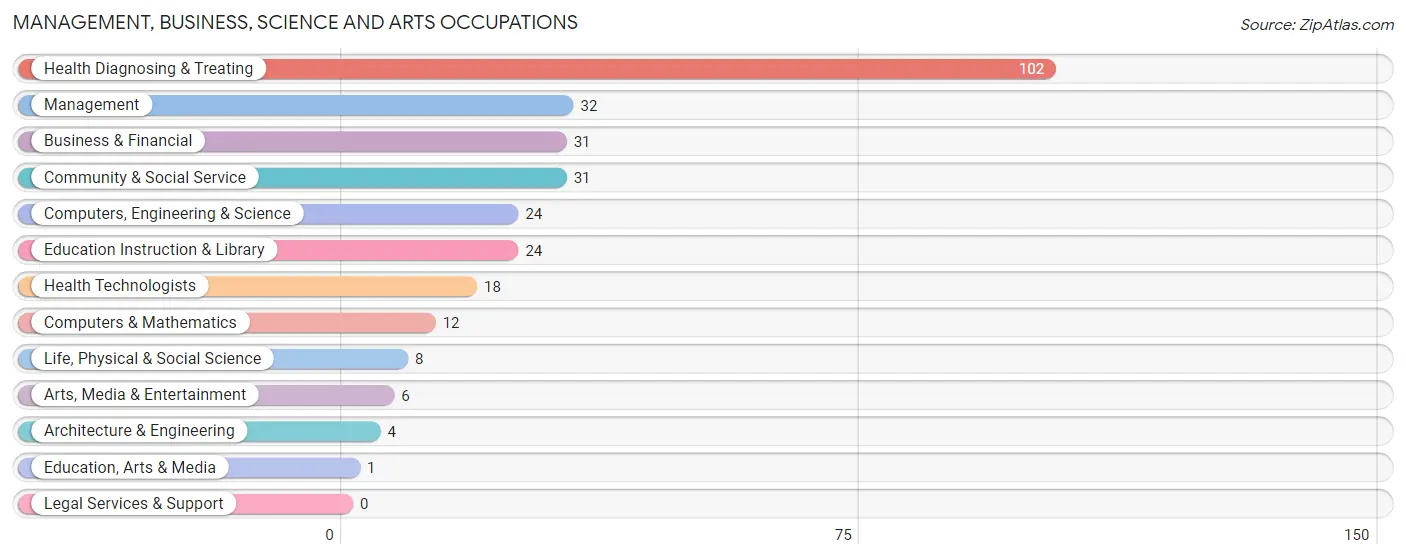
Management, Business, Science and Arts Occupations
The most common Management, Business, Science and Arts occupations in Hanover are Health Diagnosing & Treating (102 | 20.0%), Management (32 | 6.3%), Business & Financial (31 | 6.1%), Community & Social Service (31 | 6.1%), and Computers, Engineering & Science (24 | 4.7%).
Management, Business, Science and Arts Occupations by Sex
Within the Management, Business, Science and Arts occupations in Hanover, the most male-oriented occupations are Computers, Engineering & Science (100.0%), Computers & Mathematics (100.0%), and Architecture & Engineering (100.0%), while the most female-oriented occupations are Health Diagnosing & Treating (94.1%), Education Instruction & Library (79.2%), and Health Technologists (72.2%).
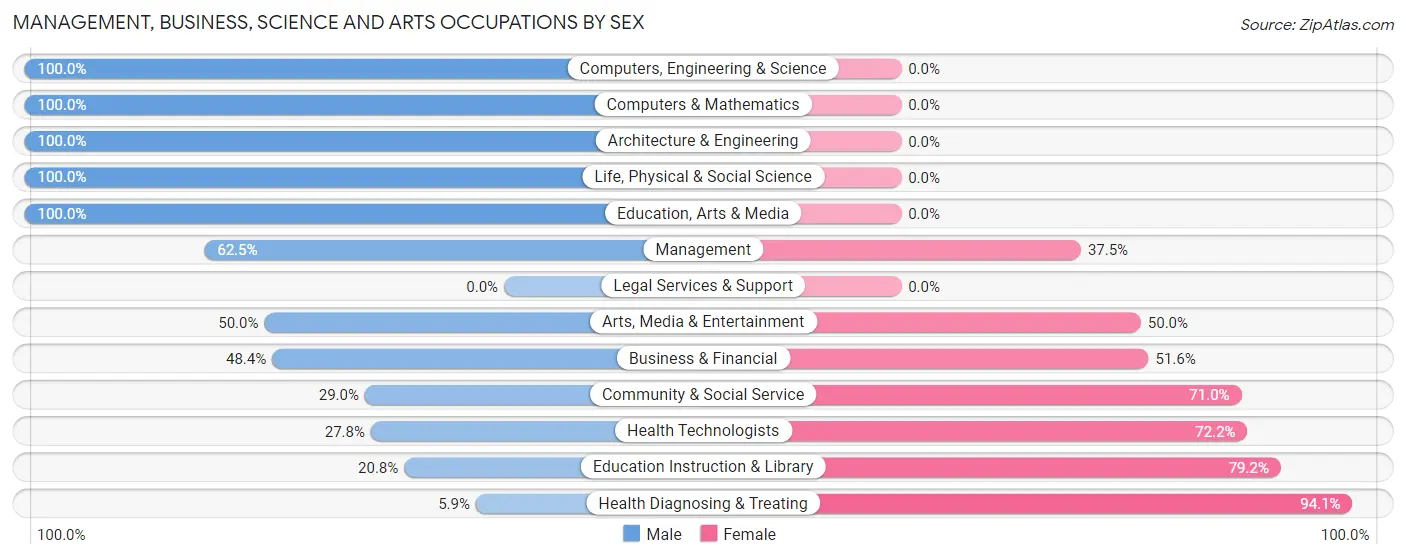
| Occupation | Male | Female |
| Management | 20 (62.5%) | 12 (37.5%) |
| Business & Financial | 15 (48.4%) | 16 (51.6%) |
| Computers, Engineering & Science | 24 (100.0%) | 0 (0.0%) |
| Computers & Mathematics | 12 (100.0%) | 0 (0.0%) |
| Architecture & Engineering | 4 (100.0%) | 0 (0.0%) |
| Life, Physical & Social Science | 8 (100.0%) | 0 (0.0%) |
| Community & Social Service | 9 (29.0%) | 22 (71.0%) |
| Education, Arts & Media | 1 (100.0%) | 0 (0.0%) |
| Legal Services & Support | 0 (0.0%) | 0 (0.0%) |
| Education Instruction & Library | 5 (20.8%) | 19 (79.2%) |
| Arts, Media & Entertainment | 3 (50.0%) | 3 (50.0%) |
| Health Diagnosing & Treating | 6 (5.9%) | 96 (94.1%) |
| Health Technologists | 5 (27.8%) | 13 (72.2%) |
| Total (Category) | 74 (33.6%) | 146 (66.4%) |
| Total (Overall) | 251 (49.1%) | 260 (50.9%) |
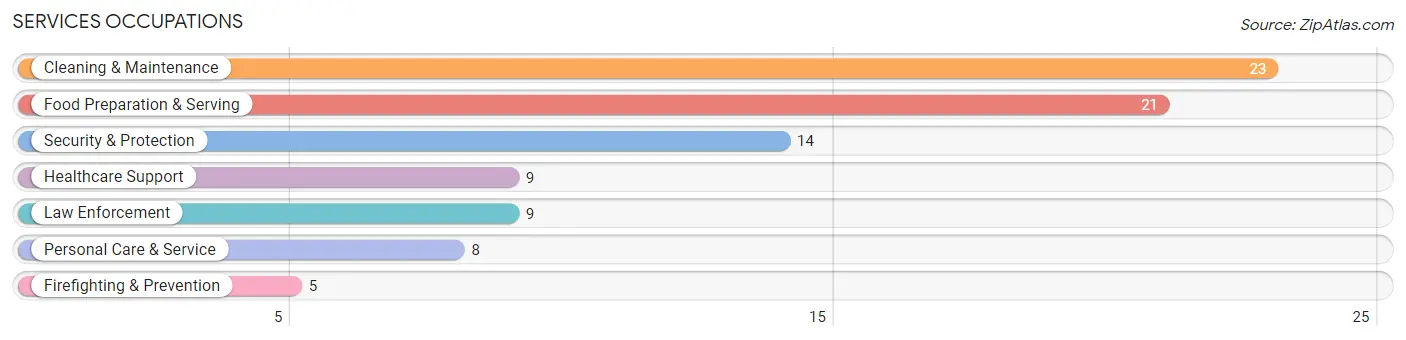
Services Occupations
The most common Services occupations in Hanover are Cleaning & Maintenance (23 | 4.5%), Food Preparation & Serving (21 | 4.1%), Security & Protection (14 | 2.7%), Healthcare Support (9 | 1.8%), and Law Enforcement (9 | 1.8%).
Services Occupations by Sex
Within the Services occupations in Hanover, the most male-oriented occupations are Law Enforcement (100.0%), Security & Protection (85.7%), and Personal Care & Service (75.0%), while the most female-oriented occupations are Food Preparation & Serving (90.5%), Healthcare Support (77.8%), and Firefighting & Prevention (40.0%).
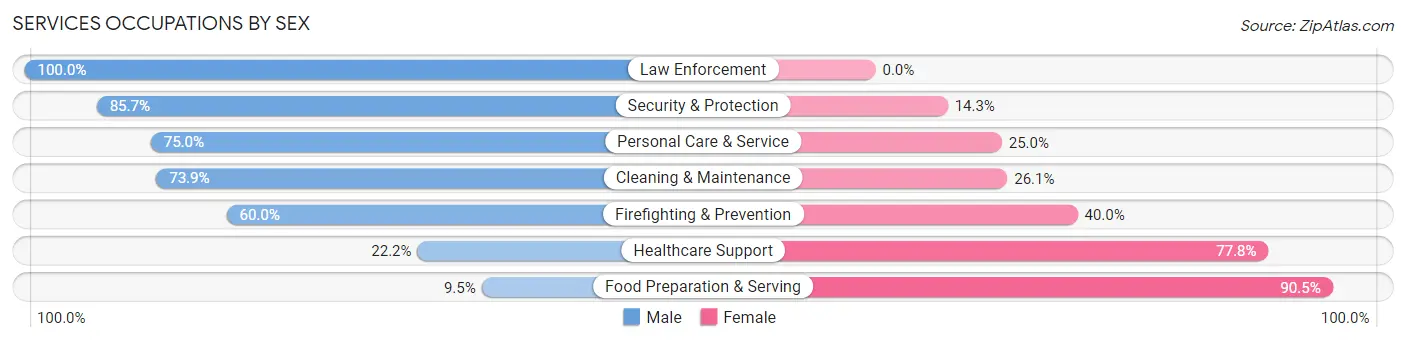
| Occupation | Male | Female |
| Healthcare Support | 2 (22.2%) | 7 (77.8%) |
| Security & Protection | 12 (85.7%) | 2 (14.3%) |
| Firefighting & Prevention | 3 (60.0%) | 2 (40.0%) |
| Law Enforcement | 9 (100.0%) | 0 (0.0%) |
| Food Preparation & Serving | 2 (9.5%) | 19 (90.5%) |
| Cleaning & Maintenance | 17 (73.9%) | 6 (26.1%) |
| Personal Care & Service | 6 (75.0%) | 2 (25.0%) |
| Total (Category) | 39 (52.0%) | 36 (48.0%) |
| Total (Overall) | 251 (49.1%) | 260 (50.9%) |
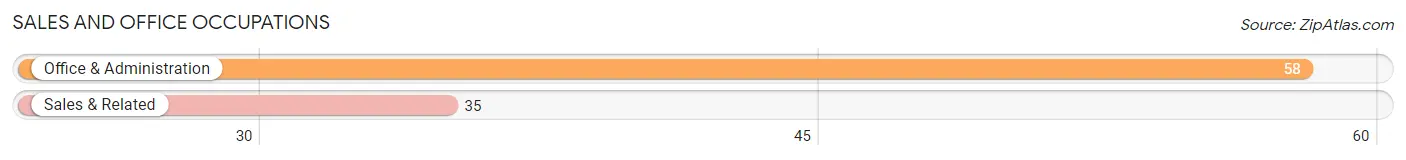
Sales and Office Occupations
The most common Sales and Office occupations in Hanover are Office & Administration (58 | 11.4%), and Sales & Related (35 | 6.9%).
Sales and Office Occupations by Sex
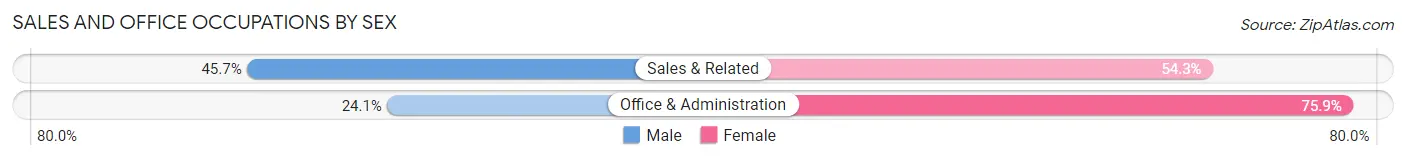
| Occupation | Male | Female |
| Sales & Related | 16 (45.7%) | 19 (54.3%) |
| Office & Administration | 14 (24.1%) | 44 (75.9%) |
| Total (Category) | 30 (32.3%) | 63 (67.7%) |
| Total (Overall) | 251 (49.1%) | 260 (50.9%) |
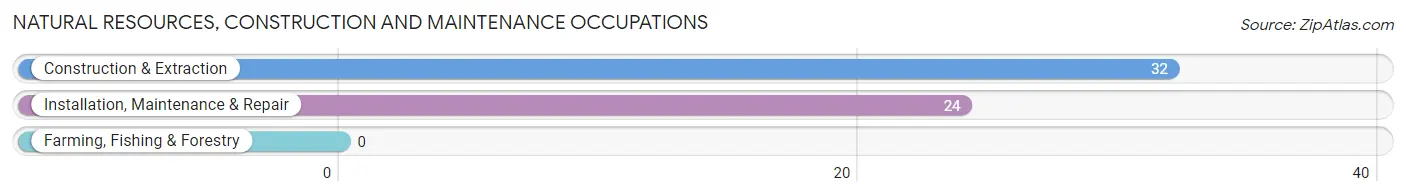
Natural Resources, Construction and Maintenance Occupations
The most common Natural Resources, Construction and Maintenance occupations in Hanover are Construction & Extraction (32 | 6.3%), and Installation, Maintenance & Repair (24 | 4.7%).
Natural Resources, Construction and Maintenance Occupations by Sex
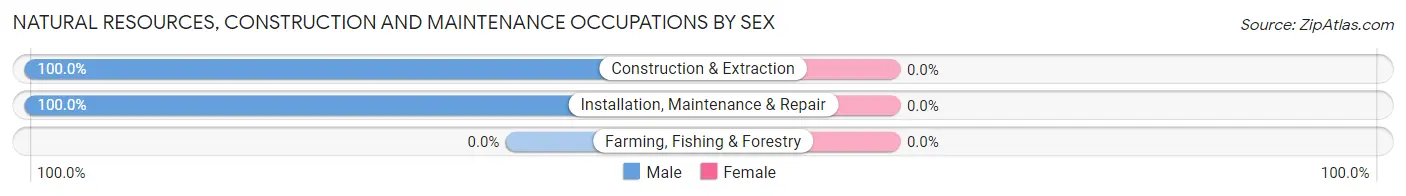
| Occupation | Male | Female |
| Farming, Fishing & Forestry | 0 (0.0%) | 0 (0.0%) |
| Construction & Extraction | 32 (100.0%) | 0 (0.0%) |
| Installation, Maintenance & Repair | 24 (100.0%) | 0 (0.0%) |
| Total (Category) | 56 (100.0%) | 0 (0.0%) |
| Total (Overall) | 251 (49.1%) | 260 (50.9%) |
Production, Transportation and Moving Occupations
The most common Production, Transportation and Moving occupations in Hanover are Production (40 | 7.8%), Material Moving (14 | 2.7%), and Transportation (13 | 2.5%).
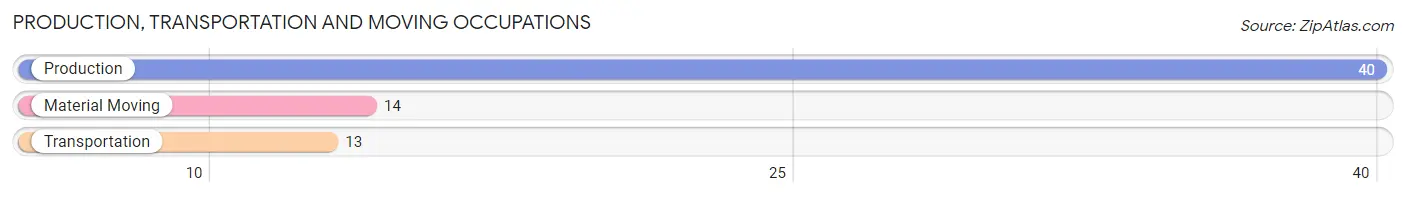
Production, Transportation and Moving Occupations by Sex
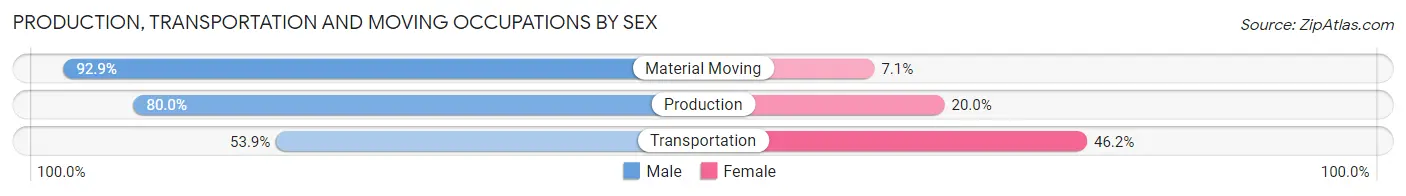
| Occupation | Male | Female |
| Production | 32 (80.0%) | 8 (20.0%) |
| Transportation | 7 (53.8%) | 6 (46.2%) |
| Material Moving | 13 (92.9%) | 1 (7.1%) |
| Total (Category) | 52 (77.6%) | 15 (22.4%) |
| Total (Overall) | 251 (49.1%) | 260 (50.9%) |
Employment Industries by Sex in Hanover
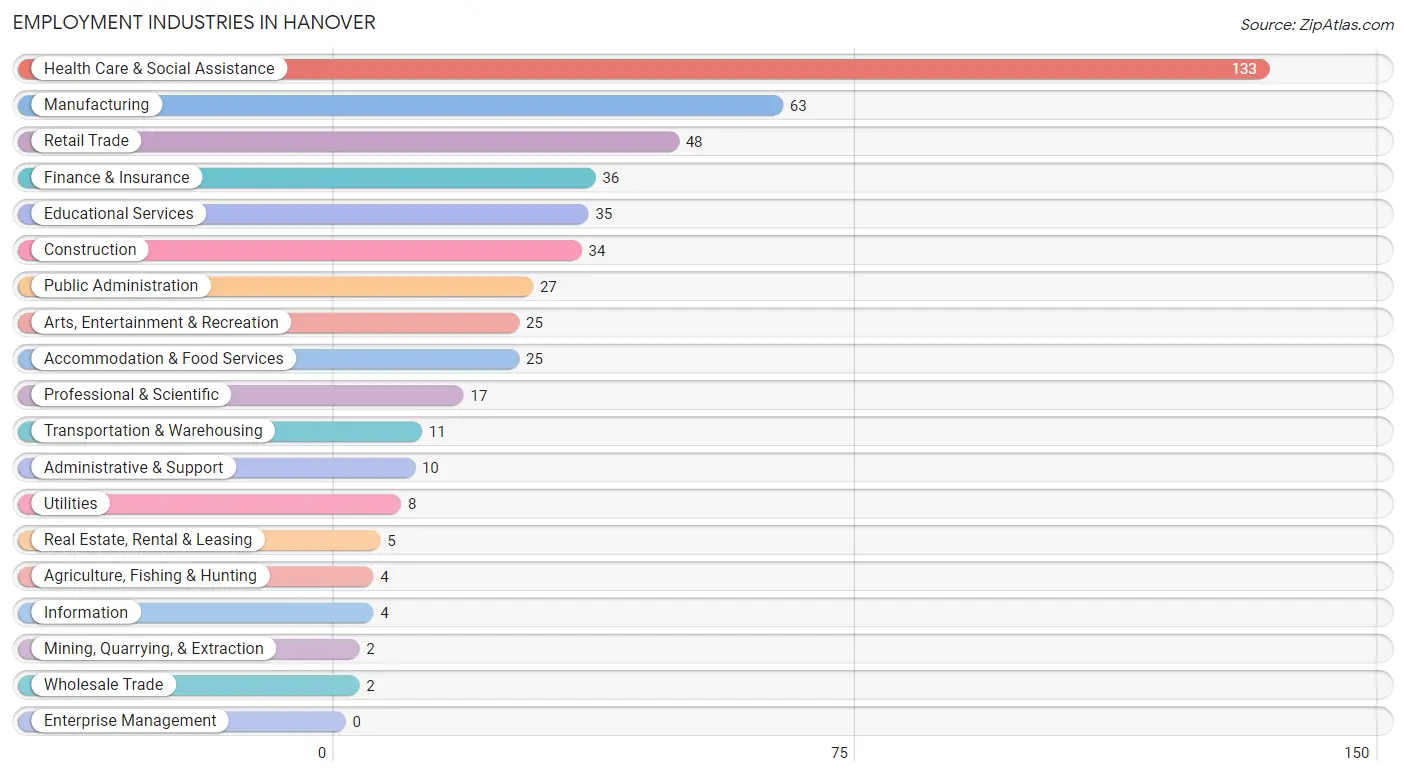
Employment Industries in Hanover
The major employment industries in Hanover include Health Care & Social Assistance (133 | 26.0%), Manufacturing (63 | 12.3%), Retail Trade (48 | 9.4%), Finance & Insurance (36 | 7.0%), and Educational Services (35 | 6.9%).
Employment Industries by Sex in Hanover
The Hanover industries that see more men than women are Agriculture, Fishing & Hunting (100.0%), Mining, Quarrying, & Extraction (100.0%), and Utilities (100.0%), whereas the industries that tend to have a higher number of women are Wholesale Trade (100.0%), Real Estate, Rental & Leasing (100.0%), and Health Care & Social Assistance (91.7%).
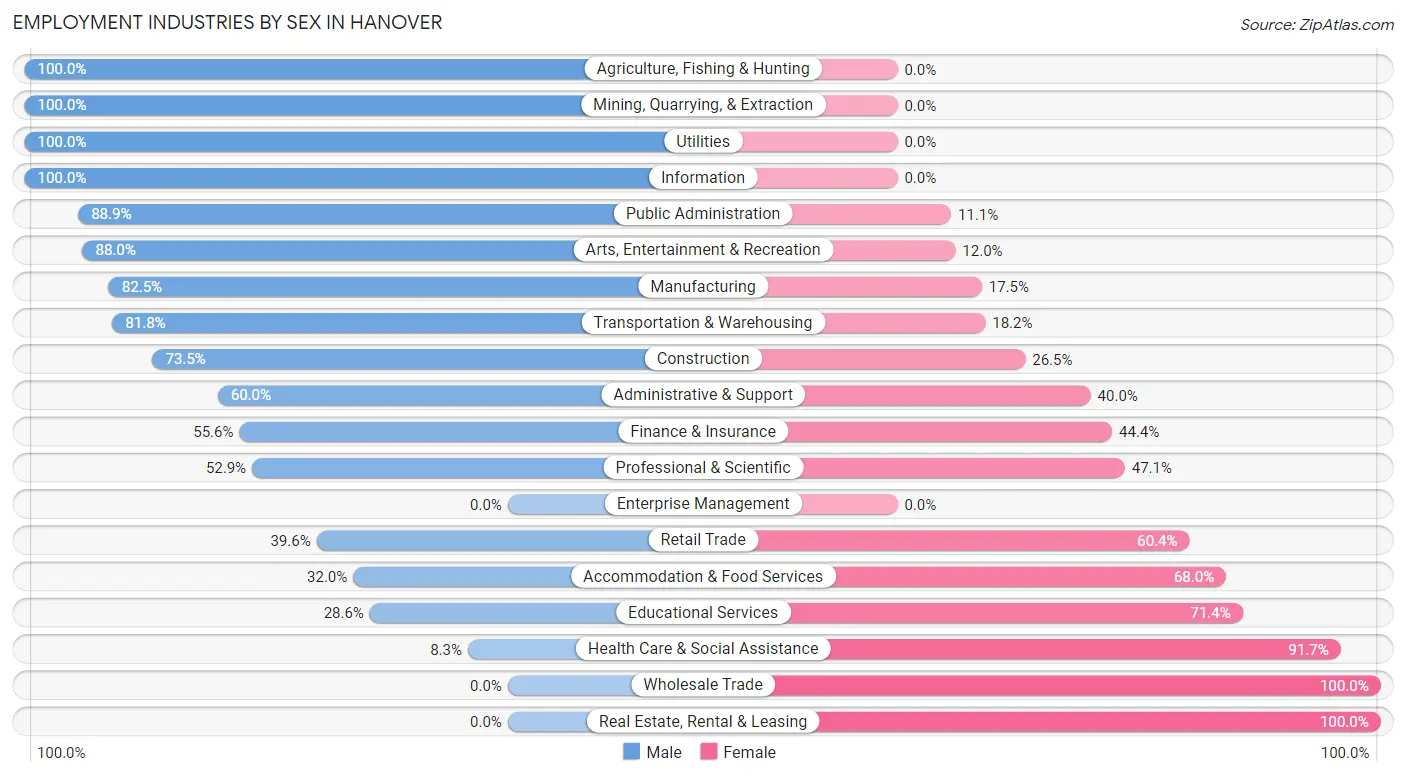
| Industry | Male | Female |
| Agriculture, Fishing & Hunting | 4 (100.0%) | 0 (0.0%) |
| Mining, Quarrying, & Extraction | 2 (100.0%) | 0 (0.0%) |
| Construction | 25 (73.5%) | 9 (26.5%) |
| Manufacturing | 52 (82.5%) | 11 (17.5%) |
| Wholesale Trade | 0 (0.0%) | 2 (100.0%) |
| Retail Trade | 19 (39.6%) | 29 (60.4%) |
| Transportation & Warehousing | 9 (81.8%) | 2 (18.2%) |
| Utilities | 8 (100.0%) | 0 (0.0%) |
| Information | 4 (100.0%) | 0 (0.0%) |
| Finance & Insurance | 20 (55.6%) | 16 (44.4%) |
| Real Estate, Rental & Leasing | 0 (0.0%) | 5 (100.0%) |
| Professional & Scientific | 9 (52.9%) | 8 (47.1%) |
| Enterprise Management | 0 (0.0%) | 0 (0.0%) |
| Administrative & Support | 6 (60.0%) | 4 (40.0%) |
| Educational Services | 10 (28.6%) | 25 (71.4%) |
| Health Care & Social Assistance | 11 (8.3%) | 122 (91.7%) |
| Arts, Entertainment & Recreation | 22 (88.0%) | 3 (12.0%) |
| Accommodation & Food Services | 8 (32.0%) | 17 (68.0%) |
| Public Administration | 24 (88.9%) | 3 (11.1%) |
| Total | 251 (49.1%) | 260 (50.9%) |
Education in Hanover
School Enrollment in Hanover
The most common levels of schooling among the 261 students in Hanover are elementary school (71 | 27.2%), middle school (63 | 24.1%), and college / undergraduate (47 | 18.0%).
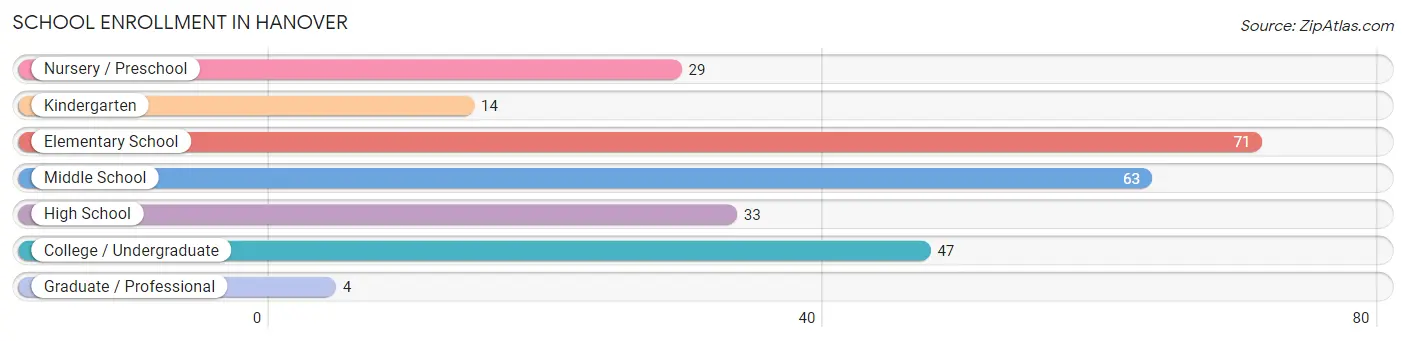
| School Level | # Students | % Students |
| Nursery / Preschool | 29 | 11.1% |
| Kindergarten | 14 | 5.4% |
| Elementary School | 71 | 27.2% |
| Middle School | 63 | 24.1% |
| High School | 33 | 12.6% |
| College / Undergraduate | 47 | 18.0% |
| Graduate / Professional | 4 | 1.5% |
| Total | 261 | 100.0% |
School Enrollment by Age by Funding Source in Hanover
Out of a total of 261 students who are enrolled in schools in Hanover, 36 (13.8%) attend a private institution, while the remaining 225 (86.2%) are enrolled in public schools. The age group of 20 to 24 year olds has the highest likelihood of being enrolled in private schools, with 12 (44.4% in the age bracket) enrolled. Conversely, the age group of 15 to 17 year olds has the lowest likelihood of being enrolled in a private school, with 24 (100.0% in the age bracket) attending a public institution.
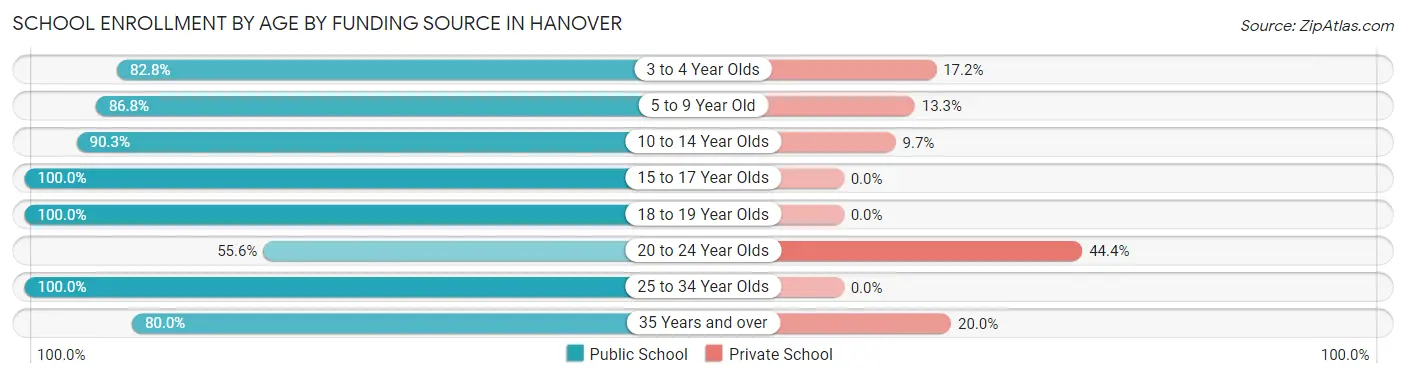
| Age Bracket | Public School | Private School |
| 3 to 4 Year Olds | 24 (82.8%) | 5 (17.2%) |
| 5 to 9 Year Old | 72 (86.8%) | 11 (13.3%) |
| 10 to 14 Year Olds | 56 (90.3%) | 6 (9.7%) |
| 15 to 17 Year Olds | 24 (100.0%) | 0 (0.0%) |
| 18 to 19 Year Olds | 16 (100.0%) | 0 (0.0%) |
| 20 to 24 Year Olds | 15 (55.6%) | 12 (44.4%) |
| 25 to 34 Year Olds | 10 (100.0%) | 0 (0.0%) |
| 35 Years and over | 8 (80.0%) | 2 (20.0%) |
| Total | 225 (86.2%) | 36 (13.8%) |
Educational Attainment by Field of Study in Hanover
Business (44 | 28.0%), science & technology (22 | 14.0%), education (22 | 14.0%), bio, nature & agricultural (13 | 8.3%), and arts & humanities (11 | 7.0%) are the most common fields of study among 157 individuals in Hanover who have obtained a bachelor's degree or higher.
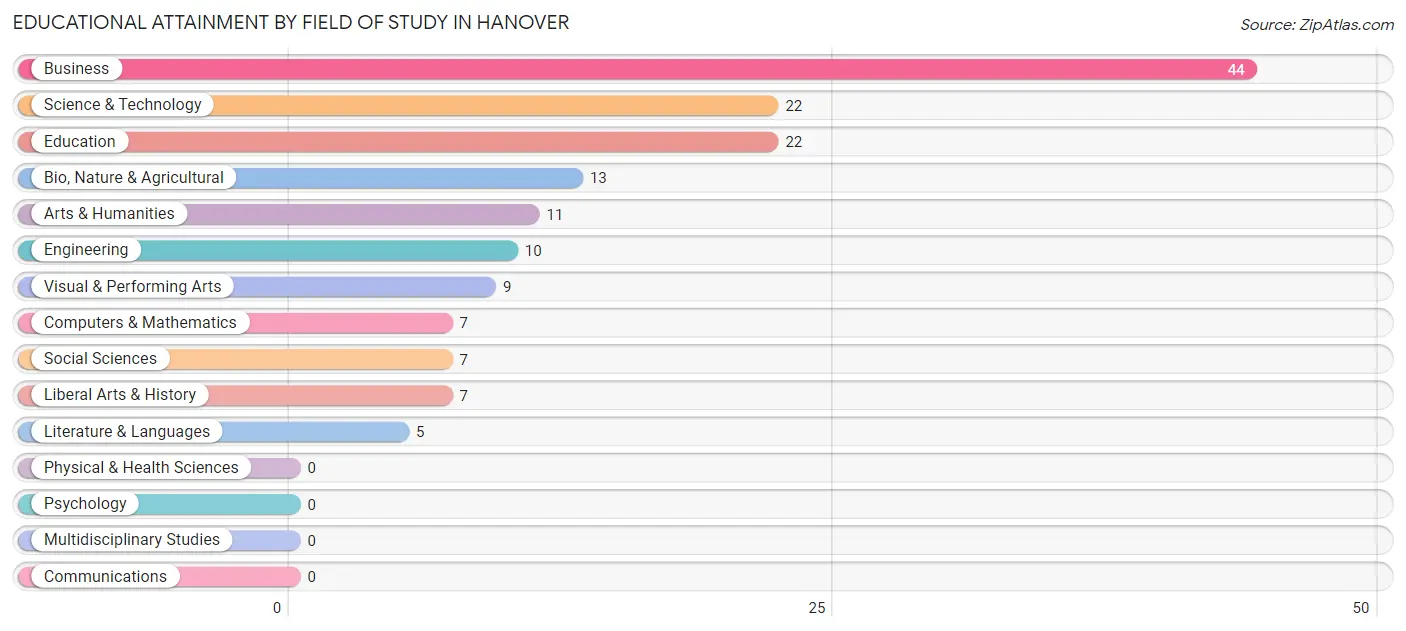
| Field of Study | # Graduates | % Graduates |
| Computers & Mathematics | 7 | 4.5% |
| Bio, Nature & Agricultural | 13 | 8.3% |
| Physical & Health Sciences | 0 | 0.0% |
| Psychology | 0 | 0.0% |
| Social Sciences | 7 | 4.5% |
| Engineering | 10 | 6.4% |
| Multidisciplinary Studies | 0 | 0.0% |
| Science & Technology | 22 | 14.0% |
| Business | 44 | 28.0% |
| Education | 22 | 14.0% |
| Literature & Languages | 5 | 3.2% |
| Liberal Arts & History | 7 | 4.5% |
| Visual & Performing Arts | 9 | 5.7% |
| Communications | 0 | 0.0% |
| Arts & Humanities | 11 | 7.0% |
| Total | 157 | 100.0% |
Transportation & Commute in Hanover
Vehicle Availability by Sex in Hanover
The most prevalent vehicle ownership categories in Hanover are males with 2 vehicles (124, accounting for 50.0%) and females with 2 vehicles (144, making up 48.2%).
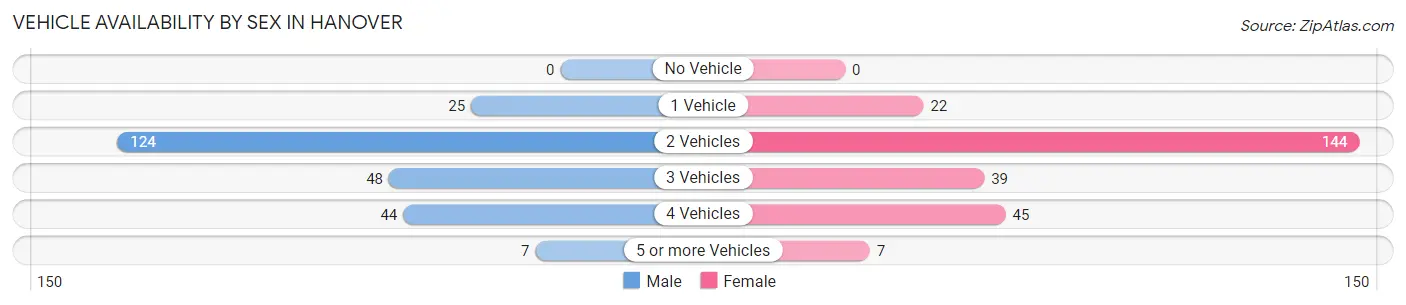
| Vehicles Available | Male | Female |
| No Vehicle | 0 (0.0%) | 0 (0.0%) |
| 1 Vehicle | 25 (10.1%) | 22 (8.6%) |
| 2 Vehicles | 124 (50.0%) | 144 (56.0%) |
| 3 Vehicles | 48 (19.4%) | 39 (15.2%) |
| 4 Vehicles | 44 (17.7%) | 45 (17.5%) |
| 5 or more Vehicles | 7 (2.8%) | 7 (2.7%) |
| Total | 248 (100.0%) | 257 (100.0%) |
Commute Time in Hanover
The most frequently occuring commute durations in Hanover are 15 to 19 minutes (104 commuters, 22.9%), 45 to 59 minutes (75 commuters, 16.5%), and 20 to 24 minutes (67 commuters, 14.8%).
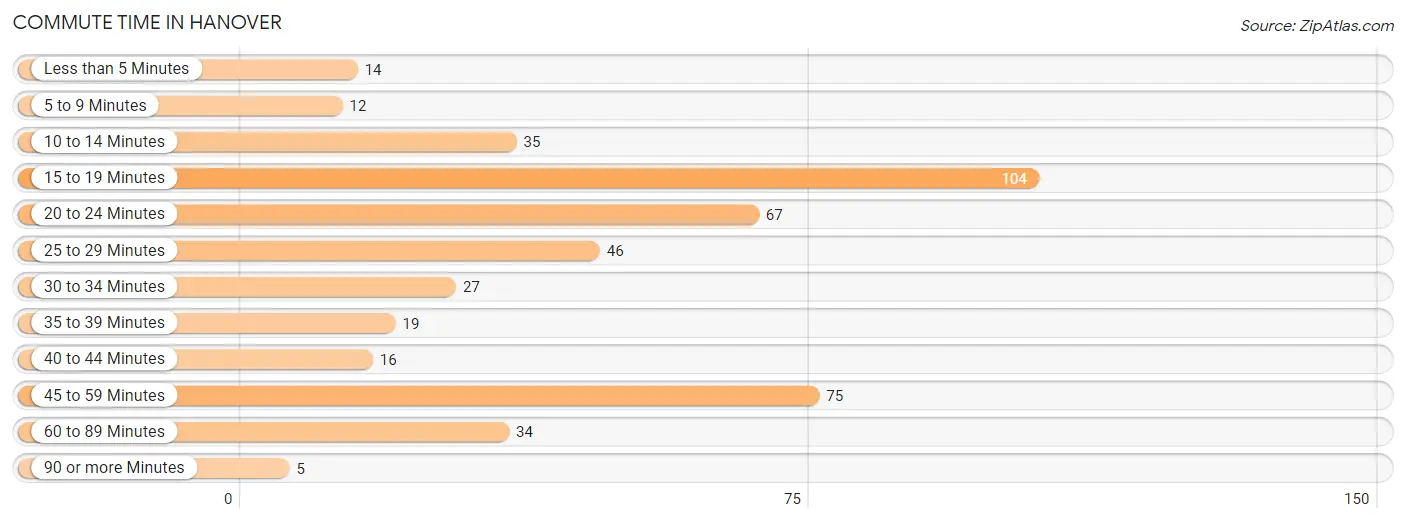
| Commute Time | # Commuters | % Commuters |
| Less than 5 Minutes | 14 | 3.1% |
| 5 to 9 Minutes | 12 | 2.6% |
| 10 to 14 Minutes | 35 | 7.7% |
| 15 to 19 Minutes | 104 | 22.9% |
| 20 to 24 Minutes | 67 | 14.8% |
| 25 to 29 Minutes | 46 | 10.1% |
| 30 to 34 Minutes | 27 | 5.9% |
| 35 to 39 Minutes | 19 | 4.2% |
| 40 to 44 Minutes | 16 | 3.5% |
| 45 to 59 Minutes | 75 | 16.5% |
| 60 to 89 Minutes | 34 | 7.5% |
| 90 or more Minutes | 5 | 1.1% |
Commute Time by Sex in Hanover
The most common commute times in Hanover are 45 to 59 minutes (42 commuters, 19.3%) for males and 15 to 19 minutes (73 commuters, 30.9%) for females.
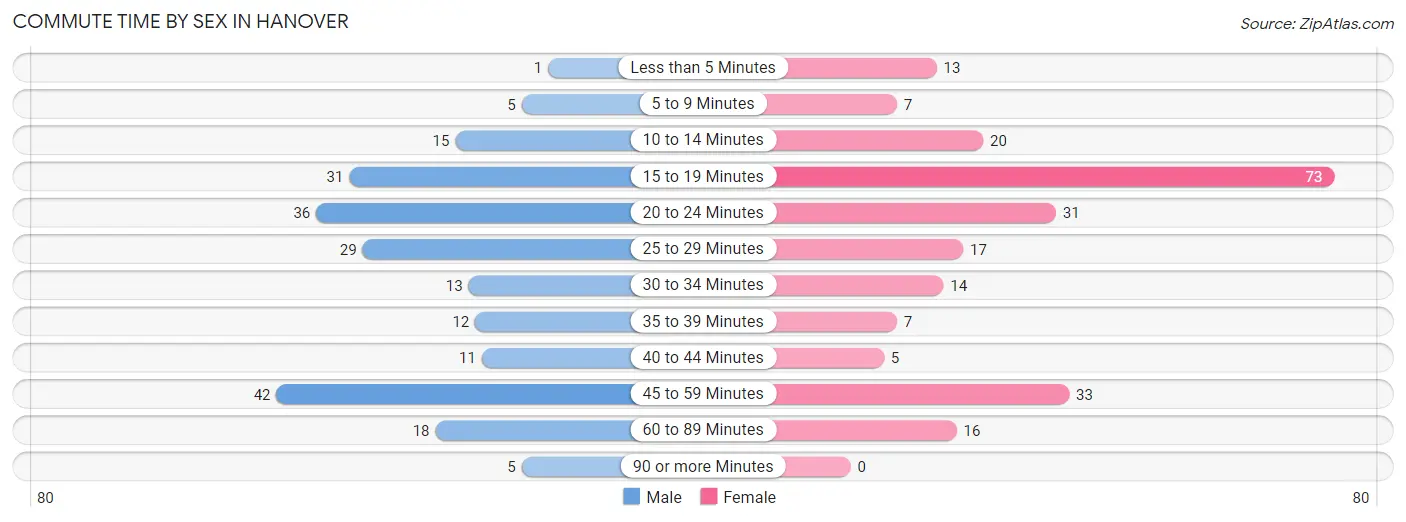
| Commute Time | Male | Female |
| Less than 5 Minutes | 1 (0.5%) | 13 (5.5%) |
| 5 to 9 Minutes | 5 (2.3%) | 7 (3.0%) |
| 10 to 14 Minutes | 15 (6.9%) | 20 (8.5%) |
| 15 to 19 Minutes | 31 (14.2%) | 73 (30.9%) |
| 20 to 24 Minutes | 36 (16.5%) | 31 (13.1%) |
| 25 to 29 Minutes | 29 (13.3%) | 17 (7.2%) |
| 30 to 34 Minutes | 13 (6.0%) | 14 (5.9%) |
| 35 to 39 Minutes | 12 (5.5%) | 7 (3.0%) |
| 40 to 44 Minutes | 11 (5.1%) | 5 (2.1%) |
| 45 to 59 Minutes | 42 (19.3%) | 33 (14.0%) |
| 60 to 89 Minutes | 18 (8.3%) | 16 (6.8%) |
| 90 or more Minutes | 5 (2.3%) | 0 (0.0%) |
Time of Departure to Work by Sex in Hanover
The most frequent times of departure to work in Hanover are 7:00 AM to 7:29 AM (34, 15.6%) for males and 5:30 AM to 5:59 AM (80, 33.9%) for females.
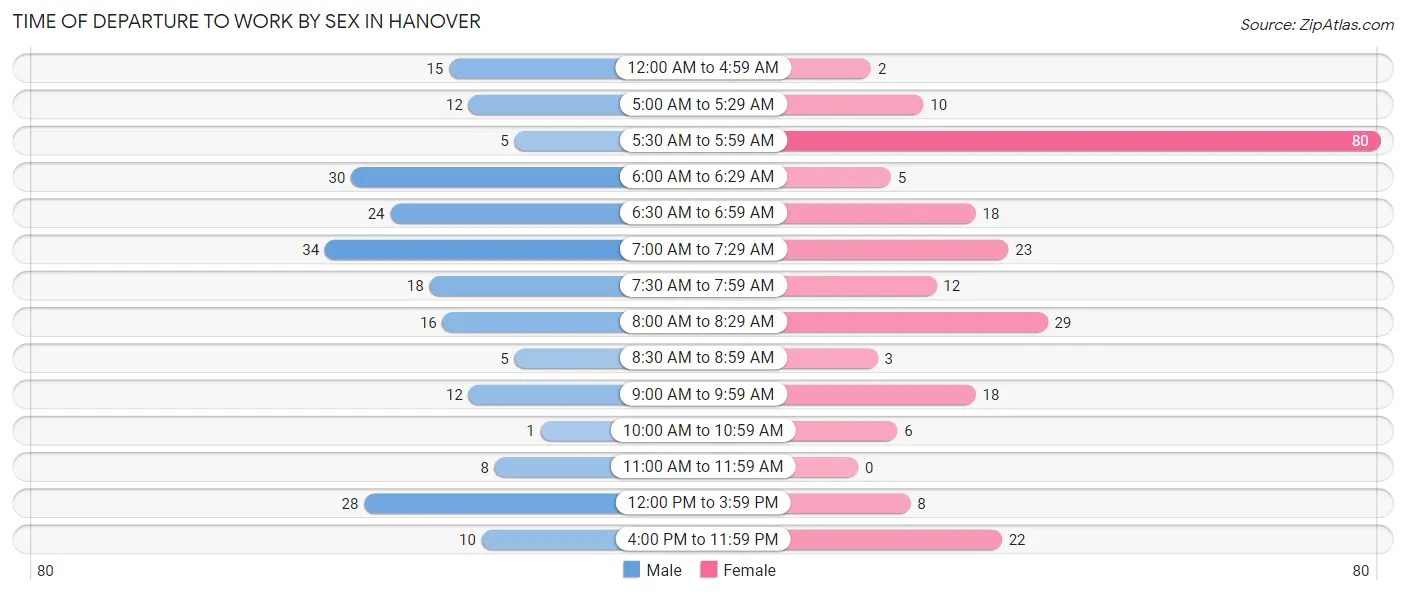
| Time of Departure | Male | Female |
| 12:00 AM to 4:59 AM | 15 (6.9%) | 2 (0.9%) |
| 5:00 AM to 5:29 AM | 12 (5.5%) | 10 (4.2%) |
| 5:30 AM to 5:59 AM | 5 (2.3%) | 80 (33.9%) |
| 6:00 AM to 6:29 AM | 30 (13.8%) | 5 (2.1%) |
| 6:30 AM to 6:59 AM | 24 (11.0%) | 18 (7.6%) |
| 7:00 AM to 7:29 AM | 34 (15.6%) | 23 (9.8%) |
| 7:30 AM to 7:59 AM | 18 (8.3%) | 12 (5.1%) |
| 8:00 AM to 8:29 AM | 16 (7.3%) | 29 (12.3%) |
| 8:30 AM to 8:59 AM | 5 (2.3%) | 3 (1.3%) |
| 9:00 AM to 9:59 AM | 12 (5.5%) | 18 (7.6%) |
| 10:00 AM to 10:59 AM | 1 (0.5%) | 6 (2.5%) |
| 11:00 AM to 11:59 AM | 8 (3.7%) | 0 (0.0%) |
| 12:00 PM to 3:59 PM | 28 (12.8%) | 8 (3.4%) |
| 4:00 PM to 11:59 PM | 10 (4.6%) | 22 (9.3%) |
| Total | 218 (100.0%) | 236 (100.0%) |
Housing Occupancy in Hanover
Occupancy by Ownership in Hanover
Of the total 427 dwellings in Hanover, owner-occupied units account for 355 (83.1%), while renter-occupied units make up 72 (16.9%).
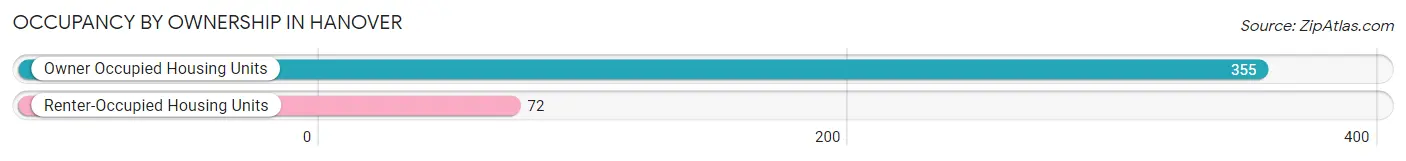
| Occupancy | # Housing Units | % Housing Units |
| Owner Occupied Housing Units | 355 | 83.1% |
| Renter-Occupied Housing Units | 72 | 16.9% |
| Total Occupied Housing Units | 427 | 100.0% |
Occupancy by Household Size in Hanover
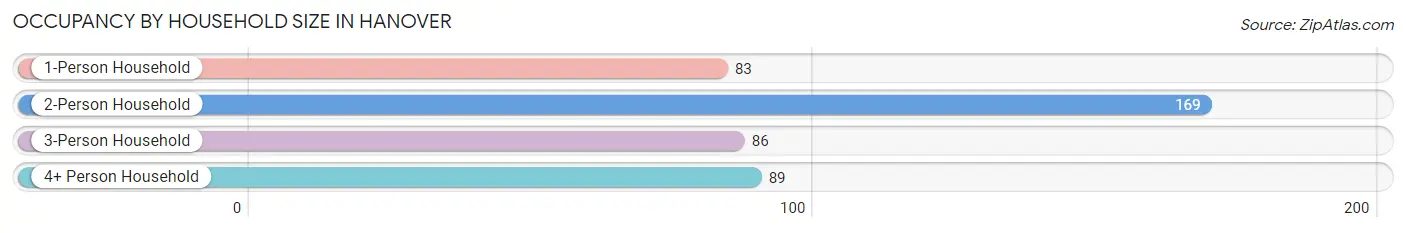
| Household Size | # Housing Units | % Housing Units |
| 1-Person Household | 83 | 19.4% |
| 2-Person Household | 169 | 39.6% |
| 3-Person Household | 86 | 20.1% |
| 4+ Person Household | 89 | 20.8% |
| Total Housing Units | 427 | 100.0% |
Occupancy by Ownership by Household Size in Hanover
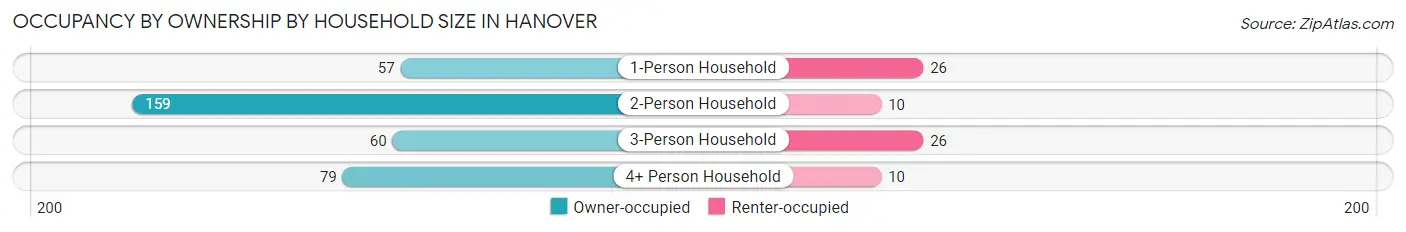
| Household Size | Owner-occupied | Renter-occupied |
| 1-Person Household | 57 (68.7%) | 26 (31.3%) |
| 2-Person Household | 159 (94.1%) | 10 (5.9%) |
| 3-Person Household | 60 (69.8%) | 26 (30.2%) |
| 4+ Person Household | 79 (88.8%) | 10 (11.2%) |
| Total Housing Units | 355 (83.1%) | 72 (16.9%) |
Occupancy by Educational Attainment in Hanover
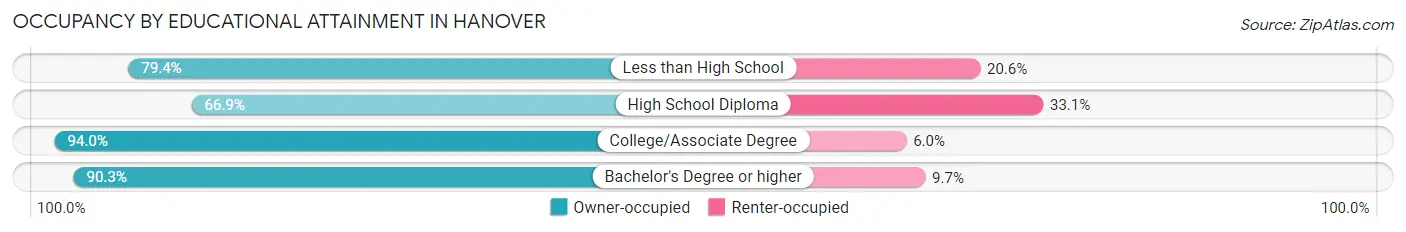
| Household Size | Owner-occupied | Renter-occupied |
| Less than High School | 27 (79.4%) | 7 (20.6%) |
| High School Diploma | 93 (66.9%) | 46 (33.1%) |
| College/Associate Degree | 142 (94.0%) | 9 (6.0%) |
| Bachelor's Degree or higher | 93 (90.3%) | 10 (9.7%) |
Occupancy by Age of Householder in Hanover
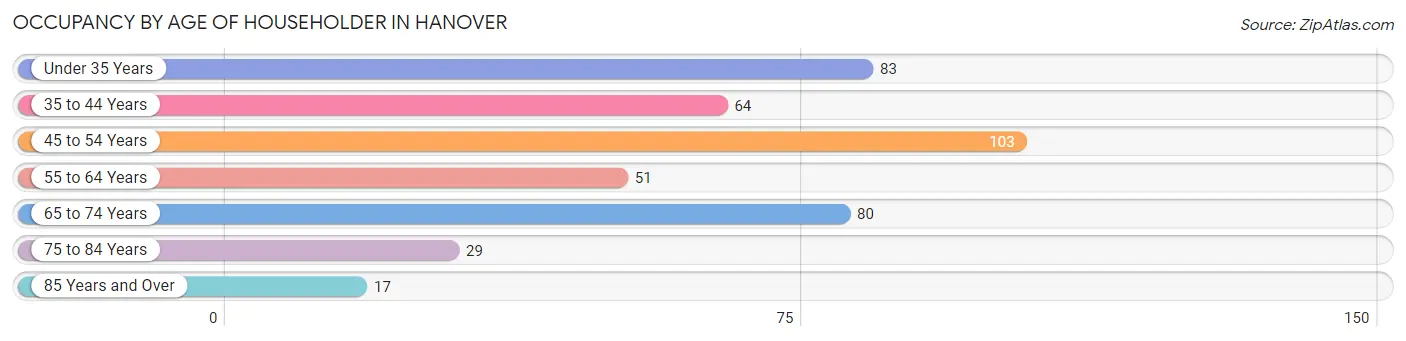
| Age Bracket | # Households | % Households |
| Under 35 Years | 83 | 19.4% |
| 35 to 44 Years | 64 | 15.0% |
| 45 to 54 Years | 103 | 24.1% |
| 55 to 64 Years | 51 | 11.9% |
| 65 to 74 Years | 80 | 18.7% |
| 75 to 84 Years | 29 | 6.8% |
| 85 Years and Over | 17 | 4.0% |
| Total | 427 | 100.0% |
Housing Finances in Hanover
Median Income by Occupancy in Hanover
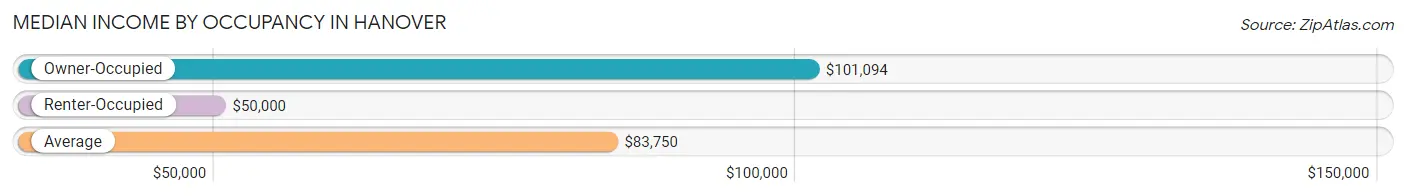
| Occupancy Type | # Households | Median Income |
| Owner-Occupied | 355 (83.1%) | $101,094 |
| Renter-Occupied | 72 (16.9%) | $50,000 |
| Average | 427 (100.0%) | $83,750 |
Occupancy by Householder Income Bracket in Hanover
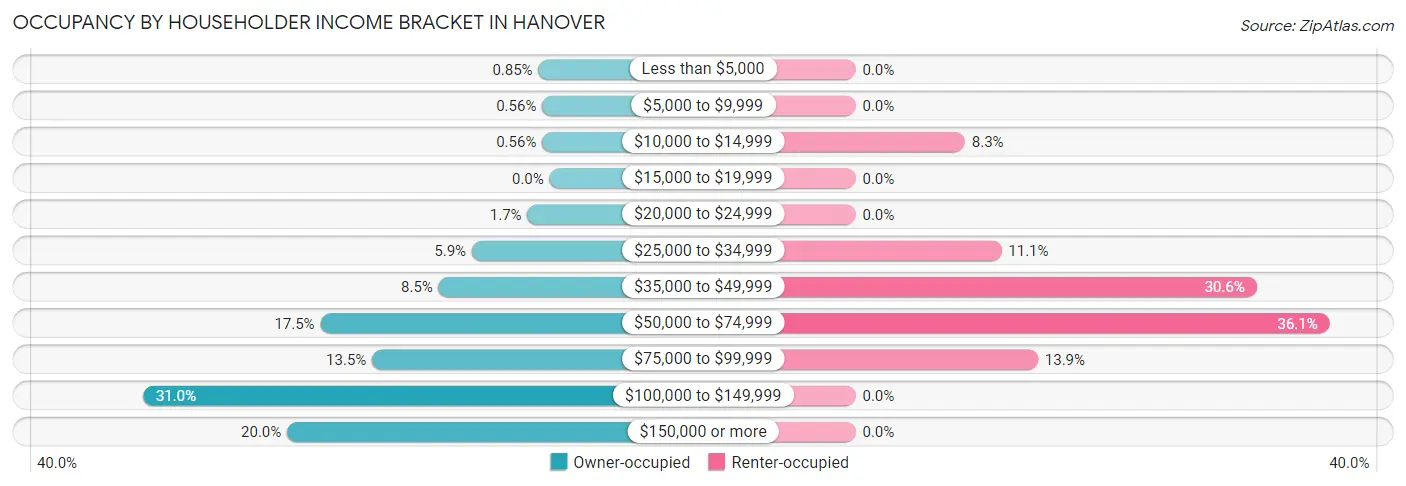
| Income Bracket | Owner-occupied | Renter-occupied |
| Less than $5,000 | 3 (0.9%) | 0 (0.0%) |
| $5,000 to $9,999 | 2 (0.6%) | 0 (0.0%) |
| $10,000 to $14,999 | 2 (0.6%) | 6 (8.3%) |
| $15,000 to $19,999 | 0 (0.0%) | 0 (0.0%) |
| $20,000 to $24,999 | 6 (1.7%) | 0 (0.0%) |
| $25,000 to $34,999 | 21 (5.9%) | 8 (11.1%) |
| $35,000 to $49,999 | 30 (8.5%) | 22 (30.6%) |
| $50,000 to $74,999 | 62 (17.5%) | 26 (36.1%) |
| $75,000 to $99,999 | 48 (13.5%) | 10 (13.9%) |
| $100,000 to $149,999 | 110 (31.0%) | 0 (0.0%) |
| $150,000 or more | 71 (20.0%) | 0 (0.0%) |
| Total | 355 (100.0%) | 72 (100.0%) |
Monthly Housing Cost Tiers in Hanover
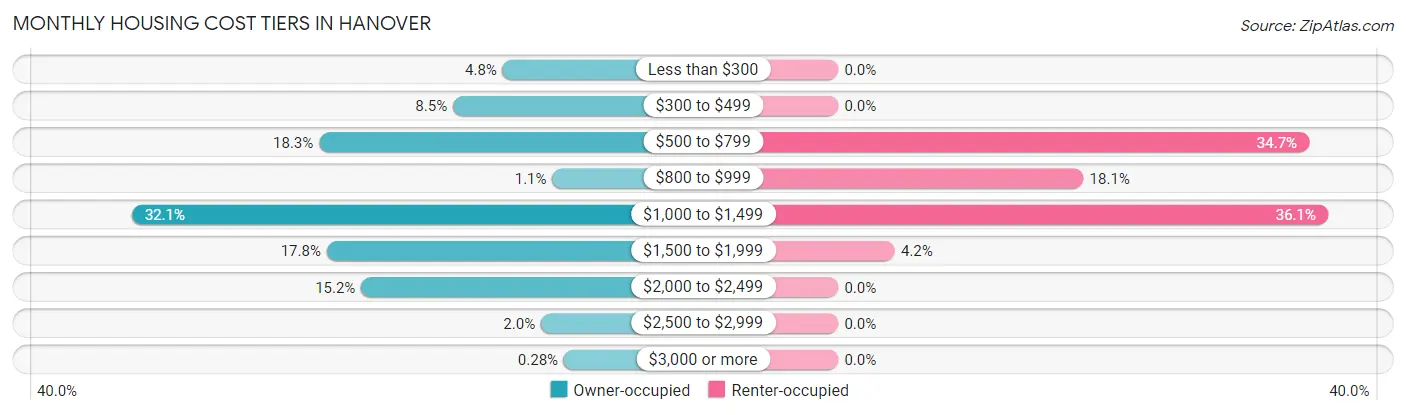
| Monthly Cost | Owner-occupied | Renter-occupied |
| Less than $300 | 17 (4.8%) | 0 (0.0%) |
| $300 to $499 | 30 (8.5%) | 0 (0.0%) |
| $500 to $799 | 65 (18.3%) | 25 (34.7%) |
| $800 to $999 | 4 (1.1%) | 13 (18.1%) |
| $1,000 to $1,499 | 114 (32.1%) | 26 (36.1%) |
| $1,500 to $1,999 | 63 (17.7%) | 3 (4.2%) |
| $2,000 to $2,499 | 54 (15.2%) | 0 (0.0%) |
| $2,500 to $2,999 | 7 (2.0%) | 0 (0.0%) |
| $3,000 or more | 1 (0.3%) | 0 (0.0%) |
| Total | 355 (100.0%) | 72 (100.0%) |
Physical Housing Characteristics in Hanover
Housing Structures in Hanover
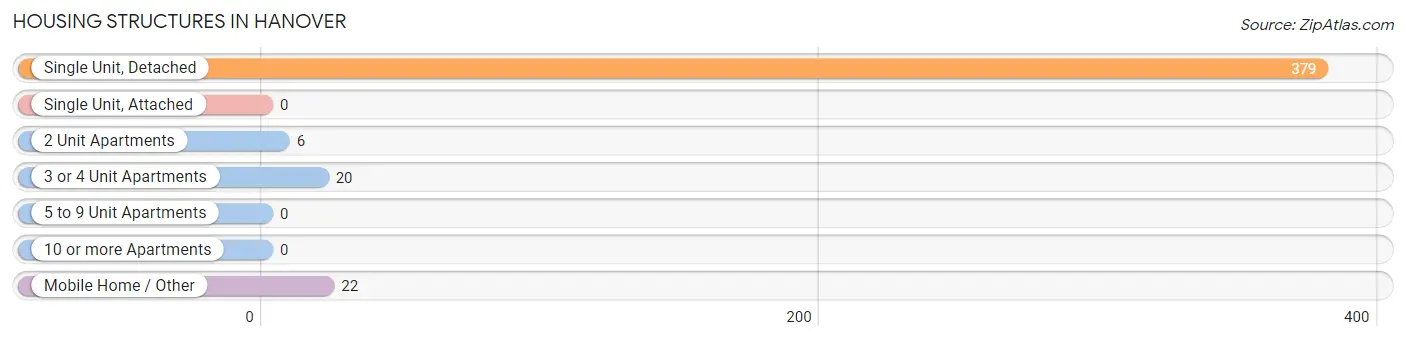
| Structure Type | # Housing Units | % Housing Units |
| Single Unit, Detached | 379 | 88.8% |
| Single Unit, Attached | 0 | 0.0% |
| 2 Unit Apartments | 6 | 1.4% |
| 3 or 4 Unit Apartments | 20 | 4.7% |
| 5 to 9 Unit Apartments | 0 | 0.0% |
| 10 or more Apartments | 0 | 0.0% |
| Mobile Home / Other | 22 | 5.1% |
| Total | 427 | 100.0% |
Housing Structures by Occupancy in Hanover
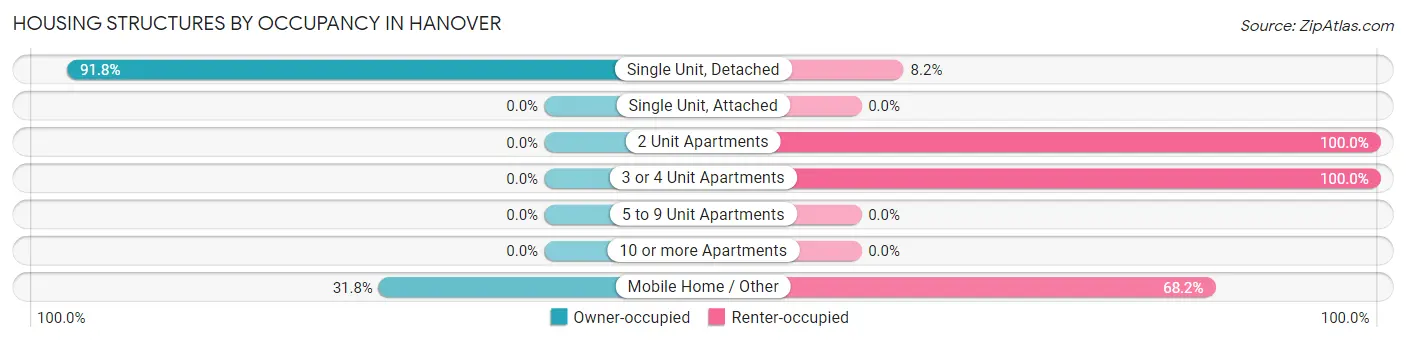
| Structure Type | Owner-occupied | Renter-occupied |
| Single Unit, Detached | 348 (91.8%) | 31 (8.2%) |
| Single Unit, Attached | 0 (0.0%) | 0 (0.0%) |
| 2 Unit Apartments | 0 (0.0%) | 6 (100.0%) |
| 3 or 4 Unit Apartments | 0 (0.0%) | 20 (100.0%) |
| 5 to 9 Unit Apartments | 0 (0.0%) | 0 (0.0%) |
| 10 or more Apartments | 0 (0.0%) | 0 (0.0%) |
| Mobile Home / Other | 7 (31.8%) | 15 (68.2%) |
| Total | 355 (83.1%) | 72 (16.9%) |
Housing Structures by Number of Rooms in Hanover
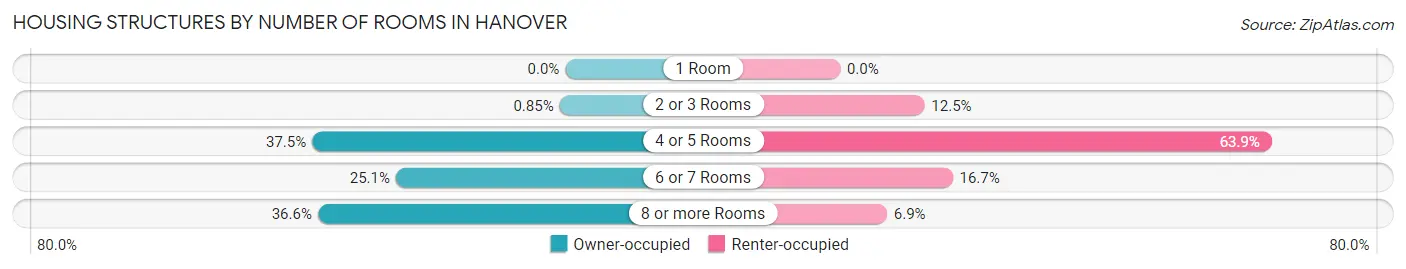
| Number of Rooms | Owner-occupied | Renter-occupied |
| 1 Room | 0 (0.0%) | 0 (0.0%) |
| 2 or 3 Rooms | 3 (0.9%) | 9 (12.5%) |
| 4 or 5 Rooms | 133 (37.5%) | 46 (63.9%) |
| 6 or 7 Rooms | 89 (25.1%) | 12 (16.7%) |
| 8 or more Rooms | 130 (36.6%) | 5 (6.9%) |
| Total | 355 (100.0%) | 72 (100.0%) |
Housing Structure by Heating Type in Hanover
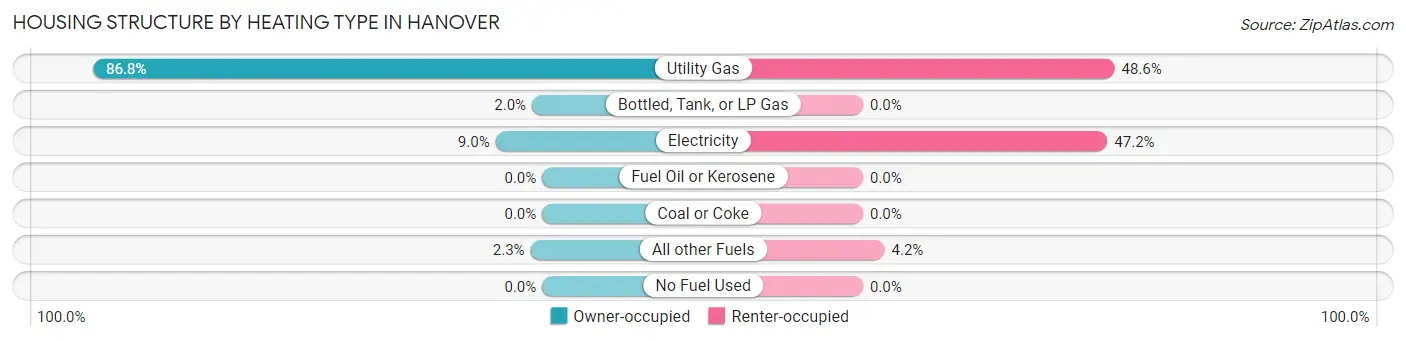
| Heating Type | Owner-occupied | Renter-occupied |
| Utility Gas | 308 (86.8%) | 35 (48.6%) |
| Bottled, Tank, or LP Gas | 7 (2.0%) | 0 (0.0%) |
| Electricity | 32 (9.0%) | 34 (47.2%) |
| Fuel Oil or Kerosene | 0 (0.0%) | 0 (0.0%) |
| Coal or Coke | 0 (0.0%) | 0 (0.0%) |
| All other Fuels | 8 (2.2%) | 3 (4.2%) |
| No Fuel Used | 0 (0.0%) | 0 (0.0%) |
| Total | 355 (100.0%) | 72 (100.0%) |
Household Vehicle Usage in Hanover
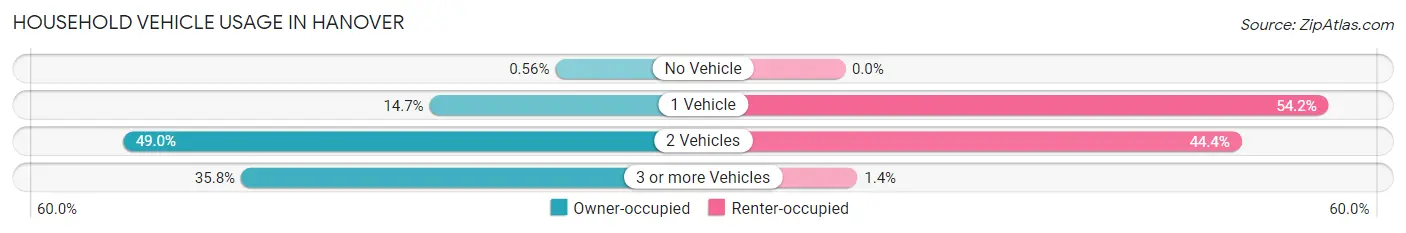
| Vehicles per Household | Owner-occupied | Renter-occupied |
| No Vehicle | 2 (0.6%) | 0 (0.0%) |
| 1 Vehicle | 52 (14.6%) | 39 (54.2%) |
| 2 Vehicles | 174 (49.0%) | 32 (44.4%) |
| 3 or more Vehicles | 127 (35.8%) | 1 (1.4%) |
| Total | 355 (100.0%) | 72 (100.0%) |
Real Estate & Mortgages in Hanover
Real Estate and Mortgage Overview in Hanover
| Characteristic | Without Mortgage | With Mortgage |
| Housing Units | 164 | 191 |
| Median Property Value | $170,700 | $237,500 |
| Median Household Income | $110,139 | $45 |
| Monthly Housing Costs | $595 | $1 |
| Real Estate Taxes | - | - |
Property Value by Mortgage Status in Hanover
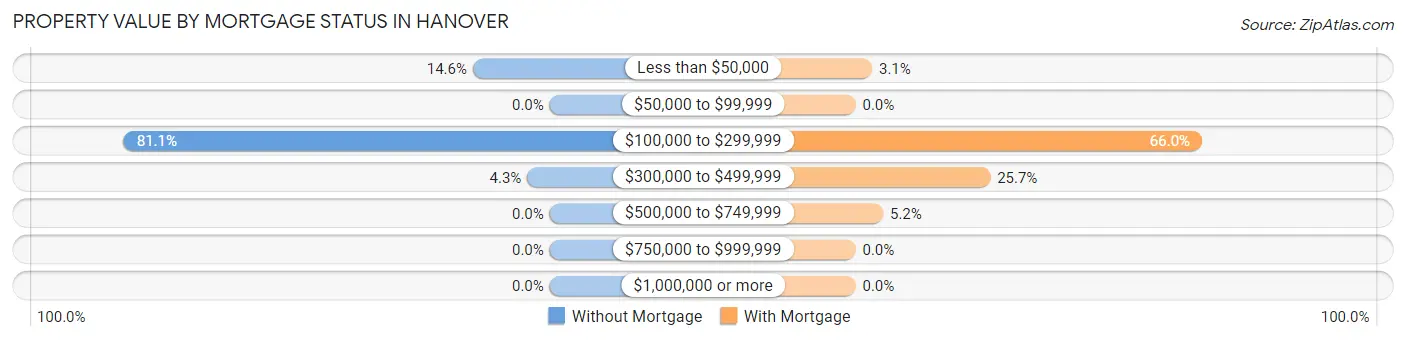
| Property Value | Without Mortgage | With Mortgage |
| Less than $50,000 | 24 (14.6%) | 6 (3.1%) |
| $50,000 to $99,999 | 0 (0.0%) | 0 (0.0%) |
| $100,000 to $299,999 | 133 (81.1%) | 126 (66.0%) |
| $300,000 to $499,999 | 7 (4.3%) | 49 (25.7%) |
| $500,000 to $749,999 | 0 (0.0%) | 10 (5.2%) |
| $750,000 to $999,999 | 0 (0.0%) | 0 (0.0%) |
| $1,000,000 or more | 0 (0.0%) | 0 (0.0%) |
| Total | 164 (100.0%) | 191 (100.0%) |
Household Income by Mortgage Status in Hanover
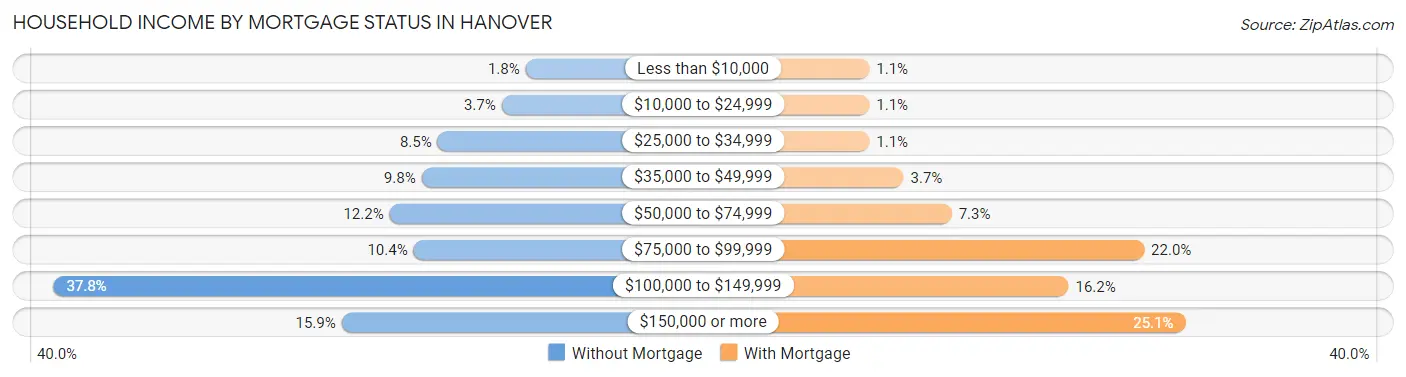
| Household Income | Without Mortgage | With Mortgage |
| Less than $10,000 | 3 (1.8%) | 2 (1.1%) |
| $10,000 to $24,999 | 6 (3.7%) | 2 (1.1%) |
| $25,000 to $34,999 | 14 (8.5%) | 2 (1.1%) |
| $35,000 to $49,999 | 16 (9.8%) | 7 (3.7%) |
| $50,000 to $74,999 | 20 (12.2%) | 14 (7.3%) |
| $75,000 to $99,999 | 17 (10.4%) | 42 (22.0%) |
| $100,000 to $149,999 | 62 (37.8%) | 31 (16.2%) |
| $150,000 or more | 26 (15.9%) | 48 (25.1%) |
| Total | 164 (100.0%) | 191 (100.0%) |
Property Value to Household Income Ratio in Hanover
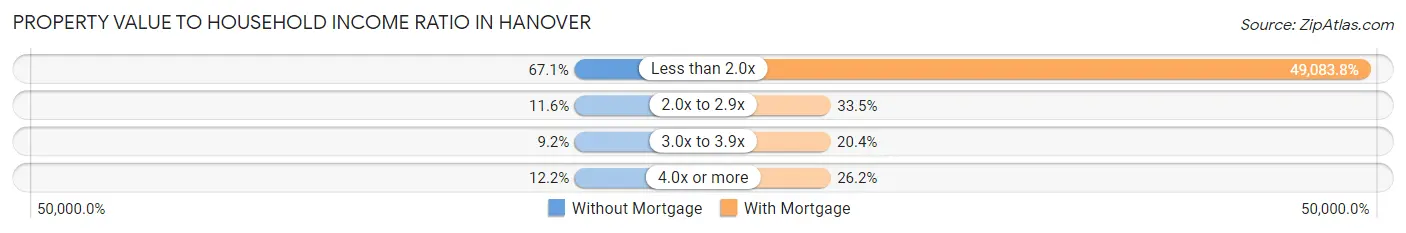
| Value-to-Income Ratio | Without Mortgage | With Mortgage |
| Less than 2.0x | 110 (67.1%) | 93,750 (49,083.8%) |
| 2.0x to 2.9x | 19 (11.6%) | 64 (33.5%) |
| 3.0x to 3.9x | 15 (9.1%) | 39 (20.4%) |
| 4.0x or more | 20 (12.2%) | 50 (26.2%) |
| Total | 164 (100.0%) | 191 (100.0%) |
Real Estate Taxes by Mortgage Status in Hanover
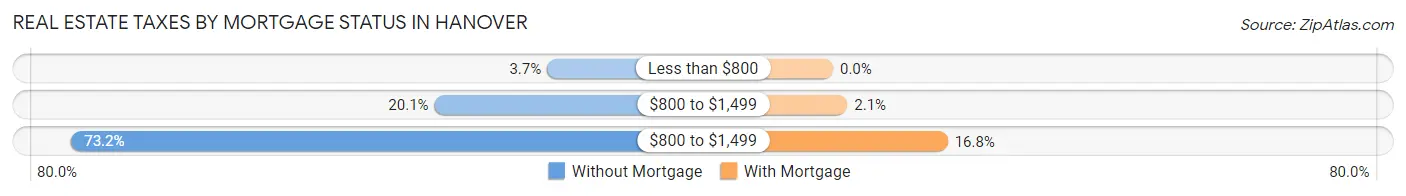
| Property Taxes | Without Mortgage | With Mortgage |
| Less than $800 | 6 (3.7%) | 0 (0.0%) |
| $800 to $1,499 | 33 (20.1%) | 4 (2.1%) |
| $800 to $1,499 | 120 (73.2%) | 32 (16.8%) |
| Total | 164 (100.0%) | 191 (100.0%) |
Health & Disability in Hanover
Health Insurance Coverage by Age in Hanover
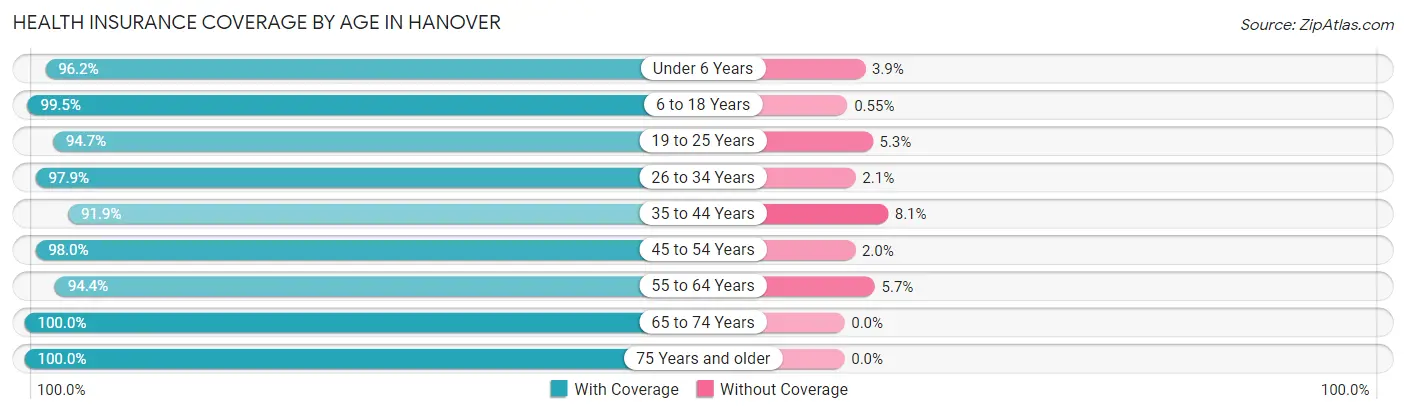
| Age Bracket | With Coverage | Without Coverage |
| Under 6 Years | 100 (96.2%) | 4 (3.8%) |
| 6 to 18 Years | 180 (99.5%) | 1 (0.5%) |
| 19 to 25 Years | 54 (94.7%) | 3 (5.3%) |
| 26 to 34 Years | 142 (97.9%) | 3 (2.1%) |
| 35 to 44 Years | 136 (91.9%) | 12 (8.1%) |
| 45 to 54 Years | 148 (98.0%) | 3 (2.0%) |
| 55 to 64 Years | 117 (94.4%) | 7 (5.7%) |
| 65 to 74 Years | 160 (100.0%) | 0 (0.0%) |
| 75 Years and older | 53 (100.0%) | 0 (0.0%) |
| Total | 1,090 (97.1%) | 33 (2.9%) |
Health Insurance Coverage by Citizenship Status in Hanover
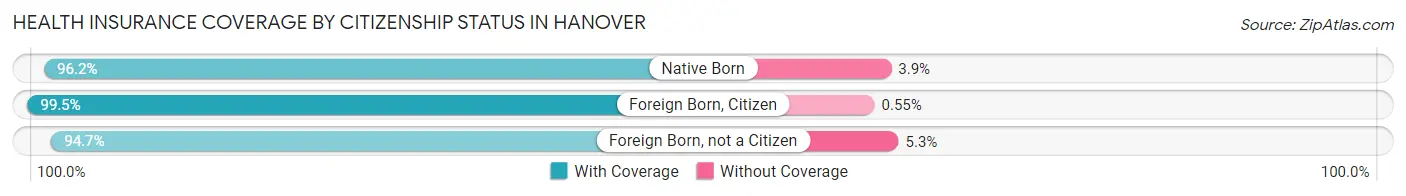
| Citizenship Status | With Coverage | Without Coverage |
| Native Born | 100 (96.2%) | 4 (3.8%) |
| Foreign Born, Citizen | 180 (99.5%) | 1 (0.5%) |
| Foreign Born, not a Citizen | 54 (94.7%) | 3 (5.3%) |
Health Insurance Coverage by Household Income in Hanover
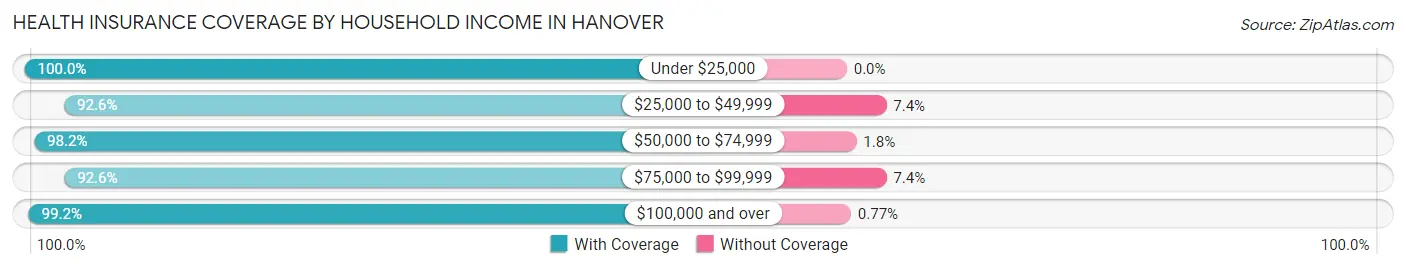
| Household Income | With Coverage | Without Coverage |
| Under $25,000 | 42 (100.0%) | 0 (0.0%) |
| $25,000 to $49,999 | 150 (92.6%) | 12 (7.4%) |
| $50,000 to $74,999 | 218 (98.2%) | 4 (1.8%) |
| $75,000 to $99,999 | 162 (92.6%) | 13 (7.4%) |
| $100,000 and over | 518 (99.2%) | 4 (0.8%) |
Public vs Private Health Insurance Coverage by Age in Hanover
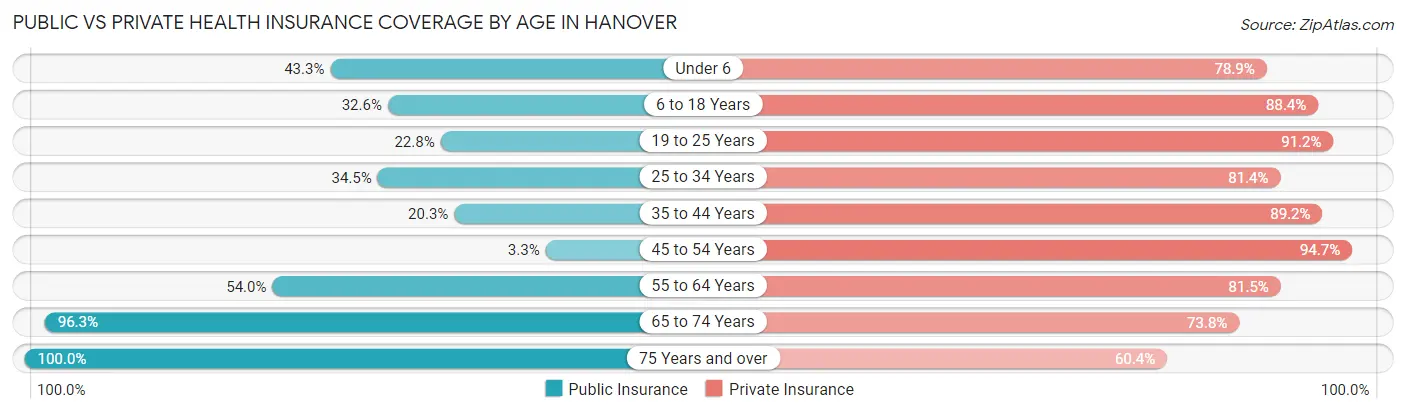
| Age Bracket | Public Insurance | Private Insurance |
| Under 6 | 45 (43.3%) | 82 (78.8%) |
| 6 to 18 Years | 59 (32.6%) | 160 (88.4%) |
| 19 to 25 Years | 13 (22.8%) | 52 (91.2%) |
| 25 to 34 Years | 50 (34.5%) | 118 (81.4%) |
| 35 to 44 Years | 30 (20.3%) | 132 (89.2%) |
| 45 to 54 Years | 5 (3.3%) | 143 (94.7%) |
| 55 to 64 Years | 67 (54.0%) | 101 (81.5%) |
| 65 to 74 Years | 154 (96.3%) | 118 (73.8%) |
| 75 Years and over | 53 (100.0%) | 32 (60.4%) |
| Total | 476 (42.4%) | 938 (83.5%) |
Disability Status by Sex by Age in Hanover
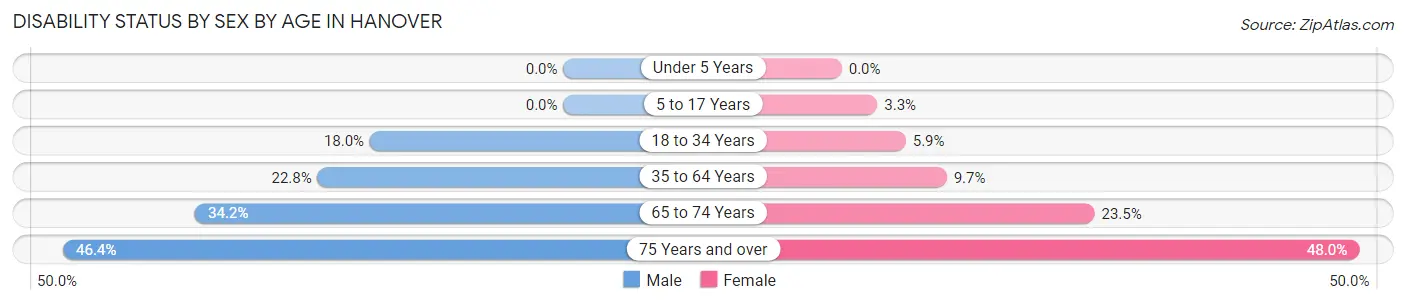
| Age Bracket | Male | Female |
| Under 5 Years | 0 (0.0%) | 0 (0.0%) |
| 5 to 17 Years | 0 (0.0%) | 3 (3.3%) |
| 18 to 34 Years | 21 (17.9%) | 6 (5.9%) |
| 35 to 64 Years | 52 (22.8%) | 19 (9.7%) |
| 65 to 74 Years | 27 (34.2%) | 19 (23.5%) |
| 75 Years and over | 13 (46.4%) | 12 (48.0%) |
Disability Class by Sex by Age in Hanover
Disability Class: Hearing Difficulty
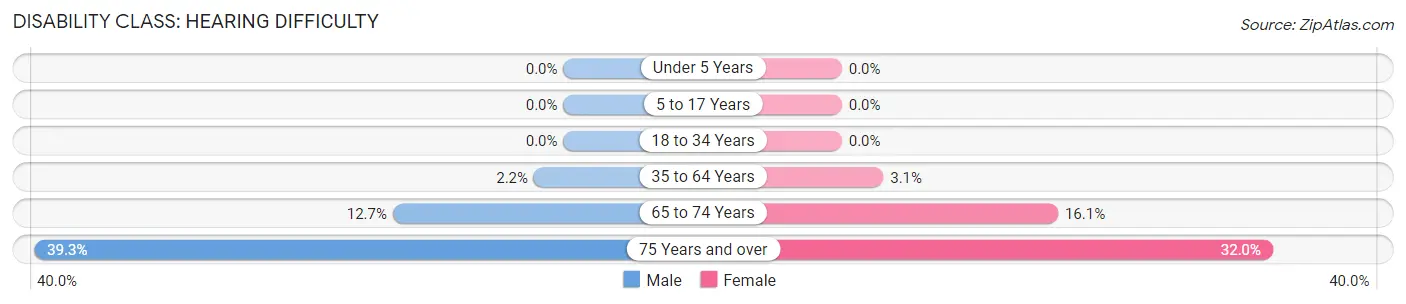
| Age Bracket | Male | Female |
| Under 5 Years | 0 (0.0%) | 0 (0.0%) |
| 5 to 17 Years | 0 (0.0%) | 0 (0.0%) |
| 18 to 34 Years | 0 (0.0%) | 0 (0.0%) |
| 35 to 64 Years | 5 (2.2%) | 6 (3.1%) |
| 65 to 74 Years | 10 (12.7%) | 13 (16.1%) |
| 75 Years and over | 11 (39.3%) | 8 (32.0%) |
Disability Class: Vision Difficulty
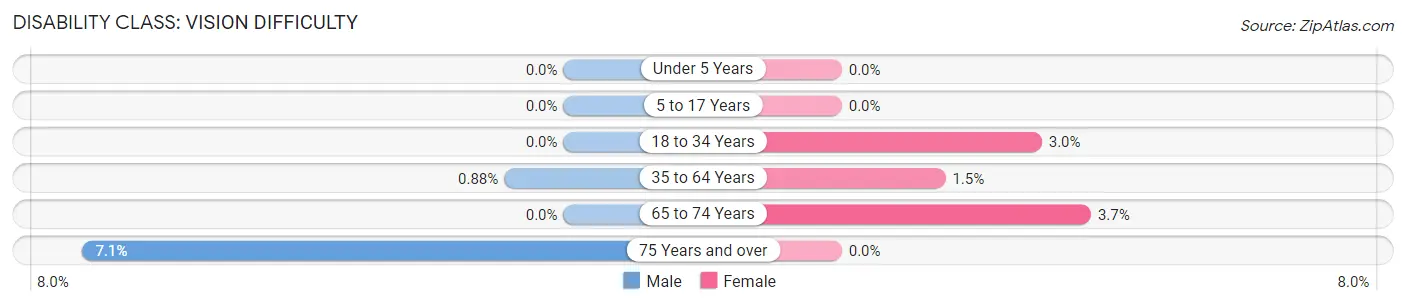
| Age Bracket | Male | Female |
| Under 5 Years | 0 (0.0%) | 0 (0.0%) |
| 5 to 17 Years | 0 (0.0%) | 0 (0.0%) |
| 18 to 34 Years | 0 (0.0%) | 3 (3.0%) |
| 35 to 64 Years | 2 (0.9%) | 3 (1.5%) |
| 65 to 74 Years | 0 (0.0%) | 3 (3.7%) |
| 75 Years and over | 2 (7.1%) | 0 (0.0%) |
Disability Class: Cognitive Difficulty
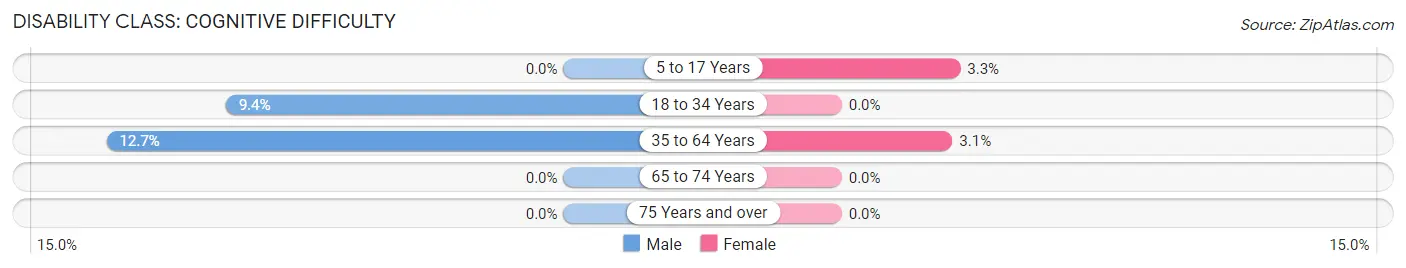
| Age Bracket | Male | Female |
| 5 to 17 Years | 0 (0.0%) | 3 (3.3%) |
| 18 to 34 Years | 11 (9.4%) | 0 (0.0%) |
| 35 to 64 Years | 29 (12.7%) | 6 (3.1%) |
| 65 to 74 Years | 0 (0.0%) | 0 (0.0%) |
| 75 Years and over | 0 (0.0%) | 0 (0.0%) |
Disability Class: Ambulatory Difficulty
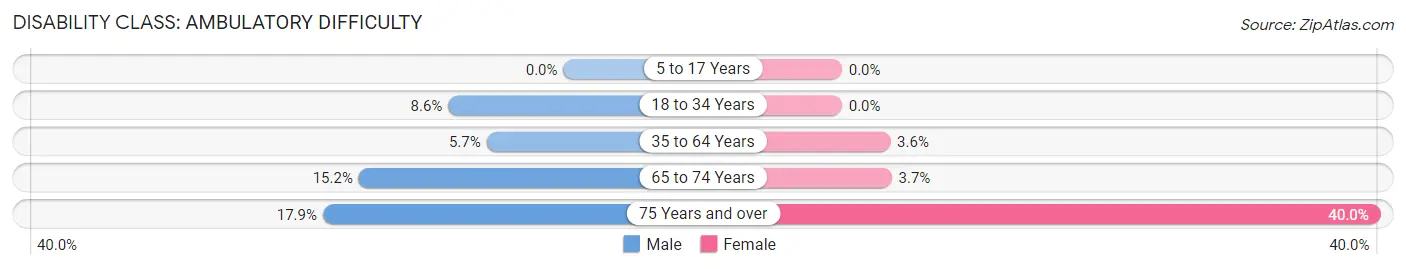
| Age Bracket | Male | Female |
| 5 to 17 Years | 0 (0.0%) | 0 (0.0%) |
| 18 to 34 Years | 10 (8.6%) | 0 (0.0%) |
| 35 to 64 Years | 13 (5.7%) | 7 (3.6%) |
| 65 to 74 Years | 12 (15.2%) | 3 (3.7%) |
| 75 Years and over | 5 (17.9%) | 10 (40.0%) |
Disability Class: Self-Care Difficulty
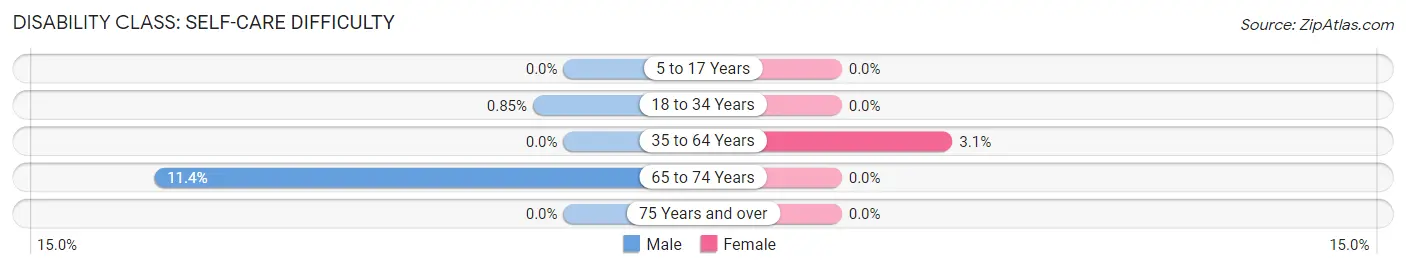
| Age Bracket | Male | Female |
| 5 to 17 Years | 0 (0.0%) | 0 (0.0%) |
| 18 to 34 Years | 1 (0.9%) | 0 (0.0%) |
| 35 to 64 Years | 0 (0.0%) | 6 (3.1%) |
| 65 to 74 Years | 9 (11.4%) | 0 (0.0%) |
| 75 Years and over | 0 (0.0%) | 0 (0.0%) |
Technology Access in Hanover
Computing Device Access in Hanover
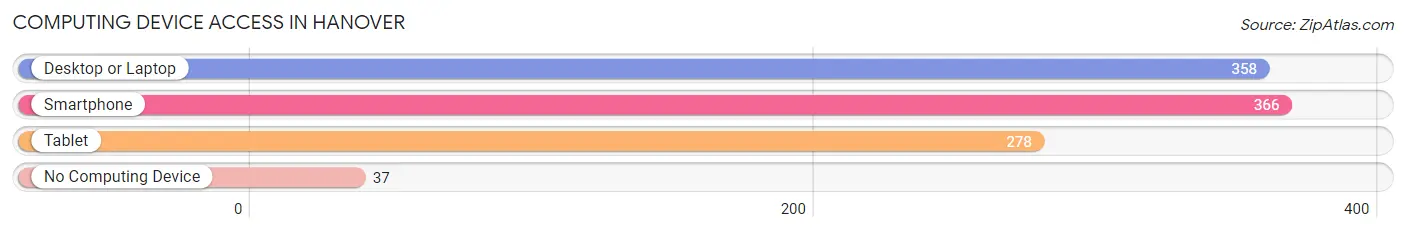
| Device Type | # Households | % Households |
| Desktop or Laptop | 358 | 83.8% |
| Smartphone | 366 | 85.7% |
| Tablet | 278 | 65.1% |
| No Computing Device | 37 | 8.7% |
| Total | 427 | 100.0% |
Internet Access in Hanover
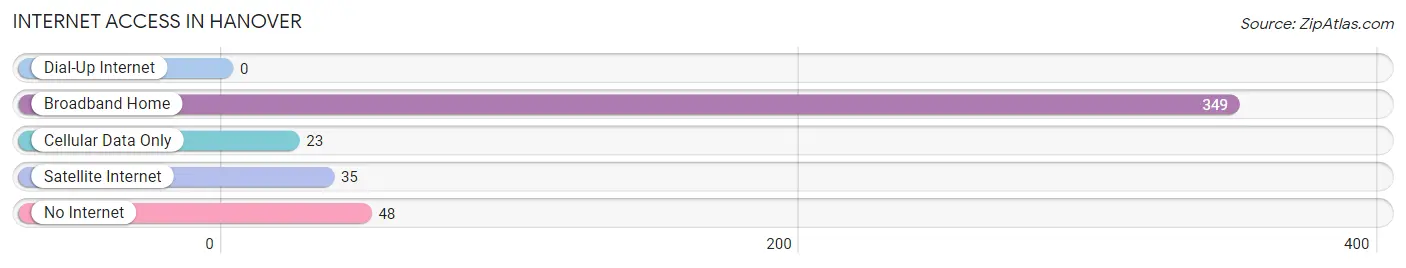
| Internet Type | # Households | % Households |
| Dial-Up Internet | 0 | 0.0% |
| Broadband Home | 349 | 81.7% |
| Cellular Data Only | 23 | 5.4% |
| Satellite Internet | 35 | 8.2% |
| No Internet | 48 | 11.2% |
| Total | 427 | 100.0% |
Hanover Summary
Hanover, Ohio is a small village located in the northeastern part of the state, in Licking County. It is situated on the banks of the Licking River, and is part of the Columbus metropolitan area. The village has a population of approximately 1,400 people, and is known for its rural charm and small-town atmosphere.
History
Hanover was founded in 1815 by a group of settlers from Pennsylvania. The village was named after the city of Hanover, Germany, and was originally part of the Virginia Military District. The village was incorporated in 1837, and the first post office was established in 1838.
In the late 19th century, Hanover was a thriving agricultural community, with a variety of crops being grown in the area. The village was also home to several mills, including a flour mill, a saw mill, and a grist mill.
In the early 20th century, Hanover began to experience a decline in population as many of its residents moved away in search of better economic opportunities. The village was also affected by the Great Depression, and many of its businesses closed.
Geography
Hanover is located in the northeastern part of Licking County, in the Appalachian Plateau region of Ohio. The village is situated on the banks of the Licking River, and is surrounded by rolling hills and forests. The village is located approximately 25 miles east of Columbus, and is part of the Columbus metropolitan area.
The climate in Hanover is humid continental, with hot summers and cold winters. The average annual temperature is around 50 degrees Fahrenheit, and the average annual precipitation is around 40 inches.
Economy
The economy of Hanover is largely based on agriculture and tourism. The village is home to several farms, which produce a variety of crops, including corn, soybeans, and wheat. The village is also home to several small businesses, including restaurants, shops, and a local winery.
Tourism is an important part of the local economy, as the village is home to several historic sites, including the Licking County Courthouse, the Hanover Presbyterian Church, and the Hanover Cemetery. The village also hosts several annual events, including the Hanover Harvest Festival and the Hanover Homecoming.
Demographics
As of the 2010 census, the population of Hanover was 1,400. The racial makeup of the village was 97.6% White, 0.6% African American, 0.3% Native American, 0.3% Asian, and 0.9% from other races. The median household income was $45,000, and the median family income was $50,000.
The village is served by the Licking Valley Local School District, which includes two elementary schools, one middle school, and one high school. The village is also home to several churches, including the Hanover Presbyterian Church and the Hanover United Methodist Church.
Common Questions
What is Per Capita Income in Hanover?
Per Capita income in Hanover is $35,680.
What is the Median Family Income in Hanover?
Median Family Income in Hanover is $110,022.
What is the Median Household income in Hanover?
Median Household Income in Hanover is $83,750.
What is Income or Wage Gap in Hanover?
Income or Wage Gap in Hanover is 29.8%.
Women in Hanover earn 70.2 cents for every dollar earned by a man.
What is Inequality or Gini Index in Hanover?
Inequality or Gini Index in Hanover is 0.32.
What is the Total Population of Hanover?
Total Population of Hanover is 1,123.
What is the Total Male Population of Hanover?
Total Male Population of Hanover is 580.
What is the Total Female Population of Hanover?
Total Female Population of Hanover is 543.
What is the Ratio of Males per 100 Females in Hanover?
There are 106.81 Males per 100 Females in Hanover.
What is the Ratio of Females per 100 Males in Hanover?
There are 93.62 Females per 100 Males in Hanover.
What is the Median Population Age in Hanover?
Median Population Age in Hanover is 40.2 Years.
What is the Average Family Size in Hanover
Average Family Size in Hanover is 3.0 People.
What is the Average Household Size in Hanover
Average Household Size in Hanover is 2.6 People.
How Large is the Labor Force in Hanover?
There are 522 People in the Labor Forcein in Hanover.
What is the Percentage of People in the Labor Force in Hanover?
60.6% of People are in the Labor Force in Hanover.
What is the Unemployment Rate in Hanover?
Unemployment Rate in Hanover is 2.1%.