Zip Codes with the Highest Percentage of Population Employed in Health Diagnosing & Treating in Westerville, OH
RELATED REPORTS & OPTIONS
Health Diagnosing & Treating
Westerville
Compare Zip Codes
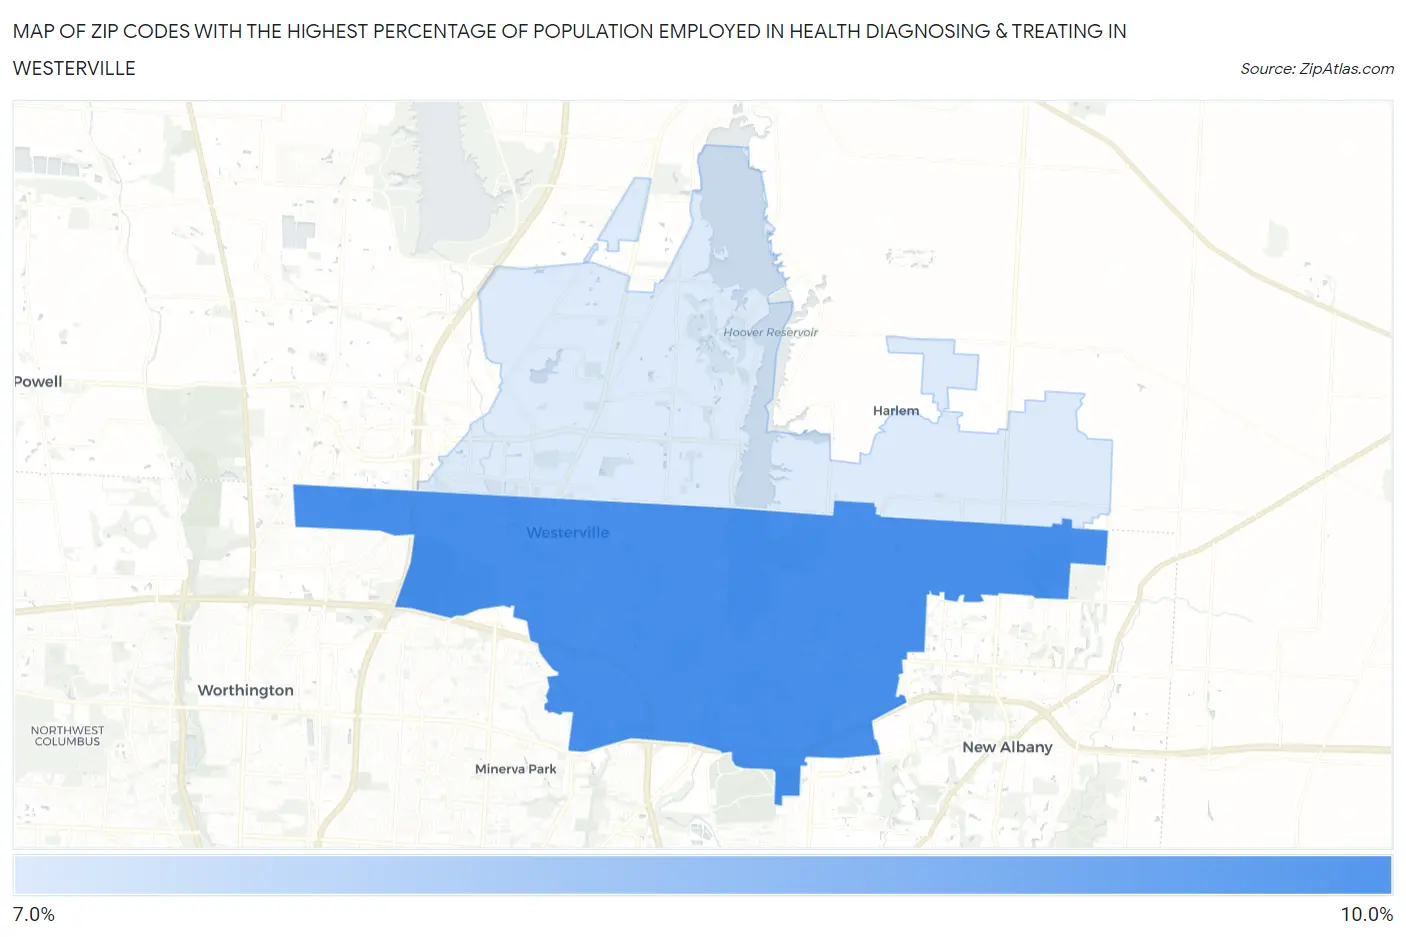
Map of Zip Codes with the Highest Percentage of Population Employed in Health Diagnosing & Treating in Westerville
7.5%
8.7%
Zip Codes with the Highest Percentage of Population Employed in Health Diagnosing & Treating in Westerville, OH
| Zip Code | % Employed | vs State | vs National | |
| 1. | 43081 | 8.7% | 7.2%(+1.56)#264 | 6.2%(+2.46)#5,918 |
| 2. | 43082 | 7.5% | 7.2%(+0.313)#398 | 6.2%(+1.22)#8,925 |
1
Common Questions
What are the Top Zip Codes with the Highest Percentage of Population Employed in Health Diagnosing & Treating in Westerville, OH?
Top Zip Codes with the Highest Percentage of Population Employed in Health Diagnosing & Treating in Westerville, OH are:
What zip code has the Highest Percentage of Population Employed in Health Diagnosing & Treating in Westerville, OH?
43081 has the Highest Percentage of Population Employed in Health Diagnosing & Treating in Westerville, OH with 8.7%.
What is the Percentage of Population Employed in Health Diagnosing & Treating in Westerville, OH?
Percentage of Population Employed in Health Diagnosing & Treating in Westerville is 9.5%.
What is the Percentage of Population Employed in Health Diagnosing & Treating in Ohio?
Percentage of Population Employed in Health Diagnosing & Treating in Ohio is 7.2%.
What is the Percentage of Population Employed in Health Diagnosing & Treating in the United States?
Percentage of Population Employed in Health Diagnosing & Treating in the United States is 6.2%.