Zip Codes with the Highest Percentage of Population Employed in Health Diagnosing & Treating in Cuyahoga Falls, OH
RELATED REPORTS & OPTIONS
Health Diagnosing & Treating
Cuyahoga Falls
Compare Zip Codes
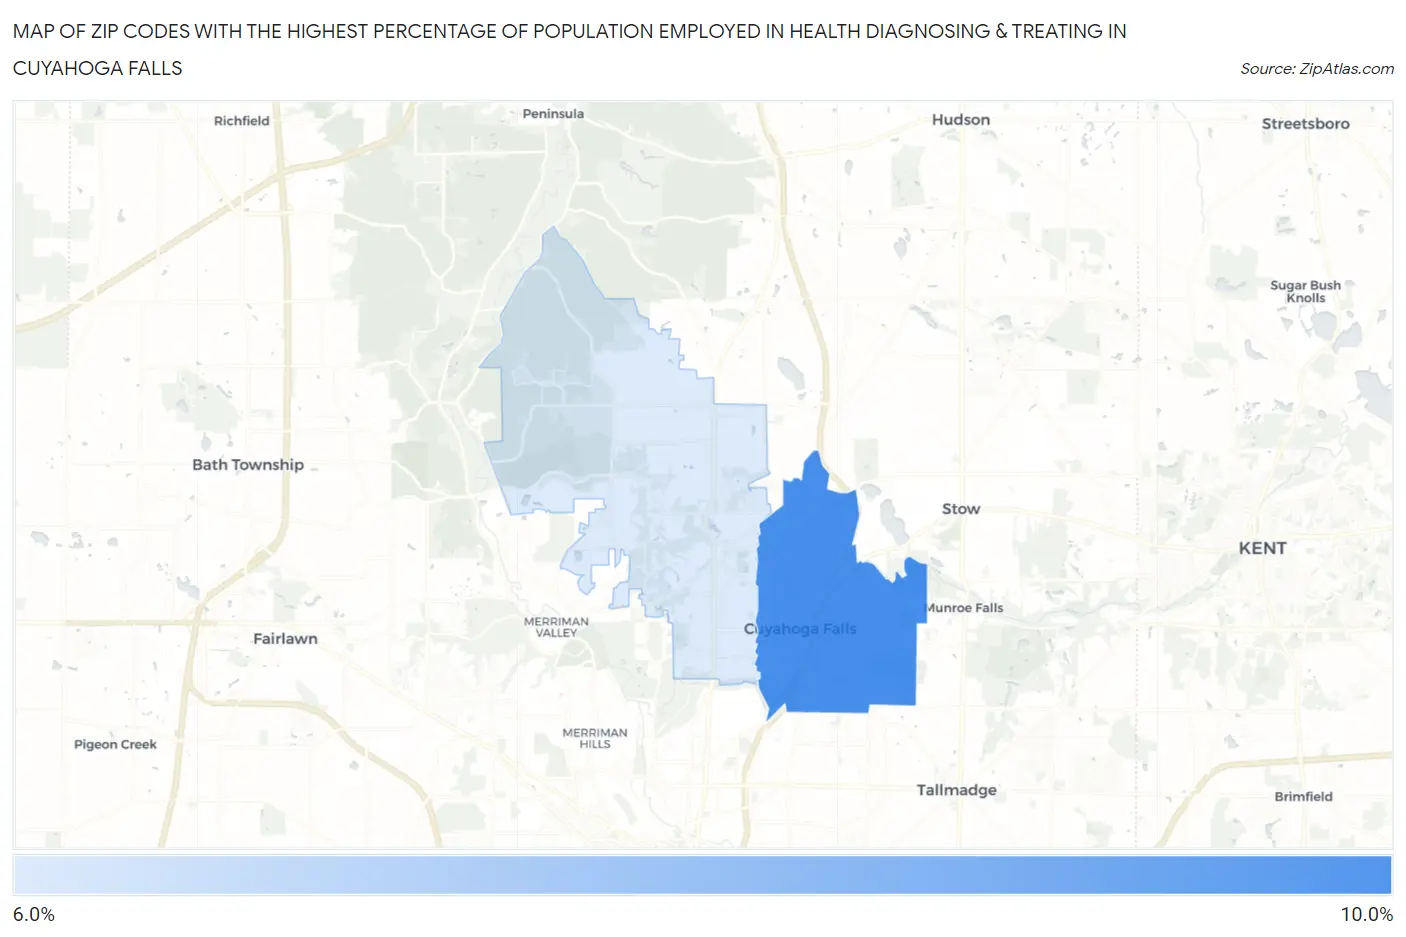
Map of Zip Codes with the Highest Percentage of Population Employed in Health Diagnosing & Treating in Cuyahoga Falls
6.7%
8.4%
Zip Codes with the Highest Percentage of Population Employed in Health Diagnosing & Treating in Cuyahoga Falls, OH
| Zip Code | % Employed | vs State | vs National | |
| 1. | 44221 | 8.4% | 7.2%(+1.25)#296 | 6.2%(+2.16)#6,520 |
| 2. | 44223 | 6.7% | 7.2%(-0.428)#513 | 6.2%(+0.479)#11,250 |
1
Common Questions
What are the Top Zip Codes with the Highest Percentage of Population Employed in Health Diagnosing & Treating in Cuyahoga Falls, OH?
Top Zip Codes with the Highest Percentage of Population Employed in Health Diagnosing & Treating in Cuyahoga Falls, OH are:
What zip code has the Highest Percentage of Population Employed in Health Diagnosing & Treating in Cuyahoga Falls, OH?
44221 has the Highest Percentage of Population Employed in Health Diagnosing & Treating in Cuyahoga Falls, OH with 8.4%.
What is the Percentage of Population Employed in Health Diagnosing & Treating in Cuyahoga Falls, OH?
Percentage of Population Employed in Health Diagnosing & Treating in Cuyahoga Falls is 8.3%.
What is the Percentage of Population Employed in Health Diagnosing & Treating in Ohio?
Percentage of Population Employed in Health Diagnosing & Treating in Ohio is 7.2%.
What is the Percentage of Population Employed in Health Diagnosing & Treating in the United States?
Percentage of Population Employed in Health Diagnosing & Treating in the United States is 6.2%.