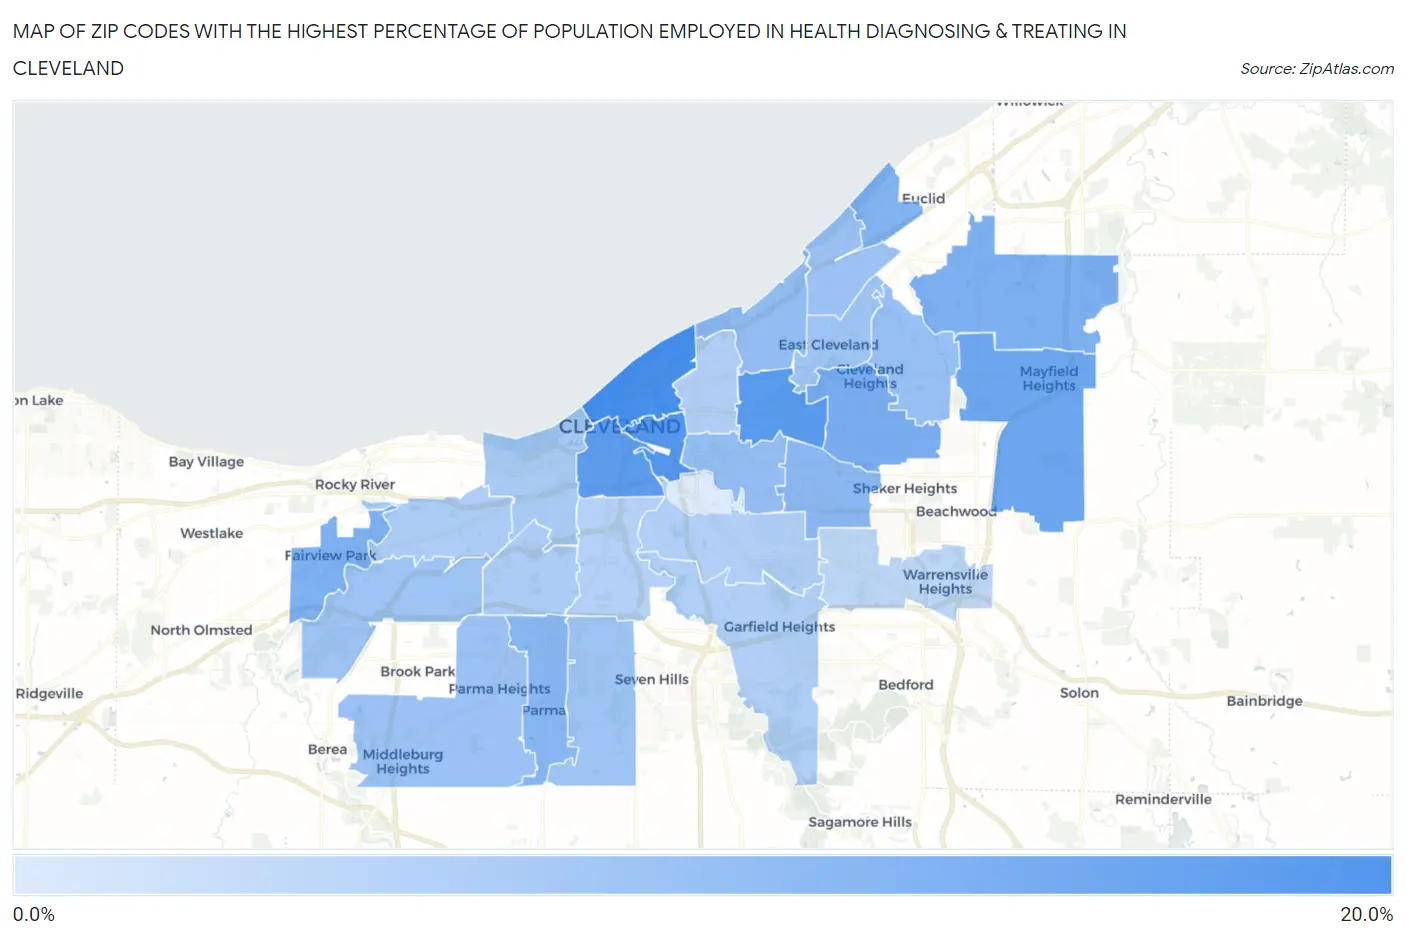
Zip Codes with the Highest Percentage of Population Employed in Health Diagnosing & Treating in Cleveland, OH
RELATED REPORTS & OPTIONS
Health Diagnosing & Treating
Cleveland
Compare Zip Codes
Map of Zip Codes with the Highest Percentage of Population Employed in Health Diagnosing & Treating in Cleveland
0.27%
15.2%

Zip Codes with the Highest Percentage of Population Employed in Health Diagnosing & Treating in Cleveland, OH
| Zip Code | % Employed | vs State | vs National | |
| 1. | 44114 | 15.2% | 7.2%(+8.07)#42 | 6.2%(+8.98)#1,100 |
| 2. | 44115 | 13.9% | 7.2%(+6.72)#54 | 6.2%(+7.62)#1,447 |
| 3. | 44106 | 13.5% | 7.2%(+6.31)#55 | 6.2%(+7.22)#1,583 |
| 4. | 44113 | 12.8% | 7.2%(+5.60)#68 | 6.2%(+6.51)#1,847 |
| 5. | 44124 | 11.0% | 7.2%(+3.87)#120 | 6.2%(+4.77)#2,879 |
| 6. | 44118 | 10.0% | 7.2%(+2.84)#167 | 6.2%(+3.74)#3,913 |
| 7. | 44143 | 9.6% | 7.2%(+2.43)#190 | 6.2%(+3.33)#4,426 |
| 8. | 44126 | 9.5% | 7.2%(+2.32)#198 | 6.2%(+3.22)#4,589 |
| 9. | 44119 | 9.3% | 7.2%(+2.15)#209 | 6.2%(+3.05)#4,865 |
| 10. | 44129 | 8.4% | 7.2%(+1.28)#293 | 6.2%(+2.18)#6,473 |
| 11. | 44120 | 8.3% | 7.2%(+1.15)#315 | 6.2%(+2.05)#6,780 |
| 12. | 44104 | 7.4% | 7.2%(+0.256)#407 | 6.2%(+1.16)#9,083 |
| 13. | 44108 | 7.4% | 7.2%(+0.255)#408 | 6.2%(+1.16)#9,100 |
| 14. | 44121 | 6.8% | 7.2%(-0.308)#498 | 6.2%(+0.599)#10,865 |
| 15. | 44130 | 6.7% | 7.2%(-0.418)#512 | 6.2%(+0.489)#11,219 |
| 16. | 44110 | 6.5% | 7.2%(-0.658)#540 | 6.2%(+0.249)#12,049 |
| 17. | 44112 | 6.3% | 7.2%(-0.834)#565 | 6.2%(+0.073)#12,695 |
| 18. | 44134 | 6.3% | 7.2%(-0.845)#568 | 6.2%(+0.062)#12,732 |
| 19. | 44135 | 6.2% | 7.2%(-0.981)#587 | 6.2%(-0.074)#13,262 |
| 20. | 44102 | 5.3% | 7.2%(-1.87)#707 | 6.2%(-0.968)#16,650 |
| 21. | 44144 | 4.9% | 7.2%(-2.21)#756 | 6.2%(-1.30)#17,932 |
| 22. | 44111 | 4.8% | 7.2%(-2.31)#772 | 6.2%(-1.40)#18,308 |
| 23. | 44103 | 4.7% | 7.2%(-2.48)#796 | 6.2%(-1.57)#18,970 |
| 24. | 44105 | 4.4% | 7.2%(-2.80)#844 | 6.2%(-1.89)#20,155 |
| 25. | 44125 | 4.3% | 7.2%(-2.83)#849 | 6.2%(-1.92)#20,266 |
| 26. | 44109 | 4.3% | 7.2%(-2.88)#859 | 6.2%(-1.97)#20,430 |
| 27. | 44128 | 3.2% | 7.2%(-3.94)#952 | 6.2%(-3.04)#23,754 |
| 28. | 44127 | 0.27% | 7.2%(-6.88)#1,102 | 6.2%(-5.97)#28,420 |
1
Common Questions
What are the Top 10 Zip Codes with the Highest Percentage of Population Employed in Health Diagnosing & Treating in Cleveland, OH?
Top 10 Zip Codes with the Highest Percentage of Population Employed in Health Diagnosing & Treating in Cleveland, OH are:
What zip code has the Highest Percentage of Population Employed in Health Diagnosing & Treating in Cleveland, OH?
44114 has the Highest Percentage of Population Employed in Health Diagnosing & Treating in Cleveland, OH with 15.2%.
What is the Percentage of Population Employed in Health Diagnosing & Treating in Cleveland, OH?
Percentage of Population Employed in Health Diagnosing & Treating in Cleveland is 6.5%.
What is the Percentage of Population Employed in Health Diagnosing & Treating in Ohio?
Percentage of Population Employed in Health Diagnosing & Treating in Ohio is 7.2%.
What is the Percentage of Population Employed in Health Diagnosing & Treating in the United States?
Percentage of Population Employed in Health Diagnosing & Treating in the United States is 6.2%.