Zip Codes with the Highest Percentage of Population Employed in Health Diagnosing & Treating in Hamilton, OH
RELATED REPORTS & OPTIONS
Health Diagnosing & Treating
Hamilton
Compare Zip Codes
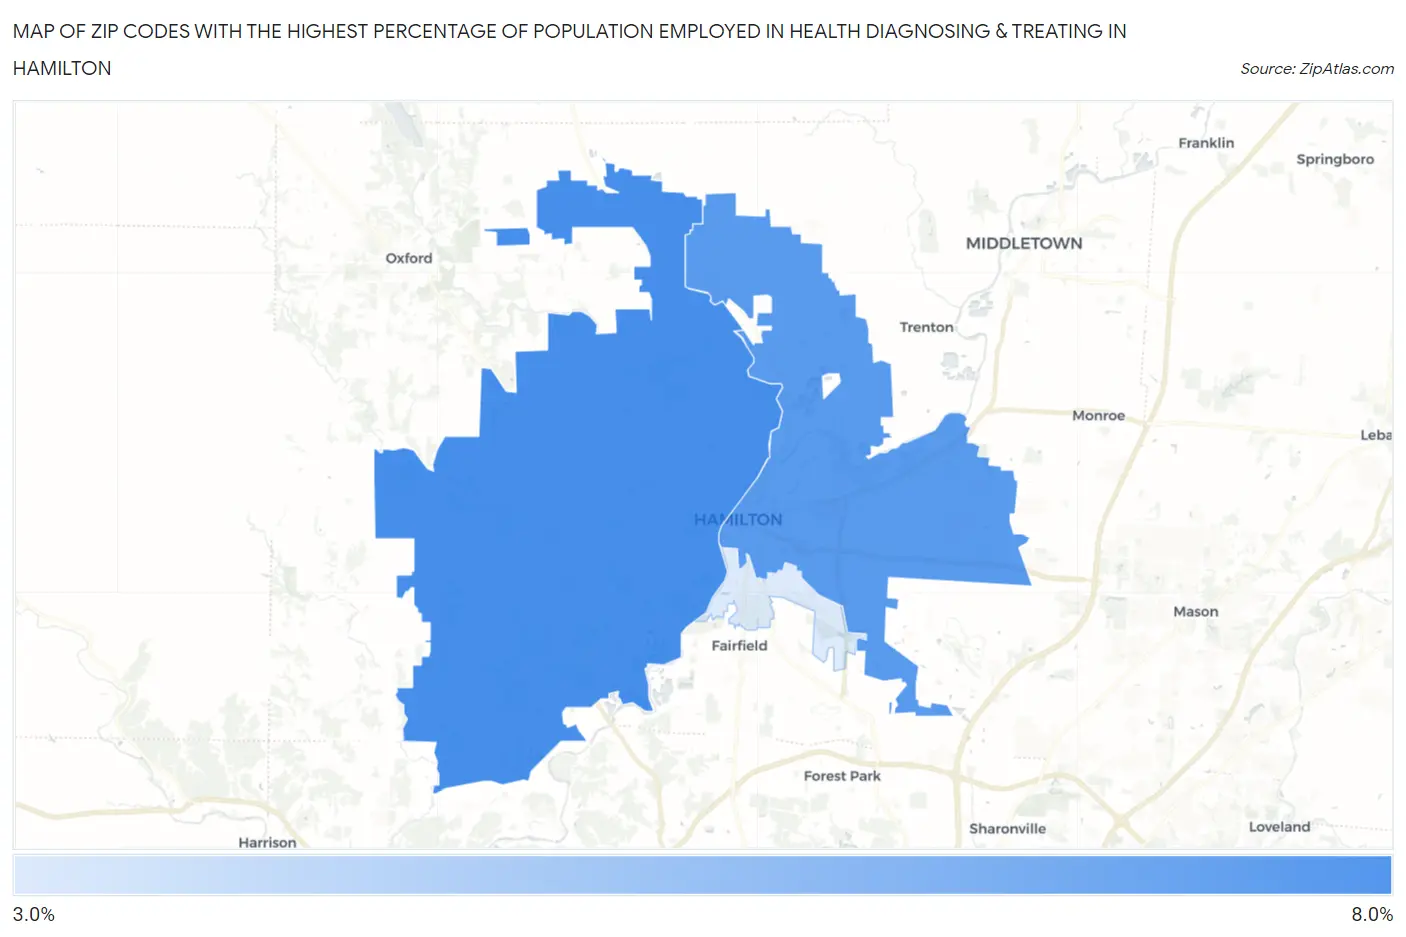
Map of Zip Codes with the Highest Percentage of Population Employed in Health Diagnosing & Treating in Hamilton
4.0%
7.5%
Zip Codes with the Highest Percentage of Population Employed in Health Diagnosing & Treating in Hamilton, OH
| Zip Code | % Employed | vs State | vs National | |
| 1. | 45013 | 7.5% | 7.2%(+0.378)#388 | 6.2%(+1.29)#8,720 |
| 2. | 45011 | 7.1% | 7.2%(-0.036)#450 | 6.2%(+0.870)#9,982 |
| 3. | 45015 | 4.0% | 7.2%(-3.19)#891 | 6.2%(-2.28)#21,469 |
1
Common Questions
What are the Top Zip Codes with the Highest Percentage of Population Employed in Health Diagnosing & Treating in Hamilton, OH?
Top Zip Codes with the Highest Percentage of Population Employed in Health Diagnosing & Treating in Hamilton, OH are:
What zip code has the Highest Percentage of Population Employed in Health Diagnosing & Treating in Hamilton, OH?
45013 has the Highest Percentage of Population Employed in Health Diagnosing & Treating in Hamilton, OH with 7.5%.
What is the Percentage of Population Employed in Health Diagnosing & Treating in Hamilton, OH?
Percentage of Population Employed in Health Diagnosing & Treating in Hamilton is 6.6%.
What is the Percentage of Population Employed in Health Diagnosing & Treating in Ohio?
Percentage of Population Employed in Health Diagnosing & Treating in Ohio is 7.2%.
What is the Percentage of Population Employed in Health Diagnosing & Treating in the United States?
Percentage of Population Employed in Health Diagnosing & Treating in the United States is 6.2%.