Burlington, OH Map & Demographics
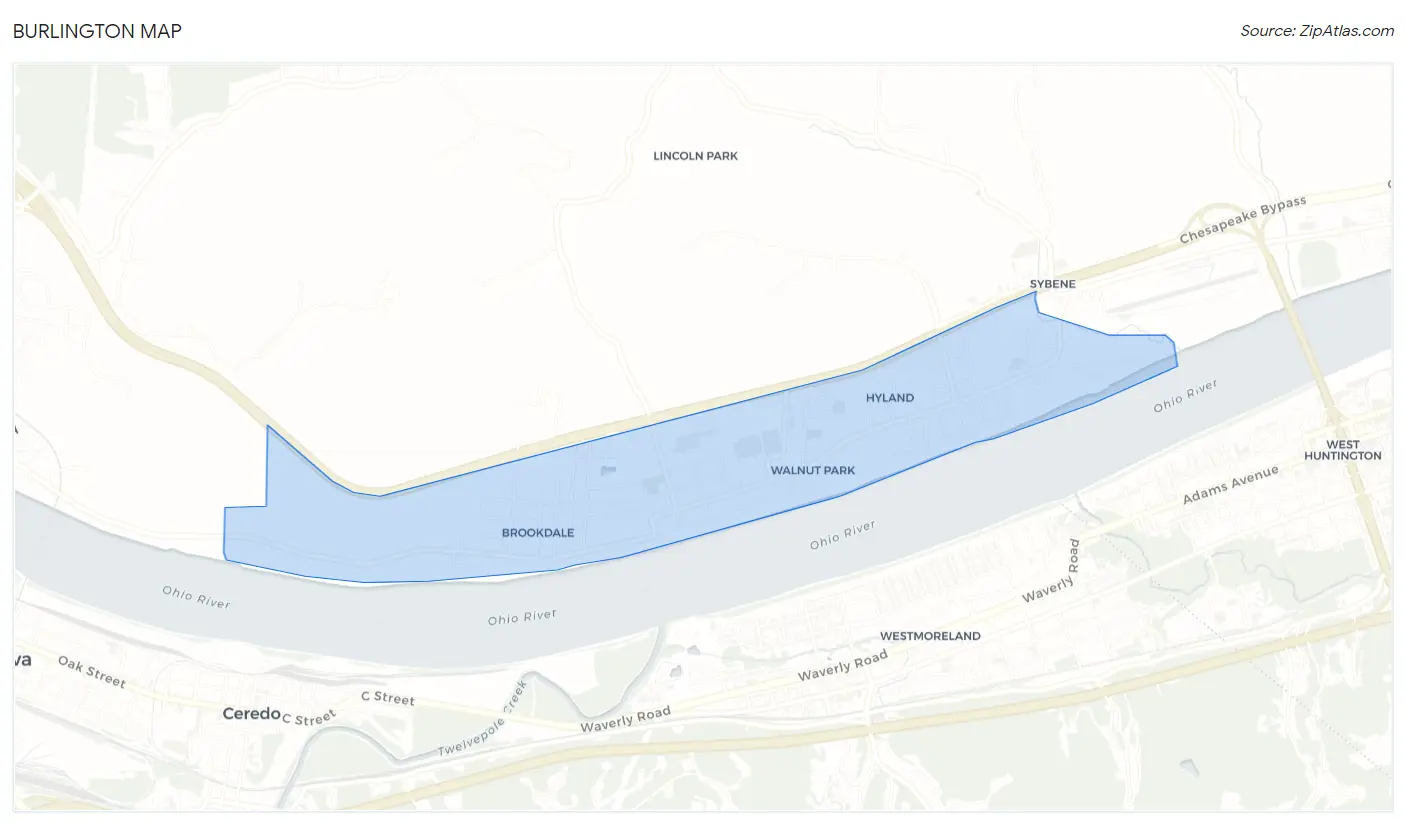
Burlington Map
Burlington Overview
$34,402
PER CAPITA INCOME
$62,788
AVG FAMILY INCOME
$39,174
AVG HOUSEHOLD INCOME
3.6%
WAGE / INCOME GAP [ % ]
96.4¢/ $1
WAGE / INCOME GAP [ $ ]
0.55
INEQUALITY / GINI INDEX
2,780
TOTAL POPULATION
1,323
MALE POPULATION
1,457
FEMALE POPULATION
90.80
MALES / 100 FEMALES
110.13
FEMALES / 100 MALES
44.5
MEDIAN AGE
3.0
AVG FAMILY SIZE
2.1
AVG HOUSEHOLD SIZE
1,173
LABOR FORCE [ PEOPLE ]
51.4%
PERCENT IN LABOR FORCE
0.9%
UNEMPLOYMENT RATE
Income in Burlington
Income Overview in Burlington
Per Capita Income in Burlington is $34,402, while median incomes of families and households are $62,788 and $39,174 respectively.
| Characteristic | Number | Measure |
| Per Capita Income | 2,780 | $34,402 |
| Median Family Income | 603 | $62,788 |
| Mean Family Income | 603 | $98,638 |
| Median Household Income | 1,230 | $39,174 |
| Mean Household Income | 1,230 | $71,349 |
| Income Deficit | 603 | $0 |
| Wage / Income Gap (%) | 2,780 | 3.56% |
| Wage / Income Gap ($) | 2,780 | 96.44¢ per $1 |
| Gini / Inequality Index | 2,780 | 0.55 |
Earnings by Sex in Burlington
Average Earnings in Burlington are $35,328, $36,193 for men and $34,904 for women, a difference of 3.6%.
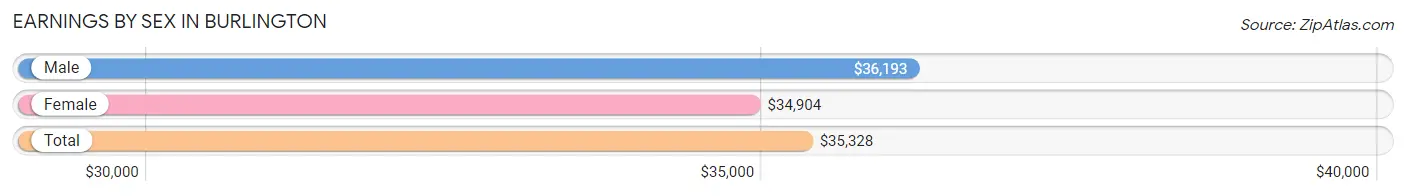
| Sex | Number | Average Earnings |
| Male | 584 (47.6%) | $36,193 |
| Female | 643 (52.4%) | $34,904 |
| Total | 1,227 (100.0%) | $35,328 |
Earnings by Sex by Income Bracket in Burlington
The most common earnings brackets in Burlington are $25,000 to $29,999 for men (153 | 26.2%) and $35,000 to $39,999 for women (228 | 35.5%).
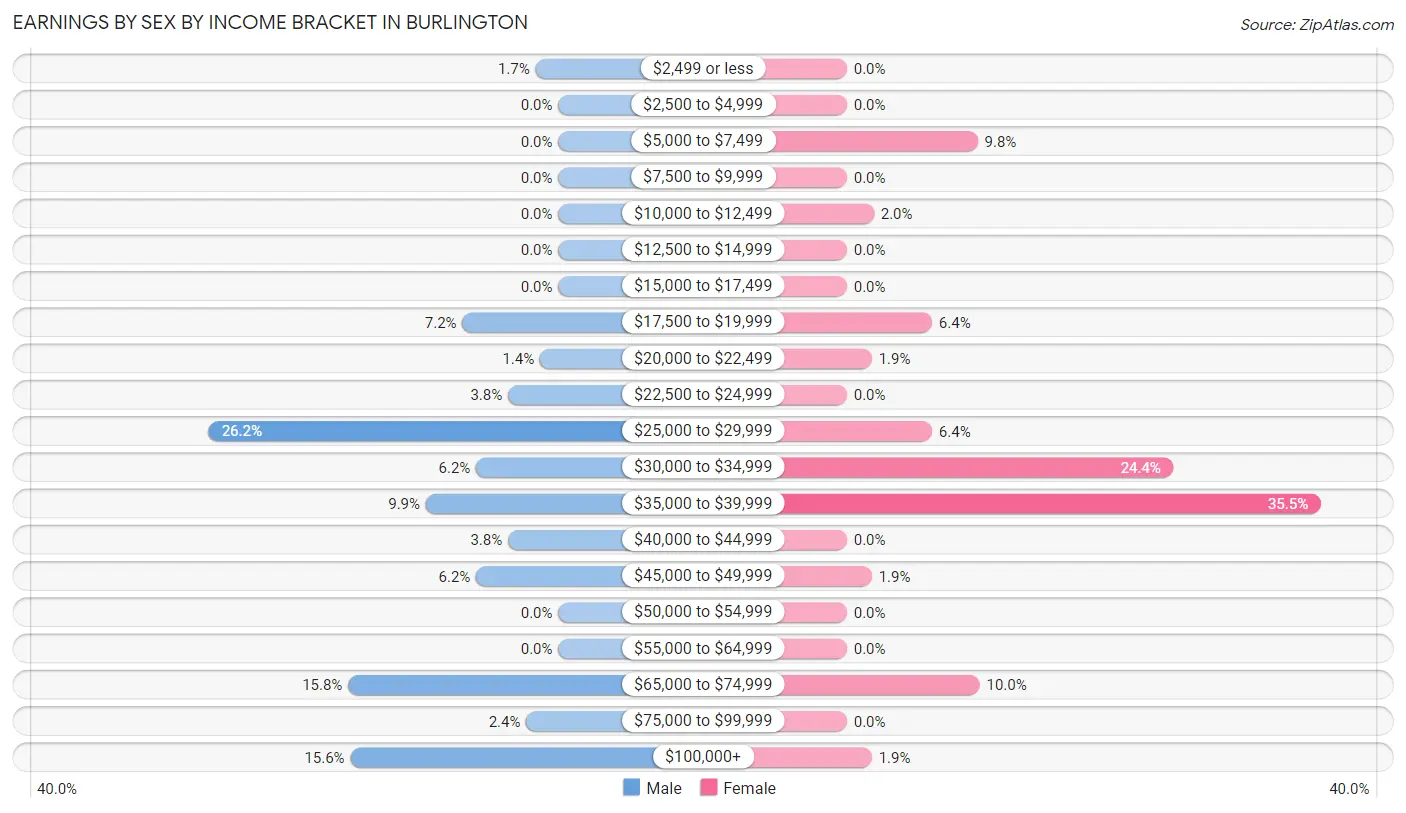
| Income | Male | Female |
| $2,499 or less | 10 (1.7%) | 0 (0.0%) |
| $2,500 to $4,999 | 0 (0.0%) | 0 (0.0%) |
| $5,000 to $7,499 | 0 (0.0%) | 63 (9.8%) |
| $7,500 to $9,999 | 0 (0.0%) | 0 (0.0%) |
| $10,000 to $12,499 | 0 (0.0%) | 13 (2.0%) |
| $12,500 to $14,999 | 0 (0.0%) | 0 (0.0%) |
| $15,000 to $17,499 | 0 (0.0%) | 0 (0.0%) |
| $17,500 to $19,999 | 42 (7.2%) | 41 (6.4%) |
| $20,000 to $22,499 | 8 (1.4%) | 12 (1.9%) |
| $22,500 to $24,999 | 22 (3.8%) | 0 (0.0%) |
| $25,000 to $29,999 | 153 (26.2%) | 41 (6.4%) |
| $30,000 to $34,999 | 36 (6.2%) | 157 (24.4%) |
| $35,000 to $39,999 | 58 (9.9%) | 228 (35.5%) |
| $40,000 to $44,999 | 22 (3.8%) | 0 (0.0%) |
| $45,000 to $49,999 | 36 (6.2%) | 12 (1.9%) |
| $50,000 to $54,999 | 0 (0.0%) | 0 (0.0%) |
| $55,000 to $64,999 | 0 (0.0%) | 0 (0.0%) |
| $65,000 to $74,999 | 92 (15.8%) | 64 (10.0%) |
| $75,000 to $99,999 | 14 (2.4%) | 0 (0.0%) |
| $100,000+ | 91 (15.6%) | 12 (1.9%) |
| Total | 584 (100.0%) | 643 (100.0%) |
Earnings by Sex by Educational Attainment in Burlington
Average earnings in Burlington are $38,036 for men and $36,622 for women, a difference of 3.7%. Men with an educational attainment of graduate degree enjoy the highest average annual earnings of $108,674, while those with high school diploma education earn the least with $36,108. Women with an educational attainment of bachelor's degree earn the most with the average annual earnings of $72,861, while those with high school diploma education have the smallest earnings of $36,993.
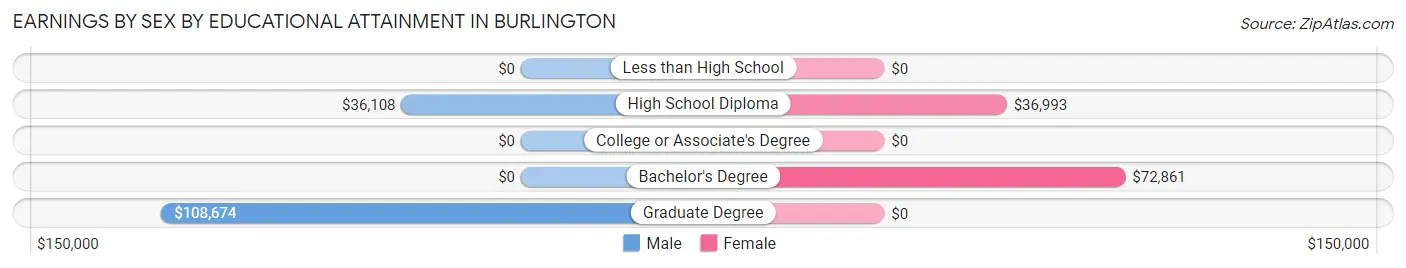
| Educational Attainment | Male Income | Female Income |
| Less than High School | - | - |
| High School Diploma | $36,108 | $36,993 |
| College or Associate's Degree | - | - |
| Bachelor's Degree | - | - |
| Graduate Degree | $108,674 | $0 |
| Total | $38,036 | $36,622 |
Family Income in Burlington
Family Income Brackets in Burlington
According to the Burlington family income data, there are 257 families falling into the $50,000 to $74,999 income range, which is the most common income bracket and makes up 42.6% of all families.
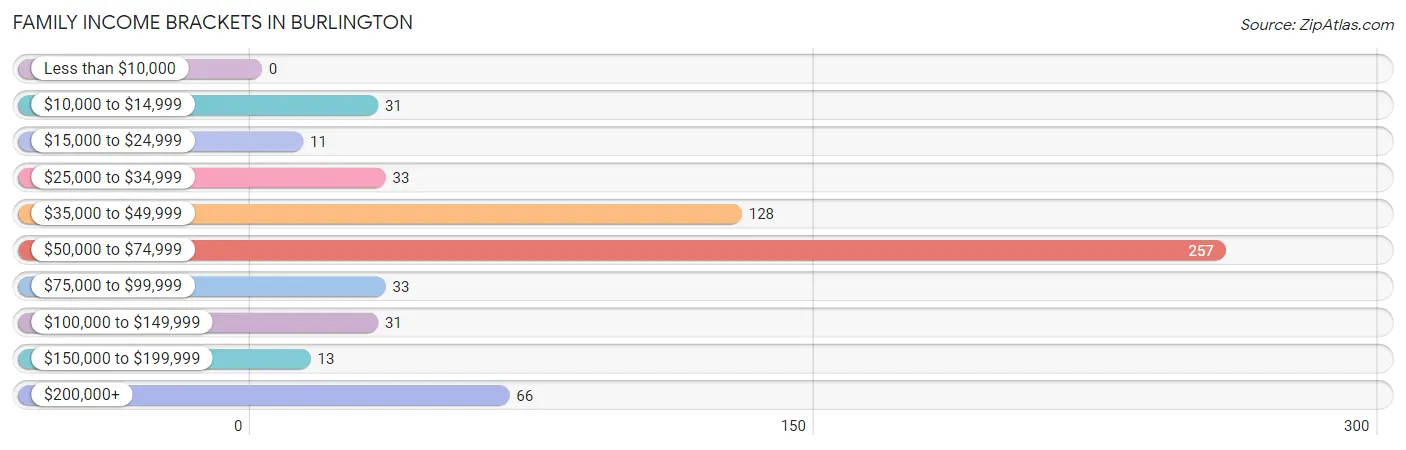
| Income Bracket | # Families | % Families |
| Less than $10,000 | 0 | 0.0% |
| $10,000 to $14,999 | 31 | 5.1% |
| $15,000 to $24,999 | 11 | 1.8% |
| $25,000 to $34,999 | 33 | 5.5% |
| $35,000 to $49,999 | 128 | 21.2% |
| $50,000 to $74,999 | 257 | 42.6% |
| $75,000 to $99,999 | 33 | 5.5% |
| $100,000 to $149,999 | 31 | 5.1% |
| $150,000 to $199,999 | 13 | 2.2% |
| $200,000+ | 66 | 10.9% |
Family Income by Famaliy Size in Burlington
4-person families (165 | 27.4%) account for the highest median family income in Burlington with $63,942 per family, while 2-person families (152 | 25.2%) have the highest median income of $29,886 per family member.
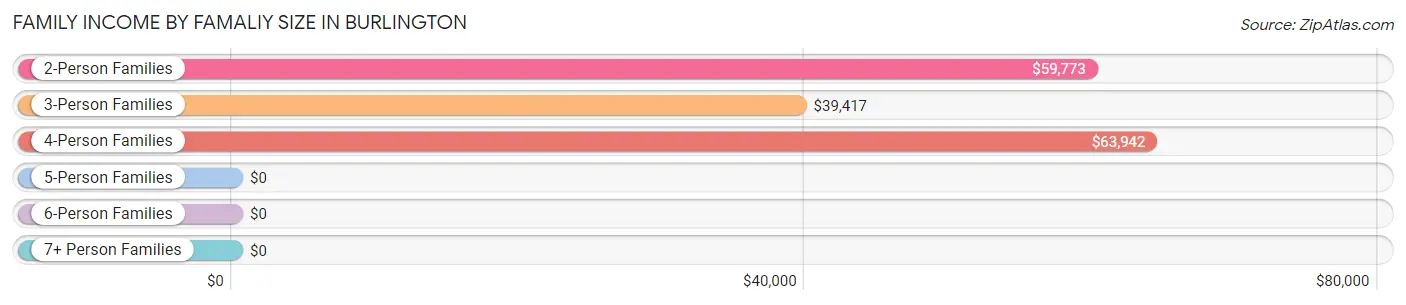
| Income Bracket | # Families | Median Income |
| 2-Person Families | 152 (25.2%) | $59,773 |
| 3-Person Families | 263 (43.6%) | $39,417 |
| 4-Person Families | 165 (27.4%) | $63,942 |
| 5-Person Families | 23 (3.8%) | $0 |
| 6-Person Families | 0 (0.0%) | $0 |
| 7+ Person Families | 0 (0.0%) | $0 |
| Total | 603 (100.0%) | $62,788 |
Family Income by Number of Earners in Burlington
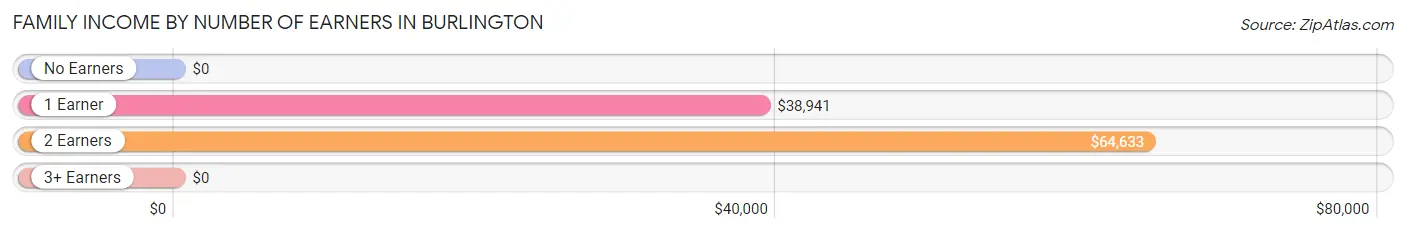
| Number of Earners | # Families | Median Income |
| No Earners | 82 (13.6%) | $0 |
| 1 Earner | 222 (36.8%) | $38,941 |
| 2 Earners | 268 (44.4%) | $64,633 |
| 3+ Earners | 31 (5.1%) | $0 |
| Total | 603 (100.0%) | $62,788 |
Household Income in Burlington
Household Income Brackets in Burlington
With 323 households falling in the category, the $50,000 to $74,999 income range is the most frequent in Burlington, accounting for 26.3% of all households. In contrast, only 25 households (2.0%) fall into the $150,000 to $199,999 income bracket, making it the least populous group.
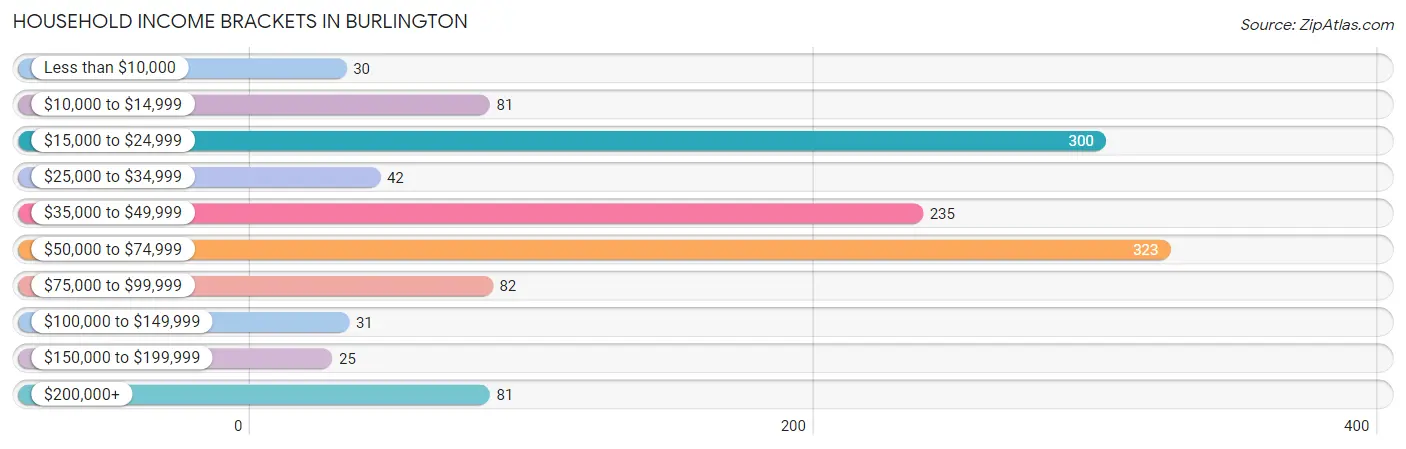
| Income Bracket | # Households | % Households |
| Less than $10,000 | 30 | 2.4% |
| $10,000 to $14,999 | 81 | 6.6% |
| $15,000 to $24,999 | 300 | 24.4% |
| $25,000 to $34,999 | 42 | 3.4% |
| $35,000 to $49,999 | 235 | 19.1% |
| $50,000 to $74,999 | 323 | 26.3% |
| $75,000 to $99,999 | 82 | 6.7% |
| $100,000 to $149,999 | 31 | 2.5% |
| $150,000 to $199,999 | 25 | 2.0% |
| $200,000+ | 81 | 6.6% |
Household Income by Householder Age in Burlington
The median household income in Burlington is $39,174, with the highest median household income of $65,714 found in the 45 to 64 years age bracket for the primary householder. A total of 332 households (27.0%) fall into this category. Meanwhile, the 15 to 24 years age bracket for the primary householder has the lowest median household income of $0, with 143 households (11.6%) in this group.
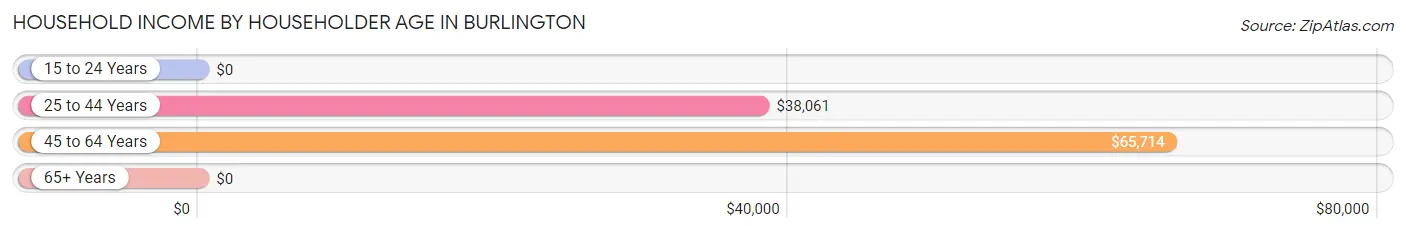
| Income Bracket | # Households | Median Income |
| 15 to 24 Years | 143 (11.6%) | $0 |
| 25 to 44 Years | 283 (23.0%) | $38,061 |
| 45 to 64 Years | 332 (27.0%) | $65,714 |
| 65+ Years | 472 (38.4%) | $0 |
| Total | 1,230 (100.0%) | $39,174 |
Poverty in Burlington
Income Below Poverty by Sex and Age in Burlington
With 2.1% poverty level for males and 15.1% for females among the residents of Burlington, 55 to 64 year old males and 12 to 14 year old females are the most vulnerable to poverty, with 27 males (25.7%) and 23 females (100.0%) in their respective age groups living below the poverty level.
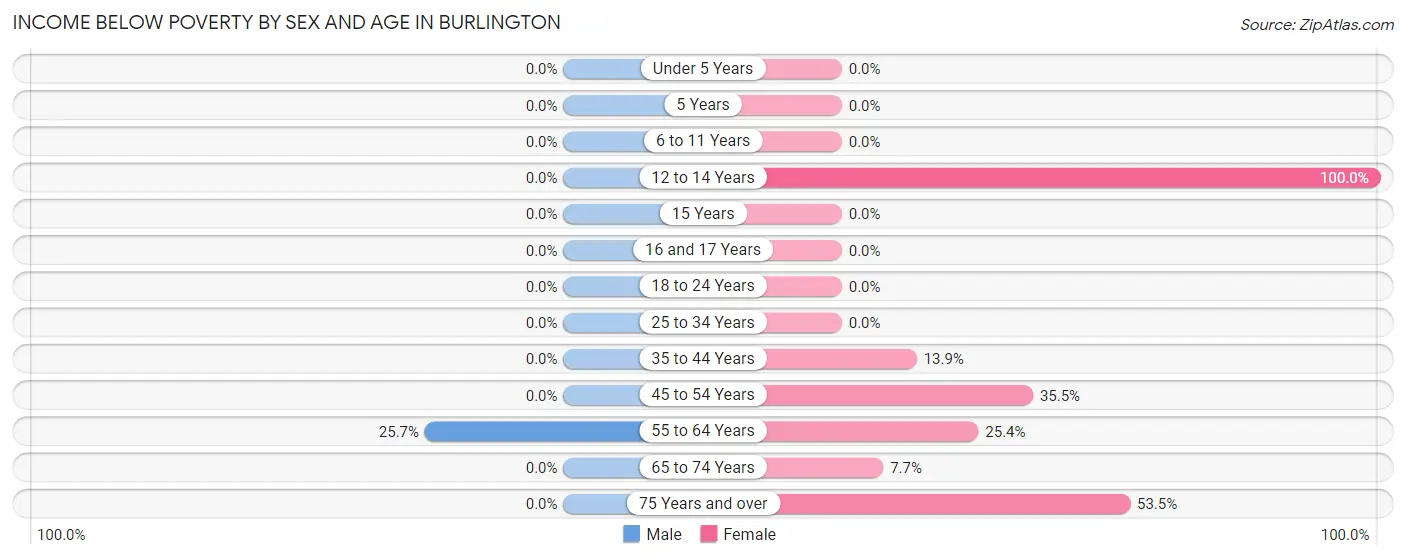
| Age Bracket | Male | Female |
| Under 5 Years | 0 (0.0%) | 0 (0.0%) |
| 5 Years | 0 (0.0%) | 0 (0.0%) |
| 6 to 11 Years | 0 (0.0%) | 0 (0.0%) |
| 12 to 14 Years | 0 (0.0%) | 23 (100.0%) |
| 15 Years | 0 (0.0%) | 0 (0.0%) |
| 16 and 17 Years | 0 (0.0%) | 0 (0.0%) |
| 18 to 24 Years | 0 (0.0%) | 0 (0.0%) |
| 25 to 34 Years | 0 (0.0%) | 0 (0.0%) |
| 35 to 44 Years | 0 (0.0%) | 31 (13.9%) |
| 45 to 54 Years | 0 (0.0%) | 33 (35.5%) |
| 55 to 64 Years | 27 (25.7%) | 54 (25.4%) |
| 65 to 74 Years | 0 (0.0%) | 22 (7.7%) |
| 75 Years and over | 0 (0.0%) | 38 (53.5%) |
| Total | 27 (2.1%) | 201 (15.1%) |
Income Above Poverty by Sex and Age in Burlington
According to the poverty statistics in Burlington, males aged 6 to 11 years and females aged 6 to 11 years are the age groups that are most secure financially, with 100.0% of males and 100.0% of females in these age groups living above the poverty line.
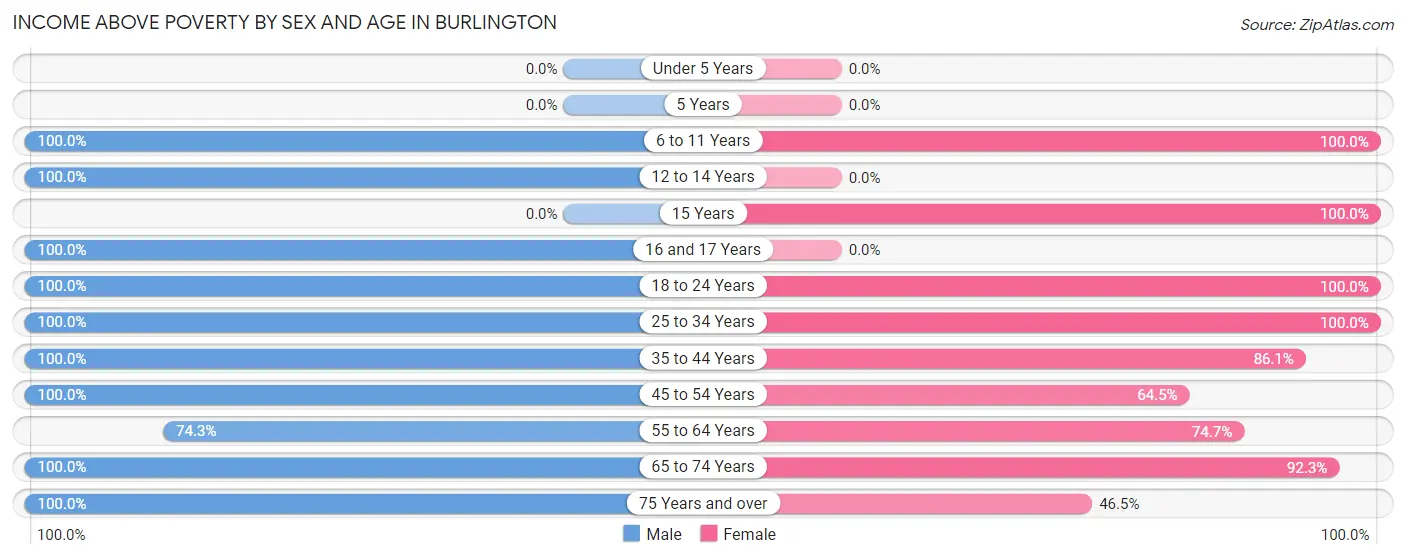
| Age Bracket | Male | Female |
| Under 5 Years | 0 (0.0%) | 0 (0.0%) |
| 5 Years | 0 (0.0%) | 0 (0.0%) |
| 6 to 11 Years | 130 (100.0%) | 181 (100.0%) |
| 12 to 14 Years | 139 (100.0%) | 0 (0.0%) |
| 15 Years | 0 (0.0%) | 15 (100.0%) |
| 16 and 17 Years | 10 (100.0%) | 0 (0.0%) |
| 18 to 24 Years | 125 (100.0%) | 179 (100.0%) |
| 25 to 34 Years | 225 (100.0%) | 50 (100.0%) |
| 35 to 44 Years | 156 (100.0%) | 192 (86.1%) |
| 45 to 54 Years | 76 (100.0%) | 60 (64.5%) |
| 55 to 64 Years | 78 (74.3%) | 159 (74.7%) |
| 65 to 74 Years | 197 (100.0%) | 264 (92.3%) |
| 75 Years and over | 97 (100.0%) | 33 (46.5%) |
| Total | 1,233 (97.9%) | 1,133 (84.9%) |
Income Below Poverty Among Married-Couple Families in Burlington
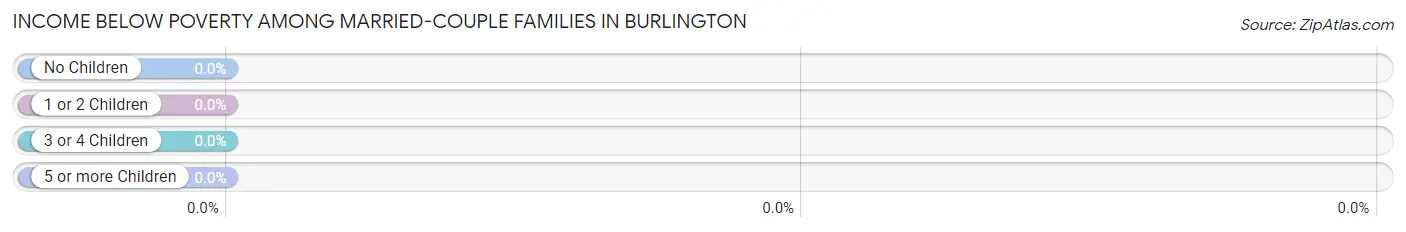
| Children | Above Poverty | Below Poverty |
| No Children | 242 (100.0%) | 0 (0.0%) |
| 1 or 2 Children | 165 (100.0%) | 0 (0.0%) |
| 3 or 4 Children | 0 (0.0%) | 0 (0.0%) |
| 5 or more Children | 0 (0.0%) | 0 (0.0%) |
| Total | 407 (100.0%) | 0 (0.0%) |
Income Below Poverty Among Single-Parent Households in Burlington
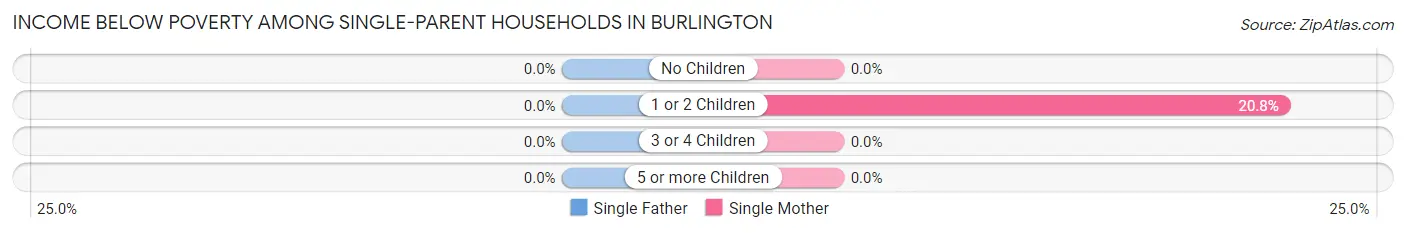
| Children | Single Father | Single Mother |
| No Children | 0 (0.0%) | 0 (0.0%) |
| 1 or 2 Children | 0 (0.0%) | 31 (20.8%) |
| 3 or 4 Children | 0 (0.0%) | 0 (0.0%) |
| 5 or more Children | 0 (0.0%) | 0 (0.0%) |
| Total | 0 (0.0%) | 31 (17.9%) |
Income Below Poverty Among Married-Couple vs Single-Parent Households in Burlington
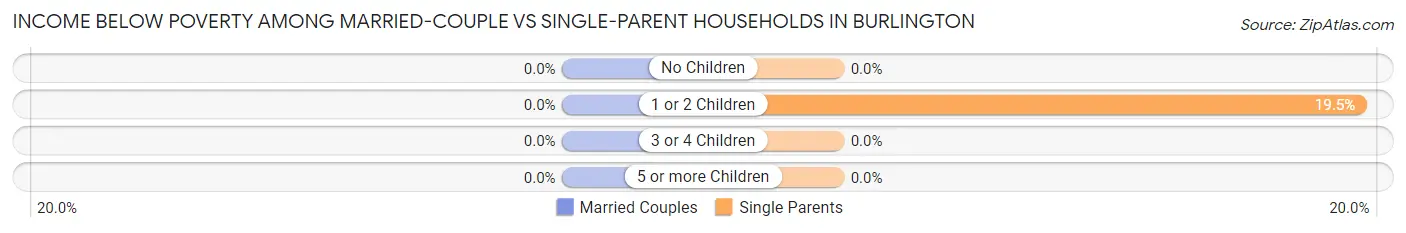
| Children | Married-Couple Families | Single-Parent Households |
| No Children | 0 (0.0%) | 0 (0.0%) |
| 1 or 2 Children | 0 (0.0%) | 31 (19.5%) |
| 3 or 4 Children | 0 (0.0%) | 0 (0.0%) |
| 5 or more Children | 0 (0.0%) | 0 (0.0%) |
| Total | 0 (0.0%) | 31 (15.8%) |
Race in Burlington
The most populous races in Burlington are White / Caucasian (2,382 | 85.7%), Two or more Races (167 | 6.0%), and Black / African American (138 | 5.0%).
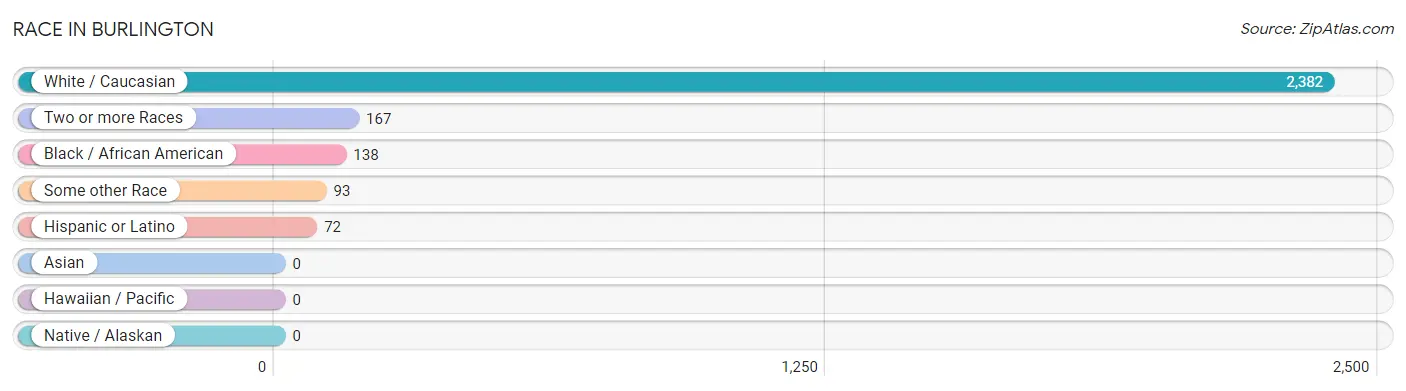
| Race | # Population | % Population |
| Asian | 0 | 0.0% |
| Black / African American | 138 | 5.0% |
| Hawaiian / Pacific | 0 | 0.0% |
| Hispanic or Latino | 72 | 2.6% |
| Native / Alaskan | 0 | 0.0% |
| White / Caucasian | 2,382 | 85.7% |
| Two or more Races | 167 | 6.0% |
| Some other Race | 93 | 3.4% |
| Total | 2,780 | 100.0% |
Ancestry in Burlington
The most populous ancestries reported in Burlington are Irish (272 | 9.8%), Scotch-Irish (221 | 8.0%), English (200 | 7.2%), German (150 | 5.4%), and Italian (128 | 4.6%), together accounting for 34.9% of all Burlington residents.
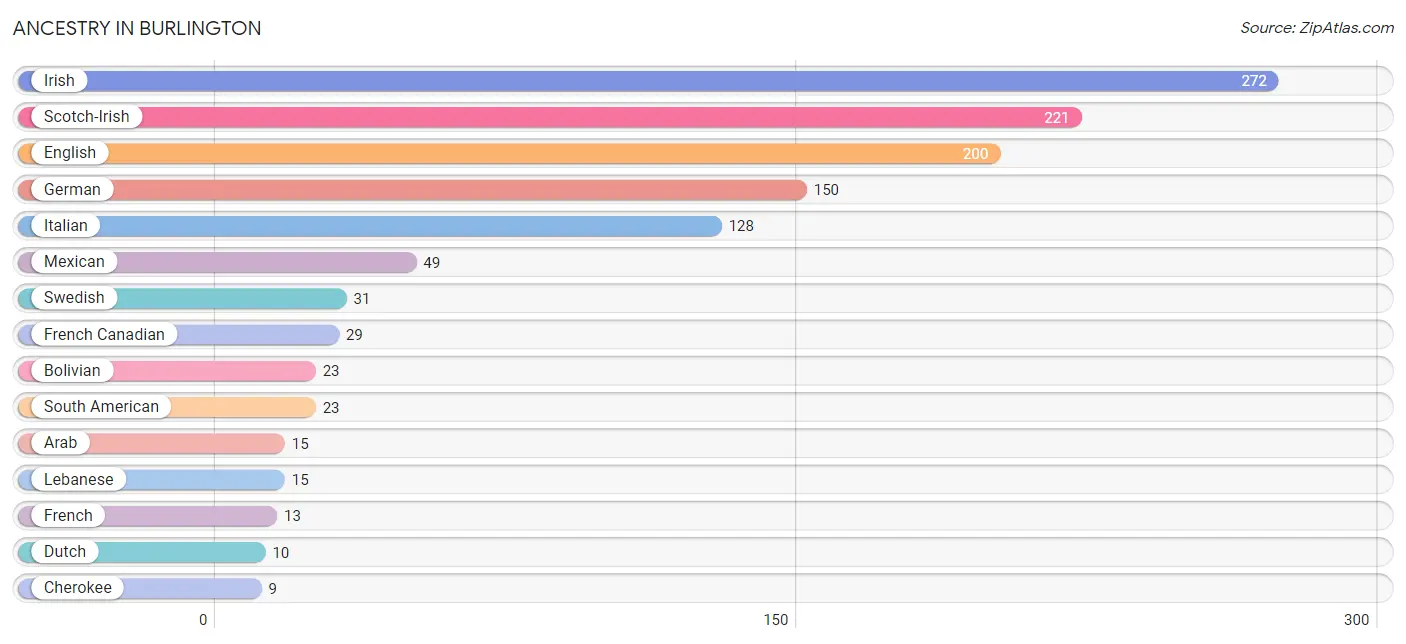
| Ancestry | # Population | % Population |
| Arab | 15 | 0.5% |
| Bolivian | 23 | 0.8% |
| Cherokee | 9 | 0.3% |
| Dutch | 10 | 0.4% |
| English | 200 | 7.2% |
| French | 13 | 0.5% |
| French Canadian | 29 | 1.0% |
| German | 150 | 5.4% |
| Hungarian | 9 | 0.3% |
| Irish | 272 | 9.8% |
| Italian | 128 | 4.6% |
| Lebanese | 15 | 0.5% |
| Mexican | 49 | 1.8% |
| Scotch-Irish | 221 | 8.0% |
| Slovak | 5 | 0.2% |
| South American | 23 | 0.8% |
| Swedish | 31 | 1.1% | View All 17 Rows |
Immigrants in Burlington
The most numerous immigrant groups reported in Burlington came from Chile (49 | 1.8%), Latin America (49 | 1.8%), South America (49 | 1.8%), Canada (29 | 1.0%), and Asia (15 | 0.5%), together accounting for 6.9% of all Burlington residents.
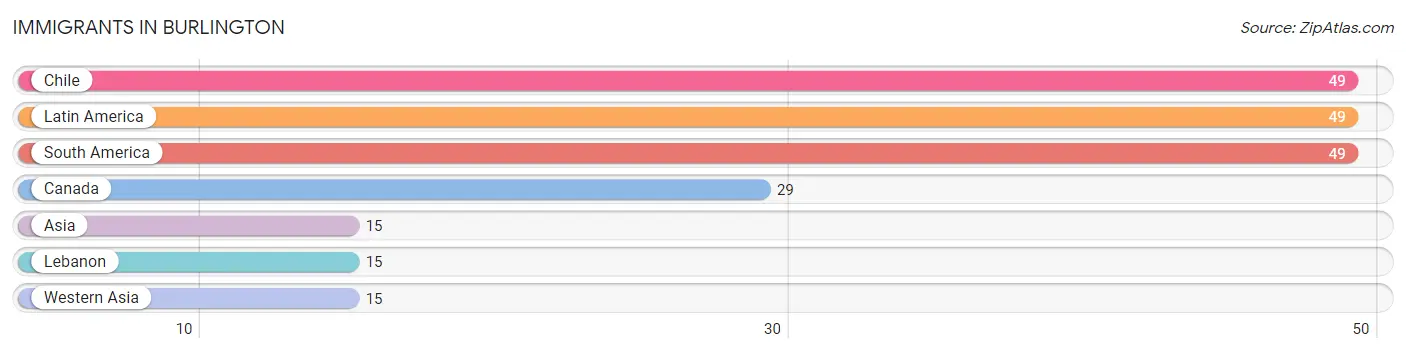
| Immigration Origin | # Population | % Population |
| Asia | 15 | 0.5% |
| Canada | 29 | 1.0% |
| Chile | 49 | 1.8% |
| Latin America | 49 | 1.8% |
| Lebanon | 15 | 0.5% |
| South America | 49 | 1.8% |
| Western Asia | 15 | 0.5% | View All 7 Rows |
Sex and Age in Burlington
Sex and Age in Burlington
The most populous age groups in Burlington are 10 to 14 Years (148 | 11.2%) for men and 60 to 64 Years (200 | 13.7%) for women.
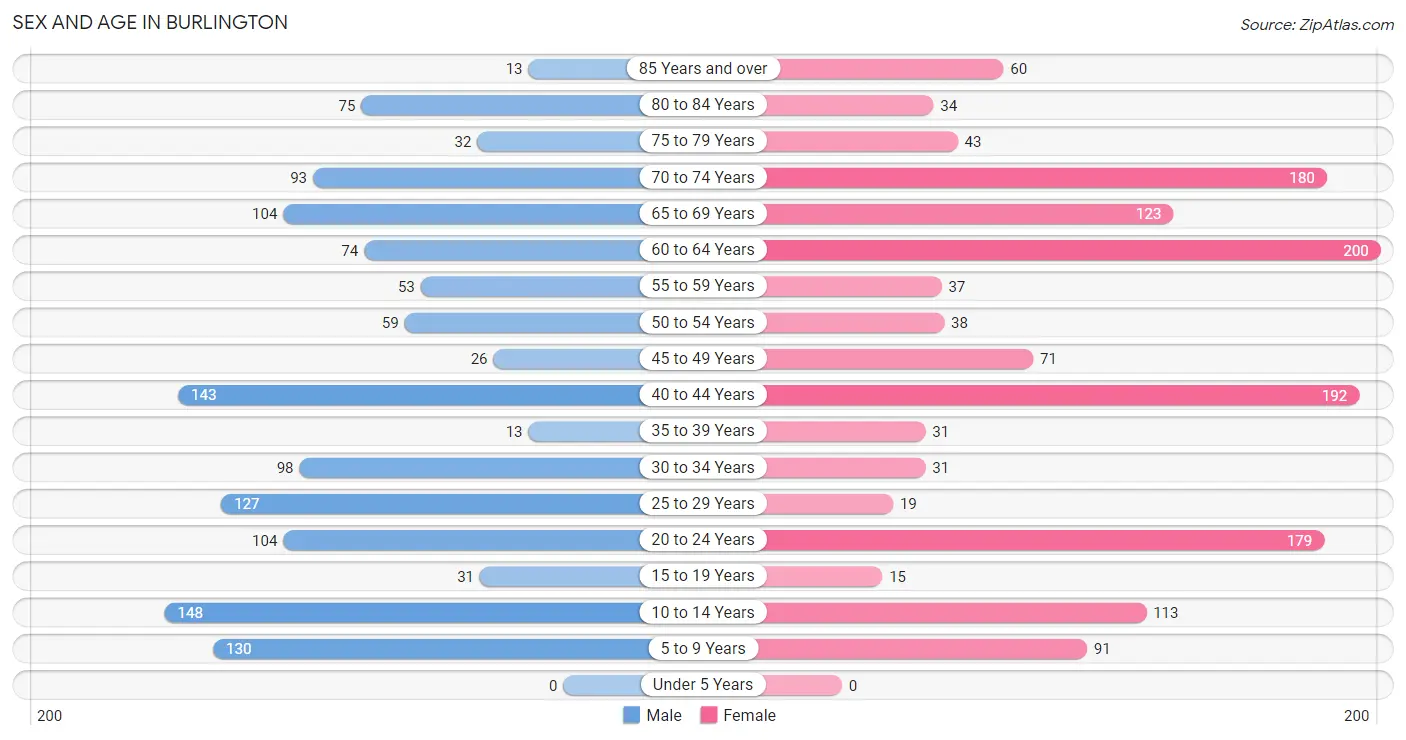
| Age Bracket | Male | Female |
| Under 5 Years | 0 (0.0%) | 0 (0.0%) |
| 5 to 9 Years | 130 (9.8%) | 91 (6.2%) |
| 10 to 14 Years | 148 (11.2%) | 113 (7.8%) |
| 15 to 19 Years | 31 (2.3%) | 15 (1.0%) |
| 20 to 24 Years | 104 (7.9%) | 179 (12.3%) |
| 25 to 29 Years | 127 (9.6%) | 19 (1.3%) |
| 30 to 34 Years | 98 (7.4%) | 31 (2.1%) |
| 35 to 39 Years | 13 (1.0%) | 31 (2.1%) |
| 40 to 44 Years | 143 (10.8%) | 192 (13.2%) |
| 45 to 49 Years | 26 (2.0%) | 71 (4.9%) |
| 50 to 54 Years | 59 (4.5%) | 38 (2.6%) |
| 55 to 59 Years | 53 (4.0%) | 37 (2.5%) |
| 60 to 64 Years | 74 (5.6%) | 200 (13.7%) |
| 65 to 69 Years | 104 (7.9%) | 123 (8.4%) |
| 70 to 74 Years | 93 (7.0%) | 180 (12.3%) |
| 75 to 79 Years | 32 (2.4%) | 43 (2.9%) |
| 80 to 84 Years | 75 (5.7%) | 34 (2.3%) |
| 85 Years and over | 13 (1.0%) | 60 (4.1%) |
| Total | 1,323 (100.0%) | 1,457 (100.0%) |
Families and Households in Burlington
Median Family Size in Burlington
The median family size in Burlington is 3.05 persons per family, with single male/father families (23 | 3.8%) accounting for the largest median family size of 4.04 persons per family. On the other hand, single female/mother families (173 | 28.7%) represent the smallest median family size with 2.74 persons per family.
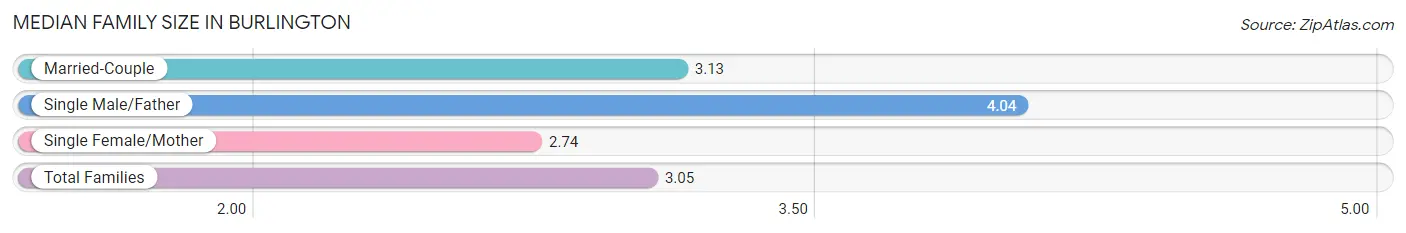
| Family Type | # Families | Family Size |
| Married-Couple | 407 (67.5%) | 3.13 |
| Single Male/Father | 23 (3.8%) | 4.04 |
| Single Female/Mother | 173 (28.7%) | 2.74 |
| Total Families | 603 (100.0%) | 3.05 |
Median Household Size in Burlington
The median household size in Burlington is 2.12 persons per household, with single male/father households (23 | 1.9%) accounting for the largest median household size of 4.04 persons per household. non-family households (627 | 51.0%) represent the smallest median household size with 1.11 persons per household.
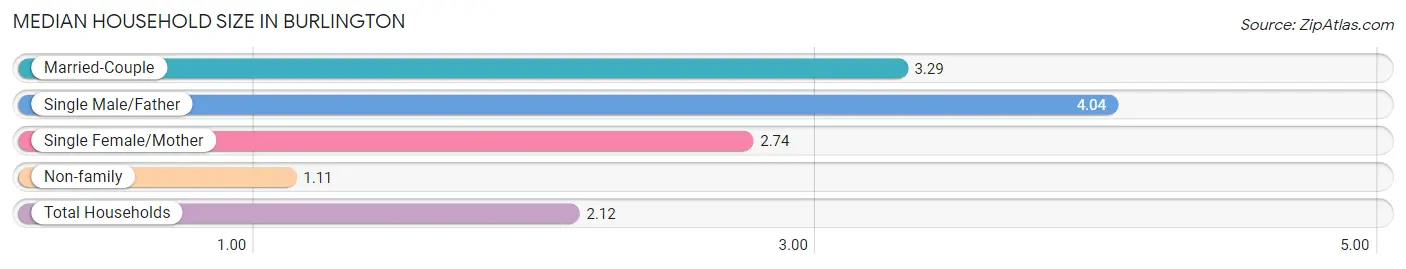
| Household Type | # Households | Household Size |
| Married-Couple | 407 (33.1%) | 3.29 |
| Single Male/Father | 23 (1.9%) | 4.04 |
| Single Female/Mother | 173 (14.1%) | 2.74 |
| Non-family | 627 (51.0%) | 1.11 |
| Total Households | 1,230 (100.0%) | 2.12 |
Household Size by Marriage Status in Burlington
Out of a total of 1,230 households in Burlington, 603 (49.0%) are family households, while 627 (51.0%) are nonfamily households. The most numerous type of family households are 3-person households, comprising 296, and the most common type of nonfamily households are 1-person households, comprising 570.
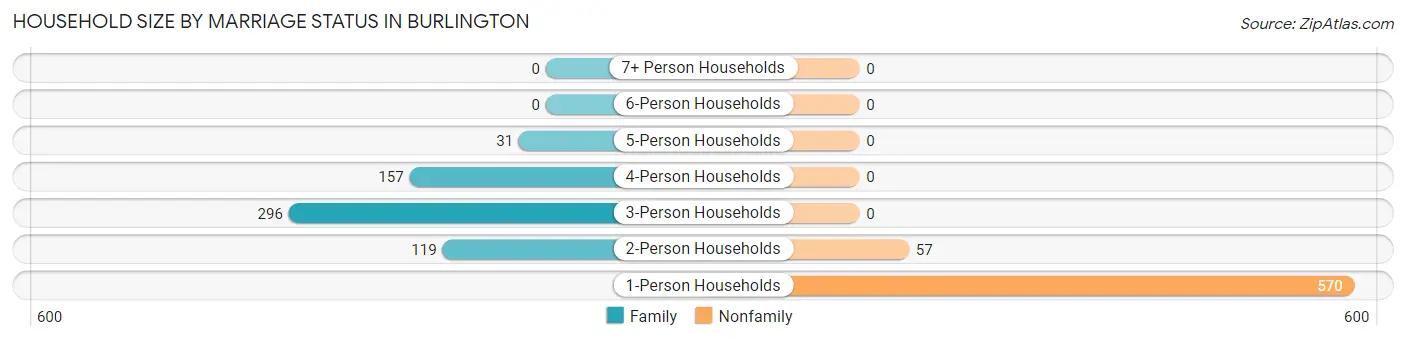
| Household Size | Family Households | Nonfamily Households |
| 1-Person Households | - | 570 (46.3%) |
| 2-Person Households | 119 (9.7%) | 57 (4.6%) |
| 3-Person Households | 296 (24.1%) | 0 (0.0%) |
| 4-Person Households | 157 (12.8%) | 0 (0.0%) |
| 5-Person Households | 31 (2.5%) | 0 (0.0%) |
| 6-Person Households | 0 (0.0%) | 0 (0.0%) |
| 7+ Person Households | 0 (0.0%) | 0 (0.0%) |
| Total | 603 (49.0%) | 627 (51.0%) |
Female Fertility in Burlington
Fertility by Age in Burlington
| Age Bracket | Women with Births | Births / 1,000 Women |
| 15 to 19 years | 0 (0.0%) | 0.0 |
| 20 to 34 years | 0 (0.0%) | 0.0 |
| 35 to 50 years | 0 (0.0%) | 0.0 |
| Total | 0 (0.0%) | 0.0 |
Fertility by Age by Marriage Status in Burlington
| Age Bracket | Married | Unmarried |
| 15 to 19 years | 0 (0.0%) | 0 (0.0%) |
| 20 to 34 years | 0 (0.0%) | 0 (0.0%) |
| 35 to 50 years | 0 (0.0%) | 0 (0.0%) |
| Total | 0 (0.0%) | 0 (0.0%) |
Fertility by Education in Burlington
| Educational Attainment | Women with Births | Births / 1,000 Women |
| Less than High School | 0 (0.0%) | 0.0 |
| High School Diploma | 0 (0.0%) | 0.0 |
| College or Associate's Degree | 0 (0.0%) | 0.0 |
| Bachelor's Degree | 0 (0.0%) | 0.0 |
| Graduate Degree | 0 (0.0%) | 0.0 |
| Total | 0 (0.0%) | 0.0 |
Fertility by Education by Marriage Status in Burlington
| Educational Attainment | Married | Unmarried |
| Less than High School | 0 (0.0%) | 0 (0.0%) |
| High School Diploma | 0 (0.0%) | 0 (0.0%) |
| College or Associate's Degree | 0 (0.0%) | 0 (0.0%) |
| Bachelor's Degree | 0 (0.0%) | 0 (0.0%) |
| Graduate Degree | 0 (0.0%) | 0 (0.0%) |
| Total | 0 (0.0%) | 0 (0.0%) |
Employment Characteristics in Burlington
Employment by Class of Employer in Burlington
Among the 1,113 employed individuals in Burlington, private company employees (951 | 85.4%), local government employees (50 | 4.5%), and self-employed (incorporated) (43 | 3.9%) make up the most common classes of employment.
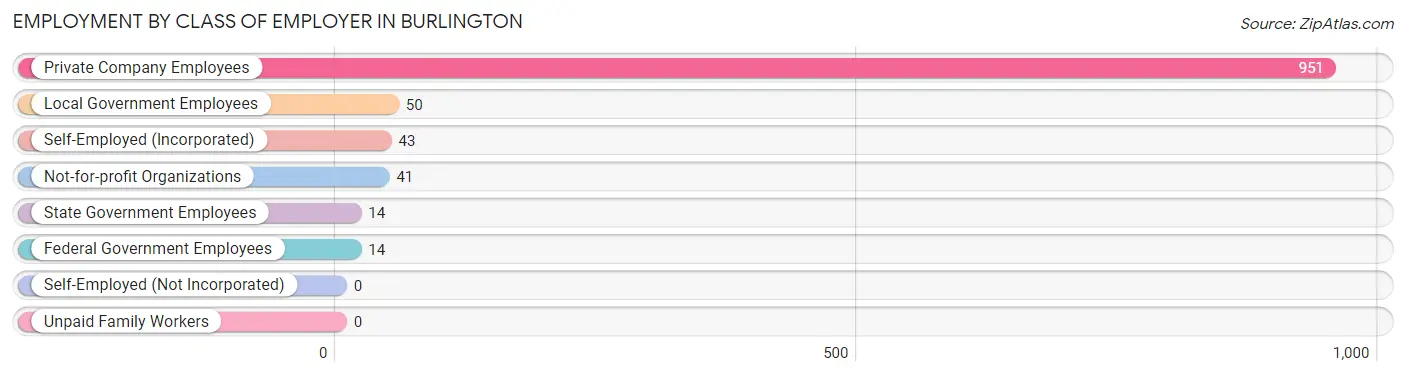
| Employer Class | # Employees | % Employees |
| Private Company Employees | 951 | 85.4% |
| Self-Employed (Incorporated) | 43 | 3.9% |
| Self-Employed (Not Incorporated) | 0 | 0.0% |
| Not-for-profit Organizations | 41 | 3.7% |
| Local Government Employees | 50 | 4.5% |
| State Government Employees | 14 | 1.3% |
| Federal Government Employees | 14 | 1.3% |
| Unpaid Family Workers | 0 | 0.0% |
| Total | 1,113 | 100.0% |
Employment Status by Age in Burlington
According to the labor force statistics for Burlington, out of the total population over 16 years of age (2,283), 51.4% or 1,173 individuals are in the labor force, with 0.9% or 11 of them unemployed. The age group with the highest labor force participation rate is 55 to 59 years, with 94.4% or 85 individuals in the labor force. Within the labor force, the 75 years and over age range has the highest percentage of unemployed individuals, with 100.0% or 11 of them being unemployed.
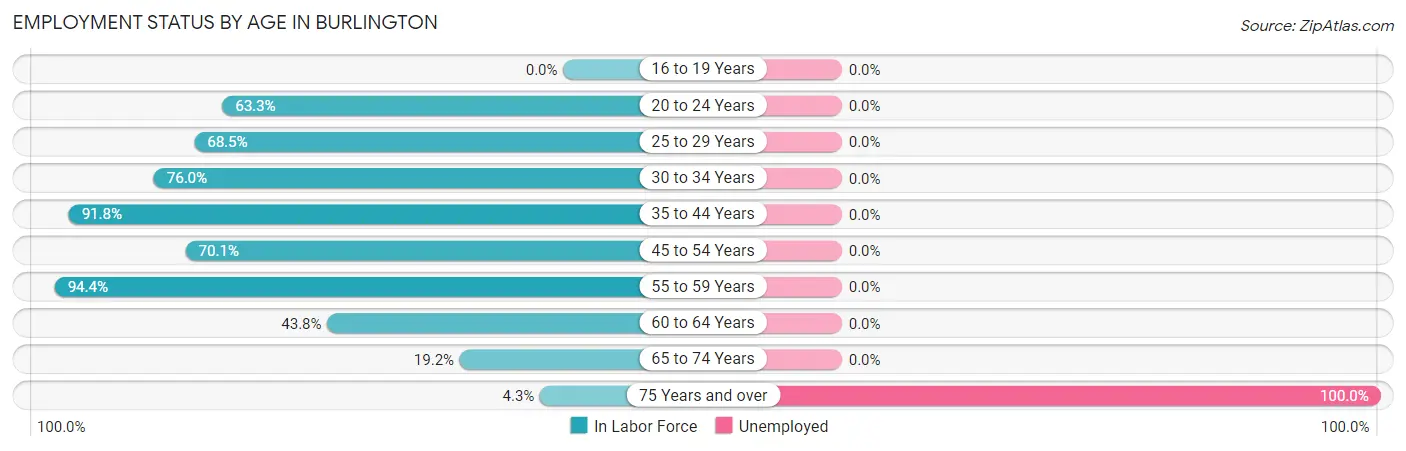
| Age Bracket | In Labor Force | Unemployed |
| 16 to 19 Years | 0 (0.0%) | 0 (0.0%) |
| 20 to 24 Years | 179 (63.3%) | 0 (0.0%) |
| 25 to 29 Years | 100 (68.5%) | 0 (0.0%) |
| 30 to 34 Years | 98 (76.0%) | 0 (0.0%) |
| 35 to 44 Years | 348 (91.8%) | 0 (0.0%) |
| 45 to 54 Years | 136 (70.1%) | 0 (0.0%) |
| 55 to 59 Years | 85 (94.4%) | 0 (0.0%) |
| 60 to 64 Years | 120 (43.8%) | 0 (0.0%) |
| 65 to 74 Years | 96 (19.2%) | 0 (0.0%) |
| 75 Years and over | 11 (4.3%) | 11 (100.0%) |
| Total | 1,173 (51.4%) | 11 (0.9%) |
Employment Status by Educational Attainment in Burlington
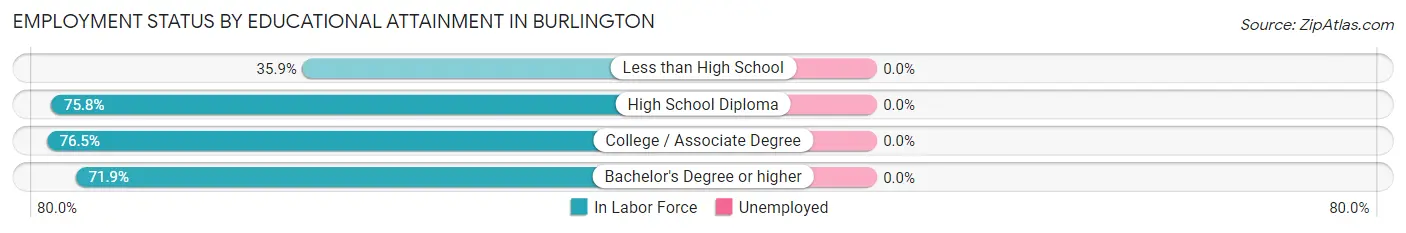
| Educational Attainment | In Labor Force | Unemployed |
| Less than High School | 23 (35.9%) | 0 (0.0%) |
| High School Diploma | 449 (75.8%) | 0 (0.0%) |
| College / Associate Degree | 254 (76.5%) | 0 (0.0%) |
| Bachelor's Degree or higher | 161 (71.9%) | 0 (0.0%) |
| Total | 887 (73.2%) | 0 (0.0%) |
Employment Occupations by Sex in Burlington
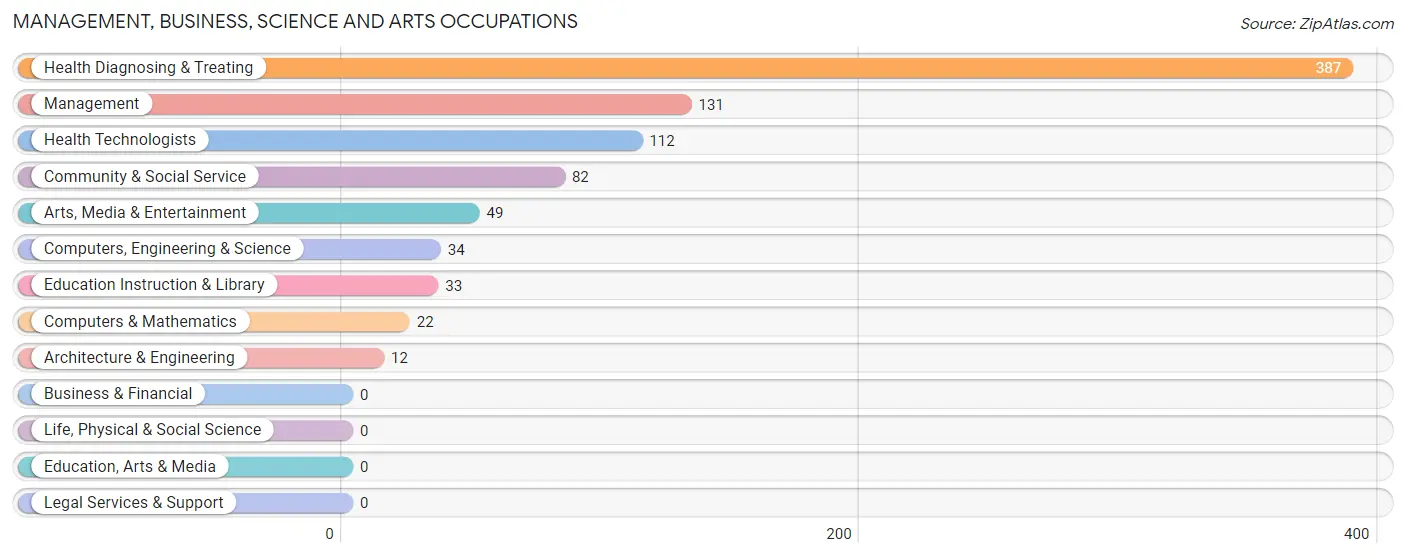
Management, Business, Science and Arts Occupations
The most common Management, Business, Science and Arts occupations in Burlington are Health Diagnosing & Treating (387 | 33.3%), Management (131 | 11.3%), Health Technologists (112 | 9.6%), Community & Social Service (82 | 7.1%), and Arts, Media & Entertainment (49 | 4.2%).
Management, Business, Science and Arts Occupations by Sex
Within the Management, Business, Science and Arts occupations in Burlington, the most male-oriented occupations are Computers & Mathematics (100.0%), Computers, Engineering & Science (64.7%), and Health Technologists (58.0%), while the most female-oriented occupations are Architecture & Engineering (100.0%), Community & Social Service (100.0%), and Education Instruction & Library (100.0%).
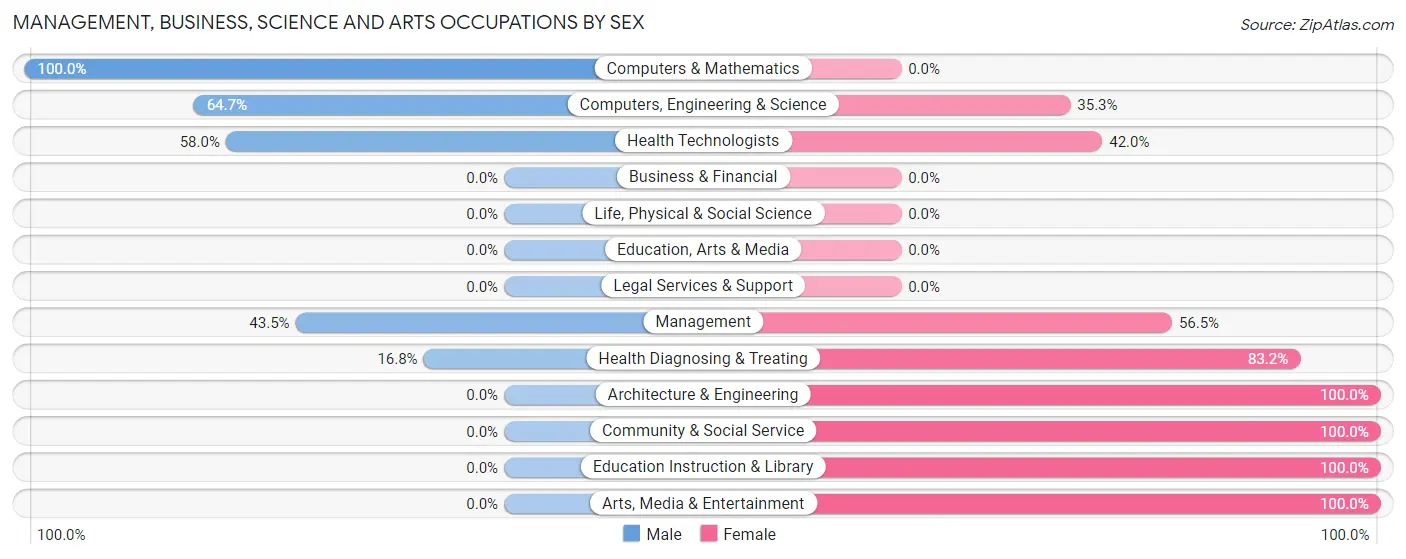
| Occupation | Male | Female |
| Management | 57 (43.5%) | 74 (56.5%) |
| Business & Financial | 0 (0.0%) | 0 (0.0%) |
| Computers, Engineering & Science | 22 (64.7%) | 12 (35.3%) |
| Computers & Mathematics | 22 (100.0%) | 0 (0.0%) |
| Architecture & Engineering | 0 (0.0%) | 12 (100.0%) |
| Life, Physical & Social Science | 0 (0.0%) | 0 (0.0%) |
| Community & Social Service | 0 (0.0%) | 82 (100.0%) |
| Education, Arts & Media | 0 (0.0%) | 0 (0.0%) |
| Legal Services & Support | 0 (0.0%) | 0 (0.0%) |
| Education Instruction & Library | 0 (0.0%) | 33 (100.0%) |
| Arts, Media & Entertainment | 0 (0.0%) | 49 (100.0%) |
| Health Diagnosing & Treating | 65 (16.8%) | 322 (83.2%) |
| Health Technologists | 65 (58.0%) | 47 (42.0%) |
| Total (Category) | 144 (22.7%) | 490 (77.3%) |
| Total (Overall) | 532 (45.8%) | 630 (54.2%) |
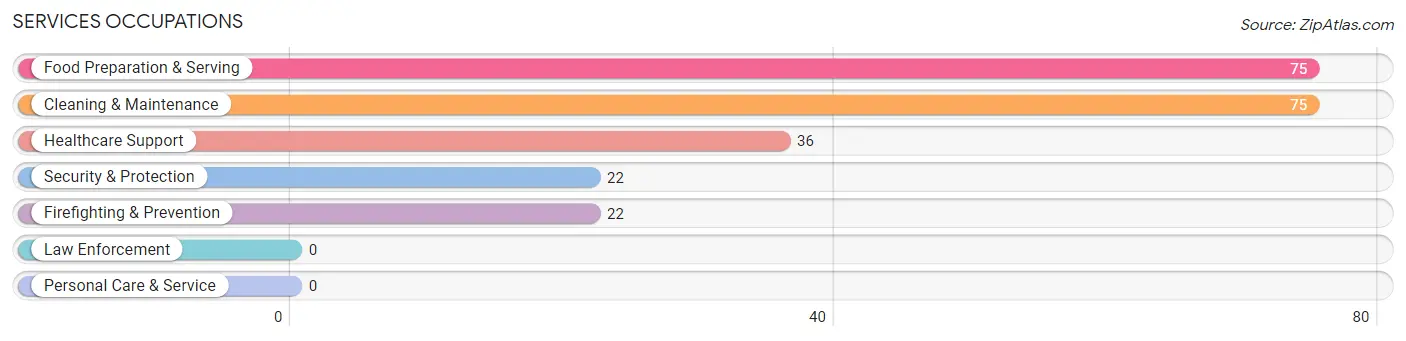
Services Occupations
The most common Services occupations in Burlington are Food Preparation & Serving (75 | 6.5%), Cleaning & Maintenance (75 | 6.5%), Healthcare Support (36 | 3.1%), Security & Protection (22 | 1.9%), and Firefighting & Prevention (22 | 1.9%).
Services Occupations by Sex
Within the Services occupations in Burlington, the most male-oriented occupations are Food Preparation & Serving (100.0%), and Cleaning & Maintenance (45.3%), while the most female-oriented occupations are Healthcare Support (100.0%), Security & Protection (100.0%), and Firefighting & Prevention (100.0%).
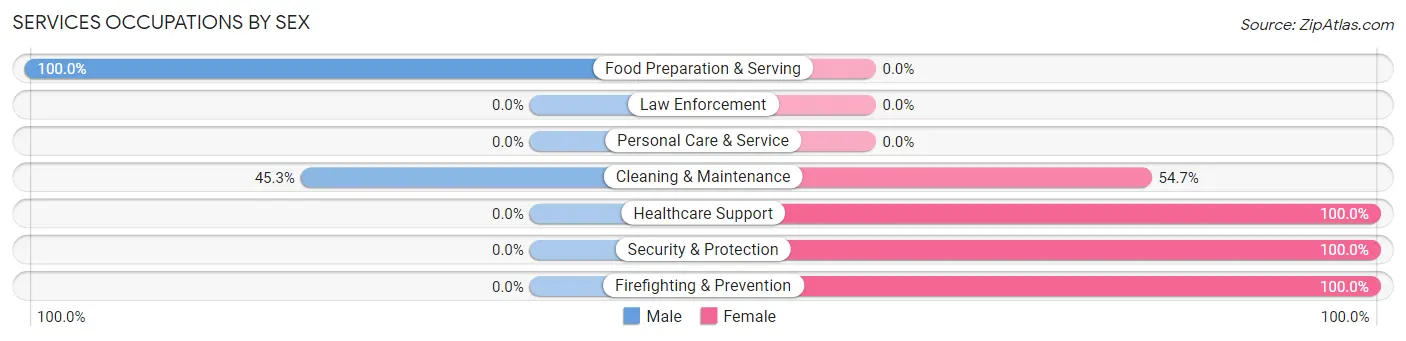
| Occupation | Male | Female |
| Healthcare Support | 0 (0.0%) | 36 (100.0%) |
| Security & Protection | 0 (0.0%) | 22 (100.0%) |
| Firefighting & Prevention | 0 (0.0%) | 22 (100.0%) |
| Law Enforcement | 0 (0.0%) | 0 (0.0%) |
| Food Preparation & Serving | 75 (100.0%) | 0 (0.0%) |
| Cleaning & Maintenance | 34 (45.3%) | 41 (54.7%) |
| Personal Care & Service | 0 (0.0%) | 0 (0.0%) |
| Total (Category) | 109 (52.4%) | 99 (47.6%) |
| Total (Overall) | 532 (45.8%) | 630 (54.2%) |
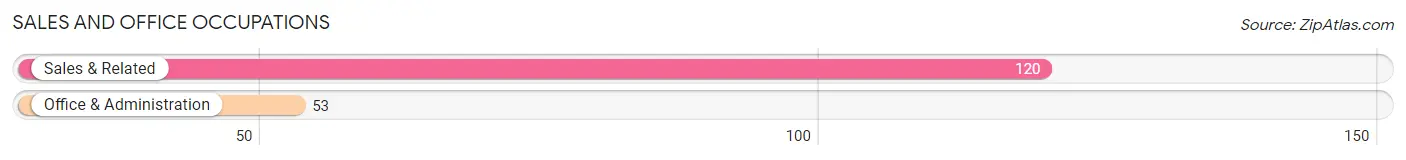
Sales and Office Occupations
The most common Sales and Office occupations in Burlington are Sales & Related (120 | 10.3%), and Office & Administration (53 | 4.6%).
Sales and Office Occupations by Sex
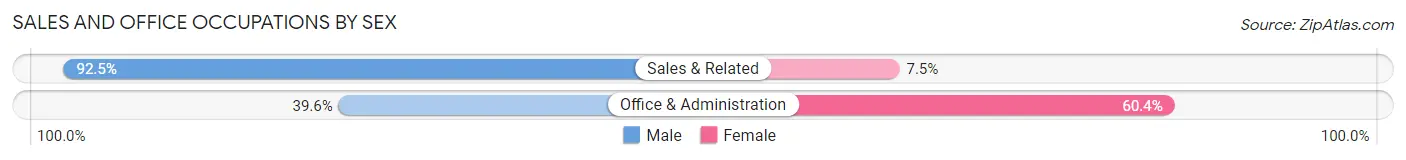
| Occupation | Male | Female |
| Sales & Related | 111 (92.5%) | 9 (7.5%) |
| Office & Administration | 21 (39.6%) | 32 (60.4%) |
| Total (Category) | 132 (76.3%) | 41 (23.7%) |
| Total (Overall) | 532 (45.8%) | 630 (54.2%) |
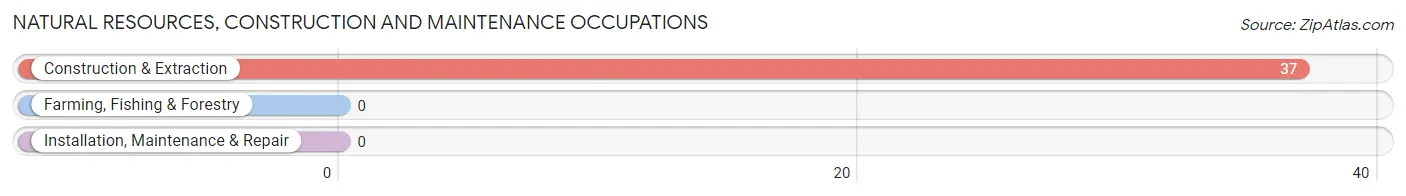
Natural Resources, Construction and Maintenance Occupations
The most common Natural Resources, Construction and Maintenance occupations in Burlington are , and Construction & Extraction (37 | 3.2%).
Natural Resources, Construction and Maintenance Occupations by Sex
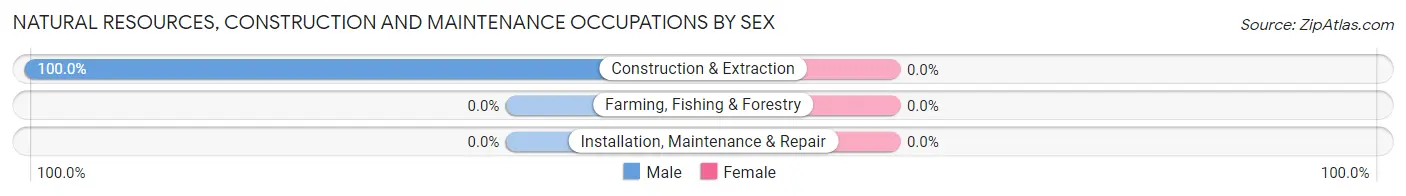
| Occupation | Male | Female |
| Farming, Fishing & Forestry | 0 (0.0%) | 0 (0.0%) |
| Construction & Extraction | 37 (100.0%) | 0 (0.0%) |
| Installation, Maintenance & Repair | 0 (0.0%) | 0 (0.0%) |
| Total (Category) | 37 (100.0%) | 0 (0.0%) |
| Total (Overall) | 532 (45.8%) | 630 (54.2%) |
Production, Transportation and Moving Occupations
The most common Production, Transportation and Moving occupations in Burlington are Transportation (64 | 5.5%), and Material Moving (46 | 4.0%).
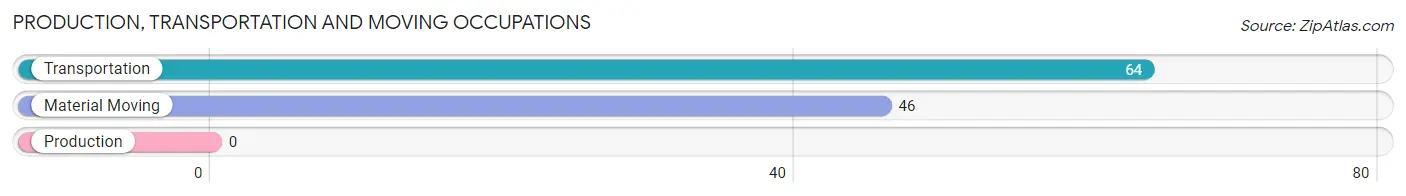
Production, Transportation and Moving Occupations by Sex
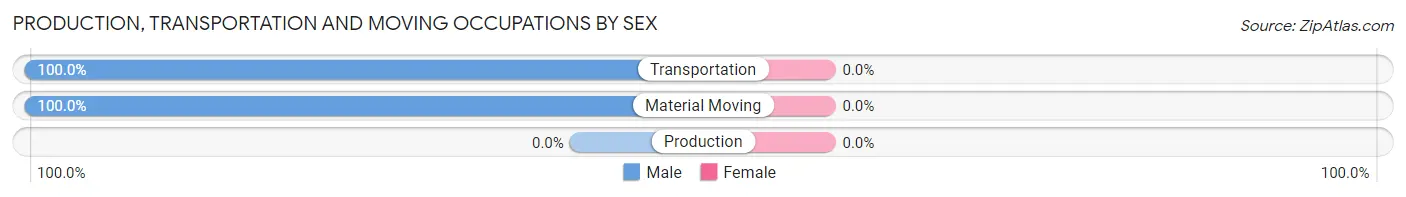
| Occupation | Male | Female |
| Production | 0 (0.0%) | 0 (0.0%) |
| Transportation | 64 (100.0%) | 0 (0.0%) |
| Material Moving | 46 (100.0%) | 0 (0.0%) |
| Total (Category) | 110 (100.0%) | 0 (0.0%) |
| Total (Overall) | 532 (45.8%) | 630 (54.2%) |
Employment Industries by Sex in Burlington
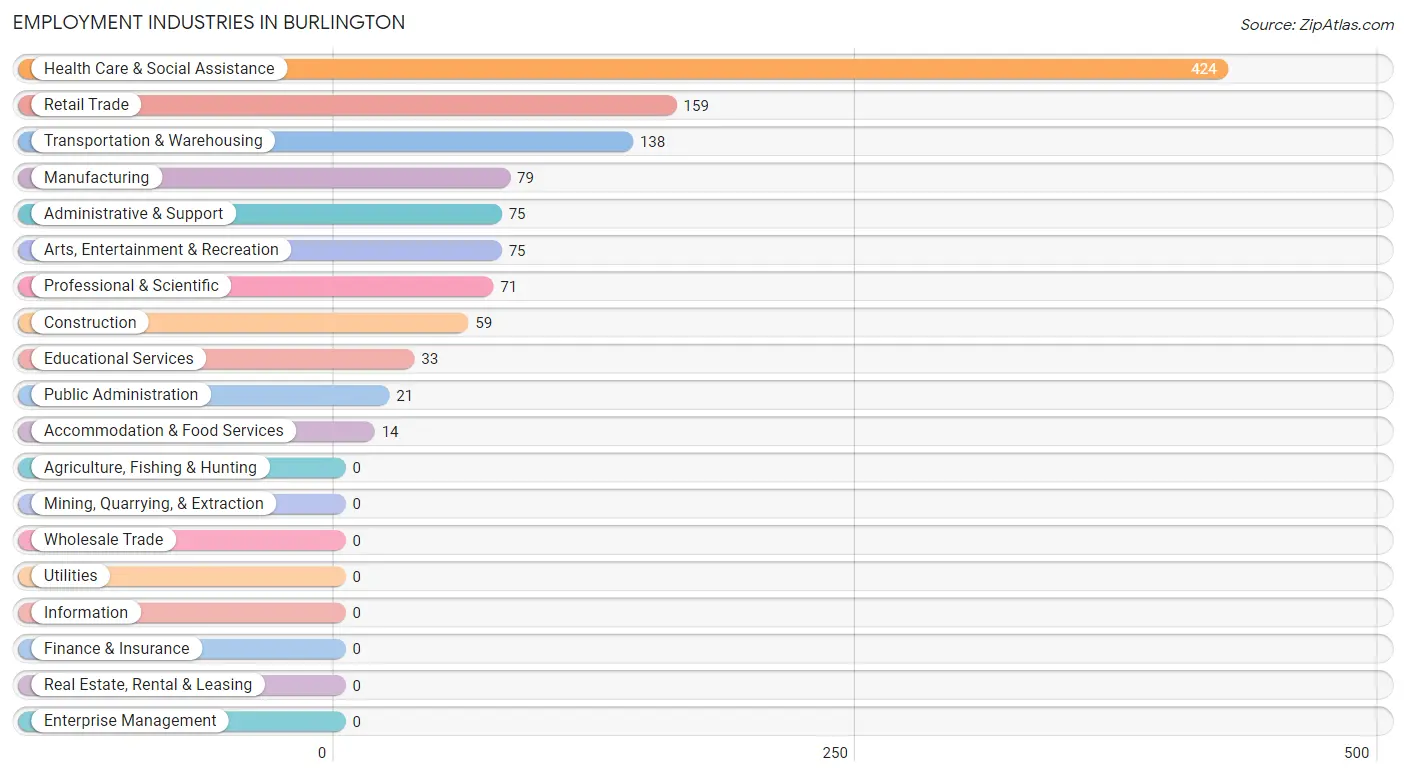
Employment Industries in Burlington
The major employment industries in Burlington include Health Care & Social Assistance (424 | 36.5%), Retail Trade (159 | 13.7%), Transportation & Warehousing (138 | 11.9%), Manufacturing (79 | 6.8%), and Administrative & Support (75 | 6.5%).
Employment Industries by Sex in Burlington
The Burlington industries that see more men than women are Manufacturing (100.0%), Arts, Entertainment & Recreation (100.0%), and Accommodation & Food Services (100.0%), whereas the industries that tend to have a higher number of women are Educational Services (100.0%), Health Care & Social Assistance (88.7%), and Administrative & Support (70.7%).
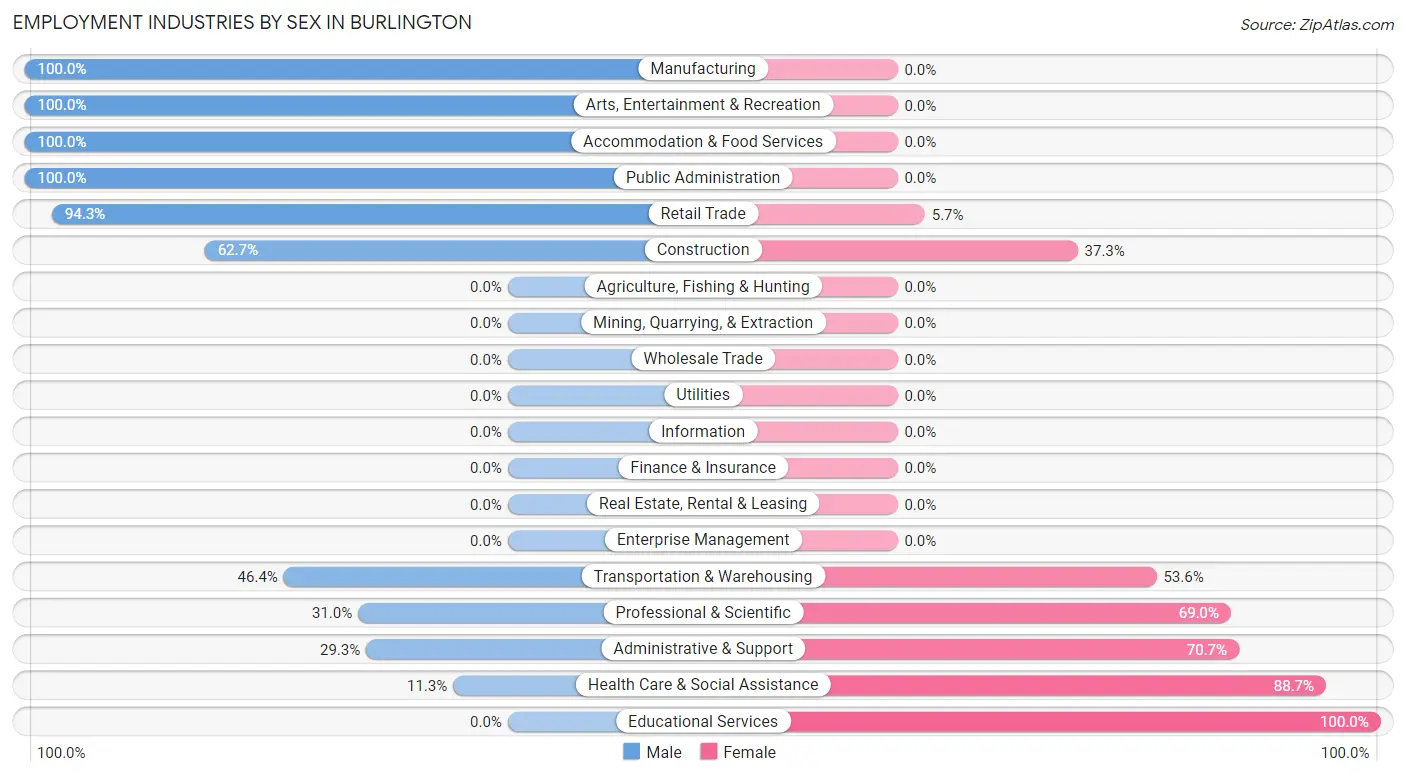
| Industry | Male | Female |
| Agriculture, Fishing & Hunting | 0 (0.0%) | 0 (0.0%) |
| Mining, Quarrying, & Extraction | 0 (0.0%) | 0 (0.0%) |
| Construction | 37 (62.7%) | 22 (37.3%) |
| Manufacturing | 79 (100.0%) | 0 (0.0%) |
| Wholesale Trade | 0 (0.0%) | 0 (0.0%) |
| Retail Trade | 150 (94.3%) | 9 (5.7%) |
| Transportation & Warehousing | 64 (46.4%) | 74 (53.6%) |
| Utilities | 0 (0.0%) | 0 (0.0%) |
| Information | 0 (0.0%) | 0 (0.0%) |
| Finance & Insurance | 0 (0.0%) | 0 (0.0%) |
| Real Estate, Rental & Leasing | 0 (0.0%) | 0 (0.0%) |
| Professional & Scientific | 22 (31.0%) | 49 (69.0%) |
| Enterprise Management | 0 (0.0%) | 0 (0.0%) |
| Administrative & Support | 22 (29.3%) | 53 (70.7%) |
| Educational Services | 0 (0.0%) | 33 (100.0%) |
| Health Care & Social Assistance | 48 (11.3%) | 376 (88.7%) |
| Arts, Entertainment & Recreation | 75 (100.0%) | 0 (0.0%) |
| Accommodation & Food Services | 14 (100.0%) | 0 (0.0%) |
| Public Administration | 21 (100.0%) | 0 (0.0%) |
| Total | 532 (45.8%) | 630 (54.2%) |
Education in Burlington
School Enrollment in Burlington
The most common levels of schooling among the 540 students in Burlington are middle school (246 | 45.6%), elementary school (221 | 40.9%), and high school (61 | 11.3%).
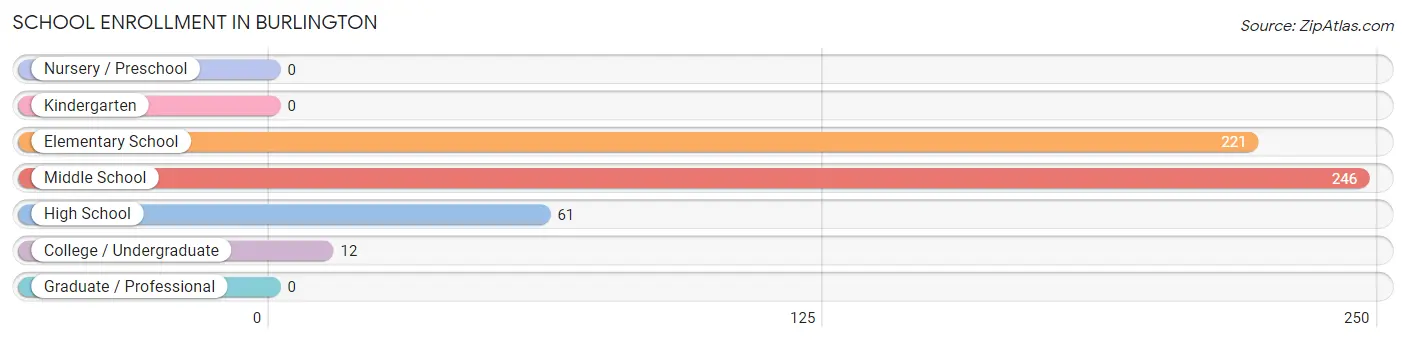
| School Level | # Students | % Students |
| Nursery / Preschool | 0 | 0.0% |
| Kindergarten | 0 | 0.0% |
| Elementary School | 221 | 40.9% |
| Middle School | 246 | 45.6% |
| High School | 61 | 11.3% |
| College / Undergraduate | 12 | 2.2% |
| Graduate / Professional | 0 | 0.0% |
| Total | 540 | 100.0% |
School Enrollment by Age by Funding Source in Burlington
Out of a total of 540 students who are enrolled in schools in Burlington, 206 (38.1%) attend a private institution, while the remaining 334 (61.9%) are enrolled in public schools. The age group of 10 to 14 year olds has the highest likelihood of being enrolled in private schools, with 206 (78.9% in the age bracket) enrolled. Conversely, the age group of 5 to 9 year old has the lowest likelihood of being enrolled in a private school, with 221 (100.0% in the age bracket) attending a public institution.
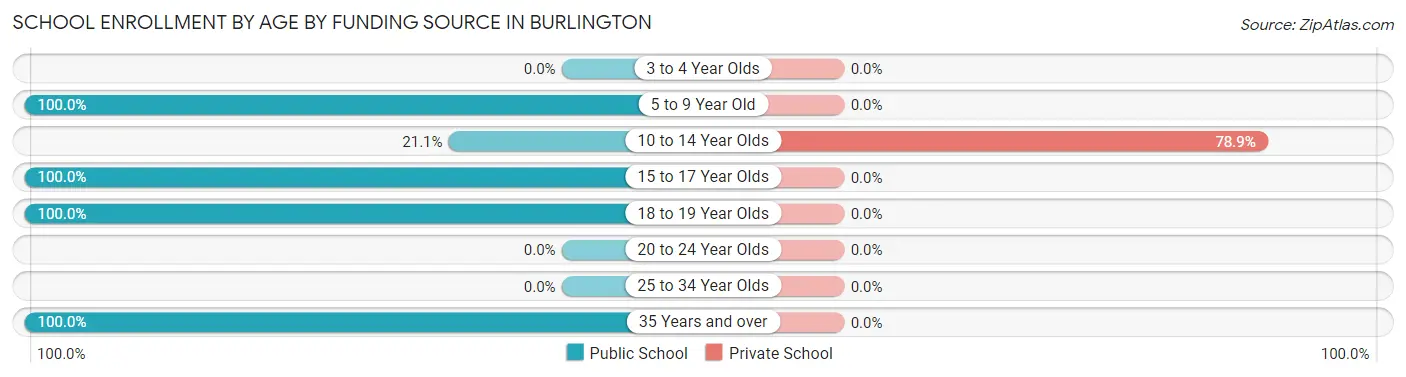
| Age Bracket | Public School | Private School |
| 3 to 4 Year Olds | 0 (0.0%) | 0 (0.0%) |
| 5 to 9 Year Old | 221 (100.0%) | 0 (0.0%) |
| 10 to 14 Year Olds | 55 (21.1%) | 206 (78.9%) |
| 15 to 17 Year Olds | 25 (100.0%) | 0 (0.0%) |
| 18 to 19 Year Olds | 21 (100.0%) | 0 (0.0%) |
| 20 to 24 Year Olds | 0 (0.0%) | 0 (0.0%) |
| 25 to 34 Year Olds | 0 (0.0%) | 0 (0.0%) |
| 35 Years and over | 12 (100.0%) | 0 (0.0%) |
| Total | 334 (61.9%) | 206 (38.1%) |
Educational Attainment by Field of Study in Burlington
Science & technology (103 | 41.5%), social sciences (46 | 18.5%), arts & humanities (37 | 14.9%), physical & health sciences (33 | 13.3%), and business (13 | 5.2%) are the most common fields of study among 248 individuals in Burlington who have obtained a bachelor's degree or higher.
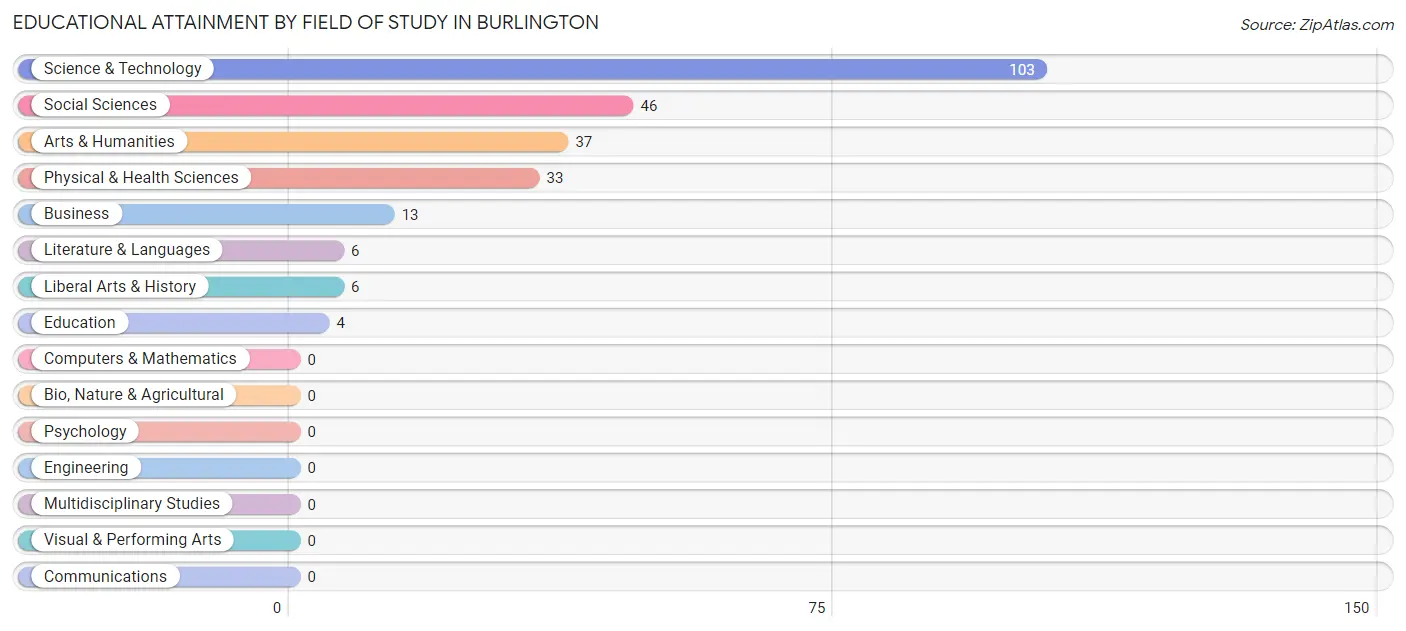
| Field of Study | # Graduates | % Graduates |
| Computers & Mathematics | 0 | 0.0% |
| Bio, Nature & Agricultural | 0 | 0.0% |
| Physical & Health Sciences | 33 | 13.3% |
| Psychology | 0 | 0.0% |
| Social Sciences | 46 | 18.5% |
| Engineering | 0 | 0.0% |
| Multidisciplinary Studies | 0 | 0.0% |
| Science & Technology | 103 | 41.5% |
| Business | 13 | 5.2% |
| Education | 4 | 1.6% |
| Literature & Languages | 6 | 2.4% |
| Liberal Arts & History | 6 | 2.4% |
| Visual & Performing Arts | 0 | 0.0% |
| Communications | 0 | 0.0% |
| Arts & Humanities | 37 | 14.9% |
| Total | 248 | 100.0% |
Transportation & Commute in Burlington
Vehicle Availability by Sex in Burlington
The most prevalent vehicle ownership categories in Burlington are males with 2 vehicles (195, accounting for 36.6%) and females with 2 vehicles (285, making up 33.6%).
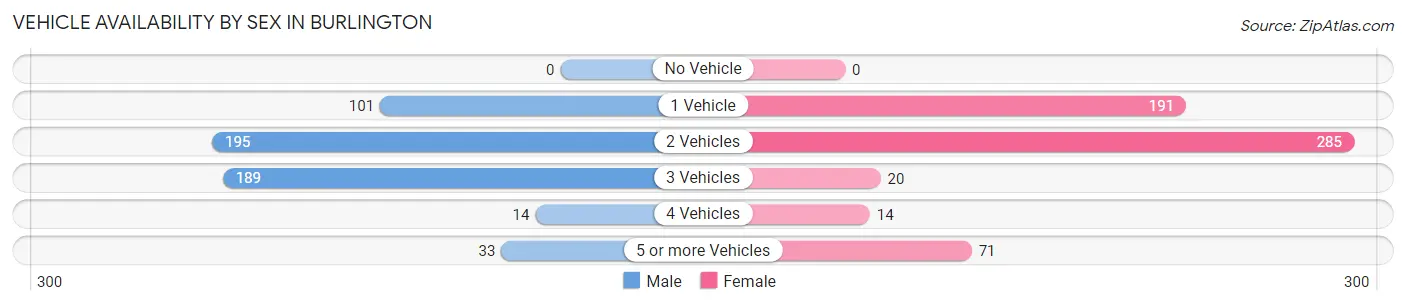
| Vehicles Available | Male | Female |
| No Vehicle | 0 (0.0%) | 0 (0.0%) |
| 1 Vehicle | 101 (19.0%) | 191 (32.9%) |
| 2 Vehicles | 195 (36.6%) | 285 (49.0%) |
| 3 Vehicles | 189 (35.5%) | 20 (3.4%) |
| 4 Vehicles | 14 (2.6%) | 14 (2.4%) |
| 5 or more Vehicles | 33 (6.2%) | 71 (12.2%) |
| Total | 532 (100.0%) | 581 (100.0%) |
Commute Time in Burlington
The most frequently occuring commute durations in Burlington are 15 to 19 minutes (376 commuters, 35.2%), 20 to 24 minutes (224 commuters, 21.0%), and 5 to 9 minutes (207 commuters, 19.4%).
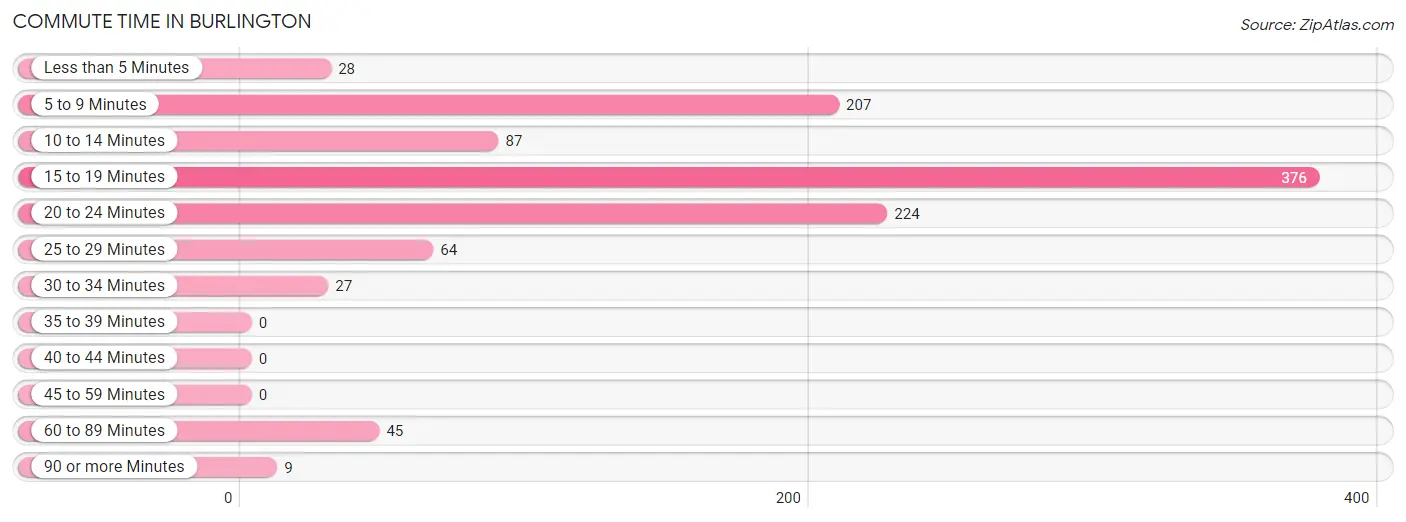
| Commute Time | # Commuters | % Commuters |
| Less than 5 Minutes | 28 | 2.6% |
| 5 to 9 Minutes | 207 | 19.4% |
| 10 to 14 Minutes | 87 | 8.2% |
| 15 to 19 Minutes | 376 | 35.2% |
| 20 to 24 Minutes | 224 | 21.0% |
| 25 to 29 Minutes | 64 | 6.0% |
| 30 to 34 Minutes | 27 | 2.5% |
| 35 to 39 Minutes | 0 | 0.0% |
| 40 to 44 Minutes | 0 | 0.0% |
| 45 to 59 Minutes | 0 | 0.0% |
| 60 to 89 Minutes | 45 | 4.2% |
| 90 or more Minutes | 9 | 0.8% |
Commute Time by Sex in Burlington
The most common commute times in Burlington are 5 to 9 minutes (207 commuters, 41.6%) for males and 15 to 19 minutes (259 commuters, 45.5%) for females.
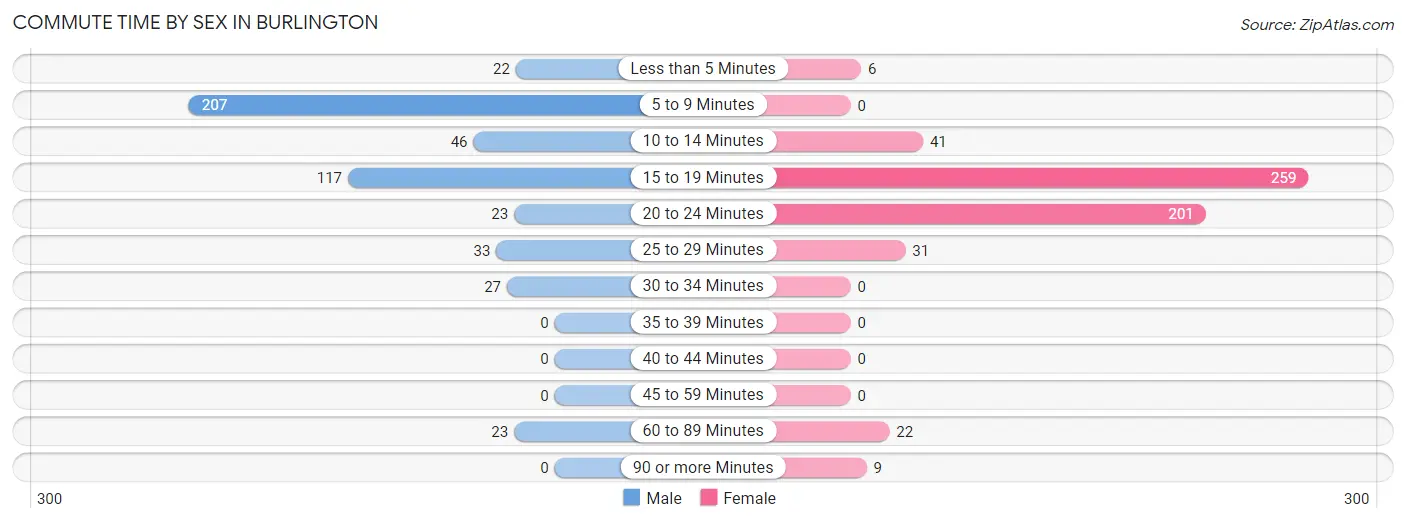
| Commute Time | Male | Female |
| Less than 5 Minutes | 22 (4.4%) | 6 (1.1%) |
| 5 to 9 Minutes | 207 (41.6%) | 0 (0.0%) |
| 10 to 14 Minutes | 46 (9.2%) | 41 (7.2%) |
| 15 to 19 Minutes | 117 (23.5%) | 259 (45.5%) |
| 20 to 24 Minutes | 23 (4.6%) | 201 (35.3%) |
| 25 to 29 Minutes | 33 (6.6%) | 31 (5.4%) |
| 30 to 34 Minutes | 27 (5.4%) | 0 (0.0%) |
| 35 to 39 Minutes | 0 (0.0%) | 0 (0.0%) |
| 40 to 44 Minutes | 0 (0.0%) | 0 (0.0%) |
| 45 to 59 Minutes | 0 (0.0%) | 0 (0.0%) |
| 60 to 89 Minutes | 23 (4.6%) | 22 (3.9%) |
| 90 or more Minutes | 0 (0.0%) | 9 (1.6%) |
Time of Departure to Work by Sex in Burlington
The most frequent times of departure to work in Burlington are 12:00 PM to 3:59 PM (229, 46.0%) for males and 6:30 AM to 6:59 AM (199, 35.0%) for females.
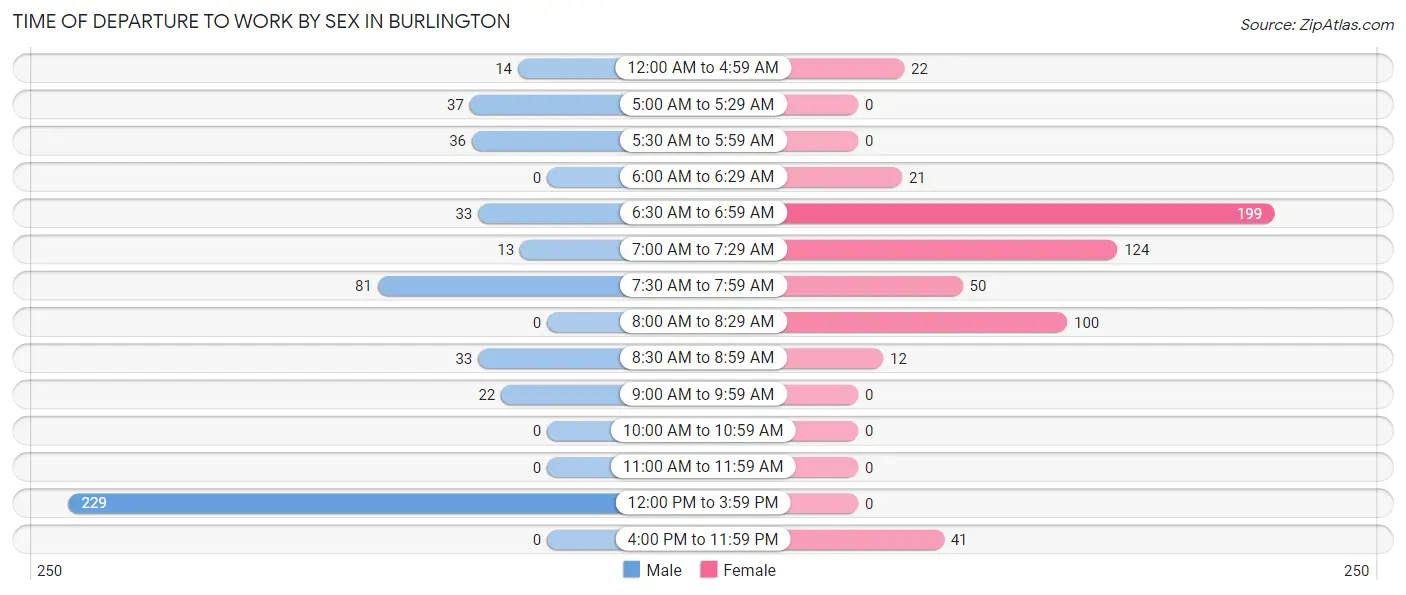
| Time of Departure | Male | Female |
| 12:00 AM to 4:59 AM | 14 (2.8%) | 22 (3.9%) |
| 5:00 AM to 5:29 AM | 37 (7.4%) | 0 (0.0%) |
| 5:30 AM to 5:59 AM | 36 (7.2%) | 0 (0.0%) |
| 6:00 AM to 6:29 AM | 0 (0.0%) | 21 (3.7%) |
| 6:30 AM to 6:59 AM | 33 (6.6%) | 199 (35.0%) |
| 7:00 AM to 7:29 AM | 13 (2.6%) | 124 (21.8%) |
| 7:30 AM to 7:59 AM | 81 (16.3%) | 50 (8.8%) |
| 8:00 AM to 8:29 AM | 0 (0.0%) | 100 (17.6%) |
| 8:30 AM to 8:59 AM | 33 (6.6%) | 12 (2.1%) |
| 9:00 AM to 9:59 AM | 22 (4.4%) | 0 (0.0%) |
| 10:00 AM to 10:59 AM | 0 (0.0%) | 0 (0.0%) |
| 11:00 AM to 11:59 AM | 0 (0.0%) | 0 (0.0%) |
| 12:00 PM to 3:59 PM | 229 (46.0%) | 0 (0.0%) |
| 4:00 PM to 11:59 PM | 0 (0.0%) | 41 (7.2%) |
| Total | 498 (100.0%) | 569 (100.0%) |
Housing Occupancy in Burlington
Occupancy by Ownership in Burlington
Of the total 1,230 dwellings in Burlington, owner-occupied units account for 499 (40.6%), while renter-occupied units make up 731 (59.4%).
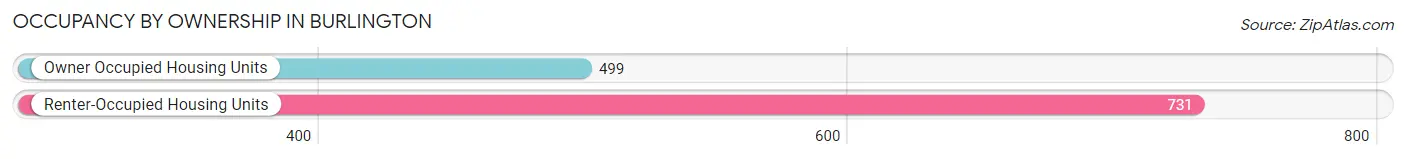
| Occupancy | # Housing Units | % Housing Units |
| Owner Occupied Housing Units | 499 | 40.6% |
| Renter-Occupied Housing Units | 731 | 59.4% |
| Total Occupied Housing Units | 1,230 | 100.0% |
Occupancy by Household Size in Burlington
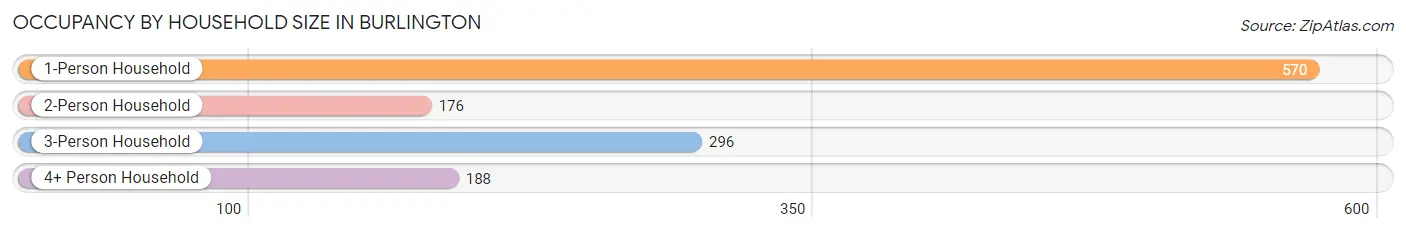
| Household Size | # Housing Units | % Housing Units |
| 1-Person Household | 570 | 46.3% |
| 2-Person Household | 176 | 14.3% |
| 3-Person Household | 296 | 24.1% |
| 4+ Person Household | 188 | 15.3% |
| Total Housing Units | 1,230 | 100.0% |
Occupancy by Ownership by Household Size in Burlington
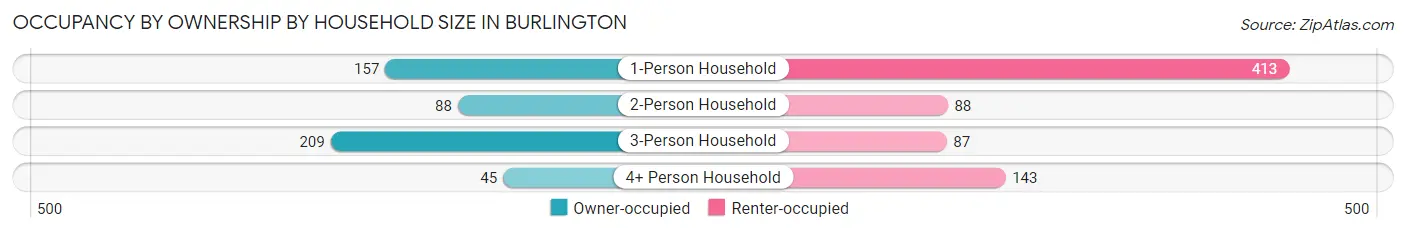
| Household Size | Owner-occupied | Renter-occupied |
| 1-Person Household | 157 (27.5%) | 413 (72.5%) |
| 2-Person Household | 88 (50.0%) | 88 (50.0%) |
| 3-Person Household | 209 (70.6%) | 87 (29.4%) |
| 4+ Person Household | 45 (23.9%) | 143 (76.1%) |
| Total Housing Units | 499 (40.6%) | 731 (59.4%) |
Occupancy by Educational Attainment in Burlington
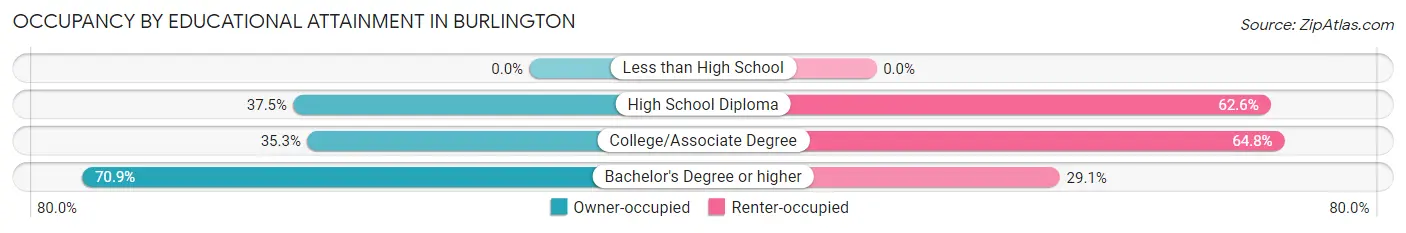
| Household Size | Owner-occupied | Renter-occupied |
| Less than High School | 0 (0.0%) | 0 (0.0%) |
| High School Diploma | 300 (37.4%) | 501 (62.5%) |
| College/Associate Degree | 104 (35.2%) | 191 (64.7%) |
| Bachelor's Degree or higher | 95 (70.9%) | 39 (29.1%) |
Occupancy by Age of Householder in Burlington
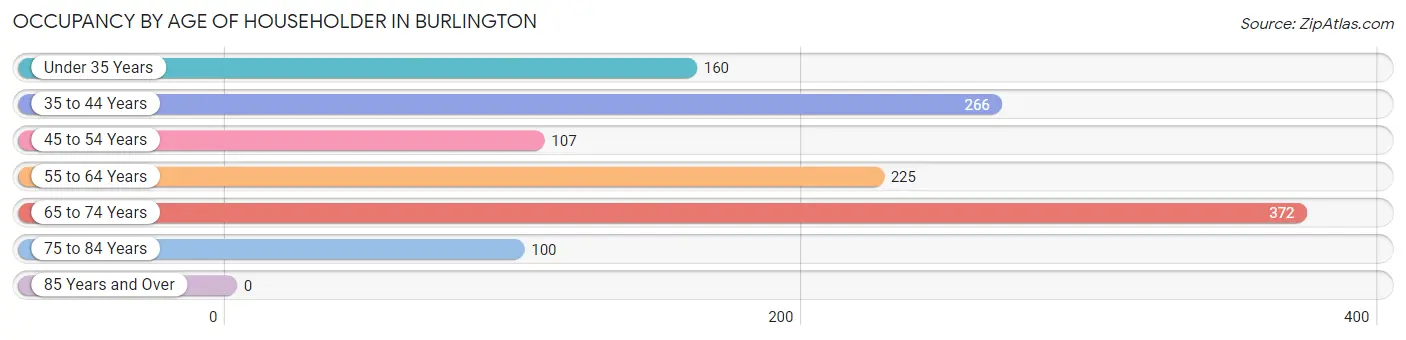
| Age Bracket | # Households | % Households |
| Under 35 Years | 160 | 13.0% |
| 35 to 44 Years | 266 | 21.6% |
| 45 to 54 Years | 107 | 8.7% |
| 55 to 64 Years | 225 | 18.3% |
| 65 to 74 Years | 372 | 30.2% |
| 75 to 84 Years | 100 | 8.1% |
| 85 Years and Over | 0 | 0.0% |
| Total | 1,230 | 100.0% |
Housing Finances in Burlington
Median Income by Occupancy in Burlington
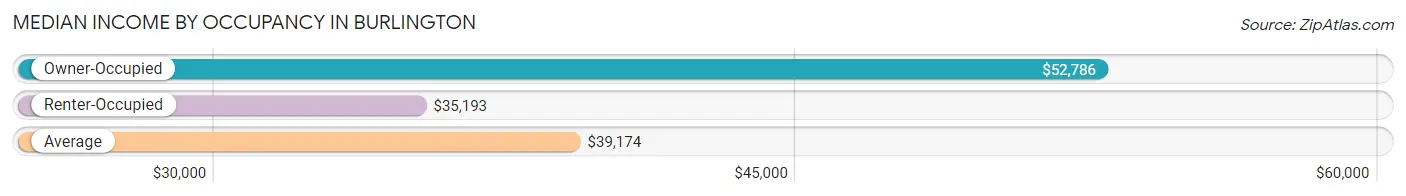
| Occupancy Type | # Households | Median Income |
| Owner-Occupied | 499 (40.6%) | $52,786 |
| Renter-Occupied | 731 (59.4%) | $35,193 |
| Average | 1,230 (100.0%) | $39,174 |
Occupancy by Householder Income Bracket in Burlington
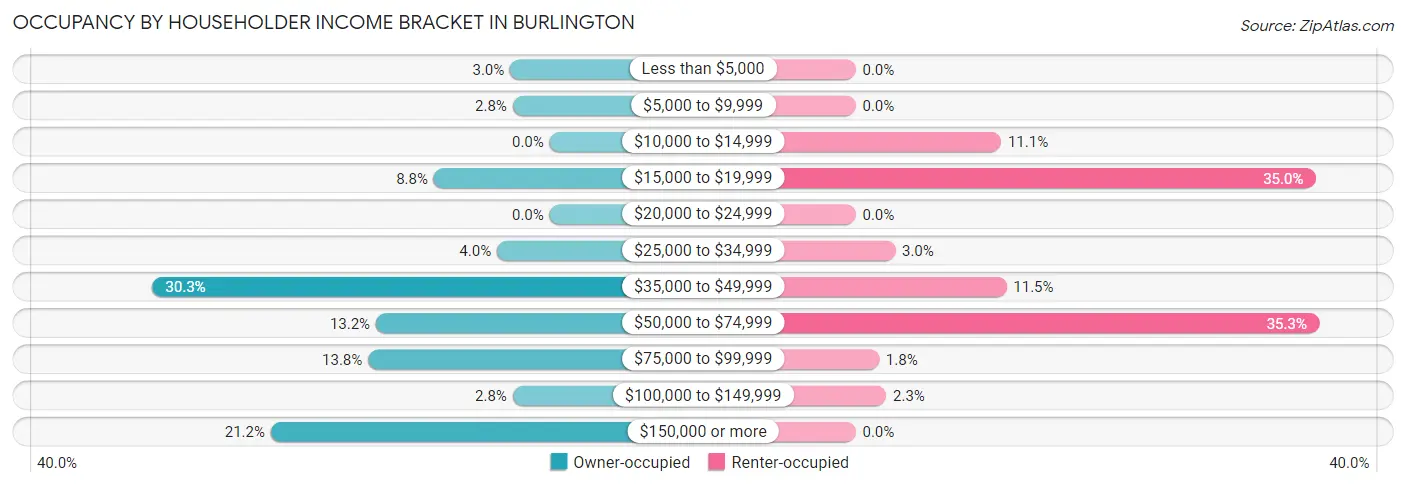
| Income Bracket | Owner-occupied | Renter-occupied |
| Less than $5,000 | 15 (3.0%) | 0 (0.0%) |
| $5,000 to $9,999 | 14 (2.8%) | 0 (0.0%) |
| $10,000 to $14,999 | 0 (0.0%) | 81 (11.1%) |
| $15,000 to $19,999 | 44 (8.8%) | 256 (35.0%) |
| $20,000 to $24,999 | 0 (0.0%) | 0 (0.0%) |
| $25,000 to $34,999 | 20 (4.0%) | 22 (3.0%) |
| $35,000 to $49,999 | 151 (30.3%) | 84 (11.5%) |
| $50,000 to $74,999 | 66 (13.2%) | 258 (35.3%) |
| $75,000 to $99,999 | 69 (13.8%) | 13 (1.8%) |
| $100,000 to $149,999 | 14 (2.8%) | 17 (2.3%) |
| $150,000 or more | 106 (21.2%) | 0 (0.0%) |
| Total | 499 (100.0%) | 731 (100.0%) |
Monthly Housing Cost Tiers in Burlington
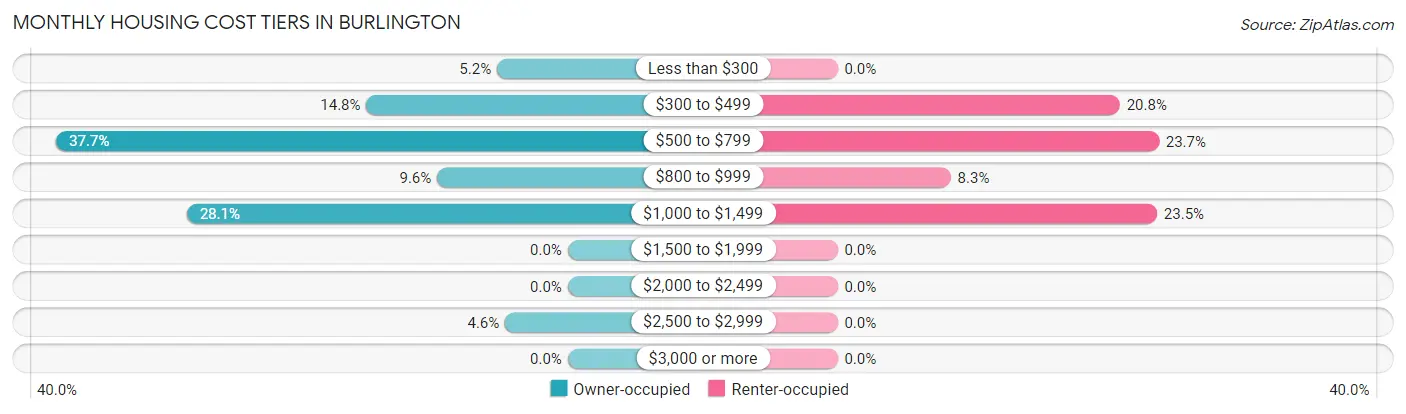
| Monthly Cost | Owner-occupied | Renter-occupied |
| Less than $300 | 26 (5.2%) | 0 (0.0%) |
| $300 to $499 | 74 (14.8%) | 152 (20.8%) |
| $500 to $799 | 188 (37.7%) | 173 (23.7%) |
| $800 to $999 | 48 (9.6%) | 61 (8.3%) |
| $1,000 to $1,499 | 140 (28.1%) | 172 (23.5%) |
| $1,500 to $1,999 | 0 (0.0%) | 0 (0.0%) |
| $2,000 to $2,499 | 0 (0.0%) | 0 (0.0%) |
| $2,500 to $2,999 | 23 (4.6%) | 0 (0.0%) |
| $3,000 or more | 0 (0.0%) | 0 (0.0%) |
| Total | 499 (100.0%) | 731 (100.0%) |
Physical Housing Characteristics in Burlington
Housing Structures in Burlington
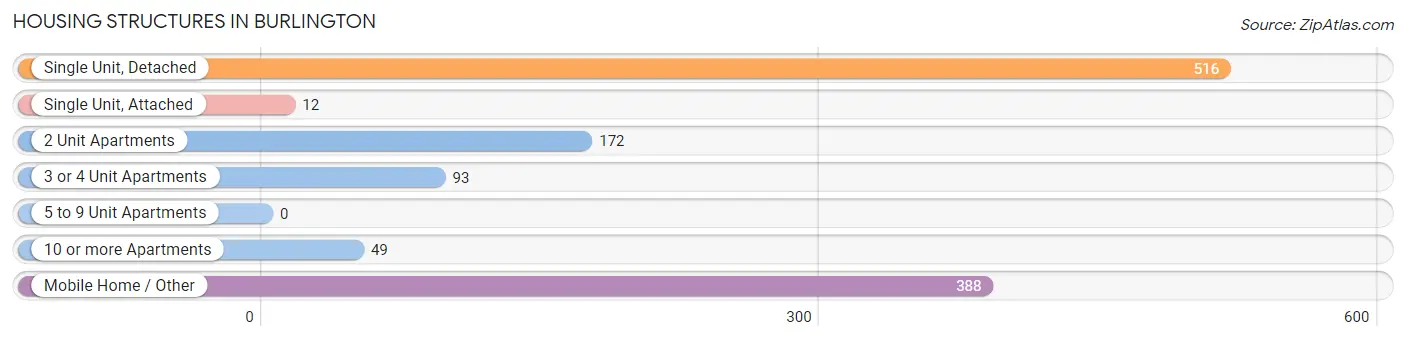
| Structure Type | # Housing Units | % Housing Units |
| Single Unit, Detached | 516 | 41.9% |
| Single Unit, Attached | 12 | 1.0% |
| 2 Unit Apartments | 172 | 14.0% |
| 3 or 4 Unit Apartments | 93 | 7.6% |
| 5 to 9 Unit Apartments | 0 | 0.0% |
| 10 or more Apartments | 49 | 4.0% |
| Mobile Home / Other | 388 | 31.5% |
| Total | 1,230 | 100.0% |
Housing Structures by Occupancy in Burlington
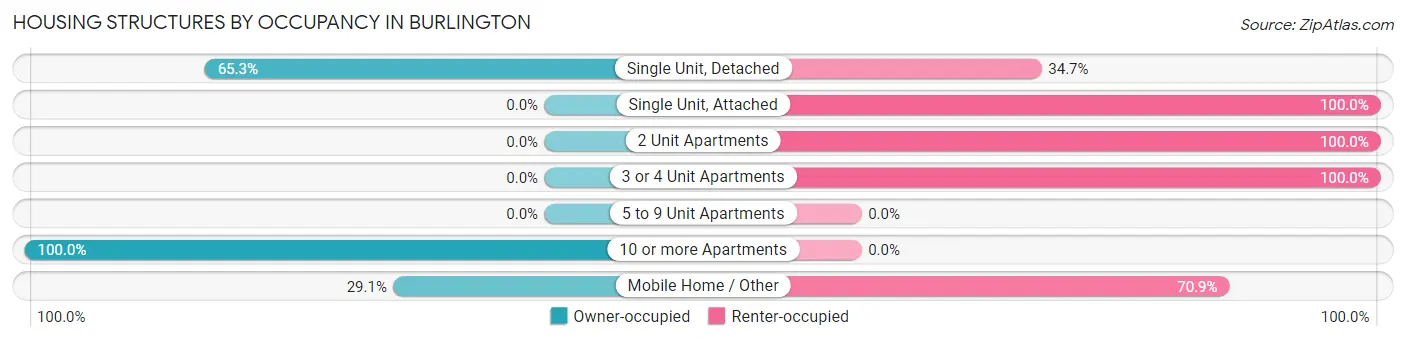
| Structure Type | Owner-occupied | Renter-occupied |
| Single Unit, Detached | 337 (65.3%) | 179 (34.7%) |
| Single Unit, Attached | 0 (0.0%) | 12 (100.0%) |
| 2 Unit Apartments | 0 (0.0%) | 172 (100.0%) |
| 3 or 4 Unit Apartments | 0 (0.0%) | 93 (100.0%) |
| 5 to 9 Unit Apartments | 0 (0.0%) | 0 (0.0%) |
| 10 or more Apartments | 49 (100.0%) | 0 (0.0%) |
| Mobile Home / Other | 113 (29.1%) | 275 (70.9%) |
| Total | 499 (40.6%) | 731 (59.4%) |
Housing Structures by Number of Rooms in Burlington
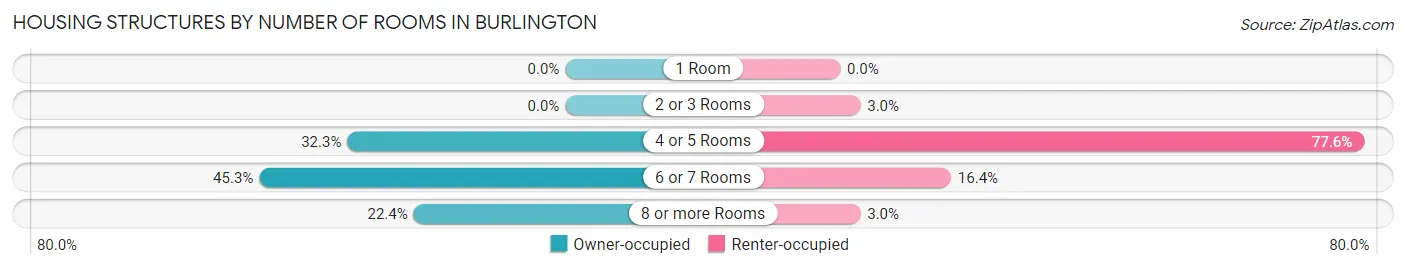
| Number of Rooms | Owner-occupied | Renter-occupied |
| 1 Room | 0 (0.0%) | 0 (0.0%) |
| 2 or 3 Rooms | 0 (0.0%) | 22 (3.0%) |
| 4 or 5 Rooms | 161 (32.3%) | 567 (77.6%) |
| 6 or 7 Rooms | 226 (45.3%) | 120 (16.4%) |
| 8 or more Rooms | 112 (22.4%) | 22 (3.0%) |
| Total | 499 (100.0%) | 731 (100.0%) |
Housing Structure by Heating Type in Burlington
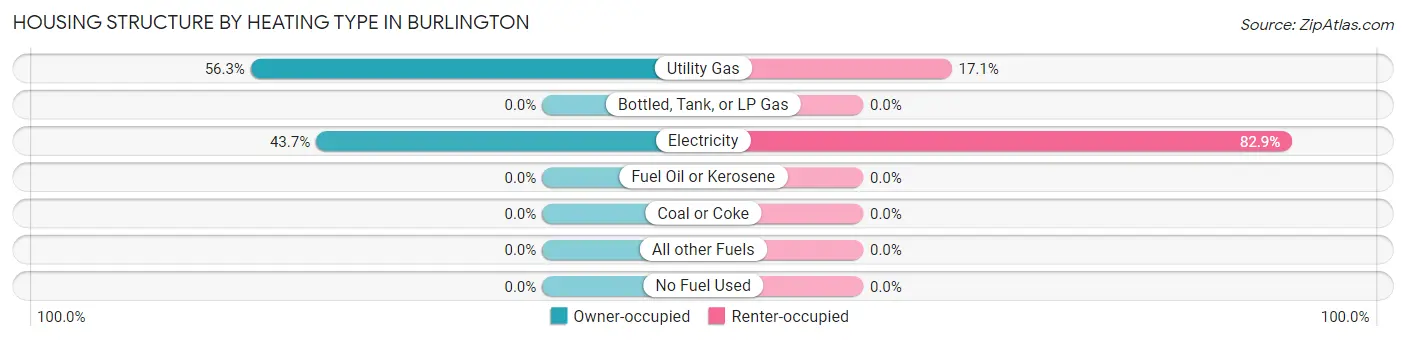
| Heating Type | Owner-occupied | Renter-occupied |
| Utility Gas | 281 (56.3%) | 125 (17.1%) |
| Bottled, Tank, or LP Gas | 0 (0.0%) | 0 (0.0%) |
| Electricity | 218 (43.7%) | 606 (82.9%) |
| Fuel Oil or Kerosene | 0 (0.0%) | 0 (0.0%) |
| Coal or Coke | 0 (0.0%) | 0 (0.0%) |
| All other Fuels | 0 (0.0%) | 0 (0.0%) |
| No Fuel Used | 0 (0.0%) | 0 (0.0%) |
| Total | 499 (100.0%) | 731 (100.0%) |
Household Vehicle Usage in Burlington
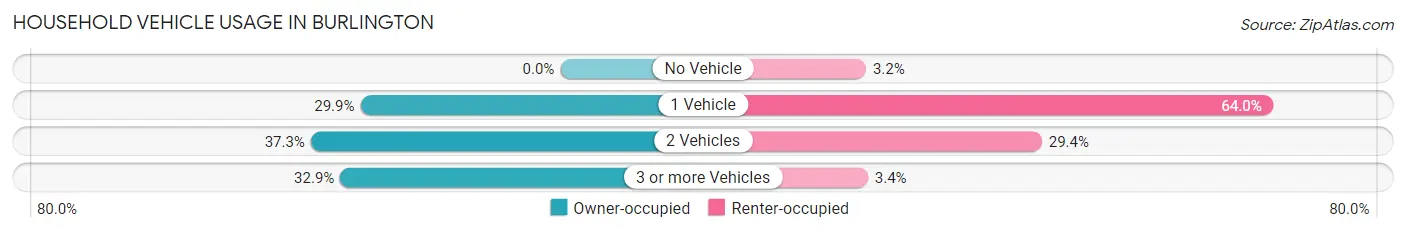
| Vehicles per Household | Owner-occupied | Renter-occupied |
| No Vehicle | 0 (0.0%) | 23 (3.2%) |
| 1 Vehicle | 149 (29.9%) | 468 (64.0%) |
| 2 Vehicles | 186 (37.3%) | 215 (29.4%) |
| 3 or more Vehicles | 164 (32.9%) | 25 (3.4%) |
| Total | 499 (100.0%) | 731 (100.0%) |
Real Estate & Mortgages in Burlington
Real Estate and Mortgage Overview in Burlington
| Characteristic | Without Mortgage | With Mortgage |
| Housing Units | 277 | 222 |
| Median Property Value | - | - |
| Median Household Income | $87,883 | $23 |
| Monthly Housing Costs | $553 | $0 |
| Real Estate Taxes | $2,304 | $11 |
Property Value by Mortgage Status in Burlington
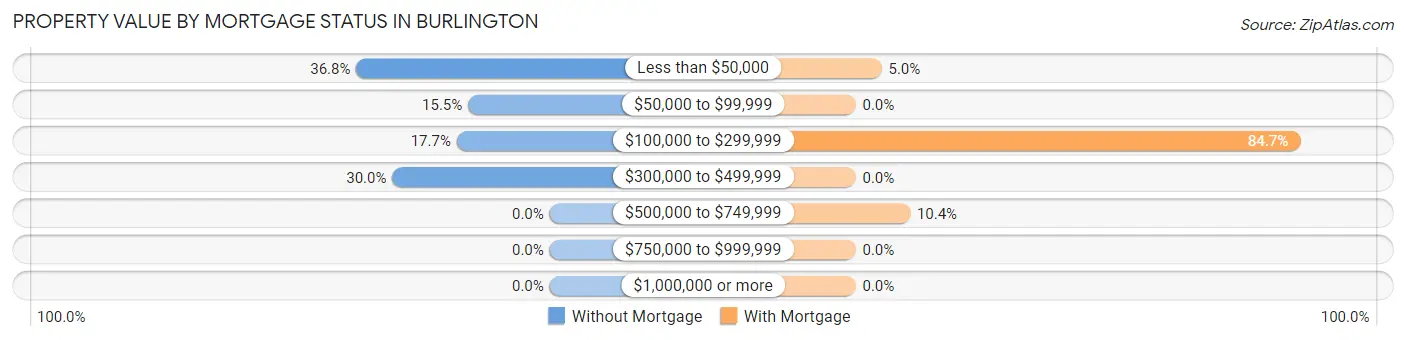
| Property Value | Without Mortgage | With Mortgage |
| Less than $50,000 | 102 (36.8%) | 11 (5.0%) |
| $50,000 to $99,999 | 43 (15.5%) | 0 (0.0%) |
| $100,000 to $299,999 | 49 (17.7%) | 188 (84.7%) |
| $300,000 to $499,999 | 83 (30.0%) | 0 (0.0%) |
| $500,000 to $749,999 | 0 (0.0%) | 23 (10.4%) |
| $750,000 to $999,999 | 0 (0.0%) | 0 (0.0%) |
| $1,000,000 or more | 0 (0.0%) | 0 (0.0%) |
| Total | 277 (100.0%) | 222 (100.0%) |
Household Income by Mortgage Status in Burlington
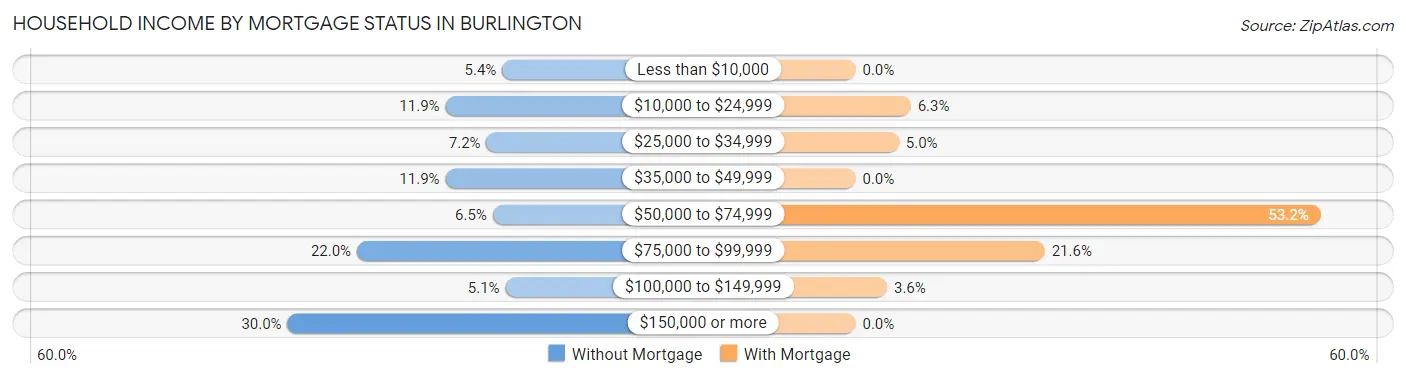
| Household Income | Without Mortgage | With Mortgage |
| Less than $10,000 | 15 (5.4%) | 0 (0.0%) |
| $10,000 to $24,999 | 33 (11.9%) | 14 (6.3%) |
| $25,000 to $34,999 | 20 (7.2%) | 11 (5.0%) |
| $35,000 to $49,999 | 33 (11.9%) | 0 (0.0%) |
| $50,000 to $74,999 | 18 (6.5%) | 118 (53.1%) |
| $75,000 to $99,999 | 61 (22.0%) | 48 (21.6%) |
| $100,000 to $149,999 | 14 (5.1%) | 8 (3.6%) |
| $150,000 or more | 83 (30.0%) | 0 (0.0%) |
| Total | 277 (100.0%) | 222 (100.0%) |
Property Value to Household Income Ratio in Burlington
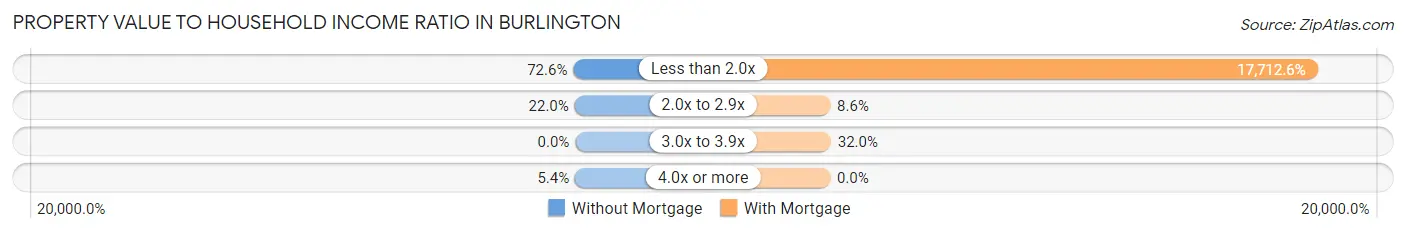
| Value-to-Income Ratio | Without Mortgage | With Mortgage |
| Less than 2.0x | 201 (72.6%) | 39,322 (17,712.6%) |
| 2.0x to 2.9x | 61 (22.0%) | 19 (8.6%) |
| 3.0x to 3.9x | 0 (0.0%) | 71 (32.0%) |
| 4.0x or more | 15 (5.4%) | 0 (0.0%) |
| Total | 277 (100.0%) | 222 (100.0%) |
Real Estate Taxes by Mortgage Status in Burlington
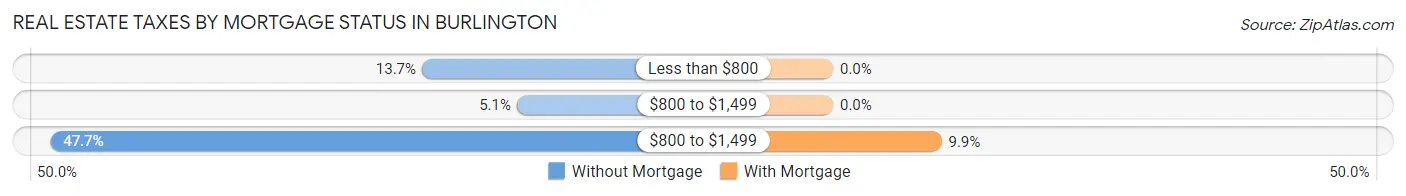
| Property Taxes | Without Mortgage | With Mortgage |
| Less than $800 | 38 (13.7%) | 0 (0.0%) |
| $800 to $1,499 | 14 (5.1%) | 0 (0.0%) |
| $800 to $1,499 | 132 (47.6%) | 22 (9.9%) |
| Total | 277 (100.0%) | 222 (100.0%) |
Health & Disability in Burlington
Health Insurance Coverage by Age in Burlington
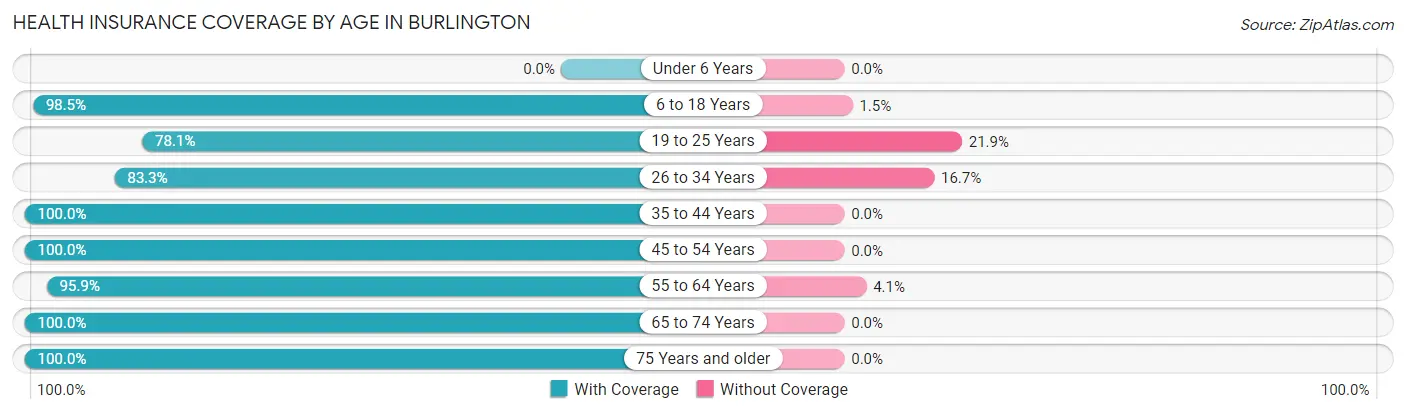
| Age Bracket | With Coverage | Without Coverage |
| Under 6 Years | 0 (0.0%) | 0 (0.0%) |
| 6 to 18 Years | 520 (98.5%) | 8 (1.5%) |
| 19 to 25 Years | 221 (78.1%) | 62 (21.9%) |
| 26 to 34 Years | 229 (83.3%) | 46 (16.7%) |
| 35 to 44 Years | 379 (100.0%) | 0 (0.0%) |
| 45 to 54 Years | 169 (100.0%) | 0 (0.0%) |
| 55 to 64 Years | 305 (95.9%) | 13 (4.1%) |
| 65 to 74 Years | 483 (100.0%) | 0 (0.0%) |
| 75 Years and older | 168 (100.0%) | 0 (0.0%) |
| Total | 2,474 (95.0%) | 129 (5.0%) |
Health Insurance Coverage by Citizenship Status in Burlington
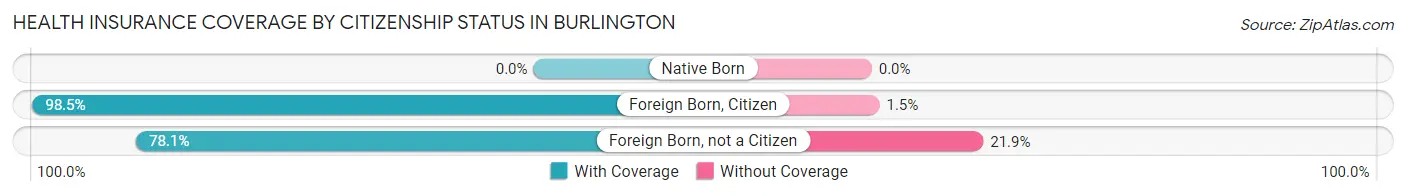
| Citizenship Status | With Coverage | Without Coverage |
| Native Born | 0 (0.0%) | 0 (0.0%) |
| Foreign Born, Citizen | 520 (98.5%) | 8 (1.5%) |
| Foreign Born, not a Citizen | 221 (78.1%) | 62 (21.9%) |
Health Insurance Coverage by Household Income in Burlington
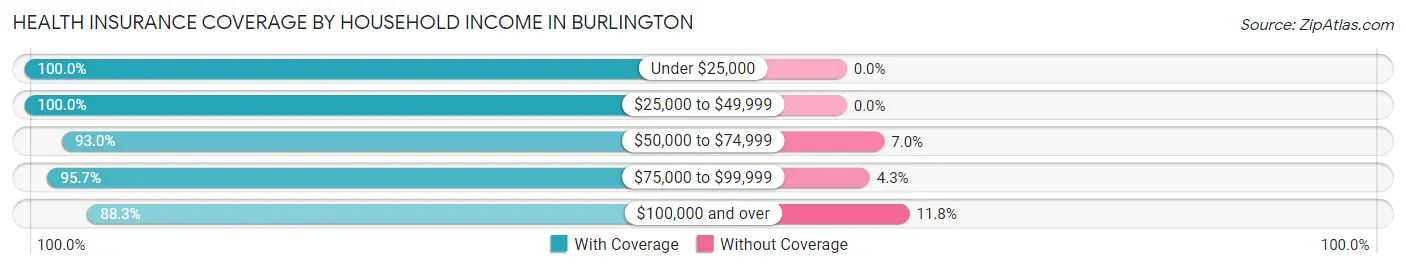
| Household Income | With Coverage | Without Coverage |
| Under $25,000 | 491 (100.0%) | 0 (0.0%) |
| $25,000 to $49,999 | 544 (100.0%) | 0 (0.0%) |
| $50,000 to $74,999 | 819 (93.0%) | 62 (7.0%) |
| $75,000 to $99,999 | 177 (95.7%) | 8 (4.3%) |
| $100,000 and over | 443 (88.2%) | 59 (11.7%) |
Public vs Private Health Insurance Coverage by Age in Burlington
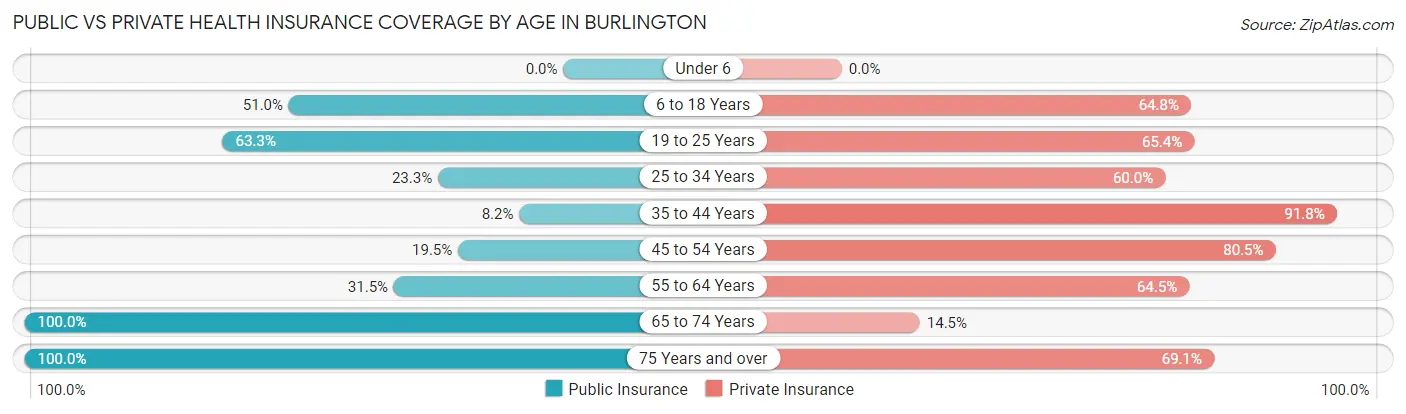
| Age Bracket | Public Insurance | Private Insurance |
| Under 6 | 0 (0.0%) | 0 (0.0%) |
| 6 to 18 Years | 269 (50.9%) | 342 (64.8%) |
| 19 to 25 Years | 179 (63.2%) | 185 (65.4%) |
| 25 to 34 Years | 64 (23.3%) | 165 (60.0%) |
| 35 to 44 Years | 31 (8.2%) | 348 (91.8%) |
| 45 to 54 Years | 33 (19.5%) | 136 (80.5%) |
| 55 to 64 Years | 100 (31.5%) | 205 (64.5%) |
| 65 to 74 Years | 483 (100.0%) | 70 (14.5%) |
| 75 Years and over | 168 (100.0%) | 116 (69.1%) |
| Total | 1,327 (51.0%) | 1,567 (60.2%) |
Disability Status by Sex by Age in Burlington
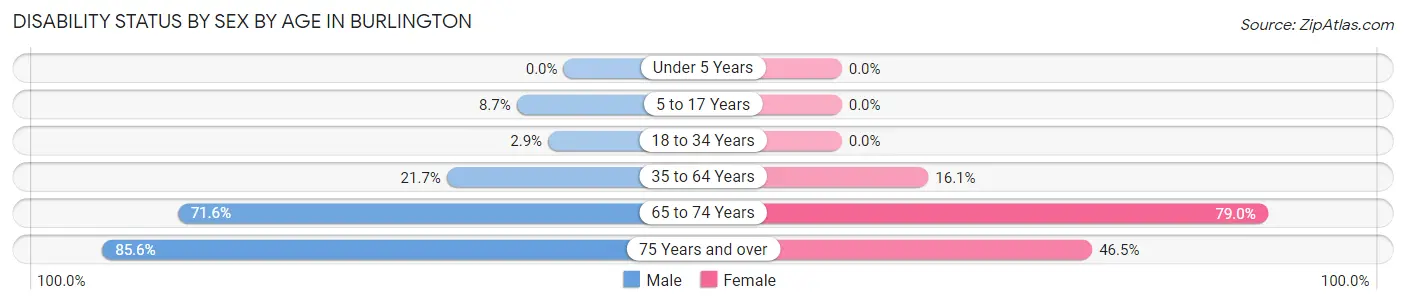
| Age Bracket | Male | Female |
| Under 5 Years | 0 (0.0%) | 0 (0.0%) |
| 5 to 17 Years | 25 (8.7%) | 0 (0.0%) |
| 18 to 34 Years | 10 (2.9%) | 0 (0.0%) |
| 35 to 64 Years | 73 (21.7%) | 85 (16.1%) |
| 65 to 74 Years | 141 (71.6%) | 226 (79.0%) |
| 75 Years and over | 83 (85.6%) | 33 (46.5%) |
Disability Class by Sex by Age in Burlington
Disability Class: Hearing Difficulty
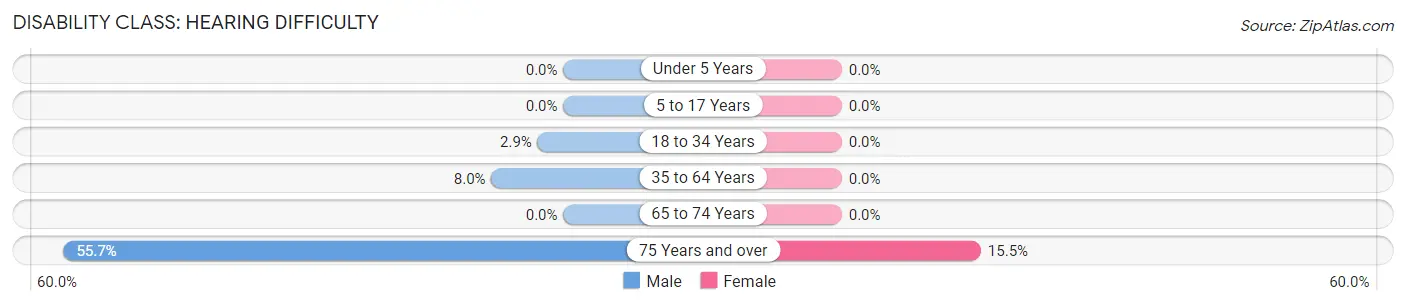
| Age Bracket | Male | Female |
| Under 5 Years | 0 (0.0%) | 0 (0.0%) |
| 5 to 17 Years | 0 (0.0%) | 0 (0.0%) |
| 18 to 34 Years | 10 (2.9%) | 0 (0.0%) |
| 35 to 64 Years | 27 (8.0%) | 0 (0.0%) |
| 65 to 74 Years | 0 (0.0%) | 0 (0.0%) |
| 75 Years and over | 54 (55.7%) | 11 (15.5%) |
Disability Class: Vision Difficulty
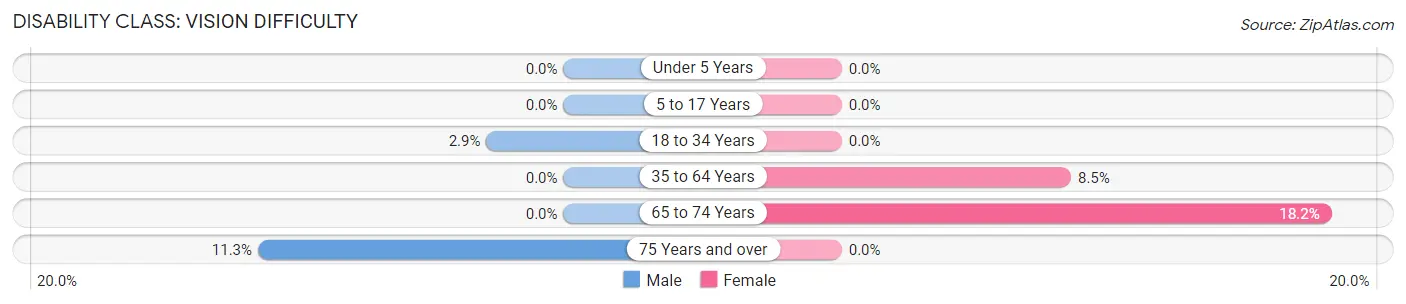
| Age Bracket | Male | Female |
| Under 5 Years | 0 (0.0%) | 0 (0.0%) |
| 5 to 17 Years | 0 (0.0%) | 0 (0.0%) |
| 18 to 34 Years | 10 (2.9%) | 0 (0.0%) |
| 35 to 64 Years | 0 (0.0%) | 45 (8.5%) |
| 65 to 74 Years | 0 (0.0%) | 52 (18.2%) |
| 75 Years and over | 11 (11.3%) | 0 (0.0%) |
Disability Class: Cognitive Difficulty
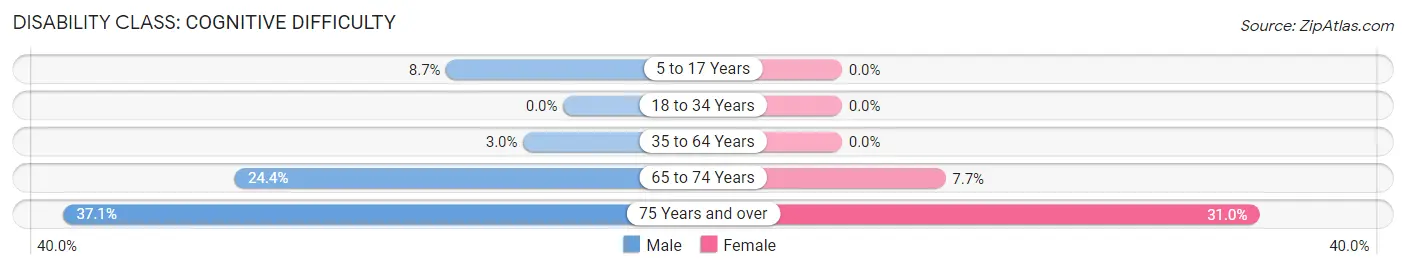
| Age Bracket | Male | Female |
| 5 to 17 Years | 25 (8.7%) | 0 (0.0%) |
| 18 to 34 Years | 0 (0.0%) | 0 (0.0%) |
| 35 to 64 Years | 10 (3.0%) | 0 (0.0%) |
| 65 to 74 Years | 48 (24.4%) | 22 (7.7%) |
| 75 Years and over | 36 (37.1%) | 22 (31.0%) |
Disability Class: Ambulatory Difficulty
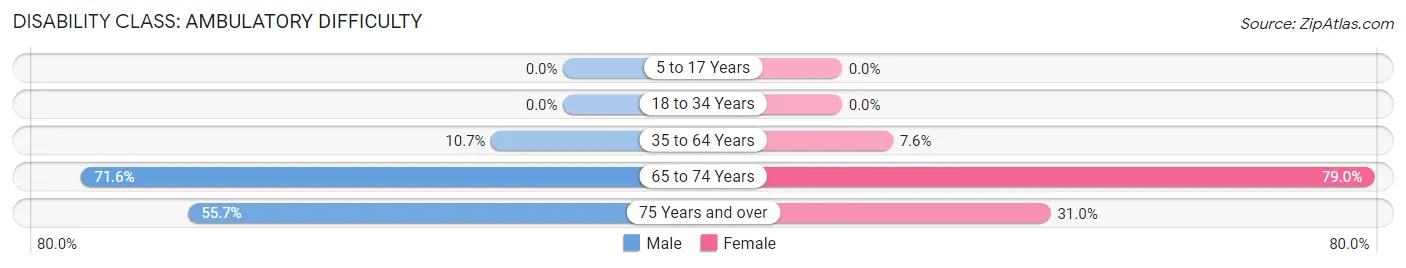
| Age Bracket | Male | Female |
| 5 to 17 Years | 0 (0.0%) | 0 (0.0%) |
| 18 to 34 Years | 0 (0.0%) | 0 (0.0%) |
| 35 to 64 Years | 36 (10.7%) | 40 (7.6%) |
| 65 to 74 Years | 141 (71.6%) | 226 (79.0%) |
| 75 Years and over | 54 (55.7%) | 22 (31.0%) |
Disability Class: Self-Care Difficulty
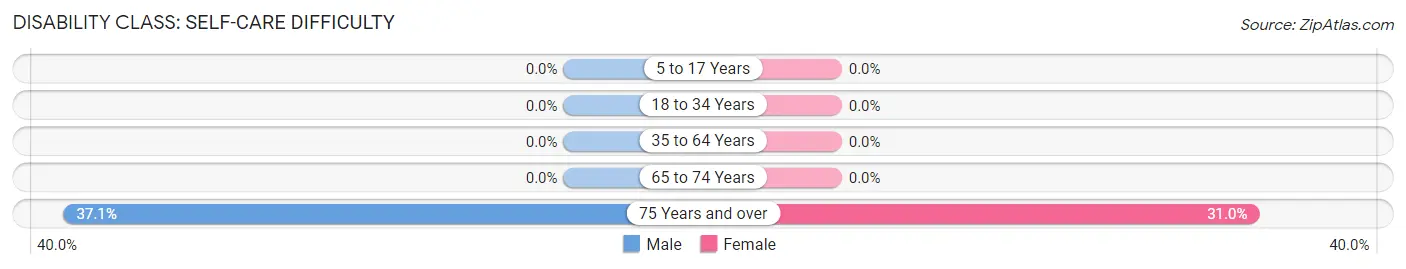
| Age Bracket | Male | Female |
| 5 to 17 Years | 0 (0.0%) | 0 (0.0%) |
| 18 to 34 Years | 0 (0.0%) | 0 (0.0%) |
| 35 to 64 Years | 0 (0.0%) | 0 (0.0%) |
| 65 to 74 Years | 0 (0.0%) | 0 (0.0%) |
| 75 Years and over | 36 (37.1%) | 22 (31.0%) |
Technology Access in Burlington
Computing Device Access in Burlington
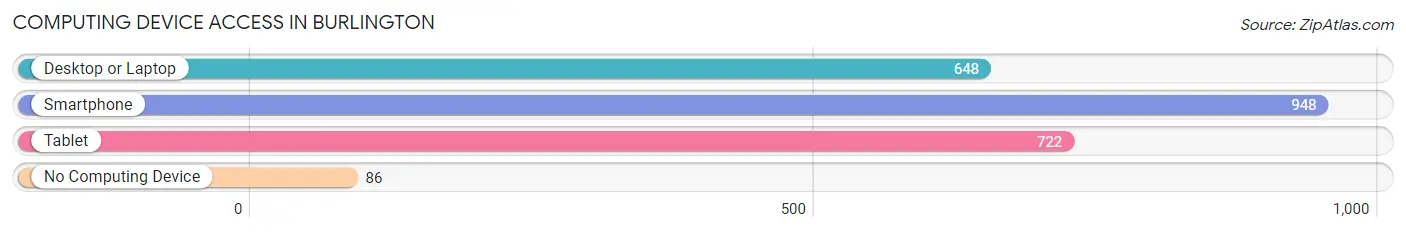
| Device Type | # Households | % Households |
| Desktop or Laptop | 648 | 52.7% |
| Smartphone | 948 | 77.1% |
| Tablet | 722 | 58.7% |
| No Computing Device | 86 | 7.0% |
| Total | 1,230 | 100.0% |
Internet Access in Burlington
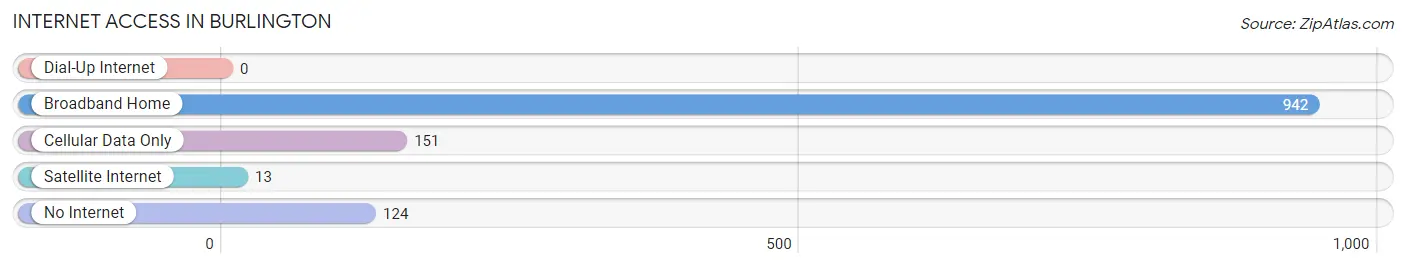
| Internet Type | # Households | % Households |
| Dial-Up Internet | 0 | 0.0% |
| Broadband Home | 942 | 76.6% |
| Cellular Data Only | 151 | 12.3% |
| Satellite Internet | 13 | 1.1% |
| No Internet | 124 | 10.1% |
| Total | 1,230 | 100.0% |
Burlington Summary
Burlington, Ohio is a small village located in the southeastern corner of the state, in the county of Preble. It is situated on the banks of the Great Miami River, and is part of the Dayton metropolitan area. The village has a population of approximately 1,000 people, and is known for its rural charm and small-town atmosphere.
History
Burlington was founded in 1817 by a group of settlers from Pennsylvania. The village was named after the nearby town of Burlington, Pennsylvania. The settlers were attracted to the area due to its fertile soil and abundant natural resources. The village quickly grew and by 1820, it had a population of over 500 people.
In the mid-1800s, the village was a major stop on the Underground Railroad, with many runaway slaves passing through on their way to freedom. The village was also home to a number of abolitionists, including the prominent Quaker, John Rankin.
In the late 1800s, the village experienced a period of growth and prosperity. The Great Miami River was used to transport goods and services, and the village became a hub for trade and commerce. The village also became a popular destination for tourists, who were drawn to its picturesque scenery and rural charm.
Geography
Burlington is located in the southeastern corner of Ohio, in the county of Preble. It is situated on the banks of the Great Miami River, and is part of the Dayton metropolitan area. The village is surrounded by rolling hills and farmland, and is located approximately 25 miles from the city of Dayton.
The village has a total area of 0.7 square miles, all of which is land. The village is located at an elevation of 845 feet above sea level. The climate in Burlington is classified as humid continental, with hot summers and cold winters.
Economy
The economy of Burlington is largely based on agriculture and tourism. The village is home to a number of farms, which produce a variety of crops, including corn, soybeans, and wheat. The village is also home to a number of small businesses, including restaurants, shops, and other services.
Tourism is an important part of the local economy, with many visitors drawn to the village’s rural charm and picturesque scenery. The village is home to a number of historic sites, including the John Rankin House, which was used as a stop on the Underground Railroad.
Demographics
As of the 2010 census, the population of Burlington was 1,000 people. The racial makeup of the village was 97.2% White, 0.7% African American, 0.2% Native American, 0.2% Asian, and 1.7% from other races. The median household income was $41,250, and the median family income was $50,000.
The village is served by the Preble County School District, which includes two elementary schools, one middle school, and one high school. The village is also home to a number of churches, including the Burlington United Methodist Church and the Burlington Presbyterian Church.
Conclusion
Burlington, Ohio is a small village located in the southeastern corner of the state, in the county of Preble. It is situated on the banks of the Great Miami River, and is part of the Dayton metropolitan area. The village has a population of approximately 1,000 people, and is known for its rural charm and small-town atmosphere. The economy of Burlington is largely based on agriculture and tourism, and the village is home to a number of historic sites, including the John Rankin House. The village is served by the Preble County School District, and is home to a number of churches.
Common Questions
What is Per Capita Income in Burlington?
Per Capita income in Burlington is $34,402.
What is the Median Family Income in Burlington?
Median Family Income in Burlington is $62,788.
What is the Median Household income in Burlington?
Median Household Income in Burlington is $39,174.
What is Income or Wage Gap in Burlington?
Income or Wage Gap in Burlington is 3.6%.
Women in Burlington earn 96.4 cents for every dollar earned by a man.
What is Inequality or Gini Index in Burlington?
Inequality or Gini Index in Burlington is 0.55.
What is the Total Population of Burlington?
Total Population of Burlington is 2,780.
What is the Total Male Population of Burlington?
Total Male Population of Burlington is 1,323.
What is the Total Female Population of Burlington?
Total Female Population of Burlington is 1,457.
What is the Ratio of Males per 100 Females in Burlington?
There are 90.80 Males per 100 Females in Burlington.
What is the Ratio of Females per 100 Males in Burlington?
There are 110.13 Females per 100 Males in Burlington.
What is the Median Population Age in Burlington?
Median Population Age in Burlington is 44.5 Years.
What is the Average Family Size in Burlington
Average Family Size in Burlington is 3.0 People.
What is the Average Household Size in Burlington
Average Household Size in Burlington is 2.1 People.
How Large is the Labor Force in Burlington?
There are 1,173 People in the Labor Forcein in Burlington.
What is the Percentage of People in the Labor Force in Burlington?
51.4% of People are in the Labor Force in Burlington.
What is the Unemployment Rate in Burlington?
Unemployment Rate in Burlington is 0.9%.