Sulphur Springs, OH Map & Demographics
Sulphur Springs Map
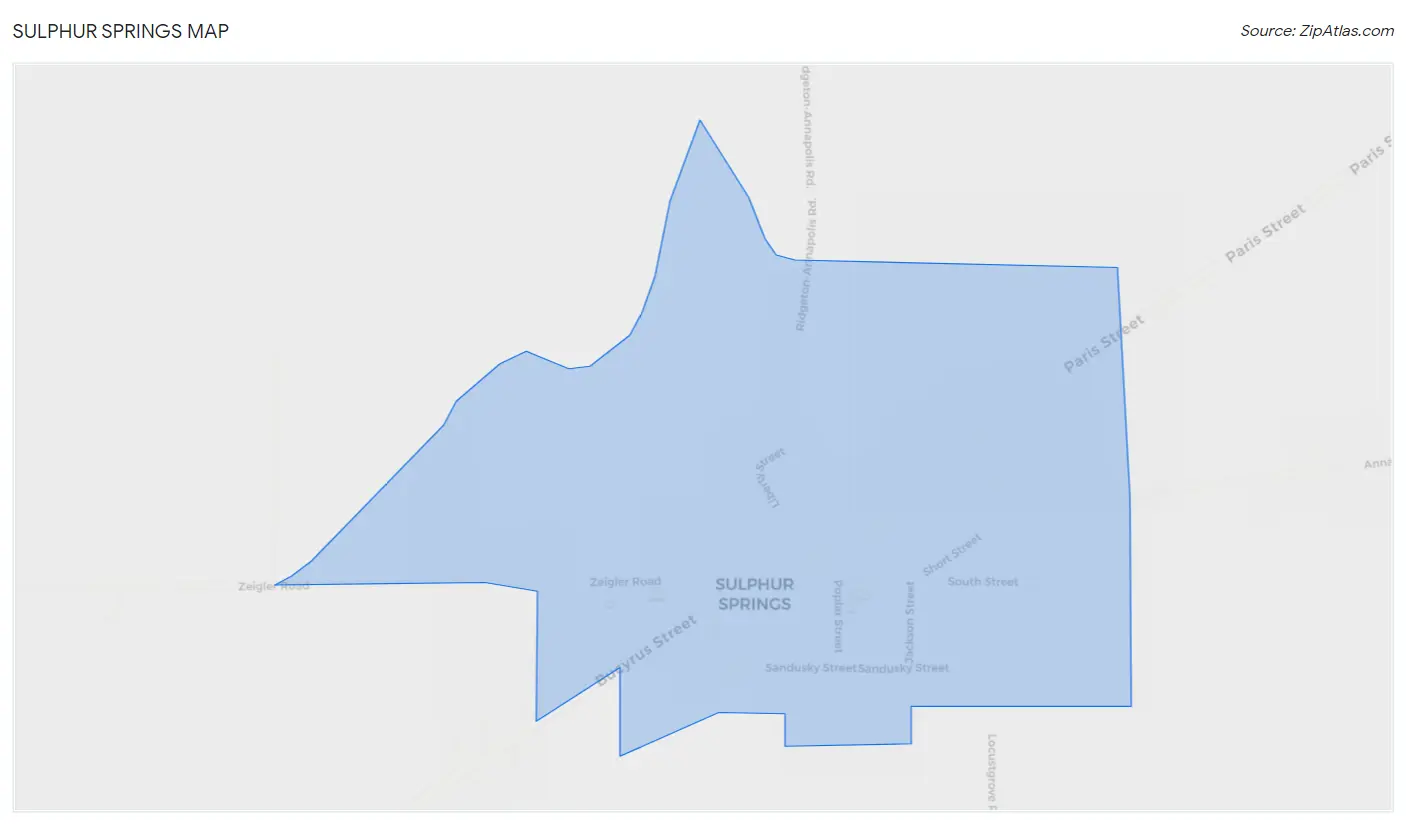
Sulphur Springs Overview
$28,994
PER CAPITA INCOME
$79,028
AVG FAMILY INCOME
19.7%
WAGE / INCOME GAP [ % ]
80.3¢/ $1
WAGE / INCOME GAP [ $ ]
0.36
INEQUALITY / GINI INDEX
193
TOTAL POPULATION
100
MALE POPULATION
93
FEMALE POPULATION
107.53
MALES / 100 FEMALES
93.00
FEMALES / 100 MALES
47.5
MEDIAN AGE
3.1
AVG FAMILY SIZE
2.9
AVG HOUSEHOLD SIZE
131
LABOR FORCE [ PEOPLE ]
90.3%
PERCENT IN LABOR FORCE
33.6%
UNEMPLOYMENT RATE
Sulphur Springs Zip Codes
Sulphur Springs Area Codes
Income in Sulphur Springs
Income Overview in Sulphur Springs
| Characteristic | Number | Measure |
| Per Capita Income | 193 | $28,994 |
| Median Family Income | 59 | $79,028 |
| Mean Family Income | 59 | $75,293 |
| Median Household Income | 67 | $0 |
| Mean Household Income | 67 | $70,997 |
| Income Deficit | 59 | $0 |
| Wage / Income Gap (%) | 193 | 19.74% |
| Wage / Income Gap ($) | 193 | 80.26¢ per $1 |
| Gini / Inequality Index | 193 | 0.36 |
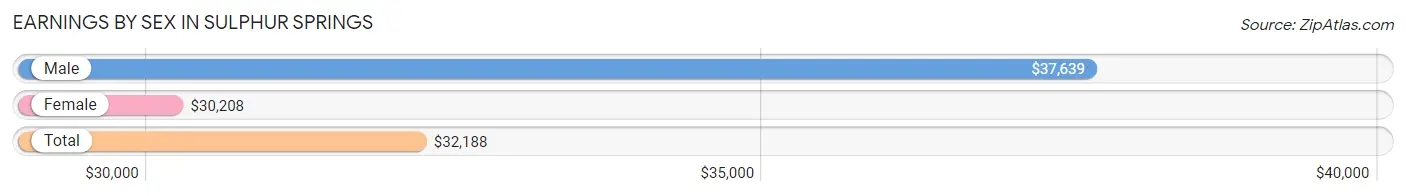
Earnings by Sex in Sulphur Springs
Average Earnings in Sulphur Springs are $32,188, $37,639 for men and $30,208 for women, a difference of 19.7%.
| Sex | Number | Average Earnings |
| Male | 51 (42.1%) | $37,639 |
| Female | 70 (57.9%) | $30,208 |
| Total | 121 (100.0%) | $32,188 |
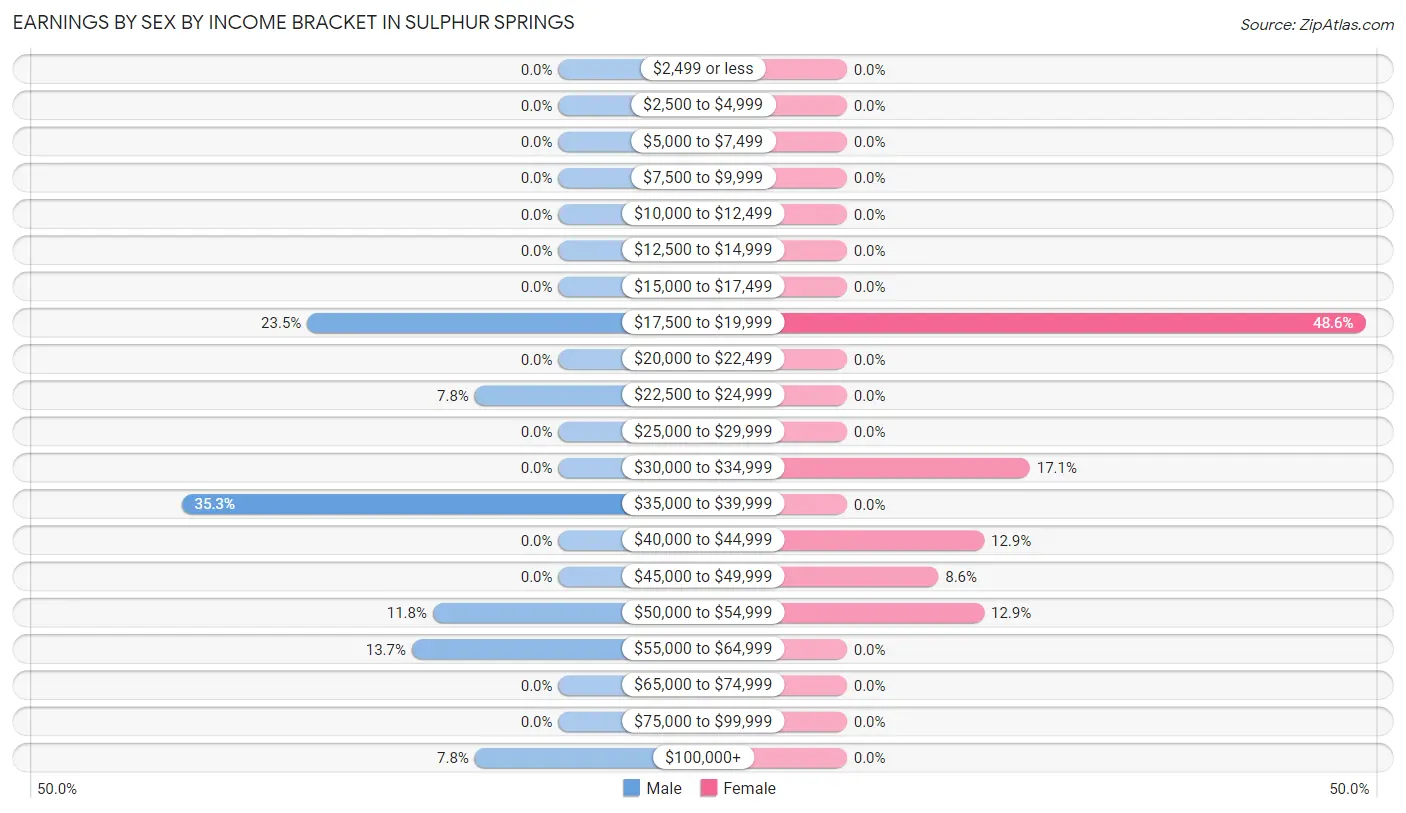
Earnings by Sex by Income Bracket in Sulphur Springs
The most common earnings brackets in Sulphur Springs are $35,000 to $39,999 for men (18 | 35.3%) and $17,500 to $19,999 for women (34 | 48.6%).
| Income | Male | Female |
| $2,499 or less | 0 (0.0%) | 0 (0.0%) |
| $2,500 to $4,999 | 0 (0.0%) | 0 (0.0%) |
| $5,000 to $7,499 | 0 (0.0%) | 0 (0.0%) |
| $7,500 to $9,999 | 0 (0.0%) | 0 (0.0%) |
| $10,000 to $12,499 | 0 (0.0%) | 0 (0.0%) |
| $12,500 to $14,999 | 0 (0.0%) | 0 (0.0%) |
| $15,000 to $17,499 | 0 (0.0%) | 0 (0.0%) |
| $17,500 to $19,999 | 12 (23.5%) | 34 (48.6%) |
| $20,000 to $22,499 | 0 (0.0%) | 0 (0.0%) |
| $22,500 to $24,999 | 4 (7.8%) | 0 (0.0%) |
| $25,000 to $29,999 | 0 (0.0%) | 0 (0.0%) |
| $30,000 to $34,999 | 0 (0.0%) | 12 (17.1%) |
| $35,000 to $39,999 | 18 (35.3%) | 0 (0.0%) |
| $40,000 to $44,999 | 0 (0.0%) | 9 (12.9%) |
| $45,000 to $49,999 | 0 (0.0%) | 6 (8.6%) |
| $50,000 to $54,999 | 6 (11.8%) | 9 (12.9%) |
| $55,000 to $64,999 | 7 (13.7%) | 0 (0.0%) |
| $65,000 to $74,999 | 0 (0.0%) | 0 (0.0%) |
| $75,000 to $99,999 | 0 (0.0%) | 0 (0.0%) |
| $100,000+ | 4 (7.8%) | 0 (0.0%) |
| Total | 51 (100.0%) | 70 (100.0%) |
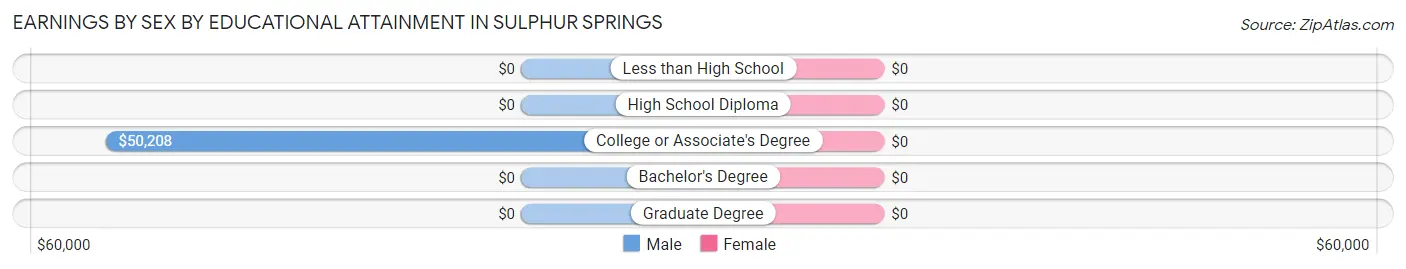
Earnings by Sex by Educational Attainment in Sulphur Springs
| Educational Attainment | Male Income | Female Income |
| Less than High School | - | - |
| High School Diploma | - | - |
| College or Associate's Degree | $50,208 | $0 |
| Bachelor's Degree | - | - |
| Graduate Degree | - | - |
| Total | $38,194 | $0 |
Family Income in Sulphur Springs
Family Income Brackets in Sulphur Springs
According to the Sulphur Springs family income data, there are 16 families falling into the $75,000 to $99,999 income range, which is the most common income bracket and makes up 27.1% of all families.
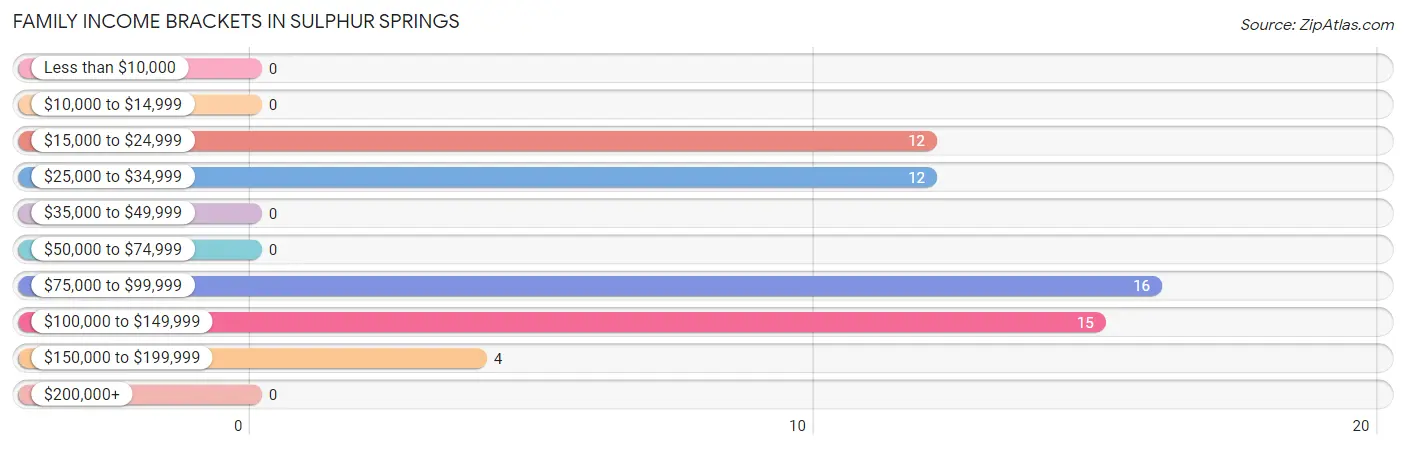
| Income Bracket | # Families | % Families |
| Less than $10,000 | 0 | 0.0% |
| $10,000 to $14,999 | 0 | 0.0% |
| $15,000 to $24,999 | 12 | 20.3% |
| $25,000 to $34,999 | 12 | 20.3% |
| $35,000 to $49,999 | 0 | 0.0% |
| $50,000 to $74,999 | 0 | 0.0% |
| $75,000 to $99,999 | 16 | 27.1% |
| $100,000 to $149,999 | 15 | 25.4% |
| $150,000 to $199,999 | 4 | 6.8% |
| $200,000+ | 0 | 0.0% |
Family Income by Famaliy Size in Sulphur Springs
2-person families (22 | 37.3%) account for the highest median family income in Sulphur Springs with $93,214 per family, while 2-person families (22 | 37.3%) have the highest median income of $46,607 per family member.
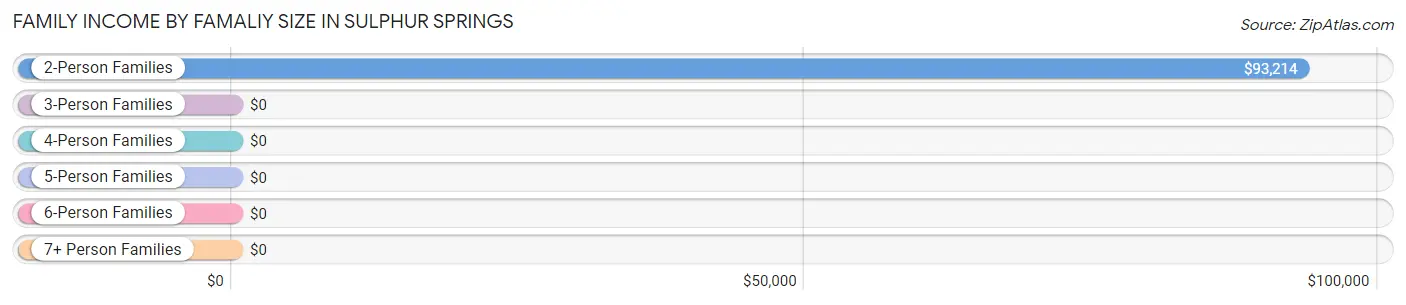
| Income Bracket | # Families | Median Income |
| 2-Person Families | 22 (37.3%) | $93,214 |
| 3-Person Families | 25 (42.4%) | $0 |
| 4-Person Families | 12 (20.3%) | $0 |
| 5-Person Families | 0 (0.0%) | $0 |
| 6-Person Families | 0 (0.0%) | $0 |
| 7+ Person Families | 0 (0.0%) | $0 |
| Total | 59 (100.0%) | $79,028 |
Family Income by Number of Earners in Sulphur Springs
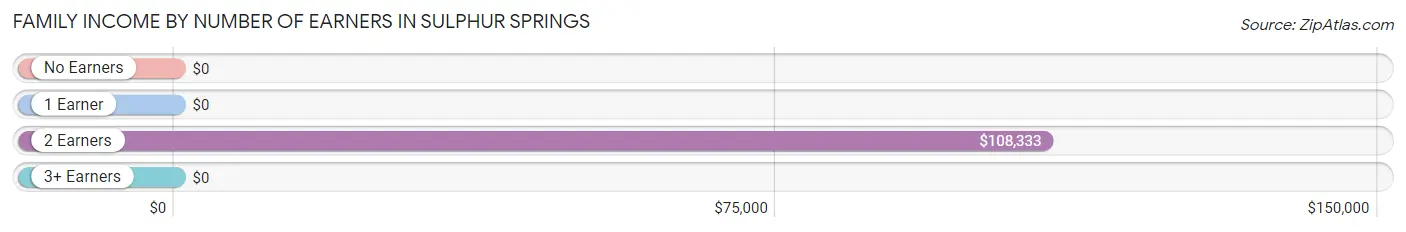
| Number of Earners | # Families | Median Income |
| No Earners | 0 (0.0%) | $0 |
| 1 Earner | 31 (52.5%) | $0 |
| 2 Earners | 24 (40.7%) | $108,333 |
| 3+ Earners | 4 (6.8%) | $0 |
| Total | 59 (100.0%) | $79,028 |
Household Income in Sulphur Springs
Household Income Brackets in Sulphur Springs
With 16 households falling in the category, the $75,000 to $99,999 income range is the most frequent in Sulphur Springs, accounting for 23.9% of all households.
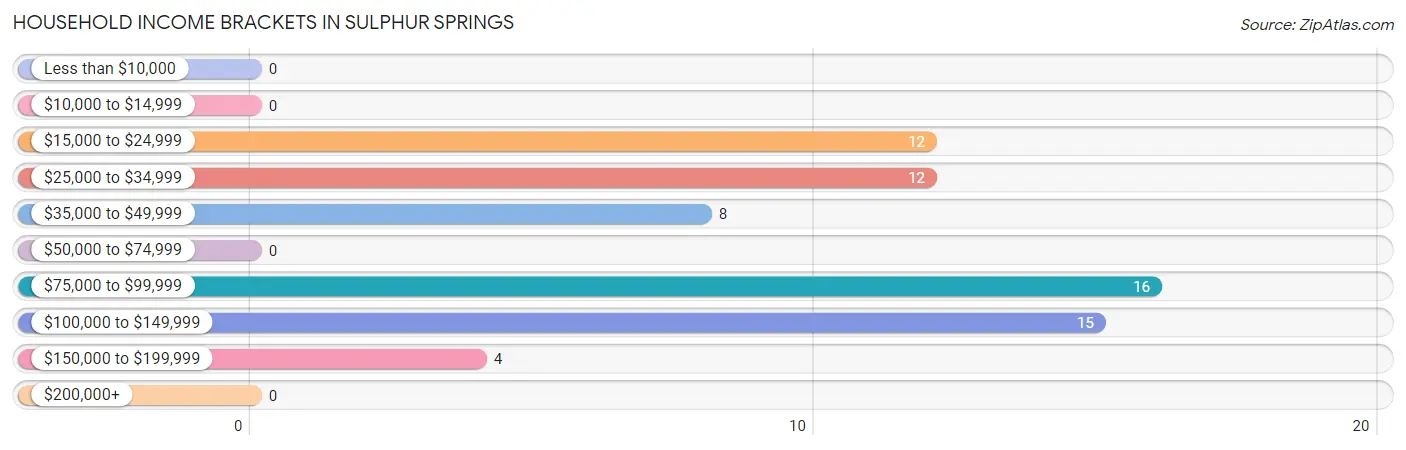
| Income Bracket | # Households | % Households |
| Less than $10,000 | 0 | 0.0% |
| $10,000 to $14,999 | 0 | 0.0% |
| $15,000 to $24,999 | 12 | 17.9% |
| $25,000 to $34,999 | 12 | 17.9% |
| $35,000 to $49,999 | 8 | 11.9% |
| $50,000 to $74,999 | 0 | 0.0% |
| $75,000 to $99,999 | 16 | 23.9% |
| $100,000 to $149,999 | 15 | 22.4% |
| $150,000 to $199,999 | 4 | 6.0% |
| $200,000+ | 0 | 0.0% |
Household Income by Householder Age in Sulphur Springs
| Income Bracket | # Households | Median Income |
| 15 to 24 Years | 0 (0.0%) | $0 |
| 25 to 44 Years | 21 (31.3%) | $0 |
| 45 to 64 Years | 31 (46.3%) | $0 |
| 65+ Years | 15 (22.4%) | $0 |
| Total | 67 (100.0%) | $0 |
Poverty in Sulphur Springs
Income Below Poverty by Sex and Age in Sulphur Springs
With 32.0% poverty level for males and 8.6% for females among the residents of Sulphur Springs, 6 to 11 year old males and 12 to 14 year old females are the most vulnerable to poverty, with 10 males (100.0%) and 8 females (100.0%) in their respective age groups living below the poverty level.
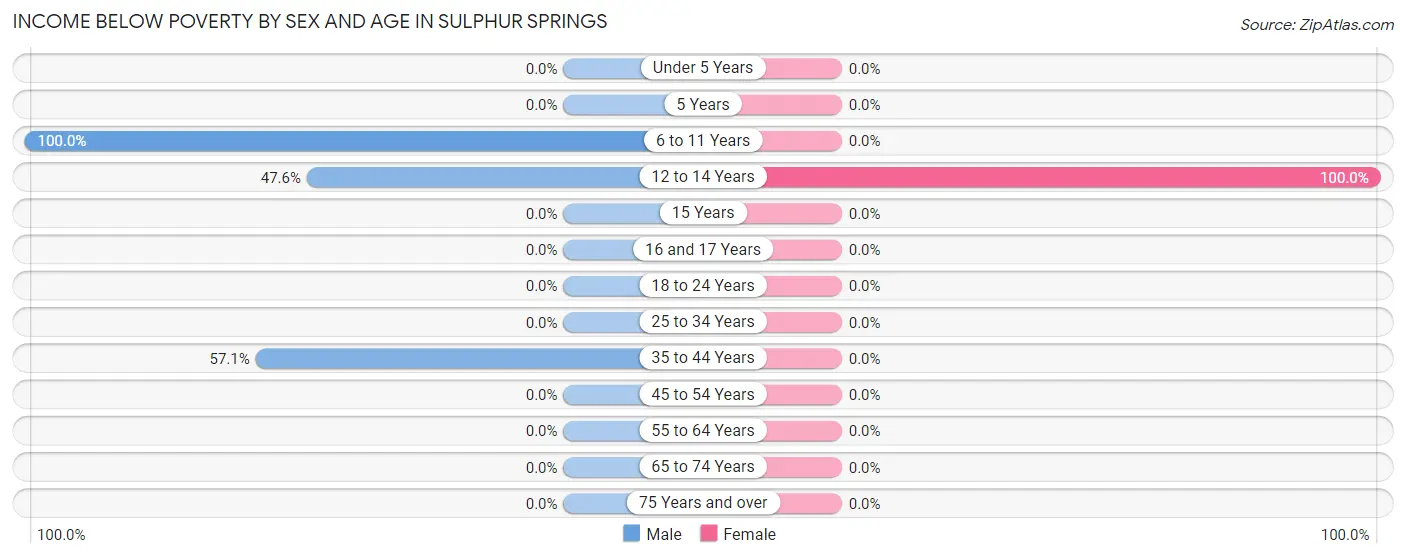
| Age Bracket | Male | Female |
| Under 5 Years | 0 (0.0%) | 0 (0.0%) |
| 5 Years | 0 (0.0%) | 0 (0.0%) |
| 6 to 11 Years | 10 (100.0%) | 0 (0.0%) |
| 12 to 14 Years | 10 (47.6%) | 8 (100.0%) |
| 15 Years | 0 (0.0%) | 0 (0.0%) |
| 16 and 17 Years | 0 (0.0%) | 0 (0.0%) |
| 18 to 24 Years | 0 (0.0%) | 0 (0.0%) |
| 25 to 34 Years | 0 (0.0%) | 0 (0.0%) |
| 35 to 44 Years | 12 (57.1%) | 0 (0.0%) |
| 45 to 54 Years | 0 (0.0%) | 0 (0.0%) |
| 55 to 64 Years | 0 (0.0%) | 0 (0.0%) |
| 65 to 74 Years | 0 (0.0%) | 0 (0.0%) |
| 75 Years and over | 0 (0.0%) | 0 (0.0%) |
| Total | 32 (32.0%) | 8 (8.6%) |
Income Above Poverty by Sex and Age in Sulphur Springs
According to the poverty statistics in Sulphur Springs, males aged 18 to 24 years and females aged 6 to 11 years are the age groups that are most secure financially, with 100.0% of males and 100.0% of females in these age groups living above the poverty line.
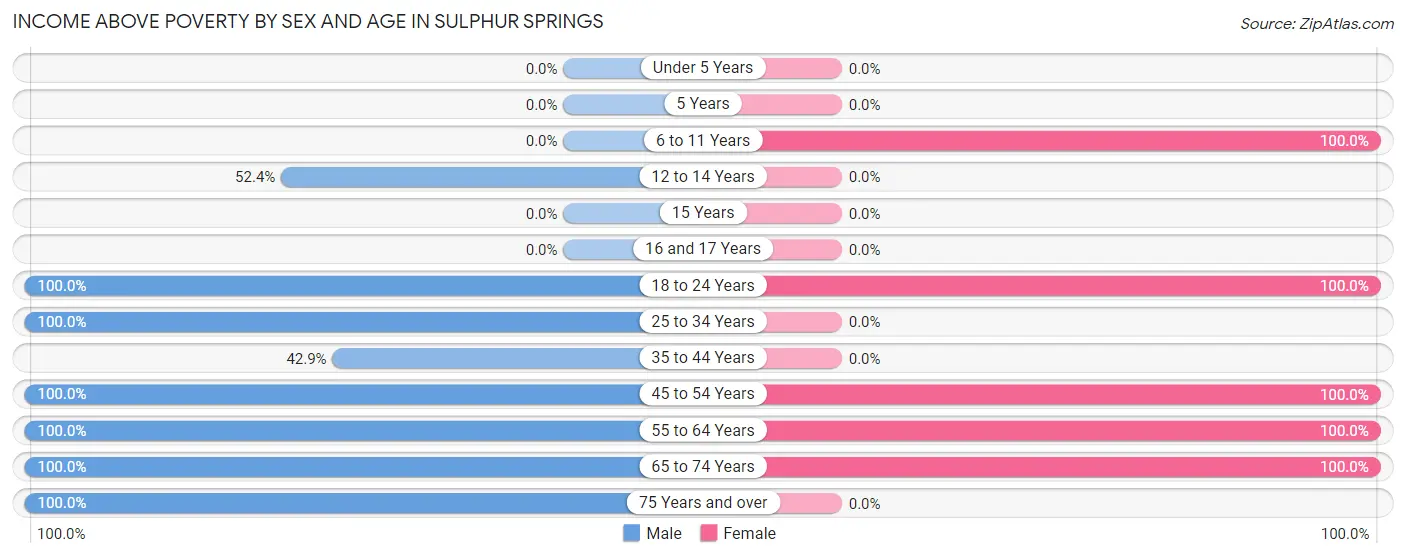
| Age Bracket | Male | Female |
| Under 5 Years | 0 (0.0%) | 0 (0.0%) |
| 5 Years | 0 (0.0%) | 0 (0.0%) |
| 6 to 11 Years | 0 (0.0%) | 9 (100.0%) |
| 12 to 14 Years | 11 (52.4%) | 0 (0.0%) |
| 15 Years | 0 (0.0%) | 0 (0.0%) |
| 16 and 17 Years | 0 (0.0%) | 0 (0.0%) |
| 18 to 24 Years | 4 (100.0%) | 9 (100.0%) |
| 25 to 34 Years | 9 (100.0%) | 0 (0.0%) |
| 35 to 44 Years | 9 (42.9%) | 0 (0.0%) |
| 45 to 54 Years | 4 (100.0%) | 46 (100.0%) |
| 55 to 64 Years | 6 (100.0%) | 15 (100.0%) |
| 65 to 74 Years | 17 (100.0%) | 6 (100.0%) |
| 75 Years and over | 8 (100.0%) | 0 (0.0%) |
| Total | 68 (68.0%) | 85 (91.4%) |
Income Below Poverty Among Married-Couple Families in Sulphur Springs
| Children | Above Poverty | Below Poverty |
| No Children | 35 (100.0%) | 0 (0.0%) |
| 1 or 2 Children | 0 (0.0%) | 0 (0.0%) |
| 3 or 4 Children | 0 (0.0%) | 0 (0.0%) |
| 5 or more Children | 0 (0.0%) | 0 (0.0%) |
| Total | 35 (100.0%) | 0 (0.0%) |
Income Below Poverty Among Single-Parent Households in Sulphur Springs
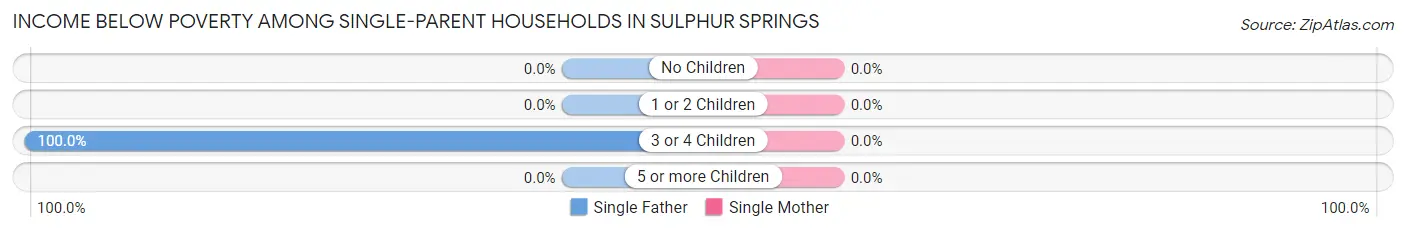
| Children | Single Father | Single Mother |
| No Children | 0 (0.0%) | 0 (0.0%) |
| 1 or 2 Children | 0 (0.0%) | 0 (0.0%) |
| 3 or 4 Children | 12 (100.0%) | 0 (0.0%) |
| 5 or more Children | 0 (0.0%) | 0 (0.0%) |
| Total | 12 (100.0%) | 0 (0.0%) |
Income Below Poverty Among Married-Couple vs Single-Parent Households in Sulphur Springs
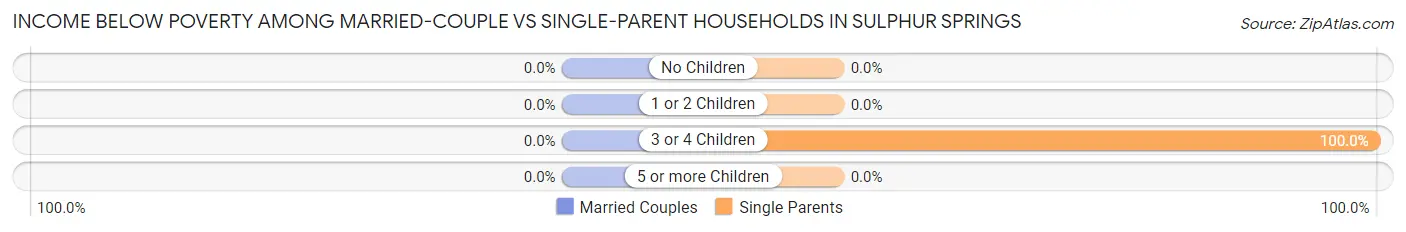
| Children | Married-Couple Families | Single-Parent Households |
| No Children | 0 (0.0%) | 0 (0.0%) |
| 1 or 2 Children | 0 (0.0%) | 0 (0.0%) |
| 3 or 4 Children | 0 (0.0%) | 12 (100.0%) |
| 5 or more Children | 0 (0.0%) | 0 (0.0%) |
| Total | 0 (0.0%) | 12 (50.0%) |
Race in Sulphur Springs
The most populous races in Sulphur Springs are White / Caucasian (185 | 95.9%), and Two or more Races (8 | 4.2%).
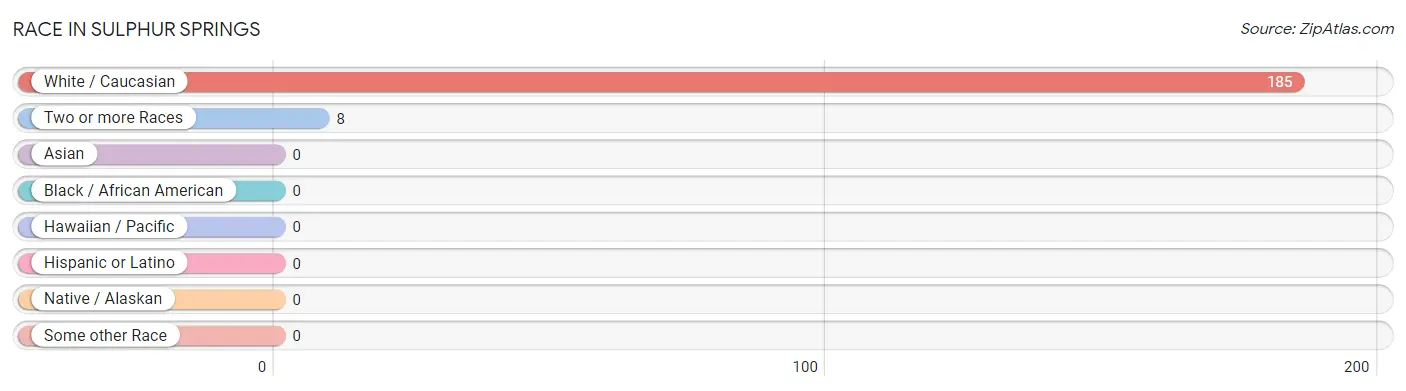
| Race | # Population | % Population |
| Asian | 0 | 0.0% |
| Black / African American | 0 | 0.0% |
| Hawaiian / Pacific | 0 | 0.0% |
| Hispanic or Latino | 0 | 0.0% |
| Native / Alaskan | 0 | 0.0% |
| White / Caucasian | 185 | 95.9% |
| Two or more Races | 8 | 4.2% |
| Some other Race | 0 | 0.0% |
| Total | 193 | 100.0% |
Ancestry in Sulphur Springs
The most populous ancestries reported in Sulphur Springs are German (139 | 72.0%), Irish (61 | 31.6%), English (21 | 10.9%), Italian (18 | 9.3%), and American (13 | 6.7%), together accounting for 130.6% of all Sulphur Springs residents.
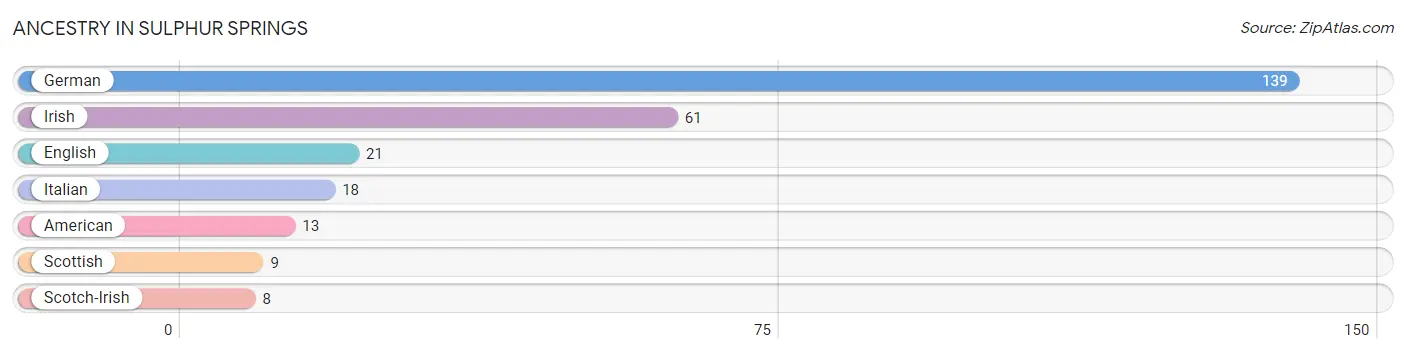
| Ancestry | # Population | % Population |
| American | 13 | 6.7% |
| English | 21 | 10.9% |
| German | 139 | 72.0% |
| Irish | 61 | 31.6% |
| Italian | 18 | 9.3% |
| Scotch-Irish | 8 | 4.2% |
| Scottish | 9 | 4.7% | View All 7 Rows |
Immigrants in Sulphur Springs

| Immigration Origin | # Population | % Population | View All 0 Rows |
Sex and Age in Sulphur Springs
Sex and Age in Sulphur Springs
The most populous age groups in Sulphur Springs are 10 to 14 Years (31 | 31.0%) for men and 50 to 54 Years (34 | 36.6%) for women.
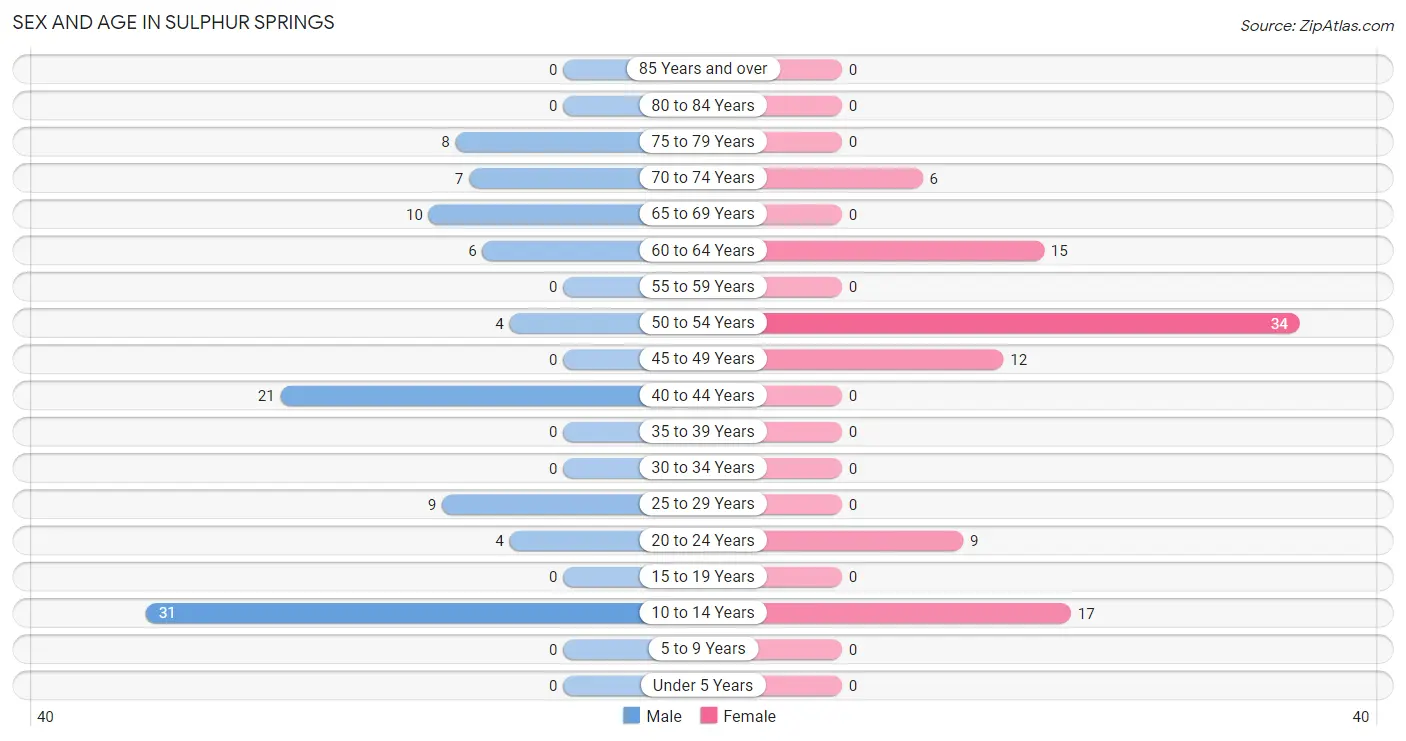
| Age Bracket | Male | Female |
| Under 5 Years | 0 (0.0%) | 0 (0.0%) |
| 5 to 9 Years | 0 (0.0%) | 0 (0.0%) |
| 10 to 14 Years | 31 (31.0%) | 17 (18.3%) |
| 15 to 19 Years | 0 (0.0%) | 0 (0.0%) |
| 20 to 24 Years | 4 (4.0%) | 9 (9.7%) |
| 25 to 29 Years | 9 (9.0%) | 0 (0.0%) |
| 30 to 34 Years | 0 (0.0%) | 0 (0.0%) |
| 35 to 39 Years | 0 (0.0%) | 0 (0.0%) |
| 40 to 44 Years | 21 (21.0%) | 0 (0.0%) |
| 45 to 49 Years | 0 (0.0%) | 12 (12.9%) |
| 50 to 54 Years | 4 (4.0%) | 34 (36.6%) |
| 55 to 59 Years | 0 (0.0%) | 0 (0.0%) |
| 60 to 64 Years | 6 (6.0%) | 15 (16.1%) |
| 65 to 69 Years | 10 (10.0%) | 0 (0.0%) |
| 70 to 74 Years | 7 (7.0%) | 6 (6.5%) |
| 75 to 79 Years | 8 (8.0%) | 0 (0.0%) |
| 80 to 84 Years | 0 (0.0%) | 0 (0.0%) |
| 85 Years and over | 0 (0.0%) | 0 (0.0%) |
| Total | 100 (100.0%) | 93 (100.0%) |
Families and Households in Sulphur Springs
Median Family Size in Sulphur Springs
The median family size in Sulphur Springs is 3.14 persons per family, with single male/father families (12 | 20.3%) accounting for the largest median family size of 3.33 persons per family. On the other hand, single female/mother families (12 | 20.3%) represent the smallest median family size with 2.67 persons per family.
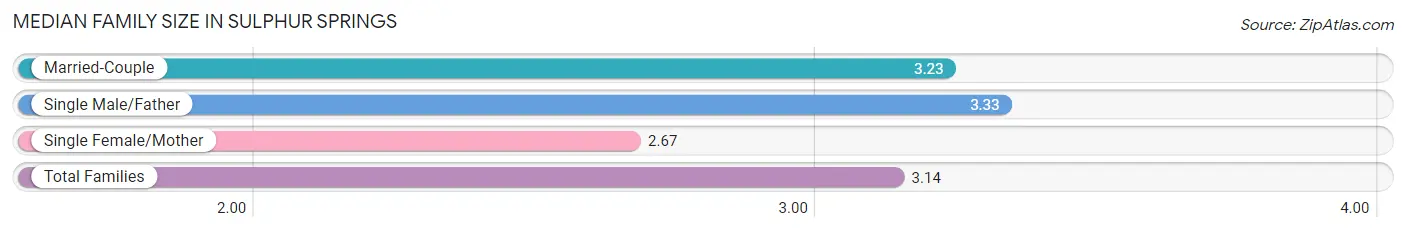
| Family Type | # Families | Family Size |
| Married-Couple | 35 (59.3%) | 3.23 |
| Single Male/Father | 12 (20.3%) | 3.33 |
| Single Female/Mother | 12 (20.3%) | 2.67 |
| Total Families | 59 (100.0%) | 3.14 |
Median Household Size in Sulphur Springs
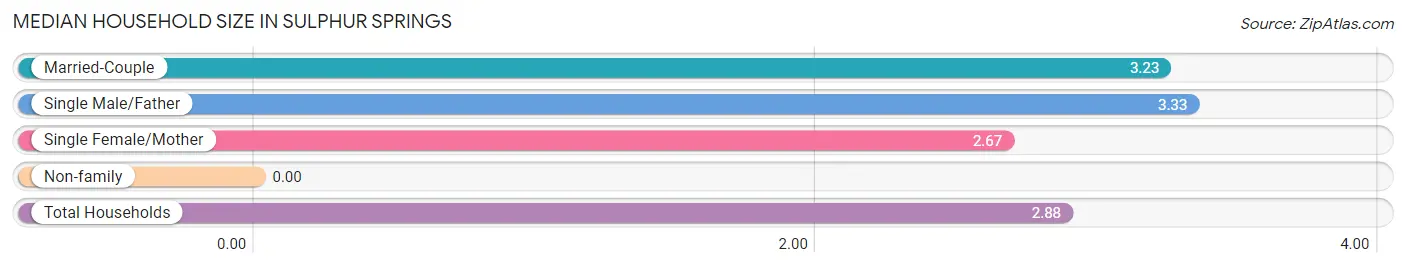
| Household Type | # Households | Household Size |
| Married-Couple | 35 (52.2%) | 3.23 |
| Single Male/Father | 12 (17.9%) | 3.33 |
| Single Female/Mother | 12 (17.9%) | 2.67 |
| Non-family | 8 (11.9%) | - |
| Total Households | 67 (100.0%) | 2.88 |
Household Size by Marriage Status in Sulphur Springs
Out of a total of 67 households in Sulphur Springs, 59 (88.1%) are family households, while 8 (11.9%) are nonfamily households. The most numerous type of family households are 3-person households, comprising 25, and the most common type of nonfamily households are 1-person households, comprising 8.
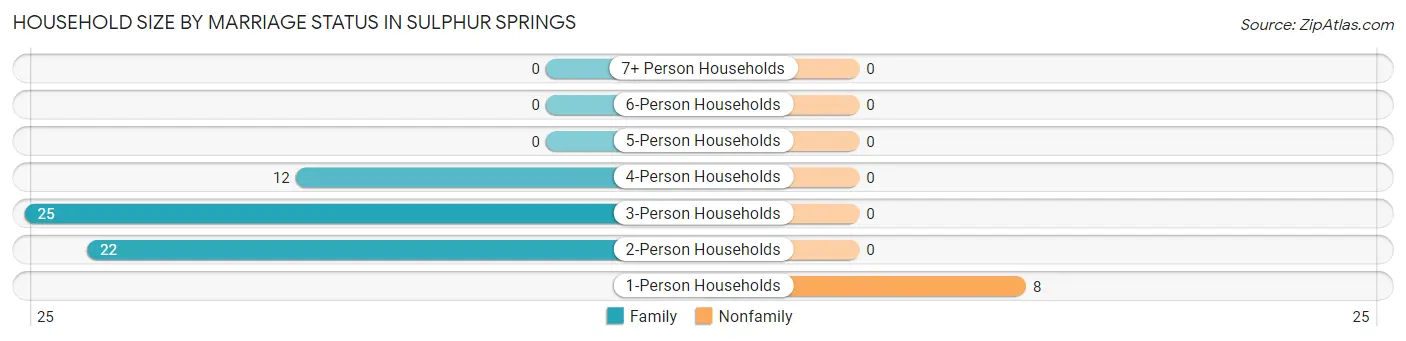
| Household Size | Family Households | Nonfamily Households |
| 1-Person Households | - | 8 (11.9%) |
| 2-Person Households | 22 (32.8%) | 0 (0.0%) |
| 3-Person Households | 25 (37.3%) | 0 (0.0%) |
| 4-Person Households | 12 (17.9%) | 0 (0.0%) |
| 5-Person Households | 0 (0.0%) | 0 (0.0%) |
| 6-Person Households | 0 (0.0%) | 0 (0.0%) |
| 7+ Person Households | 0 (0.0%) | 0 (0.0%) |
| Total | 59 (88.1%) | 8 (11.9%) |
Female Fertility in Sulphur Springs
Fertility by Age in Sulphur Springs
| Age Bracket | Women with Births | Births / 1,000 Women |
| 15 to 19 years | 0 (0.0%) | 0.0 |
| 20 to 34 years | 0 (0.0%) | 0.0 |
| 35 to 50 years | 0 (0.0%) | 0.0 |
| Total | 0 (0.0%) | 0.0 |
Fertility by Age by Marriage Status in Sulphur Springs
| Age Bracket | Married | Unmarried |
| 15 to 19 years | 0 (0.0%) | 0 (0.0%) |
| 20 to 34 years | 0 (0.0%) | 0 (0.0%) |
| 35 to 50 years | 0 (0.0%) | 0 (0.0%) |
| Total | 0 (0.0%) | 0 (0.0%) |
Fertility by Education in Sulphur Springs
| Educational Attainment | Women with Births | Births / 1,000 Women |
| Less than High School | 0 (0.0%) | 0.0 |
| High School Diploma | 0 (0.0%) | 0.0 |
| College or Associate's Degree | 0 (0.0%) | 0.0 |
| Bachelor's Degree | 0 (0.0%) | 0.0 |
| Graduate Degree | 0 (0.0%) | 0.0 |
| Total | 0 (0.0%) | 0.0 |
Fertility by Education by Marriage Status in Sulphur Springs
| Educational Attainment | Married | Unmarried |
| Less than High School | 0 (0.0%) | 0 (0.0%) |
| High School Diploma | 0 (0.0%) | 0 (0.0%) |
| College or Associate's Degree | 0 (0.0%) | 0 (0.0%) |
| Bachelor's Degree | 0 (0.0%) | 0 (0.0%) |
| Graduate Degree | 0 (0.0%) | 0 (0.0%) |
| Total | 0 (0.0%) | 0 (0.0%) |
Employment Characteristics in Sulphur Springs
Employment by Class of Employer in Sulphur Springs
Among the 75 employed individuals in Sulphur Springs, private company employees (46 | 61.3%), self-employed (not incorporated) (12 | 16.0%), and not-for-profit organizations (7 | 9.3%) make up the most common classes of employment.
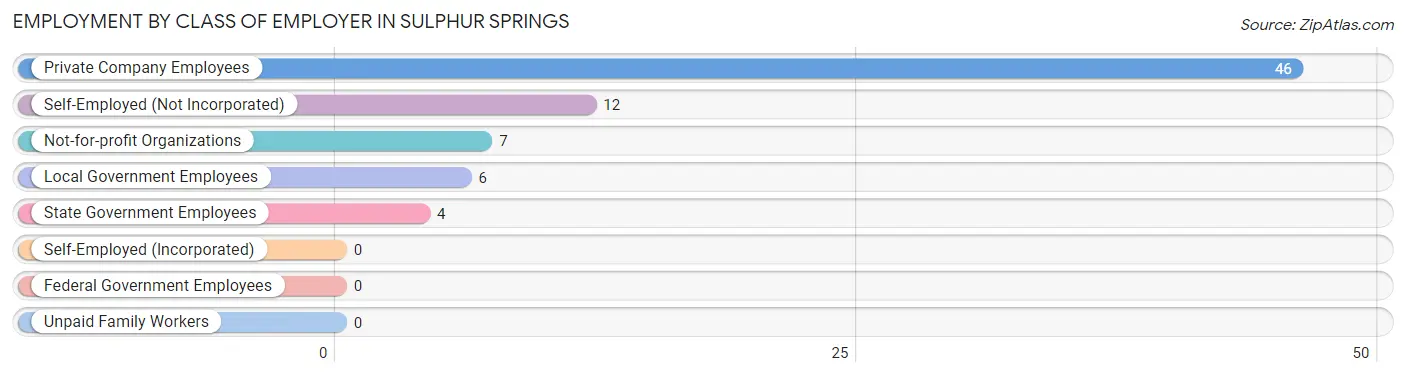
| Employer Class | # Employees | % Employees |
| Private Company Employees | 46 | 61.3% |
| Self-Employed (Incorporated) | 0 | 0.0% |
| Self-Employed (Not Incorporated) | 12 | 16.0% |
| Not-for-profit Organizations | 7 | 9.3% |
| Local Government Employees | 6 | 8.0% |
| State Government Employees | 4 | 5.3% |
| Federal Government Employees | 0 | 0.0% |
| Unpaid Family Workers | 0 | 0.0% |
| Total | 75 | 100.0% |
Employment Status by Age in Sulphur Springs
According to the labor force statistics for Sulphur Springs, out of the total population over 16 years of age (145), 90.3% or 131 individuals are in the labor force, with 33.6% or 44 of them unemployed. The age group with the highest labor force participation rate is 20 to 24 years, with 100.0% or 13 individuals in the labor force. Within the labor force, the 45 to 54 years age range has the highest percentage of unemployed individuals, with 68.0% or 34 of them being unemployed.
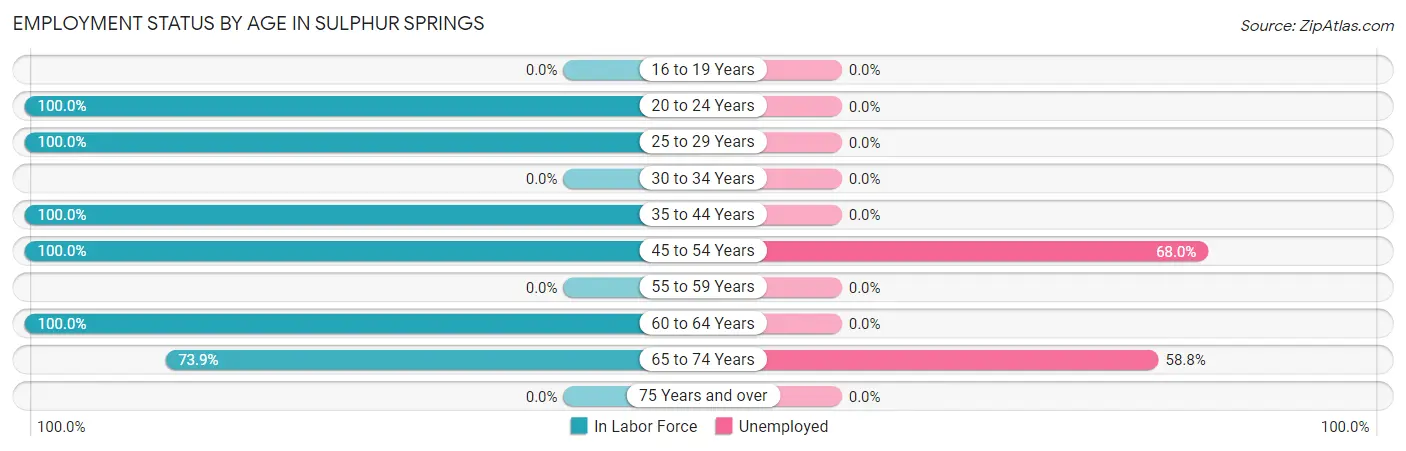
| Age Bracket | In Labor Force | Unemployed |
| 16 to 19 Years | 0 (0.0%) | 0 (0.0%) |
| 20 to 24 Years | 13 (100.0%) | 0 (0.0%) |
| 25 to 29 Years | 9 (100.0%) | 0 (0.0%) |
| 30 to 34 Years | 0 (0.0%) | 0 (0.0%) |
| 35 to 44 Years | 21 (100.0%) | 0 (0.0%) |
| 45 to 54 Years | 50 (100.0%) | 34 (68.0%) |
| 55 to 59 Years | 0 (0.0%) | 0 (0.0%) |
| 60 to 64 Years | 21 (100.0%) | 0 (0.0%) |
| 65 to 74 Years | 17 (73.9%) | 10 (58.8%) |
| 75 Years and over | 0 (0.0%) | 0 (0.0%) |
| Total | 131 (90.3%) | 44 (33.6%) |
Employment Status by Educational Attainment in Sulphur Springs
According to labor force statistics for Sulphur Springs, 100.0% of individuals (101) out of the total population between 25 and 64 years of age (101) are in the labor force, with 33.7% or 34 of them being unemployed. The group with the highest labor force participation rate are those with the educational attainment of less than high school, with 100.0% or 9 individuals in the labor force. Within the labor force, individuals with high school diploma education have the highest percentage of unemployment, with 73.9% or 34 of them being unemployed.
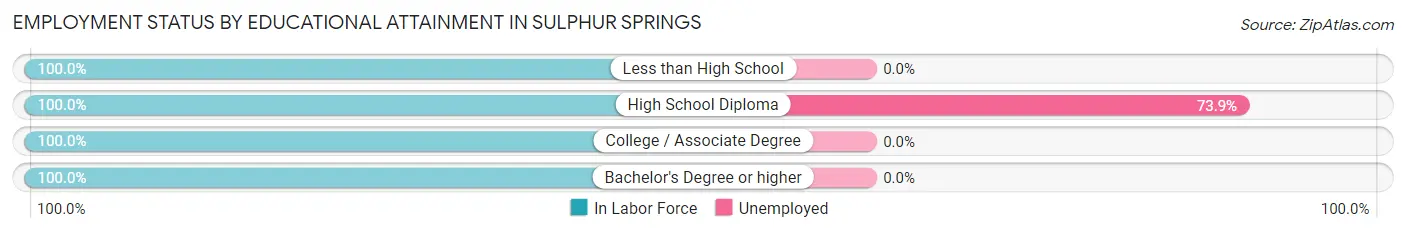
| Educational Attainment | In Labor Force | Unemployed |
| Less than High School | 9 (100.0%) | 0 (0.0%) |
| High School Diploma | 46 (100.0%) | 34 (73.9%) |
| College / Associate Degree | 34 (100.0%) | 0 (0.0%) |
| Bachelor's Degree or higher | 12 (100.0%) | 0 (0.0%) |
| Total | 101 (100.0%) | 34 (33.7%) |
Employment Occupations by Sex in Sulphur Springs
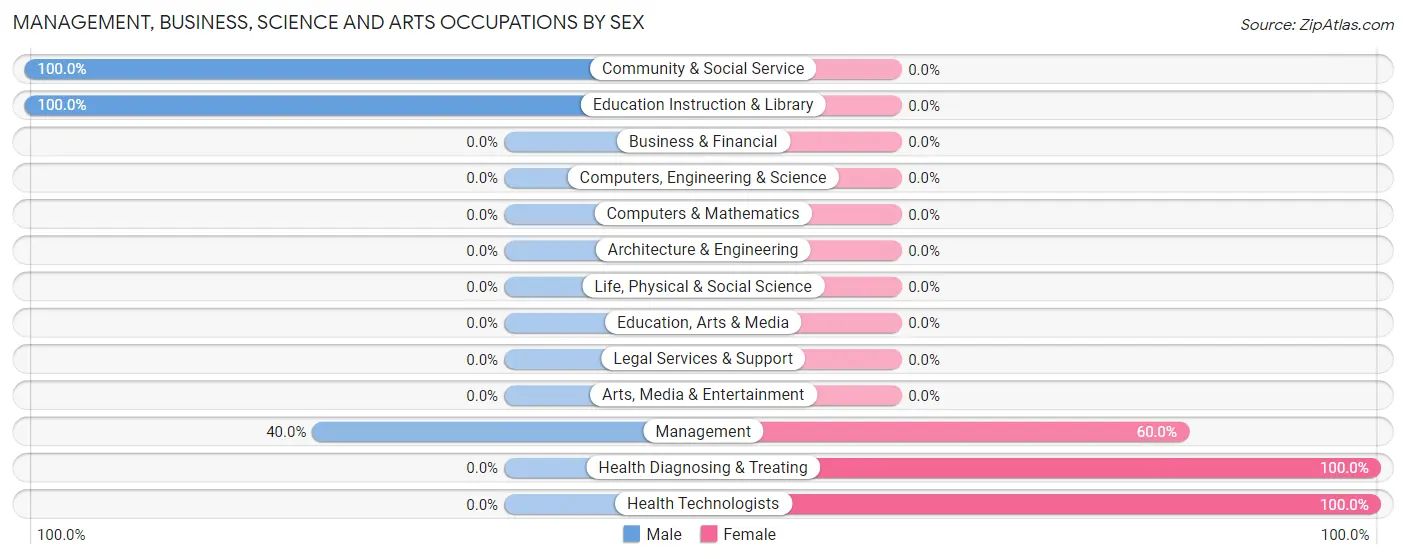
Management, Business, Science and Arts Occupations
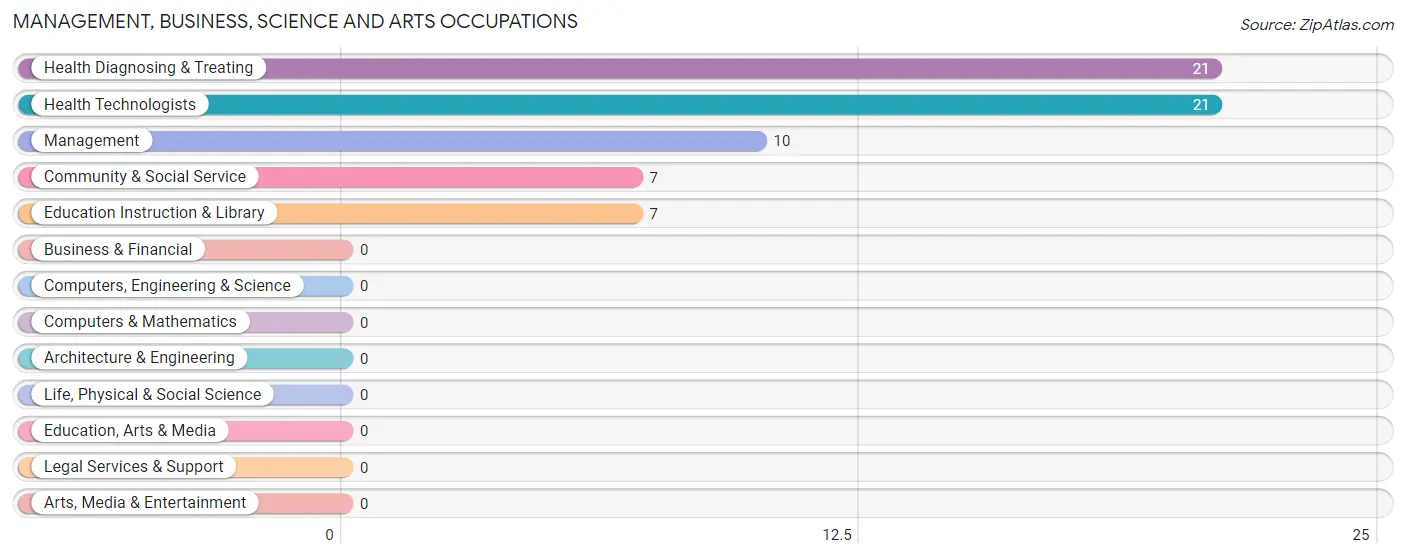
The most common Management, Business, Science and Arts occupations in Sulphur Springs are Health Diagnosing & Treating (21 | 24.1%), Health Technologists (21 | 24.1%), Management (10 | 11.5%), Community & Social Service (7 | 8.1%), and Education Instruction & Library (7 | 8.1%).
Management, Business, Science and Arts Occupations by Sex
Within the Management, Business, Science and Arts occupations in Sulphur Springs, the most male-oriented occupations are Community & Social Service (100.0%), Education Instruction & Library (100.0%), and Management (40.0%), while the most female-oriented occupations are Health Diagnosing & Treating (100.0%), Health Technologists (100.0%), and Management (60.0%).
| Occupation | Male | Female |
| Management | 4 (40.0%) | 6 (60.0%) |
| Business & Financial | 0 (0.0%) | 0 (0.0%) |
| Computers, Engineering & Science | 0 (0.0%) | 0 (0.0%) |
| Computers & Mathematics | 0 (0.0%) | 0 (0.0%) |
| Architecture & Engineering | 0 (0.0%) | 0 (0.0%) |
| Life, Physical & Social Science | 0 (0.0%) | 0 (0.0%) |
| Community & Social Service | 7 (100.0%) | 0 (0.0%) |
| Education, Arts & Media | 0 (0.0%) | 0 (0.0%) |
| Legal Services & Support | 0 (0.0%) | 0 (0.0%) |
| Education Instruction & Library | 7 (100.0%) | 0 (0.0%) |
| Arts, Media & Entertainment | 0 (0.0%) | 0 (0.0%) |
| Health Diagnosing & Treating | 0 (0.0%) | 21 (100.0%) |
| Health Technologists | 0 (0.0%) | 21 (100.0%) |
| Total (Category) | 11 (28.9%) | 27 (71.1%) |
| Total (Overall) | 51 (58.6%) | 36 (41.4%) |
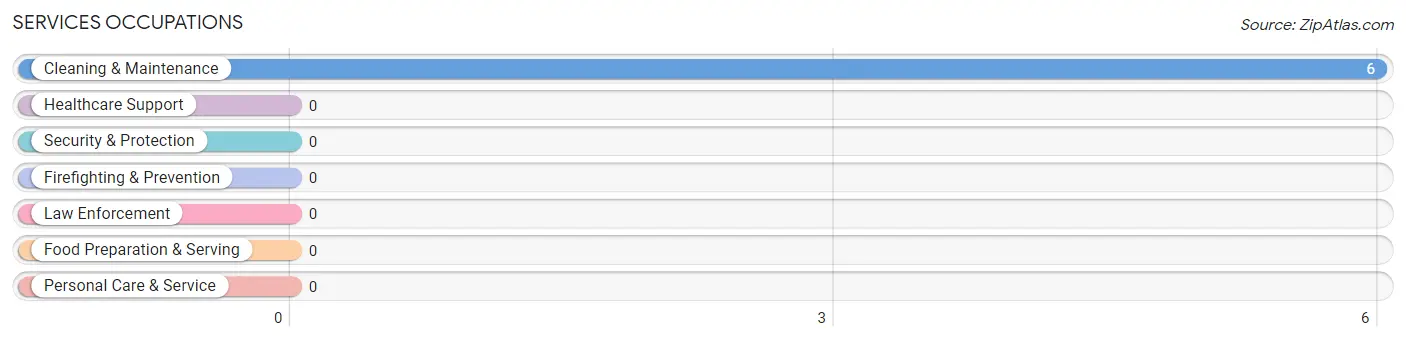
Services Occupations
The most common Services occupations in Sulphur Springs are , and Cleaning & Maintenance (6 | 6.9%).
Services Occupations by Sex
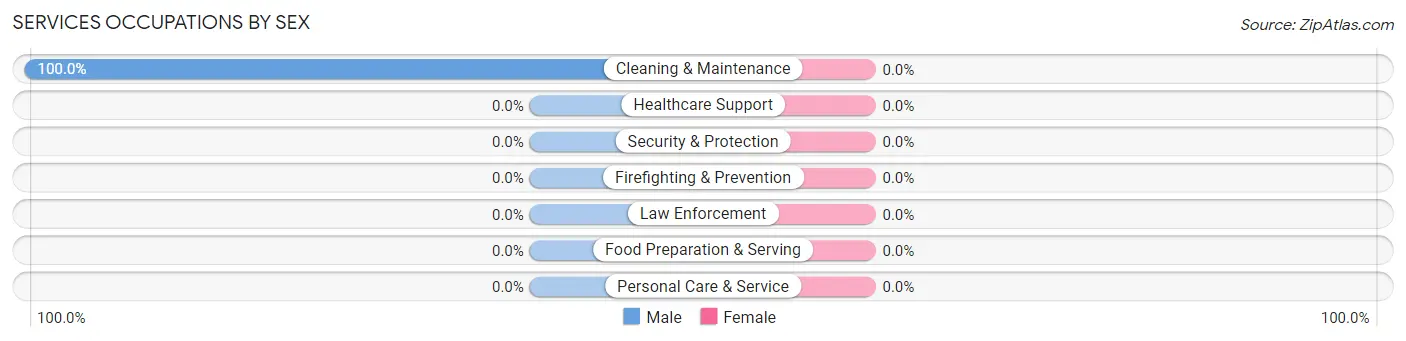
| Occupation | Male | Female |
| Healthcare Support | 0 (0.0%) | 0 (0.0%) |
| Security & Protection | 0 (0.0%) | 0 (0.0%) |
| Firefighting & Prevention | 0 (0.0%) | 0 (0.0%) |
| Law Enforcement | 0 (0.0%) | 0 (0.0%) |
| Food Preparation & Serving | 0 (0.0%) | 0 (0.0%) |
| Cleaning & Maintenance | 6 (100.0%) | 0 (0.0%) |
| Personal Care & Service | 0 (0.0%) | 0 (0.0%) |
| Total (Category) | 6 (100.0%) | 0 (0.0%) |
| Total (Overall) | 51 (58.6%) | 36 (41.4%) |
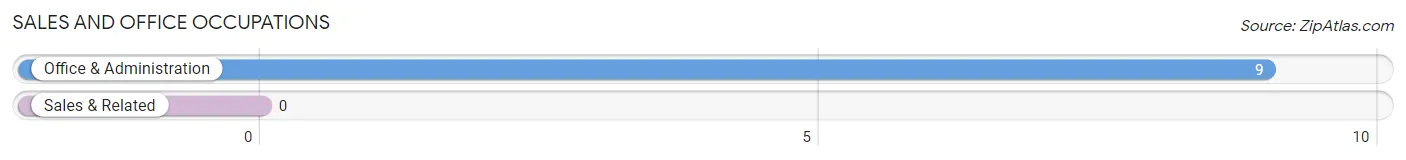
Sales and Office Occupations
The most common Sales and Office occupations in Sulphur Springs are , and Office & Administration (9 | 10.3%).
Sales and Office Occupations by Sex
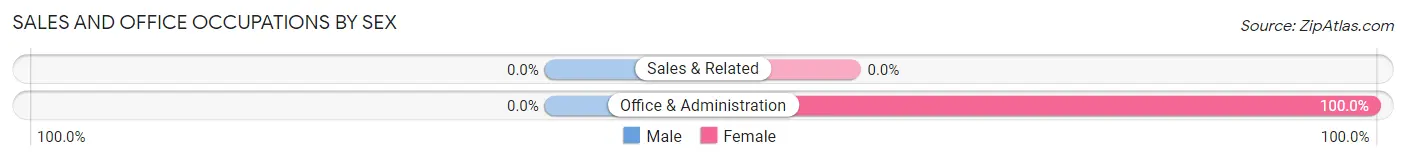
| Occupation | Male | Female |
| Sales & Related | 0 (0.0%) | 0 (0.0%) |
| Office & Administration | 0 (0.0%) | 9 (100.0%) |
| Total (Category) | 0 (0.0%) | 9 (100.0%) |
| Total (Overall) | 51 (58.6%) | 36 (41.4%) |
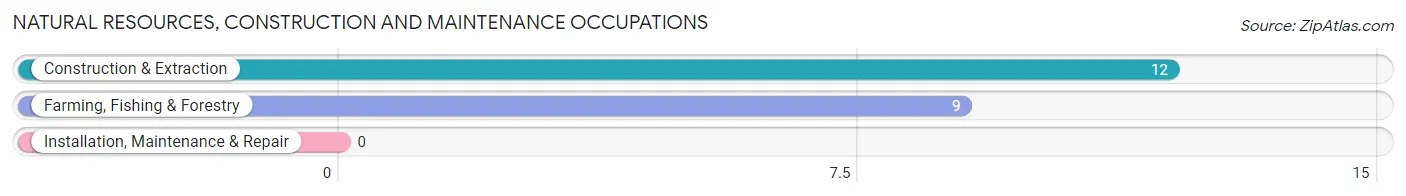
Natural Resources, Construction and Maintenance Occupations
The most common Natural Resources, Construction and Maintenance occupations in Sulphur Springs are Construction & Extraction (12 | 13.8%), and Farming, Fishing & Forestry (9 | 10.3%).
Natural Resources, Construction and Maintenance Occupations by Sex
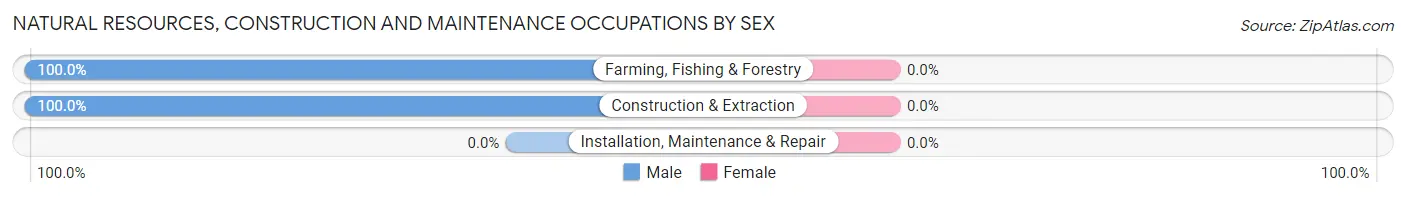
| Occupation | Male | Female |
| Farming, Fishing & Forestry | 9 (100.0%) | 0 (0.0%) |
| Construction & Extraction | 12 (100.0%) | 0 (0.0%) |
| Installation, Maintenance & Repair | 0 (0.0%) | 0 (0.0%) |
| Total (Category) | 21 (100.0%) | 0 (0.0%) |
| Total (Overall) | 51 (58.6%) | 36 (41.4%) |
Production, Transportation and Moving Occupations
The most common Production, Transportation and Moving occupations in Sulphur Springs are Transportation (9 | 10.3%), and Production (4 | 4.6%).
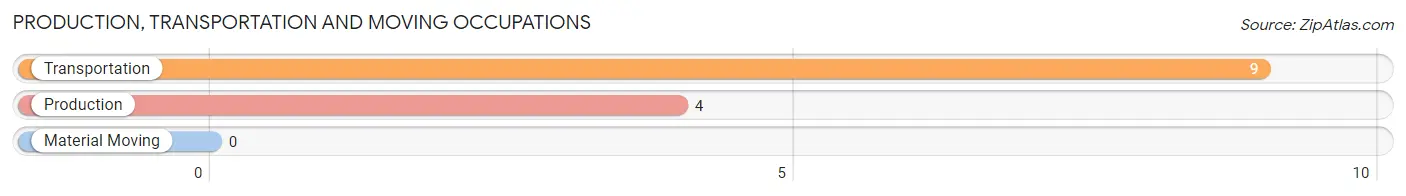
Production, Transportation and Moving Occupations by Sex
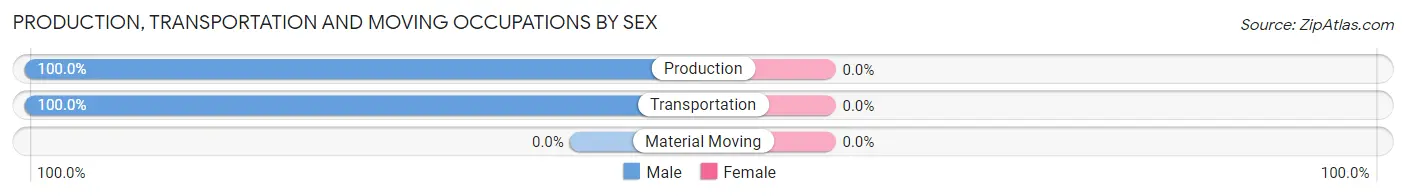
| Occupation | Male | Female |
| Production | 4 (100.0%) | 0 (0.0%) |
| Transportation | 9 (100.0%) | 0 (0.0%) |
| Material Moving | 0 (0.0%) | 0 (0.0%) |
| Total (Category) | 13 (100.0%) | 0 (0.0%) |
| Total (Overall) | 51 (58.6%) | 36 (41.4%) |
Employment Industries by Sex in Sulphur Springs
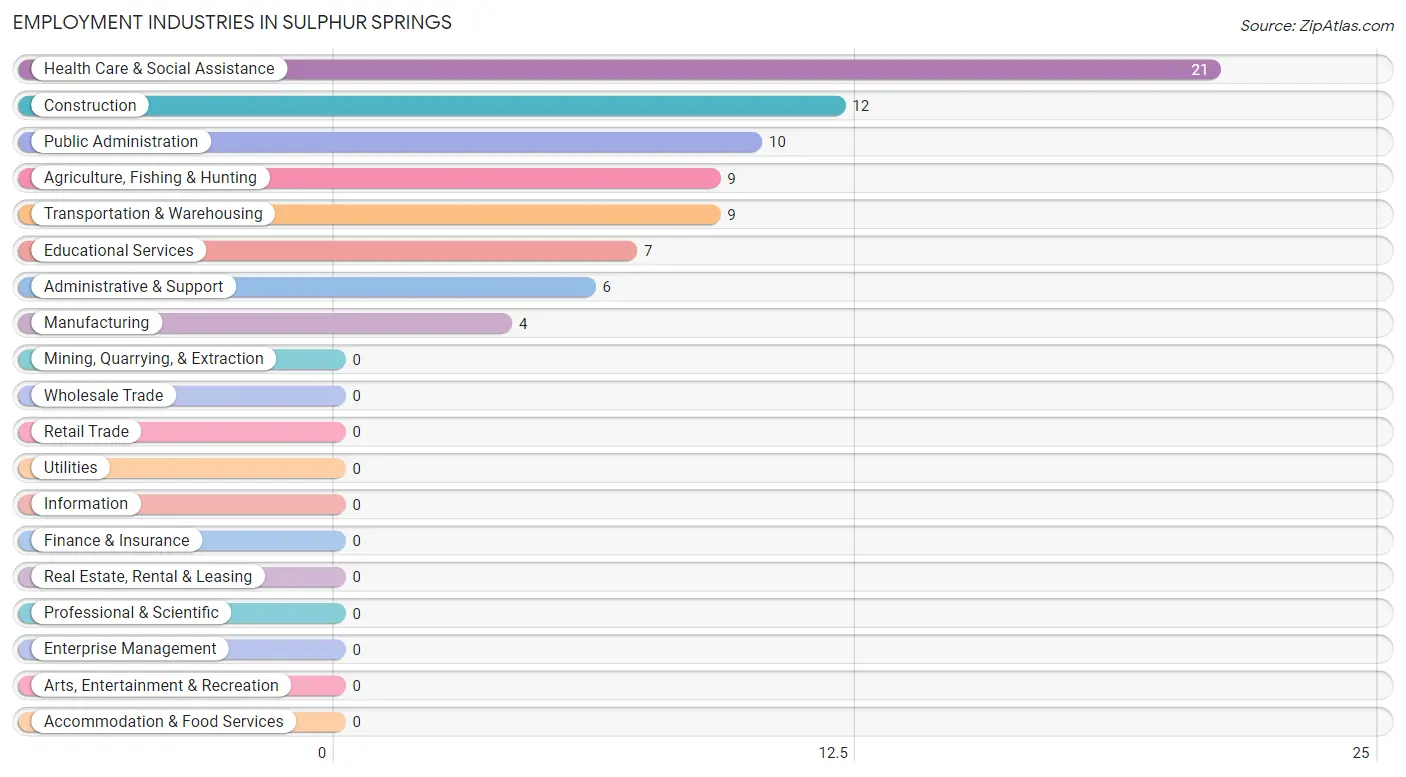
Employment Industries in Sulphur Springs
The major employment industries in Sulphur Springs include Health Care & Social Assistance (21 | 24.1%), Construction (12 | 13.8%), Public Administration (10 | 11.5%), Agriculture, Fishing & Hunting (9 | 10.3%), and Transportation & Warehousing (9 | 10.3%).
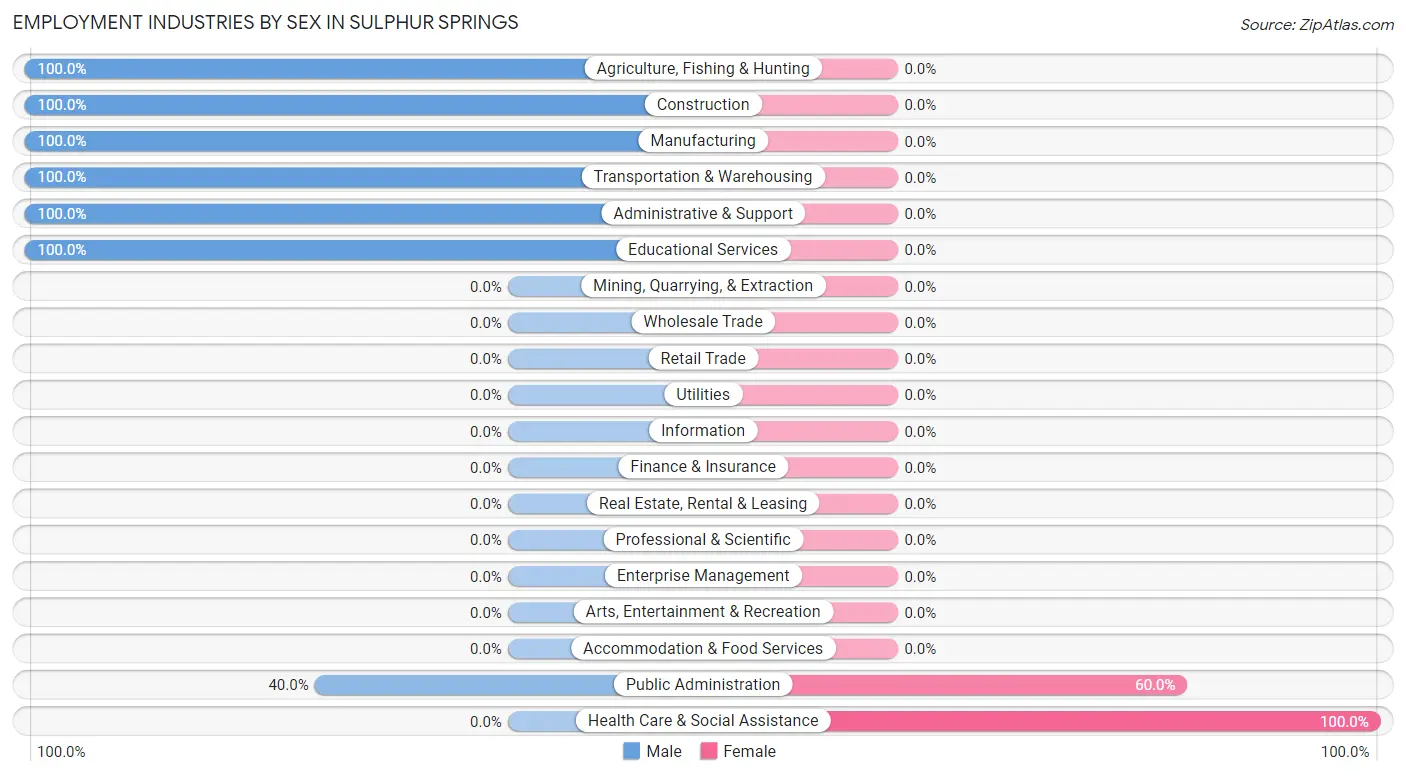
Employment Industries by Sex in Sulphur Springs
The Sulphur Springs industries that see more men than women are Agriculture, Fishing & Hunting (100.0%), Construction (100.0%), and Manufacturing (100.0%), whereas the industries that tend to have a higher number of women are Health Care & Social Assistance (100.0%), and Public Administration (60.0%).
| Industry | Male | Female |
| Agriculture, Fishing & Hunting | 9 (100.0%) | 0 (0.0%) |
| Mining, Quarrying, & Extraction | 0 (0.0%) | 0 (0.0%) |
| Construction | 12 (100.0%) | 0 (0.0%) |
| Manufacturing | 4 (100.0%) | 0 (0.0%) |
| Wholesale Trade | 0 (0.0%) | 0 (0.0%) |
| Retail Trade | 0 (0.0%) | 0 (0.0%) |
| Transportation & Warehousing | 9 (100.0%) | 0 (0.0%) |
| Utilities | 0 (0.0%) | 0 (0.0%) |
| Information | 0 (0.0%) | 0 (0.0%) |
| Finance & Insurance | 0 (0.0%) | 0 (0.0%) |
| Real Estate, Rental & Leasing | 0 (0.0%) | 0 (0.0%) |
| Professional & Scientific | 0 (0.0%) | 0 (0.0%) |
| Enterprise Management | 0 (0.0%) | 0 (0.0%) |
| Administrative & Support | 6 (100.0%) | 0 (0.0%) |
| Educational Services | 7 (100.0%) | 0 (0.0%) |
| Health Care & Social Assistance | 0 (0.0%) | 21 (100.0%) |
| Arts, Entertainment & Recreation | 0 (0.0%) | 0 (0.0%) |
| Accommodation & Food Services | 0 (0.0%) | 0 (0.0%) |
| Public Administration | 4 (40.0%) | 6 (60.0%) |
| Total | 51 (58.6%) | 36 (41.4%) |
Education in Sulphur Springs
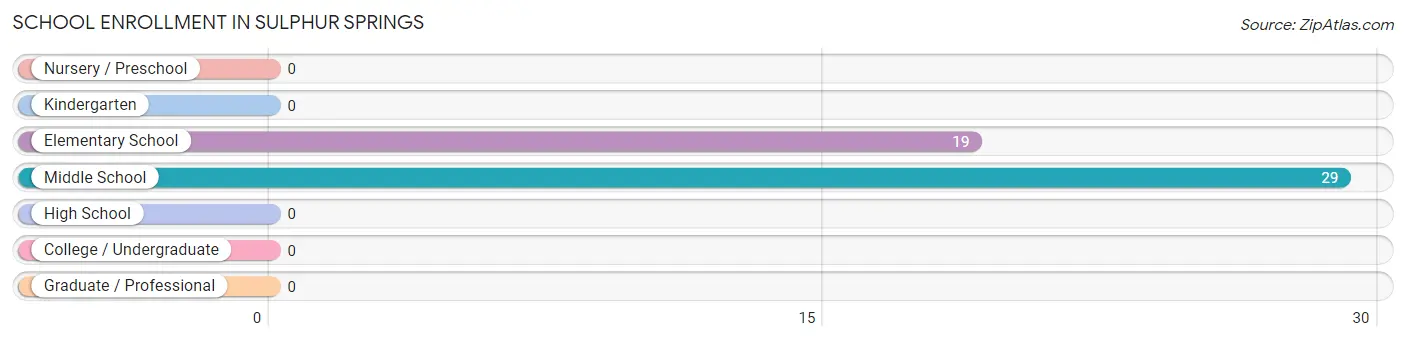
School Enrollment in Sulphur Springs
The most common levels of schooling among the 48 students in Sulphur Springs are middle school (29 | 60.4%), and elementary school (19 | 39.6%).
| School Level | # Students | % Students |
| Nursery / Preschool | 0 | 0.0% |
| Kindergarten | 0 | 0.0% |
| Elementary School | 19 | 39.6% |
| Middle School | 29 | 60.4% |
| High School | 0 | 0.0% |
| College / Undergraduate | 0 | 0.0% |
| Graduate / Professional | 0 | 0.0% |
| Total | 48 | 100.0% |
School Enrollment by Age by Funding Source in Sulphur Springs
Out of a total of 48 students who are enrolled in schools in Sulphur Springs, 28 (58.3%) attend a private institution, while the remaining 20 (41.7%) are enrolled in public schools. The age group of 10 to 14 year olds has the highest likelihood of being enrolled in private schools, with 28 (58.3% in the age bracket) enrolled. Conversely, the age group of 10 to 14 year olds has the lowest likelihood of being enrolled in a private school, with 20 (41.7% in the age bracket) attending a public institution.
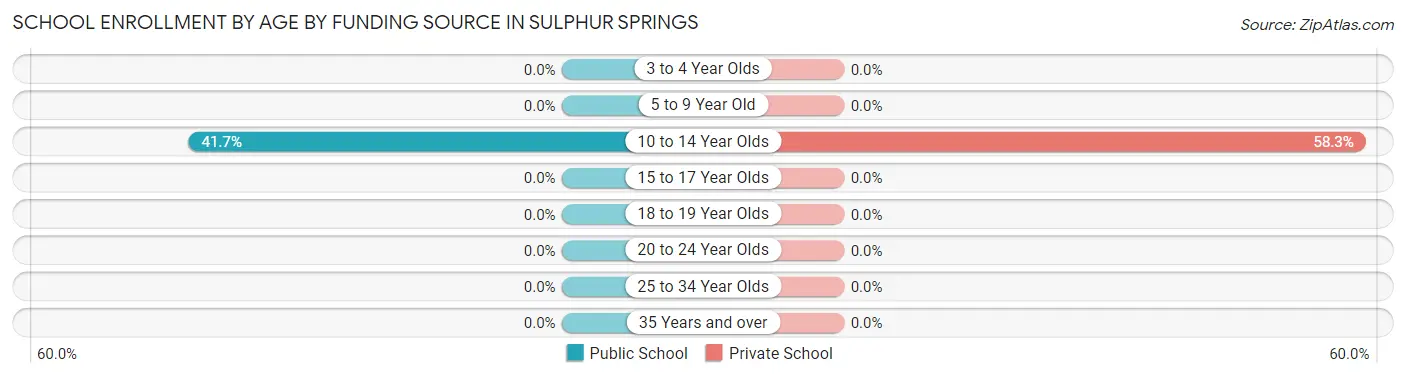
| Age Bracket | Public School | Private School |
| 3 to 4 Year Olds | 0 (0.0%) | 0 (0.0%) |
| 5 to 9 Year Old | 0 (0.0%) | 0 (0.0%) |
| 10 to 14 Year Olds | 20 (41.7%) | 28 (58.3%) |
| 15 to 17 Year Olds | 0 (0.0%) | 0 (0.0%) |
| 18 to 19 Year Olds | 0 (0.0%) | 0 (0.0%) |
| 20 to 24 Year Olds | 0 (0.0%) | 0 (0.0%) |
| 25 to 34 Year Olds | 0 (0.0%) | 0 (0.0%) |
| 35 Years and over | 0 (0.0%) | 0 (0.0%) |
| Total | 20 (41.7%) | 28 (58.3%) |
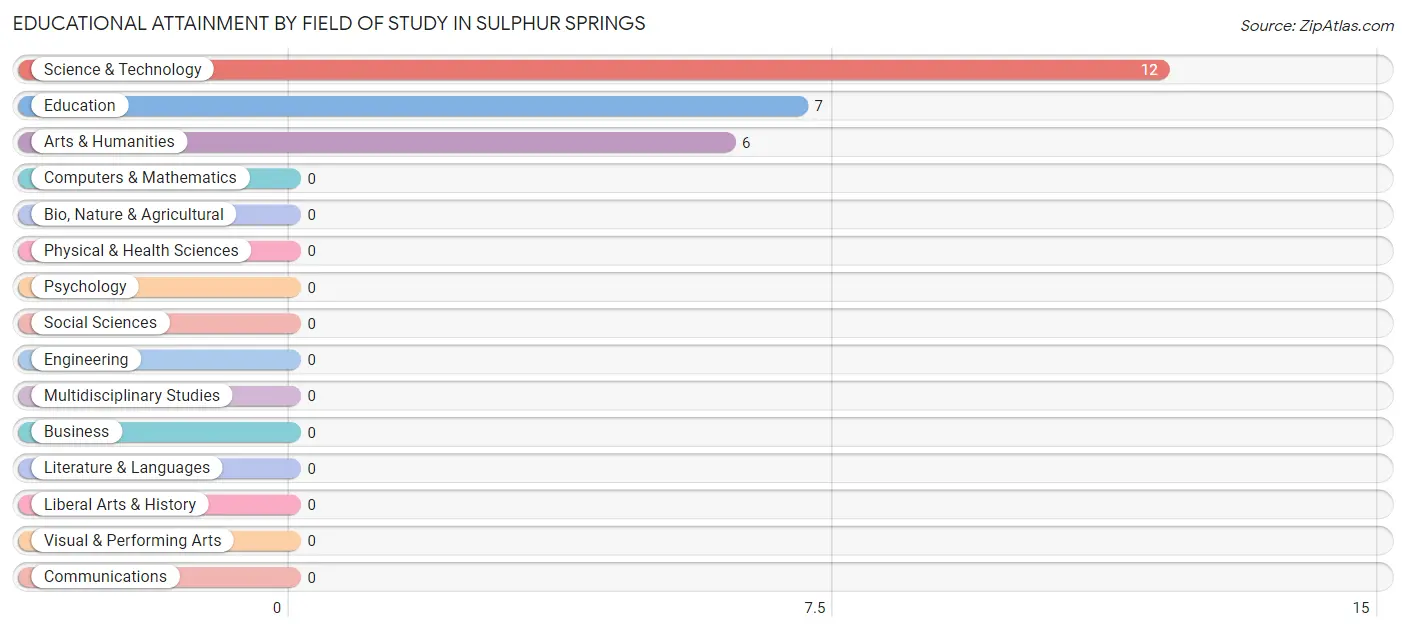
Educational Attainment by Field of Study in Sulphur Springs
Science & technology (12 | 48.0%), education (7 | 28.0%), and arts & humanities (6 | 24.0%) are the most common fields of study among 25 individuals in Sulphur Springs who have obtained a bachelor's degree or higher.
| Field of Study | # Graduates | % Graduates |
| Computers & Mathematics | 0 | 0.0% |
| Bio, Nature & Agricultural | 0 | 0.0% |
| Physical & Health Sciences | 0 | 0.0% |
| Psychology | 0 | 0.0% |
| Social Sciences | 0 | 0.0% |
| Engineering | 0 | 0.0% |
| Multidisciplinary Studies | 0 | 0.0% |
| Science & Technology | 12 | 48.0% |
| Business | 0 | 0.0% |
| Education | 7 | 28.0% |
| Literature & Languages | 0 | 0.0% |
| Liberal Arts & History | 0 | 0.0% |
| Visual & Performing Arts | 0 | 0.0% |
| Communications | 0 | 0.0% |
| Arts & Humanities | 6 | 24.0% |
| Total | 25 | 100.0% |
Transportation & Commute in Sulphur Springs
Vehicle Availability by Sex in Sulphur Springs
The most prevalent vehicle ownership categories in Sulphur Springs are males with 2 vehicles (22, accounting for 56.4%) and females with 2 vehicles (15, making up 61.1%).
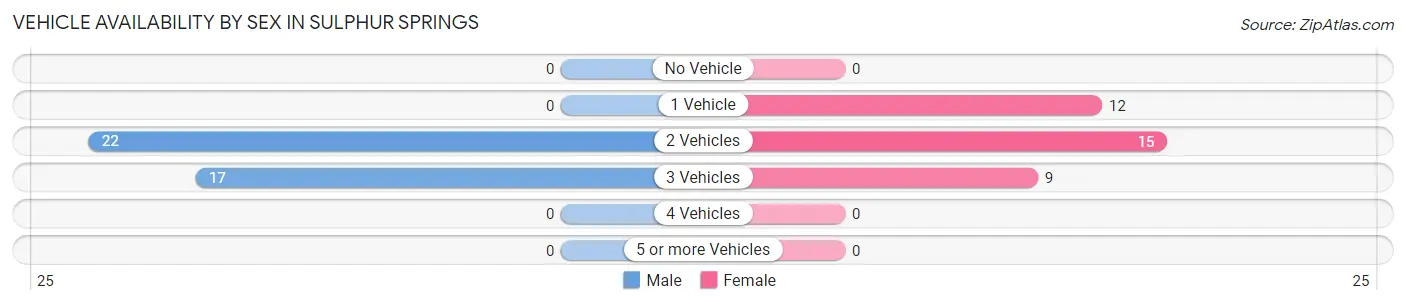
| Vehicles Available | Male | Female |
| No Vehicle | 0 (0.0%) | 0 (0.0%) |
| 1 Vehicle | 0 (0.0%) | 12 (33.3%) |
| 2 Vehicles | 22 (56.4%) | 15 (41.7%) |
| 3 Vehicles | 17 (43.6%) | 9 (25.0%) |
| 4 Vehicles | 0 (0.0%) | 0 (0.0%) |
| 5 or more Vehicles | 0 (0.0%) | 0 (0.0%) |
| Total | 39 (100.0%) | 36 (100.0%) |
Commute Time in Sulphur Springs
The most frequently occuring commute durations in Sulphur Springs are 30 to 34 minutes (16 commuters, 25.4%), 15 to 19 minutes (15 commuters, 23.8%), and 5 to 9 minutes (9 commuters, 14.3%).
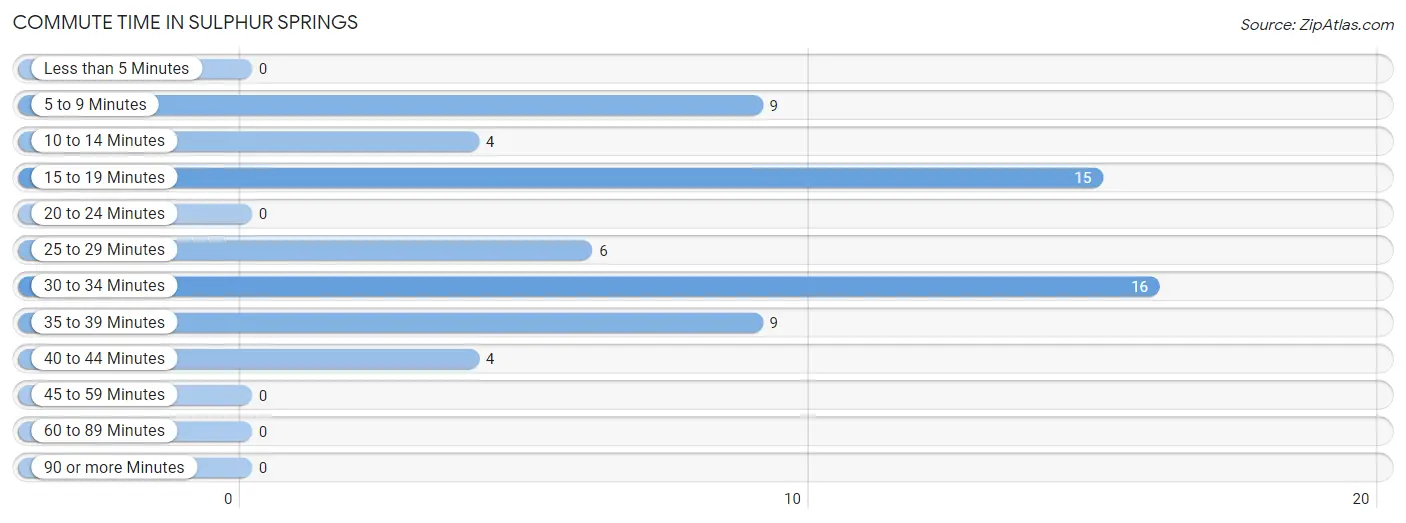
| Commute Time | # Commuters | % Commuters |
| Less than 5 Minutes | 0 | 0.0% |
| 5 to 9 Minutes | 9 | 14.3% |
| 10 to 14 Minutes | 4 | 6.4% |
| 15 to 19 Minutes | 15 | 23.8% |
| 20 to 24 Minutes | 0 | 0.0% |
| 25 to 29 Minutes | 6 | 9.5% |
| 30 to 34 Minutes | 16 | 25.4% |
| 35 to 39 Minutes | 9 | 14.3% |
| 40 to 44 Minutes | 4 | 6.4% |
| 45 to 59 Minutes | 0 | 0.0% |
| 60 to 89 Minutes | 0 | 0.0% |
| 90 or more Minutes | 0 | 0.0% |
Commute Time by Sex in Sulphur Springs
The most common commute times in Sulphur Springs are 30 to 34 minutes (16 commuters, 41.0%) for males and 15 to 19 minutes (15 commuters, 62.5%) for females.
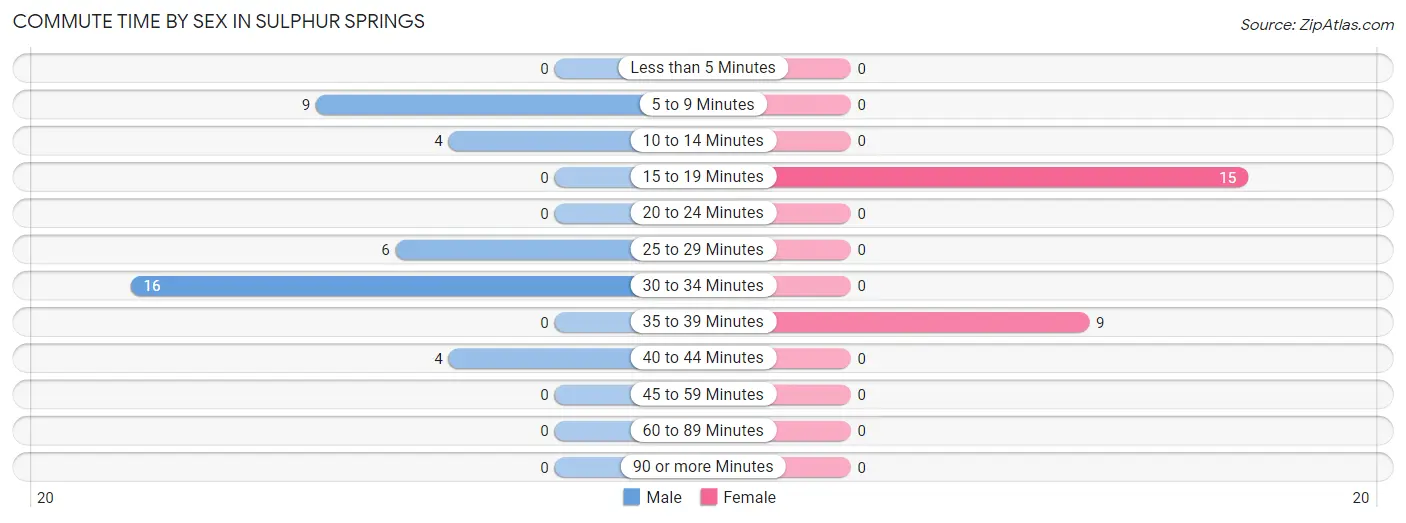
| Commute Time | Male | Female |
| Less than 5 Minutes | 0 (0.0%) | 0 (0.0%) |
| 5 to 9 Minutes | 9 (23.1%) | 0 (0.0%) |
| 10 to 14 Minutes | 4 (10.3%) | 0 (0.0%) |
| 15 to 19 Minutes | 0 (0.0%) | 15 (62.5%) |
| 20 to 24 Minutes | 0 (0.0%) | 0 (0.0%) |
| 25 to 29 Minutes | 6 (15.4%) | 0 (0.0%) |
| 30 to 34 Minutes | 16 (41.0%) | 0 (0.0%) |
| 35 to 39 Minutes | 0 (0.0%) | 9 (37.5%) |
| 40 to 44 Minutes | 4 (10.3%) | 0 (0.0%) |
| 45 to 59 Minutes | 0 (0.0%) | 0 (0.0%) |
| 60 to 89 Minutes | 0 (0.0%) | 0 (0.0%) |
| 90 or more Minutes | 0 (0.0%) | 0 (0.0%) |
Time of Departure to Work by Sex in Sulphur Springs
The most frequent times of departure to work in Sulphur Springs are 7:00 AM to 7:29 AM (20, 51.3%) for males and 6:00 AM to 6:29 AM (9, 37.5%) for females.
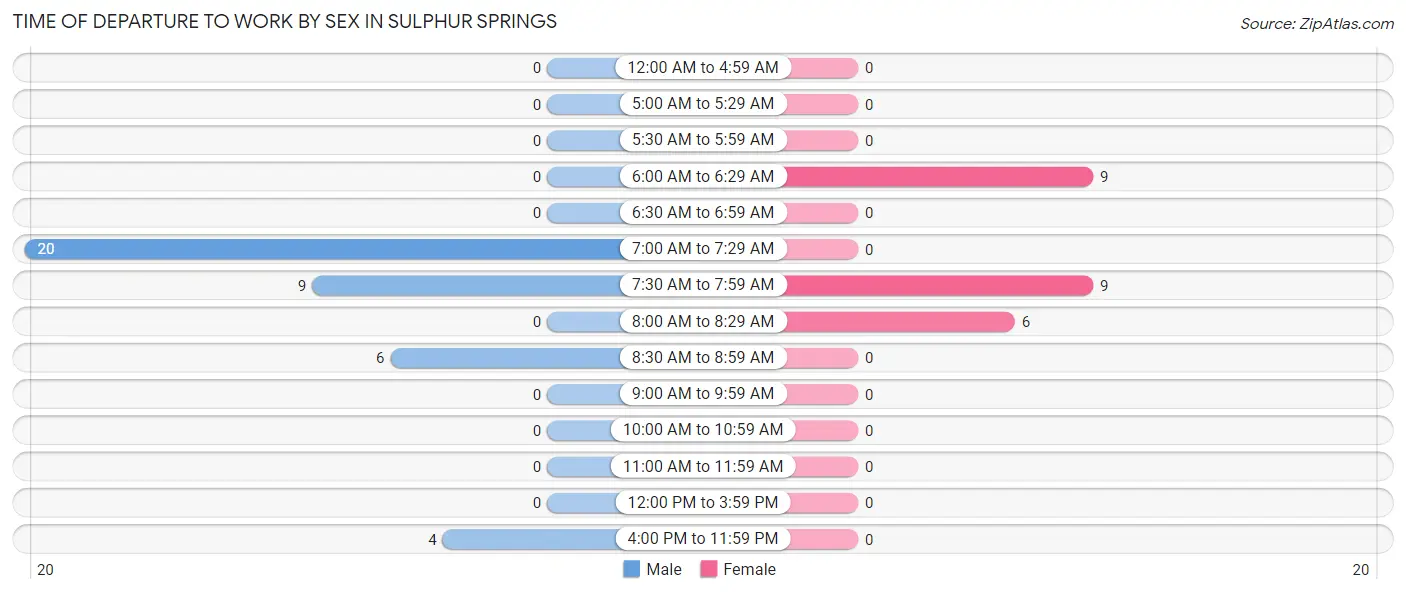
| Time of Departure | Male | Female |
| 12:00 AM to 4:59 AM | 0 (0.0%) | 0 (0.0%) |
| 5:00 AM to 5:29 AM | 0 (0.0%) | 0 (0.0%) |
| 5:30 AM to 5:59 AM | 0 (0.0%) | 0 (0.0%) |
| 6:00 AM to 6:29 AM | 0 (0.0%) | 9 (37.5%) |
| 6:30 AM to 6:59 AM | 0 (0.0%) | 0 (0.0%) |
| 7:00 AM to 7:29 AM | 20 (51.3%) | 0 (0.0%) |
| 7:30 AM to 7:59 AM | 9 (23.1%) | 9 (37.5%) |
| 8:00 AM to 8:29 AM | 0 (0.0%) | 6 (25.0%) |
| 8:30 AM to 8:59 AM | 6 (15.4%) | 0 (0.0%) |
| 9:00 AM to 9:59 AM | 0 (0.0%) | 0 (0.0%) |
| 10:00 AM to 10:59 AM | 0 (0.0%) | 0 (0.0%) |
| 11:00 AM to 11:59 AM | 0 (0.0%) | 0 (0.0%) |
| 12:00 PM to 3:59 PM | 0 (0.0%) | 0 (0.0%) |
| 4:00 PM to 11:59 PM | 4 (10.3%) | 0 (0.0%) |
| Total | 39 (100.0%) | 24 (100.0%) |
Housing Occupancy in Sulphur Springs
Occupancy by Ownership in Sulphur Springs
Of the total 67 dwellings in Sulphur Springs, owner-occupied units account for 58 (86.6%), while renter-occupied units make up 9 (13.4%).
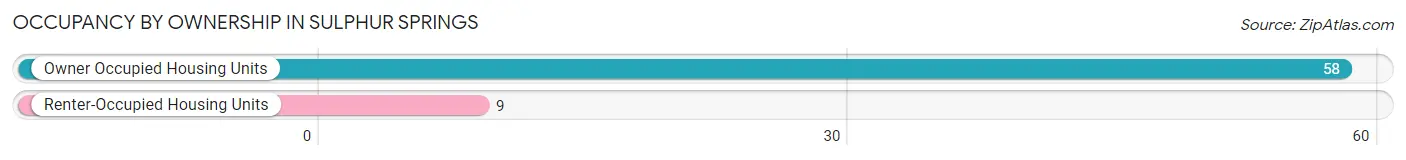
| Occupancy | # Housing Units | % Housing Units |
| Owner Occupied Housing Units | 58 | 86.6% |
| Renter-Occupied Housing Units | 9 | 13.4% |
| Total Occupied Housing Units | 67 | 100.0% |
Occupancy by Household Size in Sulphur Springs
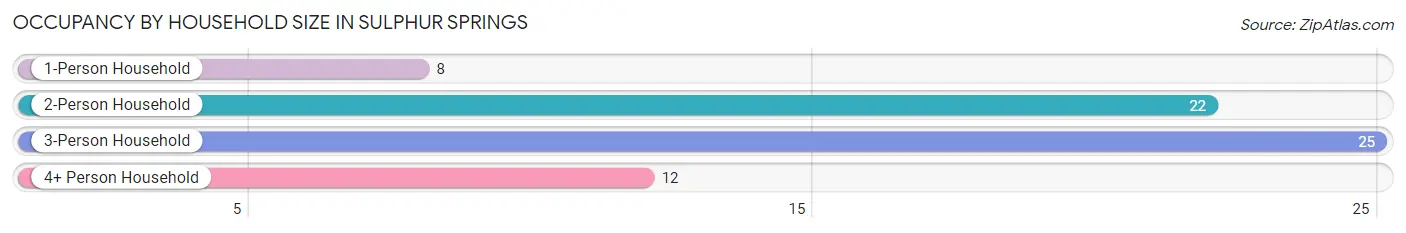
| Household Size | # Housing Units | % Housing Units |
| 1-Person Household | 8 | 11.9% |
| 2-Person Household | 22 | 32.8% |
| 3-Person Household | 25 | 37.3% |
| 4+ Person Household | 12 | 17.9% |
| Total Housing Units | 67 | 100.0% |
Occupancy by Ownership by Household Size in Sulphur Springs
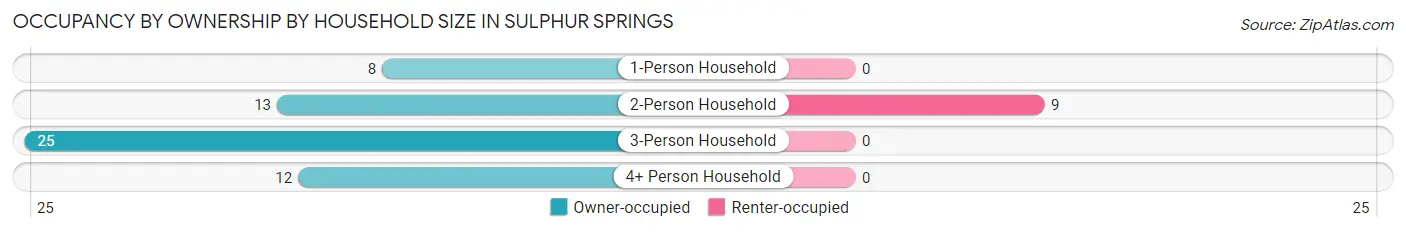
| Household Size | Owner-occupied | Renter-occupied |
| 1-Person Household | 8 (100.0%) | 0 (0.0%) |
| 2-Person Household | 13 (59.1%) | 9 (40.9%) |
| 3-Person Household | 25 (100.0%) | 0 (0.0%) |
| 4+ Person Household | 12 (100.0%) | 0 (0.0%) |
| Total Housing Units | 58 (86.6%) | 9 (13.4%) |
Occupancy by Educational Attainment in Sulphur Springs
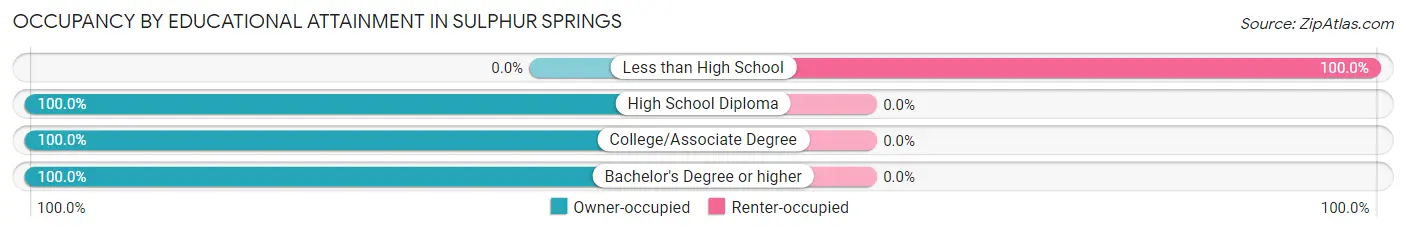
| Household Size | Owner-occupied | Renter-occupied |
| Less than High School | 0 (0.0%) | 9 (100.0%) |
| High School Diploma | 20 (100.0%) | 0 (0.0%) |
| College/Associate Degree | 19 (100.0%) | 0 (0.0%) |
| Bachelor's Degree or higher | 19 (100.0%) | 0 (0.0%) |
Occupancy by Age of Householder in Sulphur Springs
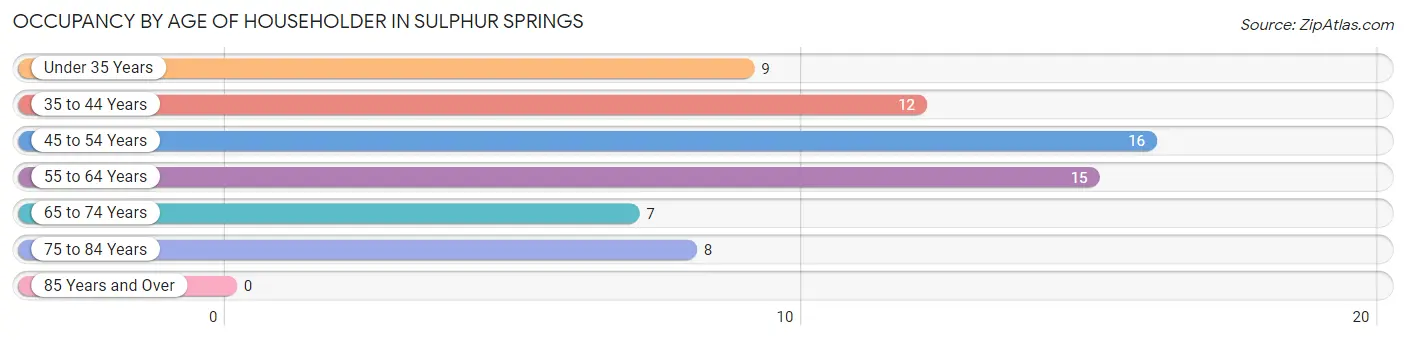
| Age Bracket | # Households | % Households |
| Under 35 Years | 9 | 13.4% |
| 35 to 44 Years | 12 | 17.9% |
| 45 to 54 Years | 16 | 23.9% |
| 55 to 64 Years | 15 | 22.4% |
| 65 to 74 Years | 7 | 10.4% |
| 75 to 84 Years | 8 | 11.9% |
| 85 Years and Over | 0 | 0.0% |
| Total | 67 | 100.0% |
Housing Finances in Sulphur Springs
Median Income by Occupancy in Sulphur Springs
| Occupancy Type | # Households | Median Income |
| Owner-Occupied | 58 (86.6%) | $0 |
| Renter-Occupied | 9 (13.4%) | $0 |
| Average | 67 (100.0%) | $0 |
Occupancy by Householder Income Bracket in Sulphur Springs
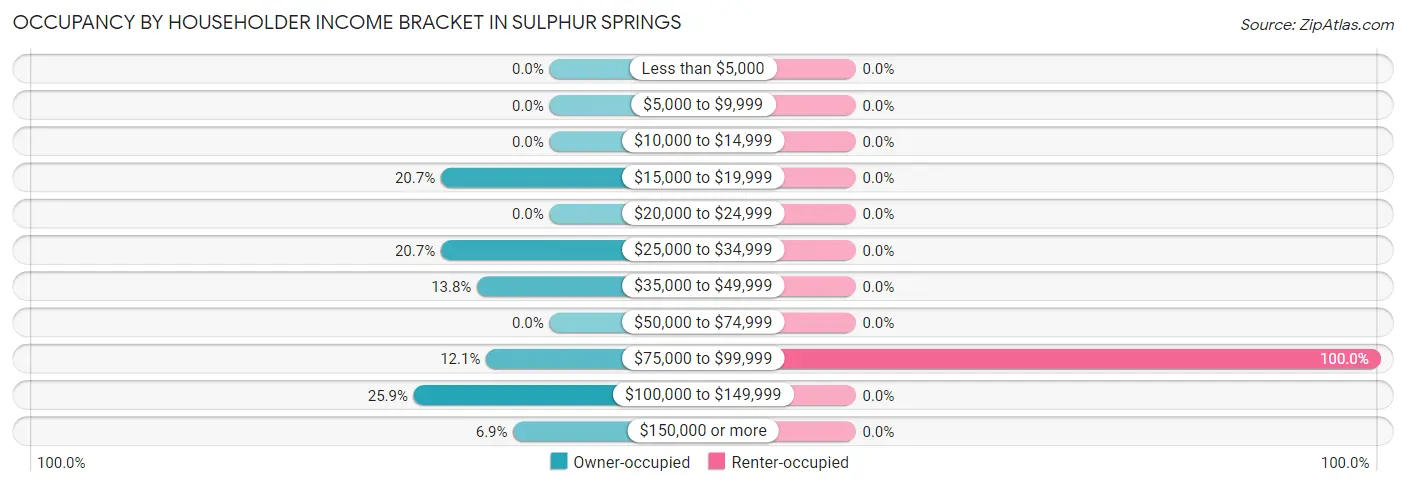
| Income Bracket | Owner-occupied | Renter-occupied |
| Less than $5,000 | 0 (0.0%) | 0 (0.0%) |
| $5,000 to $9,999 | 0 (0.0%) | 0 (0.0%) |
| $10,000 to $14,999 | 0 (0.0%) | 0 (0.0%) |
| $15,000 to $19,999 | 12 (20.7%) | 0 (0.0%) |
| $20,000 to $24,999 | 0 (0.0%) | 0 (0.0%) |
| $25,000 to $34,999 | 12 (20.7%) | 0 (0.0%) |
| $35,000 to $49,999 | 8 (13.8%) | 0 (0.0%) |
| $50,000 to $74,999 | 0 (0.0%) | 0 (0.0%) |
| $75,000 to $99,999 | 7 (12.1%) | 9 (100.0%) |
| $100,000 to $149,999 | 15 (25.9%) | 0 (0.0%) |
| $150,000 or more | 4 (6.9%) | 0 (0.0%) |
| Total | 58 (100.0%) | 9 (100.0%) |
Monthly Housing Cost Tiers in Sulphur Springs
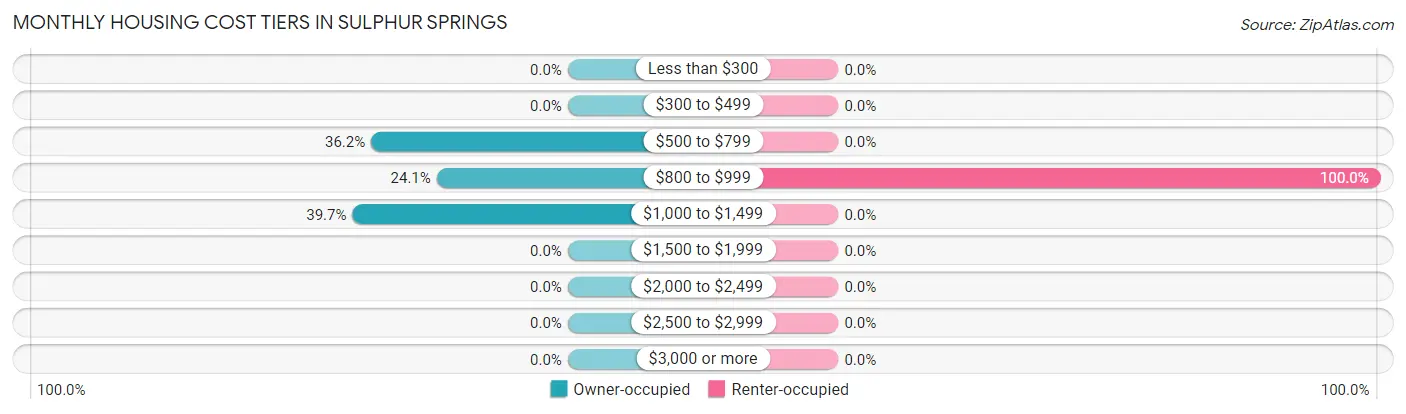
| Monthly Cost | Owner-occupied | Renter-occupied |
| Less than $300 | 0 (0.0%) | 0 (0.0%) |
| $300 to $499 | 0 (0.0%) | 0 (0.0%) |
| $500 to $799 | 21 (36.2%) | 0 (0.0%) |
| $800 to $999 | 14 (24.1%) | 9 (100.0%) |
| $1,000 to $1,499 | 23 (39.7%) | 0 (0.0%) |
| $1,500 to $1,999 | 0 (0.0%) | 0 (0.0%) |
| $2,000 to $2,499 | 0 (0.0%) | 0 (0.0%) |
| $2,500 to $2,999 | 0 (0.0%) | 0 (0.0%) |
| $3,000 or more | 0 (0.0%) | 0 (0.0%) |
| Total | 58 (100.0%) | 9 (100.0%) |
Physical Housing Characteristics in Sulphur Springs
Housing Structures in Sulphur Springs
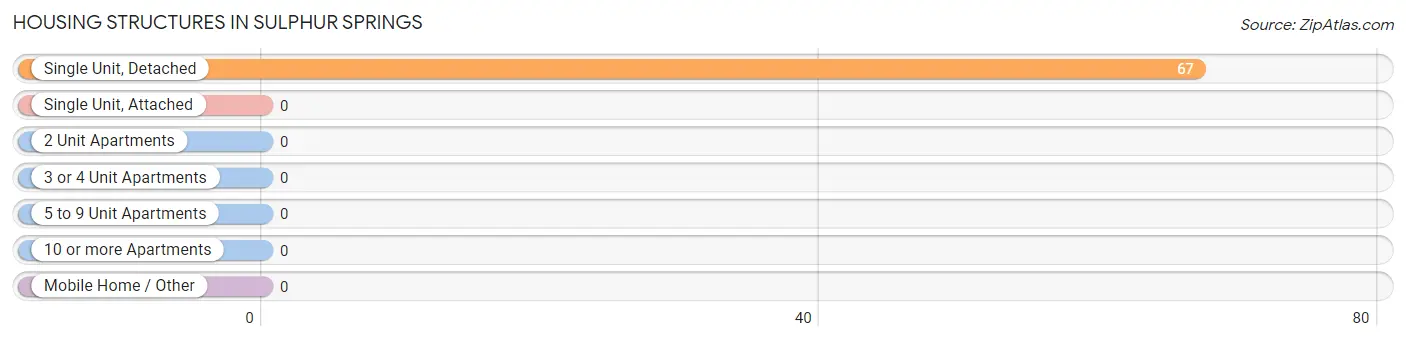
| Structure Type | # Housing Units | % Housing Units |
| Single Unit, Detached | 67 | 100.0% |
| Single Unit, Attached | 0 | 0.0% |
| 2 Unit Apartments | 0 | 0.0% |
| 3 or 4 Unit Apartments | 0 | 0.0% |
| 5 to 9 Unit Apartments | 0 | 0.0% |
| 10 or more Apartments | 0 | 0.0% |
| Mobile Home / Other | 0 | 0.0% |
| Total | 67 | 100.0% |
Housing Structures by Occupancy in Sulphur Springs
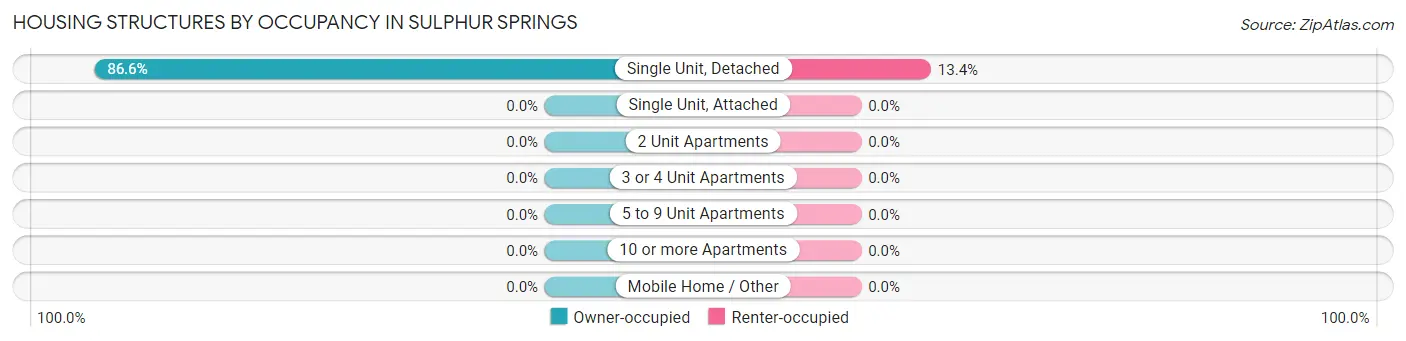
| Structure Type | Owner-occupied | Renter-occupied |
| Single Unit, Detached | 58 (86.6%) | 9 (13.4%) |
| Single Unit, Attached | 0 (0.0%) | 0 (0.0%) |
| 2 Unit Apartments | 0 (0.0%) | 0 (0.0%) |
| 3 or 4 Unit Apartments | 0 (0.0%) | 0 (0.0%) |
| 5 to 9 Unit Apartments | 0 (0.0%) | 0 (0.0%) |
| 10 or more Apartments | 0 (0.0%) | 0 (0.0%) |
| Mobile Home / Other | 0 (0.0%) | 0 (0.0%) |
| Total | 58 (86.6%) | 9 (13.4%) |
Housing Structures by Number of Rooms in Sulphur Springs
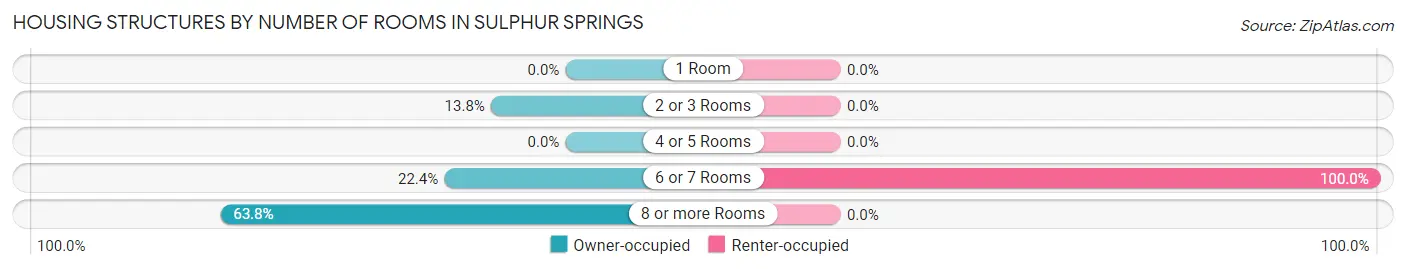
| Number of Rooms | Owner-occupied | Renter-occupied |
| 1 Room | 0 (0.0%) | 0 (0.0%) |
| 2 or 3 Rooms | 8 (13.8%) | 0 (0.0%) |
| 4 or 5 Rooms | 0 (0.0%) | 0 (0.0%) |
| 6 or 7 Rooms | 13 (22.4%) | 9 (100.0%) |
| 8 or more Rooms | 37 (63.8%) | 0 (0.0%) |
| Total | 58 (100.0%) | 9 (100.0%) |
Housing Structure by Heating Type in Sulphur Springs
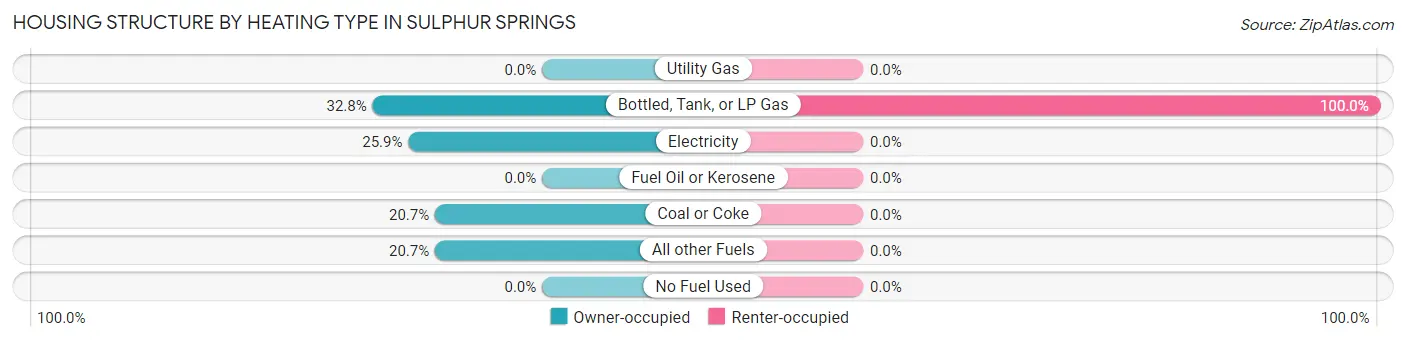
| Heating Type | Owner-occupied | Renter-occupied |
| Utility Gas | 0 (0.0%) | 0 (0.0%) |
| Bottled, Tank, or LP Gas | 19 (32.8%) | 9 (100.0%) |
| Electricity | 15 (25.9%) | 0 (0.0%) |
| Fuel Oil or Kerosene | 0 (0.0%) | 0 (0.0%) |
| Coal or Coke | 12 (20.7%) | 0 (0.0%) |
| All other Fuels | 12 (20.7%) | 0 (0.0%) |
| No Fuel Used | 0 (0.0%) | 0 (0.0%) |
| Total | 58 (100.0%) | 9 (100.0%) |
Household Vehicle Usage in Sulphur Springs
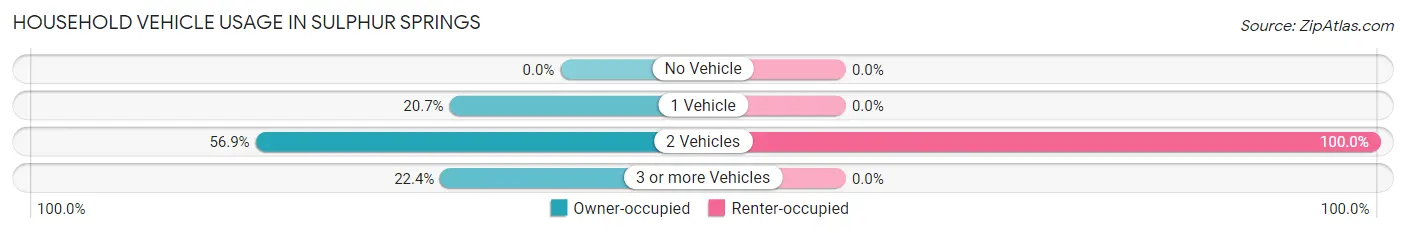
| Vehicles per Household | Owner-occupied | Renter-occupied |
| No Vehicle | 0 (0.0%) | 0 (0.0%) |
| 1 Vehicle | 12 (20.7%) | 0 (0.0%) |
| 2 Vehicles | 33 (56.9%) | 9 (100.0%) |
| 3 or more Vehicles | 13 (22.4%) | 0 (0.0%) |
| Total | 58 (100.0%) | 9 (100.0%) |
Real Estate & Mortgages in Sulphur Springs
Real Estate and Mortgage Overview in Sulphur Springs
| Characteristic | Without Mortgage | With Mortgage |
| Housing Units | 23 | 35 |
| Median Property Value | - | - |
| Median Household Income | $108,472 | $4 |
| Monthly Housing Costs | $831 | $0 |
| Real Estate Taxes | $1,344 | $0 |
Property Value by Mortgage Status in Sulphur Springs
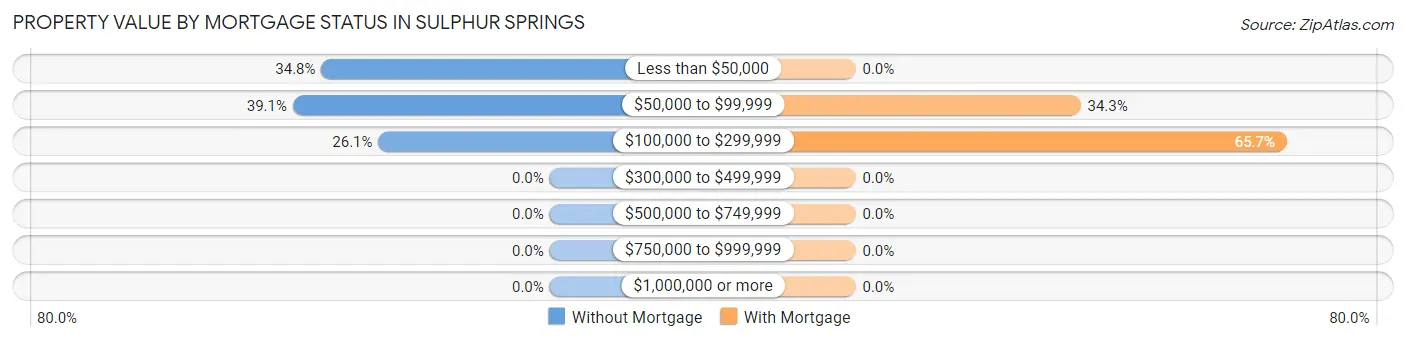
| Property Value | Without Mortgage | With Mortgage |
| Less than $50,000 | 8 (34.8%) | 0 (0.0%) |
| $50,000 to $99,999 | 9 (39.1%) | 12 (34.3%) |
| $100,000 to $299,999 | 6 (26.1%) | 23 (65.7%) |
| $300,000 to $499,999 | 0 (0.0%) | 0 (0.0%) |
| $500,000 to $749,999 | 0 (0.0%) | 0 (0.0%) |
| $750,000 to $999,999 | 0 (0.0%) | 0 (0.0%) |
| $1,000,000 or more | 0 (0.0%) | 0 (0.0%) |
| Total | 23 (100.0%) | 35 (100.0%) |
Household Income by Mortgage Status in Sulphur Springs
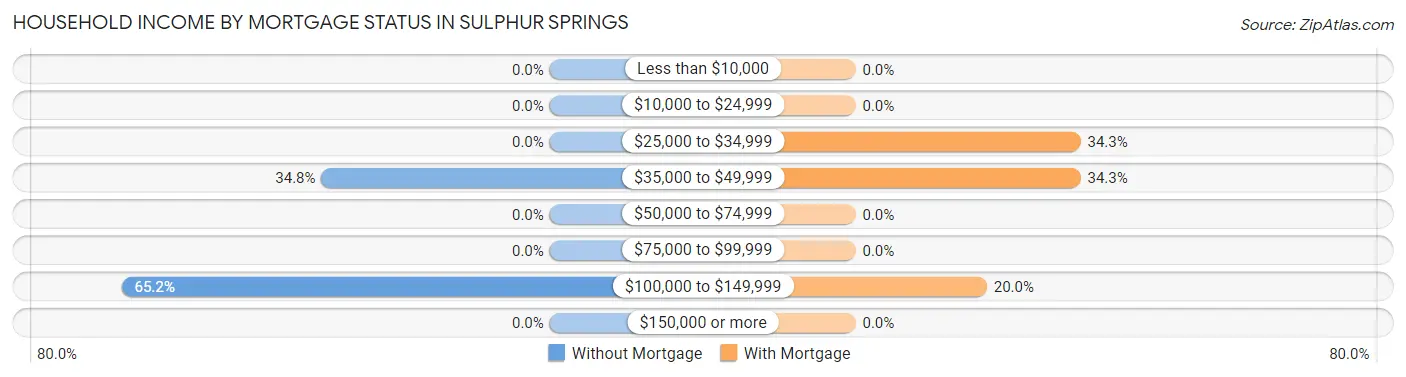
| Household Income | Without Mortgage | With Mortgage |
| Less than $10,000 | 0 (0.0%) | 0 (0.0%) |
| $10,000 to $24,999 | 0 (0.0%) | 0 (0.0%) |
| $25,000 to $34,999 | 0 (0.0%) | 12 (34.3%) |
| $35,000 to $49,999 | 8 (34.8%) | 12 (34.3%) |
| $50,000 to $74,999 | 0 (0.0%) | 0 (0.0%) |
| $75,000 to $99,999 | 0 (0.0%) | 0 (0.0%) |
| $100,000 to $149,999 | 15 (65.2%) | 7 (20.0%) |
| $150,000 or more | 0 (0.0%) | 0 (0.0%) |
| Total | 23 (100.0%) | 35 (100.0%) |
Property Value to Household Income Ratio in Sulphur Springs
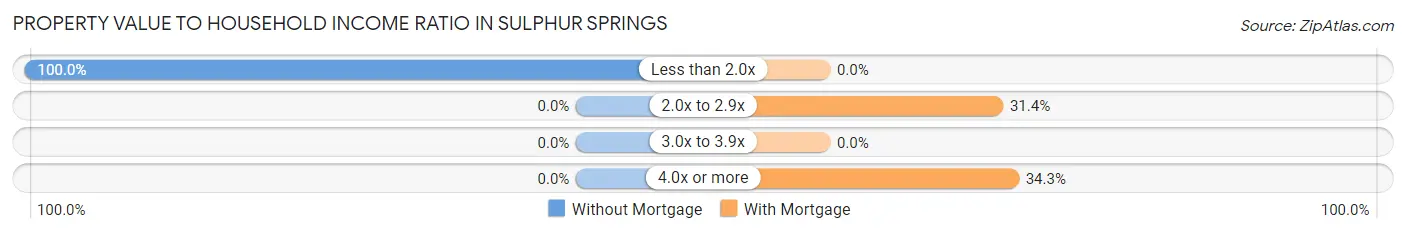
| Value-to-Income Ratio | Without Mortgage | With Mortgage |
| Less than 2.0x | 23 (100.0%) | 0 (0.0%) |
| 2.0x to 2.9x | 0 (0.0%) | 11 (31.4%) |
| 3.0x to 3.9x | 0 (0.0%) | 0 (0.0%) |
| 4.0x or more | 0 (0.0%) | 12 (34.3%) |
| Total | 23 (100.0%) | 35 (100.0%) |
Real Estate Taxes by Mortgage Status in Sulphur Springs
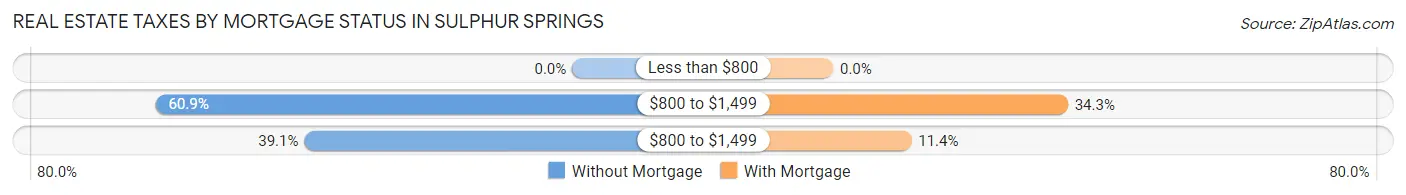
| Property Taxes | Without Mortgage | With Mortgage |
| Less than $800 | 0 (0.0%) | 0 (0.0%) |
| $800 to $1,499 | 14 (60.9%) | 12 (34.3%) |
| $800 to $1,499 | 9 (39.1%) | 4 (11.4%) |
| Total | 23 (100.0%) | 35 (100.0%) |
Health & Disability in Sulphur Springs
Health Insurance Coverage by Age in Sulphur Springs
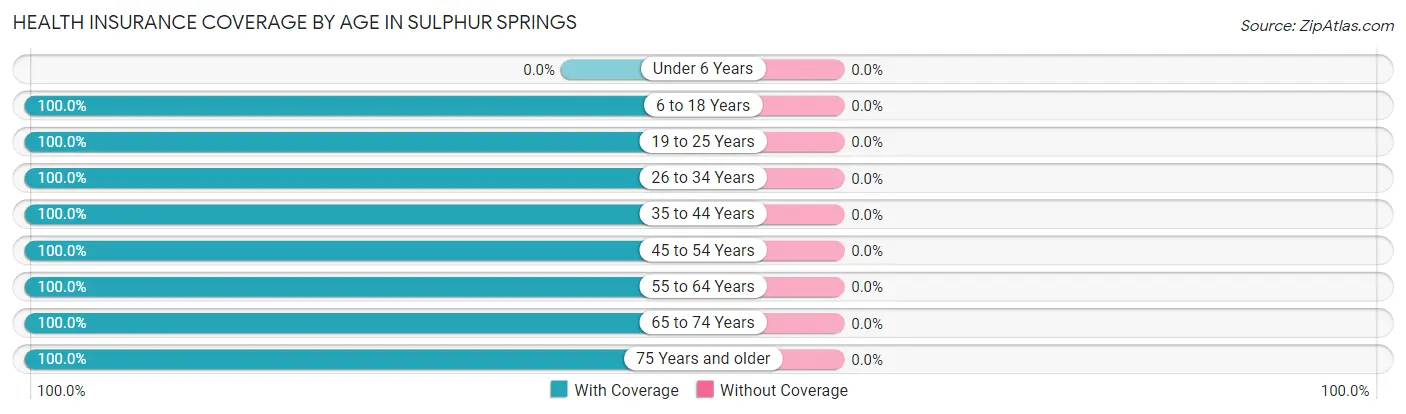
| Age Bracket | With Coverage | Without Coverage |
| Under 6 Years | 0 (0.0%) | 0 (0.0%) |
| 6 to 18 Years | 48 (100.0%) | 0 (0.0%) |
| 19 to 25 Years | 13 (100.0%) | 0 (0.0%) |
| 26 to 34 Years | 9 (100.0%) | 0 (0.0%) |
| 35 to 44 Years | 21 (100.0%) | 0 (0.0%) |
| 45 to 54 Years | 50 (100.0%) | 0 (0.0%) |
| 55 to 64 Years | 21 (100.0%) | 0 (0.0%) |
| 65 to 74 Years | 23 (100.0%) | 0 (0.0%) |
| 75 Years and older | 8 (100.0%) | 0 (0.0%) |
| Total | 193 (100.0%) | 0 (0.0%) |
Health Insurance Coverage by Citizenship Status in Sulphur Springs
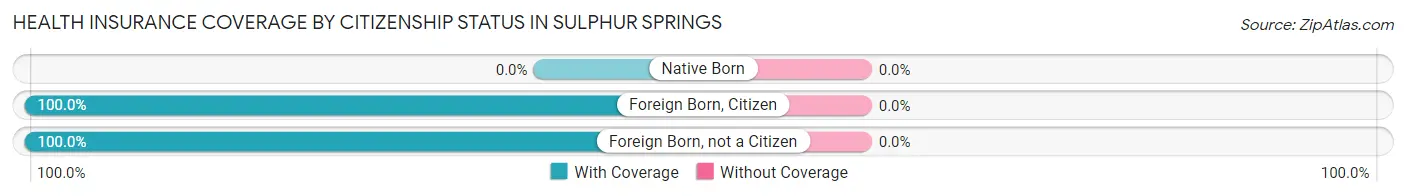
| Citizenship Status | With Coverage | Without Coverage |
| Native Born | 0 (0.0%) | 0 (0.0%) |
| Foreign Born, Citizen | 48 (100.0%) | 0 (0.0%) |
| Foreign Born, not a Citizen | 13 (100.0%) | 0 (0.0%) |
Health Insurance Coverage by Household Income in Sulphur Springs
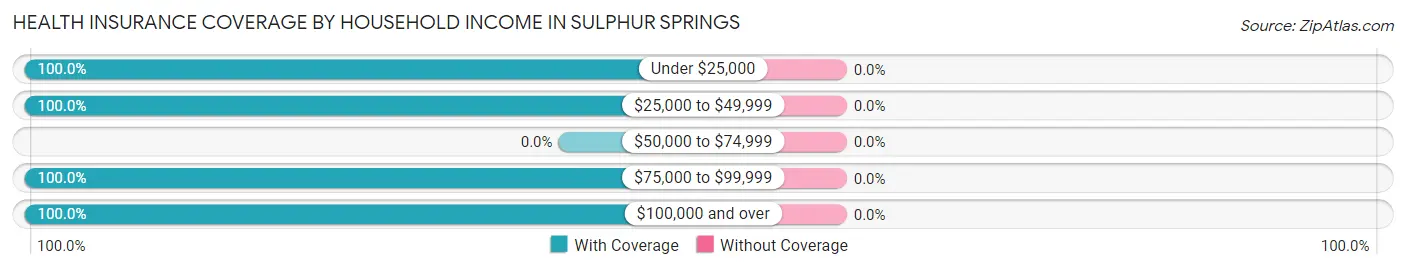
| Household Income | With Coverage | Without Coverage |
| Under $25,000 | 40 (100.0%) | 0 (0.0%) |
| $25,000 to $49,999 | 40 (100.0%) | 0 (0.0%) |
| $50,000 to $74,999 | 0 (0.0%) | 0 (0.0%) |
| $75,000 to $99,999 | 31 (100.0%) | 0 (0.0%) |
| $100,000 and over | 82 (100.0%) | 0 (0.0%) |
Public vs Private Health Insurance Coverage by Age in Sulphur Springs
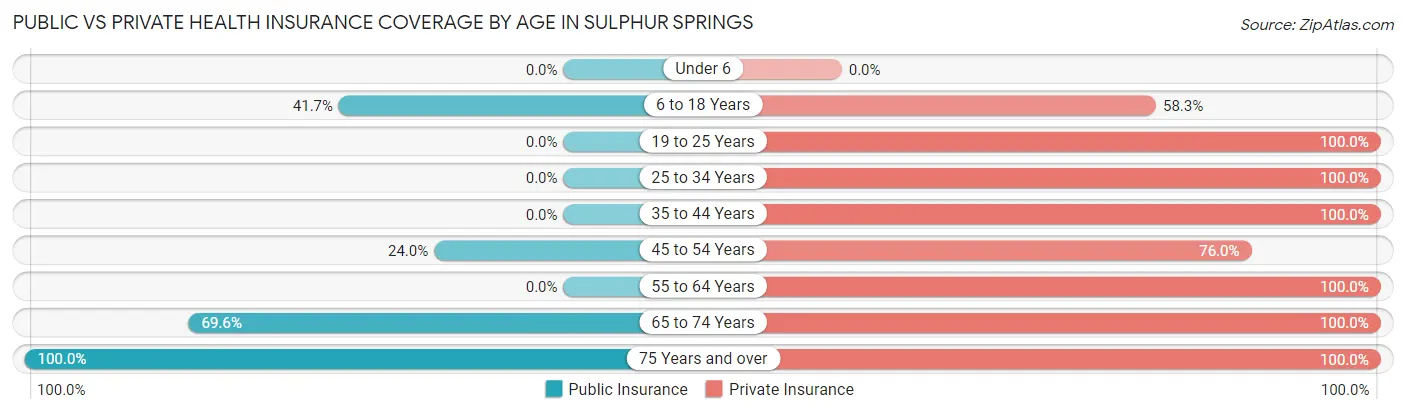
| Age Bracket | Public Insurance | Private Insurance |
| Under 6 | 0 (0.0%) | 0 (0.0%) |
| 6 to 18 Years | 20 (41.7%) | 28 (58.3%) |
| 19 to 25 Years | 0 (0.0%) | 13 (100.0%) |
| 25 to 34 Years | 0 (0.0%) | 9 (100.0%) |
| 35 to 44 Years | 0 (0.0%) | 21 (100.0%) |
| 45 to 54 Years | 12 (24.0%) | 38 (76.0%) |
| 55 to 64 Years | 0 (0.0%) | 21 (100.0%) |
| 65 to 74 Years | 16 (69.6%) | 23 (100.0%) |
| 75 Years and over | 8 (100.0%) | 8 (100.0%) |
| Total | 56 (29.0%) | 161 (83.4%) |
Disability Status by Sex by Age in Sulphur Springs
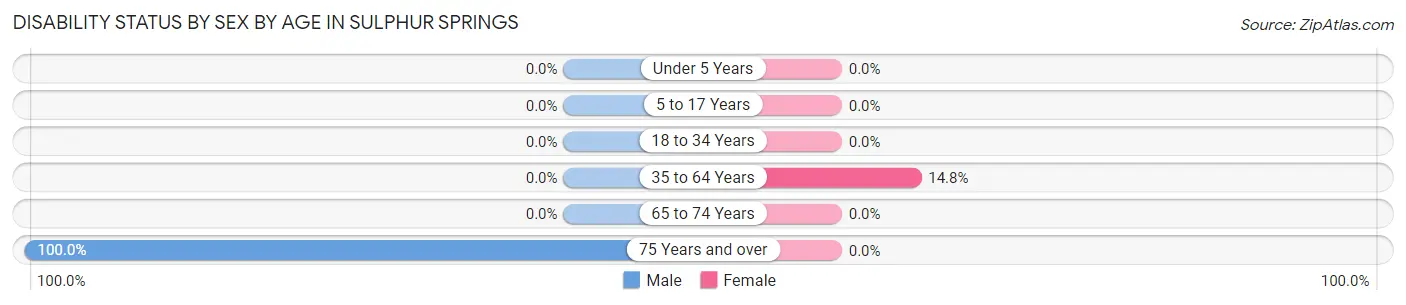
| Age Bracket | Male | Female |
| Under 5 Years | 0 (0.0%) | 0 (0.0%) |
| 5 to 17 Years | 0 (0.0%) | 0 (0.0%) |
| 18 to 34 Years | 0 (0.0%) | 0 (0.0%) |
| 35 to 64 Years | 0 (0.0%) | 9 (14.7%) |
| 65 to 74 Years | 0 (0.0%) | 0 (0.0%) |
| 75 Years and over | 8 (100.0%) | 0 (0.0%) |
Disability Class by Sex by Age in Sulphur Springs
Disability Class: Hearing Difficulty
| Age Bracket | Male | Female |
| Under 5 Years | 0 (0.0%) | 0 (0.0%) |
| 5 to 17 Years | 0 (0.0%) | 0 (0.0%) |
| 18 to 34 Years | 0 (0.0%) | 0 (0.0%) |
| 35 to 64 Years | 0 (0.0%) | 0 (0.0%) |
| 65 to 74 Years | 0 (0.0%) | 0 (0.0%) |
| 75 Years and over | 0 (0.0%) | 0 (0.0%) |
Disability Class: Vision Difficulty
| Age Bracket | Male | Female |
| Under 5 Years | 0 (0.0%) | 0 (0.0%) |
| 5 to 17 Years | 0 (0.0%) | 0 (0.0%) |
| 18 to 34 Years | 0 (0.0%) | 0 (0.0%) |
| 35 to 64 Years | 0 (0.0%) | 0 (0.0%) |
| 65 to 74 Years | 0 (0.0%) | 0 (0.0%) |
| 75 Years and over | 0 (0.0%) | 0 (0.0%) |
Disability Class: Cognitive Difficulty
| Age Bracket | Male | Female |
| 5 to 17 Years | 0 (0.0%) | 0 (0.0%) |
| 18 to 34 Years | 0 (0.0%) | 0 (0.0%) |
| 35 to 64 Years | 0 (0.0%) | 0 (0.0%) |
| 65 to 74 Years | 0 (0.0%) | 0 (0.0%) |
| 75 Years and over | 0 (0.0%) | 0 (0.0%) |
Disability Class: Ambulatory Difficulty
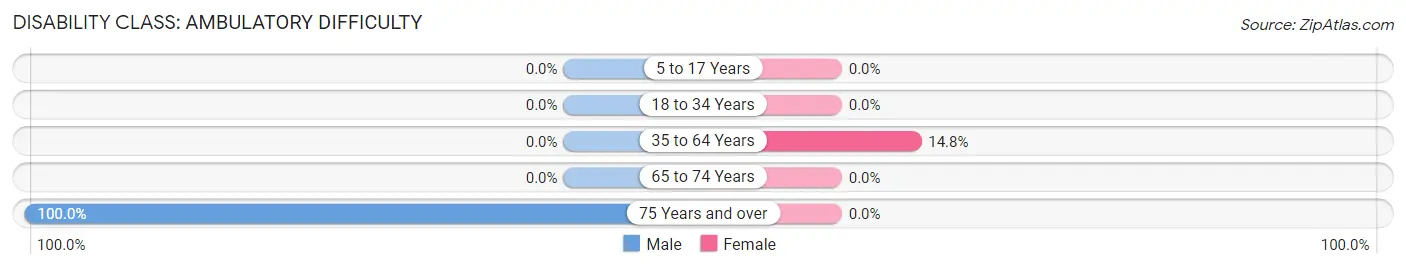
| Age Bracket | Male | Female |
| 5 to 17 Years | 0 (0.0%) | 0 (0.0%) |
| 18 to 34 Years | 0 (0.0%) | 0 (0.0%) |
| 35 to 64 Years | 0 (0.0%) | 9 (14.7%) |
| 65 to 74 Years | 0 (0.0%) | 0 (0.0%) |
| 75 Years and over | 8 (100.0%) | 0 (0.0%) |
Disability Class: Self-Care Difficulty
| Age Bracket | Male | Female |
| 5 to 17 Years | 0 (0.0%) | 0 (0.0%) |
| 18 to 34 Years | 0 (0.0%) | 0 (0.0%) |
| 35 to 64 Years | 0 (0.0%) | 0 (0.0%) |
| 65 to 74 Years | 0 (0.0%) | 0 (0.0%) |
| 75 Years and over | 0 (0.0%) | 0 (0.0%) |
Technology Access in Sulphur Springs
Computing Device Access in Sulphur Springs
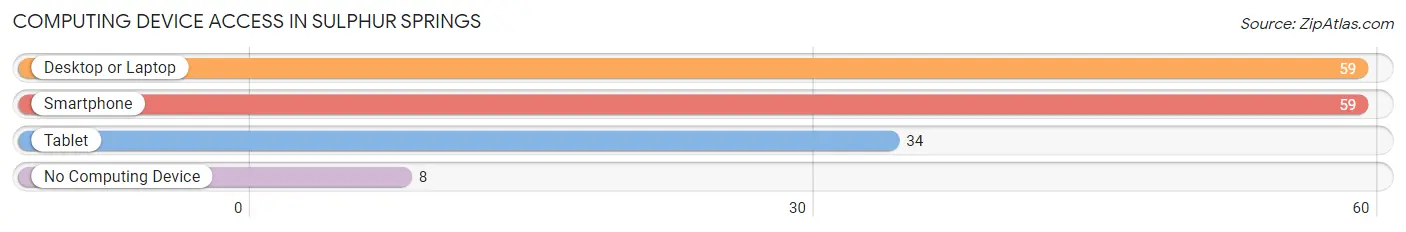
| Device Type | # Households | % Households |
| Desktop or Laptop | 59 | 88.1% |
| Smartphone | 59 | 88.1% |
| Tablet | 34 | 50.7% |
| No Computing Device | 8 | 11.9% |
| Total | 67 | 100.0% |
Internet Access in Sulphur Springs
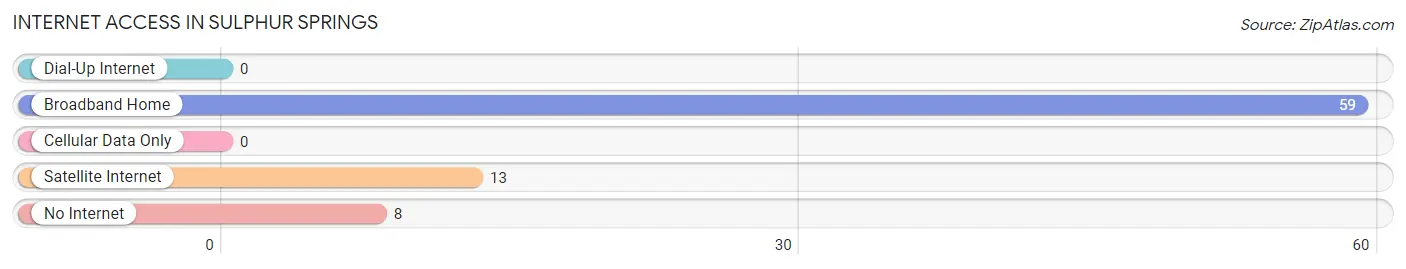
| Internet Type | # Households | % Households |
| Dial-Up Internet | 0 | 0.0% |
| Broadband Home | 59 | 88.1% |
| Cellular Data Only | 0 | 0.0% |
| Satellite Internet | 13 | 19.4% |
| No Internet | 8 | 11.9% |
| Total | 67 | 100.0% |
Sulphur Springs Summary
Sulphur Springs is a small unincorporated community located in the southeastern corner of Ohio, in the county of Hocking. It is situated in the foothills of the Appalachian Mountains, and is surrounded by the Hocking River and the Hocking Hills State Park. The community is home to approximately 500 people, and is known for its rural charm and natural beauty.
History
Sulphur Springs was first settled in the early 1800s by a group of settlers from Pennsylvania. The settlers were attracted to the area due to its abundance of natural resources, including timber, coal, and iron ore. The settlers built a small village and named it Sulphur Springs, after the nearby sulfur springs. The village grew slowly, and by the mid-1800s, it had become a thriving community with a population of around 500 people.
The village was home to a variety of businesses, including a general store, a blacksmith shop, a sawmill, and a gristmill. The village also had a school, a post office, and a church. The village was a popular destination for tourists, who came to enjoy the natural beauty of the area.
In the late 1800s, the village began to decline as the local economy shifted away from agriculture and towards industry. The village was eventually abandoned in the early 1900s, and the buildings were left to decay. In the late 1900s, the village was rediscovered by a group of local residents who began to restore the buildings and revitalize the community.
Geography
Sulphur Springs is located in the southeastern corner of Ohio, in the county of Hocking. It is situated in the foothills of the Appalachian Mountains, and is surrounded by the Hocking River and the Hocking Hills State Park. The village is located approximately 30 miles from the city of Columbus, and is accessible by car via State Route 33.
The village is situated on a plateau, and is surrounded by rolling hills and lush forests. The area is known for its natural beauty, and is home to a variety of wildlife, including deer, wild turkeys, and bald eagles. The village is also home to a variety of plants, including wildflowers, ferns, and mosses.
Economy
Sulphur Springs is a small, rural community with a population of approximately 500 people. The local economy is largely based on agriculture, with the majority of the population employed in farming and related activities. The village is also home to a variety of small businesses, including a general store, a blacksmith shop, and a sawmill.
The village is also home to a variety of tourist attractions, including the Hocking Hills State Park, which is a popular destination for hikers, campers, and nature lovers. The village is also home to a variety of art galleries, antique shops, and restaurants.
Demographics
As of the 2010 census, the population of Sulphur Springs was 498 people. The racial makeup of the village was 97.2% White, 0.2% African American, 0.2% Native American, 0.2% Asian, 0.2% from other races, and 1.8% from two or more races. The median household income was $37,500, and the median age was 43.5 years.
Common Questions
What is Per Capita Income in Sulphur Springs?
Per Capita income in Sulphur Springs is $28,994.
What is the Median Family Income in Sulphur Springs?
Median Family Income in Sulphur Springs is $79,028.
What is Income or Wage Gap in Sulphur Springs?
Income or Wage Gap in Sulphur Springs is 19.7%.
Women in Sulphur Springs earn 80.3 cents for every dollar earned by a man.
What is Inequality or Gini Index in Sulphur Springs?
Inequality or Gini Index in Sulphur Springs is 0.36.
What is the Total Population of Sulphur Springs?
Total Population of Sulphur Springs is 193.
What is the Total Male Population of Sulphur Springs?
Total Male Population of Sulphur Springs is 100.
What is the Total Female Population of Sulphur Springs?
Total Female Population of Sulphur Springs is 93.
What is the Ratio of Males per 100 Females in Sulphur Springs?
There are 107.53 Males per 100 Females in Sulphur Springs.
What is the Ratio of Females per 100 Males in Sulphur Springs?
There are 93.00 Females per 100 Males in Sulphur Springs.
What is the Median Population Age in Sulphur Springs?
Median Population Age in Sulphur Springs is 47.5 Years.
What is the Average Family Size in Sulphur Springs
Average Family Size in Sulphur Springs is 3.1 People.
What is the Average Household Size in Sulphur Springs
Average Household Size in Sulphur Springs is 2.9 People.
How Large is the Labor Force in Sulphur Springs?
There are 131 People in the Labor Forcein in Sulphur Springs.
What is the Percentage of People in the Labor Force in Sulphur Springs?
90.3% of People are in the Labor Force in Sulphur Springs.
What is the Unemployment Rate in Sulphur Springs?
Unemployment Rate in Sulphur Springs is 33.6%.