Maineville, OH Map & Demographics
Maineville Map
Maineville Overview
$30,255
PER CAPITA INCOME
$87,517
AVG FAMILY INCOME
$87,894
AVG HOUSEHOLD INCOME
50.3%
WAGE / INCOME GAP [ % ]
49.7¢/ $1
WAGE / INCOME GAP [ $ ]
0.37
INEQUALITY / GINI INDEX
2,057
TOTAL POPULATION
1,152
MALE POPULATION
905
FEMALE POPULATION
127.29
MALES / 100 FEMALES
78.56
FEMALES / 100 MALES
31.6
MEDIAN AGE
3.6
AVG FAMILY SIZE
3.1
AVG HOUSEHOLD SIZE
912
LABOR FORCE [ PEOPLE ]
63.7%
PERCENT IN LABOR FORCE
3.0%
UNEMPLOYMENT RATE
Maineville Zip Codes
Maineville Area Codes
Income in Maineville
Income Overview in Maineville
Per Capita Income in Maineville is $30,255, while median incomes of families and households are $87,517 and $87,894 respectively.
| Characteristic | Number | Measure |
| Per Capita Income | 2,057 | $30,255 |
| Median Family Income | 487 | $87,517 |
| Mean Family Income | 487 | $100,779 |
| Median Household Income | 661 | $87,894 |
| Mean Household Income | 661 | $90,574 |
| Income Deficit | 487 | $0 |
| Wage / Income Gap (%) | 2,057 | 50.27% |
| Wage / Income Gap ($) | 2,057 | 49.73¢ per $1 |
| Gini / Inequality Index | 2,057 | 0.37 |
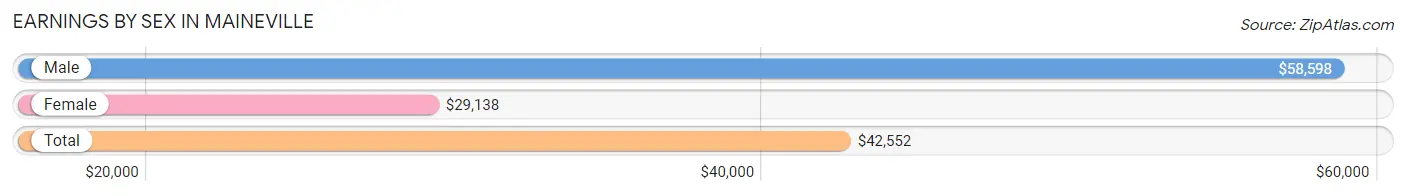
Earnings by Sex in Maineville
Average Earnings in Maineville are $42,552, $58,598 for men and $29,138 for women, a difference of 50.3%.
| Sex | Number | Average Earnings |
| Male | 541 (52.8%) | $58,598 |
| Female | 484 (47.2%) | $29,138 |
| Total | 1,025 (100.0%) | $42,552 |
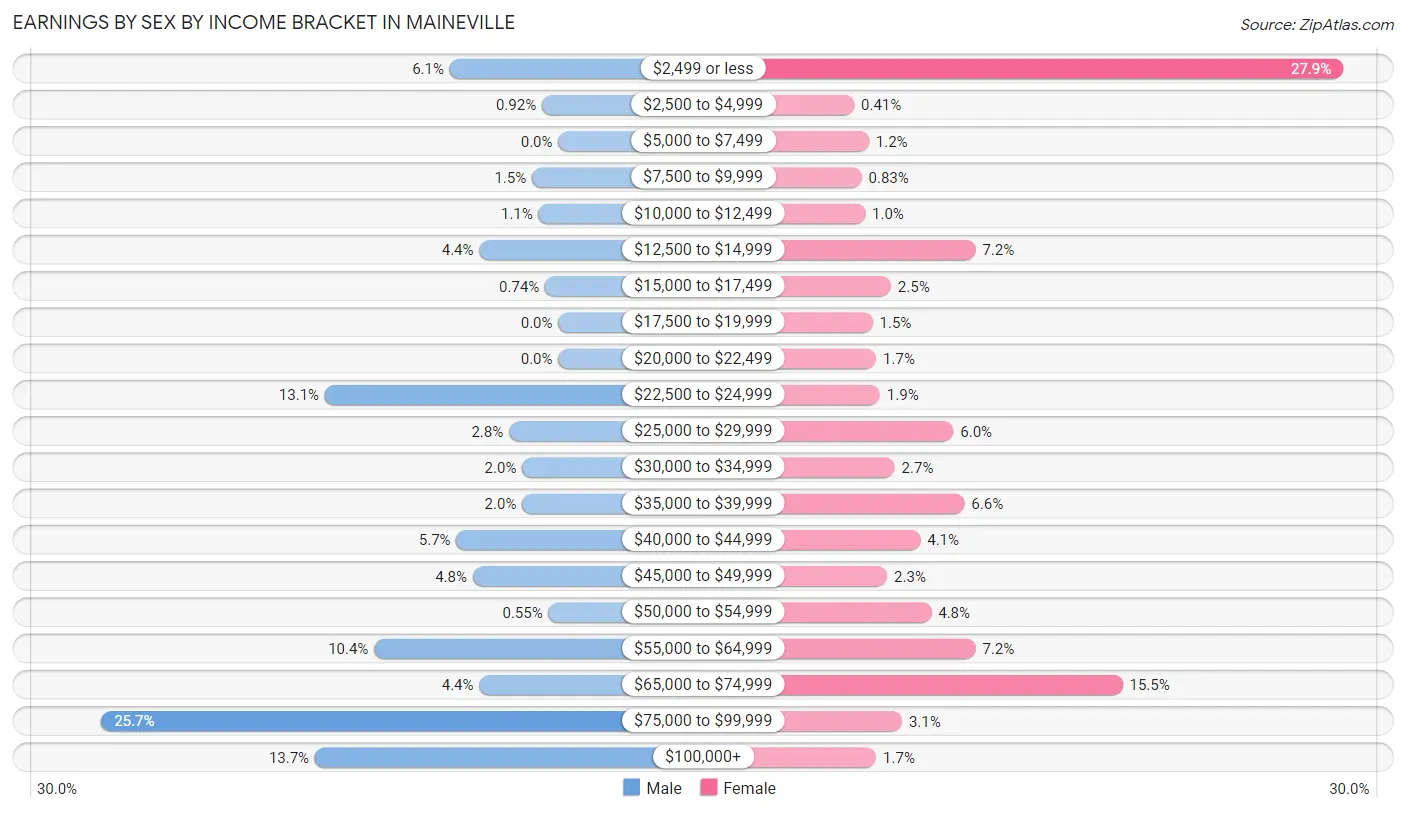
Earnings by Sex by Income Bracket in Maineville
The most common earnings brackets in Maineville are $75,000 to $99,999 for men (139 | 25.7%) and $2,499 or less for women (135 | 27.9%).
| Income | Male | Female |
| $2,499 or less | 33 (6.1%) | 135 (27.9%) |
| $2,500 to $4,999 | 5 (0.9%) | 2 (0.4%) |
| $5,000 to $7,499 | 0 (0.0%) | 6 (1.2%) |
| $7,500 to $9,999 | 8 (1.5%) | 4 (0.8%) |
| $10,000 to $12,499 | 6 (1.1%) | 5 (1.0%) |
| $12,500 to $14,999 | 24 (4.4%) | 35 (7.2%) |
| $15,000 to $17,499 | 4 (0.7%) | 12 (2.5%) |
| $17,500 to $19,999 | 0 (0.0%) | 7 (1.5%) |
| $20,000 to $22,499 | 0 (0.0%) | 8 (1.7%) |
| $22,500 to $24,999 | 71 (13.1%) | 9 (1.9%) |
| $25,000 to $29,999 | 15 (2.8%) | 29 (6.0%) |
| $30,000 to $34,999 | 11 (2.0%) | 13 (2.7%) |
| $35,000 to $39,999 | 11 (2.0%) | 32 (6.6%) |
| $40,000 to $44,999 | 31 (5.7%) | 20 (4.1%) |
| $45,000 to $49,999 | 26 (4.8%) | 11 (2.3%) |
| $50,000 to $54,999 | 3 (0.5%) | 23 (4.8%) |
| $55,000 to $64,999 | 56 (10.3%) | 35 (7.2%) |
| $65,000 to $74,999 | 24 (4.4%) | 75 (15.5%) |
| $75,000 to $99,999 | 139 (25.7%) | 15 (3.1%) |
| $100,000+ | 74 (13.7%) | 8 (1.7%) |
| Total | 541 (100.0%) | 484 (100.0%) |
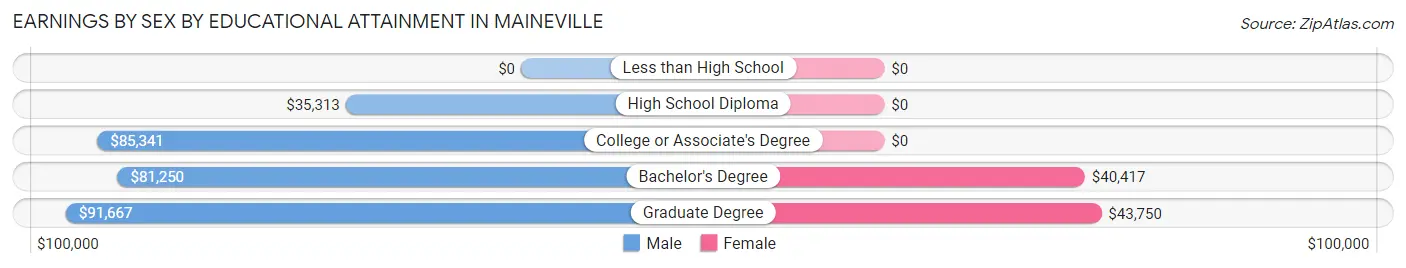
Earnings by Sex by Educational Attainment in Maineville
Average earnings in Maineville are $75,000 for men and $30,417 for women, a difference of 59.4%. Men with an educational attainment of graduate degree enjoy the highest average annual earnings of $91,667, while those with high school diploma education earn the least with $35,313. Women with an educational attainment of graduate degree earn the most with the average annual earnings of $43,750, while those with bachelor's degree education have the smallest earnings of $40,417.
| Educational Attainment | Male Income | Female Income |
| Less than High School | - | - |
| High School Diploma | $35,313 | $0 |
| College or Associate's Degree | $85,341 | $0 |
| Bachelor's Degree | $81,250 | $40,417 |
| Graduate Degree | $91,667 | $43,750 |
| Total | $75,000 | $30,417 |
Family Income in Maineville
Family Income Brackets in Maineville
According to the Maineville family income data, there are 138 families falling into the $50,000 to $74,999 income range, which is the most common income bracket and makes up 28.3% of all families.
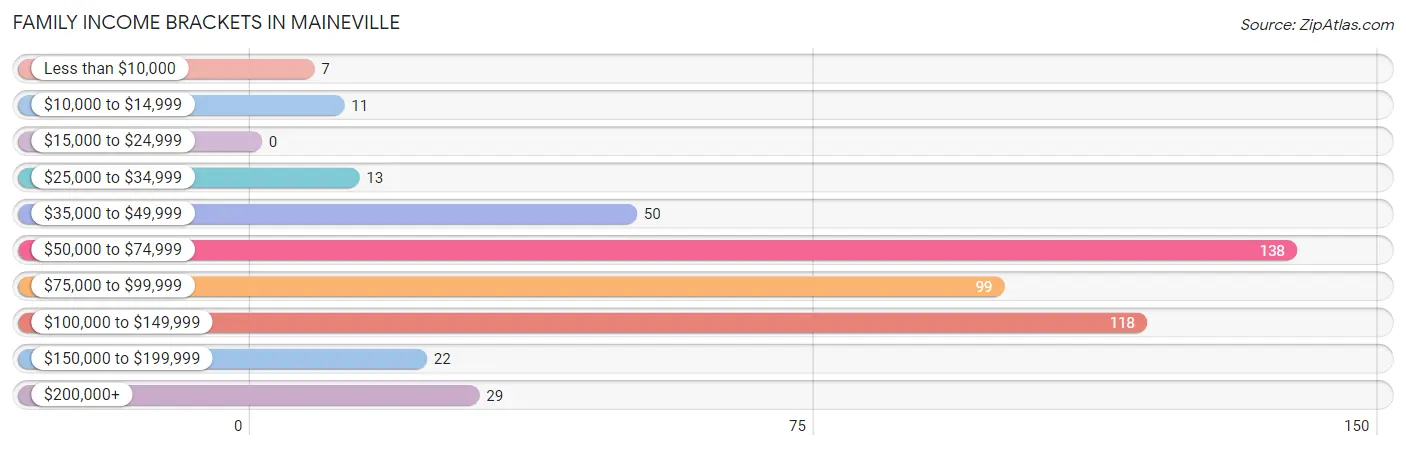
| Income Bracket | # Families | % Families |
| Less than $10,000 | 7 | 1.4% |
| $10,000 to $14,999 | 11 | 2.3% |
| $15,000 to $24,999 | 0 | 0.0% |
| $25,000 to $34,999 | 13 | 2.7% |
| $35,000 to $49,999 | 50 | 10.3% |
| $50,000 to $74,999 | 138 | 28.3% |
| $75,000 to $99,999 | 99 | 20.3% |
| $100,000 to $149,999 | 118 | 24.2% |
| $150,000 to $199,999 | 22 | 4.5% |
| $200,000+ | 29 | 6.0% |
Family Income by Famaliy Size in Maineville
5-person families (122 | 25.1%) account for the highest median family income in Maineville with $89,312 per family, while 2-person families (190 | 39.0%) have the highest median income of $37,025 per family member.
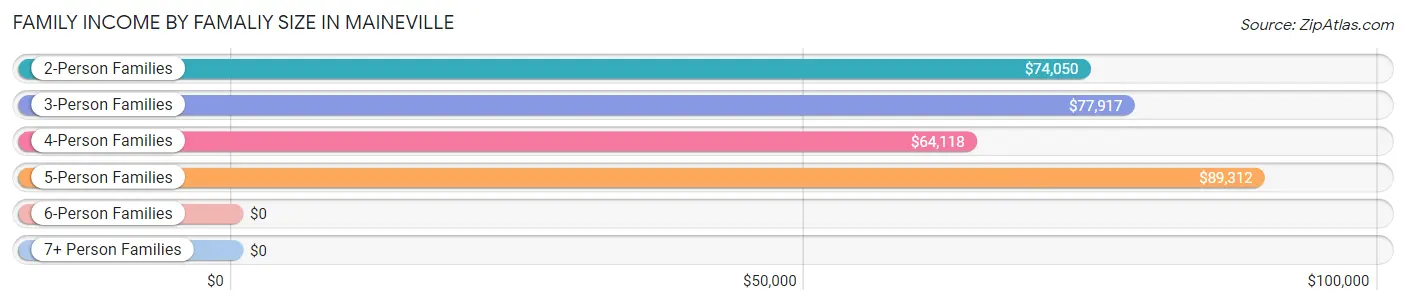
| Income Bracket | # Families | Median Income |
| 2-Person Families | 190 (39.0%) | $74,050 |
| 3-Person Families | 91 (18.7%) | $77,917 |
| 4-Person Families | 82 (16.8%) | $64,118 |
| 5-Person Families | 122 (25.1%) | $89,312 |
| 6-Person Families | 0 (0.0%) | $0 |
| 7+ Person Families | 2 (0.4%) | $0 |
| Total | 487 (100.0%) | $87,517 |
Family Income by Number of Earners in Maineville
The median family income in Maineville is $87,517, with families comprising 3+ earners (35) having the highest median family income of $144,688, while families with no earners (45) have the lowest median family income of $49,583, accounting for 7.2% and 9.2% of families, respectively.
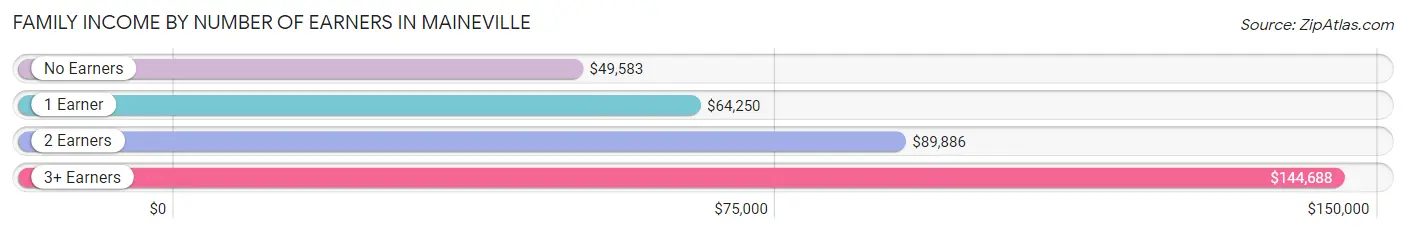
| Number of Earners | # Families | Median Income |
| No Earners | 45 (9.2%) | $49,583 |
| 1 Earner | 187 (38.4%) | $64,250 |
| 2 Earners | 220 (45.2%) | $89,886 |
| 3+ Earners | 35 (7.2%) | $144,688 |
| Total | 487 (100.0%) | $87,517 |
Household Income in Maineville
Household Income Brackets in Maineville
With 159 households falling in the category, the $100,000 to $149,999 income range is the most frequent in Maineville, accounting for 24.0% of all households. In contrast, only 17 households (2.6%) fall into the less than $10,000 income bracket, making it the least populous group.
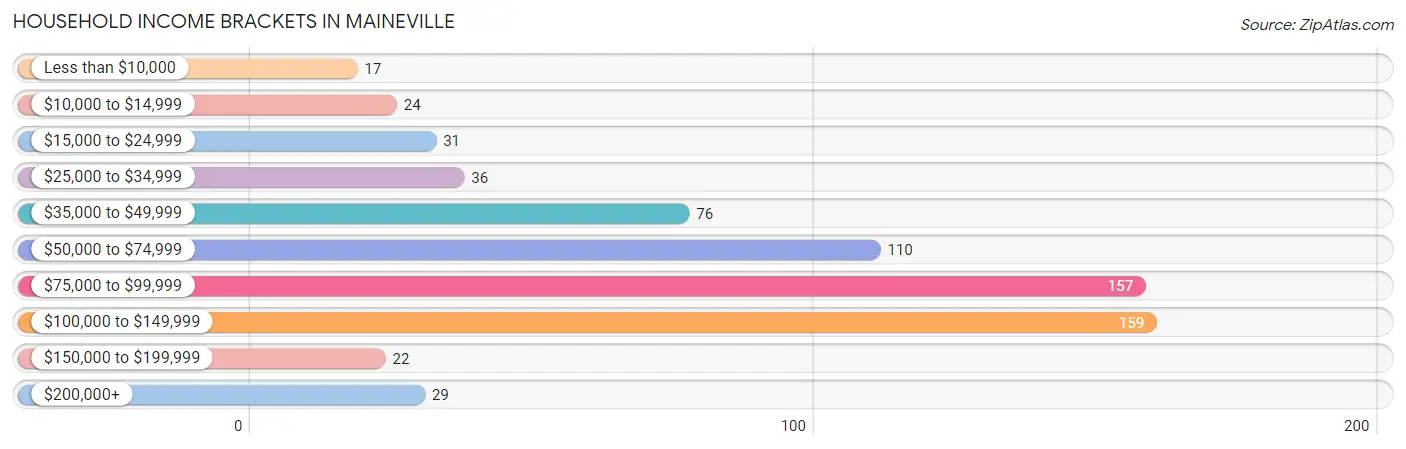
| Income Bracket | # Households | % Households |
| Less than $10,000 | 17 | 2.6% |
| $10,000 to $14,999 | 24 | 3.6% |
| $15,000 to $24,999 | 31 | 4.7% |
| $25,000 to $34,999 | 36 | 5.4% |
| $35,000 to $49,999 | 76 | 11.5% |
| $50,000 to $74,999 | 110 | 16.6% |
| $75,000 to $99,999 | 157 | 23.8% |
| $100,000 to $149,999 | 159 | 24.1% |
| $150,000 to $199,999 | 22 | 3.3% |
| $200,000+ | 29 | 4.4% |
Household Income by Householder Age in Maineville
The median household income in Maineville is $87,894, with the highest median household income of $92,500 found in the 45 to 64 years age bracket for the primary householder. A total of 196 households (29.6%) fall into this category. Meanwhile, the 15 to 24 years age bracket for the primary householder has the lowest median household income of $0, with 25 households (3.8%) in this group.
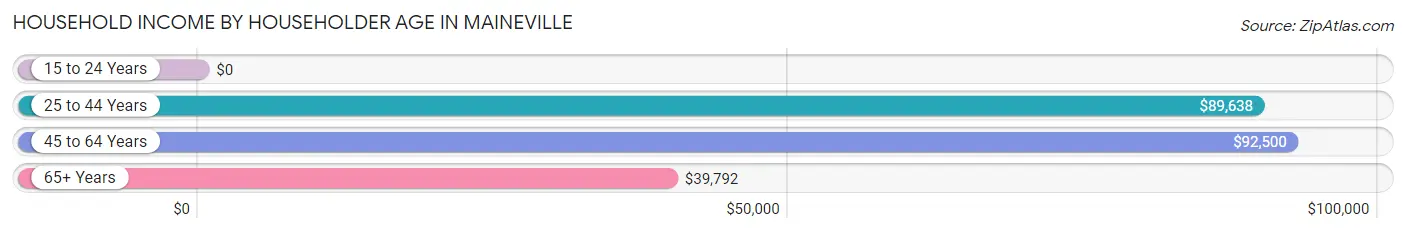
| Income Bracket | # Households | Median Income |
| 15 to 24 Years | 25 (3.8%) | $0 |
| 25 to 44 Years | 286 (43.3%) | $89,638 |
| 45 to 64 Years | 196 (29.6%) | $92,500 |
| 65+ Years | 154 (23.3%) | $39,792 |
| Total | 661 (100.0%) | $87,894 |
Poverty in Maineville
Income Below Poverty by Sex and Age in Maineville
With 7.8% poverty level for males and 5.7% for females among the residents of Maineville, 15 year old males and 45 to 54 year old females are the most vulnerable to poverty, with 10 males (62.5%) and 18 females (32.1%) in their respective age groups living below the poverty level.
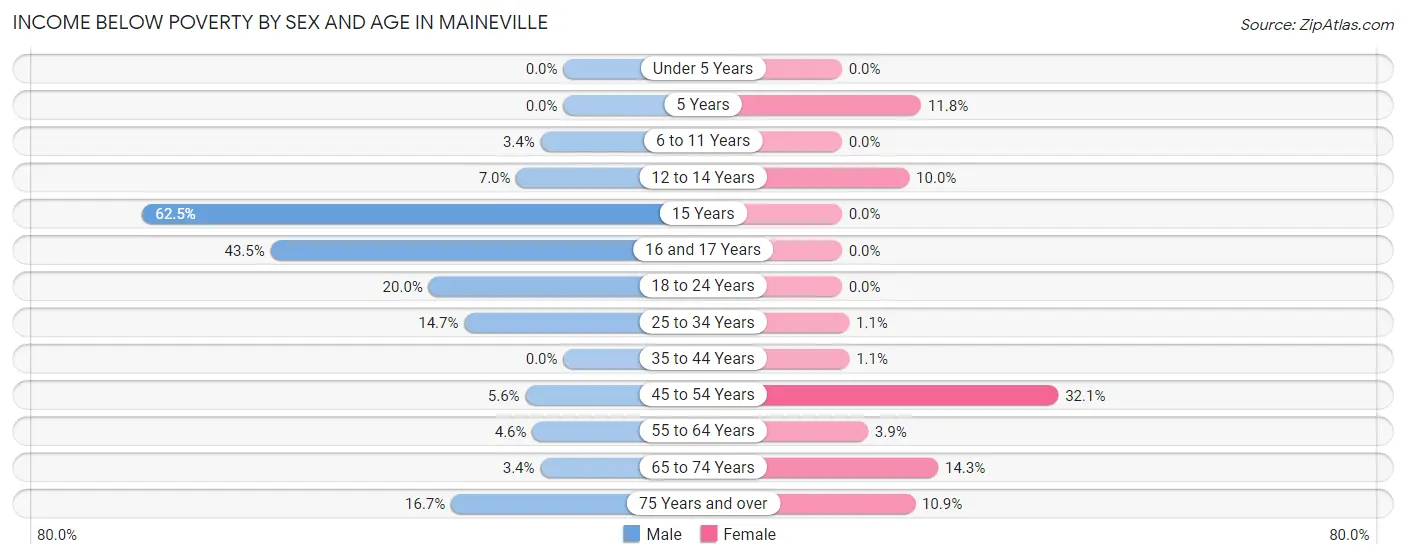
| Age Bracket | Male | Female |
| Under 5 Years | 0 (0.0%) | 0 (0.0%) |
| 5 Years | 0 (0.0%) | 2 (11.8%) |
| 6 to 11 Years | 5 (3.4%) | 0 (0.0%) |
| 12 to 14 Years | 3 (7.0%) | 5 (10.0%) |
| 15 Years | 10 (62.5%) | 0 (0.0%) |
| 16 and 17 Years | 10 (43.5%) | 0 (0.0%) |
| 18 to 24 Years | 28 (20.0%) | 0 (0.0%) |
| 25 to 34 Years | 20 (14.7%) | 2 (1.1%) |
| 35 to 44 Years | 0 (0.0%) | 2 (1.1%) |
| 45 to 54 Years | 4 (5.6%) | 18 (32.1%) |
| 55 to 64 Years | 4 (4.6%) | 5 (3.9%) |
| 65 to 74 Years | 3 (3.4%) | 11 (14.3%) |
| 75 Years and over | 3 (16.7%) | 5 (10.9%) |
| Total | 90 (7.8%) | 50 (5.7%) |
Income Above Poverty by Sex and Age in Maineville
According to the poverty statistics in Maineville, males aged under 5 years and females aged under 5 years are the age groups that are most secure financially, with 100.0% of males and 100.0% of females in these age groups living above the poverty line.
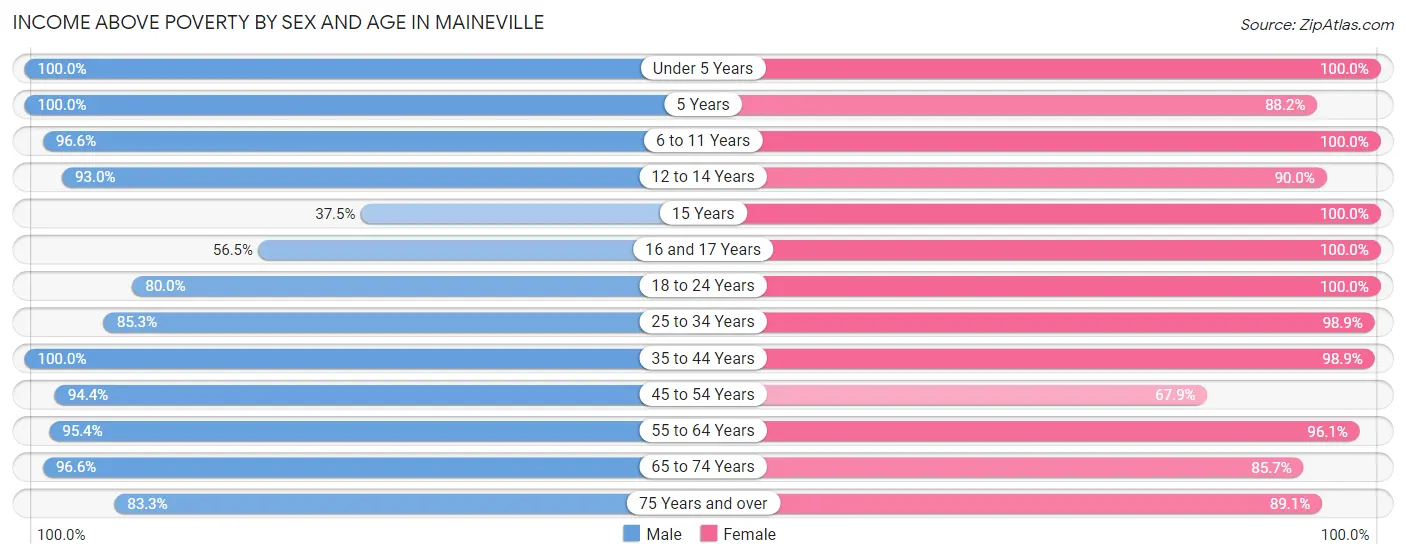
| Age Bracket | Male | Female |
| Under 5 Years | 211 (100.0%) | 27 (100.0%) |
| 5 Years | 6 (100.0%) | 15 (88.2%) |
| 6 to 11 Years | 143 (96.6%) | 75 (100.0%) |
| 12 to 14 Years | 40 (93.0%) | 45 (90.0%) |
| 15 Years | 6 (37.5%) | 11 (100.0%) |
| 16 and 17 Years | 13 (56.5%) | 16 (100.0%) |
| 18 to 24 Years | 112 (80.0%) | 14 (100.0%) |
| 25 to 34 Years | 116 (85.3%) | 182 (98.9%) |
| 35 to 44 Years | 165 (100.0%) | 179 (98.9%) |
| 45 to 54 Years | 67 (94.4%) | 38 (67.9%) |
| 55 to 64 Years | 83 (95.4%) | 124 (96.1%) |
| 65 to 74 Years | 85 (96.6%) | 66 (85.7%) |
| 75 Years and over | 15 (83.3%) | 41 (89.1%) |
| Total | 1,062 (92.2%) | 833 (94.3%) |
Income Below Poverty Among Married-Couple Families in Maineville
The poverty statistics for married-couple families in Maineville show that 0.5% or 2 of the total 370 families live below the poverty line. Families with 5 or more children have the highest poverty rate of 100.0%, comprising of 2 families. On the other hand, families with no children have the lowest poverty rate of 0.0%, which includes 0 families.
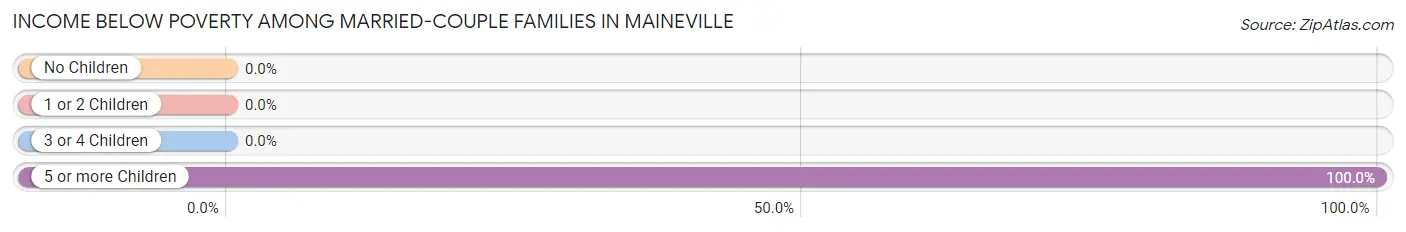
| Children | Above Poverty | Below Poverty |
| No Children | 154 (100.0%) | 0 (0.0%) |
| 1 or 2 Children | 142 (100.0%) | 0 (0.0%) |
| 3 or 4 Children | 72 (100.0%) | 0 (0.0%) |
| 5 or more Children | 0 (0.0%) | 2 (100.0%) |
| Total | 368 (99.5%) | 2 (0.5%) |
Income Below Poverty Among Single-Parent Households in Maineville
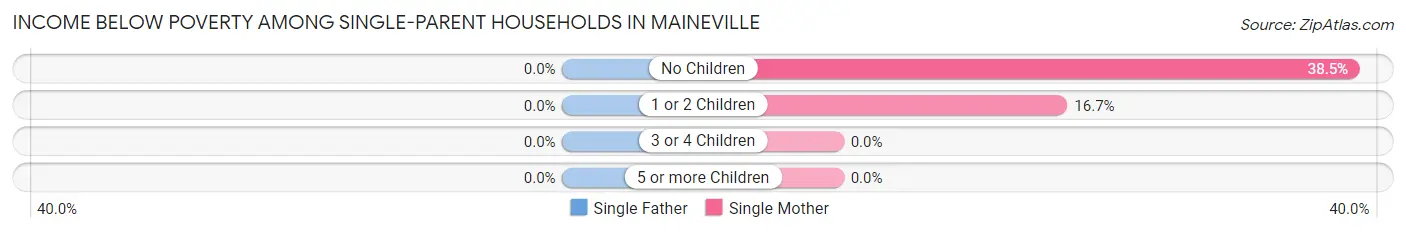
| Children | Single Father | Single Mother |
| No Children | 0 (0.0%) | 5 (38.5%) |
| 1 or 2 Children | 0 (0.0%) | 13 (16.7%) |
| 3 or 4 Children | 0 (0.0%) | 0 (0.0%) |
| 5 or more Children | 0 (0.0%) | 0 (0.0%) |
| Total | 0 (0.0%) | 18 (17.6%) |
Income Below Poverty Among Married-Couple vs Single-Parent Households in Maineville
The poverty data for Maineville shows that 2 of the married-couple family households (0.5%) and 18 of the single-parent households (15.4%) are living below the poverty level. Within the married-couple family households, those with 5 or more children have the highest poverty rate, with 2 households (100.0%) falling below the poverty line. Among the single-parent households, those with no children have the highest poverty rate, with 5 household (29.4%) living below poverty.
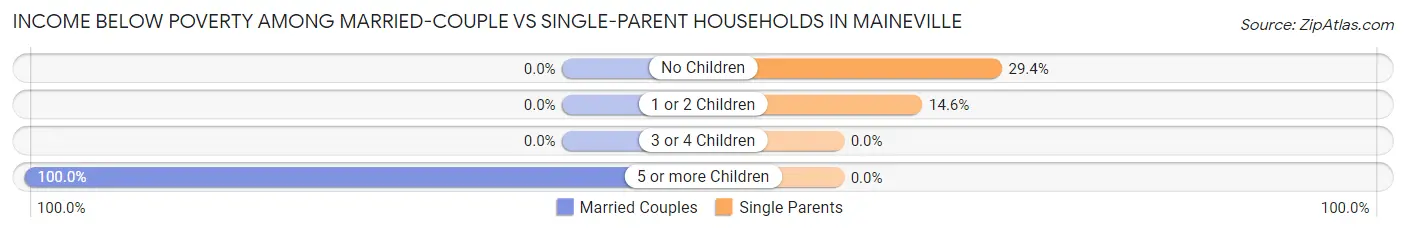
| Children | Married-Couple Families | Single-Parent Households |
| No Children | 0 (0.0%) | 5 (29.4%) |
| 1 or 2 Children | 0 (0.0%) | 13 (14.6%) |
| 3 or 4 Children | 0 (0.0%) | 0 (0.0%) |
| 5 or more Children | 2 (100.0%) | 0 (0.0%) |
| Total | 2 (0.5%) | 18 (15.4%) |
Race in Maineville
The most populous races in Maineville are White / Caucasian (1,934 | 94.0%), Hispanic or Latino (76 | 3.7%), and Two or more Races (62 | 3.0%).
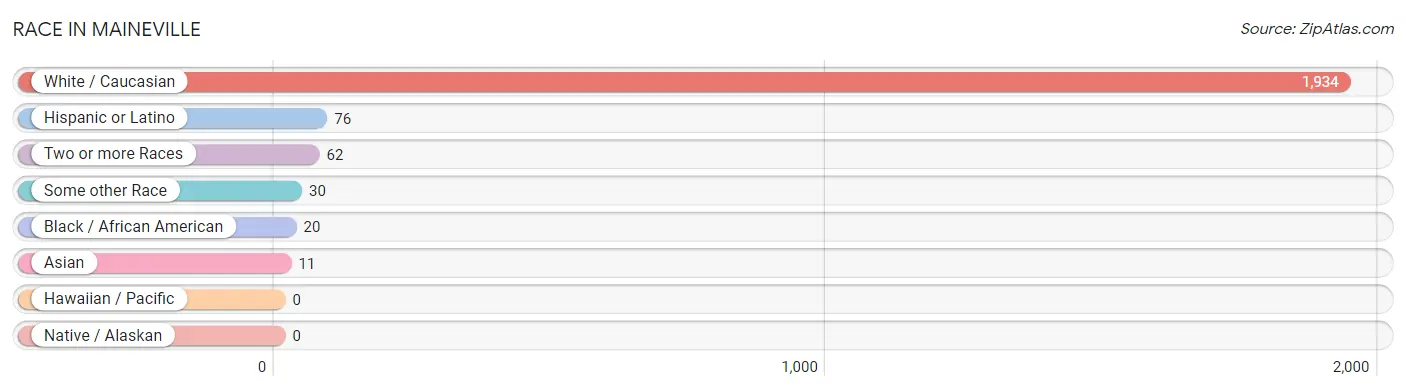
| Race | # Population | % Population |
| Asian | 11 | 0.5% |
| Black / African American | 20 | 1.0% |
| Hawaiian / Pacific | 0 | 0.0% |
| Hispanic or Latino | 76 | 3.7% |
| Native / Alaskan | 0 | 0.0% |
| White / Caucasian | 1,934 | 94.0% |
| Two or more Races | 62 | 3.0% |
| Some other Race | 30 | 1.5% |
| Total | 2,057 | 100.0% |
Ancestry in Maineville
The most populous ancestries reported in Maineville are German (665 | 32.3%), Italian (387 | 18.8%), Irish (345 | 16.8%), English (206 | 10.0%), and Scottish (106 | 5.1%), together accounting for 83.1% of all Maineville residents.
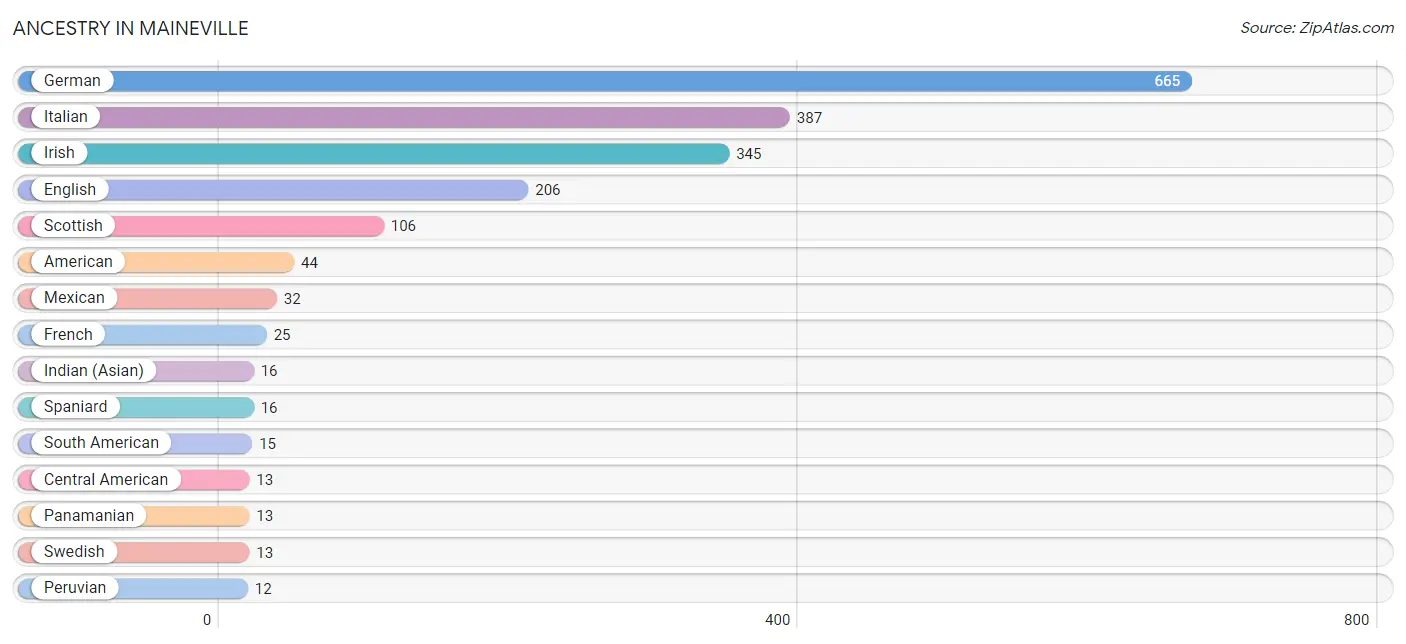
| Ancestry | # Population | % Population |
| American | 44 | 2.1% |
| Bangladeshi | 4 | 0.2% |
| British | 11 | 0.5% |
| Central American | 13 | 0.6% |
| Cherokee | 2 | 0.1% |
| Czech | 4 | 0.2% |
| Dutch | 7 | 0.3% |
| Ecuadorian | 3 | 0.2% |
| English | 206 | 10.0% |
| European | 3 | 0.2% |
| French | 25 | 1.2% |
| German | 665 | 32.3% |
| Greek | 6 | 0.3% |
| Hungarian | 3 | 0.2% |
| Indian (Asian) | 16 | 0.8% |
| Irish | 345 | 16.8% |
| Italian | 387 | 18.8% |
| Mexican | 32 | 1.6% |
| Norwegian | 3 | 0.2% |
| Panamanian | 13 | 0.6% |
| Peruvian | 12 | 0.6% |
| Polish | 8 | 0.4% |
| Portuguese | 4 | 0.2% |
| Romanian | 6 | 0.3% |
| Russian | 5 | 0.2% |
| Scotch-Irish | 3 | 0.2% |
| Scottish | 106 | 5.1% |
| South American | 15 | 0.7% |
| Spaniard | 16 | 0.8% |
| Swedish | 13 | 0.6% |
| Ukrainian | 3 | 0.2% |
| Welsh | 7 | 0.3% | View All 32 Rows |
Immigrants in Maineville
The most numerous immigrant groups reported in Maineville came from Europe (46 | 2.2%), Eastern Europe (44 | 2.1%), Russia (35 | 1.7%), Latin America (30 | 1.5%), and Central America (20 | 1.0%), together accounting for 8.5% of all Maineville residents.
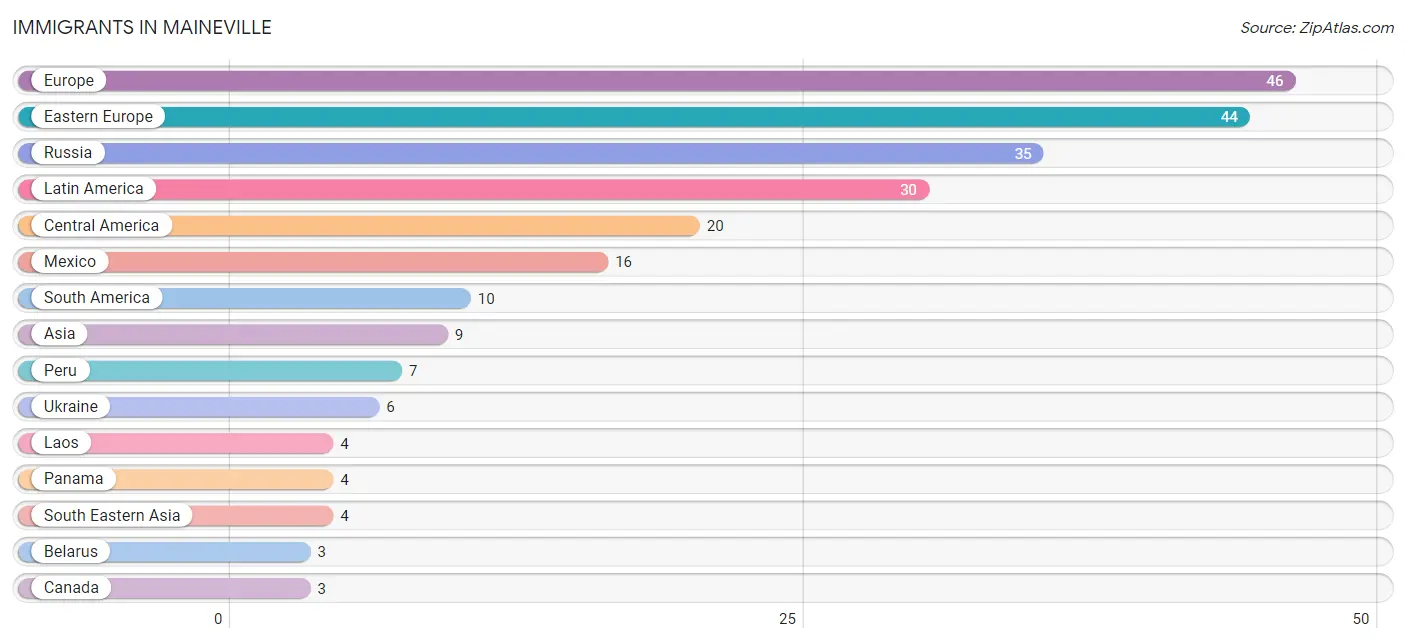
| Immigration Origin | # Population | % Population |
| Asia | 9 | 0.4% |
| Belarus | 3 | 0.2% |
| Canada | 3 | 0.2% |
| Central America | 20 | 1.0% |
| China | 3 | 0.2% |
| Eastern Asia | 3 | 0.2% |
| Eastern Europe | 44 | 2.1% |
| Ecuador | 3 | 0.2% |
| Europe | 46 | 2.2% |
| Greece | 2 | 0.1% |
| Laos | 4 | 0.2% |
| Latin America | 30 | 1.5% |
| Mexico | 16 | 0.8% |
| Panama | 4 | 0.2% |
| Peru | 7 | 0.3% |
| Russia | 35 | 1.7% |
| South America | 10 | 0.5% |
| South Eastern Asia | 4 | 0.2% |
| Southern Europe | 2 | 0.1% |
| Ukraine | 6 | 0.3% |
| Western Asia | 2 | 0.1% | View All 21 Rows |
Sex and Age in Maineville
Sex and Age in Maineville
The most populous age groups in Maineville are Under 5 Years (211 | 18.3%) for men and 25 to 29 Years (147 | 16.2%) for women.
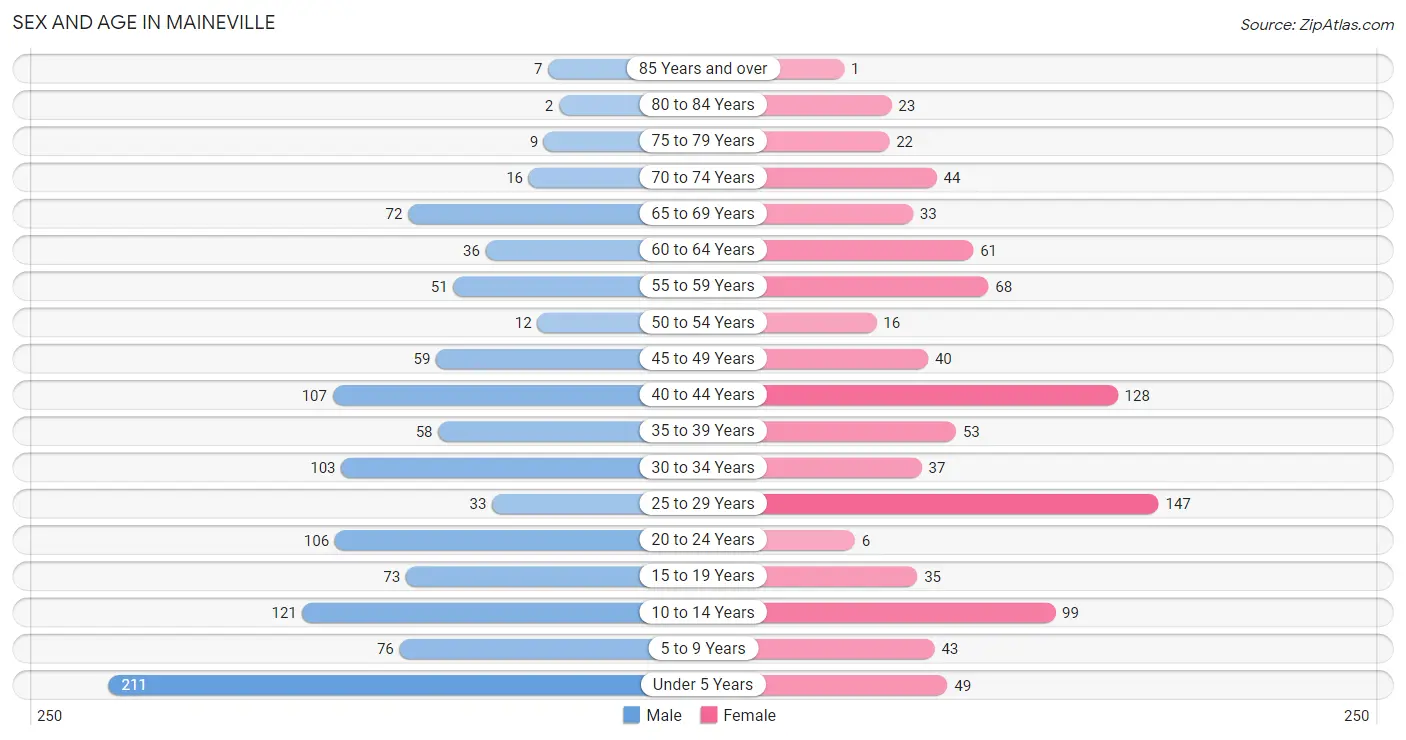
| Age Bracket | Male | Female |
| Under 5 Years | 211 (18.3%) | 49 (5.4%) |
| 5 to 9 Years | 76 (6.6%) | 43 (4.8%) |
| 10 to 14 Years | 121 (10.5%) | 99 (10.9%) |
| 15 to 19 Years | 73 (6.3%) | 35 (3.9%) |
| 20 to 24 Years | 106 (9.2%) | 6 (0.7%) |
| 25 to 29 Years | 33 (2.9%) | 147 (16.2%) |
| 30 to 34 Years | 103 (8.9%) | 37 (4.1%) |
| 35 to 39 Years | 58 (5.0%) | 53 (5.9%) |
| 40 to 44 Years | 107 (9.3%) | 128 (14.1%) |
| 45 to 49 Years | 59 (5.1%) | 40 (4.4%) |
| 50 to 54 Years | 12 (1.0%) | 16 (1.8%) |
| 55 to 59 Years | 51 (4.4%) | 68 (7.5%) |
| 60 to 64 Years | 36 (3.1%) | 61 (6.7%) |
| 65 to 69 Years | 72 (6.2%) | 33 (3.6%) |
| 70 to 74 Years | 16 (1.4%) | 44 (4.9%) |
| 75 to 79 Years | 9 (0.8%) | 22 (2.4%) |
| 80 to 84 Years | 2 (0.2%) | 23 (2.5%) |
| 85 Years and over | 7 (0.6%) | 1 (0.1%) |
| Total | 1,152 (100.0%) | 905 (100.0%) |
Families and Households in Maineville
Median Family Size in Maineville
The median family size in Maineville is 3.58 persons per family, with married-couple families (370 | 76.0%) accounting for the largest median family size of 3.84 persons per family. On the other hand, single male/father families (15 | 3.1%) represent the smallest median family size with 2.40 persons per family.
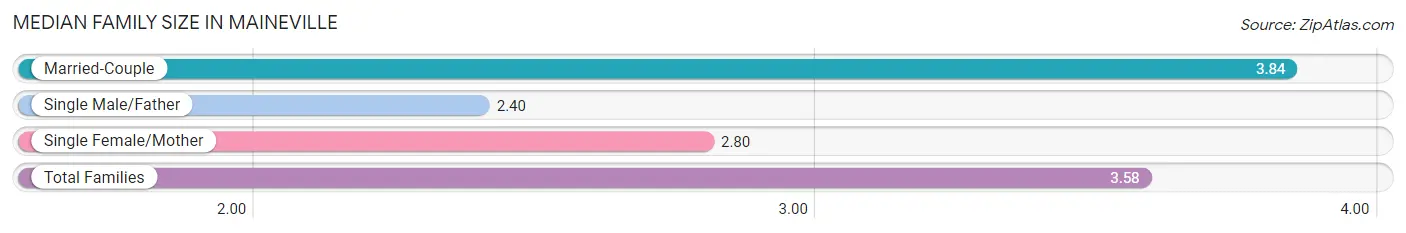
| Family Type | # Families | Family Size |
| Married-Couple | 370 (76.0%) | 3.84 |
| Single Male/Father | 15 (3.1%) | 2.40 |
| Single Female/Mother | 102 (20.9%) | 2.80 |
| Total Families | 487 (100.0%) | 3.58 |
Median Household Size in Maineville
The median household size in Maineville is 3.10 persons per household, with married-couple households (370 | 56.0%) accounting for the largest median household size of 3.91 persons per household. non-family households (174 | 26.3%) represent the smallest median household size with 1.29 persons per household.
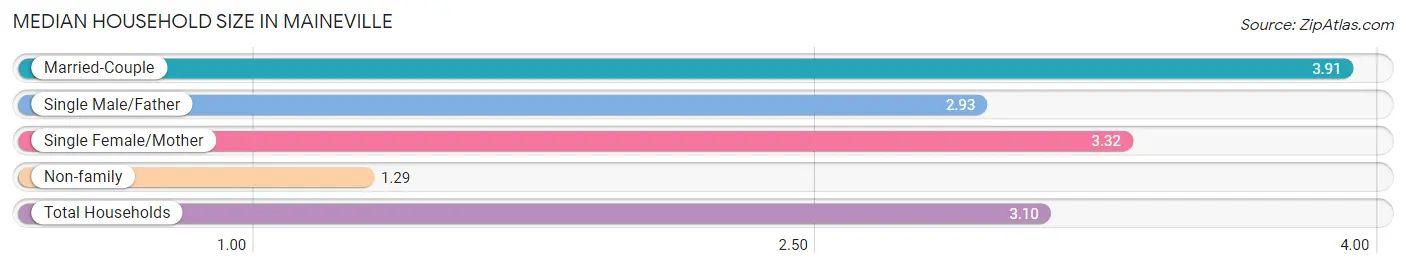
| Household Type | # Households | Household Size |
| Married-Couple | 370 (56.0%) | 3.91 |
| Single Male/Father | 15 (2.3%) | 2.93 |
| Single Female/Mother | 102 (15.4%) | 3.32 |
| Non-family | 174 (26.3%) | 1.29 |
| Total Households | 661 (100.0%) | 3.10 |
Household Size by Marriage Status in Maineville
Out of a total of 661 households in Maineville, 487 (73.7%) are family households, while 174 (26.3%) are nonfamily households. The most numerous type of family households are 3-person households, comprising 141, and the most common type of nonfamily households are 1-person households, comprising 144.
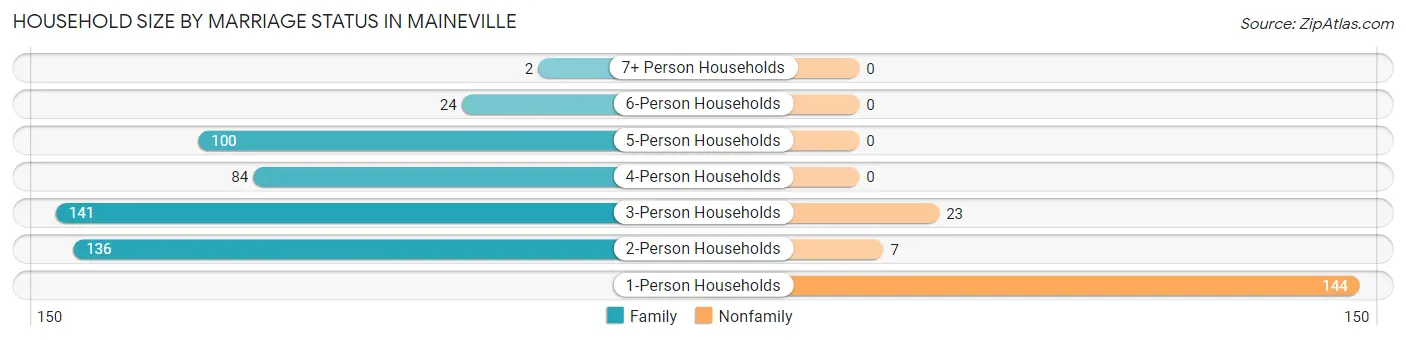
| Household Size | Family Households | Nonfamily Households |
| 1-Person Households | - | 144 (21.8%) |
| 2-Person Households | 136 (20.6%) | 7 (1.1%) |
| 3-Person Households | 141 (21.3%) | 23 (3.5%) |
| 4-Person Households | 84 (12.7%) | 0 (0.0%) |
| 5-Person Households | 100 (15.1%) | 0 (0.0%) |
| 6-Person Households | 24 (3.6%) | 0 (0.0%) |
| 7+ Person Households | 2 (0.3%) | 0 (0.0%) |
| Total | 487 (73.7%) | 174 (26.3%) |
Female Fertility in Maineville
Fertility by Age in Maineville
| Age Bracket | Women with Births | Births / 1,000 Women |
| 15 to 19 years | 0 (0.0%) | 0.0 |
| 20 to 34 years | 0 (0.0%) | 0.0 |
| 35 to 50 years | 0 (0.0%) | 0.0 |
| Total | 0 (0.0%) | 0.0 |
Fertility by Age by Marriage Status in Maineville
| Age Bracket | Married | Unmarried |
| 15 to 19 years | 0 (0.0%) | 0 (0.0%) |
| 20 to 34 years | 0 (0.0%) | 0 (0.0%) |
| 35 to 50 years | 0 (0.0%) | 0 (0.0%) |
| Total | 0 (0.0%) | 0 (0.0%) |
Fertility by Education in Maineville
| Educational Attainment | Women with Births | Births / 1,000 Women |
| Less than High School | 0 (0.0%) | 0.0 |
| High School Diploma | 0 (0.0%) | 0.0 |
| College or Associate's Degree | 0 (0.0%) | 0.0 |
| Bachelor's Degree | 0 (0.0%) | 0.0 |
| Graduate Degree | 0 (0.0%) | 0.0 |
| Total | 0 (0.0%) | 0.0 |
Fertility by Education by Marriage Status in Maineville
| Educational Attainment | Married | Unmarried |
| Less than High School | 0 (0.0%) | 0 (0.0%) |
| High School Diploma | 0 (0.0%) | 0 (0.0%) |
| College or Associate's Degree | 0 (0.0%) | 0 (0.0%) |
| Bachelor's Degree | 0 (0.0%) | 0 (0.0%) |
| Graduate Degree | 0 (0.0%) | 0 (0.0%) |
| Total | 0 (0.0%) | 0 (0.0%) |
Employment Characteristics in Maineville
Employment by Class of Employer in Maineville
Among the 883 employed individuals in Maineville, private company employees (693 | 78.5%), local government employees (106 | 12.0%), and self-employed (not incorporated) (49 | 5.6%) make up the most common classes of employment.
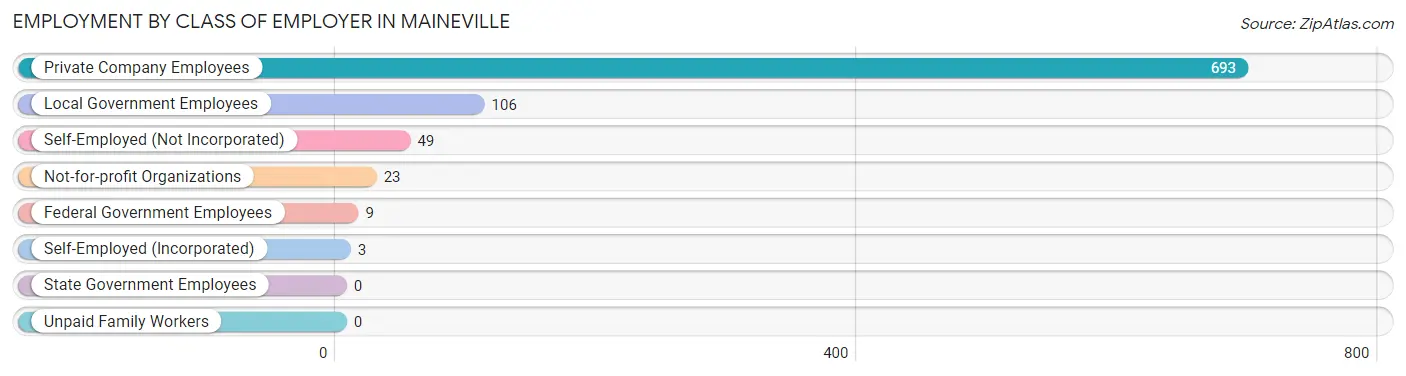
| Employer Class | # Employees | % Employees |
| Private Company Employees | 693 | 78.5% |
| Self-Employed (Incorporated) | 3 | 0.3% |
| Self-Employed (Not Incorporated) | 49 | 5.6% |
| Not-for-profit Organizations | 23 | 2.6% |
| Local Government Employees | 106 | 12.0% |
| State Government Employees | 0 | 0.0% |
| Federal Government Employees | 9 | 1.0% |
| Unpaid Family Workers | 0 | 0.0% |
| Total | 883 | 100.0% |
Employment Status by Age in Maineville
According to the labor force statistics for Maineville, out of the total population over 16 years of age (1,431), 63.7% or 912 individuals are in the labor force, with 3.0% or 27 of them unemployed. The age group with the highest labor force participation rate is 35 to 44 years, with 92.2% or 319 individuals in the labor force. Within the labor force, the 16 to 19 years age range has the highest percentage of unemployed individuals, with 25.5% or 13 of them being unemployed.
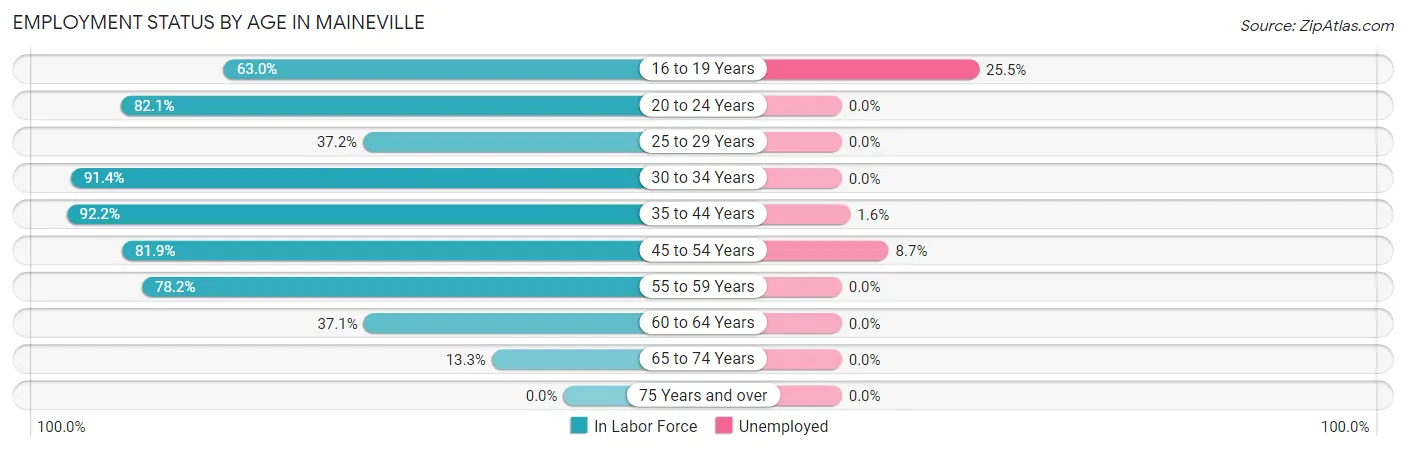
| Age Bracket | In Labor Force | Unemployed |
| 16 to 19 Years | 51 (63.0%) | 13 (25.5%) |
| 20 to 24 Years | 92 (82.1%) | 0 (0.0%) |
| 25 to 29 Years | 67 (37.2%) | 0 (0.0%) |
| 30 to 34 Years | 128 (91.4%) | 0 (0.0%) |
| 35 to 44 Years | 319 (92.2%) | 5 (1.6%) |
| 45 to 54 Years | 104 (81.9%) | 9 (8.7%) |
| 55 to 59 Years | 93 (78.2%) | 0 (0.0%) |
| 60 to 64 Years | 36 (37.1%) | 0 (0.0%) |
| 65 to 74 Years | 22 (13.3%) | 0 (0.0%) |
| 75 Years and over | 0 (0.0%) | 0 (0.0%) |
| Total | 912 (63.7%) | 27 (3.0%) |
Employment Status by Educational Attainment in Maineville
According to labor force statistics for Maineville, 74.0% of individuals (747) out of the total population between 25 and 64 years of age (1,009) are in the labor force, with 1.9% or 14 of them being unemployed. The group with the highest labor force participation rate are those with the educational attainment of bachelor's degree or higher, with 86.6% or 245 individuals in the labor force. Within the labor force, individuals with less than high school education have the highest percentage of unemployment, with 33.3% or 5 of them being unemployed.
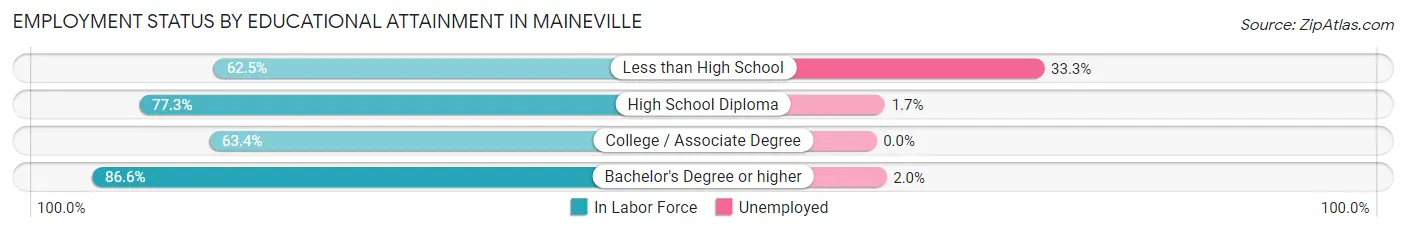
| Educational Attainment | In Labor Force | Unemployed |
| Less than High School | 15 (62.5%) | 8 (33.3%) |
| High School Diploma | 232 (77.3%) | 5 (1.7%) |
| College / Associate Degree | 255 (63.4%) | 0 (0.0%) |
| Bachelor's Degree or higher | 245 (86.6%) | 6 (2.0%) |
| Total | 747 (74.0%) | 19 (1.9%) |
Employment Occupations by Sex in Maineville
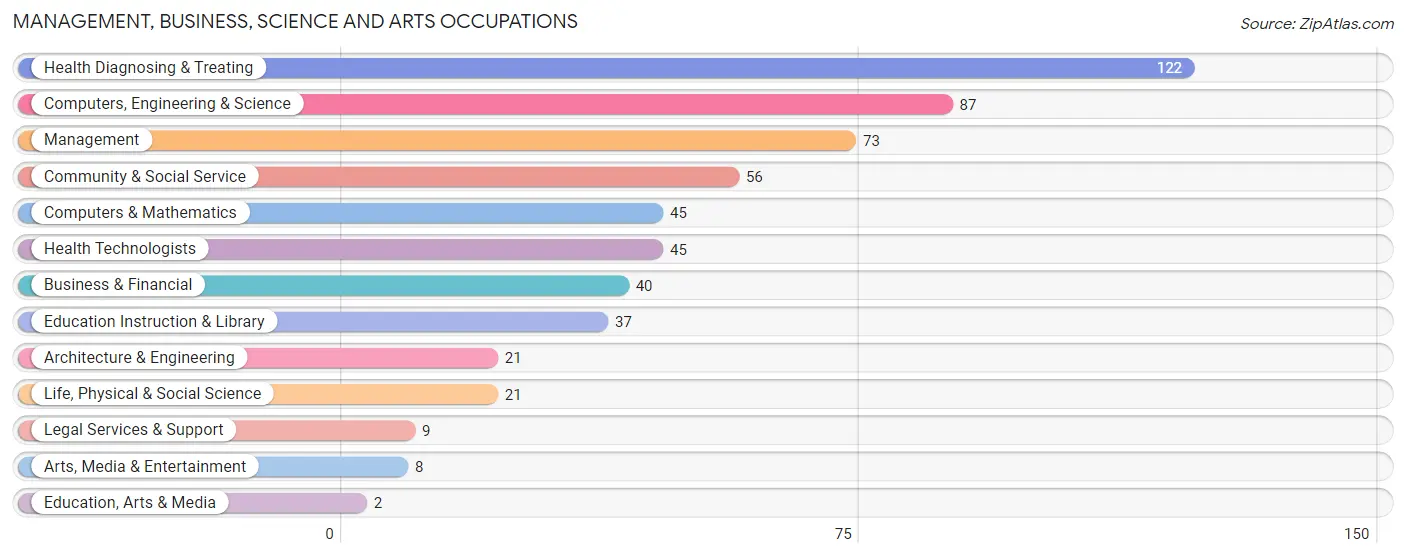
Management, Business, Science and Arts Occupations
The most common Management, Business, Science and Arts occupations in Maineville are Health Diagnosing & Treating (122 | 13.9%), Computers, Engineering & Science (87 | 9.9%), Management (73 | 8.3%), Community & Social Service (56 | 6.4%), and Computers & Mathematics (45 | 5.1%).
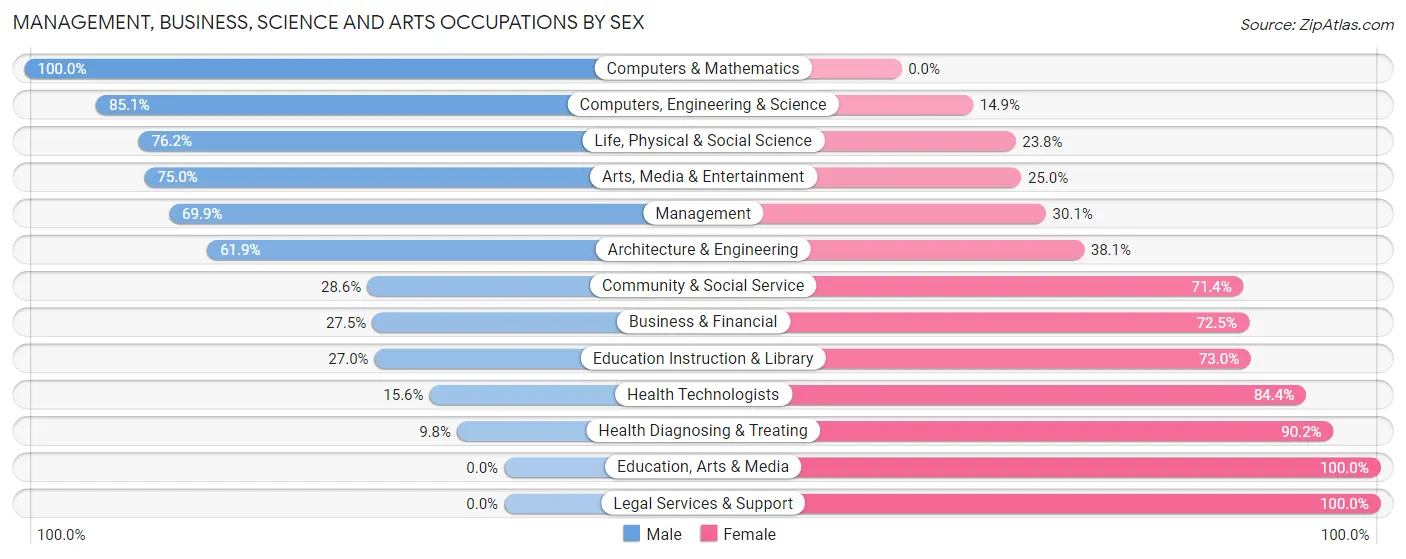
Management, Business, Science and Arts Occupations by Sex
Within the Management, Business, Science and Arts occupations in Maineville, the most male-oriented occupations are Computers & Mathematics (100.0%), Computers, Engineering & Science (85.1%), and Life, Physical & Social Science (76.2%), while the most female-oriented occupations are Education, Arts & Media (100.0%), Legal Services & Support (100.0%), and Health Diagnosing & Treating (90.2%).
| Occupation | Male | Female |
| Management | 51 (69.9%) | 22 (30.1%) |
| Business & Financial | 11 (27.5%) | 29 (72.5%) |
| Computers, Engineering & Science | 74 (85.1%) | 13 (14.9%) |
| Computers & Mathematics | 45 (100.0%) | 0 (0.0%) |
| Architecture & Engineering | 13 (61.9%) | 8 (38.1%) |
| Life, Physical & Social Science | 16 (76.2%) | 5 (23.8%) |
| Community & Social Service | 16 (28.6%) | 40 (71.4%) |
| Education, Arts & Media | 0 (0.0%) | 2 (100.0%) |
| Legal Services & Support | 0 (0.0%) | 9 (100.0%) |
| Education Instruction & Library | 10 (27.0%) | 27 (73.0%) |
| Arts, Media & Entertainment | 6 (75.0%) | 2 (25.0%) |
| Health Diagnosing & Treating | 12 (9.8%) | 110 (90.2%) |
| Health Technologists | 7 (15.6%) | 38 (84.4%) |
| Total (Category) | 164 (43.4%) | 214 (56.6%) |
| Total (Overall) | 518 (58.8%) | 363 (41.2%) |
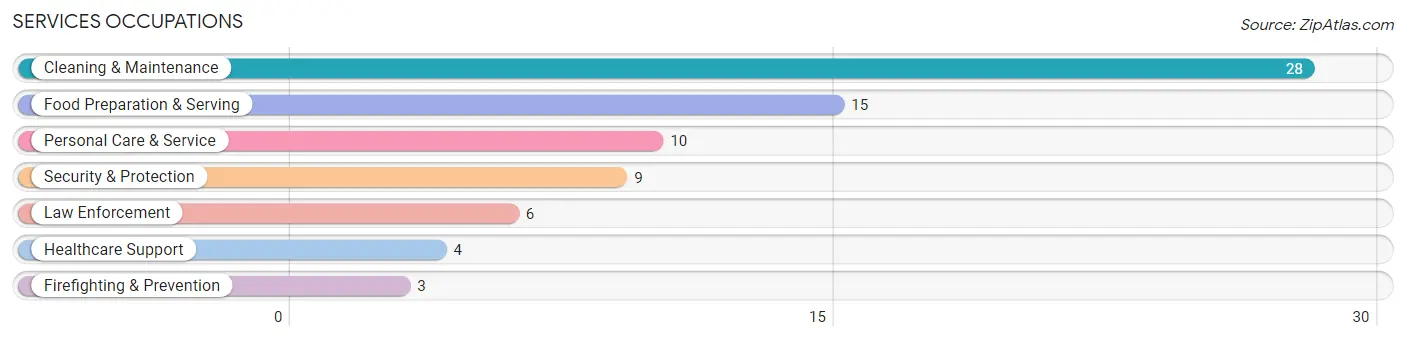
Services Occupations
The most common Services occupations in Maineville are Cleaning & Maintenance (28 | 3.2%), Food Preparation & Serving (15 | 1.7%), Personal Care & Service (10 | 1.1%), Security & Protection (9 | 1.0%), and Law Enforcement (6 | 0.7%).
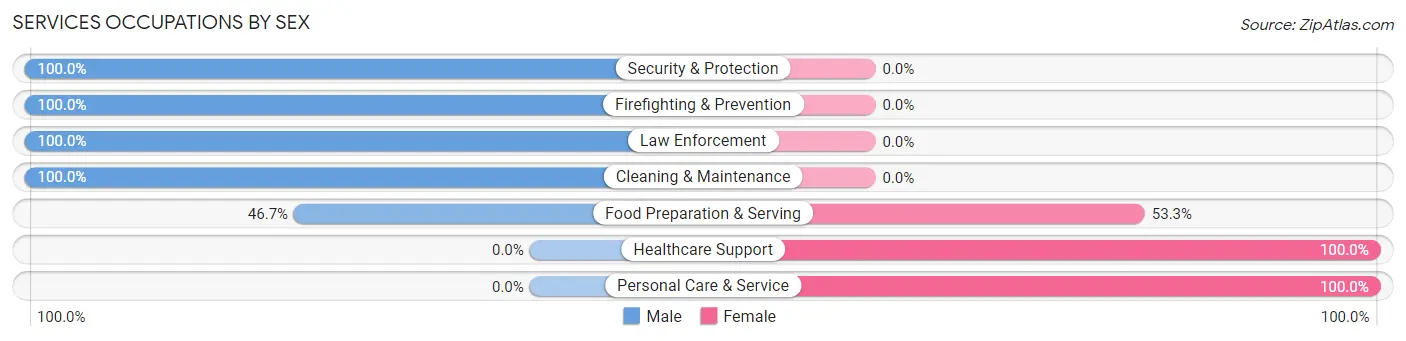
Services Occupations by Sex
Within the Services occupations in Maineville, the most male-oriented occupations are Security & Protection (100.0%), Firefighting & Prevention (100.0%), and Law Enforcement (100.0%), while the most female-oriented occupations are Healthcare Support (100.0%), Personal Care & Service (100.0%), and Food Preparation & Serving (53.3%).
| Occupation | Male | Female |
| Healthcare Support | 0 (0.0%) | 4 (100.0%) |
| Security & Protection | 9 (100.0%) | 0 (0.0%) |
| Firefighting & Prevention | 3 (100.0%) | 0 (0.0%) |
| Law Enforcement | 6 (100.0%) | 0 (0.0%) |
| Food Preparation & Serving | 7 (46.7%) | 8 (53.3%) |
| Cleaning & Maintenance | 28 (100.0%) | 0 (0.0%) |
| Personal Care & Service | 0 (0.0%) | 10 (100.0%) |
| Total (Category) | 44 (66.7%) | 22 (33.3%) |
| Total (Overall) | 518 (58.8%) | 363 (41.2%) |
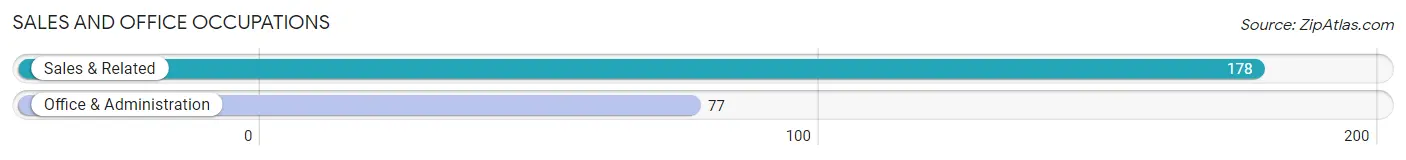
Sales and Office Occupations
The most common Sales and Office occupations in Maineville are Sales & Related (178 | 20.2%), and Office & Administration (77 | 8.7%).
Sales and Office Occupations by Sex
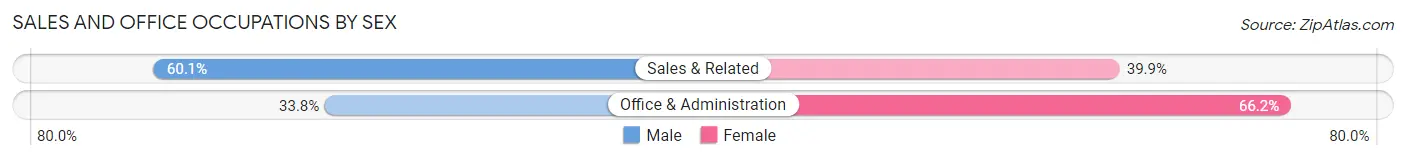
| Occupation | Male | Female |
| Sales & Related | 107 (60.1%) | 71 (39.9%) |
| Office & Administration | 26 (33.8%) | 51 (66.2%) |
| Total (Category) | 133 (52.2%) | 122 (47.8%) |
| Total (Overall) | 518 (58.8%) | 363 (41.2%) |
Natural Resources, Construction and Maintenance Occupations
The most common Natural Resources, Construction and Maintenance occupations in Maineville are Installation, Maintenance & Repair (20 | 2.3%), and Construction & Extraction (15 | 1.7%).

Natural Resources, Construction and Maintenance Occupations by Sex
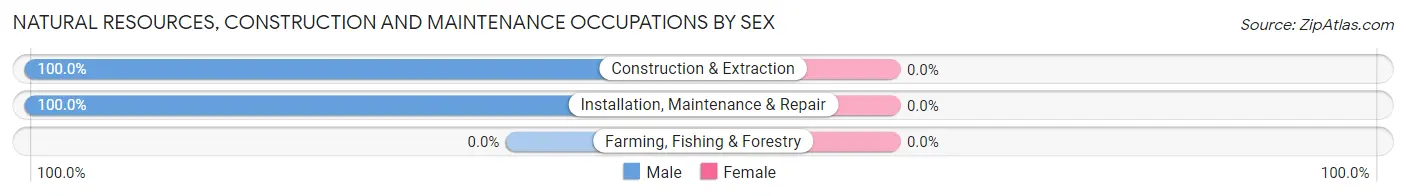
| Occupation | Male | Female |
| Farming, Fishing & Forestry | 0 (0.0%) | 0 (0.0%) |
| Construction & Extraction | 15 (100.0%) | 0 (0.0%) |
| Installation, Maintenance & Repair | 20 (100.0%) | 0 (0.0%) |
| Total (Category) | 35 (100.0%) | 0 (0.0%) |
| Total (Overall) | 518 (58.8%) | 363 (41.2%) |
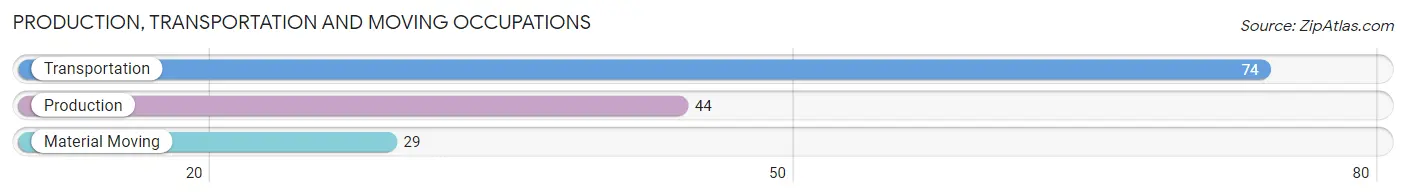
Production, Transportation and Moving Occupations
The most common Production, Transportation and Moving occupations in Maineville are Transportation (74 | 8.4%), Production (44 | 5.0%), and Material Moving (29 | 3.3%).
Production, Transportation and Moving Occupations by Sex
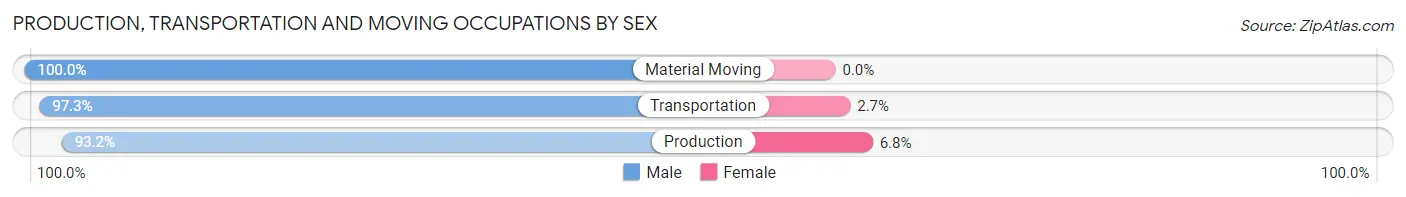
| Occupation | Male | Female |
| Production | 41 (93.2%) | 3 (6.8%) |
| Transportation | 72 (97.3%) | 2 (2.7%) |
| Material Moving | 29 (100.0%) | 0 (0.0%) |
| Total (Category) | 142 (96.6%) | 5 (3.4%) |
| Total (Overall) | 518 (58.8%) | 363 (41.2%) |
Employment Industries by Sex in Maineville
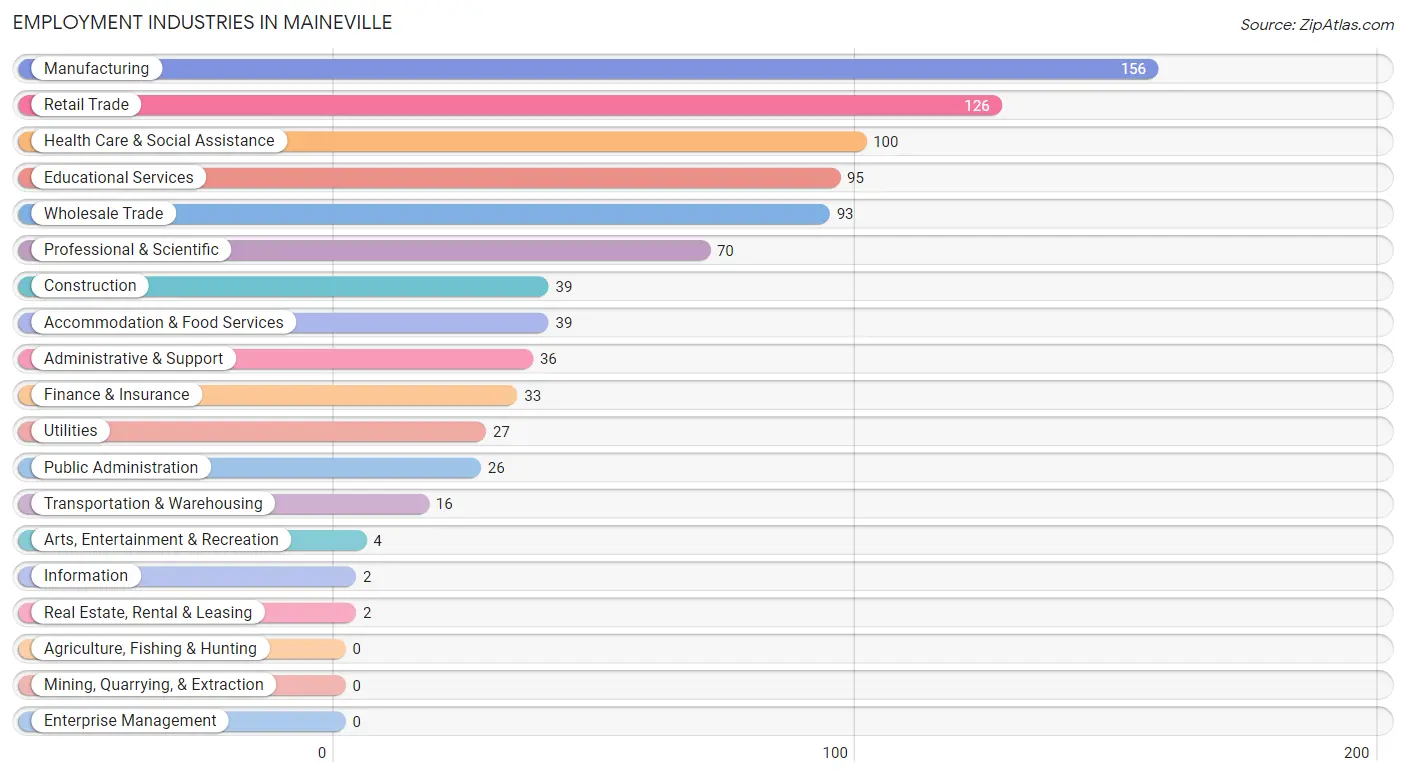
Employment Industries in Maineville
The major employment industries in Maineville include Manufacturing (156 | 17.7%), Retail Trade (126 | 14.3%), Health Care & Social Assistance (100 | 11.4%), Educational Services (95 | 10.8%), and Wholesale Trade (93 | 10.6%).
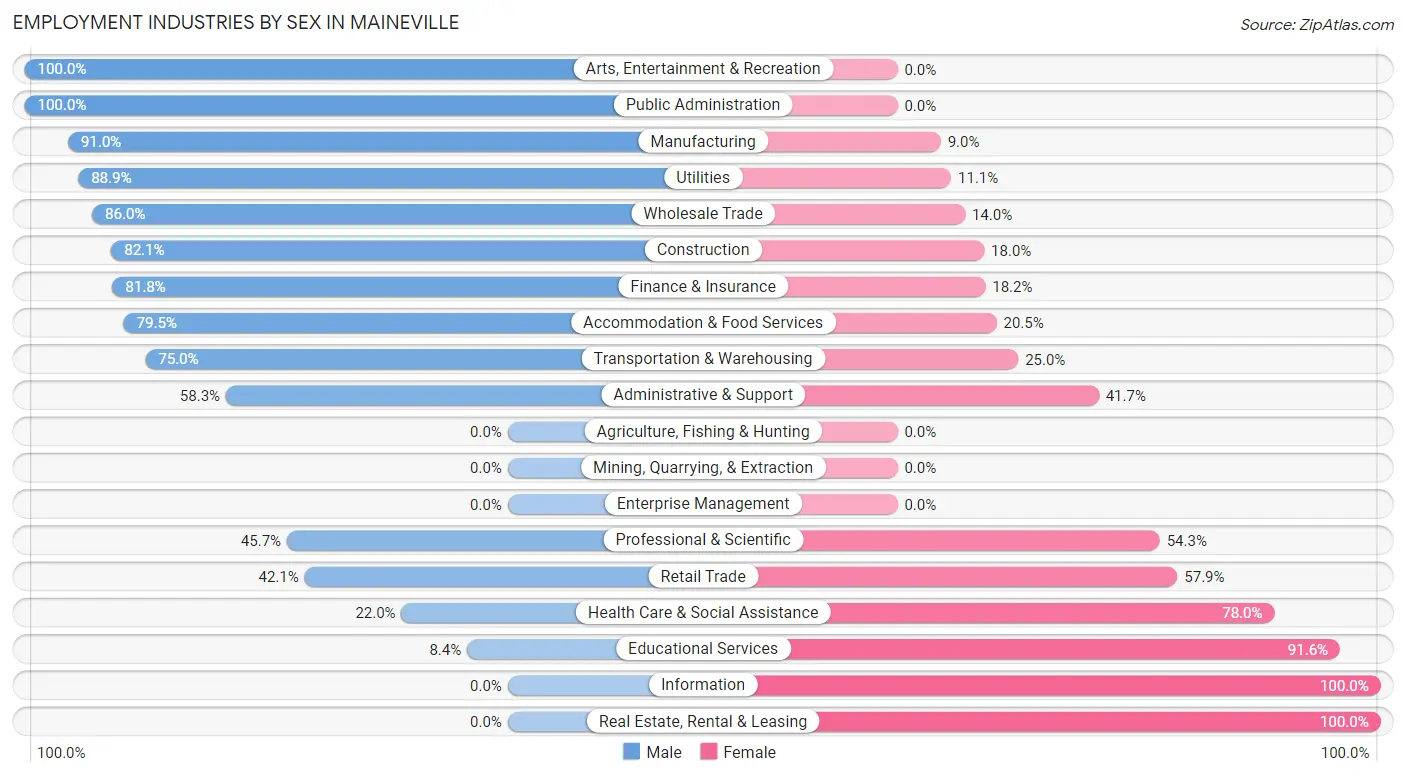
Employment Industries by Sex in Maineville
The Maineville industries that see more men than women are Arts, Entertainment & Recreation (100.0%), Public Administration (100.0%), and Manufacturing (91.0%), whereas the industries that tend to have a higher number of women are Information (100.0%), Real Estate, Rental & Leasing (100.0%), and Educational Services (91.6%).
| Industry | Male | Female |
| Agriculture, Fishing & Hunting | 0 (0.0%) | 0 (0.0%) |
| Mining, Quarrying, & Extraction | 0 (0.0%) | 0 (0.0%) |
| Construction | 32 (82.1%) | 7 (17.9%) |
| Manufacturing | 142 (91.0%) | 14 (9.0%) |
| Wholesale Trade | 80 (86.0%) | 13 (14.0%) |
| Retail Trade | 53 (42.1%) | 73 (57.9%) |
| Transportation & Warehousing | 12 (75.0%) | 4 (25.0%) |
| Utilities | 24 (88.9%) | 3 (11.1%) |
| Information | 0 (0.0%) | 2 (100.0%) |
| Finance & Insurance | 27 (81.8%) | 6 (18.2%) |
| Real Estate, Rental & Leasing | 0 (0.0%) | 2 (100.0%) |
| Professional & Scientific | 32 (45.7%) | 38 (54.3%) |
| Enterprise Management | 0 (0.0%) | 0 (0.0%) |
| Administrative & Support | 21 (58.3%) | 15 (41.7%) |
| Educational Services | 8 (8.4%) | 87 (91.6%) |
| Health Care & Social Assistance | 22 (22.0%) | 78 (78.0%) |
| Arts, Entertainment & Recreation | 4 (100.0%) | 0 (0.0%) |
| Accommodation & Food Services | 31 (79.5%) | 8 (20.5%) |
| Public Administration | 26 (100.0%) | 0 (0.0%) |
| Total | 518 (58.8%) | 363 (41.2%) |
Education in Maineville
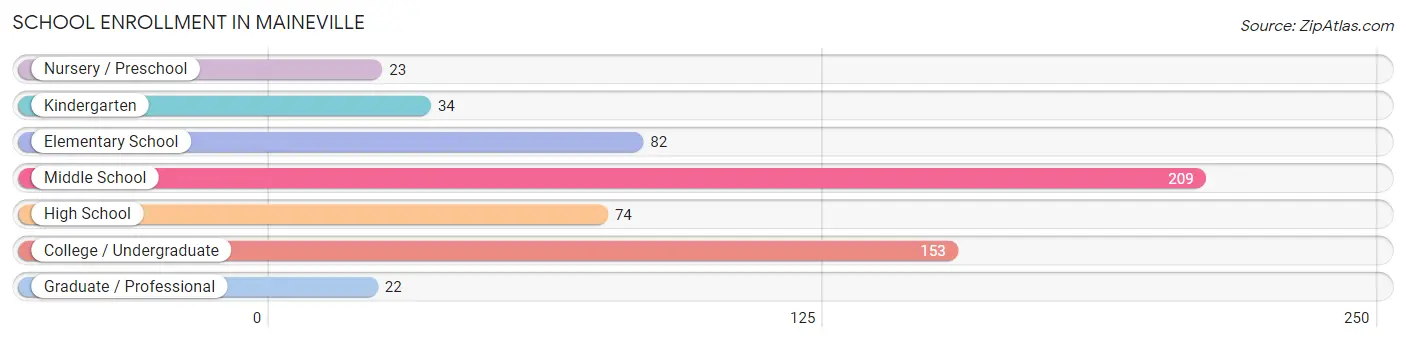
School Enrollment in Maineville
The most common levels of schooling among the 597 students in Maineville are middle school (209 | 35.0%), college / undergraduate (153 | 25.6%), and elementary school (82 | 13.7%).
| School Level | # Students | % Students |
| Nursery / Preschool | 23 | 3.8% |
| Kindergarten | 34 | 5.7% |
| Elementary School | 82 | 13.7% |
| Middle School | 209 | 35.0% |
| High School | 74 | 12.4% |
| College / Undergraduate | 153 | 25.6% |
| Graduate / Professional | 22 | 3.7% |
| Total | 597 | 100.0% |
School Enrollment by Age by Funding Source in Maineville
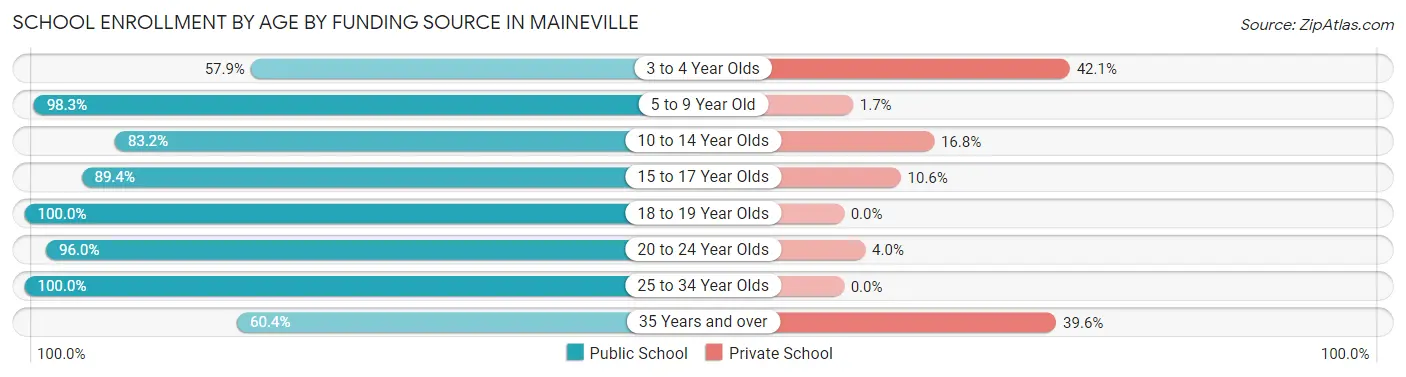
Out of a total of 597 students who are enrolled in schools in Maineville, 94 (15.7%) attend a private institution, while the remaining 503 (84.3%) are enrolled in public schools. The age group of 3 to 4 year olds has the highest likelihood of being enrolled in private schools, with 8 (42.1% in the age bracket) enrolled. Conversely, the age group of 18 to 19 year olds has the lowest likelihood of being enrolled in a private school, with 23 (100.0% in the age bracket) attending a public institution.
| Age Bracket | Public School | Private School |
| 3 to 4 Year Olds | 11 (57.9%) | 8 (42.1%) |
| 5 to 9 Year Old | 115 (98.3%) | 2 (1.7%) |
| 10 to 14 Year Olds | 183 (83.2%) | 37 (16.8%) |
| 15 to 17 Year Olds | 59 (89.4%) | 7 (10.6%) |
| 18 to 19 Year Olds | 23 (100.0%) | 0 (0.0%) |
| 20 to 24 Year Olds | 48 (96.0%) | 2 (4.0%) |
| 25 to 34 Year Olds | 6 (100.0%) | 0 (0.0%) |
| 35 Years and over | 58 (60.4%) | 38 (39.6%) |
| Total | 503 (84.3%) | 94 (15.7%) |
Educational Attainment by Field of Study in Maineville
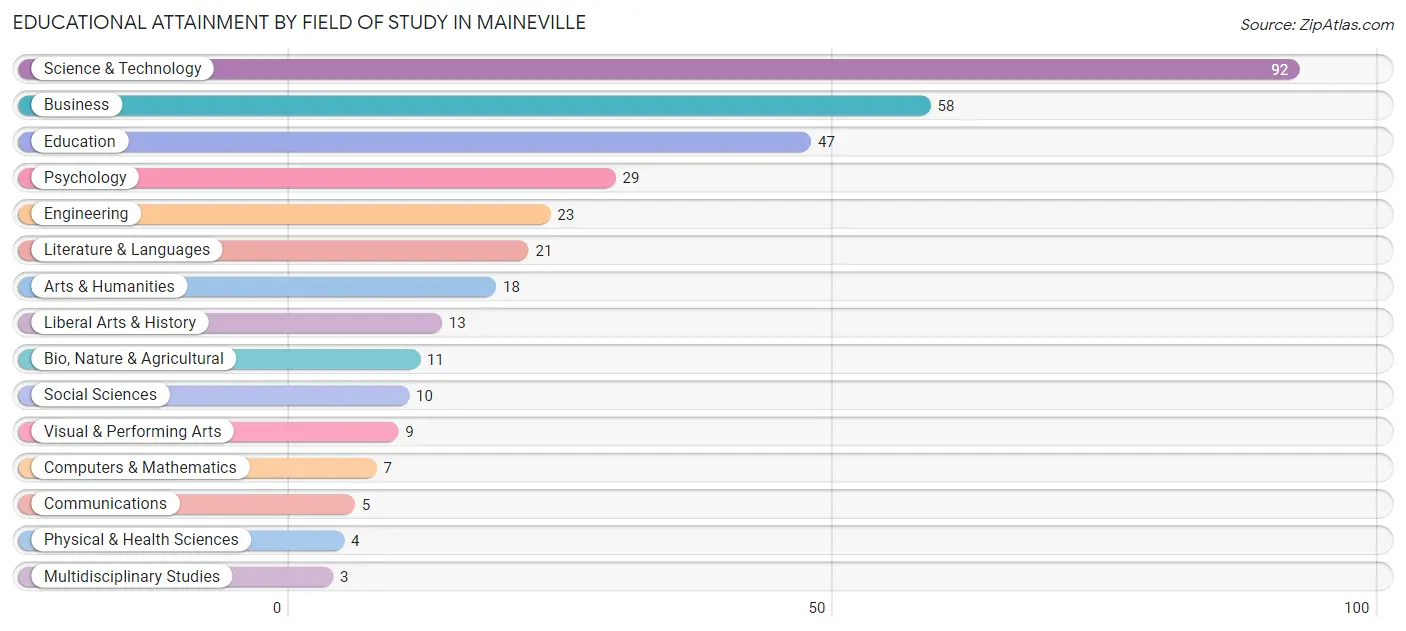
Science & technology (92 | 26.3%), business (58 | 16.6%), education (47 | 13.4%), psychology (29 | 8.3%), and engineering (23 | 6.6%) are the most common fields of study among 350 individuals in Maineville who have obtained a bachelor's degree or higher.
| Field of Study | # Graduates | % Graduates |
| Computers & Mathematics | 7 | 2.0% |
| Bio, Nature & Agricultural | 11 | 3.1% |
| Physical & Health Sciences | 4 | 1.1% |
| Psychology | 29 | 8.3% |
| Social Sciences | 10 | 2.9% |
| Engineering | 23 | 6.6% |
| Multidisciplinary Studies | 3 | 0.9% |
| Science & Technology | 92 | 26.3% |
| Business | 58 | 16.6% |
| Education | 47 | 13.4% |
| Literature & Languages | 21 | 6.0% |
| Liberal Arts & History | 13 | 3.7% |
| Visual & Performing Arts | 9 | 2.6% |
| Communications | 5 | 1.4% |
| Arts & Humanities | 18 | 5.1% |
| Total | 350 | 100.0% |
Transportation & Commute in Maineville
Vehicle Availability by Sex in Maineville
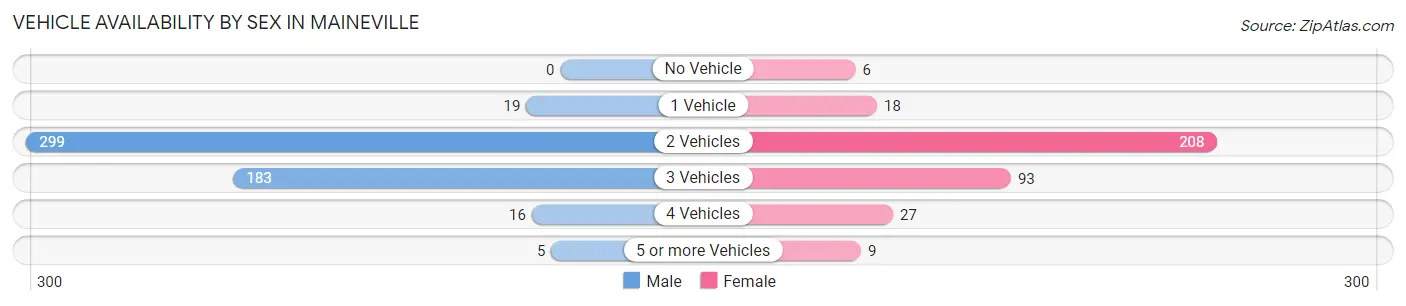
The most prevalent vehicle ownership categories in Maineville are males with 2 vehicles (299, accounting for 57.3%) and females with 2 vehicles (208, making up 82.8%).
| Vehicles Available | Male | Female |
| No Vehicle | 0 (0.0%) | 6 (1.7%) |
| 1 Vehicle | 19 (3.6%) | 18 (5.0%) |
| 2 Vehicles | 299 (57.3%) | 208 (57.6%) |
| 3 Vehicles | 183 (35.1%) | 93 (25.8%) |
| 4 Vehicles | 16 (3.1%) | 27 (7.5%) |
| 5 or more Vehicles | 5 (1.0%) | 9 (2.5%) |
| Total | 522 (100.0%) | 361 (100.0%) |
Commute Time in Maineville
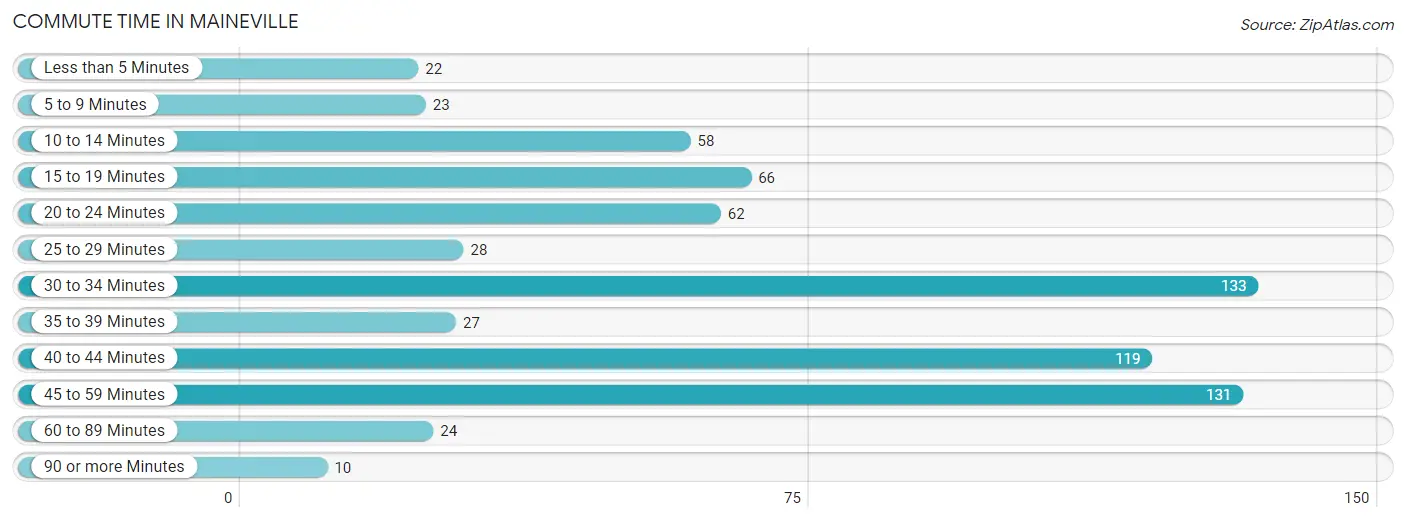
The most frequently occuring commute durations in Maineville are 30 to 34 minutes (133 commuters, 18.9%), 45 to 59 minutes (131 commuters, 18.6%), and 40 to 44 minutes (119 commuters, 16.9%).
| Commute Time | # Commuters | % Commuters |
| Less than 5 Minutes | 22 | 3.1% |
| 5 to 9 Minutes | 23 | 3.3% |
| 10 to 14 Minutes | 58 | 8.3% |
| 15 to 19 Minutes | 66 | 9.4% |
| 20 to 24 Minutes | 62 | 8.8% |
| 25 to 29 Minutes | 28 | 4.0% |
| 30 to 34 Minutes | 133 | 18.9% |
| 35 to 39 Minutes | 27 | 3.8% |
| 40 to 44 Minutes | 119 | 16.9% |
| 45 to 59 Minutes | 131 | 18.6% |
| 60 to 89 Minutes | 24 | 3.4% |
| 90 or more Minutes | 10 | 1.4% |
Commute Time by Sex in Maineville
The most common commute times in Maineville are 30 to 34 minutes (94 commuters, 21.8%) for males and 45 to 59 minutes (86 commuters, 31.7%) for females.
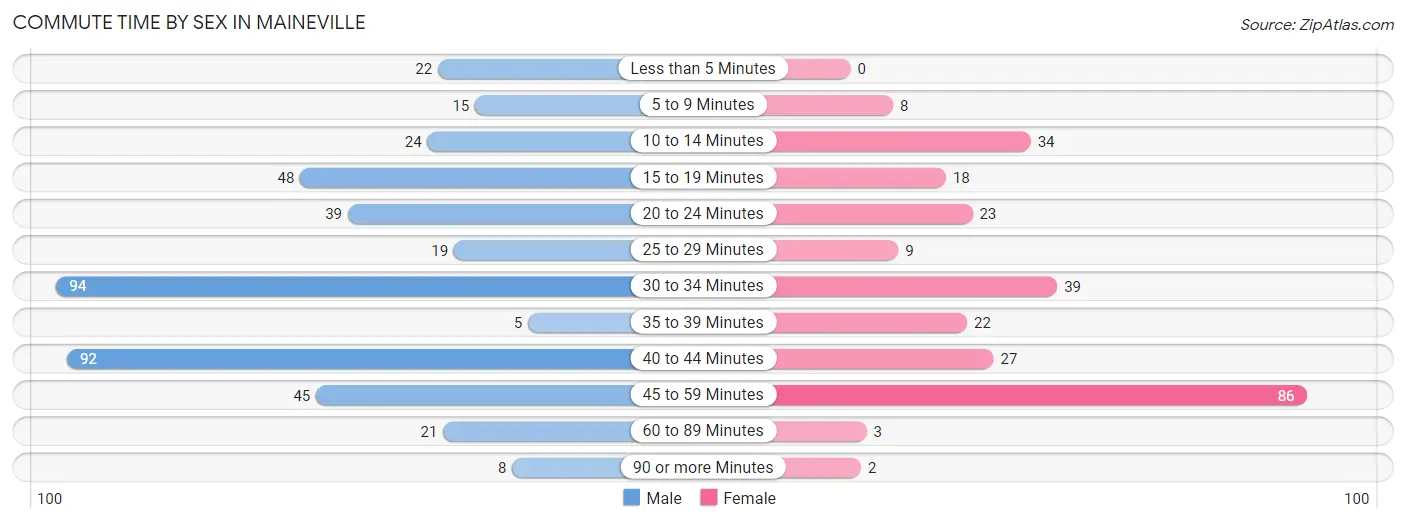
| Commute Time | Male | Female |
| Less than 5 Minutes | 22 (5.1%) | 0 (0.0%) |
| 5 to 9 Minutes | 15 (3.5%) | 8 (2.9%) |
| 10 to 14 Minutes | 24 (5.6%) | 34 (12.6%) |
| 15 to 19 Minutes | 48 (11.1%) | 18 (6.6%) |
| 20 to 24 Minutes | 39 (9.0%) | 23 (8.5%) |
| 25 to 29 Minutes | 19 (4.4%) | 9 (3.3%) |
| 30 to 34 Minutes | 94 (21.8%) | 39 (14.4%) |
| 35 to 39 Minutes | 5 (1.2%) | 22 (8.1%) |
| 40 to 44 Minutes | 92 (21.3%) | 27 (10.0%) |
| 45 to 59 Minutes | 45 (10.4%) | 86 (31.7%) |
| 60 to 89 Minutes | 21 (4.9%) | 3 (1.1%) |
| 90 or more Minutes | 8 (1.8%) | 2 (0.7%) |
Time of Departure to Work by Sex in Maineville
The most frequent times of departure to work in Maineville are 7:00 AM to 7:29 AM (90, 20.8%) for males and 8:00 AM to 8:29 AM (66, 24.3%) for females.
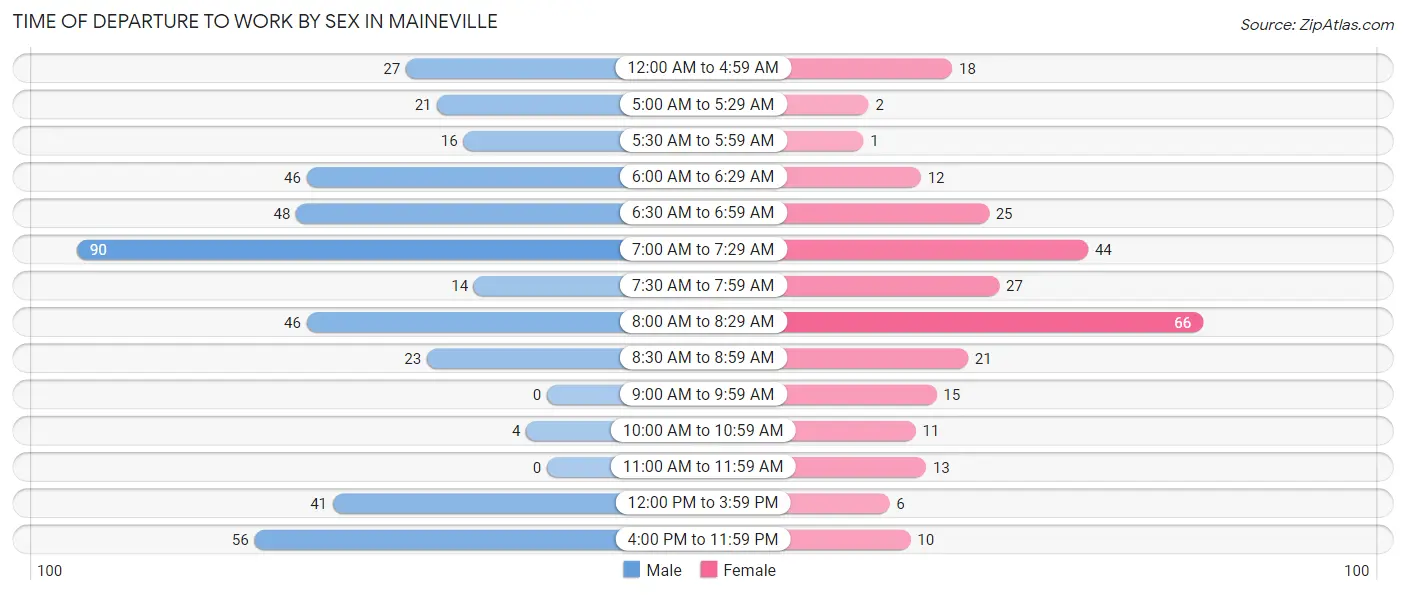
| Time of Departure | Male | Female |
| 12:00 AM to 4:59 AM | 27 (6.2%) | 18 (6.6%) |
| 5:00 AM to 5:29 AM | 21 (4.9%) | 2 (0.7%) |
| 5:30 AM to 5:59 AM | 16 (3.7%) | 1 (0.4%) |
| 6:00 AM to 6:29 AM | 46 (10.6%) | 12 (4.4%) |
| 6:30 AM to 6:59 AM | 48 (11.1%) | 25 (9.2%) |
| 7:00 AM to 7:29 AM | 90 (20.8%) | 44 (16.2%) |
| 7:30 AM to 7:59 AM | 14 (3.2%) | 27 (10.0%) |
| 8:00 AM to 8:29 AM | 46 (10.6%) | 66 (24.3%) |
| 8:30 AM to 8:59 AM | 23 (5.3%) | 21 (7.7%) |
| 9:00 AM to 9:59 AM | 0 (0.0%) | 15 (5.5%) |
| 10:00 AM to 10:59 AM | 4 (0.9%) | 11 (4.1%) |
| 11:00 AM to 11:59 AM | 0 (0.0%) | 13 (4.8%) |
| 12:00 PM to 3:59 PM | 41 (9.5%) | 6 (2.2%) |
| 4:00 PM to 11:59 PM | 56 (13.0%) | 10 (3.7%) |
| Total | 432 (100.0%) | 271 (100.0%) |
Housing Occupancy in Maineville
Occupancy by Ownership in Maineville
Of the total 661 dwellings in Maineville, owner-occupied units account for 513 (77.6%), while renter-occupied units make up 148 (22.4%).
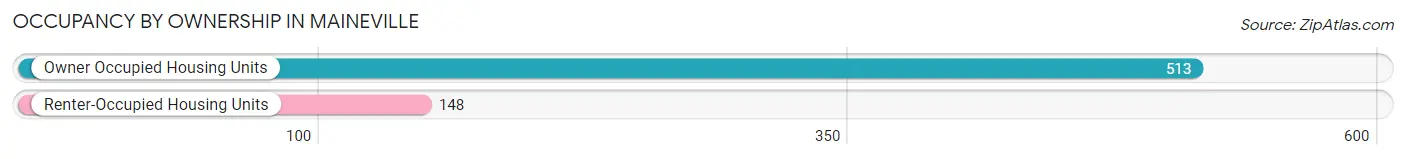
| Occupancy | # Housing Units | % Housing Units |
| Owner Occupied Housing Units | 513 | 77.6% |
| Renter-Occupied Housing Units | 148 | 22.4% |
| Total Occupied Housing Units | 661 | 100.0% |
Occupancy by Household Size in Maineville
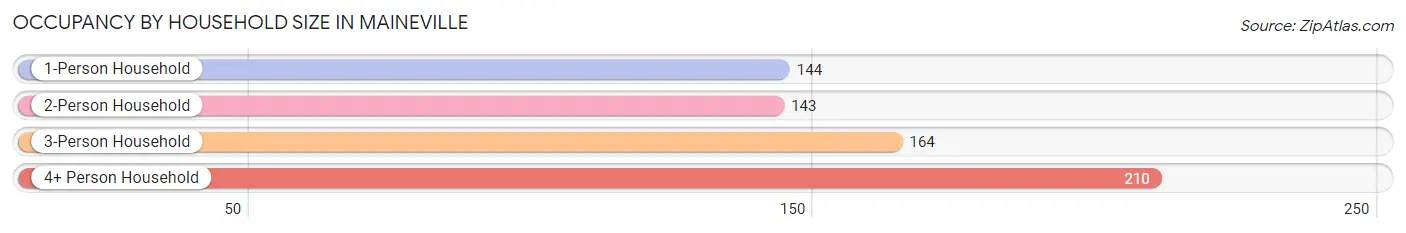
| Household Size | # Housing Units | % Housing Units |
| 1-Person Household | 144 | 21.8% |
| 2-Person Household | 143 | 21.6% |
| 3-Person Household | 164 | 24.8% |
| 4+ Person Household | 210 | 31.8% |
| Total Housing Units | 661 | 100.0% |
Occupancy by Ownership by Household Size in Maineville
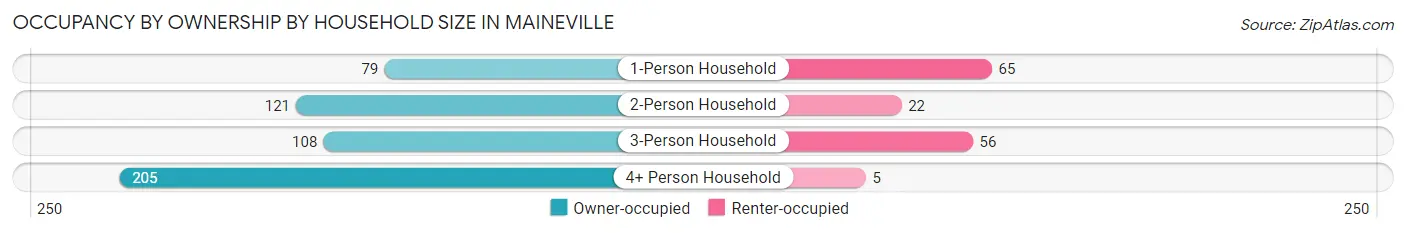
| Household Size | Owner-occupied | Renter-occupied |
| 1-Person Household | 79 (54.9%) | 65 (45.1%) |
| 2-Person Household | 121 (84.6%) | 22 (15.4%) |
| 3-Person Household | 108 (65.8%) | 56 (34.2%) |
| 4+ Person Household | 205 (97.6%) | 5 (2.4%) |
| Total Housing Units | 513 (77.6%) | 148 (22.4%) |
Occupancy by Educational Attainment in Maineville
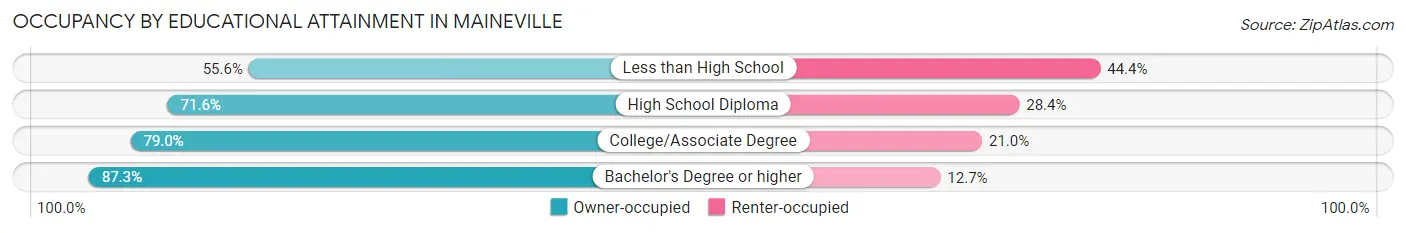
| Household Size | Owner-occupied | Renter-occupied |
| Less than High School | 15 (55.6%) | 12 (44.4%) |
| High School Diploma | 154 (71.6%) | 61 (28.4%) |
| College/Associate Degree | 207 (79.0%) | 55 (21.0%) |
| Bachelor's Degree or higher | 137 (87.3%) | 20 (12.7%) |
Occupancy by Age of Householder in Maineville
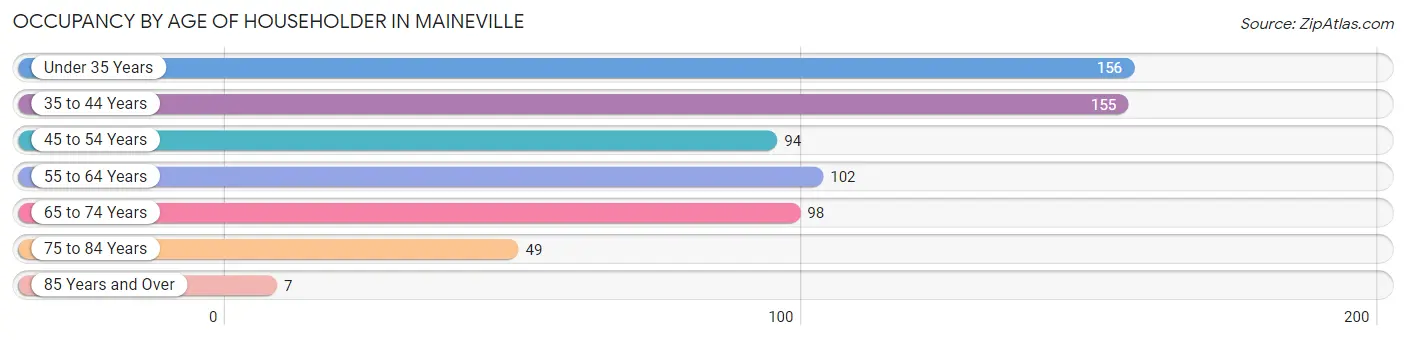
| Age Bracket | # Households | % Households |
| Under 35 Years | 156 | 23.6% |
| 35 to 44 Years | 155 | 23.4% |
| 45 to 54 Years | 94 | 14.2% |
| 55 to 64 Years | 102 | 15.4% |
| 65 to 74 Years | 98 | 14.8% |
| 75 to 84 Years | 49 | 7.4% |
| 85 Years and Over | 7 | 1.1% |
| Total | 661 | 100.0% |
Housing Finances in Maineville
Median Income by Occupancy in Maineville
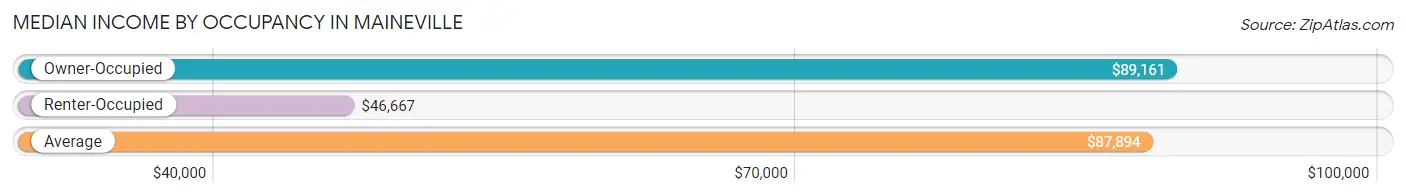
| Occupancy Type | # Households | Median Income |
| Owner-Occupied | 513 (77.6%) | $89,161 |
| Renter-Occupied | 148 (22.4%) | $46,667 |
| Average | 661 (100.0%) | $87,894 |
Occupancy by Householder Income Bracket in Maineville
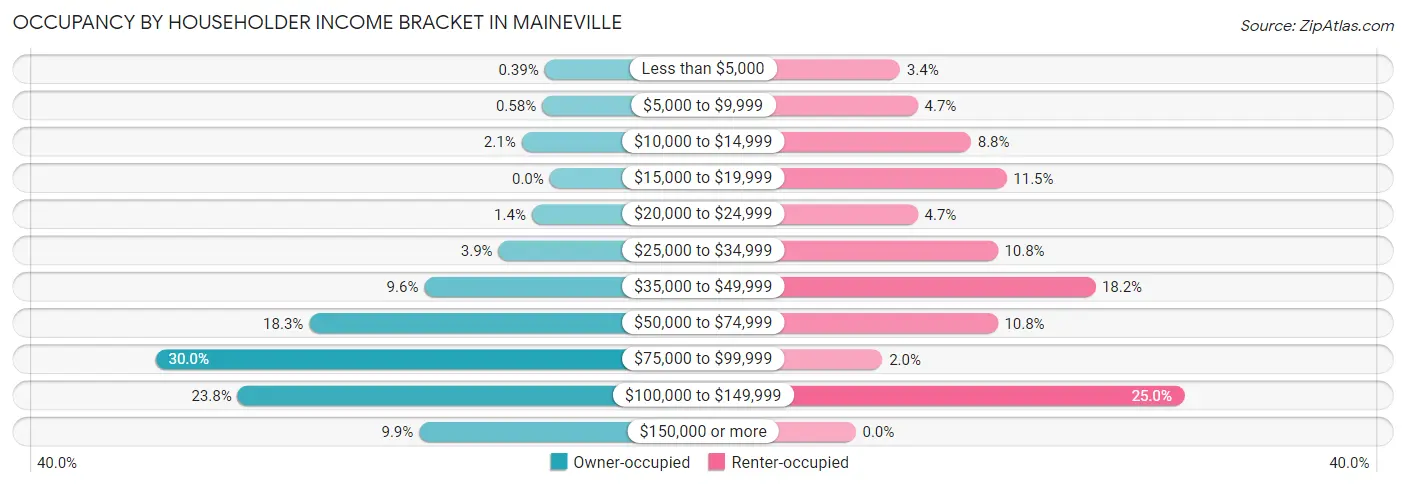
| Income Bracket | Owner-occupied | Renter-occupied |
| Less than $5,000 | 2 (0.4%) | 5 (3.4%) |
| $5,000 to $9,999 | 3 (0.6%) | 7 (4.7%) |
| $10,000 to $14,999 | 11 (2.1%) | 13 (8.8%) |
| $15,000 to $19,999 | 0 (0.0%) | 17 (11.5%) |
| $20,000 to $24,999 | 7 (1.4%) | 7 (4.7%) |
| $25,000 to $34,999 | 20 (3.9%) | 16 (10.8%) |
| $35,000 to $49,999 | 49 (9.6%) | 27 (18.2%) |
| $50,000 to $74,999 | 94 (18.3%) | 16 (10.8%) |
| $75,000 to $99,999 | 154 (30.0%) | 3 (2.0%) |
| $100,000 to $149,999 | 122 (23.8%) | 37 (25.0%) |
| $150,000 or more | 51 (9.9%) | 0 (0.0%) |
| Total | 513 (100.0%) | 148 (100.0%) |
Monthly Housing Cost Tiers in Maineville
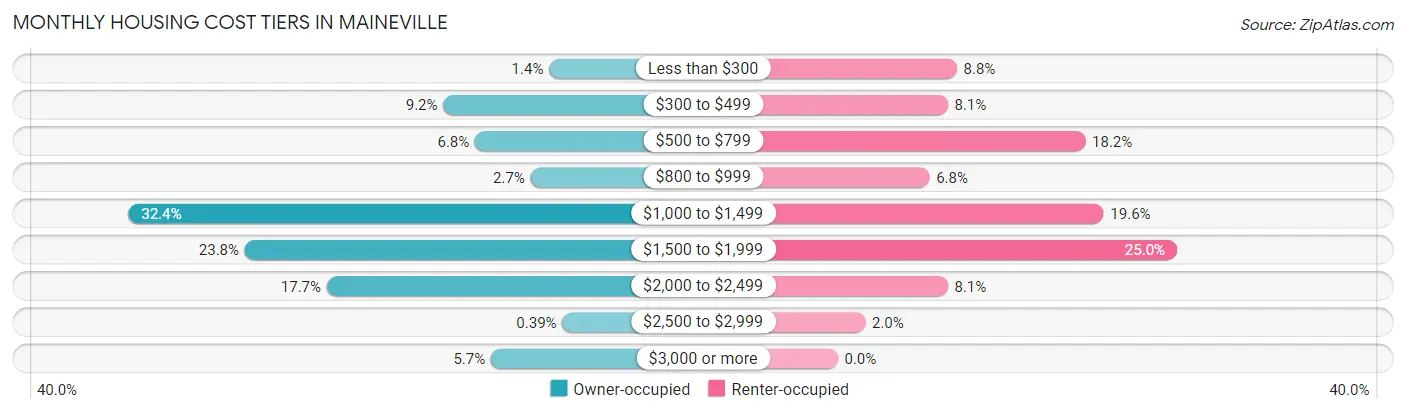
| Monthly Cost | Owner-occupied | Renter-occupied |
| Less than $300 | 7 (1.4%) | 13 (8.8%) |
| $300 to $499 | 47 (9.2%) | 12 (8.1%) |
| $500 to $799 | 35 (6.8%) | 27 (18.2%) |
| $800 to $999 | 14 (2.7%) | 10 (6.8%) |
| $1,000 to $1,499 | 166 (32.4%) | 29 (19.6%) |
| $1,500 to $1,999 | 122 (23.8%) | 37 (25.0%) |
| $2,000 to $2,499 | 91 (17.7%) | 12 (8.1%) |
| $2,500 to $2,999 | 2 (0.4%) | 3 (2.0%) |
| $3,000 or more | 29 (5.7%) | 0 (0.0%) |
| Total | 513 (100.0%) | 148 (100.0%) |
Physical Housing Characteristics in Maineville
Housing Structures in Maineville
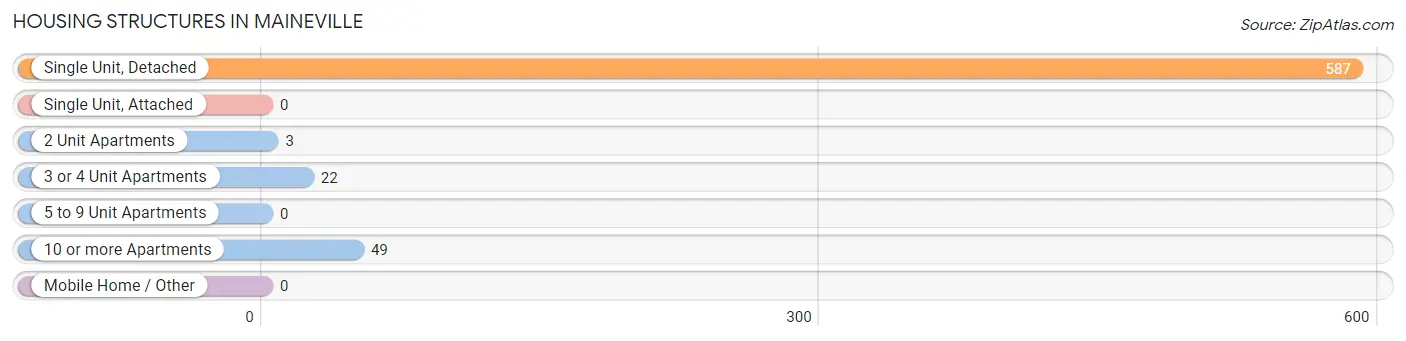
| Structure Type | # Housing Units | % Housing Units |
| Single Unit, Detached | 587 | 88.8% |
| Single Unit, Attached | 0 | 0.0% |
| 2 Unit Apartments | 3 | 0.4% |
| 3 or 4 Unit Apartments | 22 | 3.3% |
| 5 to 9 Unit Apartments | 0 | 0.0% |
| 10 or more Apartments | 49 | 7.4% |
| Mobile Home / Other | 0 | 0.0% |
| Total | 661 | 100.0% |
Housing Structures by Occupancy in Maineville
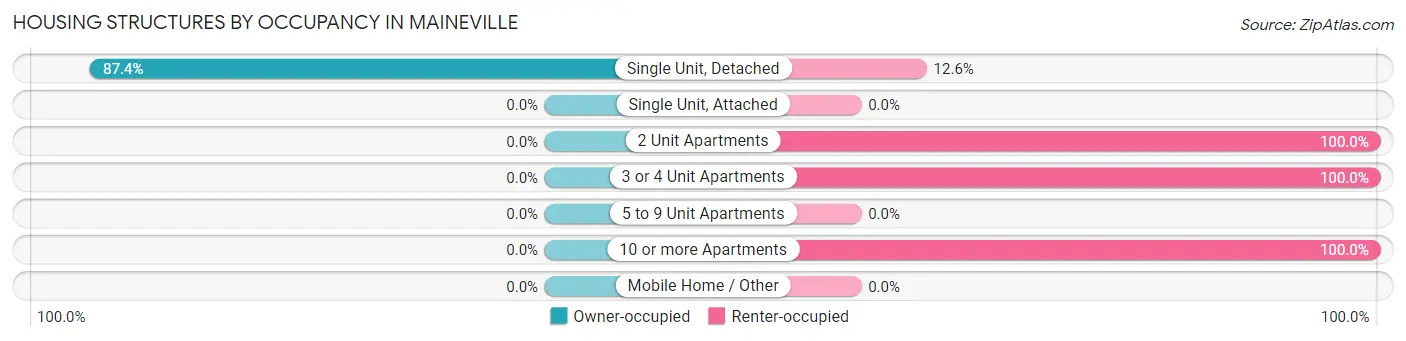
| Structure Type | Owner-occupied | Renter-occupied |
| Single Unit, Detached | 513 (87.4%) | 74 (12.6%) |
| Single Unit, Attached | 0 (0.0%) | 0 (0.0%) |
| 2 Unit Apartments | 0 (0.0%) | 3 (100.0%) |
| 3 or 4 Unit Apartments | 0 (0.0%) | 22 (100.0%) |
| 5 to 9 Unit Apartments | 0 (0.0%) | 0 (0.0%) |
| 10 or more Apartments | 0 (0.0%) | 49 (100.0%) |
| Mobile Home / Other | 0 (0.0%) | 0 (0.0%) |
| Total | 513 (77.6%) | 148 (22.4%) |
Housing Structures by Number of Rooms in Maineville
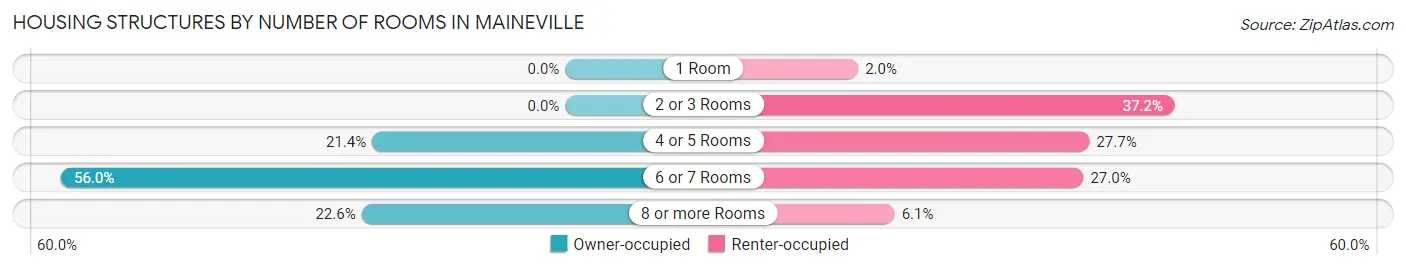
| Number of Rooms | Owner-occupied | Renter-occupied |
| 1 Room | 0 (0.0%) | 3 (2.0%) |
| 2 or 3 Rooms | 0 (0.0%) | 55 (37.2%) |
| 4 or 5 Rooms | 110 (21.4%) | 41 (27.7%) |
| 6 or 7 Rooms | 287 (55.9%) | 40 (27.0%) |
| 8 or more Rooms | 116 (22.6%) | 9 (6.1%) |
| Total | 513 (100.0%) | 148 (100.0%) |
Housing Structure by Heating Type in Maineville
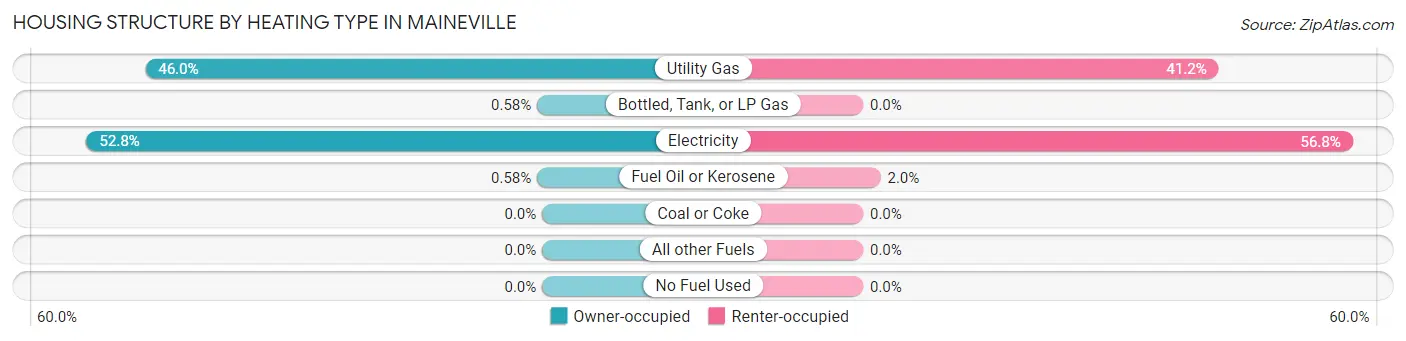
| Heating Type | Owner-occupied | Renter-occupied |
| Utility Gas | 236 (46.0%) | 61 (41.2%) |
| Bottled, Tank, or LP Gas | 3 (0.6%) | 0 (0.0%) |
| Electricity | 271 (52.8%) | 84 (56.8%) |
| Fuel Oil or Kerosene | 3 (0.6%) | 3 (2.0%) |
| Coal or Coke | 0 (0.0%) | 0 (0.0%) |
| All other Fuels | 0 (0.0%) | 0 (0.0%) |
| No Fuel Used | 0 (0.0%) | 0 (0.0%) |
| Total | 513 (100.0%) | 148 (100.0%) |
Household Vehicle Usage in Maineville
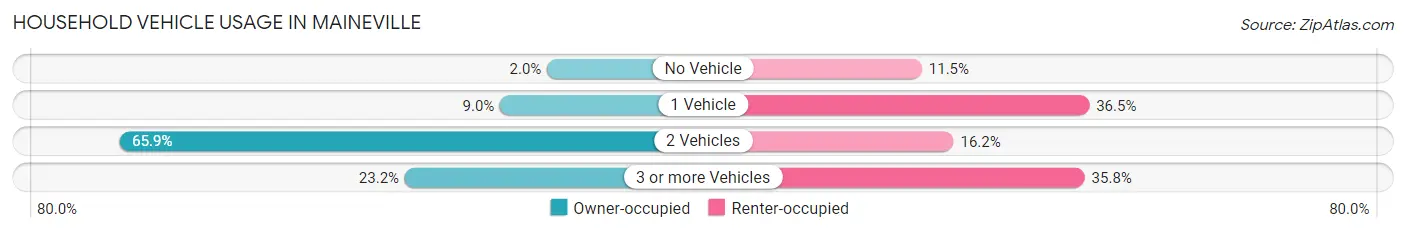
| Vehicles per Household | Owner-occupied | Renter-occupied |
| No Vehicle | 10 (1.9%) | 17 (11.5%) |
| 1 Vehicle | 46 (9.0%) | 54 (36.5%) |
| 2 Vehicles | 338 (65.9%) | 24 (16.2%) |
| 3 or more Vehicles | 119 (23.2%) | 53 (35.8%) |
| Total | 513 (100.0%) | 148 (100.0%) |
Real Estate & Mortgages in Maineville
Real Estate and Mortgage Overview in Maineville
| Characteristic | Without Mortgage | With Mortgage |
| Housing Units | 110 | 403 |
| Median Property Value | $222,200 | $243,700 |
| Median Household Income | $49,583 | $37 |
| Monthly Housing Costs | $510 | $26 |
| Real Estate Taxes | $2,750 | $6 |
Property Value by Mortgage Status in Maineville
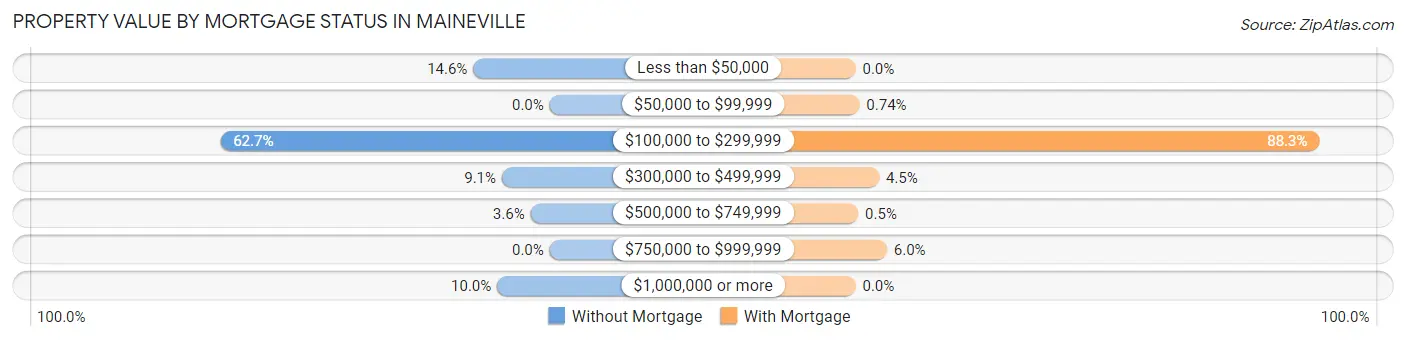
| Property Value | Without Mortgage | With Mortgage |
| Less than $50,000 | 16 (14.5%) | 0 (0.0%) |
| $50,000 to $99,999 | 0 (0.0%) | 3 (0.7%) |
| $100,000 to $299,999 | 69 (62.7%) | 356 (88.3%) |
| $300,000 to $499,999 | 10 (9.1%) | 18 (4.5%) |
| $500,000 to $749,999 | 4 (3.6%) | 2 (0.5%) |
| $750,000 to $999,999 | 0 (0.0%) | 24 (6.0%) |
| $1,000,000 or more | 11 (10.0%) | 0 (0.0%) |
| Total | 110 (100.0%) | 403 (100.0%) |
Household Income by Mortgage Status in Maineville
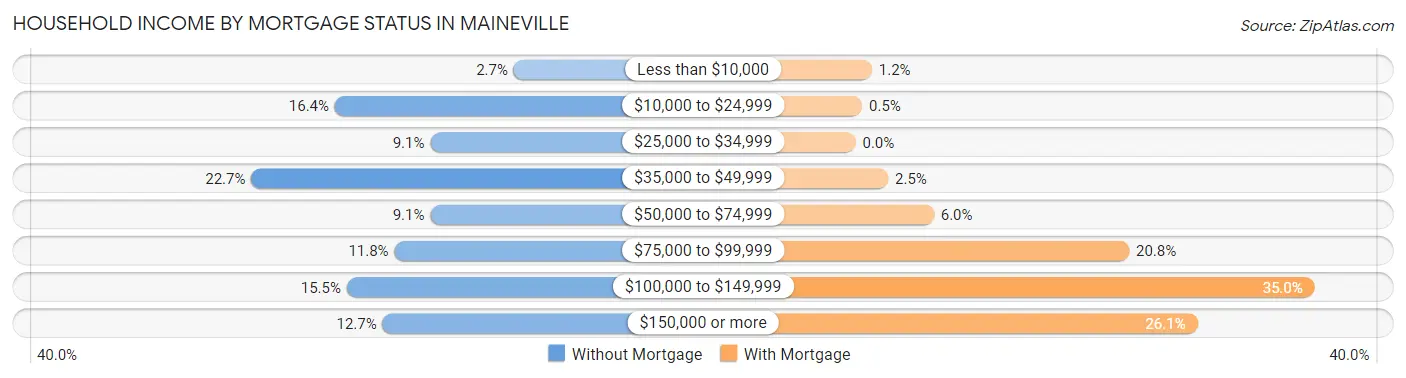
| Household Income | Without Mortgage | With Mortgage |
| Less than $10,000 | 3 (2.7%) | 5 (1.2%) |
| $10,000 to $24,999 | 18 (16.4%) | 2 (0.5%) |
| $25,000 to $34,999 | 10 (9.1%) | 0 (0.0%) |
| $35,000 to $49,999 | 25 (22.7%) | 10 (2.5%) |
| $50,000 to $74,999 | 10 (9.1%) | 24 (6.0%) |
| $75,000 to $99,999 | 13 (11.8%) | 84 (20.8%) |
| $100,000 to $149,999 | 17 (15.4%) | 141 (35.0%) |
| $150,000 or more | 14 (12.7%) | 105 (26.1%) |
| Total | 110 (100.0%) | 403 (100.0%) |
Property Value to Household Income Ratio in Maineville
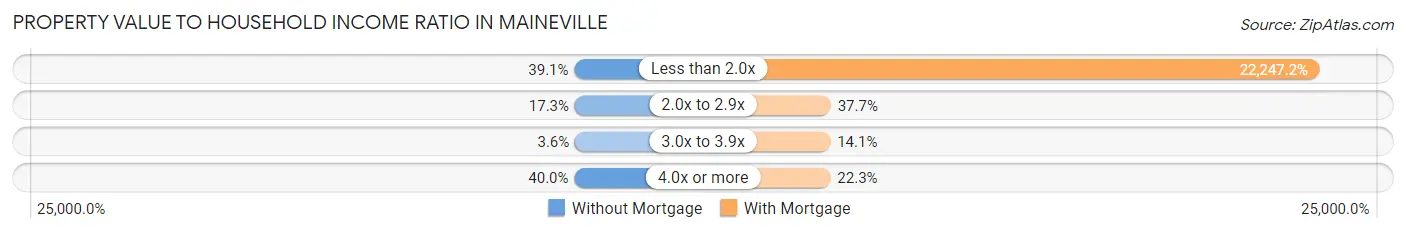
| Value-to-Income Ratio | Without Mortgage | With Mortgage |
| Less than 2.0x | 43 (39.1%) | 89,656 (22,247.1%) |
| 2.0x to 2.9x | 19 (17.3%) | 152 (37.7%) |
| 3.0x to 3.9x | 4 (3.6%) | 57 (14.1%) |
| 4.0x or more | 44 (40.0%) | 90 (22.3%) |
| Total | 110 (100.0%) | 403 (100.0%) |
Real Estate Taxes by Mortgage Status in Maineville
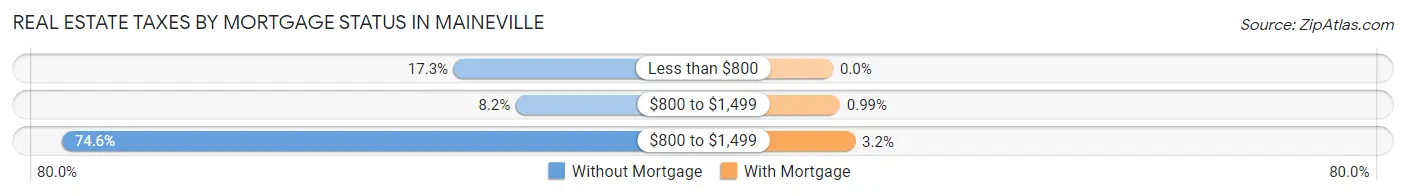
| Property Taxes | Without Mortgage | With Mortgage |
| Less than $800 | 19 (17.3%) | 0 (0.0%) |
| $800 to $1,499 | 9 (8.2%) | 4 (1.0%) |
| $800 to $1,499 | 82 (74.6%) | 13 (3.2%) |
| Total | 110 (100.0%) | 403 (100.0%) |
Health & Disability in Maineville
Health Insurance Coverage by Age in Maineville
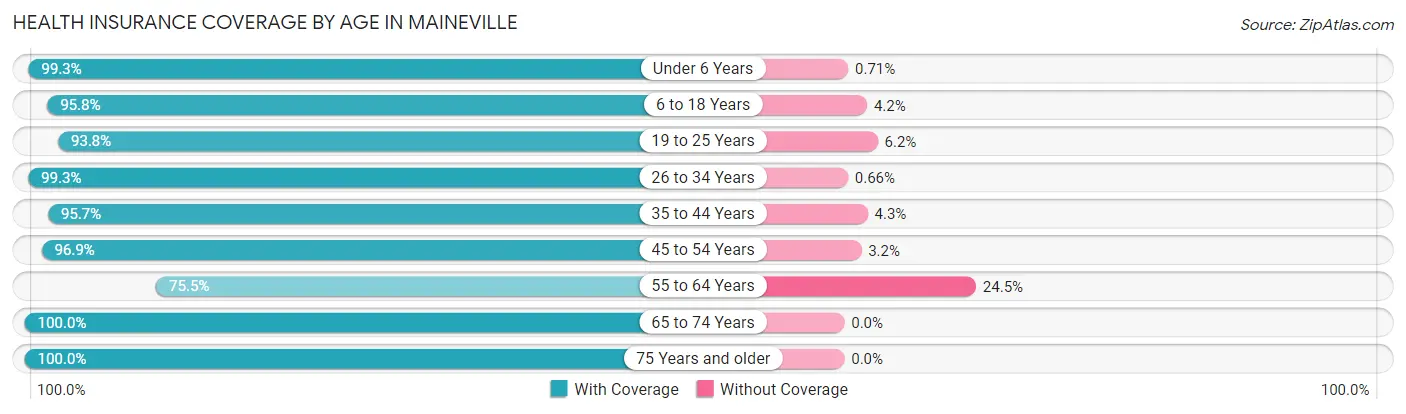
| Age Bracket | With Coverage | Without Coverage |
| Under 6 Years | 281 (99.3%) | 2 (0.7%) |
| 6 to 18 Years | 385 (95.8%) | 17 (4.2%) |
| 19 to 25 Years | 136 (93.8%) | 9 (6.2%) |
| 26 to 34 Years | 303 (99.3%) | 2 (0.7%) |
| 35 to 44 Years | 331 (95.7%) | 15 (4.3%) |
| 45 to 54 Years | 123 (96.9%) | 4 (3.2%) |
| 55 to 64 Years | 163 (75.5%) | 53 (24.5%) |
| 65 to 74 Years | 165 (100.0%) | 0 (0.0%) |
| 75 Years and older | 64 (100.0%) | 0 (0.0%) |
| Total | 1,951 (95.0%) | 102 (5.0%) |
Health Insurance Coverage by Citizenship Status in Maineville
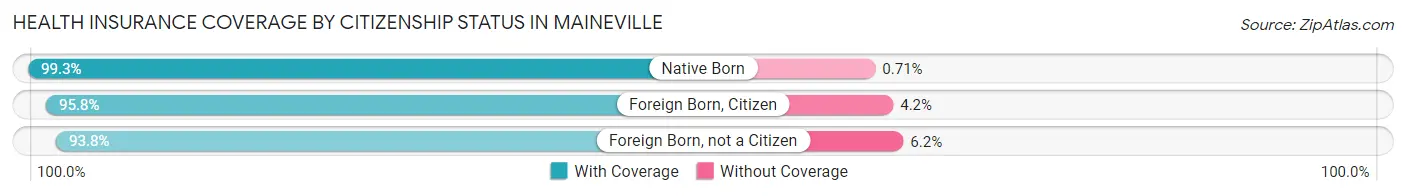
| Citizenship Status | With Coverage | Without Coverage |
| Native Born | 281 (99.3%) | 2 (0.7%) |
| Foreign Born, Citizen | 385 (95.8%) | 17 (4.2%) |
| Foreign Born, not a Citizen | 136 (93.8%) | 9 (6.2%) |
Health Insurance Coverage by Household Income in Maineville
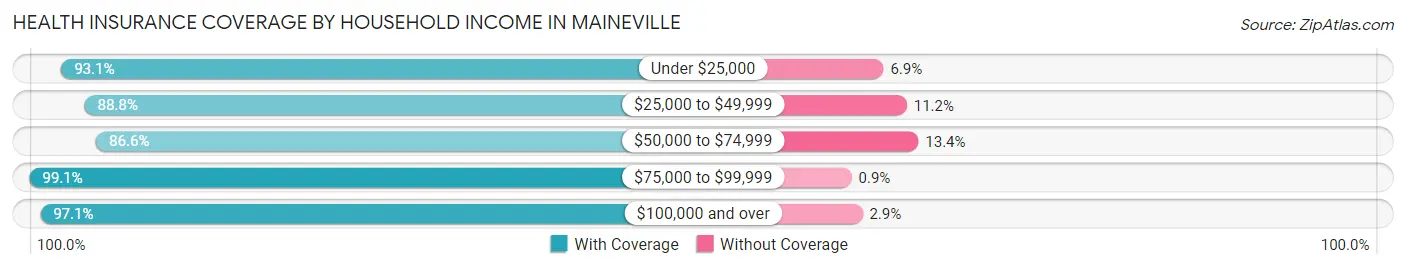
| Household Income | With Coverage | Without Coverage |
| Under $25,000 | 122 (93.1%) | 9 (6.9%) |
| $25,000 to $49,999 | 229 (88.8%) | 29 (11.2%) |
| $50,000 to $74,999 | 239 (86.6%) | 37 (13.4%) |
| $75,000 to $99,999 | 661 (99.1%) | 6 (0.9%) |
| $100,000 and over | 695 (97.1%) | 21 (2.9%) |
Public vs Private Health Insurance Coverage by Age in Maineville
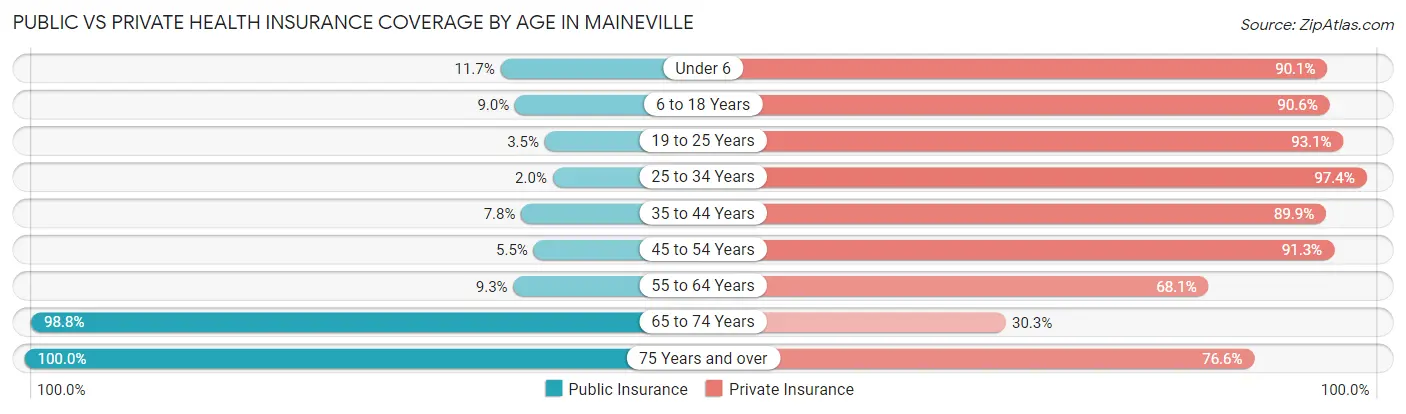
| Age Bracket | Public Insurance | Private Insurance |
| Under 6 | 33 (11.7%) | 255 (90.1%) |
| 6 to 18 Years | 36 (9.0%) | 364 (90.5%) |
| 19 to 25 Years | 5 (3.5%) | 135 (93.1%) |
| 25 to 34 Years | 6 (2.0%) | 297 (97.4%) |
| 35 to 44 Years | 27 (7.8%) | 311 (89.9%) |
| 45 to 54 Years | 7 (5.5%) | 116 (91.3%) |
| 55 to 64 Years | 20 (9.3%) | 147 (68.1%) |
| 65 to 74 Years | 163 (98.8%) | 50 (30.3%) |
| 75 Years and over | 64 (100.0%) | 49 (76.6%) |
| Total | 361 (17.6%) | 1,724 (84.0%) |
Disability Status by Sex by Age in Maineville
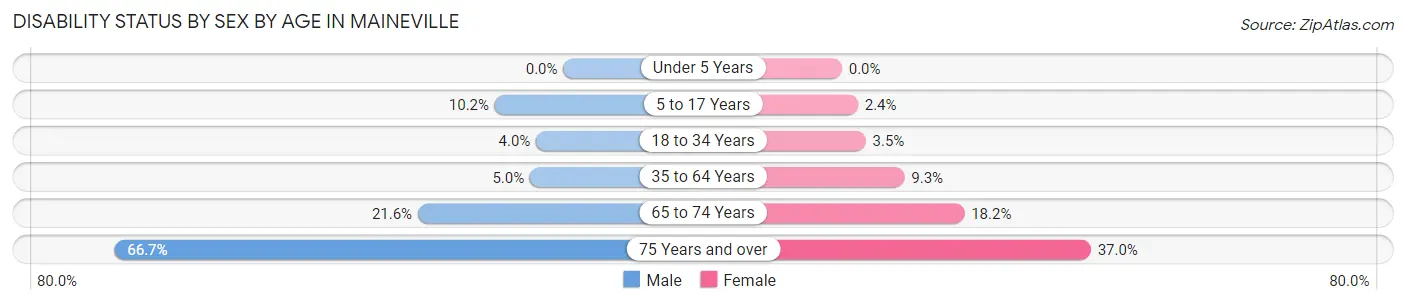
| Age Bracket | Male | Female |
| Under 5 Years | 0 (0.0%) | 0 (0.0%) |
| 5 to 17 Years | 24 (10.2%) | 4 (2.4%) |
| 18 to 34 Years | 11 (4.0%) | 7 (3.5%) |
| 35 to 64 Years | 16 (5.0%) | 34 (9.3%) |
| 65 to 74 Years | 19 (21.6%) | 14 (18.2%) |
| 75 Years and over | 12 (66.7%) | 17 (37.0%) |
Disability Class by Sex by Age in Maineville
Disability Class: Hearing Difficulty
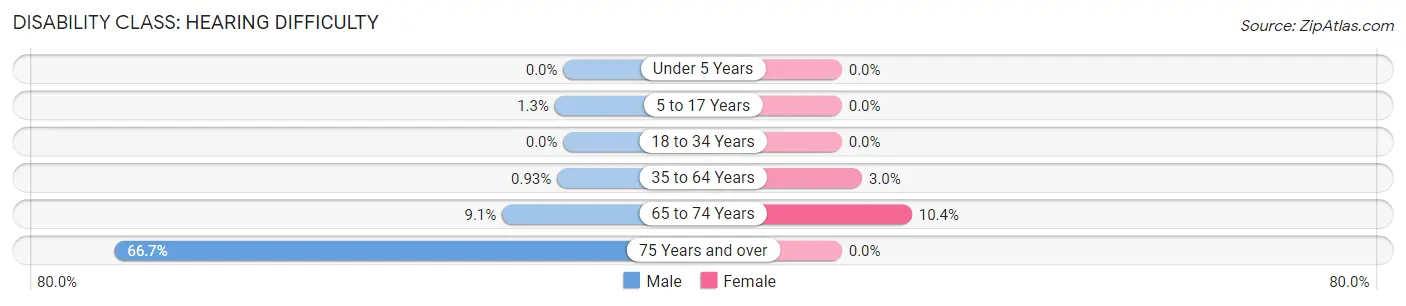
| Age Bracket | Male | Female |
| Under 5 Years | 0 (0.0%) | 0 (0.0%) |
| 5 to 17 Years | 3 (1.3%) | 0 (0.0%) |
| 18 to 34 Years | 0 (0.0%) | 0 (0.0%) |
| 35 to 64 Years | 3 (0.9%) | 11 (3.0%) |
| 65 to 74 Years | 8 (9.1%) | 8 (10.4%) |
| 75 Years and over | 12 (66.7%) | 0 (0.0%) |
Disability Class: Vision Difficulty
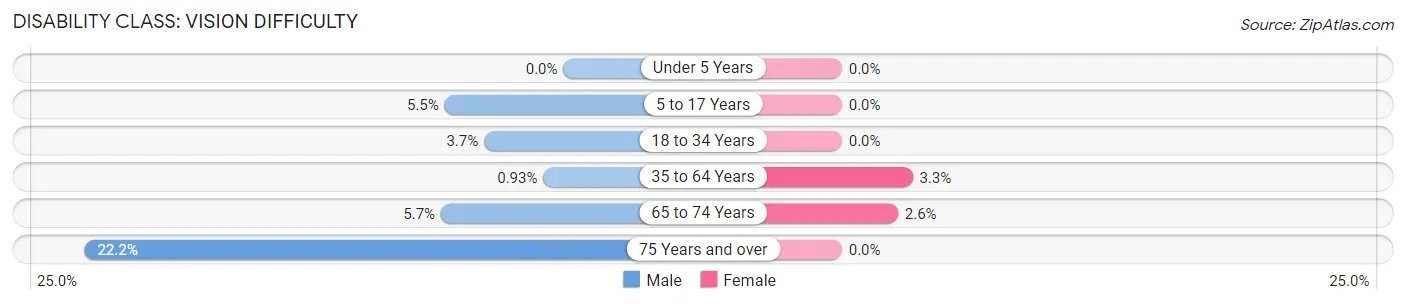
| Age Bracket | Male | Female |
| Under 5 Years | 0 (0.0%) | 0 (0.0%) |
| 5 to 17 Years | 13 (5.5%) | 0 (0.0%) |
| 18 to 34 Years | 10 (3.7%) | 0 (0.0%) |
| 35 to 64 Years | 3 (0.9%) | 12 (3.3%) |
| 65 to 74 Years | 5 (5.7%) | 2 (2.6%) |
| 75 Years and over | 4 (22.2%) | 0 (0.0%) |
Disability Class: Cognitive Difficulty
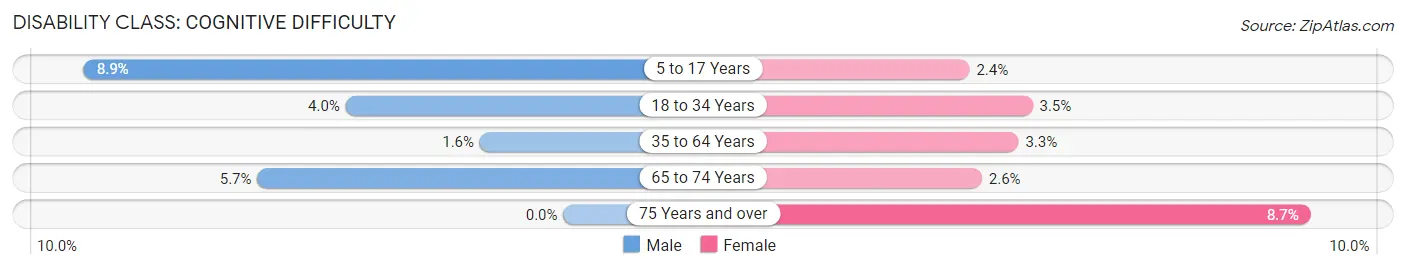
| Age Bracket | Male | Female |
| 5 to 17 Years | 21 (8.9%) | 4 (2.4%) |
| 18 to 34 Years | 11 (4.0%) | 7 (3.5%) |
| 35 to 64 Years | 5 (1.5%) | 12 (3.3%) |
| 65 to 74 Years | 5 (5.7%) | 2 (2.6%) |
| 75 Years and over | 0 (0.0%) | 4 (8.7%) |
Disability Class: Ambulatory Difficulty
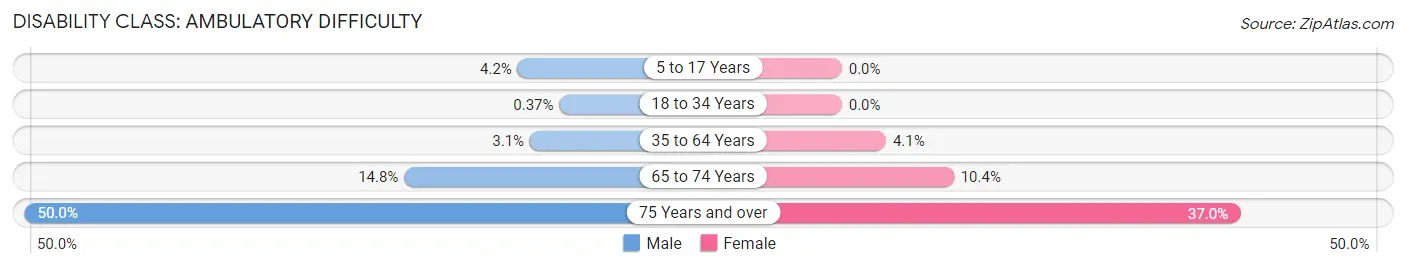
| Age Bracket | Male | Female |
| 5 to 17 Years | 10 (4.2%) | 0 (0.0%) |
| 18 to 34 Years | 1 (0.4%) | 0 (0.0%) |
| 35 to 64 Years | 10 (3.1%) | 15 (4.1%) |
| 65 to 74 Years | 13 (14.8%) | 8 (10.4%) |
| 75 Years and over | 9 (50.0%) | 17 (37.0%) |
Disability Class: Self-Care Difficulty
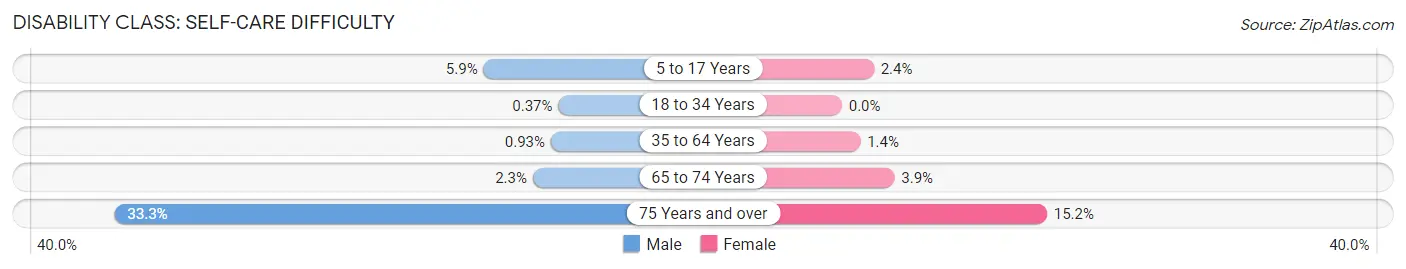
| Age Bracket | Male | Female |
| 5 to 17 Years | 14 (5.9%) | 4 (2.4%) |
| 18 to 34 Years | 1 (0.4%) | 0 (0.0%) |
| 35 to 64 Years | 3 (0.9%) | 5 (1.4%) |
| 65 to 74 Years | 2 (2.3%) | 3 (3.9%) |
| 75 Years and over | 6 (33.3%) | 7 (15.2%) |
Technology Access in Maineville
Computing Device Access in Maineville
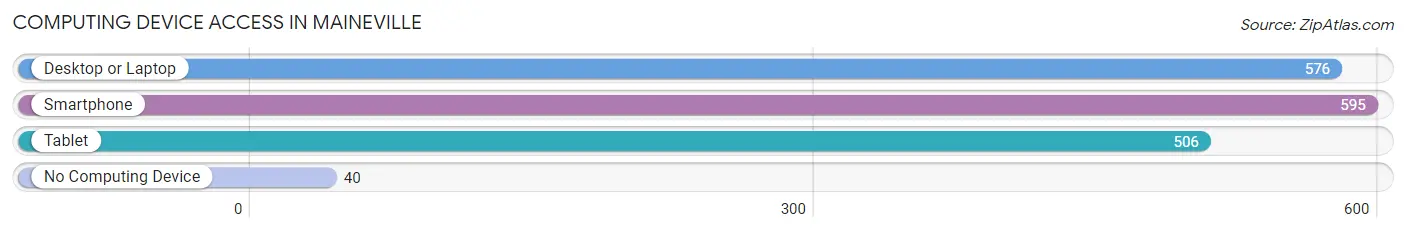
| Device Type | # Households | % Households |
| Desktop or Laptop | 576 | 87.1% |
| Smartphone | 595 | 90.0% |
| Tablet | 506 | 76.5% |
| No Computing Device | 40 | 6.0% |
| Total | 661 | 100.0% |
Internet Access in Maineville
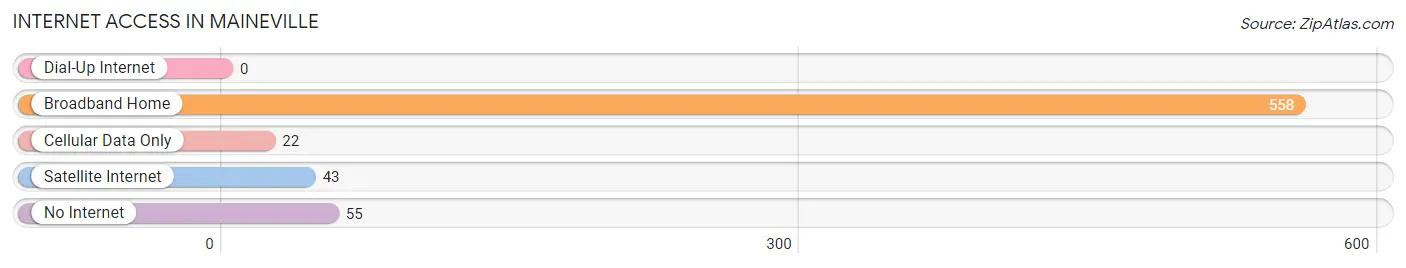
| Internet Type | # Households | % Households |
| Dial-Up Internet | 0 | 0.0% |
| Broadband Home | 558 | 84.4% |
| Cellular Data Only | 22 | 3.3% |
| Satellite Internet | 43 | 6.5% |
| No Internet | 55 | 8.3% |
| Total | 661 | 100.0% |
Maineville Summary
Maineville, Ohio is a small village located in Warren County, Ohio. It is situated on the Little Miami River, approximately 25 miles northeast of Cincinnati. The village was founded in 1815 and has a population of approximately 2,500 people.
History
Maineville was founded in 1815 by a group of settlers from Maine. The settlers were attracted to the area due to its proximity to the Little Miami River, which provided a convenient transportation route for goods and services. The village was named after the settlers’ home state of Maine.
The village was initially a farming community, with the main crops being corn, wheat, and oats. In the late 19th century, the village began to grow and develop as a commercial center. The first store was opened in 1876, and the first post office was established in 1877.
In the early 20th century, Maineville experienced a period of growth and development. The village was incorporated in 1921, and the first mayor was elected in 1922. The village also saw the construction of a new school, a library, and a fire station.
Geography
Maineville is located in Warren County, Ohio. It is situated on the Little Miami River, approximately 25 miles northeast of Cincinnati. The village is located in a rural area, with the nearest major city being Dayton, Ohio.
The village has a total area of 1.2 square miles, all of which is land. The terrain is mostly flat, with some rolling hills. The climate is humid continental, with hot summers and cold winters.
Economy
The economy of Maineville is largely based on agriculture and tourism. The village is home to several farms, which produce a variety of crops, including corn, wheat, and oats. The village also has several small businesses, including restaurants, retail stores, and service providers.
The village is also a popular tourist destination, due to its proximity to the Little Miami River. The village is home to several parks and recreational areas, including the Maineville Nature Preserve.
Demographics
As of the 2010 census, the population of Maineville was 2,500. The racial makeup of the village was 97.2% White, 0.8% African American, 0.4% Native American, 0.4% Asian, and 1.2% from other races. The median household income was $50,000, and the median family income was $60,000.
Conclusion
Maineville, Ohio is a small village located in Warren County, Ohio. It was founded in 1815 by a group of settlers from Maine and has a population of approximately 2,500 people. The village is situated on the Little Miami River and is a popular tourist destination due to its proximity to the river. The economy of Maineville is largely based on agriculture and tourism, and the village is home to several farms and small businesses. The racial makeup of the village is predominantly White, with a small percentage of African American, Native American, and Asian residents.
Common Questions
What is Per Capita Income in Maineville?
Per Capita income in Maineville is $30,255.
What is the Median Family Income in Maineville?
Median Family Income in Maineville is $87,517.
What is the Median Household income in Maineville?
Median Household Income in Maineville is $87,894.
What is Income or Wage Gap in Maineville?
Income or Wage Gap in Maineville is 50.3%.
Women in Maineville earn 49.7 cents for every dollar earned by a man.
What is Inequality or Gini Index in Maineville?
Inequality or Gini Index in Maineville is 0.37.
What is the Total Population of Maineville?
Total Population of Maineville is 2,057.
What is the Total Male Population of Maineville?
Total Male Population of Maineville is 1,152.
What is the Total Female Population of Maineville?
Total Female Population of Maineville is 905.
What is the Ratio of Males per 100 Females in Maineville?
There are 127.29 Males per 100 Females in Maineville.
What is the Ratio of Females per 100 Males in Maineville?
There are 78.56 Females per 100 Males in Maineville.
What is the Median Population Age in Maineville?
Median Population Age in Maineville is 31.6 Years.
What is the Average Family Size in Maineville
Average Family Size in Maineville is 3.6 People.
What is the Average Household Size in Maineville
Average Household Size in Maineville is 3.1 People.
How Large is the Labor Force in Maineville?
There are 912 People in the Labor Forcein in Maineville.
What is the Percentage of People in the Labor Force in Maineville?
63.7% of People are in the Labor Force in Maineville.
What is the Unemployment Rate in Maineville?
Unemployment Rate in Maineville is 3.0%.