Newton Falls, OH Map & Demographics
Newton Falls Map
Newton Falls Overview
$30,359
PER CAPITA INCOME
$71,250
AVG FAMILY INCOME
$50,738
AVG HOUSEHOLD INCOME
29.4%
WAGE / INCOME GAP [ % ]
70.6¢/ $1
WAGE / INCOME GAP [ $ ]
0.45
INEQUALITY / GINI INDEX
4,562
TOTAL POPULATION
2,133
MALE POPULATION
2,429
FEMALE POPULATION
87.81
MALES / 100 FEMALES
113.88
FEMALES / 100 MALES
49.2
MEDIAN AGE
3.0
AVG FAMILY SIZE
2.0
AVG HOUSEHOLD SIZE
2,270
LABOR FORCE [ PEOPLE ]
57.2%
PERCENT IN LABOR FORCE
6.9%
UNEMPLOYMENT RATE
Newton Falls Zip Codes
Newton Falls Area Codes
Income in Newton Falls
Income Overview in Newton Falls
Per Capita Income in Newton Falls is $30,359, while median incomes of families and households are $71,250 and $50,738 respectively.
| Characteristic | Number | Measure |
| Per Capita Income | 4,562 | $30,359 |
| Median Family Income | 977 | $71,250 |
| Mean Family Income | 977 | $90,635 |
| Median Household Income | 2,206 | $50,738 |
| Mean Household Income | 2,206 | $61,459 |
| Income Deficit | 977 | $0 |
| Wage / Income Gap (%) | 4,562 | 29.40% |
| Wage / Income Gap ($) | 4,562 | 70.60¢ per $1 |
| Gini / Inequality Index | 4,562 | 0.45 |
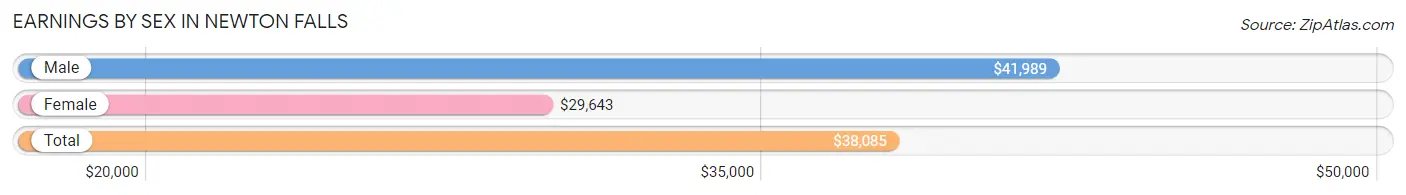
Earnings by Sex in Newton Falls
Average Earnings in Newton Falls are $38,085, $41,989 for men and $29,643 for women, a difference of 29.4%.
| Sex | Number | Average Earnings |
| Male | 1,205 (51.3%) | $41,989 |
| Female | 1,142 (48.7%) | $29,643 |
| Total | 2,347 (100.0%) | $38,085 |
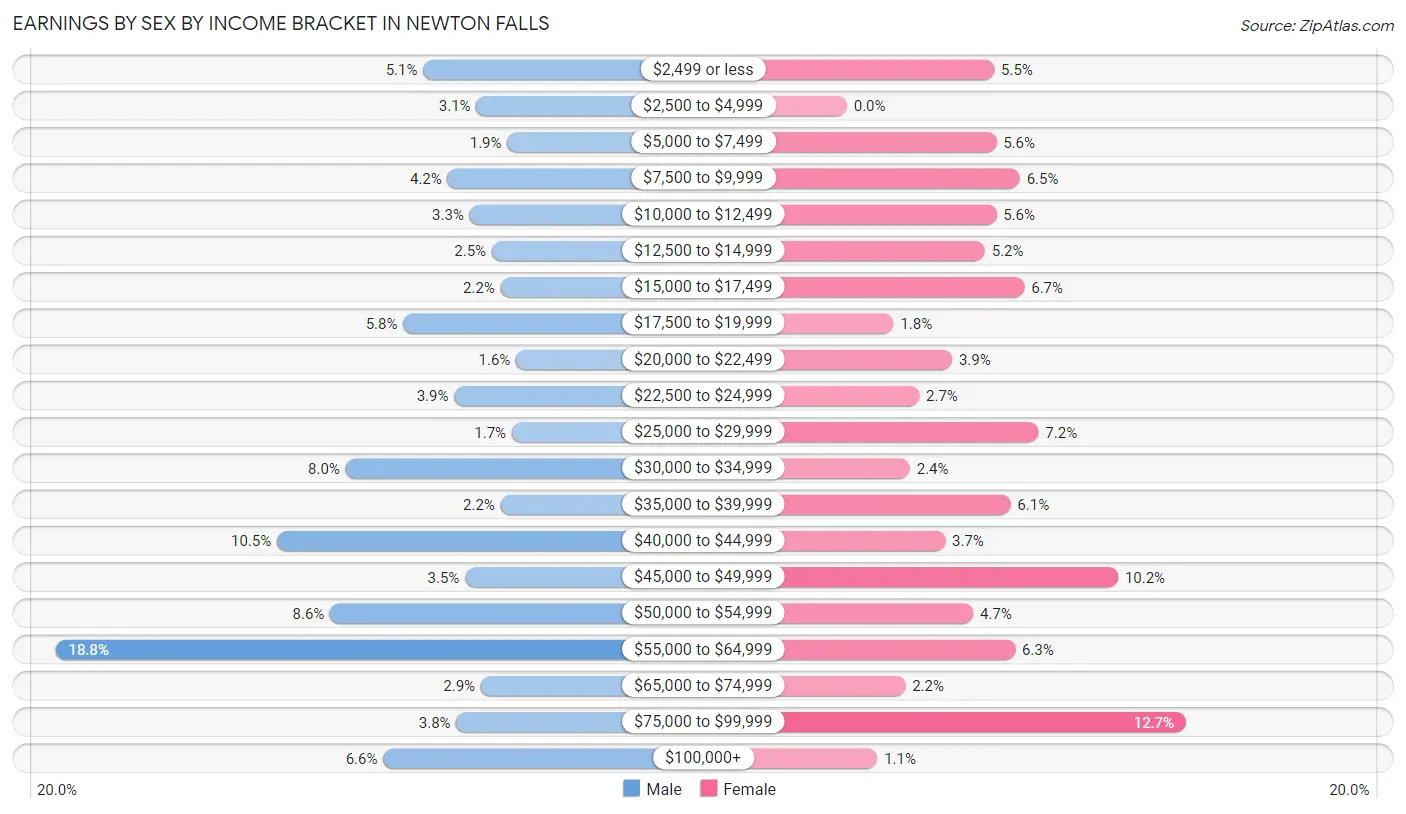
Earnings by Sex by Income Bracket in Newton Falls
The most common earnings brackets in Newton Falls are $55,000 to $64,999 for men (227 | 18.8%) and $75,000 to $99,999 for women (145 | 12.7%).
| Income | Male | Female |
| $2,499 or less | 61 (5.1%) | 63 (5.5%) |
| $2,500 to $4,999 | 37 (3.1%) | 0 (0.0%) |
| $5,000 to $7,499 | 23 (1.9%) | 64 (5.6%) |
| $7,500 to $9,999 | 50 (4.2%) | 74 (6.5%) |
| $10,000 to $12,499 | 40 (3.3%) | 64 (5.6%) |
| $12,500 to $14,999 | 30 (2.5%) | 59 (5.2%) |
| $15,000 to $17,499 | 26 (2.2%) | 76 (6.7%) |
| $17,500 to $19,999 | 70 (5.8%) | 20 (1.8%) |
| $20,000 to $22,499 | 19 (1.6%) | 45 (3.9%) |
| $22,500 to $24,999 | 47 (3.9%) | 31 (2.7%) |
| $25,000 to $29,999 | 21 (1.7%) | 82 (7.2%) |
| $30,000 to $34,999 | 96 (8.0%) | 27 (2.4%) |
| $35,000 to $39,999 | 26 (2.2%) | 70 (6.1%) |
| $40,000 to $44,999 | 127 (10.5%) | 42 (3.7%) |
| $45,000 to $49,999 | 42 (3.5%) | 116 (10.2%) |
| $50,000 to $54,999 | 103 (8.6%) | 54 (4.7%) |
| $55,000 to $64,999 | 227 (18.8%) | 72 (6.3%) |
| $65,000 to $74,999 | 35 (2.9%) | 25 (2.2%) |
| $75,000 to $99,999 | 46 (3.8%) | 145 (12.7%) |
| $100,000+ | 79 (6.6%) | 13 (1.1%) |
| Total | 1,205 (100.0%) | 1,142 (100.0%) |
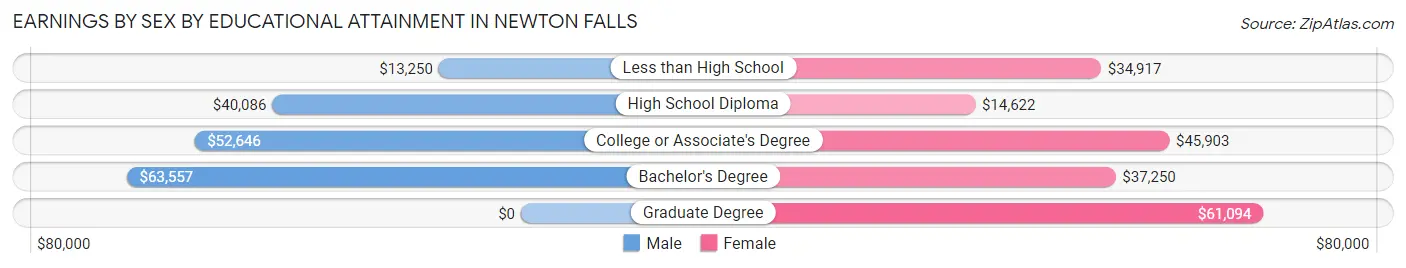
Earnings by Sex by Educational Attainment in Newton Falls
Average earnings in Newton Falls are $47,986 for men and $37,674 for women, a difference of 21.5%. Men with an educational attainment of bachelor's degree enjoy the highest average annual earnings of $63,557, while those with less than high school education earn the least with $13,250. Women with an educational attainment of graduate degree earn the most with the average annual earnings of $61,094, while those with high school diploma education have the smallest earnings of $14,622.
| Educational Attainment | Male Income | Female Income |
| Less than High School | $13,250 | $34,917 |
| High School Diploma | $40,086 | $14,622 |
| College or Associate's Degree | $52,646 | $45,903 |
| Bachelor's Degree | $63,557 | $37,250 |
| Graduate Degree | - | - |
| Total | $47,986 | $37,674 |
Family Income in Newton Falls
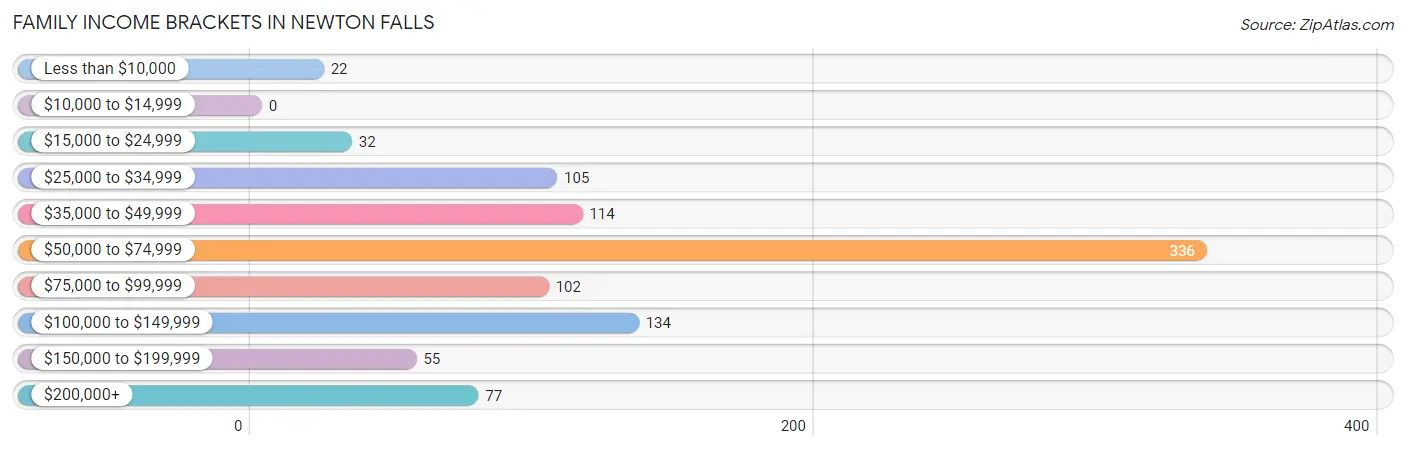
Family Income Brackets in Newton Falls
According to the Newton Falls family income data, there are 336 families falling into the $50,000 to $74,999 income range, which is the most common income bracket and makes up 34.4% of all families.
| Income Bracket | # Families | % Families |
| Less than $10,000 | 22 | 2.3% |
| $10,000 to $14,999 | 0 | 0.0% |
| $15,000 to $24,999 | 32 | 3.3% |
| $25,000 to $34,999 | 105 | 10.7% |
| $35,000 to $49,999 | 114 | 11.7% |
| $50,000 to $74,999 | 336 | 34.4% |
| $75,000 to $99,999 | 102 | 10.4% |
| $100,000 to $149,999 | 134 | 13.7% |
| $150,000 to $199,999 | 55 | 5.6% |
| $200,000+ | 77 | 7.9% |
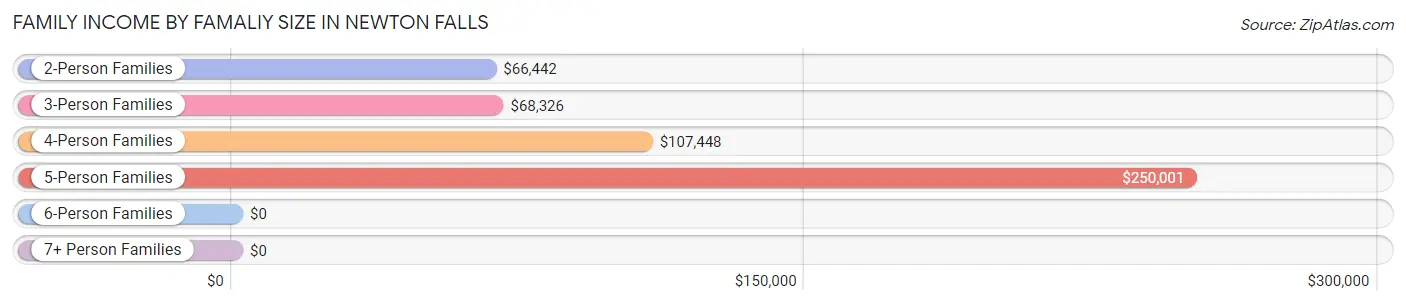
Family Income by Famaliy Size in Newton Falls
5-person families (94 | 9.6%) account for the highest median family income in Newton Falls with $250,001 per family, while 5-person families (94 | 9.6%) have the highest median income of $50,000 per family member.
| Income Bracket | # Families | Median Income |
| 2-Person Families | 437 (44.7%) | $66,442 |
| 3-Person Families | 351 (35.9%) | $68,326 |
| 4-Person Families | 83 (8.5%) | $107,448 |
| 5-Person Families | 94 (9.6%) | $250,001 |
| 6-Person Families | 12 (1.2%) | $0 |
| 7+ Person Families | 0 (0.0%) | $0 |
| Total | 977 (100.0%) | $71,250 |
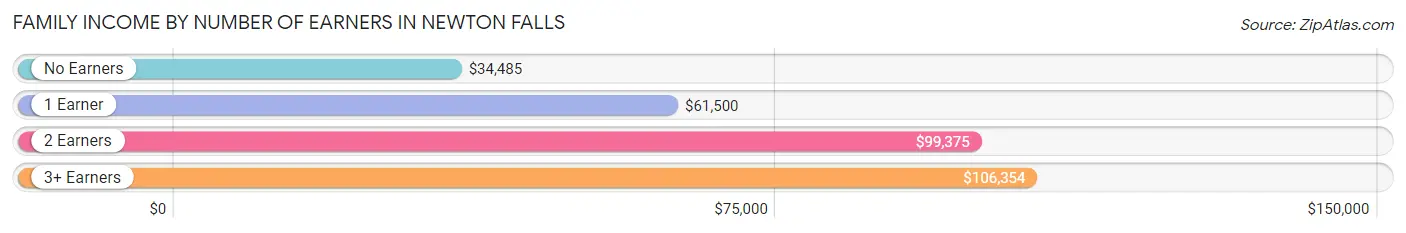
Family Income by Number of Earners in Newton Falls
The median family income in Newton Falls is $71,250, with families comprising 3+ earners (168) having the highest median family income of $106,354, while families with no earners (169) have the lowest median family income of $34,485, accounting for 17.2% and 17.3% of families, respectively.
| Number of Earners | # Families | Median Income |
| No Earners | 169 (17.3%) | $34,485 |
| 1 Earner | 334 (34.2%) | $61,500 |
| 2 Earners | 306 (31.3%) | $99,375 |
| 3+ Earners | 168 (17.2%) | $106,354 |
| Total | 977 (100.0%) | $71,250 |
Household Income in Newton Falls
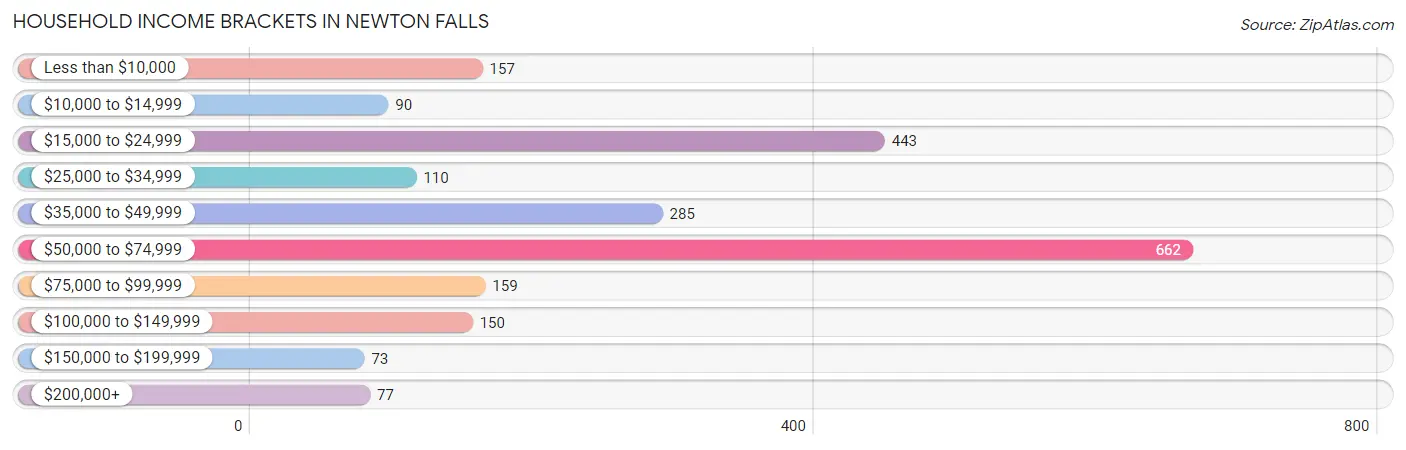
Household Income Brackets in Newton Falls
With 662 households falling in the category, the $50,000 to $74,999 income range is the most frequent in Newton Falls, accounting for 30.0% of all households. In contrast, only 73 households (3.3%) fall into the $150,000 to $199,999 income bracket, making it the least populous group.
| Income Bracket | # Households | % Households |
| Less than $10,000 | 157 | 7.1% |
| $10,000 to $14,999 | 90 | 4.1% |
| $15,000 to $24,999 | 443 | 20.1% |
| $25,000 to $34,999 | 110 | 5.0% |
| $35,000 to $49,999 | 285 | 12.9% |
| $50,000 to $74,999 | 662 | 30.0% |
| $75,000 to $99,999 | 159 | 7.2% |
| $100,000 to $149,999 | 150 | 6.8% |
| $150,000 to $199,999 | 73 | 3.3% |
| $200,000+ | 77 | 3.5% |
Household Income by Householder Age in Newton Falls
The median household income in Newton Falls is $50,738, with the highest median household income of $69,442 found in the 25 to 44 years age bracket for the primary householder. A total of 359 households (16.3%) fall into this category. Meanwhile, the 65+ years age bracket for the primary householder has the lowest median household income of $33,405, with 875 households (39.7%) in this group.
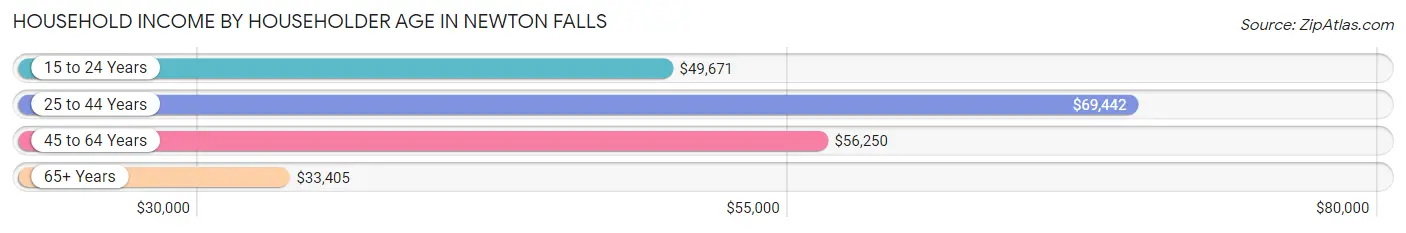
| Income Bracket | # Households | Median Income |
| 15 to 24 Years | 93 (4.2%) | $49,671 |
| 25 to 44 Years | 359 (16.3%) | $69,442 |
| 45 to 64 Years | 879 (39.9%) | $56,250 |
| 65+ Years | 875 (39.7%) | $33,405 |
| Total | 2,206 (100.0%) | $50,738 |
Poverty in Newton Falls
Income Below Poverty by Sex and Age in Newton Falls
With 10.4% poverty level for males and 13.2% for females among the residents of Newton Falls, 12 to 14 year old males and 45 to 54 year old females are the most vulnerable to poverty, with 27 males (100.0%) and 149 females (40.8%) in their respective age groups living below the poverty level.
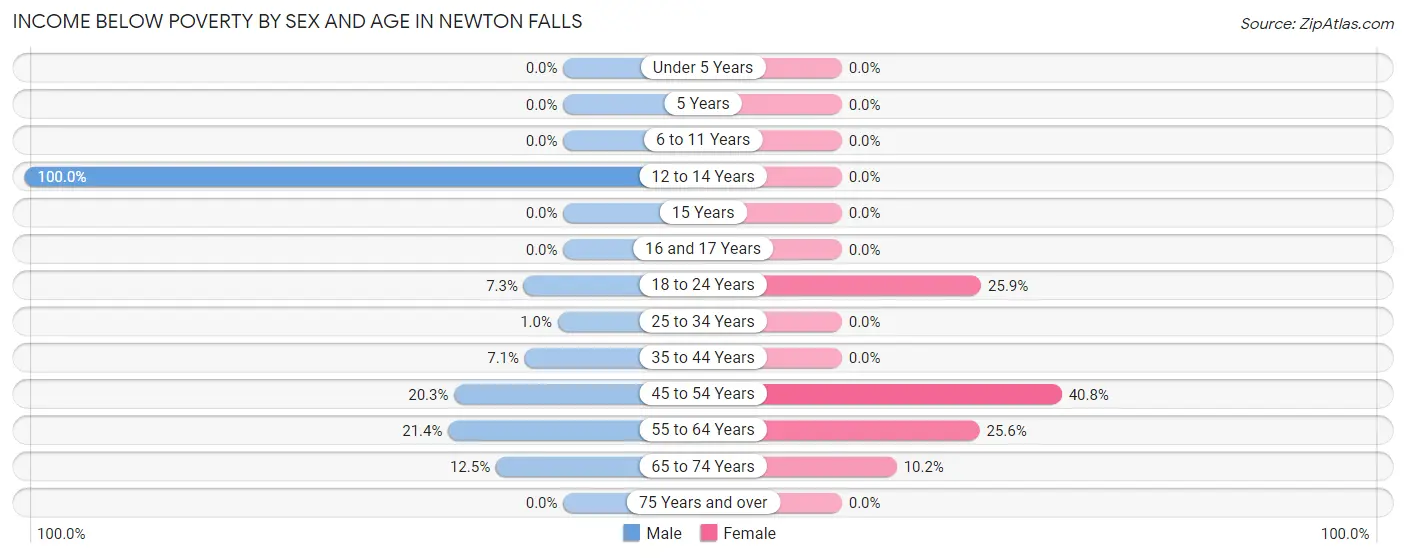
| Age Bracket | Male | Female |
| Under 5 Years | 0 (0.0%) | 0 (0.0%) |
| 5 Years | 0 (0.0%) | 0 (0.0%) |
| 6 to 11 Years | 0 (0.0%) | 0 (0.0%) |
| 12 to 14 Years | 27 (100.0%) | 0 (0.0%) |
| 15 Years | 0 (0.0%) | 0 (0.0%) |
| 16 and 17 Years | 0 (0.0%) | 0 (0.0%) |
| 18 to 24 Years | 16 (7.3%) | 30 (25.9%) |
| 25 to 34 Years | 3 (1.0%) | 0 (0.0%) |
| 35 to 44 Years | 14 (7.1%) | 0 (0.0%) |
| 45 to 54 Years | 81 (20.3%) | 149 (40.8%) |
| 55 to 64 Years | 44 (21.4%) | 101 (25.6%) |
| 65 to 74 Years | 35 (12.5%) | 32 (10.2%) |
| 75 Years and over | 0 (0.0%) | 0 (0.0%) |
| Total | 220 (10.4%) | 312 (13.2%) |
Income Above Poverty by Sex and Age in Newton Falls
According to the poverty statistics in Newton Falls, males aged under 5 years and females aged under 5 years are the age groups that are most secure financially, with 100.0% of males and 100.0% of females in these age groups living above the poverty line.
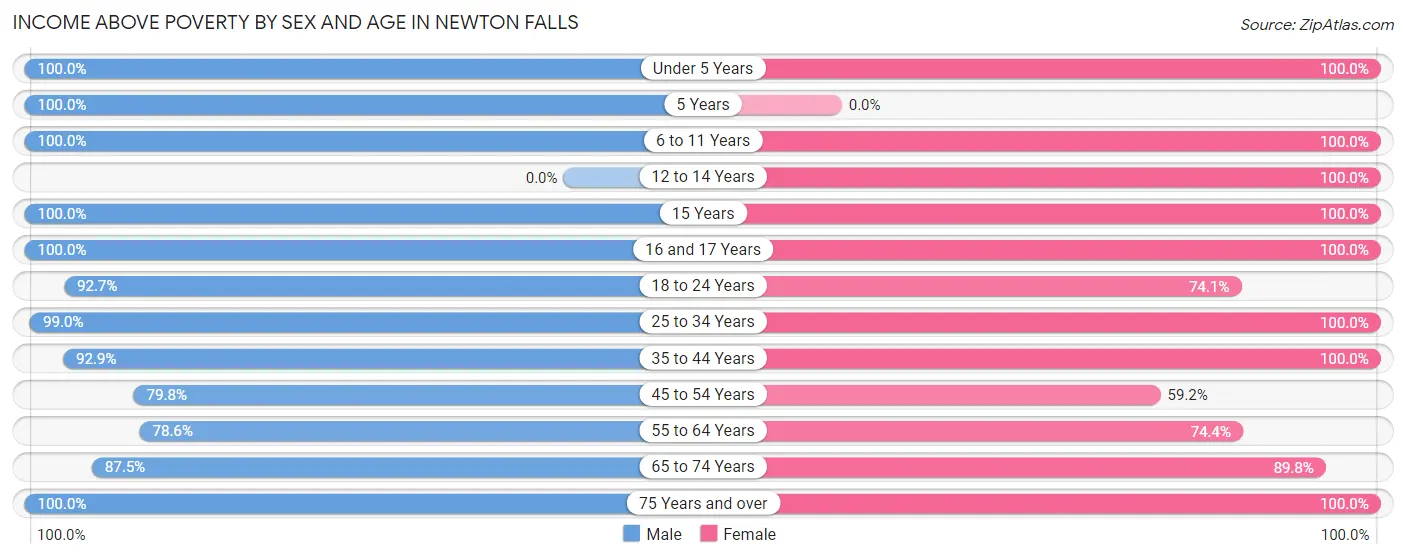
| Age Bracket | Male | Female |
| Under 5 Years | 106 (100.0%) | 81 (100.0%) |
| 5 Years | 32 (100.0%) | 0 (0.0%) |
| 6 to 11 Years | 86 (100.0%) | 127 (100.0%) |
| 12 to 14 Years | 0 (0.0%) | 91 (100.0%) |
| 15 Years | 20 (100.0%) | 23 (100.0%) |
| 16 and 17 Years | 39 (100.0%) | 39 (100.0%) |
| 18 to 24 Years | 202 (92.7%) | 86 (74.1%) |
| 25 to 34 Years | 289 (99.0%) | 300 (100.0%) |
| 35 to 44 Years | 182 (92.9%) | 217 (100.0%) |
| 45 to 54 Years | 319 (79.7%) | 216 (59.2%) |
| 55 to 64 Years | 162 (78.6%) | 294 (74.4%) |
| 65 to 74 Years | 245 (87.5%) | 282 (89.8%) |
| 75 Years and over | 222 (100.0%) | 302 (100.0%) |
| Total | 1,904 (89.6%) | 2,058 (86.8%) |
Income Below Poverty Among Married-Couple Families in Newton Falls
The poverty statistics for married-couple families in Newton Falls show that 4.3% or 28 of the total 647 families live below the poverty line. Families with 1 or 2 children have the highest poverty rate of 5.0%, comprising of 6 families. On the other hand, families with 3 or 4 children have the lowest poverty rate of 0.0%, which includes 0 families.
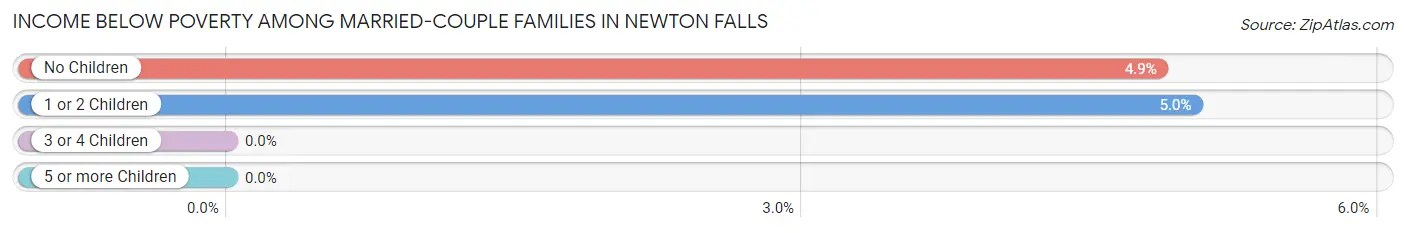
| Children | Above Poverty | Below Poverty |
| No Children | 431 (95.1%) | 22 (4.9%) |
| 1 or 2 Children | 113 (95.0%) | 6 (5.0%) |
| 3 or 4 Children | 75 (100.0%) | 0 (0.0%) |
| 5 or more Children | 0 (0.0%) | 0 (0.0%) |
| Total | 619 (95.7%) | 28 (4.3%) |
Income Below Poverty Among Single-Parent Households in Newton Falls
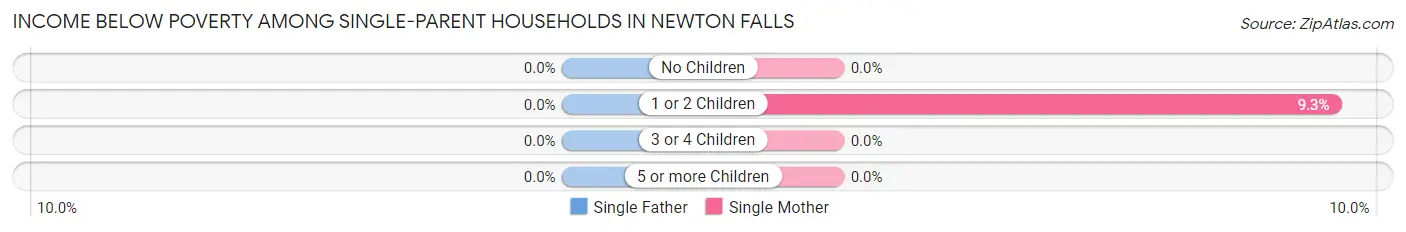
| Children | Single Father | Single Mother |
| No Children | 0 (0.0%) | 0 (0.0%) |
| 1 or 2 Children | 0 (0.0%) | 14 (9.3%) |
| 3 or 4 Children | 0 (0.0%) | 0 (0.0%) |
| 5 or more Children | 0 (0.0%) | 0 (0.0%) |
| Total | 0 (0.0%) | 14 (5.7%) |
Income Below Poverty Among Married-Couple vs Single-Parent Households in Newton Falls
The poverty data for Newton Falls shows that 28 of the married-couple family households (4.3%) and 14 of the single-parent households (4.2%) are living below the poverty level. Within the married-couple family households, those with 1 or 2 children have the highest poverty rate, with 6 households (5.0%) falling below the poverty line. Among the single-parent households, those with 1 or 2 children have the highest poverty rate, with 14 household (6.9%) living below poverty.
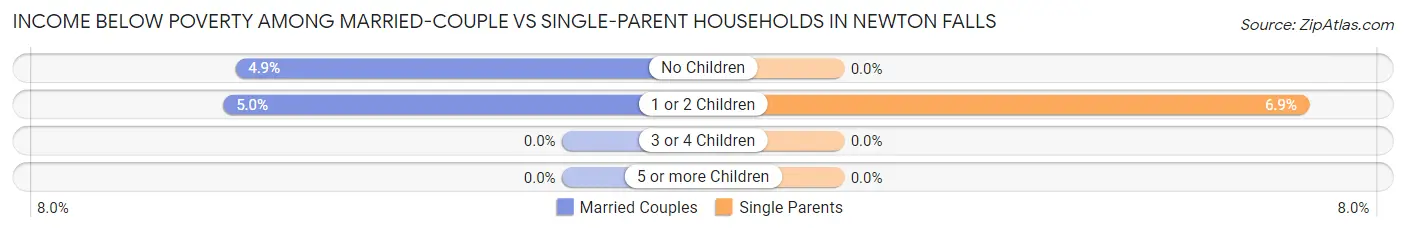
| Children | Married-Couple Families | Single-Parent Households |
| No Children | 22 (4.9%) | 0 (0.0%) |
| 1 or 2 Children | 6 (5.0%) | 14 (6.9%) |
| 3 or 4 Children | 0 (0.0%) | 0 (0.0%) |
| 5 or more Children | 0 (0.0%) | 0 (0.0%) |
| Total | 28 (4.3%) | 14 (4.2%) |
Race in Newton Falls
The most populous races in Newton Falls are White / Caucasian (4,369 | 95.8%), Asian (74 | 1.6%), and Black / African American (62 | 1.4%).
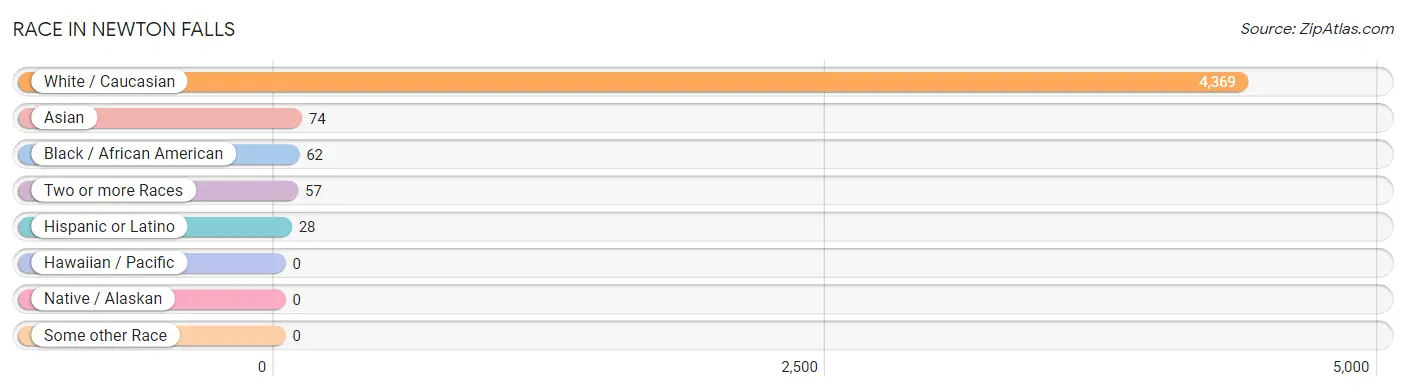
| Race | # Population | % Population |
| Asian | 74 | 1.6% |
| Black / African American | 62 | 1.4% |
| Hawaiian / Pacific | 0 | 0.0% |
| Hispanic or Latino | 28 | 0.6% |
| Native / Alaskan | 0 | 0.0% |
| White / Caucasian | 4,369 | 95.8% |
| Two or more Races | 57 | 1.3% |
| Some other Race | 0 | 0.0% |
| Total | 4,562 | 100.0% |
Ancestry in Newton Falls
The most populous ancestries reported in Newton Falls are American (1,152 | 25.3%), German (976 | 21.4%), English (525 | 11.5%), Irish (503 | 11.0%), and Italian (143 | 3.1%), together accounting for 72.3% of all Newton Falls residents.
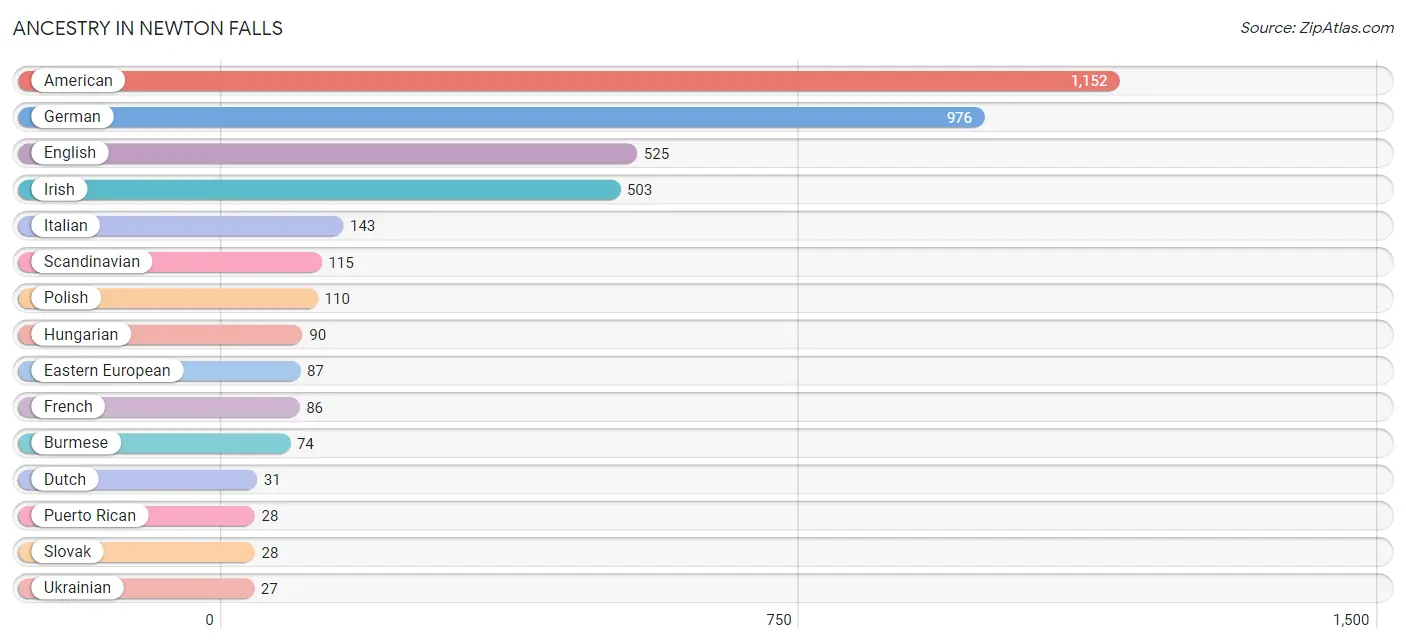
| Ancestry | # Population | % Population |
| American | 1,152 | 25.3% |
| Austrian | 20 | 0.4% |
| Burmese | 74 | 1.6% |
| Croatian | 17 | 0.4% |
| Dutch | 31 | 0.7% |
| Eastern European | 87 | 1.9% |
| English | 525 | 11.5% |
| French | 86 | 1.9% |
| German | 976 | 21.4% |
| Greek | 14 | 0.3% |
| Hungarian | 90 | 2.0% |
| Irish | 503 | 11.0% |
| Italian | 143 | 3.1% |
| Lithuanian | 17 | 0.4% |
| Pennsylvania German | 12 | 0.3% |
| Polish | 110 | 2.4% |
| Puerto Rican | 28 | 0.6% |
| Romanian | 26 | 0.6% |
| Scandinavian | 115 | 2.5% |
| Scotch-Irish | 16 | 0.4% |
| Scottish | 17 | 0.4% |
| Slovak | 28 | 0.6% |
| Swedish | 14 | 0.3% |
| Ukrainian | 27 | 0.6% |
| Welsh | 17 | 0.4% | View All 25 Rows |
Immigrants in Newton Falls
The most numerous immigrant groups reported in Newton Falls came from Asia (74 | 1.6%), Eastern Asia (74 | 1.6%), and Korea (74 | 1.6%), together accounting for 4.9% of all Newton Falls residents.
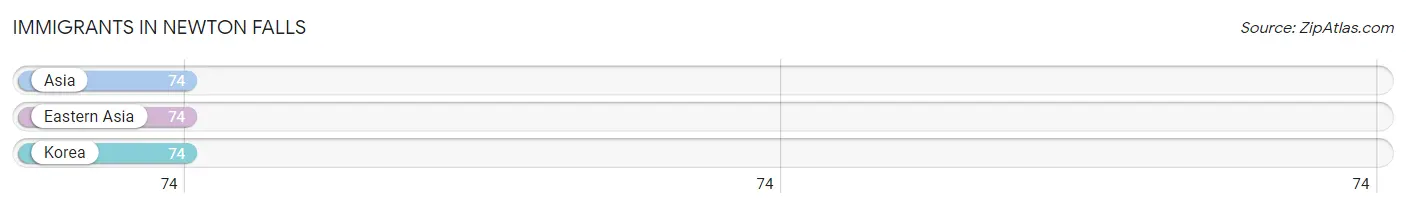
| Immigration Origin | # Population | % Population |
| Asia | 74 | 1.6% |
| Eastern Asia | 74 | 1.6% |
| Korea | 74 | 1.6% | View All 3 Rows |
Sex and Age in Newton Falls
Sex and Age in Newton Falls
The most populous age groups in Newton Falls are 50 to 54 Years (303 | 14.2%) for men and 60 to 64 Years (265 | 10.9%) for women.
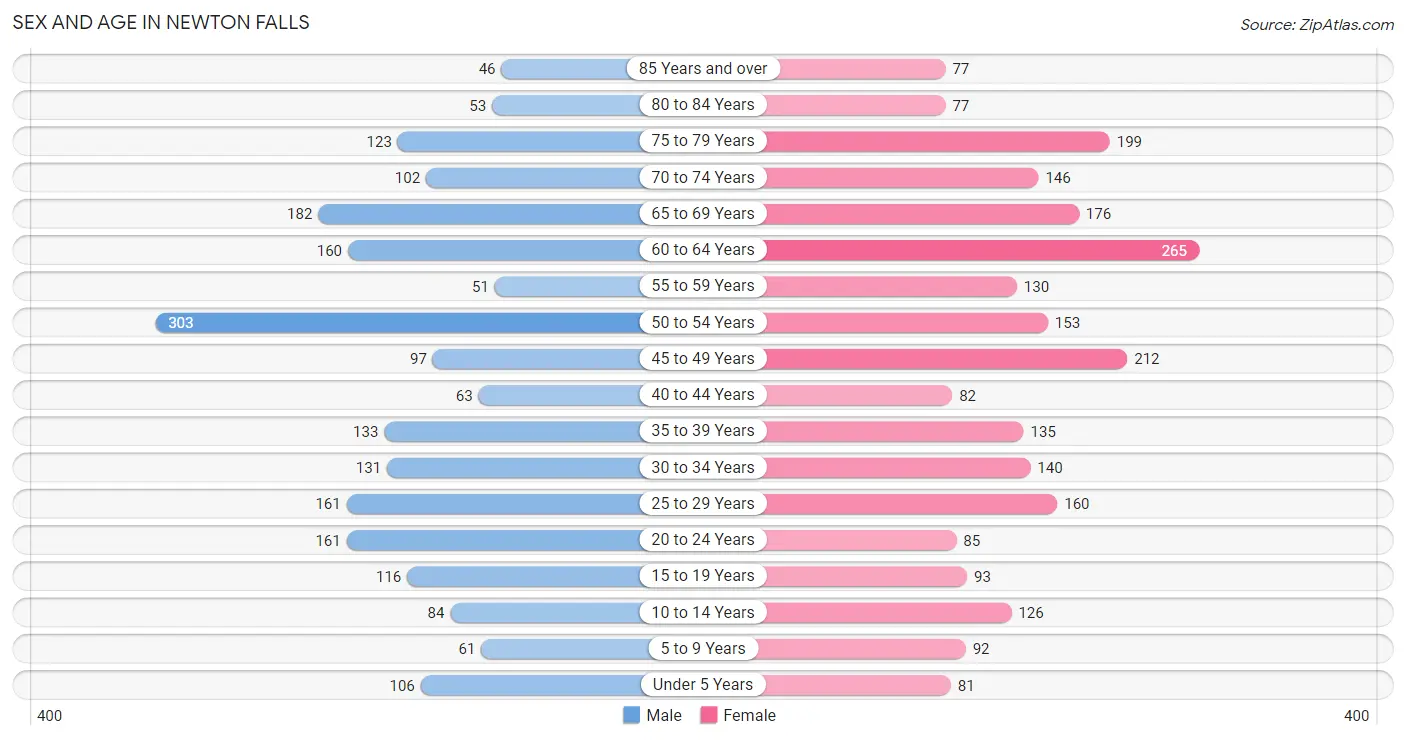
| Age Bracket | Male | Female |
| Under 5 Years | 106 (5.0%) | 81 (3.3%) |
| 5 to 9 Years | 61 (2.9%) | 92 (3.8%) |
| 10 to 14 Years | 84 (3.9%) | 126 (5.2%) |
| 15 to 19 Years | 116 (5.4%) | 93 (3.8%) |
| 20 to 24 Years | 161 (7.5%) | 85 (3.5%) |
| 25 to 29 Years | 161 (7.5%) | 160 (6.6%) |
| 30 to 34 Years | 131 (6.1%) | 140 (5.8%) |
| 35 to 39 Years | 133 (6.2%) | 135 (5.6%) |
| 40 to 44 Years | 63 (2.9%) | 82 (3.4%) |
| 45 to 49 Years | 97 (4.5%) | 212 (8.7%) |
| 50 to 54 Years | 303 (14.2%) | 153 (6.3%) |
| 55 to 59 Years | 51 (2.4%) | 130 (5.3%) |
| 60 to 64 Years | 160 (7.5%) | 265 (10.9%) |
| 65 to 69 Years | 182 (8.5%) | 176 (7.2%) |
| 70 to 74 Years | 102 (4.8%) | 146 (6.0%) |
| 75 to 79 Years | 123 (5.8%) | 199 (8.2%) |
| 80 to 84 Years | 53 (2.5%) | 77 (3.2%) |
| 85 Years and over | 46 (2.2%) | 77 (3.2%) |
| Total | 2,133 (100.0%) | 2,429 (100.0%) |
Families and Households in Newton Falls
Median Family Size in Newton Falls
The median family size in Newton Falls is 2.97 persons per family, with married-couple families (647 | 66.2%) accounting for the largest median family size of 3.07 persons per family. On the other hand, single male/father families (82 | 8.4%) represent the smallest median family size with 2.45 persons per family.
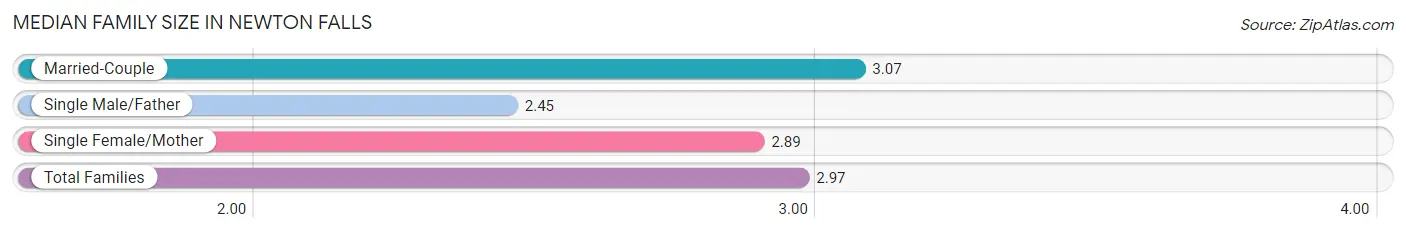
| Family Type | # Families | Family Size |
| Married-Couple | 647 (66.2%) | 3.07 |
| Single Male/Father | 82 (8.4%) | 2.45 |
| Single Female/Mother | 248 (25.4%) | 2.89 |
| Total Families | 977 (100.0%) | 2.97 |
Median Household Size in Newton Falls
The median household size in Newton Falls is 2.03 persons per household, with single male/father households (82 | 3.7%) accounting for the largest median household size of 3.28 persons per household. non-family households (1,229 | 55.7%) represent the smallest median household size with 1.21 persons per household.
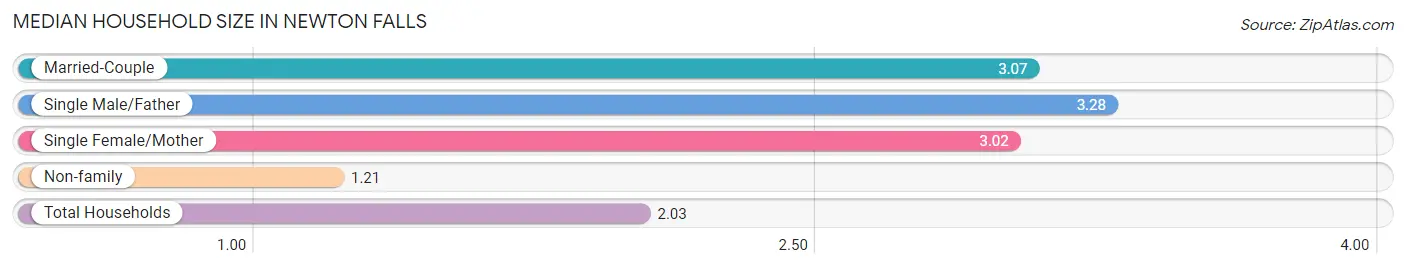
| Household Type | # Households | Household Size |
| Married-Couple | 647 (29.3%) | 3.07 |
| Single Male/Father | 82 (3.7%) | 3.28 |
| Single Female/Mother | 248 (11.2%) | 3.02 |
| Non-family | 1,229 (55.7%) | 1.21 |
| Total Households | 2,206 (100.0%) | 2.03 |
Household Size by Marriage Status in Newton Falls
Out of a total of 2,206 households in Newton Falls, 977 (44.3%) are family households, while 1,229 (55.7%) are nonfamily households. The most numerous type of family households are 2-person households, comprising 386, and the most common type of nonfamily households are 1-person households, comprising 995.
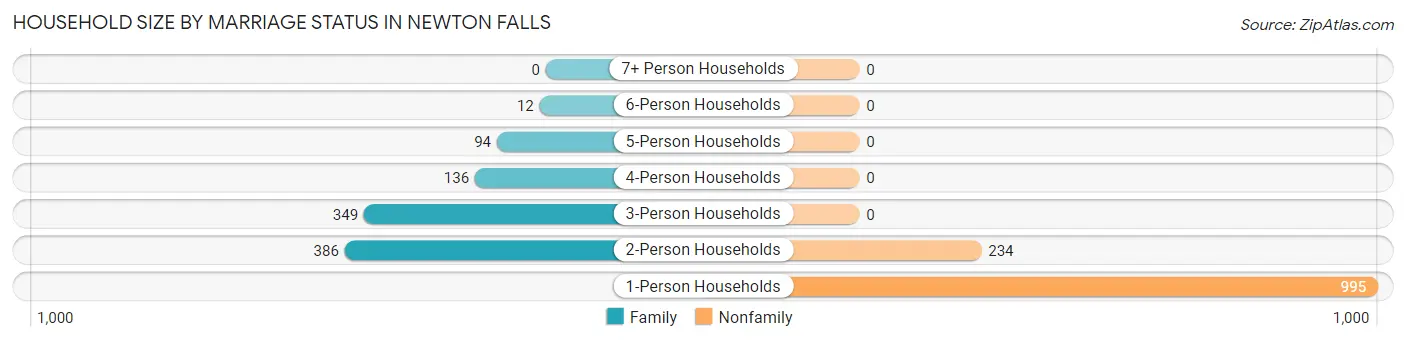
| Household Size | Family Households | Nonfamily Households |
| 1-Person Households | - | 995 (45.1%) |
| 2-Person Households | 386 (17.5%) | 234 (10.6%) |
| 3-Person Households | 349 (15.8%) | 0 (0.0%) |
| 4-Person Households | 136 (6.2%) | 0 (0.0%) |
| 5-Person Households | 94 (4.3%) | 0 (0.0%) |
| 6-Person Households | 12 (0.5%) | 0 (0.0%) |
| 7+ Person Households | 0 (0.0%) | 0 (0.0%) |
| Total | 977 (44.3%) | 1,229 (55.7%) |
Female Fertility in Newton Falls
Fertility by Age in Newton Falls
Average fertility rate in Newton Falls is 30.0 births per 1,000 women. Women in the age bracket of 20 to 34 years have the highest fertility rate with 73.0 births per 1,000 women. Women in the age bracket of 20 to 34 years acount for 100.0% of all women with births.
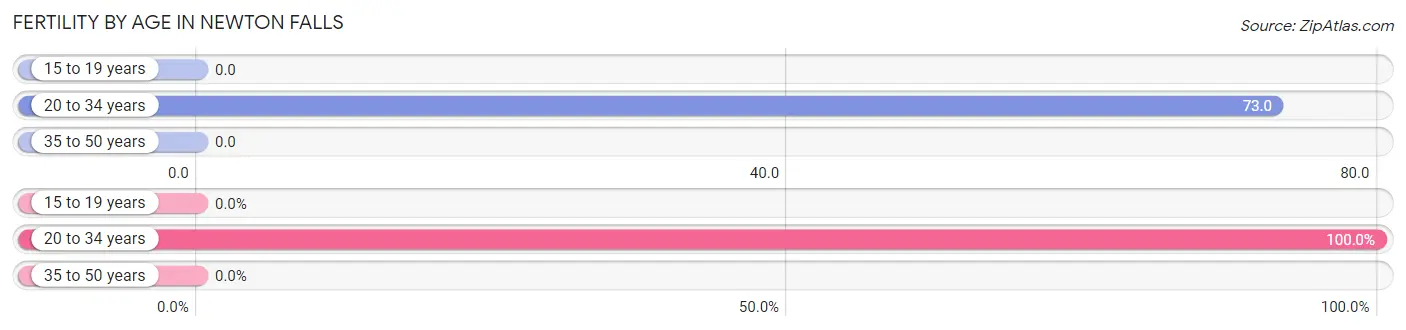
| Age Bracket | Women with Births | Births / 1,000 Women |
| 15 to 19 years | 0 (0.0%) | 0.0 |
| 20 to 34 years | 28 (100.0%) | 73.0 |
| 35 to 50 years | 0 (0.0%) | 0.0 |
| Total | 28 (100.0%) | 30.0 |
Fertility by Age by Marriage Status in Newton Falls
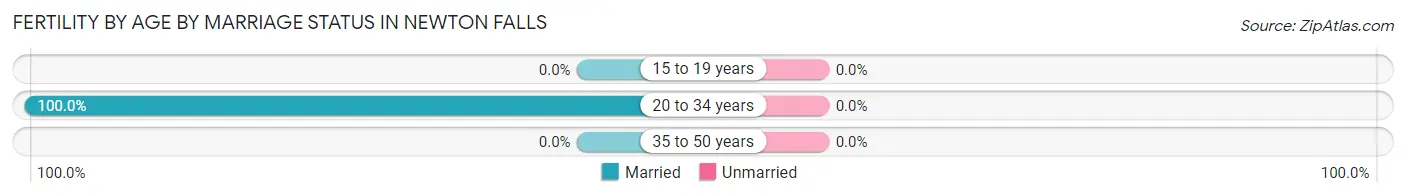
| Age Bracket | Married | Unmarried |
| 15 to 19 years | 0 (0.0%) | 0 (0.0%) |
| 20 to 34 years | 28 (100.0%) | 0 (0.0%) |
| 35 to 50 years | 0 (0.0%) | 0 (0.0%) |
| Total | 28 (100.0%) | 0 (0.0%) |
Fertility by Education in Newton Falls
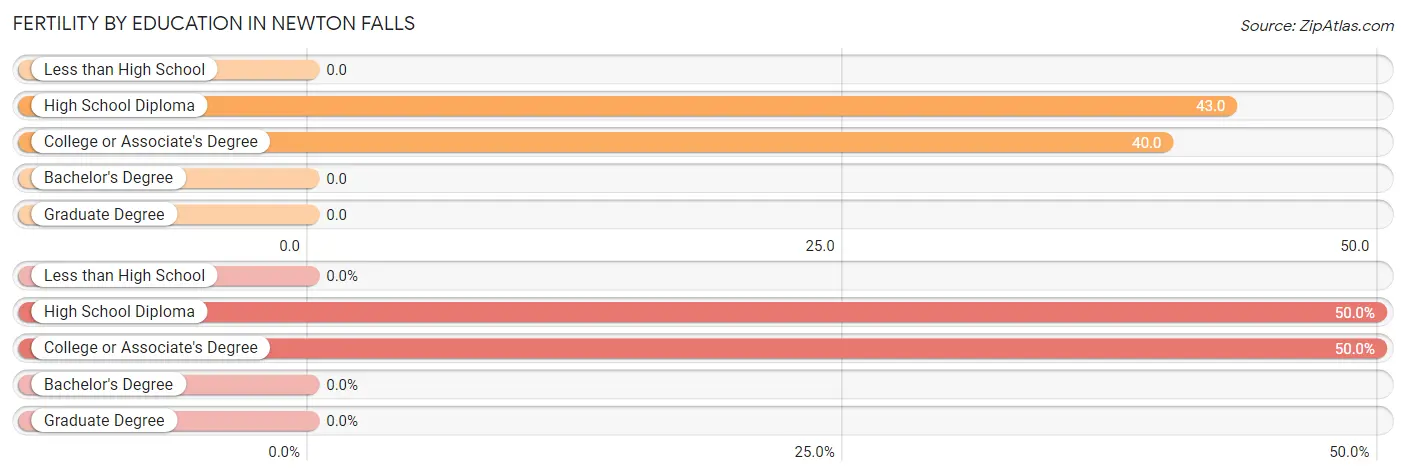
| Educational Attainment | Women with Births | Births / 1,000 Women |
| Less than High School | 0 (0.0%) | 0.0 |
| High School Diploma | 14 (50.0%) | 43.0 |
| College or Associate's Degree | 14 (50.0%) | 40.0 |
| Bachelor's Degree | 0 (0.0%) | 0.0 |
| Graduate Degree | 0 (0.0%) | 0.0 |
| Total | 28 (100.0%) | 30.0 |
Fertility by Education by Marriage Status in Newton Falls
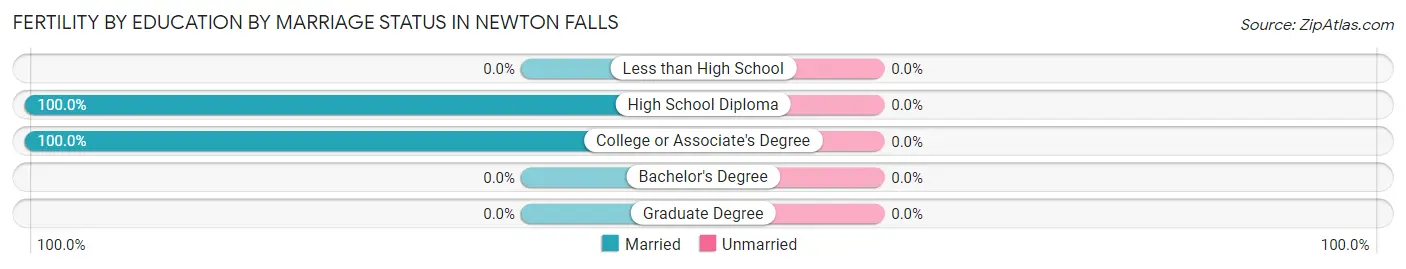
| Educational Attainment | Married | Unmarried |
| Less than High School | 0 (0.0%) | 0 (0.0%) |
| High School Diploma | 14 (100.0%) | 0 (0.0%) |
| College or Associate's Degree | 14 (100.0%) | 0 (0.0%) |
| Bachelor's Degree | 0 (0.0%) | 0 (0.0%) |
| Graduate Degree | 0 (0.0%) | 0 (0.0%) |
| Total | 28 (100.0%) | 0 (0.0%) |
Employment Characteristics in Newton Falls
Employment by Class of Employer in Newton Falls
Among the 2,041 employed individuals in Newton Falls, private company employees (1,619 | 79.3%), local government employees (266 | 13.0%), and not-for-profit organizations (63 | 3.1%) make up the most common classes of employment.
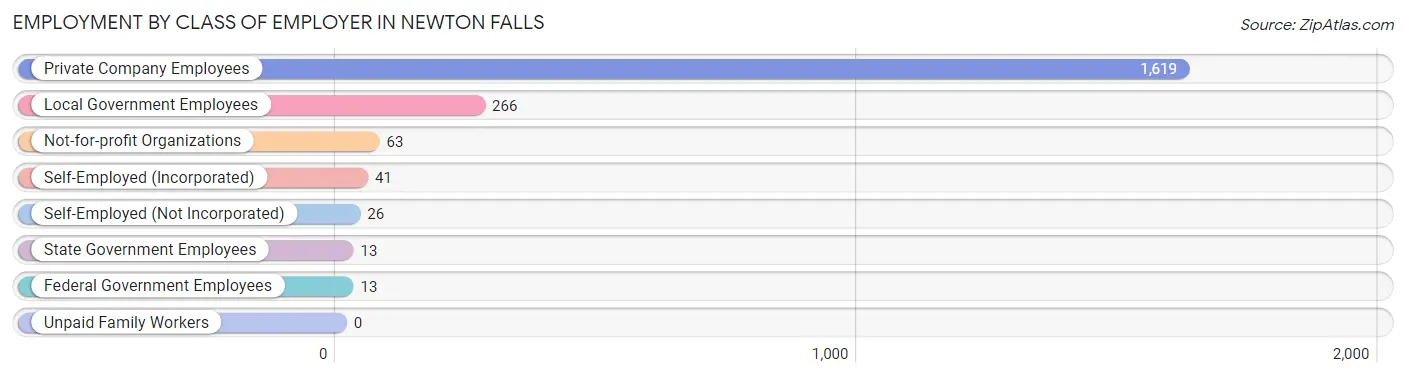
| Employer Class | # Employees | % Employees |
| Private Company Employees | 1,619 | 79.3% |
| Self-Employed (Incorporated) | 41 | 2.0% |
| Self-Employed (Not Incorporated) | 26 | 1.3% |
| Not-for-profit Organizations | 63 | 3.1% |
| Local Government Employees | 266 | 13.0% |
| State Government Employees | 13 | 0.6% |
| Federal Government Employees | 13 | 0.6% |
| Unpaid Family Workers | 0 | 0.0% |
| Total | 2,041 | 100.0% |
Employment Status by Age in Newton Falls
According to the labor force statistics for Newton Falls, out of the total population over 16 years of age (3,969), 57.2% or 2,270 individuals are in the labor force, with 6.9% or 157 of them unemployed. The age group with the highest labor force participation rate is 25 to 29 years, with 99.1% or 318 individuals in the labor force. Within the labor force, the 30 to 34 years age range has the highest percentage of unemployed individuals, with 14.1% or 31 of them being unemployed.
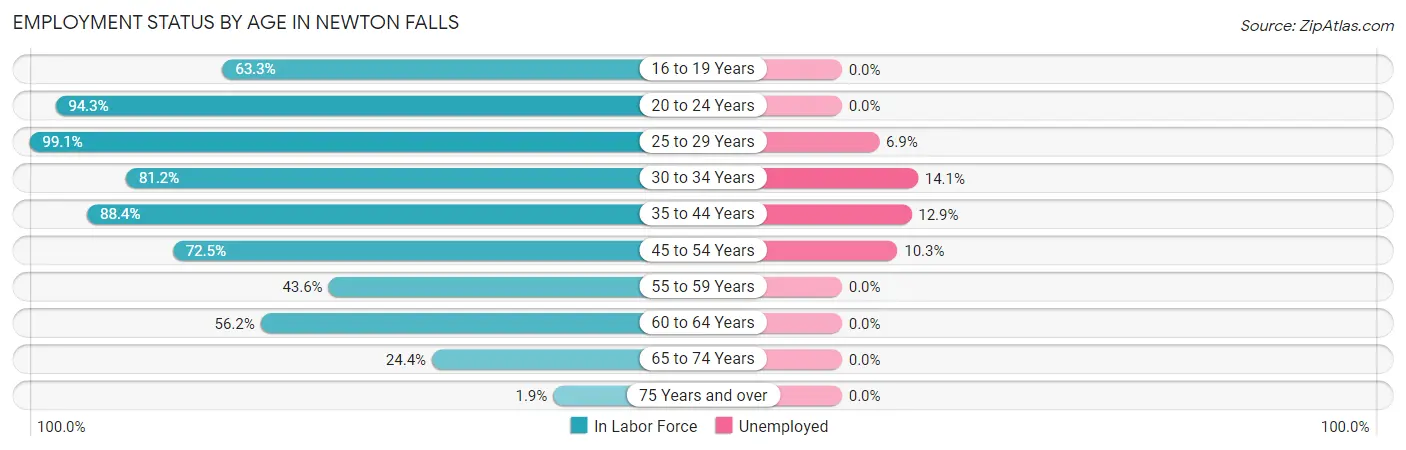
| Age Bracket | In Labor Force | Unemployed |
| 16 to 19 Years | 105 (63.3%) | 0 (0.0%) |
| 20 to 24 Years | 232 (94.3%) | 0 (0.0%) |
| 25 to 29 Years | 318 (99.1%) | 22 (6.9%) |
| 30 to 34 Years | 220 (81.2%) | 31 (14.1%) |
| 35 to 44 Years | 365 (88.4%) | 47 (12.9%) |
| 45 to 54 Years | 555 (72.5%) | 57 (10.3%) |
| 55 to 59 Years | 79 (43.6%) | 0 (0.0%) |
| 60 to 64 Years | 239 (56.2%) | 0 (0.0%) |
| 65 to 74 Years | 148 (24.4%) | 0 (0.0%) |
| 75 Years and over | 11 (1.9%) | 0 (0.0%) |
| Total | 2,270 (57.2%) | 157 (6.9%) |
Employment Status by Educational Attainment in Newton Falls
According to labor force statistics for Newton Falls, 74.7% of individuals (1,775) out of the total population between 25 and 64 years of age (2,376) are in the labor force, with 8.8% or 156 of them being unemployed. The group with the highest labor force participation rate are those with the educational attainment of bachelor's degree or higher, with 87.4% or 402 individuals in the labor force. Within the labor force, individuals with high school diploma education have the highest percentage of unemployment, with 20.1% or 128 of them being unemployed.
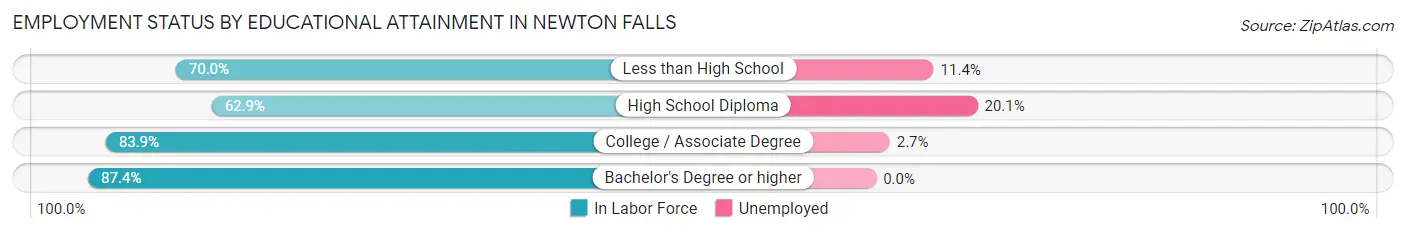
| Educational Attainment | In Labor Force | Unemployed |
| Less than High School | 105 (70.0%) | 17 (11.4%) |
| High School Diploma | 638 (62.9%) | 204 (20.1%) |
| College / Associate Degree | 631 (83.9%) | 20 (2.7%) |
| Bachelor's Degree or higher | 402 (87.4%) | 0 (0.0%) |
| Total | 1,775 (74.7%) | 209 (8.8%) |
Employment Occupations by Sex in Newton Falls
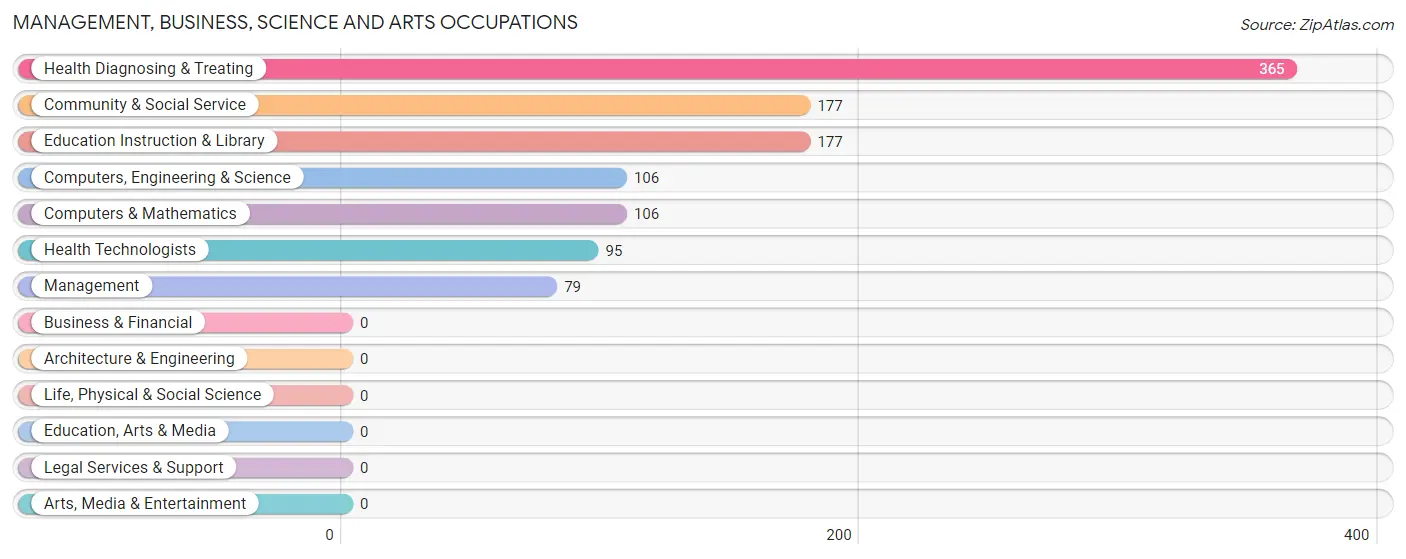
Management, Business, Science and Arts Occupations
The most common Management, Business, Science and Arts occupations in Newton Falls are Health Diagnosing & Treating (365 | 17.3%), Community & Social Service (177 | 8.4%), Education Instruction & Library (177 | 8.4%), Computers, Engineering & Science (106 | 5.0%), and Computers & Mathematics (106 | 5.0%).
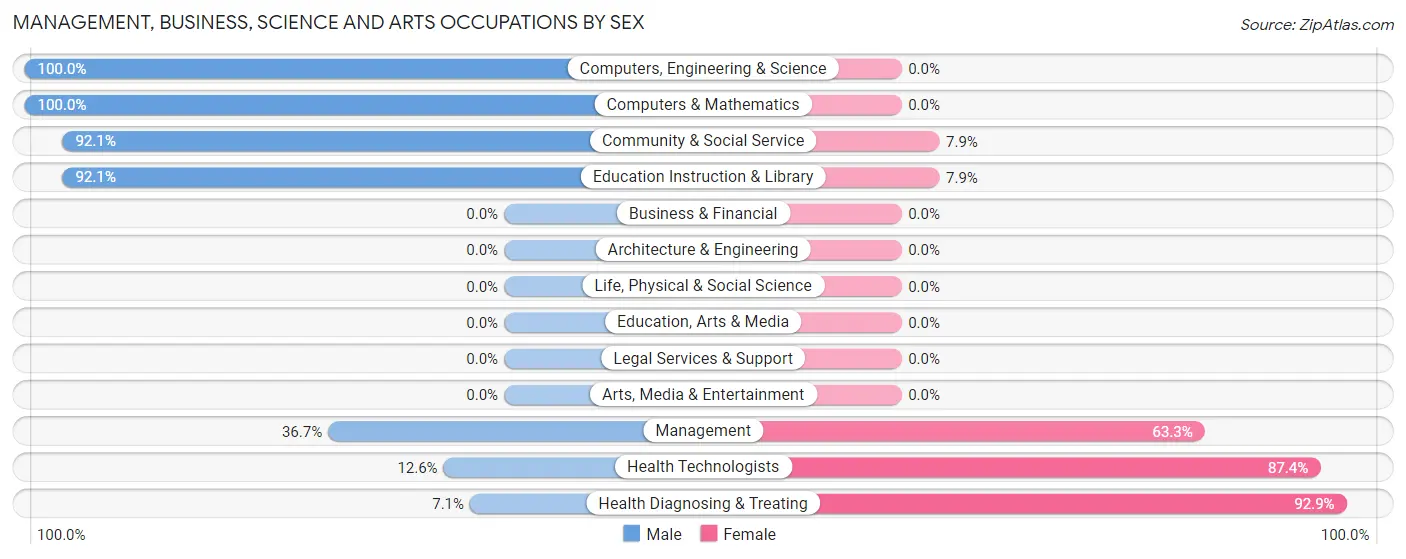
Management, Business, Science and Arts Occupations by Sex
Within the Management, Business, Science and Arts occupations in Newton Falls, the most male-oriented occupations are Computers, Engineering & Science (100.0%), Computers & Mathematics (100.0%), and Community & Social Service (92.1%), while the most female-oriented occupations are Health Diagnosing & Treating (92.9%), Health Technologists (87.4%), and Management (63.3%).
| Occupation | Male | Female |
| Management | 29 (36.7%) | 50 (63.3%) |
| Business & Financial | 0 (0.0%) | 0 (0.0%) |
| Computers, Engineering & Science | 106 (100.0%) | 0 (0.0%) |
| Computers & Mathematics | 106 (100.0%) | 0 (0.0%) |
| Architecture & Engineering | 0 (0.0%) | 0 (0.0%) |
| Life, Physical & Social Science | 0 (0.0%) | 0 (0.0%) |
| Community & Social Service | 163 (92.1%) | 14 (7.9%) |
| Education, Arts & Media | 0 (0.0%) | 0 (0.0%) |
| Legal Services & Support | 0 (0.0%) | 0 (0.0%) |
| Education Instruction & Library | 163 (92.1%) | 14 (7.9%) |
| Arts, Media & Entertainment | 0 (0.0%) | 0 (0.0%) |
| Health Diagnosing & Treating | 26 (7.1%) | 339 (92.9%) |
| Health Technologists | 12 (12.6%) | 83 (87.4%) |
| Total (Category) | 324 (44.6%) | 403 (55.4%) |
| Total (Overall) | 1,094 (51.7%) | 1,021 (48.3%) |
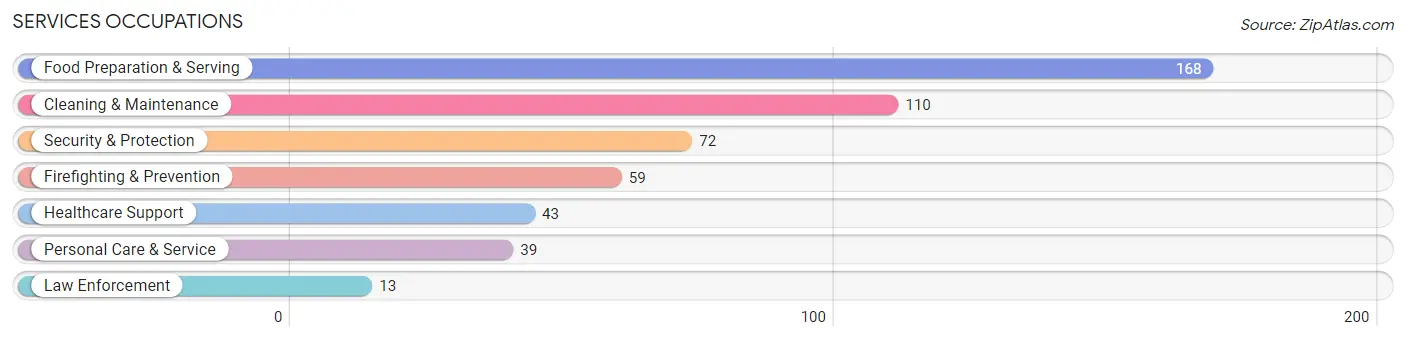
Services Occupations
The most common Services occupations in Newton Falls are Food Preparation & Serving (168 | 7.9%), Cleaning & Maintenance (110 | 5.2%), Security & Protection (72 | 3.4%), Firefighting & Prevention (59 | 2.8%), and Healthcare Support (43 | 2.0%).
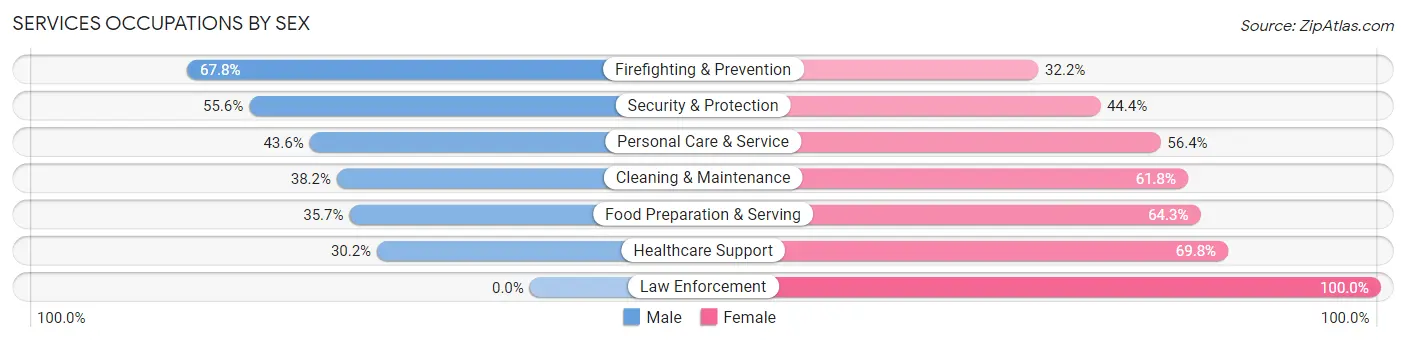
Services Occupations by Sex
Within the Services occupations in Newton Falls, the most male-oriented occupations are Firefighting & Prevention (67.8%), Security & Protection (55.6%), and Personal Care & Service (43.6%), while the most female-oriented occupations are Law Enforcement (100.0%), Healthcare Support (69.8%), and Food Preparation & Serving (64.3%).
| Occupation | Male | Female |
| Healthcare Support | 13 (30.2%) | 30 (69.8%) |
| Security & Protection | 40 (55.6%) | 32 (44.4%) |
| Firefighting & Prevention | 40 (67.8%) | 19 (32.2%) |
| Law Enforcement | 0 (0.0%) | 13 (100.0%) |
| Food Preparation & Serving | 60 (35.7%) | 108 (64.3%) |
| Cleaning & Maintenance | 42 (38.2%) | 68 (61.8%) |
| Personal Care & Service | 17 (43.6%) | 22 (56.4%) |
| Total (Category) | 172 (39.8%) | 260 (60.2%) |
| Total (Overall) | 1,094 (51.7%) | 1,021 (48.3%) |
Sales and Office Occupations
The most common Sales and Office occupations in Newton Falls are Sales & Related (165 | 7.8%), and Office & Administration (118 | 5.6%).
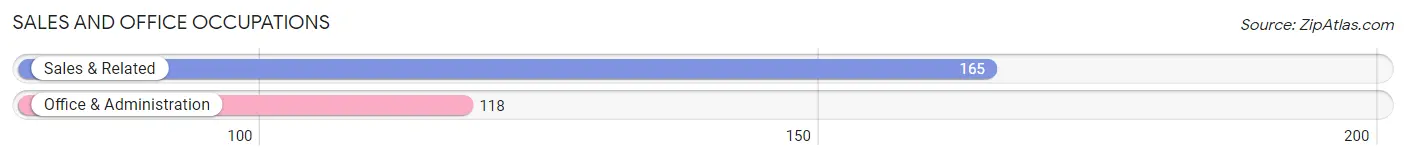
Sales and Office Occupations by Sex
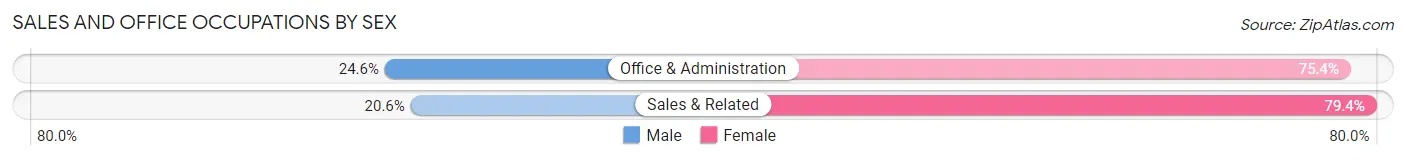
| Occupation | Male | Female |
| Sales & Related | 34 (20.6%) | 131 (79.4%) |
| Office & Administration | 29 (24.6%) | 89 (75.4%) |
| Total (Category) | 63 (22.3%) | 220 (77.7%) |
| Total (Overall) | 1,094 (51.7%) | 1,021 (48.3%) |
Natural Resources, Construction and Maintenance Occupations
The most common Natural Resources, Construction and Maintenance occupations in Newton Falls are Construction & Extraction (100 | 4.7%), and Installation, Maintenance & Repair (15 | 0.7%).
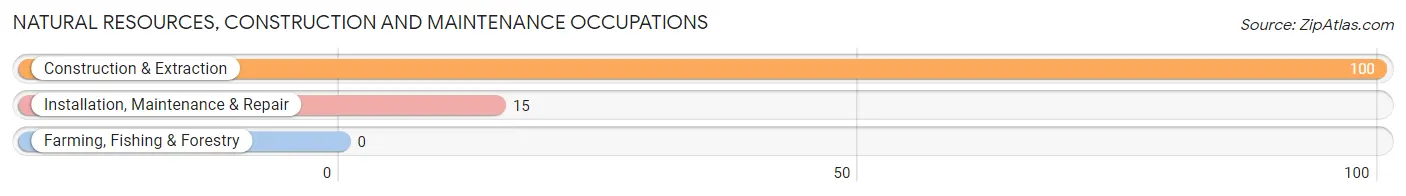
Natural Resources, Construction and Maintenance Occupations by Sex
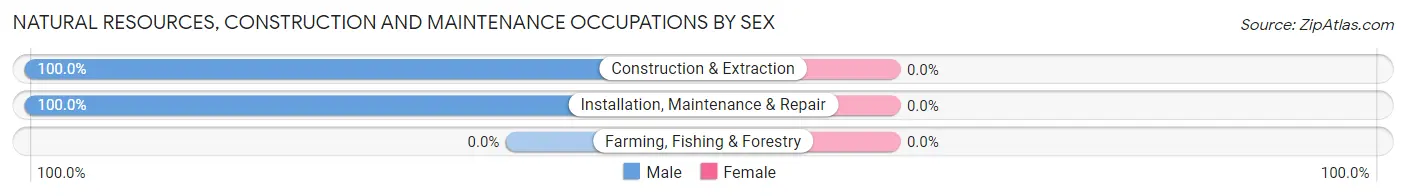
| Occupation | Male | Female |
| Farming, Fishing & Forestry | 0 (0.0%) | 0 (0.0%) |
| Construction & Extraction | 100 (100.0%) | 0 (0.0%) |
| Installation, Maintenance & Repair | 15 (100.0%) | 0 (0.0%) |
| Total (Category) | 115 (100.0%) | 0 (0.0%) |
| Total (Overall) | 1,094 (51.7%) | 1,021 (48.3%) |
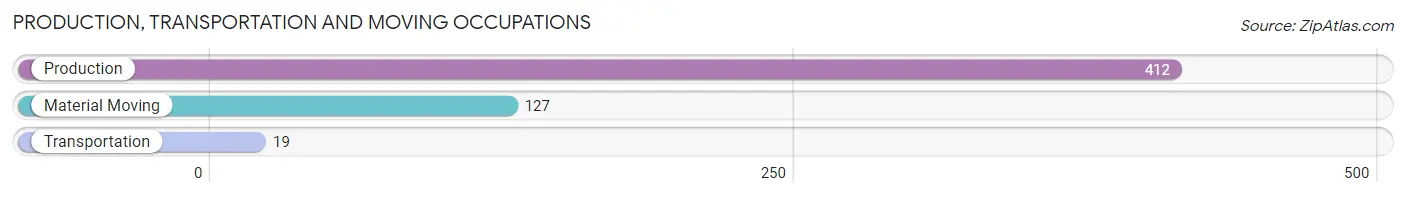
Production, Transportation and Moving Occupations
The most common Production, Transportation and Moving occupations in Newton Falls are Production (412 | 19.5%), Material Moving (127 | 6.0%), and Transportation (19 | 0.9%).
Production, Transportation and Moving Occupations by Sex
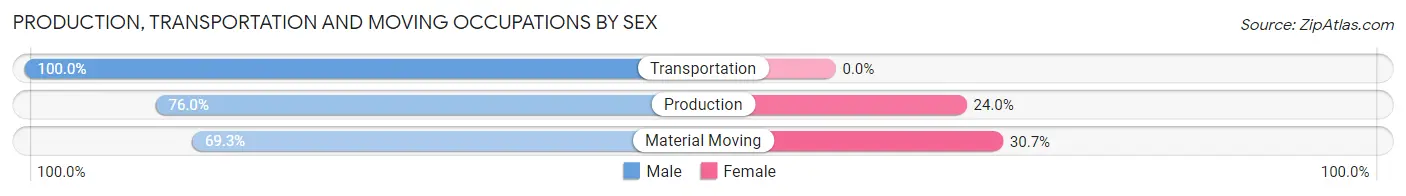
| Occupation | Male | Female |
| Production | 313 (76.0%) | 99 (24.0%) |
| Transportation | 19 (100.0%) | 0 (0.0%) |
| Material Moving | 88 (69.3%) | 39 (30.7%) |
| Total (Category) | 420 (75.3%) | 138 (24.7%) |
| Total (Overall) | 1,094 (51.7%) | 1,021 (48.3%) |
Employment Industries by Sex in Newton Falls
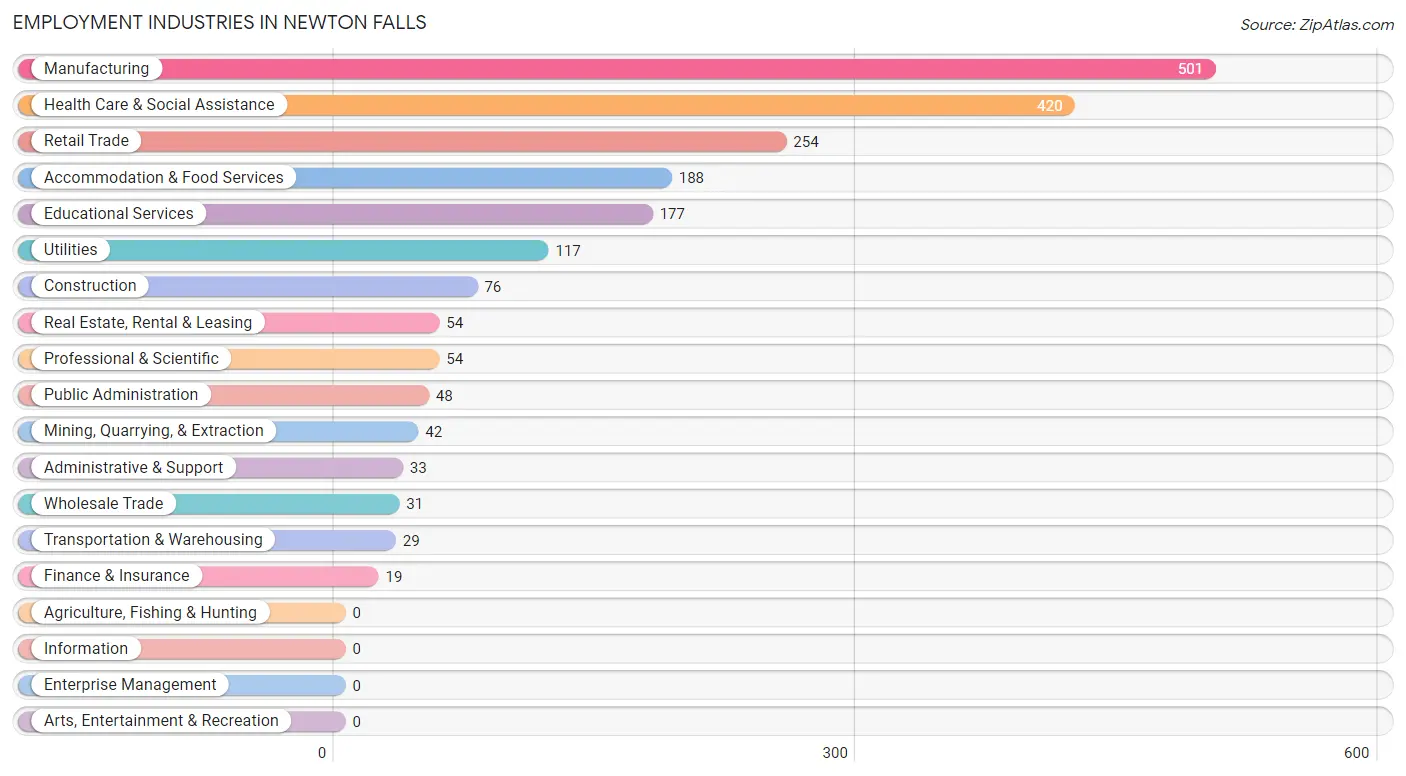
Employment Industries in Newton Falls
The major employment industries in Newton Falls include Manufacturing (501 | 23.7%), Health Care & Social Assistance (420 | 19.9%), Retail Trade (254 | 12.0%), Accommodation & Food Services (188 | 8.9%), and Educational Services (177 | 8.4%).
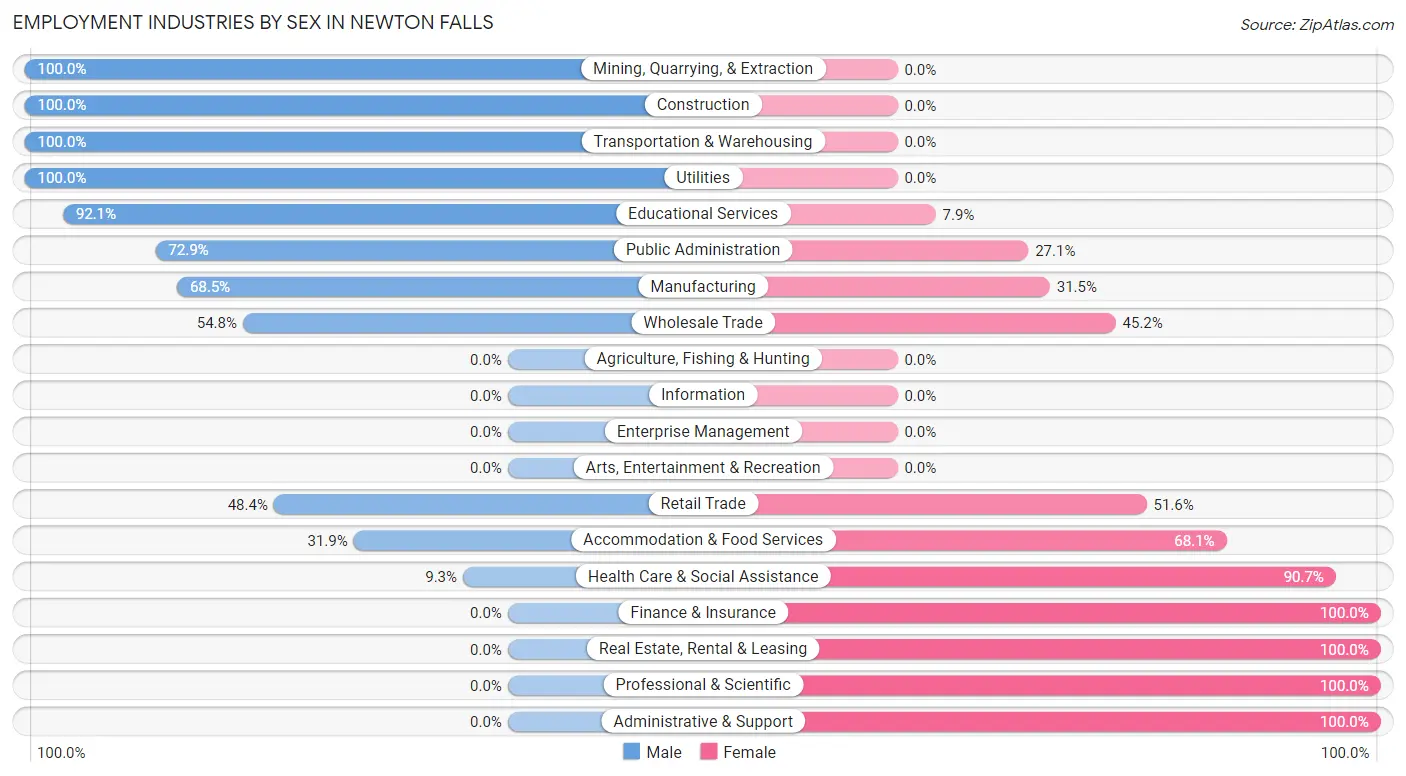
Employment Industries by Sex in Newton Falls
The Newton Falls industries that see more men than women are Mining, Quarrying, & Extraction (100.0%), Construction (100.0%), and Transportation & Warehousing (100.0%), whereas the industries that tend to have a higher number of women are Finance & Insurance (100.0%), Real Estate, Rental & Leasing (100.0%), and Professional & Scientific (100.0%).
| Industry | Male | Female |
| Agriculture, Fishing & Hunting | 0 (0.0%) | 0 (0.0%) |
| Mining, Quarrying, & Extraction | 42 (100.0%) | 0 (0.0%) |
| Construction | 76 (100.0%) | 0 (0.0%) |
| Manufacturing | 343 (68.5%) | 158 (31.5%) |
| Wholesale Trade | 17 (54.8%) | 14 (45.2%) |
| Retail Trade | 123 (48.4%) | 131 (51.6%) |
| Transportation & Warehousing | 29 (100.0%) | 0 (0.0%) |
| Utilities | 117 (100.0%) | 0 (0.0%) |
| Information | 0 (0.0%) | 0 (0.0%) |
| Finance & Insurance | 0 (0.0%) | 19 (100.0%) |
| Real Estate, Rental & Leasing | 0 (0.0%) | 54 (100.0%) |
| Professional & Scientific | 0 (0.0%) | 54 (100.0%) |
| Enterprise Management | 0 (0.0%) | 0 (0.0%) |
| Administrative & Support | 0 (0.0%) | 33 (100.0%) |
| Educational Services | 163 (92.1%) | 14 (7.9%) |
| Health Care & Social Assistance | 39 (9.3%) | 381 (90.7%) |
| Arts, Entertainment & Recreation | 0 (0.0%) | 0 (0.0%) |
| Accommodation & Food Services | 60 (31.9%) | 128 (68.1%) |
| Public Administration | 35 (72.9%) | 13 (27.1%) |
| Total | 1,094 (51.7%) | 1,021 (48.3%) |
Education in Newton Falls
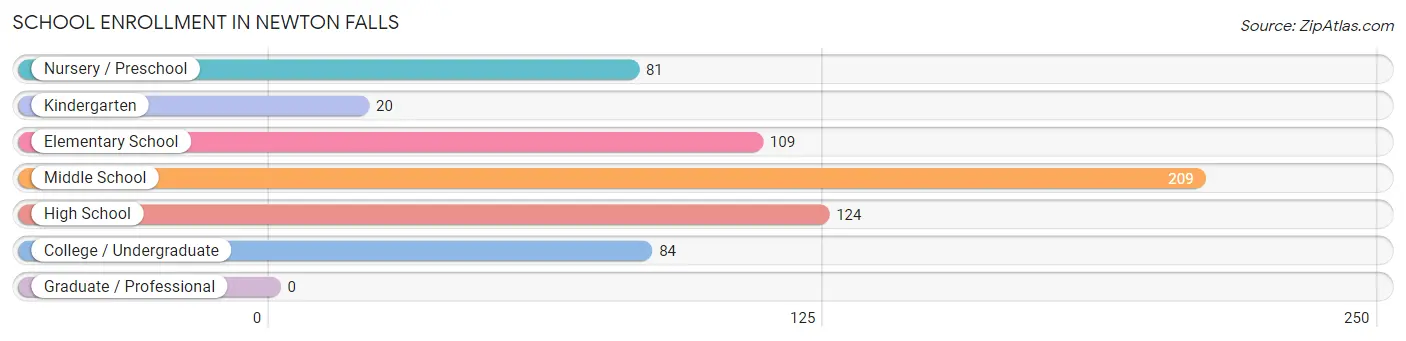
School Enrollment in Newton Falls
The most common levels of schooling among the 627 students in Newton Falls are middle school (209 | 33.3%), high school (124 | 19.8%), and elementary school (109 | 17.4%).
| School Level | # Students | % Students |
| Nursery / Preschool | 81 | 12.9% |
| Kindergarten | 20 | 3.2% |
| Elementary School | 109 | 17.4% |
| Middle School | 209 | 33.3% |
| High School | 124 | 19.8% |
| College / Undergraduate | 84 | 13.4% |
| Graduate / Professional | 0 | 0.0% |
| Total | 627 | 100.0% |
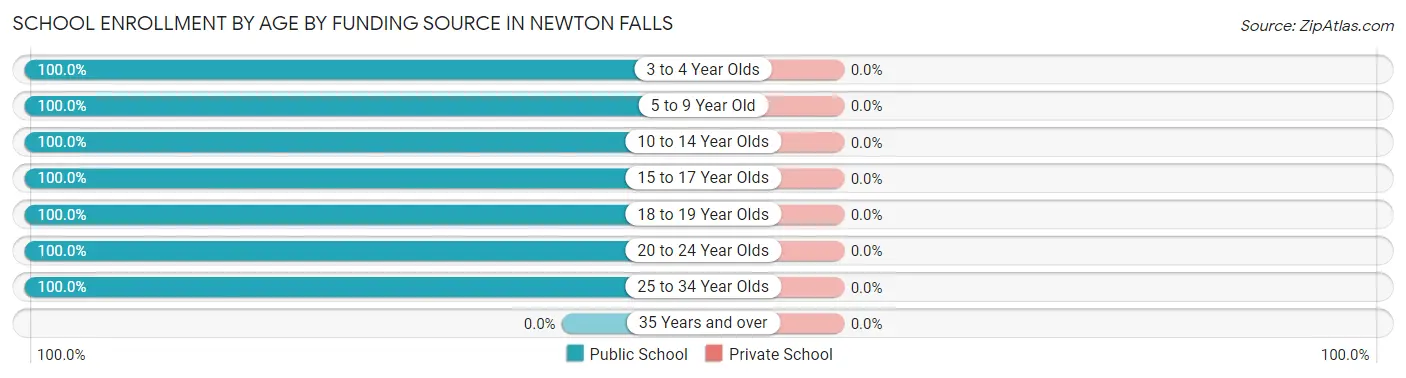
School Enrollment by Age by Funding Source in Newton Falls
| Age Bracket | Public School | Private School |
| 3 to 4 Year Olds | 69 (100.0%) | 0 (0.0%) |
| 5 to 9 Year Old | 141 (100.0%) | 0 (0.0%) |
| 10 to 14 Year Olds | 210 (100.0%) | 0 (0.0%) |
| 15 to 17 Year Olds | 102 (100.0%) | 0 (0.0%) |
| 18 to 19 Year Olds | 21 (100.0%) | 0 (0.0%) |
| 20 to 24 Year Olds | 27 (100.0%) | 0 (0.0%) |
| 25 to 34 Year Olds | 57 (100.0%) | 0 (0.0%) |
| 35 Years and over | 0 (0.0%) | 0 (0.0%) |
| Total | 627 (100.0%) | 0 (0.0%) |
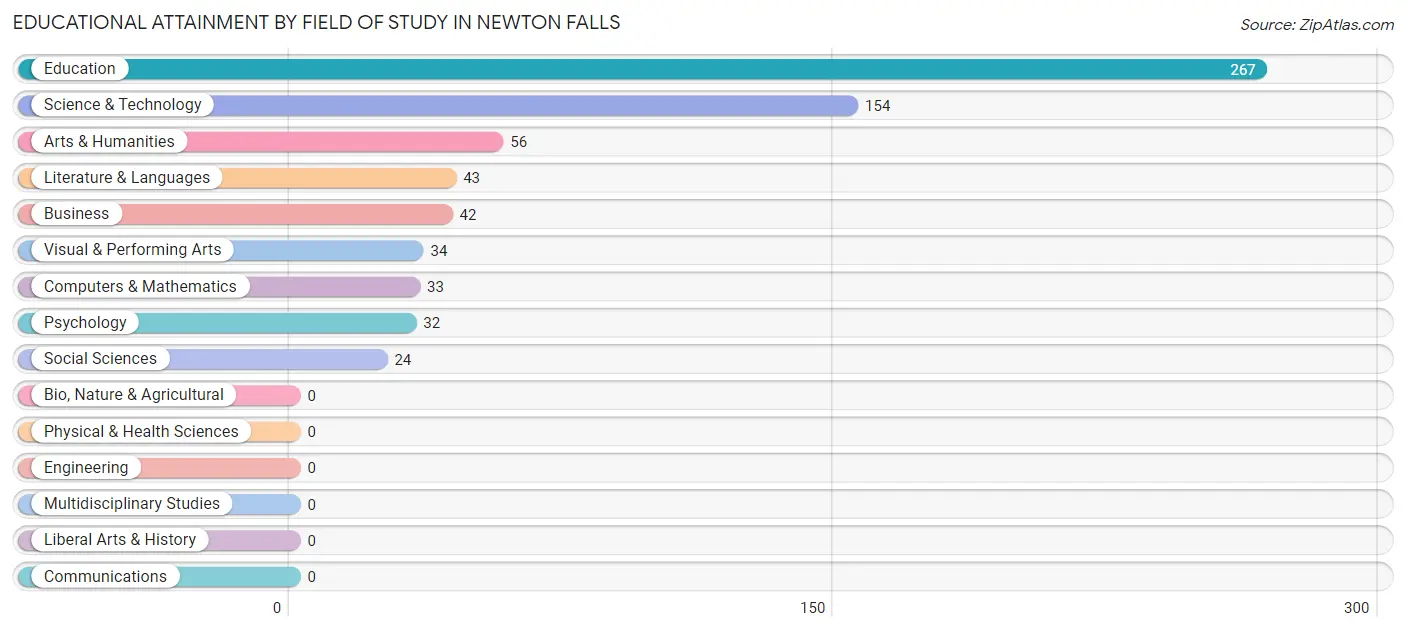
Educational Attainment by Field of Study in Newton Falls
Education (267 | 39.0%), science & technology (154 | 22.5%), arts & humanities (56 | 8.2%), literature & languages (43 | 6.3%), and business (42 | 6.1%) are the most common fields of study among 685 individuals in Newton Falls who have obtained a bachelor's degree or higher.
| Field of Study | # Graduates | % Graduates |
| Computers & Mathematics | 33 | 4.8% |
| Bio, Nature & Agricultural | 0 | 0.0% |
| Physical & Health Sciences | 0 | 0.0% |
| Psychology | 32 | 4.7% |
| Social Sciences | 24 | 3.5% |
| Engineering | 0 | 0.0% |
| Multidisciplinary Studies | 0 | 0.0% |
| Science & Technology | 154 | 22.5% |
| Business | 42 | 6.1% |
| Education | 267 | 39.0% |
| Literature & Languages | 43 | 6.3% |
| Liberal Arts & History | 0 | 0.0% |
| Visual & Performing Arts | 34 | 5.0% |
| Communications | 0 | 0.0% |
| Arts & Humanities | 56 | 8.2% |
| Total | 685 | 100.0% |
Transportation & Commute in Newton Falls
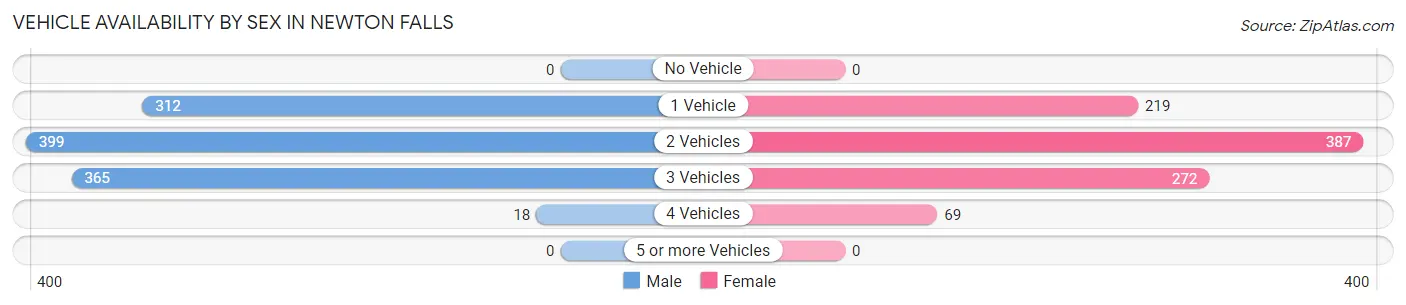
Vehicle Availability by Sex in Newton Falls
The most prevalent vehicle ownership categories in Newton Falls are males with 2 vehicles (399, accounting for 36.5%) and females with 2 vehicles (387, making up 42.1%).
| Vehicles Available | Male | Female |
| No Vehicle | 0 (0.0%) | 0 (0.0%) |
| 1 Vehicle | 312 (28.5%) | 219 (23.1%) |
| 2 Vehicles | 399 (36.5%) | 387 (40.9%) |
| 3 Vehicles | 365 (33.4%) | 272 (28.7%) |
| 4 Vehicles | 18 (1.7%) | 69 (7.3%) |
| 5 or more Vehicles | 0 (0.0%) | 0 (0.0%) |
| Total | 1,094 (100.0%) | 947 (100.0%) |
Commute Time in Newton Falls
The most frequently occuring commute durations in Newton Falls are 15 to 19 minutes (290 commuters, 15.4%), less than 5 minutes (253 commuters, 13.5%), and 30 to 34 minutes (228 commuters, 12.1%).
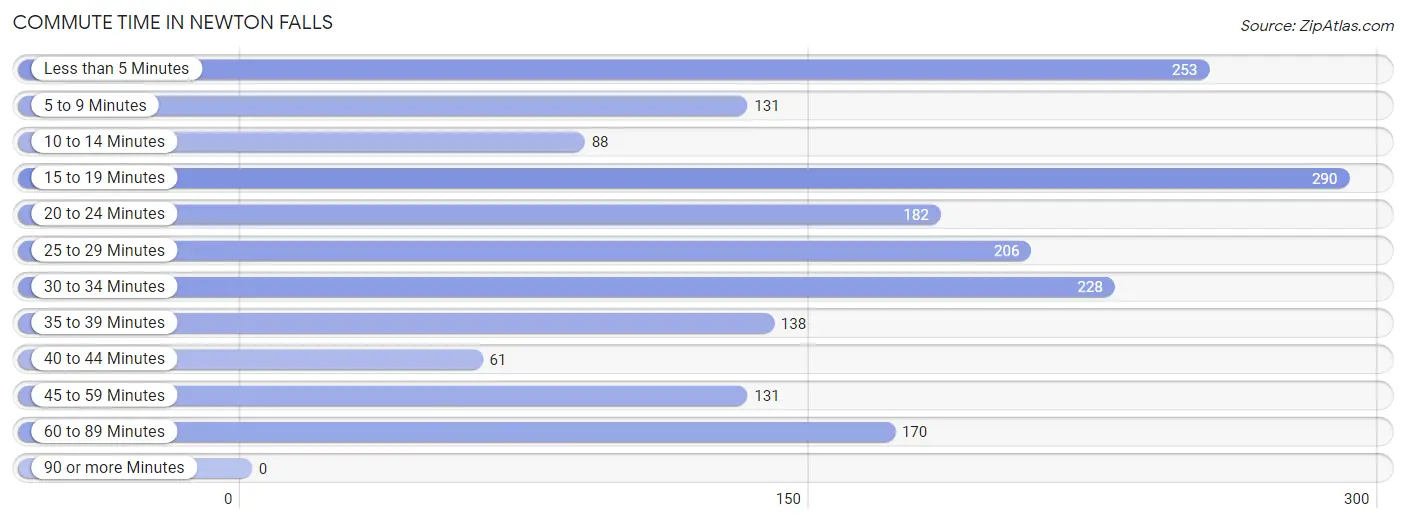
| Commute Time | # Commuters | % Commuters |
| Less than 5 Minutes | 253 | 13.5% |
| 5 to 9 Minutes | 131 | 7.0% |
| 10 to 14 Minutes | 88 | 4.7% |
| 15 to 19 Minutes | 290 | 15.4% |
| 20 to 24 Minutes | 182 | 9.7% |
| 25 to 29 Minutes | 206 | 11.0% |
| 30 to 34 Minutes | 228 | 12.1% |
| 35 to 39 Minutes | 138 | 7.3% |
| 40 to 44 Minutes | 61 | 3.3% |
| 45 to 59 Minutes | 131 | 7.0% |
| 60 to 89 Minutes | 170 | 9.0% |
| 90 or more Minutes | 0 | 0.0% |
Commute Time by Sex in Newton Falls
The most common commute times in Newton Falls are 15 to 19 minutes (175 commuters, 18.8%) for males and less than 5 minutes (171 commuters, 18.1%) for females.
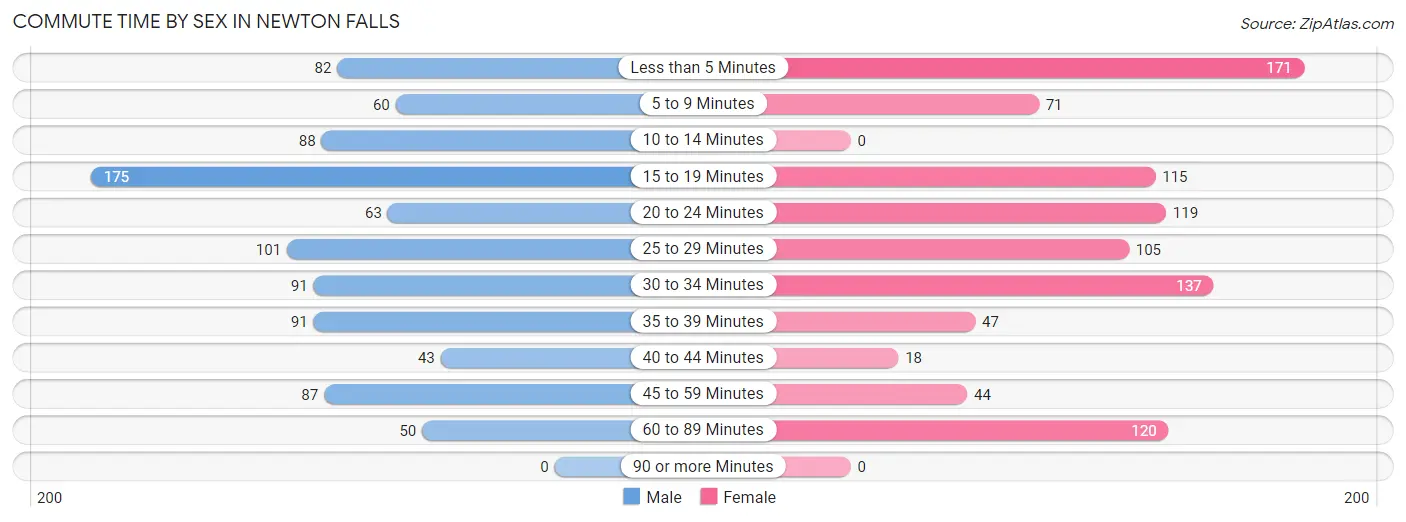
| Commute Time | Male | Female |
| Less than 5 Minutes | 82 (8.8%) | 171 (18.1%) |
| 5 to 9 Minutes | 60 (6.4%) | 71 (7.5%) |
| 10 to 14 Minutes | 88 (9.5%) | 0 (0.0%) |
| 15 to 19 Minutes | 175 (18.8%) | 115 (12.1%) |
| 20 to 24 Minutes | 63 (6.8%) | 119 (12.6%) |
| 25 to 29 Minutes | 101 (10.8%) | 105 (11.1%) |
| 30 to 34 Minutes | 91 (9.8%) | 137 (14.5%) |
| 35 to 39 Minutes | 91 (9.8%) | 47 (5.0%) |
| 40 to 44 Minutes | 43 (4.6%) | 18 (1.9%) |
| 45 to 59 Minutes | 87 (9.3%) | 44 (4.6%) |
| 60 to 89 Minutes | 50 (5.4%) | 120 (12.7%) |
| 90 or more Minutes | 0 (0.0%) | 0 (0.0%) |
Time of Departure to Work by Sex in Newton Falls
The most frequent times of departure to work in Newton Falls are 5:30 AM to 5:59 AM (232, 24.9%) for males and 12:00 PM to 3:59 PM (173, 18.3%) for females.
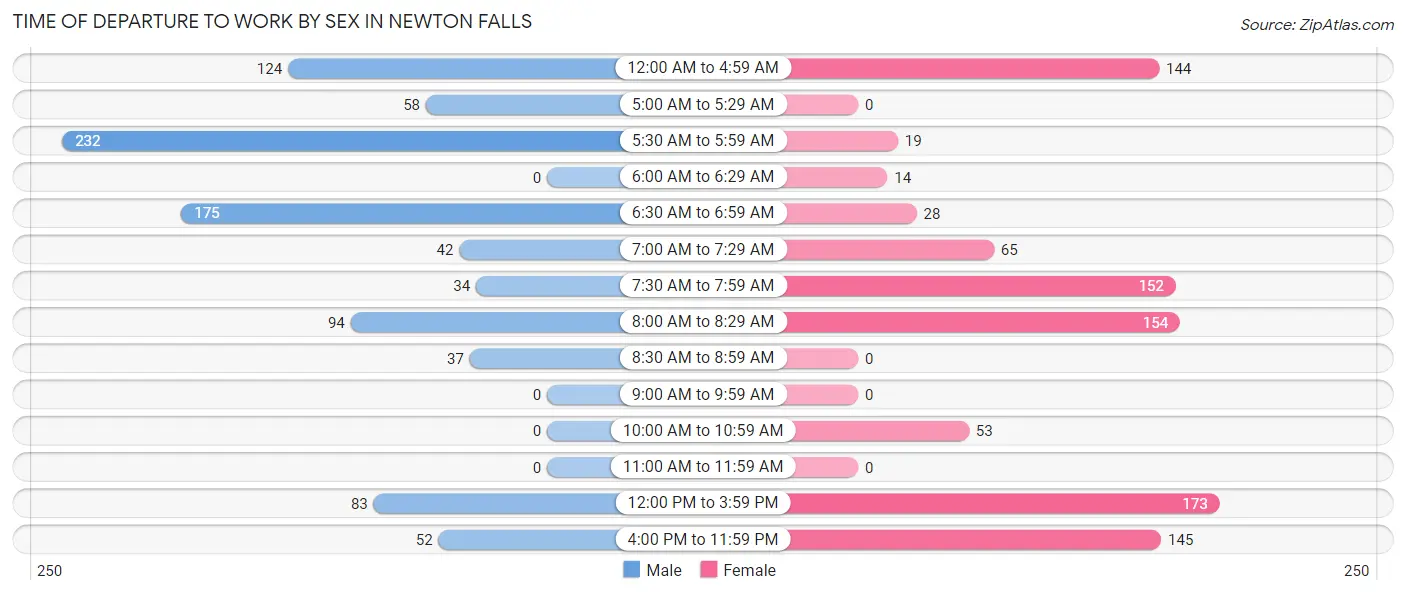
| Time of Departure | Male | Female |
| 12:00 AM to 4:59 AM | 124 (13.3%) | 144 (15.2%) |
| 5:00 AM to 5:29 AM | 58 (6.2%) | 0 (0.0%) |
| 5:30 AM to 5:59 AM | 232 (24.9%) | 19 (2.0%) |
| 6:00 AM to 6:29 AM | 0 (0.0%) | 14 (1.5%) |
| 6:30 AM to 6:59 AM | 175 (18.8%) | 28 (3.0%) |
| 7:00 AM to 7:29 AM | 42 (4.5%) | 65 (6.9%) |
| 7:30 AM to 7:59 AM | 34 (3.6%) | 152 (16.1%) |
| 8:00 AM to 8:29 AM | 94 (10.1%) | 154 (16.3%) |
| 8:30 AM to 8:59 AM | 37 (4.0%) | 0 (0.0%) |
| 9:00 AM to 9:59 AM | 0 (0.0%) | 0 (0.0%) |
| 10:00 AM to 10:59 AM | 0 (0.0%) | 53 (5.6%) |
| 11:00 AM to 11:59 AM | 0 (0.0%) | 0 (0.0%) |
| 12:00 PM to 3:59 PM | 83 (8.9%) | 173 (18.3%) |
| 4:00 PM to 11:59 PM | 52 (5.6%) | 145 (15.3%) |
| Total | 931 (100.0%) | 947 (100.0%) |
Housing Occupancy in Newton Falls
Occupancy by Ownership in Newton Falls
Of the total 2,206 dwellings in Newton Falls, owner-occupied units account for 1,204 (54.6%), while renter-occupied units make up 1,002 (45.4%).
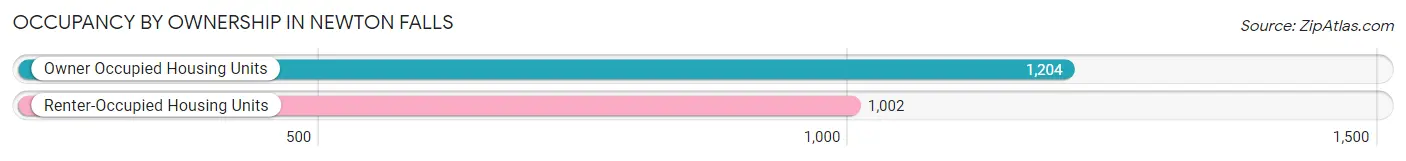
| Occupancy | # Housing Units | % Housing Units |
| Owner Occupied Housing Units | 1,204 | 54.6% |
| Renter-Occupied Housing Units | 1,002 | 45.4% |
| Total Occupied Housing Units | 2,206 | 100.0% |
Occupancy by Household Size in Newton Falls
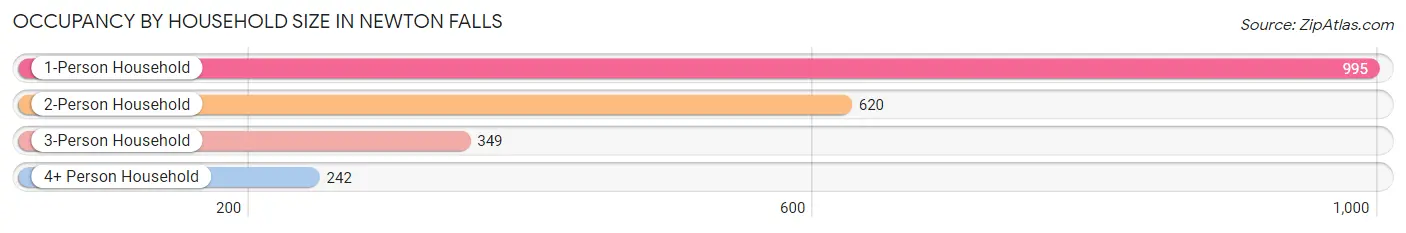
| Household Size | # Housing Units | % Housing Units |
| 1-Person Household | 995 | 45.1% |
| 2-Person Household | 620 | 28.1% |
| 3-Person Household | 349 | 15.8% |
| 4+ Person Household | 242 | 11.0% |
| Total Housing Units | 2,206 | 100.0% |
Occupancy by Ownership by Household Size in Newton Falls
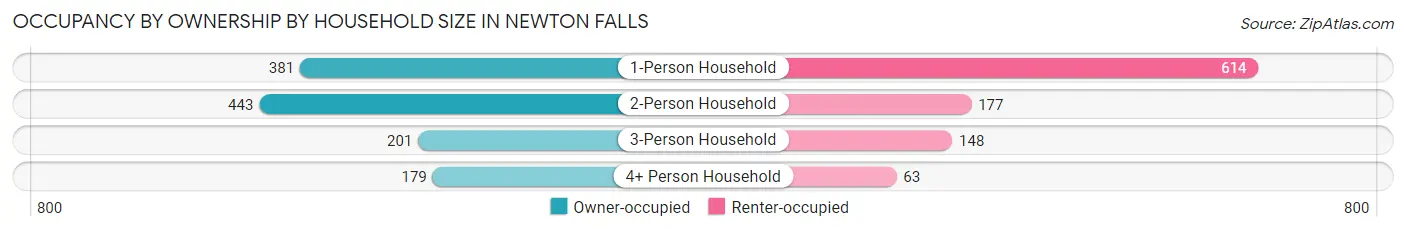
| Household Size | Owner-occupied | Renter-occupied |
| 1-Person Household | 381 (38.3%) | 614 (61.7%) |
| 2-Person Household | 443 (71.5%) | 177 (28.5%) |
| 3-Person Household | 201 (57.6%) | 148 (42.4%) |
| 4+ Person Household | 179 (74.0%) | 63 (26.0%) |
| Total Housing Units | 1,204 (54.6%) | 1,002 (45.4%) |
Occupancy by Educational Attainment in Newton Falls
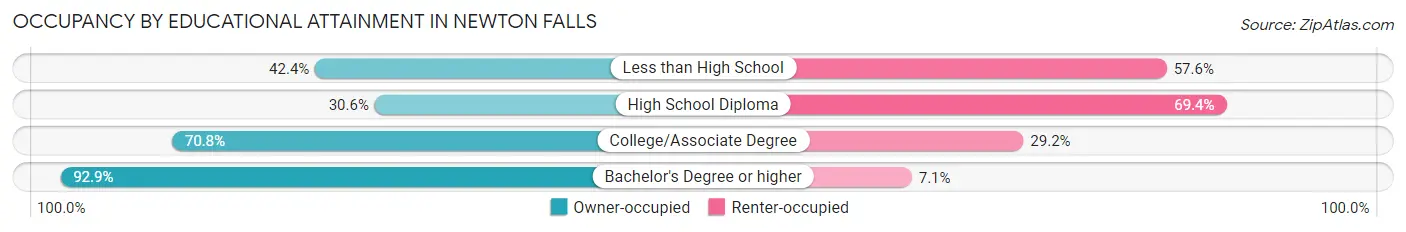
| Household Size | Owner-occupied | Renter-occupied |
| Less than High School | 78 (42.4%) | 106 (57.6%) |
| High School Diploma | 304 (30.6%) | 690 (69.4%) |
| College/Associate Degree | 427 (70.8%) | 176 (29.2%) |
| Bachelor's Degree or higher | 395 (92.9%) | 30 (7.1%) |
Occupancy by Age of Householder in Newton Falls
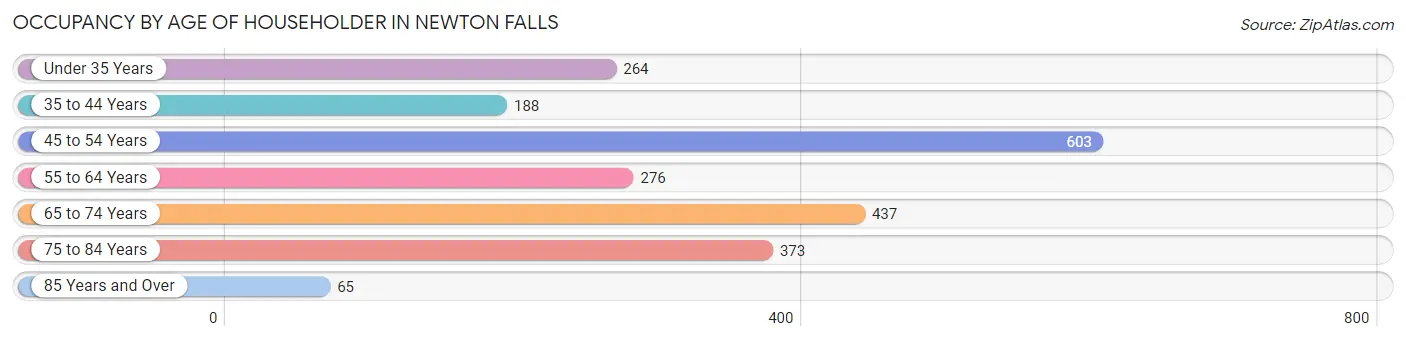
| Age Bracket | # Households | % Households |
| Under 35 Years | 264 | 12.0% |
| 35 to 44 Years | 188 | 8.5% |
| 45 to 54 Years | 603 | 27.3% |
| 55 to 64 Years | 276 | 12.5% |
| 65 to 74 Years | 437 | 19.8% |
| 75 to 84 Years | 373 | 16.9% |
| 85 Years and Over | 65 | 2.9% |
| Total | 2,206 | 100.0% |
Housing Finances in Newton Falls
Median Income by Occupancy in Newton Falls
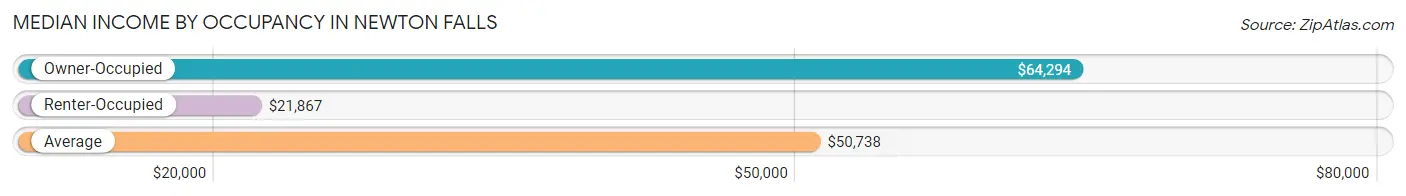
| Occupancy Type | # Households | Median Income |
| Owner-Occupied | 1,204 (54.6%) | $64,294 |
| Renter-Occupied | 1,002 (45.4%) | $21,867 |
| Average | 2,206 (100.0%) | $50,738 |
Occupancy by Householder Income Bracket in Newton Falls
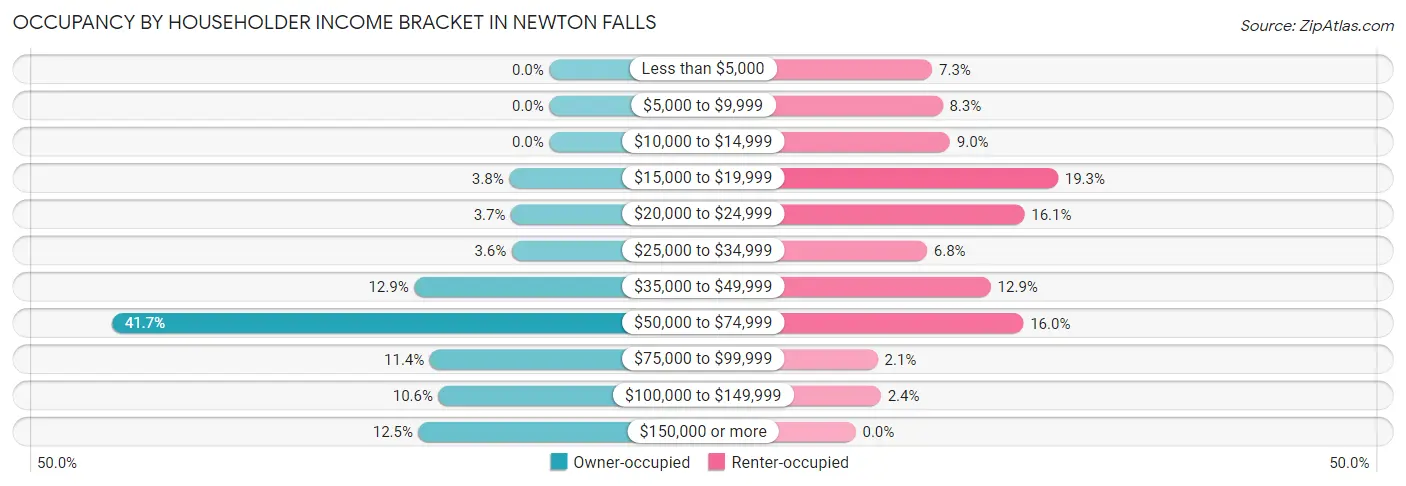
| Income Bracket | Owner-occupied | Renter-occupied |
| Less than $5,000 | 0 (0.0%) | 73 (7.3%) |
| $5,000 to $9,999 | 0 (0.0%) | 83 (8.3%) |
| $10,000 to $14,999 | 0 (0.0%) | 90 (9.0%) |
| $15,000 to $19,999 | 46 (3.8%) | 193 (19.3%) |
| $20,000 to $24,999 | 44 (3.6%) | 161 (16.1%) |
| $25,000 to $34,999 | 43 (3.6%) | 68 (6.8%) |
| $35,000 to $49,999 | 155 (12.9%) | 129 (12.9%) |
| $50,000 to $74,999 | 502 (41.7%) | 160 (16.0%) |
| $75,000 to $99,999 | 137 (11.4%) | 21 (2.1%) |
| $100,000 to $149,999 | 127 (10.5%) | 24 (2.4%) |
| $150,000 or more | 150 (12.5%) | 0 (0.0%) |
| Total | 1,204 (100.0%) | 1,002 (100.0%) |
Monthly Housing Cost Tiers in Newton Falls
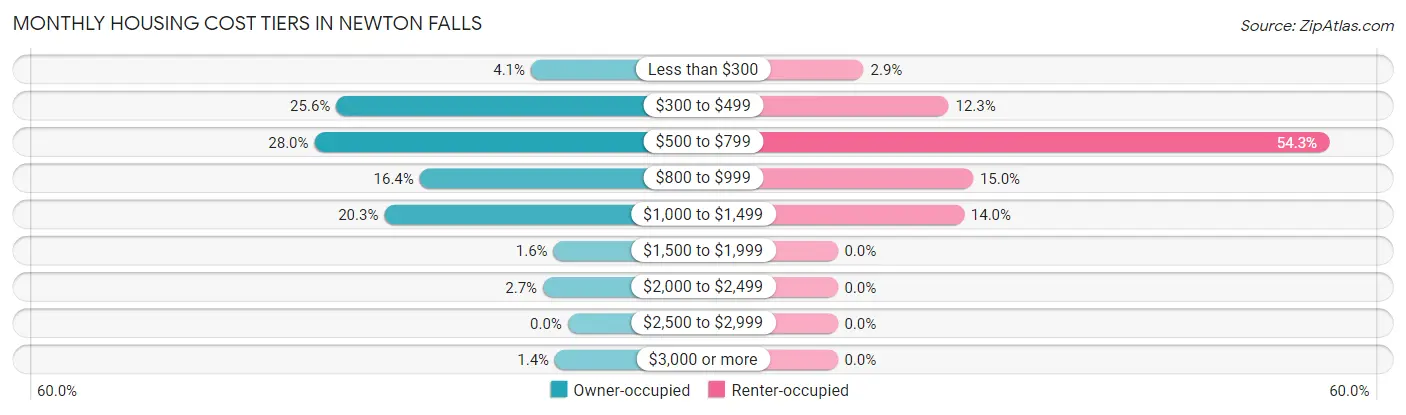
| Monthly Cost | Owner-occupied | Renter-occupied |
| Less than $300 | 49 (4.1%) | 29 (2.9%) |
| $300 to $499 | 308 (25.6%) | 123 (12.3%) |
| $500 to $799 | 337 (28.0%) | 544 (54.3%) |
| $800 to $999 | 197 (16.4%) | 150 (15.0%) |
| $1,000 to $1,499 | 244 (20.3%) | 140 (14.0%) |
| $1,500 to $1,999 | 19 (1.6%) | 0 (0.0%) |
| $2,000 to $2,499 | 33 (2.7%) | 0 (0.0%) |
| $2,500 to $2,999 | 0 (0.0%) | 0 (0.0%) |
| $3,000 or more | 17 (1.4%) | 0 (0.0%) |
| Total | 1,204 (100.0%) | 1,002 (100.0%) |
Physical Housing Characteristics in Newton Falls
Housing Structures in Newton Falls
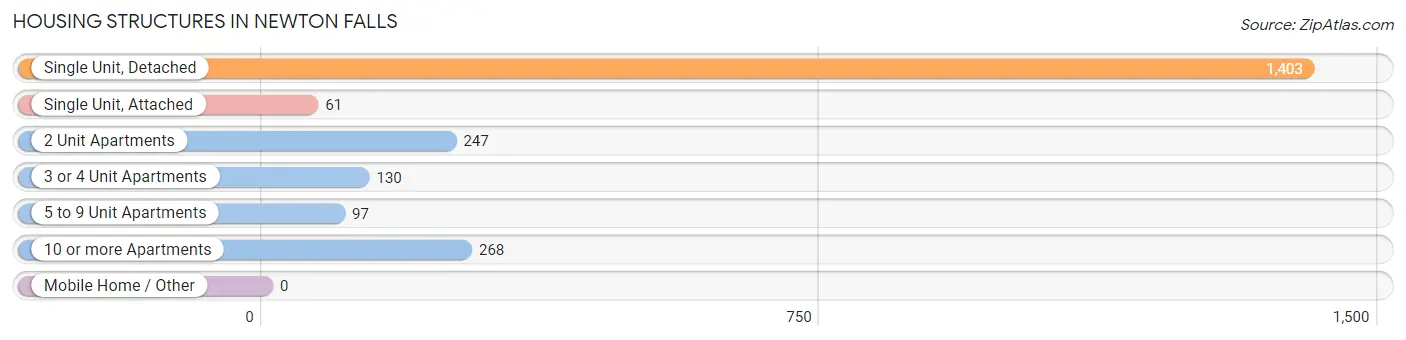
| Structure Type | # Housing Units | % Housing Units |
| Single Unit, Detached | 1,403 | 63.6% |
| Single Unit, Attached | 61 | 2.8% |
| 2 Unit Apartments | 247 | 11.2% |
| 3 or 4 Unit Apartments | 130 | 5.9% |
| 5 to 9 Unit Apartments | 97 | 4.4% |
| 10 or more Apartments | 268 | 12.1% |
| Mobile Home / Other | 0 | 0.0% |
| Total | 2,206 | 100.0% |
Housing Structures by Occupancy in Newton Falls
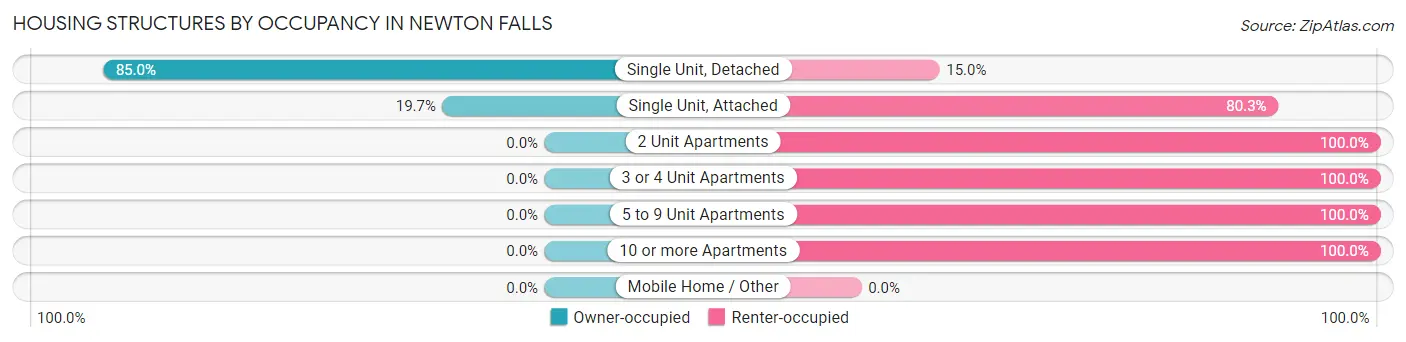
| Structure Type | Owner-occupied | Renter-occupied |
| Single Unit, Detached | 1,192 (85.0%) | 211 (15.0%) |
| Single Unit, Attached | 12 (19.7%) | 49 (80.3%) |
| 2 Unit Apartments | 0 (0.0%) | 247 (100.0%) |
| 3 or 4 Unit Apartments | 0 (0.0%) | 130 (100.0%) |
| 5 to 9 Unit Apartments | 0 (0.0%) | 97 (100.0%) |
| 10 or more Apartments | 0 (0.0%) | 268 (100.0%) |
| Mobile Home / Other | 0 (0.0%) | 0 (0.0%) |
| Total | 1,204 (54.6%) | 1,002 (45.4%) |
Housing Structures by Number of Rooms in Newton Falls
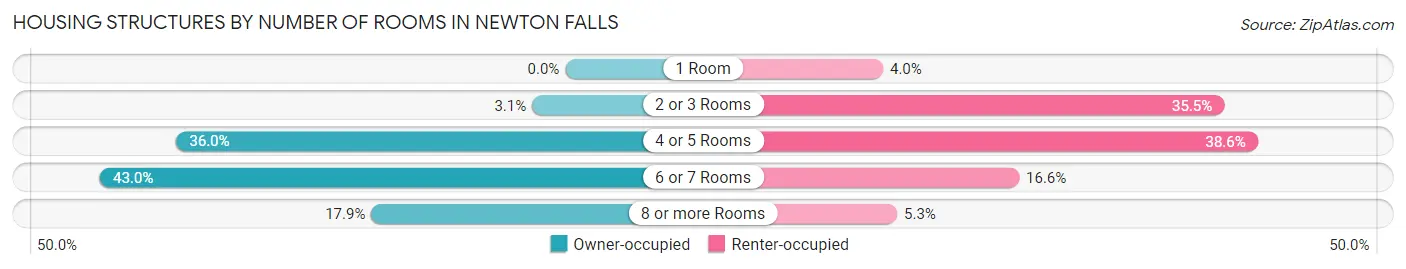
| Number of Rooms | Owner-occupied | Renter-occupied |
| 1 Room | 0 (0.0%) | 40 (4.0%) |
| 2 or 3 Rooms | 37 (3.1%) | 356 (35.5%) |
| 4 or 5 Rooms | 433 (36.0%) | 387 (38.6%) |
| 6 or 7 Rooms | 518 (43.0%) | 166 (16.6%) |
| 8 or more Rooms | 216 (17.9%) | 53 (5.3%) |
| Total | 1,204 (100.0%) | 1,002 (100.0%) |
Housing Structure by Heating Type in Newton Falls
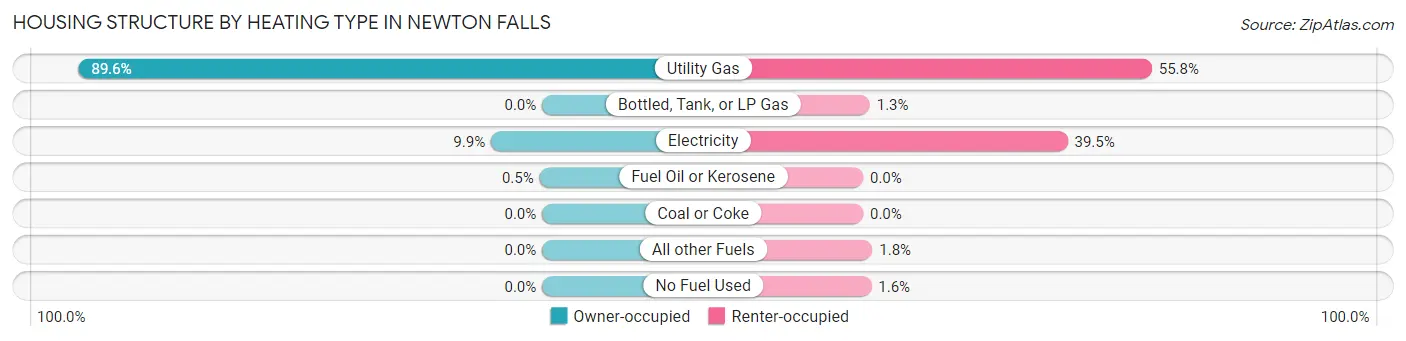
| Heating Type | Owner-occupied | Renter-occupied |
| Utility Gas | 1,079 (89.6%) | 559 (55.8%) |
| Bottled, Tank, or LP Gas | 0 (0.0%) | 13 (1.3%) |
| Electricity | 119 (9.9%) | 396 (39.5%) |
| Fuel Oil or Kerosene | 6 (0.5%) | 0 (0.0%) |
| Coal or Coke | 0 (0.0%) | 0 (0.0%) |
| All other Fuels | 0 (0.0%) | 18 (1.8%) |
| No Fuel Used | 0 (0.0%) | 16 (1.6%) |
| Total | 1,204 (100.0%) | 1,002 (100.0%) |
Household Vehicle Usage in Newton Falls
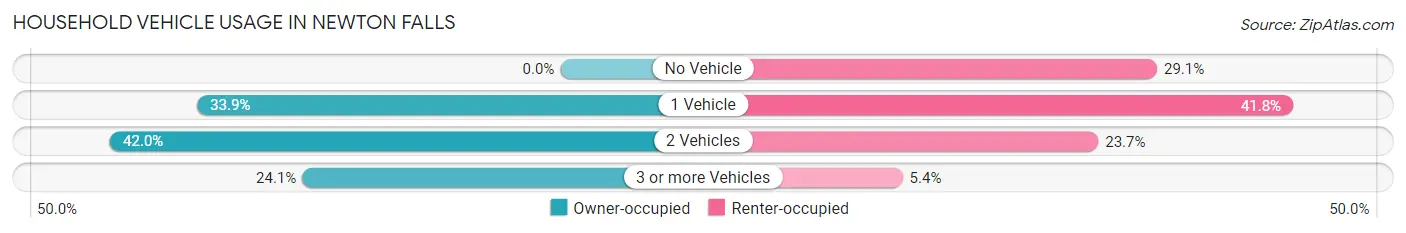
| Vehicles per Household | Owner-occupied | Renter-occupied |
| No Vehicle | 0 (0.0%) | 292 (29.1%) |
| 1 Vehicle | 408 (33.9%) | 419 (41.8%) |
| 2 Vehicles | 506 (42.0%) | 237 (23.6%) |
| 3 or more Vehicles | 290 (24.1%) | 54 (5.4%) |
| Total | 1,204 (100.0%) | 1,002 (100.0%) |
Real Estate & Mortgages in Newton Falls
Real Estate and Mortgage Overview in Newton Falls
| Characteristic | Without Mortgage | With Mortgage |
| Housing Units | 425 | 779 |
| Median Property Value | $92,200 | $97,500 |
| Median Household Income | $50,506 | $104 |
| Monthly Housing Costs | $443 | $0 |
| Real Estate Taxes | $1,294 | $0 |
Property Value by Mortgage Status in Newton Falls
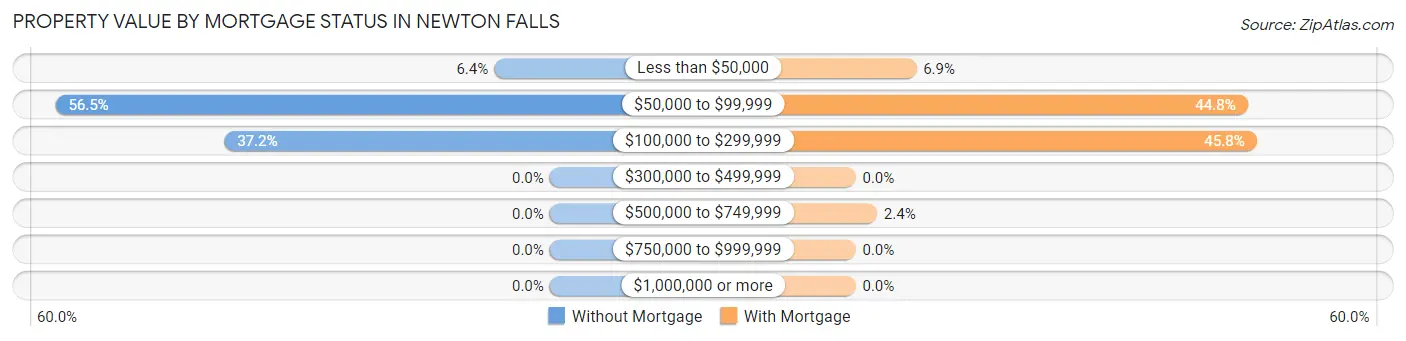
| Property Value | Without Mortgage | With Mortgage |
| Less than $50,000 | 27 (6.4%) | 54 (6.9%) |
| $50,000 to $99,999 | 240 (56.5%) | 349 (44.8%) |
| $100,000 to $299,999 | 158 (37.2%) | 357 (45.8%) |
| $300,000 to $499,999 | 0 (0.0%) | 0 (0.0%) |
| $500,000 to $749,999 | 0 (0.0%) | 19 (2.4%) |
| $750,000 to $999,999 | 0 (0.0%) | 0 (0.0%) |
| $1,000,000 or more | 0 (0.0%) | 0 (0.0%) |
| Total | 425 (100.0%) | 779 (100.0%) |
Household Income by Mortgage Status in Newton Falls
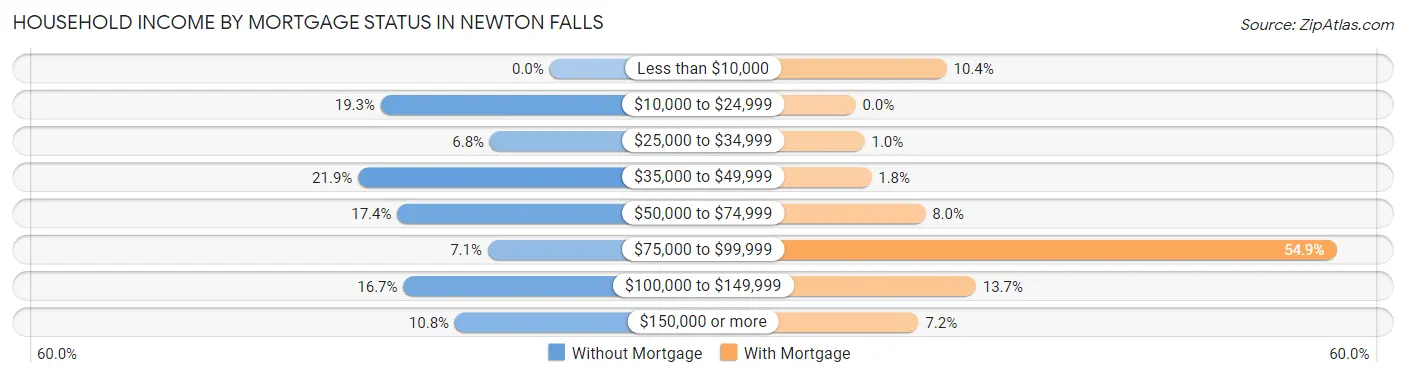
| Household Income | Without Mortgage | With Mortgage |
| Less than $10,000 | 0 (0.0%) | 81 (10.4%) |
| $10,000 to $24,999 | 82 (19.3%) | 0 (0.0%) |
| $25,000 to $34,999 | 29 (6.8%) | 8 (1.0%) |
| $35,000 to $49,999 | 93 (21.9%) | 14 (1.8%) |
| $50,000 to $74,999 | 74 (17.4%) | 62 (8.0%) |
| $75,000 to $99,999 | 30 (7.1%) | 428 (54.9%) |
| $100,000 to $149,999 | 71 (16.7%) | 107 (13.7%) |
| $150,000 or more | 46 (10.8%) | 56 (7.2%) |
| Total | 425 (100.0%) | 779 (100.0%) |
Property Value to Household Income Ratio in Newton Falls
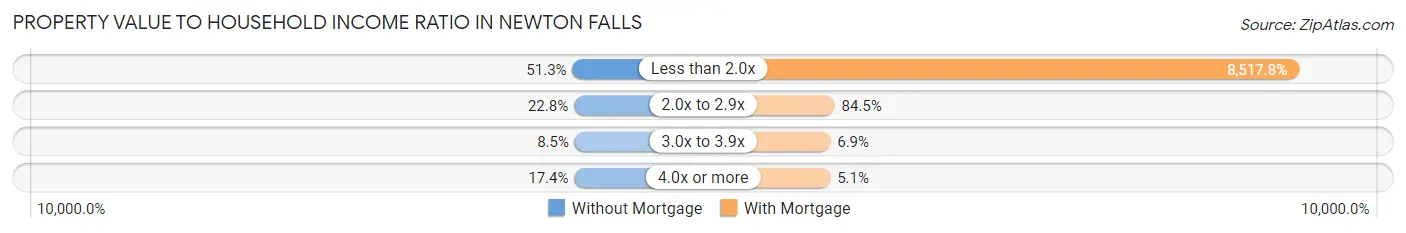
| Value-to-Income Ratio | Without Mortgage | With Mortgage |
| Less than 2.0x | 218 (51.3%) | 66,354 (8,517.8%) |
| 2.0x to 2.9x | 97 (22.8%) | 658 (84.5%) |
| 3.0x to 3.9x | 36 (8.5%) | 54 (6.9%) |
| 4.0x or more | 74 (17.4%) | 40 (5.1%) |
| Total | 425 (100.0%) | 779 (100.0%) |
Real Estate Taxes by Mortgage Status in Newton Falls
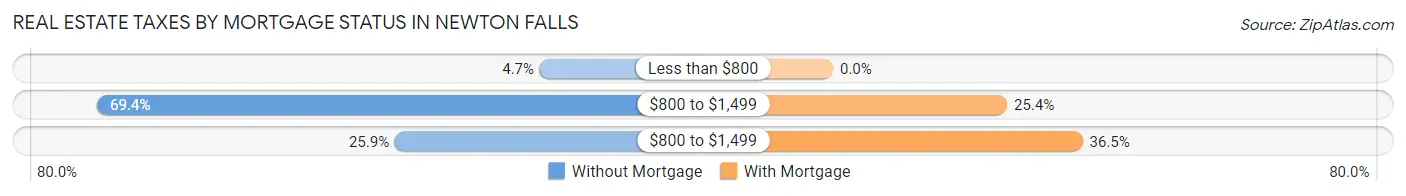
| Property Taxes | Without Mortgage | With Mortgage |
| Less than $800 | 20 (4.7%) | 0 (0.0%) |
| $800 to $1,499 | 295 (69.4%) | 198 (25.4%) |
| $800 to $1,499 | 110 (25.9%) | 284 (36.5%) |
| Total | 425 (100.0%) | 779 (100.0%) |
Health & Disability in Newton Falls
Health Insurance Coverage by Age in Newton Falls
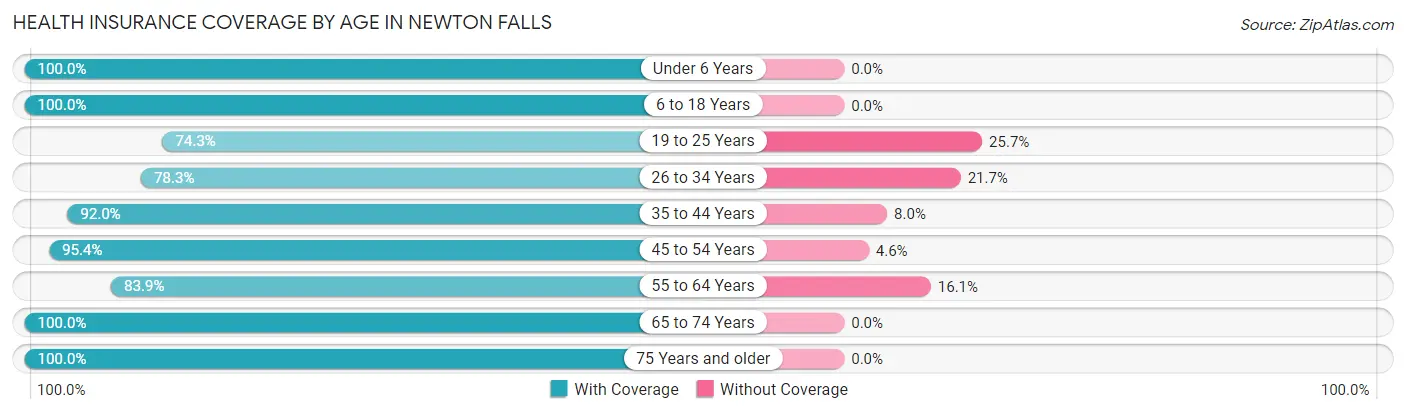
| Age Bracket | With Coverage | Without Coverage |
| Under 6 Years | 219 (100.0%) | 0 (0.0%) |
| 6 to 18 Years | 489 (100.0%) | 0 (0.0%) |
| 19 to 25 Years | 260 (74.3%) | 90 (25.7%) |
| 26 to 34 Years | 422 (78.3%) | 117 (21.7%) |
| 35 to 44 Years | 380 (92.0%) | 33 (8.0%) |
| 45 to 54 Years | 730 (95.4%) | 35 (4.6%) |
| 55 to 64 Years | 504 (83.9%) | 97 (16.1%) |
| 65 to 74 Years | 594 (100.0%) | 0 (0.0%) |
| 75 Years and older | 524 (100.0%) | 0 (0.0%) |
| Total | 4,122 (91.7%) | 372 (8.3%) |
Health Insurance Coverage by Citizenship Status in Newton Falls
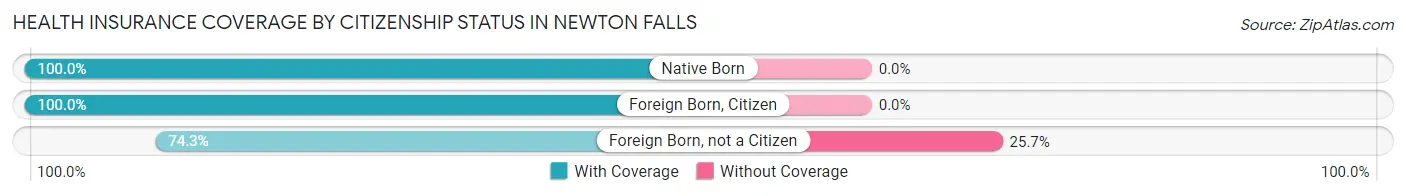
| Citizenship Status | With Coverage | Without Coverage |
| Native Born | 219 (100.0%) | 0 (0.0%) |
| Foreign Born, Citizen | 489 (100.0%) | 0 (0.0%) |
| Foreign Born, not a Citizen | 260 (74.3%) | 90 (25.7%) |
Health Insurance Coverage by Household Income in Newton Falls
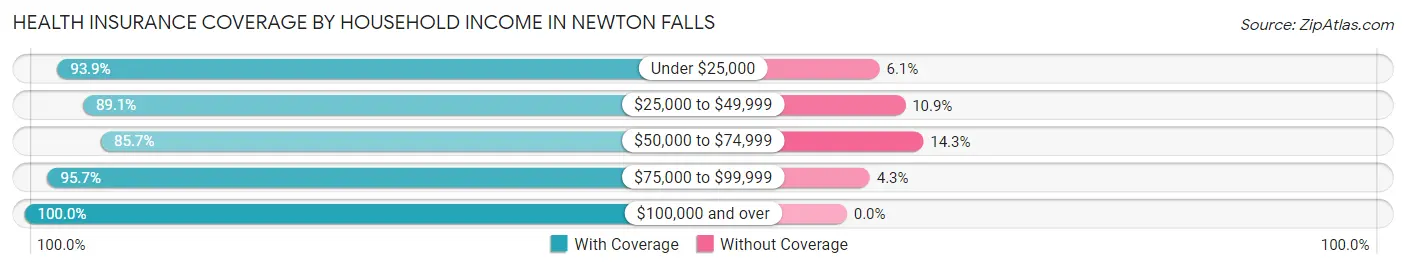
| Household Income | With Coverage | Without Coverage |
| Under $25,000 | 719 (93.9%) | 47 (6.1%) |
| $25,000 to $49,999 | 733 (89.1%) | 90 (10.9%) |
| $50,000 to $74,999 | 1,303 (85.7%) | 218 (14.3%) |
| $75,000 to $99,999 | 377 (95.7%) | 17 (4.3%) |
| $100,000 and over | 985 (100.0%) | 0 (0.0%) |
Public vs Private Health Insurance Coverage by Age in Newton Falls
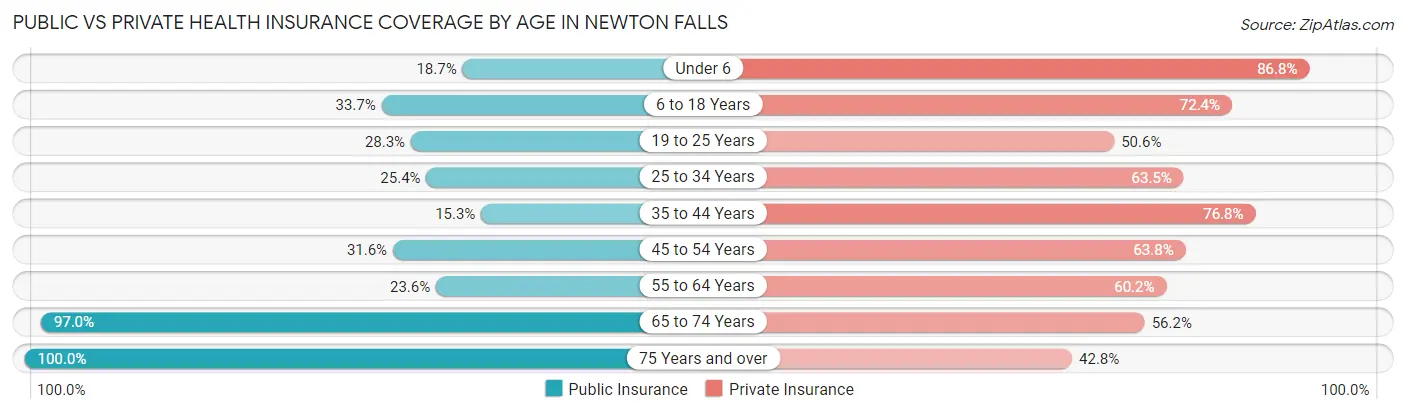
| Age Bracket | Public Insurance | Private Insurance |
| Under 6 | 41 (18.7%) | 190 (86.8%) |
| 6 to 18 Years | 165 (33.7%) | 354 (72.4%) |
| 19 to 25 Years | 99 (28.3%) | 177 (50.6%) |
| 25 to 34 Years | 137 (25.4%) | 342 (63.4%) |
| 35 to 44 Years | 63 (15.2%) | 317 (76.8%) |
| 45 to 54 Years | 242 (31.6%) | 488 (63.8%) |
| 55 to 64 Years | 142 (23.6%) | 362 (60.2%) |
| 65 to 74 Years | 576 (97.0%) | 334 (56.2%) |
| 75 Years and over | 524 (100.0%) | 224 (42.7%) |
| Total | 1,989 (44.3%) | 2,788 (62.0%) |
Disability Status by Sex by Age in Newton Falls
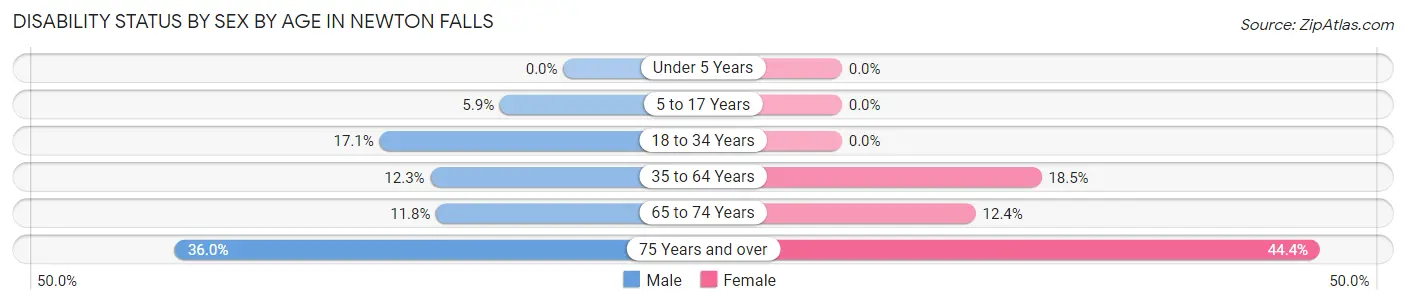
| Age Bracket | Male | Female |
| Under 5 Years | 0 (0.0%) | 0 (0.0%) |
| 5 to 17 Years | 12 (5.9%) | 0 (0.0%) |
| 18 to 34 Years | 87 (17.1%) | 0 (0.0%) |
| 35 to 64 Years | 99 (12.3%) | 181 (18.5%) |
| 65 to 74 Years | 33 (11.8%) | 39 (12.4%) |
| 75 Years and over | 80 (36.0%) | 134 (44.4%) |
Disability Class by Sex by Age in Newton Falls
Disability Class: Hearing Difficulty
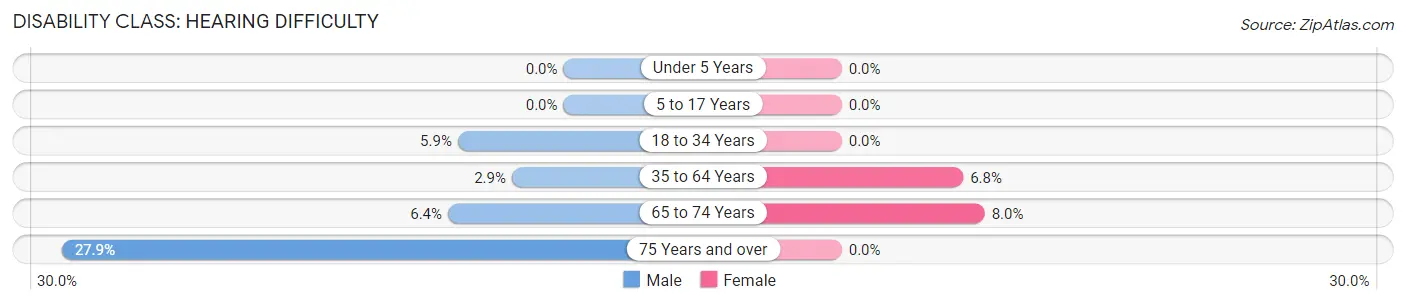
| Age Bracket | Male | Female |
| Under 5 Years | 0 (0.0%) | 0 (0.0%) |
| 5 to 17 Years | 0 (0.0%) | 0 (0.0%) |
| 18 to 34 Years | 30 (5.9%) | 0 (0.0%) |
| 35 to 64 Years | 23 (2.9%) | 66 (6.8%) |
| 65 to 74 Years | 18 (6.4%) | 25 (8.0%) |
| 75 Years and over | 62 (27.9%) | 0 (0.0%) |
Disability Class: Vision Difficulty
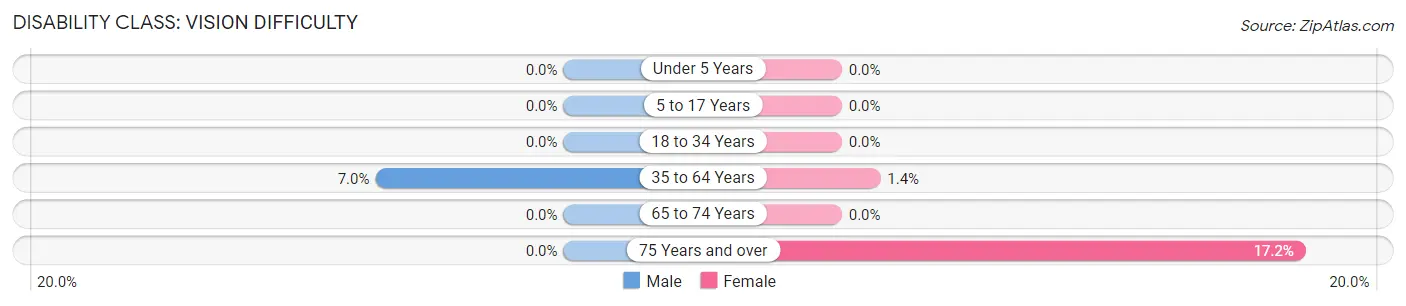
| Age Bracket | Male | Female |
| Under 5 Years | 0 (0.0%) | 0 (0.0%) |
| 5 to 17 Years | 0 (0.0%) | 0 (0.0%) |
| 18 to 34 Years | 0 (0.0%) | 0 (0.0%) |
| 35 to 64 Years | 56 (7.0%) | 14 (1.4%) |
| 65 to 74 Years | 0 (0.0%) | 0 (0.0%) |
| 75 Years and over | 0 (0.0%) | 52 (17.2%) |
Disability Class: Cognitive Difficulty
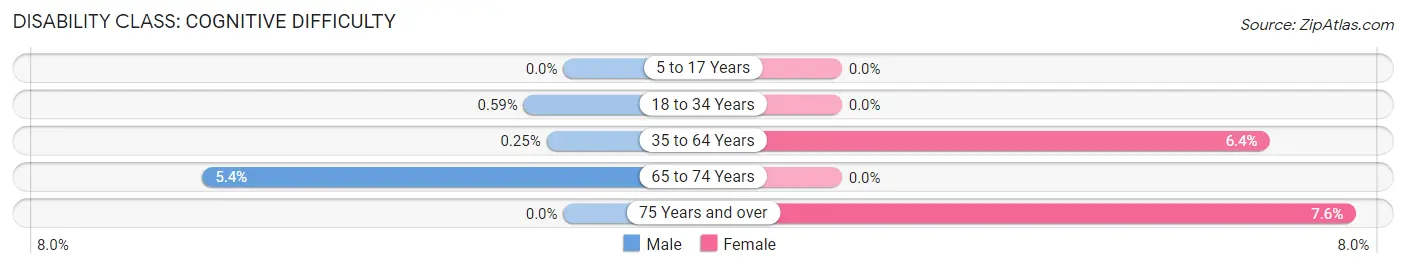
| Age Bracket | Male | Female |
| 5 to 17 Years | 0 (0.0%) | 0 (0.0%) |
| 18 to 34 Years | 3 (0.6%) | 0 (0.0%) |
| 35 to 64 Years | 2 (0.3%) | 62 (6.4%) |
| 65 to 74 Years | 15 (5.4%) | 0 (0.0%) |
| 75 Years and over | 0 (0.0%) | 23 (7.6%) |
Disability Class: Ambulatory Difficulty
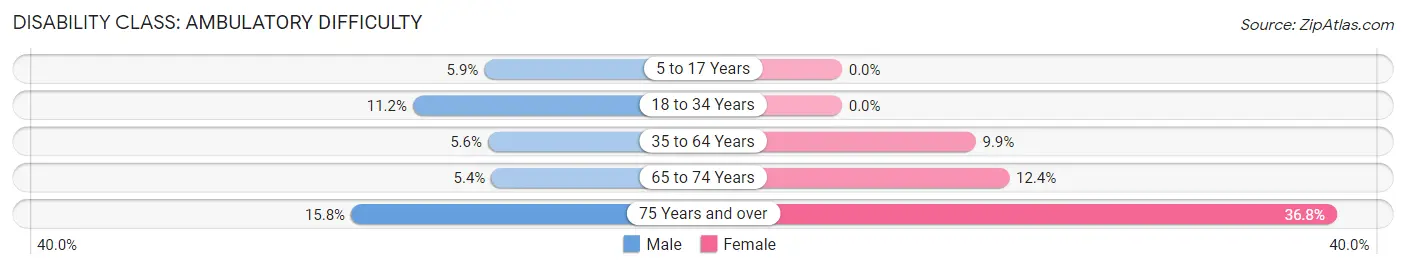
| Age Bracket | Male | Female |
| 5 to 17 Years | 12 (5.9%) | 0 (0.0%) |
| 18 to 34 Years | 57 (11.2%) | 0 (0.0%) |
| 35 to 64 Years | 45 (5.6%) | 97 (9.9%) |
| 65 to 74 Years | 15 (5.4%) | 39 (12.4%) |
| 75 Years and over | 35 (15.8%) | 111 (36.7%) |
Disability Class: Self-Care Difficulty
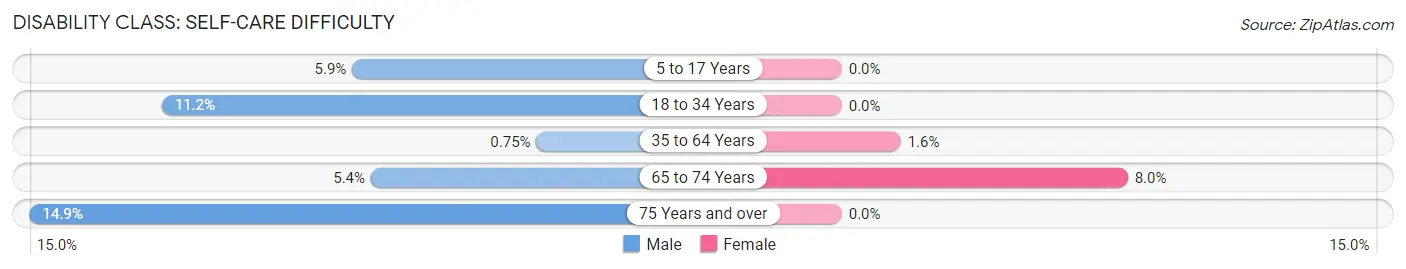
| Age Bracket | Male | Female |
| 5 to 17 Years | 12 (5.9%) | 0 (0.0%) |
| 18 to 34 Years | 57 (11.2%) | 0 (0.0%) |
| 35 to 64 Years | 6 (0.7%) | 16 (1.6%) |
| 65 to 74 Years | 15 (5.4%) | 25 (8.0%) |
| 75 Years and over | 33 (14.9%) | 0 (0.0%) |
Technology Access in Newton Falls
Computing Device Access in Newton Falls
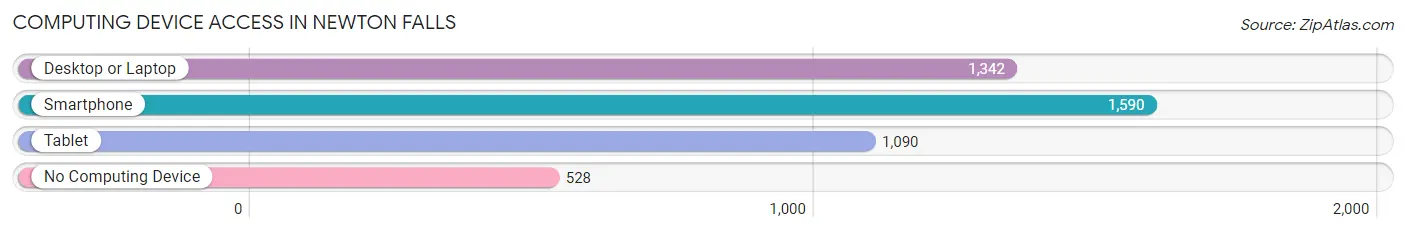
| Device Type | # Households | % Households |
| Desktop or Laptop | 1,342 | 60.8% |
| Smartphone | 1,590 | 72.1% |
| Tablet | 1,090 | 49.4% |
| No Computing Device | 528 | 23.9% |
| Total | 2,206 | 100.0% |
Internet Access in Newton Falls
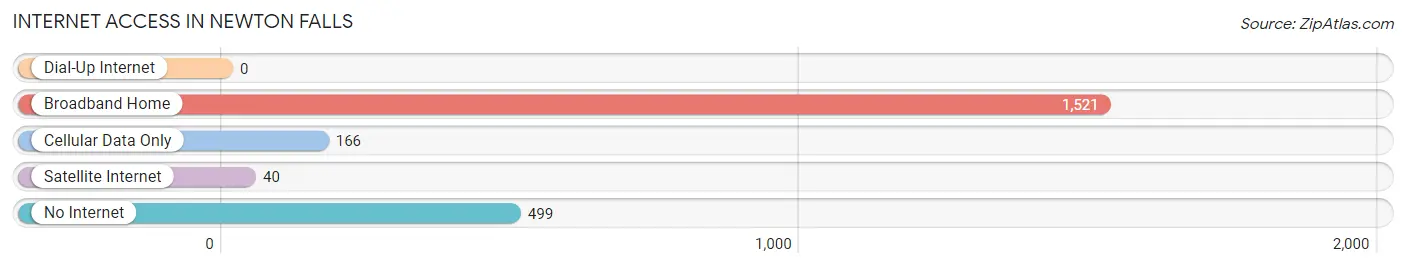
| Internet Type | # Households | % Households |
| Dial-Up Internet | 0 | 0.0% |
| Broadband Home | 1,521 | 69.0% |
| Cellular Data Only | 166 | 7.5% |
| Satellite Internet | 40 | 1.8% |
| No Internet | 499 | 22.6% |
| Total | 2,206 | 100.0% |
Newton Falls Summary
Newton Falls is a small city located in Trumbull County, Ohio, United States. It is situated along the Mahoning River, approximately 20 miles southeast of Youngstown. The city has a population of approximately 5,000 people and is part of the Youngstown-Warren-Boardman metropolitan area.
History
The area that is now Newton Falls was first settled in 1798 by a group of settlers from Connecticut. The settlement was originally known as “New Town” and was later renamed “Newton” in honor of the Revolutionary War hero, General John Newton. The village was incorporated in 1828 and the name was changed to “Newton Falls” in 1832.
The city was an important stop on the Underground Railroad, with many runaway slaves passing through the area on their way to freedom. The city was also home to several important industries, including a paper mill, a sawmill, and a gristmill.
Geography
Newton Falls is located at 41°7′N 80°59′W (41.1167, -80.9833). According to the United States Census Bureau, the city has a total area of 2.2 square miles (5.7 km2), all of it land.
The city is situated along the Mahoning River, which is a tributary of the Ohio River. The city is located in the Appalachian Plateau region of Ohio and is surrounded by rolling hills and forests.
Economy
The economy of Newton Falls is largely based on manufacturing and services. The city is home to several manufacturing companies, including a paper mill, a sawmill, and a gristmill. The city is also home to several retail stores, restaurants, and other businesses.
The city is also home to several educational institutions, including the Newton Falls High School, the Newton Falls Middle School, and the Newton Falls Elementary School.
Demographics
As of the 2010 census, the population of Newton Falls was 5,046. The racial makeup of the city was 95.2% White, 1.2% African American, 0.3% Native American, 0.5% Asian, 0.1% Pacific Islander, 0.7% from other races, and 1.9% from two or more races. Hispanic or Latino of any race were 2.2% of the population.
The median income for a household in the city was $37,917, and the median income for a family was $45,938. The per capita income for the city was $18,945. About 11.2% of families and 14.2% of the population were below the poverty line, including 20.2% of those under age 18 and 8.2% of those age 65 or over.
Newton Falls is a small city with a rich history and a diverse economy. The city is home to several manufacturing companies, educational institutions, and other businesses. The city has a population of approximately 5,000 people and is part of the Youngstown-Warren-Boardman metropolitan area.
Common Questions
What is Per Capita Income in Newton Falls?
Per Capita income in Newton Falls is $30,359.
What is the Median Family Income in Newton Falls?
Median Family Income in Newton Falls is $71,250.
What is the Median Household income in Newton Falls?
Median Household Income in Newton Falls is $50,738.
What is Income or Wage Gap in Newton Falls?
Income or Wage Gap in Newton Falls is 29.4%.
Women in Newton Falls earn 70.6 cents for every dollar earned by a man.
What is Inequality or Gini Index in Newton Falls?
Inequality or Gini Index in Newton Falls is 0.45.
What is the Total Population of Newton Falls?
Total Population of Newton Falls is 4,562.
What is the Total Male Population of Newton Falls?
Total Male Population of Newton Falls is 2,133.
What is the Total Female Population of Newton Falls?
Total Female Population of Newton Falls is 2,429.
What is the Ratio of Males per 100 Females in Newton Falls?
There are 87.81 Males per 100 Females in Newton Falls.
What is the Ratio of Females per 100 Males in Newton Falls?
There are 113.88 Females per 100 Males in Newton Falls.
What is the Median Population Age in Newton Falls?
Median Population Age in Newton Falls is 49.2 Years.
What is the Average Family Size in Newton Falls
Average Family Size in Newton Falls is 3.0 People.
What is the Average Household Size in Newton Falls
Average Household Size in Newton Falls is 2.0 People.
How Large is the Labor Force in Newton Falls?
There are 2,270 People in the Labor Forcein in Newton Falls.
What is the Percentage of People in the Labor Force in Newton Falls?
57.2% of People are in the Labor Force in Newton Falls.
What is the Unemployment Rate in Newton Falls?
Unemployment Rate in Newton Falls is 6.9%.