Crystal Rock, OH Map & Demographics
Crystal Rock Map
Crystal Rock Overview
$57,440
PER CAPITA INCOME
$147,983
AVG HOUSEHOLD INCOME
0.18
INEQUALITY / GINI INDEX
108
TOTAL POPULATION
67
MALE POPULATION
41
FEMALE POPULATION
163.41
MALES / 100 FEMALES
61.19
FEMALES / 100 MALES
38.9
MEDIAN AGE
1.8
AVG FAMILY SIZE
1.5
AVG HOUSEHOLD SIZE
58
LABOR FORCE [ PEOPLE ]
53.7%
PERCENT IN LABOR FORCE
Income in Crystal Rock
Income Overview in Crystal Rock
| Characteristic | Number | Measure |
| Per Capita Income | 108 | $57,440 |
| Median Family Income | 9 | $0 |
| Mean Family Income | 9 | $0 |
| Median Household Income | 71 | $147,983 |
| Mean Household Income | 71 | $115,834 |
| Income Deficit | 9 | $0 |
| Wage / Income Gap (%) | 108 | 0.00% |
| Wage / Income Gap ($) | 108 | 100.00¢ per $1 |
| Gini / Inequality Index | 108 | 0.18 |
Earnings by Sex in Crystal Rock
| Sex | Number | Average Earnings |
| Male | 44 (75.9%) | $0 |
| Female | 14 (24.1%) | $0 |
| Total | 58 (100.0%) | $0 |
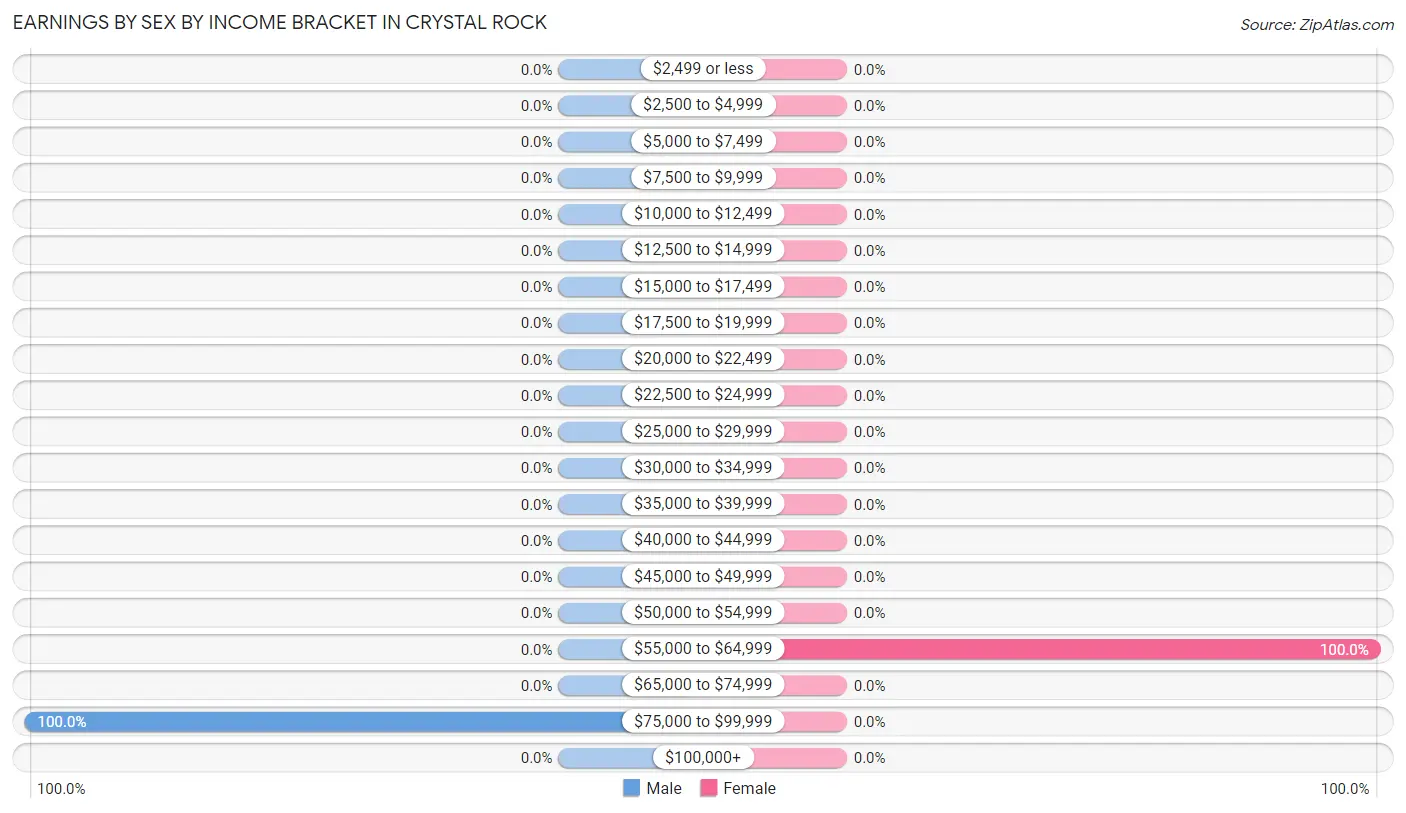
Earnings by Sex by Income Bracket in Crystal Rock
The most common earnings brackets in Crystal Rock are $75,000 to $99,999 for men (44 | 100.0%) and $55,000 to $64,999 for women (14 | 100.0%).
| Income | Male | Female |
| $2,499 or less | 0 (0.0%) | 0 (0.0%) |
| $2,500 to $4,999 | 0 (0.0%) | 0 (0.0%) |
| $5,000 to $7,499 | 0 (0.0%) | 0 (0.0%) |
| $7,500 to $9,999 | 0 (0.0%) | 0 (0.0%) |
| $10,000 to $12,499 | 0 (0.0%) | 0 (0.0%) |
| $12,500 to $14,999 | 0 (0.0%) | 0 (0.0%) |
| $15,000 to $17,499 | 0 (0.0%) | 0 (0.0%) |
| $17,500 to $19,999 | 0 (0.0%) | 0 (0.0%) |
| $20,000 to $22,499 | 0 (0.0%) | 0 (0.0%) |
| $22,500 to $24,999 | 0 (0.0%) | 0 (0.0%) |
| $25,000 to $29,999 | 0 (0.0%) | 0 (0.0%) |
| $30,000 to $34,999 | 0 (0.0%) | 0 (0.0%) |
| $35,000 to $39,999 | 0 (0.0%) | 0 (0.0%) |
| $40,000 to $44,999 | 0 (0.0%) | 0 (0.0%) |
| $45,000 to $49,999 | 0 (0.0%) | 0 (0.0%) |
| $50,000 to $54,999 | 0 (0.0%) | 0 (0.0%) |
| $55,000 to $64,999 | 0 (0.0%) | 14 (100.0%) |
| $65,000 to $74,999 | 0 (0.0%) | 0 (0.0%) |
| $75,000 to $99,999 | 44 (100.0%) | 0 (0.0%) |
| $100,000+ | 0 (0.0%) | 0 (0.0%) |
| Total | 44 (100.0%) | 14 (100.0%) |
Earnings by Sex by Educational Attainment in Crystal Rock
| Educational Attainment | Male Income | Female Income |
| Less than High School | - | - |
| High School Diploma | - | - |
| College or Associate's Degree | - | - |
| Bachelor's Degree | - | - |
| Graduate Degree | - | - |
| Total | - | - |
Family Income in Crystal Rock
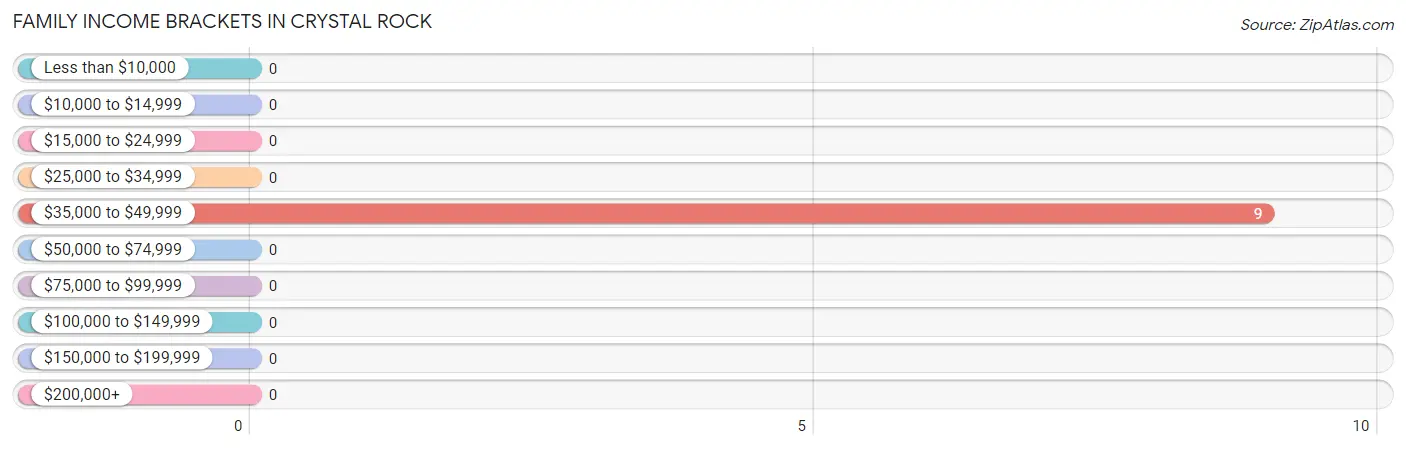
Family Income Brackets in Crystal Rock
According to the Crystal Rock family income data, there are 9 families falling into the $35,000 to $49,999 income range, which is the most common income bracket and makes up 100.0% of all families.
| Income Bracket | # Families | % Families |
| Less than $10,000 | 0 | 0.0% |
| $10,000 to $14,999 | 0 | 0.0% |
| $15,000 to $24,999 | 0 | 0.0% |
| $25,000 to $34,999 | 0 | 0.0% |
| $35,000 to $49,999 | 9 | 100.0% |
| $50,000 to $74,999 | 0 | 0.0% |
| $75,000 to $99,999 | 0 | 0.0% |
| $100,000 to $149,999 | 0 | 0.0% |
| $150,000 to $199,999 | 0 | 0.0% |
| $200,000+ | 0 | 0.0% |
Family Income by Famaliy Size in Crystal Rock
| Income Bracket | # Families | Median Income |
| 2-Person Families | 9 (100.0%) | $0 |
| 3-Person Families | 0 (0.0%) | $0 |
| 4-Person Families | 0 (0.0%) | $0 |
| 5-Person Families | 0 (0.0%) | $0 |
| 6-Person Families | 0 (0.0%) | $0 |
| 7+ Person Families | 0 (0.0%) | $0 |
| Total | 9 (100.0%) | $0 |
Family Income by Number of Earners in Crystal Rock
| Number of Earners | # Families | Median Income |
| No Earners | 9 (100.0%) | $0 |
| 1 Earner | 0 (0.0%) | $0 |
| 2 Earners | 0 (0.0%) | $0 |
| 3+ Earners | 0 (0.0%) | $0 |
| Total | 9 (100.0%) | $0 |
Household Income in Crystal Rock
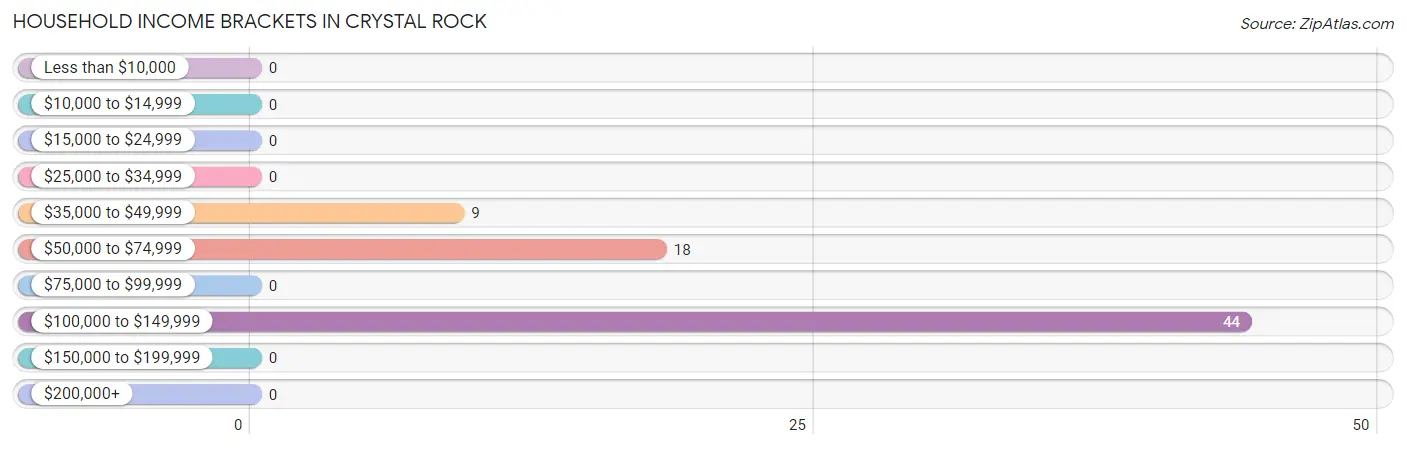
Household Income Brackets in Crystal Rock
With 44 households falling in the category, the $100,000 to $149,999 income range is the most frequent in Crystal Rock, accounting for 62.0% of all households.
| Income Bracket | # Households | % Households |
| Less than $10,000 | 0 | 0.0% |
| $10,000 to $14,999 | 0 | 0.0% |
| $15,000 to $24,999 | 0 | 0.0% |
| $25,000 to $34,999 | 0 | 0.0% |
| $35,000 to $49,999 | 9 | 12.7% |
| $50,000 to $74,999 | 18 | 25.4% |
| $75,000 to $99,999 | 0 | 0.0% |
| $100,000 to $149,999 | 44 | 62.0% |
| $150,000 to $199,999 | 0 | 0.0% |
| $200,000+ | 0 | 0.0% |
Household Income by Householder Age in Crystal Rock
| Income Bracket | # Households | Median Income |
| 15 to 24 Years | 0 (0.0%) | $0 |
| 25 to 44 Years | 44 (62.0%) | $0 |
| 45 to 64 Years | 9 (12.7%) | $0 |
| 65+ Years | 18 (25.4%) | $0 |
| Total | 71 (100.0%) | $147,983 |
Poverty in Crystal Rock
Income Below Poverty by Sex and Age in Crystal Rock
| Age Bracket | Male | Female |
| Under 5 Years | 0 (0.0%) | 0 (0.0%) |
| 5 Years | 0 (0.0%) | 0 (0.0%) |
| 6 to 11 Years | 0 (0.0%) | 0 (0.0%) |
| 12 to 14 Years | 0 (0.0%) | 0 (0.0%) |
| 15 Years | 0 (0.0%) | 0 (0.0%) |
| 16 and 17 Years | 0 (0.0%) | 0 (0.0%) |
| 18 to 24 Years | 0 (0.0%) | 0 (0.0%) |
| 25 to 34 Years | 0 (0.0%) | 0 (0.0%) |
| 35 to 44 Years | 0 (0.0%) | 0 (0.0%) |
| 45 to 54 Years | 0 (0.0%) | 0 (0.0%) |
| 55 to 64 Years | 0 (0.0%) | 0 (0.0%) |
| 65 to 74 Years | 0 (0.0%) | 0 (0.0%) |
| 75 Years and over | 0 (0.0%) | 0 (0.0%) |
| Total | 0 (0.0%) | 0 (0.0%) |
Income Above Poverty by Sex and Age in Crystal Rock
According to the poverty statistics in Crystal Rock, males aged 35 to 44 years and females aged 35 to 44 years are the age groups that are most secure financially, with 100.0% of males and 100.0% of females in these age groups living above the poverty line.
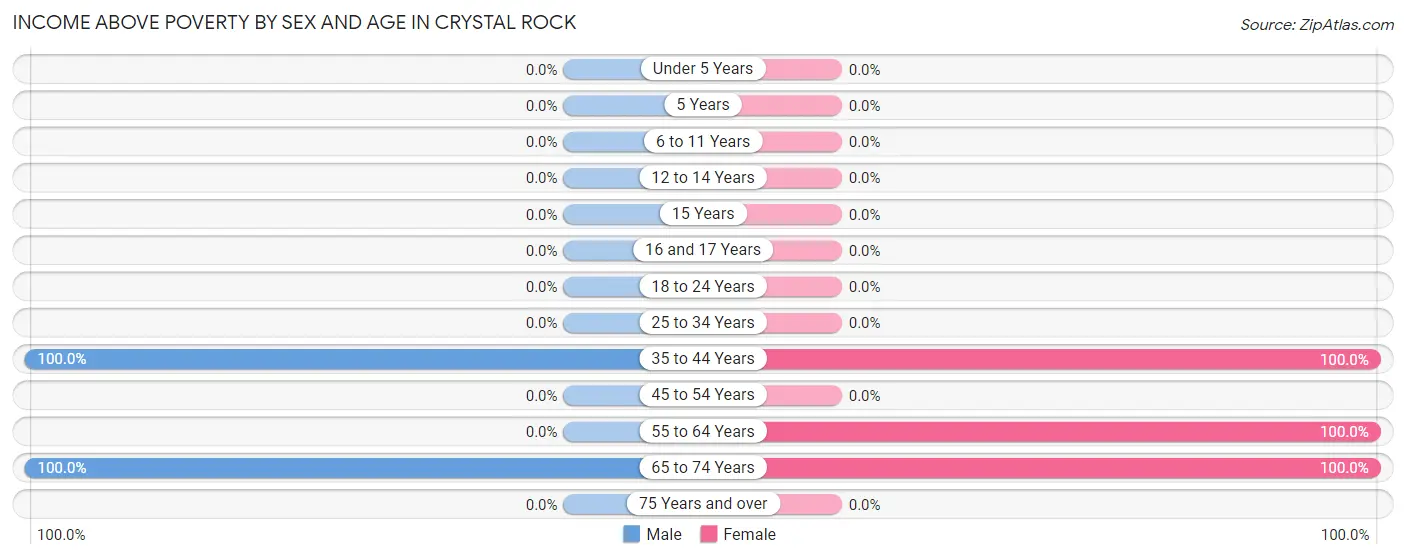
| Age Bracket | Male | Female |
| Under 5 Years | 0 (0.0%) | 0 (0.0%) |
| 5 Years | 0 (0.0%) | 0 (0.0%) |
| 6 to 11 Years | 0 (0.0%) | 0 (0.0%) |
| 12 to 14 Years | 0 (0.0%) | 0 (0.0%) |
| 15 Years | 0 (0.0%) | 0 (0.0%) |
| 16 and 17 Years | 0 (0.0%) | 0 (0.0%) |
| 18 to 24 Years | 0 (0.0%) | 0 (0.0%) |
| 25 to 34 Years | 0 (0.0%) | 0 (0.0%) |
| 35 to 44 Years | 44 (100.0%) | 14 (100.0%) |
| 45 to 54 Years | 0 (0.0%) | 0 (0.0%) |
| 55 to 64 Years | 0 (0.0%) | 9 (100.0%) |
| 65 to 74 Years | 23 (100.0%) | 18 (100.0%) |
| 75 Years and over | 0 (0.0%) | 0 (0.0%) |
| Total | 67 (100.0%) | 41 (100.0%) |
Income Below Poverty Among Married-Couple Families in Crystal Rock
| Children | Above Poverty | Below Poverty |
| No Children | 9 (100.0%) | 0 (0.0%) |
| 1 or 2 Children | 0 (0.0%) | 0 (0.0%) |
| 3 or 4 Children | 0 (0.0%) | 0 (0.0%) |
| 5 or more Children | 0 (0.0%) | 0 (0.0%) |
| Total | 9 (100.0%) | 0 (0.0%) |
Income Below Poverty Among Single-Parent Households in Crystal Rock
| Children | Single Father | Single Mother |
| No Children | 0 (0.0%) | 0 (0.0%) |
| 1 or 2 Children | 0 (0.0%) | 0 (0.0%) |
| 3 or 4 Children | 0 (0.0%) | 0 (0.0%) |
| 5 or more Children | 0 (0.0%) | 0 (0.0%) |
| Total | 0 (0.0%) | 0 (0.0%) |
Income Below Poverty Among Married-Couple vs Single-Parent Households in Crystal Rock
| Children | Married-Couple Families | Single-Parent Households |
| No Children | 0 (0.0%) | 0 (0.0%) |
| 1 or 2 Children | 0 (0.0%) | 0 (0.0%) |
| 3 or 4 Children | 0 (0.0%) | 0 (0.0%) |
| 5 or more Children | 0 (0.0%) | 0 (0.0%) |
| Total | 0 (0.0%) | 0 (0.0%) |
Race in Crystal Rock
The most populous races in Crystal Rock are White / Caucasian (55 | 50.9%), Hispanic or Latino (53 | 49.1%), and Two or more Races (53 | 49.1%).
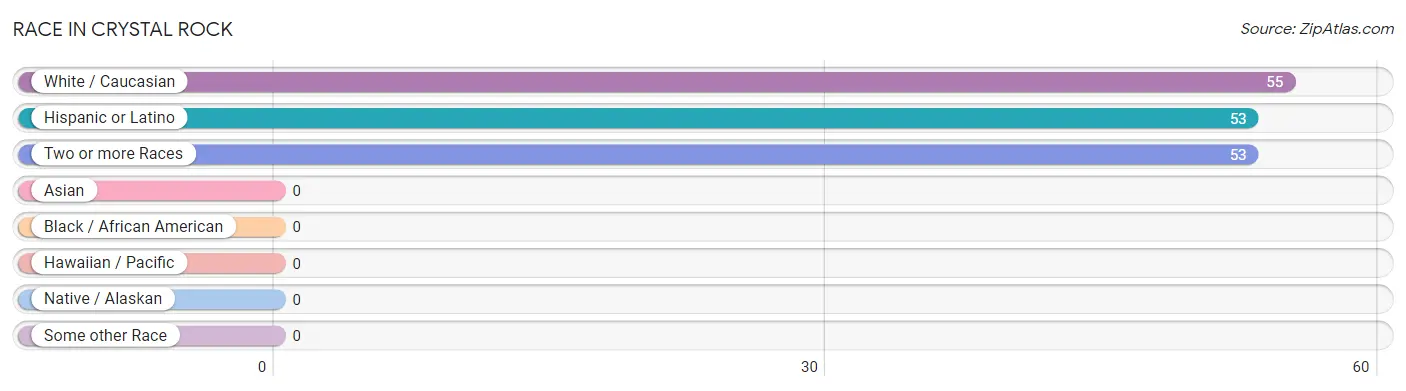
| Race | # Population | % Population |
| Asian | 0 | 0.0% |
| Black / African American | 0 | 0.0% |
| Hawaiian / Pacific | 0 | 0.0% |
| Hispanic or Latino | 53 | 49.1% |
| Native / Alaskan | 0 | 0.0% |
| White / Caucasian | 55 | 50.9% |
| Two or more Races | 53 | 49.1% |
| Some other Race | 0 | 0.0% |
| Total | 108 | 100.0% |
Ancestry in Crystal Rock
The most populous ancestries reported in Crystal Rock are Puerto Rican (53 | 49.1%), German (34 | 31.5%), and Italian (7 | 6.5%), together accounting for 87.0% of all Crystal Rock residents.
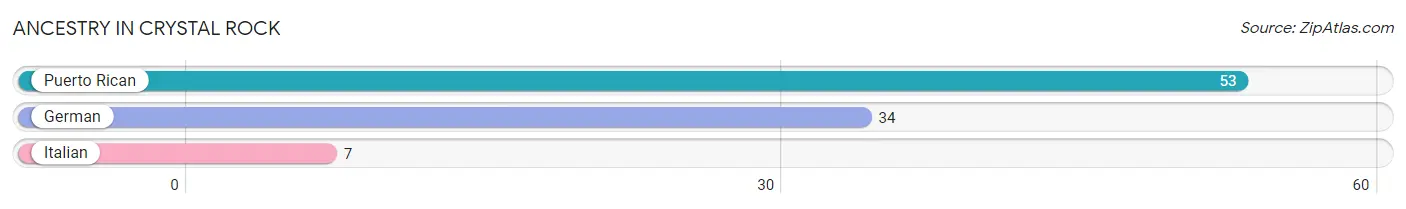
| Ancestry | # Population | % Population |
| German | 34 | 31.5% |
| Italian | 7 | 6.5% |
| Puerto Rican | 53 | 49.1% | View All 3 Rows |
Immigrants in Crystal Rock

| Immigration Origin | # Population | % Population | View All 0 Rows |
Sex and Age in Crystal Rock
Sex and Age in Crystal Rock
The most populous age groups in Crystal Rock are 35 to 39 Years (44 | 65.7%) for men and 65 to 69 Years (18 | 43.9%) for women.

| Age Bracket | Male | Female |
| Under 5 Years | 0 (0.0%) | 0 (0.0%) |
| 5 to 9 Years | 0 (0.0%) | 0 (0.0%) |
| 10 to 14 Years | 0 (0.0%) | 0 (0.0%) |
| 15 to 19 Years | 0 (0.0%) | 0 (0.0%) |
| 20 to 24 Years | 0 (0.0%) | 0 (0.0%) |
| 25 to 29 Years | 0 (0.0%) | 0 (0.0%) |
| 30 to 34 Years | 0 (0.0%) | 0 (0.0%) |
| 35 to 39 Years | 44 (65.7%) | 14 (34.2%) |
| 40 to 44 Years | 0 (0.0%) | 0 (0.0%) |
| 45 to 49 Years | 0 (0.0%) | 0 (0.0%) |
| 50 to 54 Years | 0 (0.0%) | 0 (0.0%) |
| 55 to 59 Years | 0 (0.0%) | 0 (0.0%) |
| 60 to 64 Years | 0 (0.0%) | 9 (22.0%) |
| 65 to 69 Years | 23 (34.3%) | 18 (43.9%) |
| 70 to 74 Years | 0 (0.0%) | 0 (0.0%) |
| 75 to 79 Years | 0 (0.0%) | 0 (0.0%) |
| 80 to 84 Years | 0 (0.0%) | 0 (0.0%) |
| 85 Years and over | 0 (0.0%) | 0 (0.0%) |
| Total | 67 (100.0%) | 41 (100.0%) |
Families and Households in Crystal Rock
Median Family Size in Crystal Rock
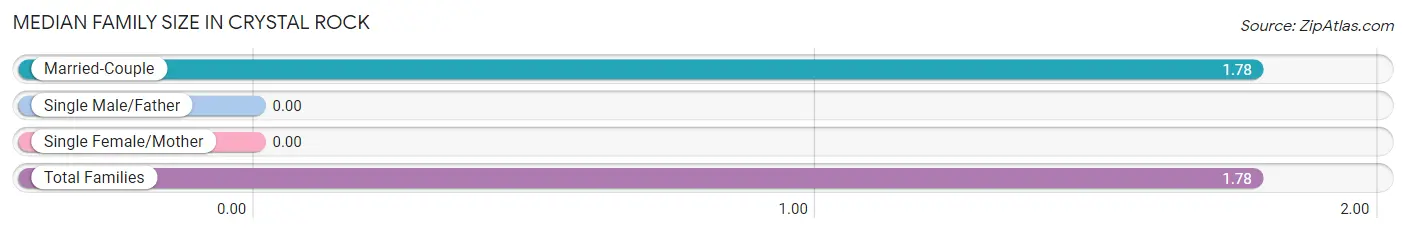
| Family Type | # Families | Family Size |
| Married-Couple | 9 (100.0%) | 1.78 |
| Single Male/Father | 0 (0.0%) | - |
| Single Female/Mother | 0 (0.0%) | - |
| Total Families | 9 (100.0%) | 1.78 |
Median Household Size in Crystal Rock
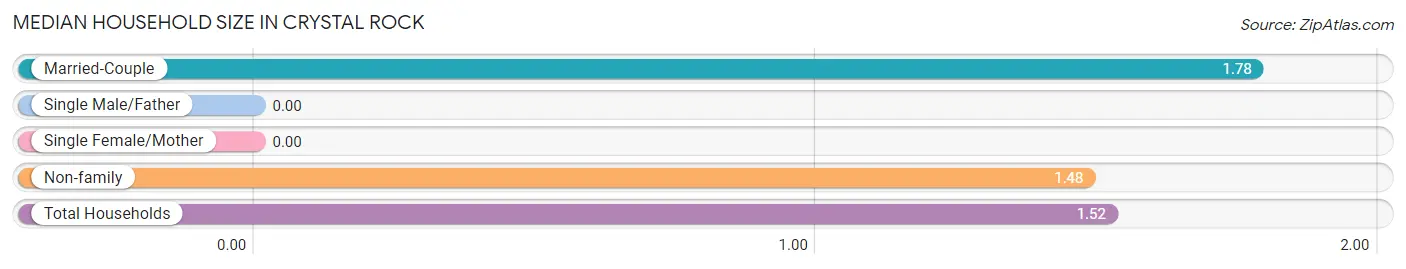
| Household Type | # Households | Household Size |
| Married-Couple | 9 (12.7%) | 1.78 |
| Single Male/Father | 0 (0.0%) | - |
| Single Female/Mother | 0 (0.0%) | - |
| Non-family | 62 (87.3%) | 1.48 |
| Total Households | 71 (100.0%) | 1.52 |
Household Size by Marriage Status in Crystal Rock
Out of a total of 71 households in Crystal Rock, 9 (12.7%) are family households, while 62 (87.3%) are nonfamily households. The most numerous type of family households are 2-person households, comprising 9, and the most common type of nonfamily households are 2-person households, comprising 62.
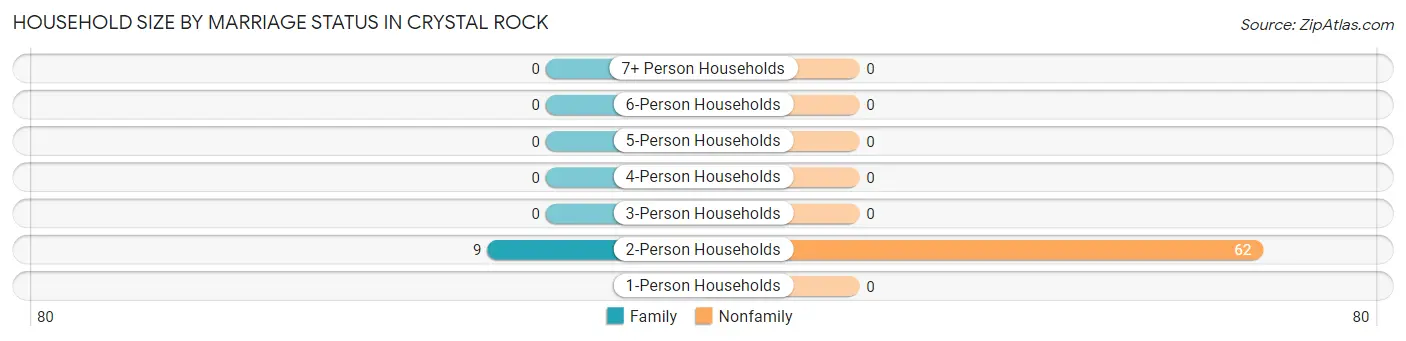
| Household Size | Family Households | Nonfamily Households |
| 1-Person Households | - | 0 (0.0%) |
| 2-Person Households | 9 (12.7%) | 62 (87.3%) |
| 3-Person Households | 0 (0.0%) | 0 (0.0%) |
| 4-Person Households | 0 (0.0%) | 0 (0.0%) |
| 5-Person Households | 0 (0.0%) | 0 (0.0%) |
| 6-Person Households | 0 (0.0%) | 0 (0.0%) |
| 7+ Person Households | 0 (0.0%) | 0 (0.0%) |
| Total | 9 (12.7%) | 62 (87.3%) |
Female Fertility in Crystal Rock
Fertility by Age in Crystal Rock
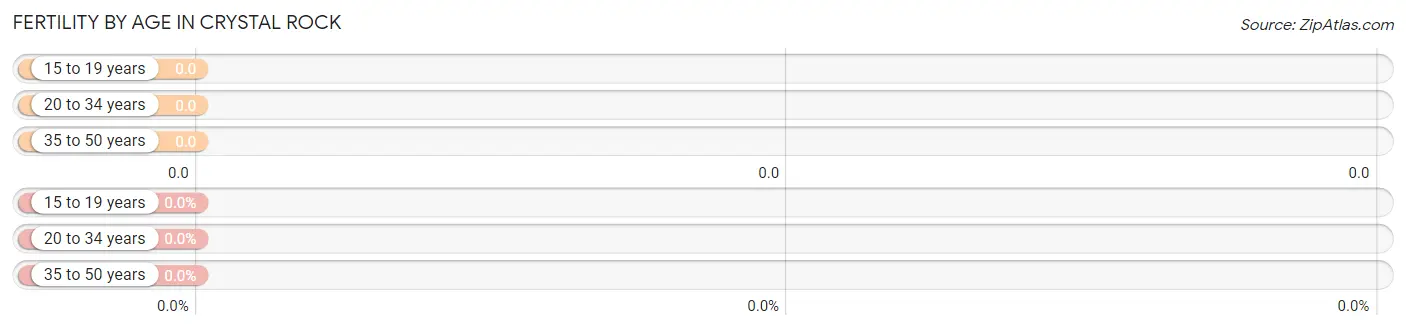
| Age Bracket | Women with Births | Births / 1,000 Women |
| 15 to 19 years | 0 (0.0%) | 0.0 |
| 20 to 34 years | 0 (0.0%) | 0.0 |
| 35 to 50 years | 0 (0.0%) | 0.0 |
| Total | 0 (0.0%) | 0.0 |
Fertility by Age by Marriage Status in Crystal Rock
| Age Bracket | Married | Unmarried |
| 15 to 19 years | 0 (0.0%) | 0 (0.0%) |
| 20 to 34 years | 0 (0.0%) | 0 (0.0%) |
| 35 to 50 years | 0 (0.0%) | 0 (0.0%) |
| Total | 0 (0.0%) | 0 (0.0%) |
Fertility by Education in Crystal Rock
| Educational Attainment | Women with Births | Births / 1,000 Women |
| Less than High School | 0 (0.0%) | 0.0 |
| High School Diploma | 0 (0.0%) | 0.0 |
| College or Associate's Degree | 0 (0.0%) | 0.0 |
| Bachelor's Degree | 0 (0.0%) | 0.0 |
| Graduate Degree | 0 (0.0%) | 0.0 |
| Total | 0 (0.0%) | 0.0 |
Fertility by Education by Marriage Status in Crystal Rock
| Educational Attainment | Married | Unmarried |
| Less than High School | 0 (0.0%) | 0 (0.0%) |
| High School Diploma | 0 (0.0%) | 0 (0.0%) |
| College or Associate's Degree | 0 (0.0%) | 0 (0.0%) |
| Bachelor's Degree | 0 (0.0%) | 0 (0.0%) |
| Graduate Degree | 0 (0.0%) | 0 (0.0%) |
| Total | 0 (0.0%) | 0 (0.0%) |
Employment Characteristics in Crystal Rock
Employment by Class of Employer in Crystal Rock
Among the 58 employed individuals in Crystal Rock, , and private company employees (58 | 100.0%) make up the most common classes of employment.
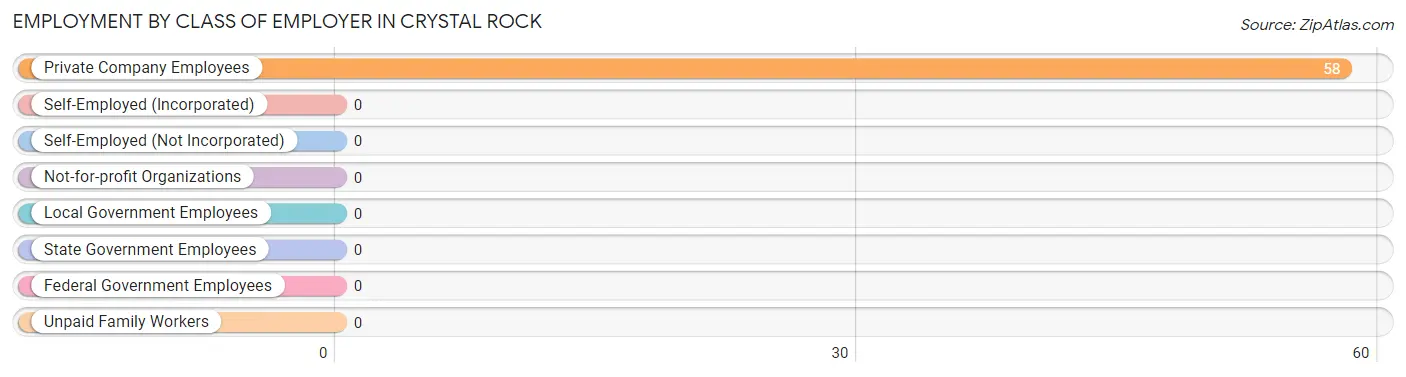
| Employer Class | # Employees | % Employees |
| Private Company Employees | 58 | 100.0% |
| Self-Employed (Incorporated) | 0 | 0.0% |
| Self-Employed (Not Incorporated) | 0 | 0.0% |
| Not-for-profit Organizations | 0 | 0.0% |
| Local Government Employees | 0 | 0.0% |
| State Government Employees | 0 | 0.0% |
| Federal Government Employees | 0 | 0.0% |
| Unpaid Family Workers | 0 | 0.0% |
| Total | 58 | 100.0% |
Employment Status by Age in Crystal Rock
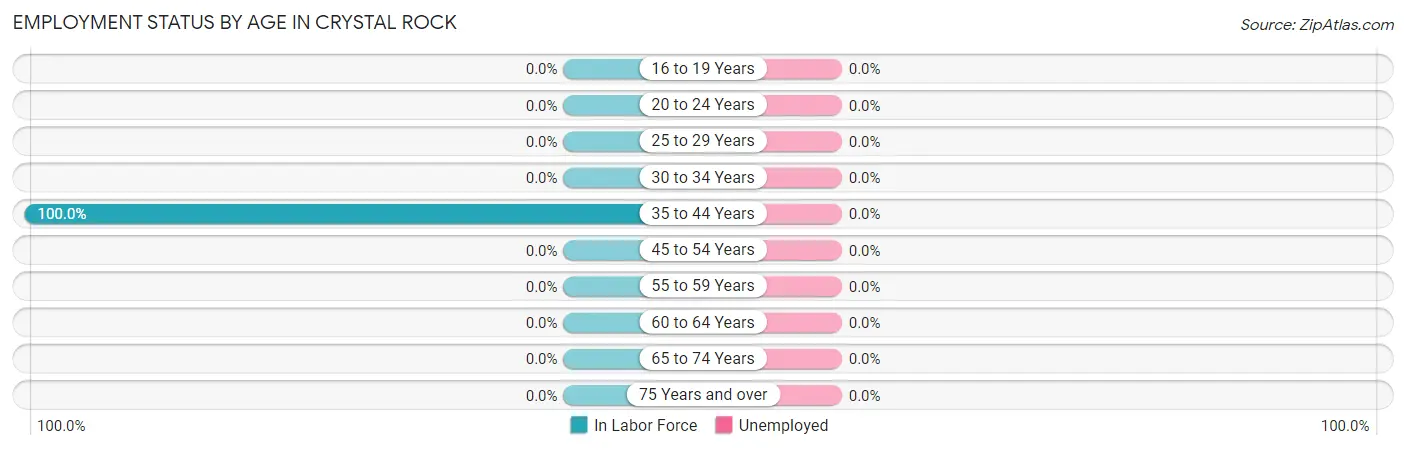
| Age Bracket | In Labor Force | Unemployed |
| 16 to 19 Years | 0 (0.0%) | 0 (0.0%) |
| 20 to 24 Years | 0 (0.0%) | 0 (0.0%) |
| 25 to 29 Years | 0 (0.0%) | 0 (0.0%) |
| 30 to 34 Years | 0 (0.0%) | 0 (0.0%) |
| 35 to 44 Years | 58 (100.0%) | 0 (0.0%) |
| 45 to 54 Years | 0 (0.0%) | 0 (0.0%) |
| 55 to 59 Years | 0 (0.0%) | 0 (0.0%) |
| 60 to 64 Years | 0 (0.0%) | 0 (0.0%) |
| 65 to 74 Years | 0 (0.0%) | 0 (0.0%) |
| 75 Years and over | 0 (0.0%) | 0 (0.0%) |
| Total | 58 (53.7%) | 0 (0.0%) |
Employment Status by Educational Attainment in Crystal Rock
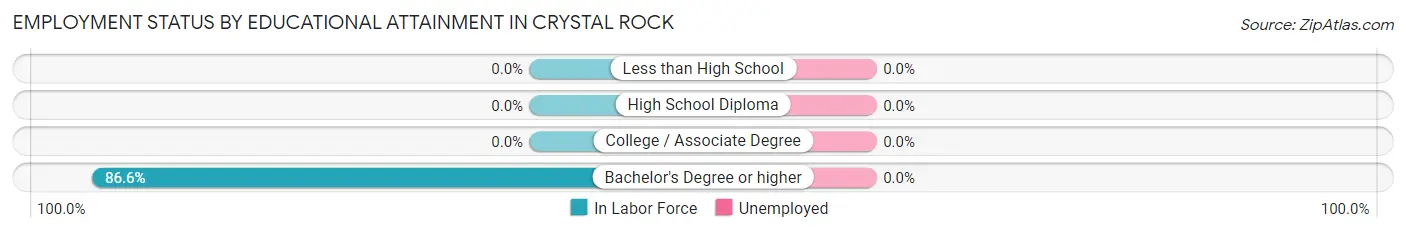
| Educational Attainment | In Labor Force | Unemployed |
| Less than High School | 0 (0.0%) | 0 (0.0%) |
| High School Diploma | 0 (0.0%) | 0 (0.0%) |
| College / Associate Degree | 0 (0.0%) | 0 (0.0%) |
| Bachelor's Degree or higher | 58 (86.6%) | 0 (0.0%) |
| Total | 58 (86.6%) | 0 (0.0%) |
Employment Occupations by Sex in Crystal Rock
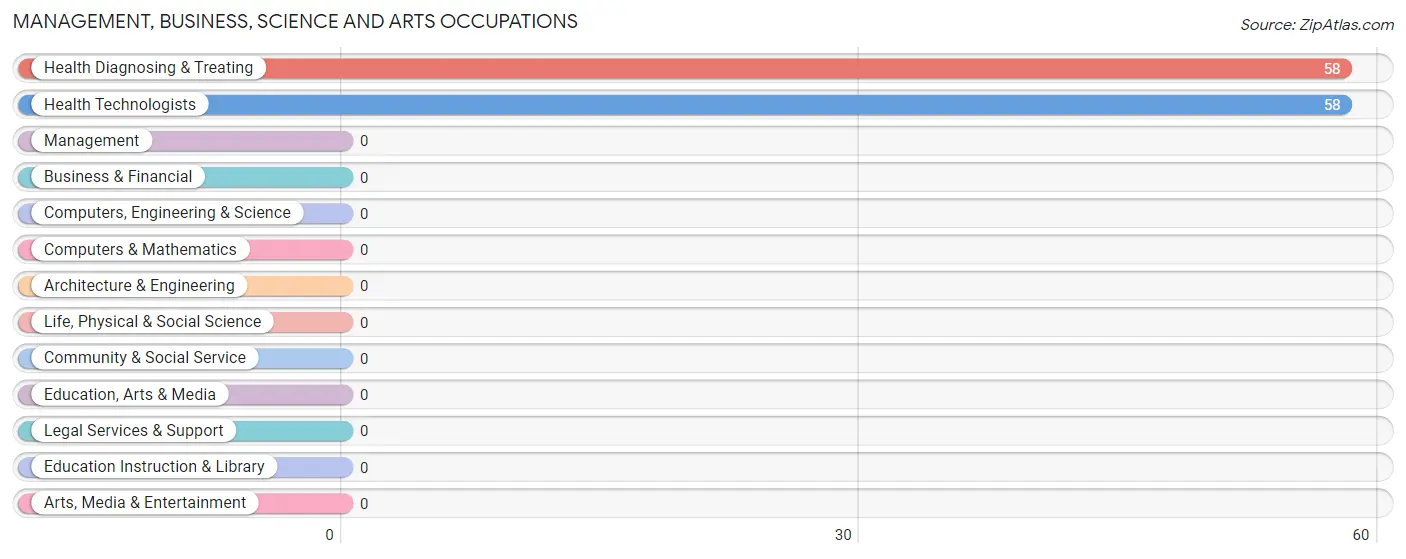
Management, Business, Science and Arts Occupations
The most common Management, Business, Science and Arts occupations in Crystal Rock are Health Diagnosing & Treating (58 | 100.0%), and Health Technologists (58 | 100.0%).
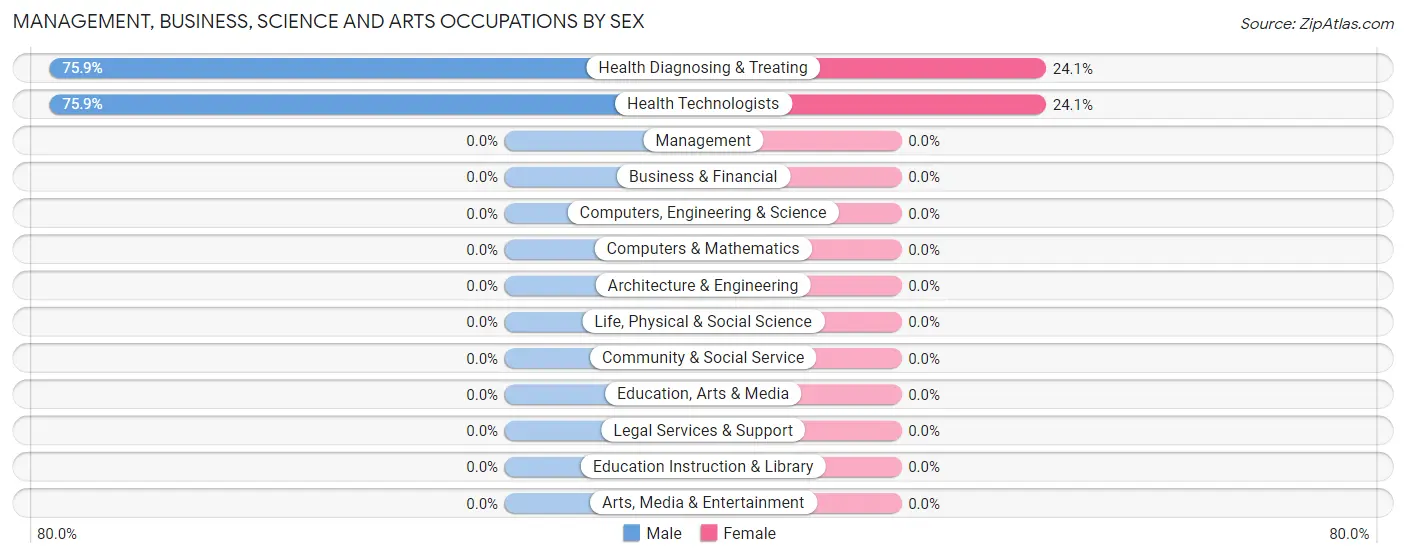
Management, Business, Science and Arts Occupations by Sex
Within the Management, Business, Science and Arts occupations in Crystal Rock, the most male-oriented occupations are Health Diagnosing & Treating (75.9%), and Health Technologists (75.9%), while the most female-oriented occupations are Health Diagnosing & Treating (24.1%), and Health Technologists (24.1%).
| Occupation | Male | Female |
| Management | 0 (0.0%) | 0 (0.0%) |
| Business & Financial | 0 (0.0%) | 0 (0.0%) |
| Computers, Engineering & Science | 0 (0.0%) | 0 (0.0%) |
| Computers & Mathematics | 0 (0.0%) | 0 (0.0%) |
| Architecture & Engineering | 0 (0.0%) | 0 (0.0%) |
| Life, Physical & Social Science | 0 (0.0%) | 0 (0.0%) |
| Community & Social Service | 0 (0.0%) | 0 (0.0%) |
| Education, Arts & Media | 0 (0.0%) | 0 (0.0%) |
| Legal Services & Support | 0 (0.0%) | 0 (0.0%) |
| Education Instruction & Library | 0 (0.0%) | 0 (0.0%) |
| Arts, Media & Entertainment | 0 (0.0%) | 0 (0.0%) |
| Health Diagnosing & Treating | 44 (75.9%) | 14 (24.1%) |
| Health Technologists | 44 (75.9%) | 14 (24.1%) |
| Total (Category) | 44 (75.9%) | 14 (24.1%) |
| Total (Overall) | 44 (75.9%) | 14 (24.1%) |
Services Occupations
Services Occupations by Sex
| Occupation | Male | Female |
| Healthcare Support | 0 (0.0%) | 0 (0.0%) |
| Security & Protection | 0 (0.0%) | 0 (0.0%) |
| Firefighting & Prevention | 0 (0.0%) | 0 (0.0%) |
| Law Enforcement | 0 (0.0%) | 0 (0.0%) |
| Food Preparation & Serving | 0 (0.0%) | 0 (0.0%) |
| Cleaning & Maintenance | 0 (0.0%) | 0 (0.0%) |
| Personal Care & Service | 0 (0.0%) | 0 (0.0%) |
| Total (Category) | 0 (0.0%) | 0 (0.0%) |
| Total (Overall) | 44 (75.9%) | 14 (24.1%) |
Sales and Office Occupations
Sales and Office Occupations by Sex
| Occupation | Male | Female |
| Sales & Related | 0 (0.0%) | 0 (0.0%) |
| Office & Administration | 0 (0.0%) | 0 (0.0%) |
| Total (Category) | 0 (0.0%) | 0 (0.0%) |
| Total (Overall) | 44 (75.9%) | 14 (24.1%) |
Natural Resources, Construction and Maintenance Occupations
Natural Resources, Construction and Maintenance Occupations by Sex
| Occupation | Male | Female |
| Farming, Fishing & Forestry | 0 (0.0%) | 0 (0.0%) |
| Construction & Extraction | 0 (0.0%) | 0 (0.0%) |
| Installation, Maintenance & Repair | 0 (0.0%) | 0 (0.0%) |
| Total (Category) | 0 (0.0%) | 0 (0.0%) |
| Total (Overall) | 44 (75.9%) | 14 (24.1%) |
Production, Transportation and Moving Occupations
Production, Transportation and Moving Occupations by Sex
| Occupation | Male | Female |
| Production | 0 (0.0%) | 0 (0.0%) |
| Transportation | 0 (0.0%) | 0 (0.0%) |
| Material Moving | 0 (0.0%) | 0 (0.0%) |
| Total (Category) | 0 (0.0%) | 0 (0.0%) |
| Total (Overall) | 44 (75.9%) | 14 (24.1%) |
Employment Industries by Sex in Crystal Rock
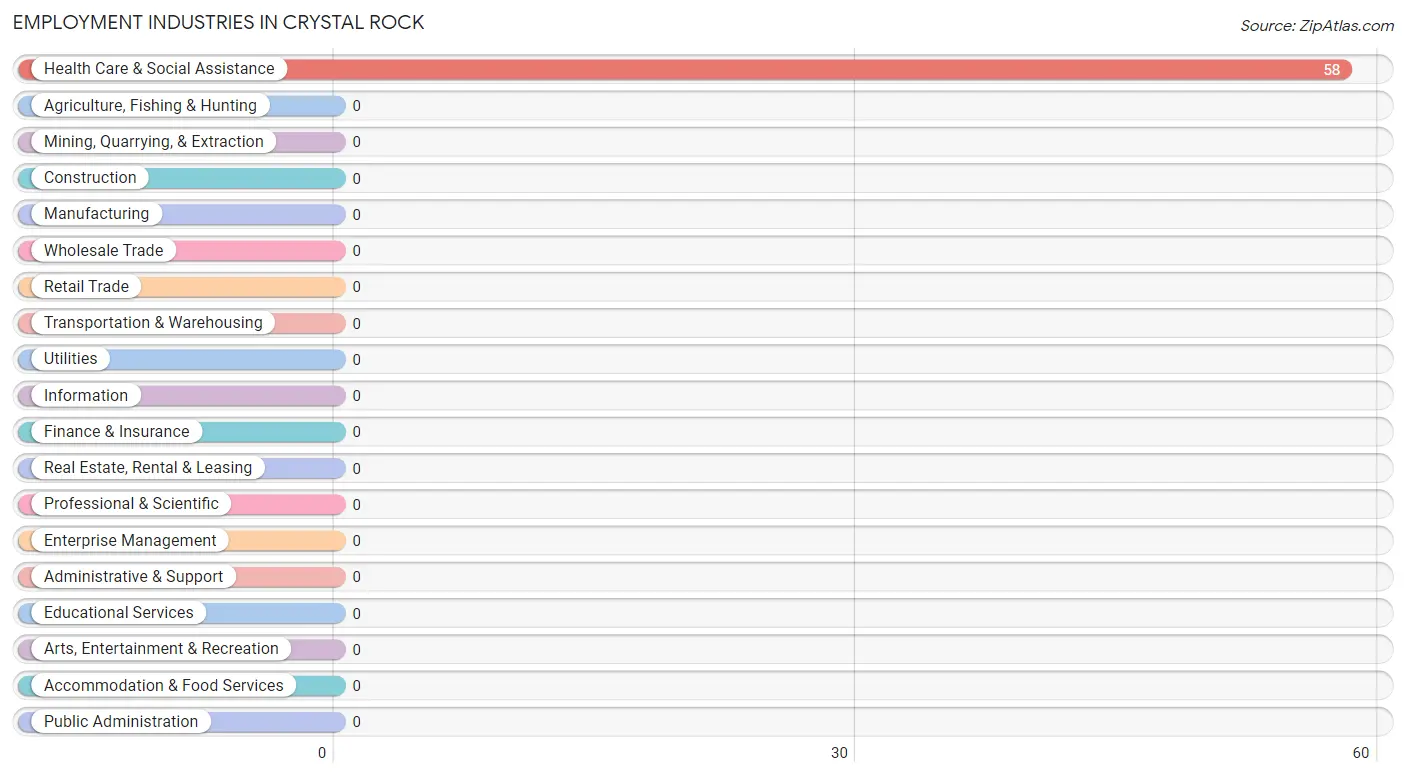
Employment Industries in Crystal Rock
The major employment industries in Crystal Rock include , and Health Care & Social Assistance (58 | 100.0%).
Employment Industries by Sex in Crystal Rock
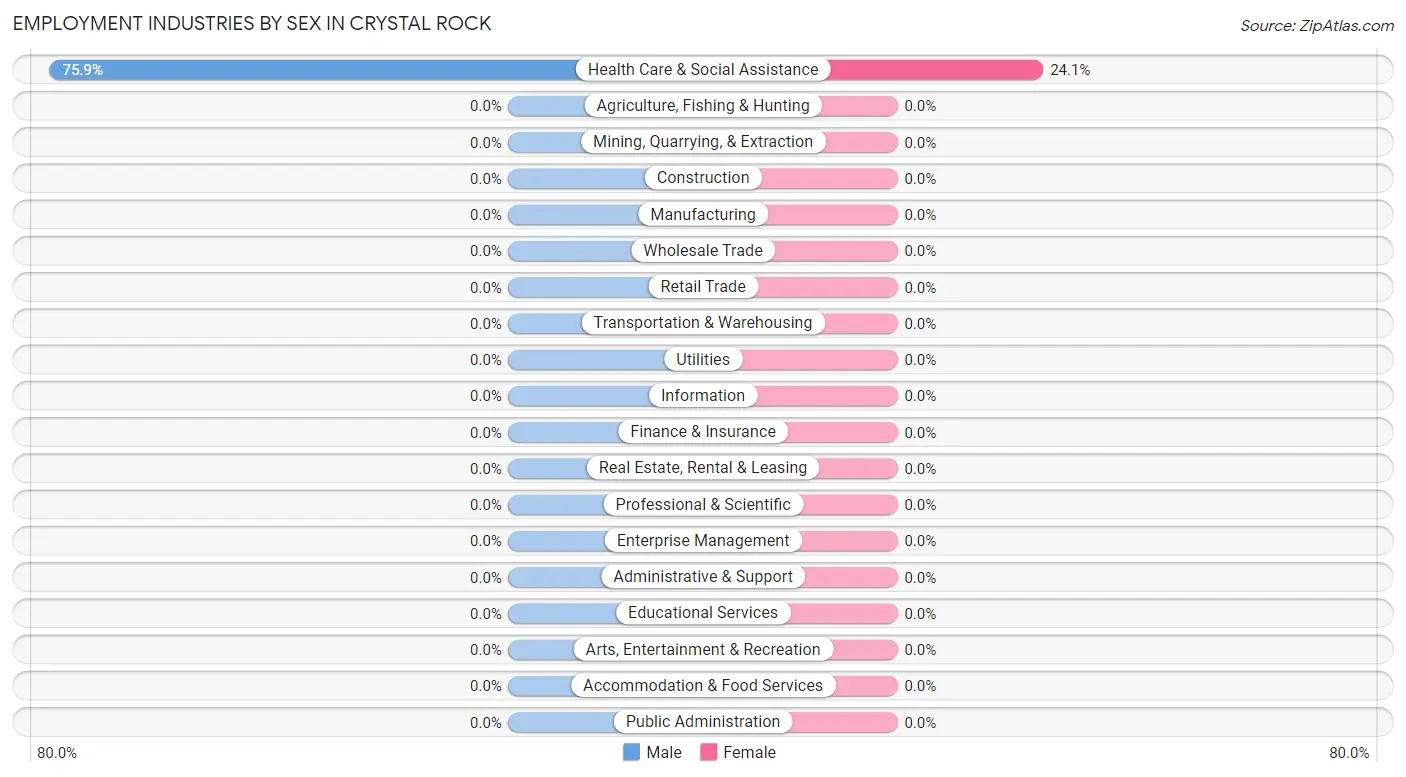
| Industry | Male | Female |
| Agriculture, Fishing & Hunting | 0 (0.0%) | 0 (0.0%) |
| Mining, Quarrying, & Extraction | 0 (0.0%) | 0 (0.0%) |
| Construction | 0 (0.0%) | 0 (0.0%) |
| Manufacturing | 0 (0.0%) | 0 (0.0%) |
| Wholesale Trade | 0 (0.0%) | 0 (0.0%) |
| Retail Trade | 0 (0.0%) | 0 (0.0%) |
| Transportation & Warehousing | 0 (0.0%) | 0 (0.0%) |
| Utilities | 0 (0.0%) | 0 (0.0%) |
| Information | 0 (0.0%) | 0 (0.0%) |
| Finance & Insurance | 0 (0.0%) | 0 (0.0%) |
| Real Estate, Rental & Leasing | 0 (0.0%) | 0 (0.0%) |
| Professional & Scientific | 0 (0.0%) | 0 (0.0%) |
| Enterprise Management | 0 (0.0%) | 0 (0.0%) |
| Administrative & Support | 0 (0.0%) | 0 (0.0%) |
| Educational Services | 0 (0.0%) | 0 (0.0%) |
| Health Care & Social Assistance | 44 (75.9%) | 14 (24.1%) |
| Arts, Entertainment & Recreation | 0 (0.0%) | 0 (0.0%) |
| Accommodation & Food Services | 0 (0.0%) | 0 (0.0%) |
| Public Administration | 0 (0.0%) | 0 (0.0%) |
| Total | 44 (75.9%) | 14 (24.1%) |
Education in Crystal Rock
School Enrollment in Crystal Rock
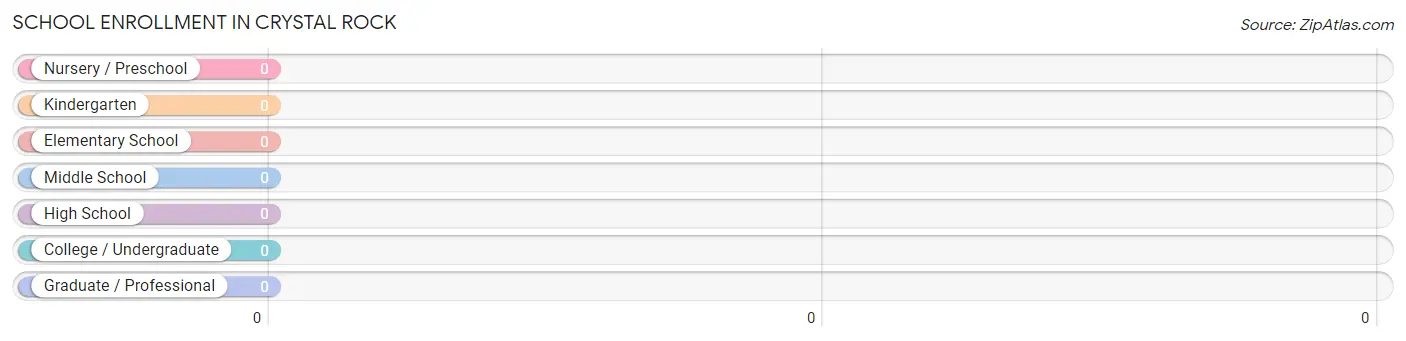
| School Level | # Students | % Students |
| Nursery / Preschool | 0 | 0.0% |
| Kindergarten | 0 | 0.0% |
| Elementary School | 0 | 0.0% |
| Middle School | 0 | 0.0% |
| High School | 0 | 0.0% |
| College / Undergraduate | 0 | 0.0% |
| Graduate / Professional | 0 | 0.0% |
| Total | 0 | 0.0% |
School Enrollment by Age by Funding Source in Crystal Rock
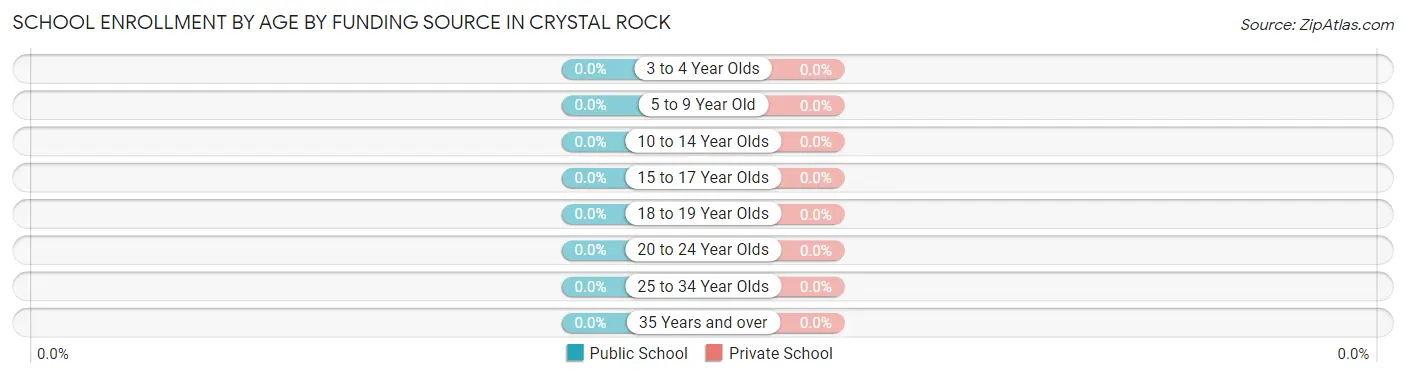
| Age Bracket | Public School | Private School |
| 3 to 4 Year Olds | 0 (0.0%) | 0 (0.0%) |
| 5 to 9 Year Old | 0 (0.0%) | 0 (0.0%) |
| 10 to 14 Year Olds | 0 (0.0%) | 0 (0.0%) |
| 15 to 17 Year Olds | 0 (0.0%) | 0 (0.0%) |
| 18 to 19 Year Olds | 0 (0.0%) | 0 (0.0%) |
| 20 to 24 Year Olds | 0 (0.0%) | 0 (0.0%) |
| 25 to 34 Year Olds | 0 (0.0%) | 0 (0.0%) |
| 35 Years and over | 0 (0.0%) | 0 (0.0%) |
| Total | 0 (0.0%) | 0 (0.0%) |
Educational Attainment by Field of Study in Crystal Rock
Psychology (44 | 51.8%), business (27 | 31.8%), and science & technology (14 | 16.5%) are the most common fields of study among 85 individuals in Crystal Rock who have obtained a bachelor's degree or higher.
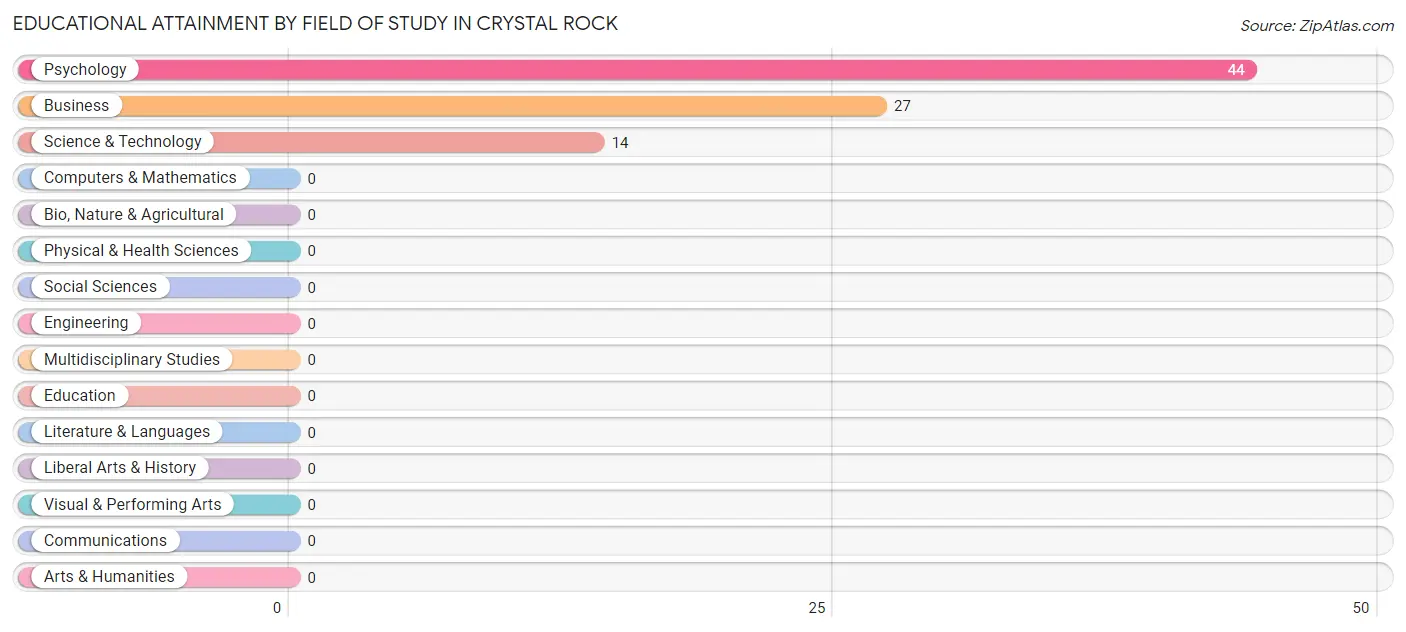
| Field of Study | # Graduates | % Graduates |
| Computers & Mathematics | 0 | 0.0% |
| Bio, Nature & Agricultural | 0 | 0.0% |
| Physical & Health Sciences | 0 | 0.0% |
| Psychology | 44 | 51.8% |
| Social Sciences | 0 | 0.0% |
| Engineering | 0 | 0.0% |
| Multidisciplinary Studies | 0 | 0.0% |
| Science & Technology | 14 | 16.5% |
| Business | 27 | 31.8% |
| Education | 0 | 0.0% |
| Literature & Languages | 0 | 0.0% |
| Liberal Arts & History | 0 | 0.0% |
| Visual & Performing Arts | 0 | 0.0% |
| Communications | 0 | 0.0% |
| Arts & Humanities | 0 | 0.0% |
| Total | 85 | 100.0% |
Transportation & Commute in Crystal Rock
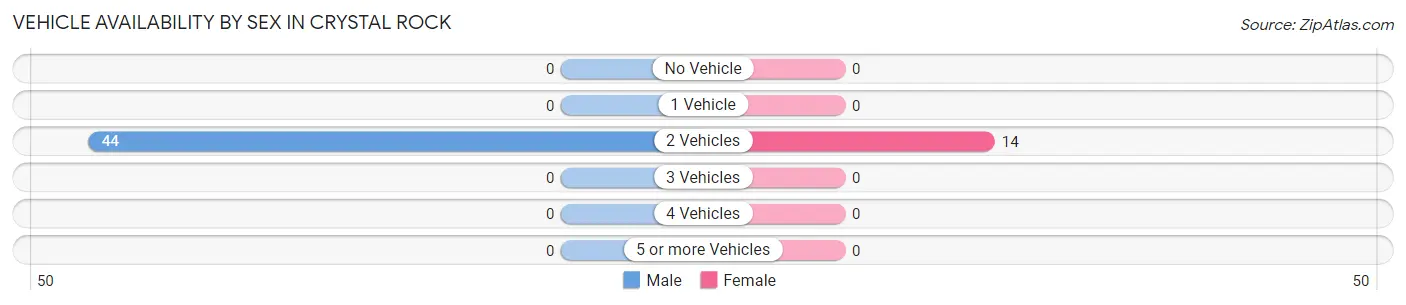
Vehicle Availability by Sex in Crystal Rock
The most prevalent vehicle ownership categories in Crystal Rock are males with 2 vehicles (44, accounting for 100.0%) and females with 2 vehicles (14, making up 314.3%).
| Vehicles Available | Male | Female |
| No Vehicle | 0 (0.0%) | 0 (0.0%) |
| 1 Vehicle | 0 (0.0%) | 0 (0.0%) |
| 2 Vehicles | 44 (100.0%) | 14 (100.0%) |
| 3 Vehicles | 0 (0.0%) | 0 (0.0%) |
| 4 Vehicles | 0 (0.0%) | 0 (0.0%) |
| 5 or more Vehicles | 0 (0.0%) | 0 (0.0%) |
| Total | 44 (100.0%) | 14 (100.0%) |
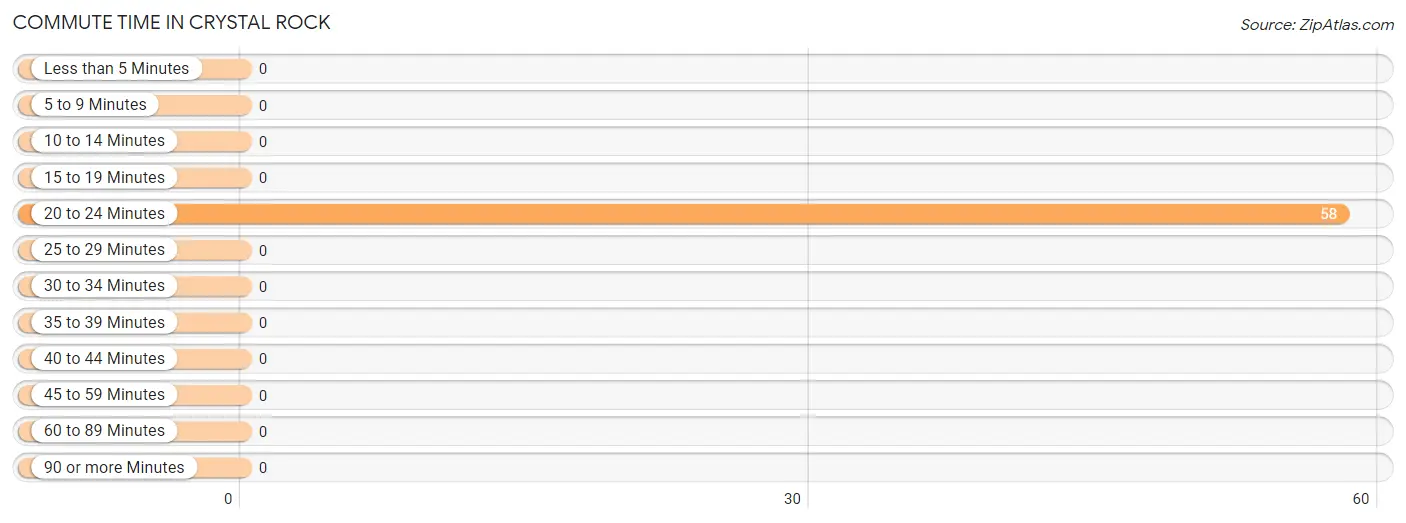
Commute Time in Crystal Rock
The most frequently occuring commute durations in Crystal Rock are 20 to 24 minutes (58 commuters, 100.0%), less than 5 minutes (0 commuters, 0.0%), and 5 to 9 minutes (0 commuters, 0.0%).
| Commute Time | # Commuters | % Commuters |
| Less than 5 Minutes | 0 | 0.0% |
| 5 to 9 Minutes | 0 | 0.0% |
| 10 to 14 Minutes | 0 | 0.0% |
| 15 to 19 Minutes | 0 | 0.0% |
| 20 to 24 Minutes | 58 | 100.0% |
| 25 to 29 Minutes | 0 | 0.0% |
| 30 to 34 Minutes | 0 | 0.0% |
| 35 to 39 Minutes | 0 | 0.0% |
| 40 to 44 Minutes | 0 | 0.0% |
| 45 to 59 Minutes | 0 | 0.0% |
| 60 to 89 Minutes | 0 | 0.0% |
| 90 or more Minutes | 0 | 0.0% |
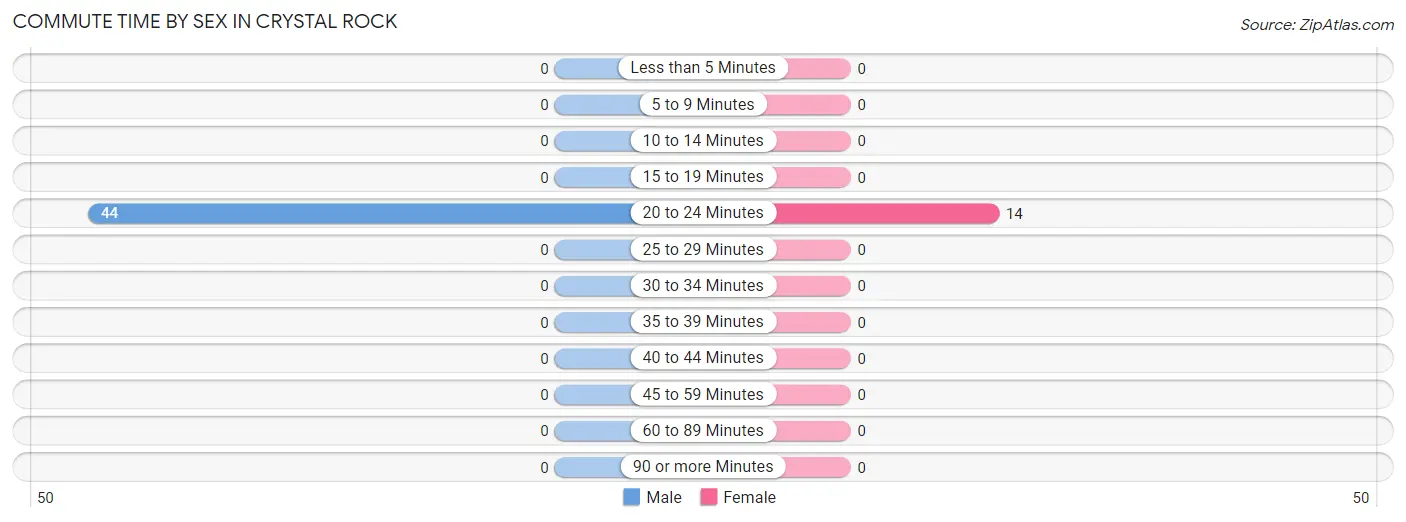
Commute Time by Sex in Crystal Rock
The most common commute times in Crystal Rock are 20 to 24 minutes (44 commuters, 100.0%) for males and 20 to 24 minutes (14 commuters, 100.0%) for females.
| Commute Time | Male | Female |
| Less than 5 Minutes | 0 (0.0%) | 0 (0.0%) |
| 5 to 9 Minutes | 0 (0.0%) | 0 (0.0%) |
| 10 to 14 Minutes | 0 (0.0%) | 0 (0.0%) |
| 15 to 19 Minutes | 0 (0.0%) | 0 (0.0%) |
| 20 to 24 Minutes | 44 (100.0%) | 14 (100.0%) |
| 25 to 29 Minutes | 0 (0.0%) | 0 (0.0%) |
| 30 to 34 Minutes | 0 (0.0%) | 0 (0.0%) |
| 35 to 39 Minutes | 0 (0.0%) | 0 (0.0%) |
| 40 to 44 Minutes | 0 (0.0%) | 0 (0.0%) |
| 45 to 59 Minutes | 0 (0.0%) | 0 (0.0%) |
| 60 to 89 Minutes | 0 (0.0%) | 0 (0.0%) |
| 90 or more Minutes | 0 (0.0%) | 0 (0.0%) |
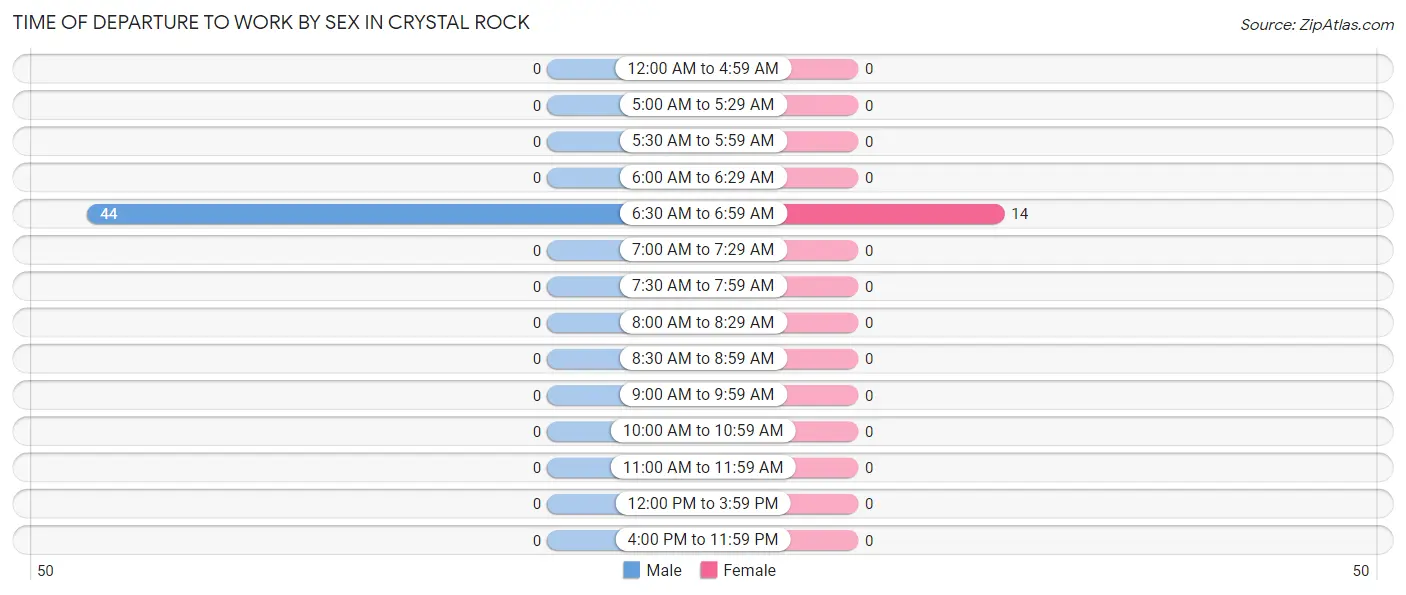
Time of Departure to Work by Sex in Crystal Rock
The most frequent times of departure to work in Crystal Rock are 6:30 AM to 6:59 AM (44, 100.0%) for males and 6:30 AM to 6:59 AM (14, 100.0%) for females.
| Time of Departure | Male | Female |
| 12:00 AM to 4:59 AM | 0 (0.0%) | 0 (0.0%) |
| 5:00 AM to 5:29 AM | 0 (0.0%) | 0 (0.0%) |
| 5:30 AM to 5:59 AM | 0 (0.0%) | 0 (0.0%) |
| 6:00 AM to 6:29 AM | 0 (0.0%) | 0 (0.0%) |
| 6:30 AM to 6:59 AM | 44 (100.0%) | 14 (100.0%) |
| 7:00 AM to 7:29 AM | 0 (0.0%) | 0 (0.0%) |
| 7:30 AM to 7:59 AM | 0 (0.0%) | 0 (0.0%) |
| 8:00 AM to 8:29 AM | 0 (0.0%) | 0 (0.0%) |
| 8:30 AM to 8:59 AM | 0 (0.0%) | 0 (0.0%) |
| 9:00 AM to 9:59 AM | 0 (0.0%) | 0 (0.0%) |
| 10:00 AM to 10:59 AM | 0 (0.0%) | 0 (0.0%) |
| 11:00 AM to 11:59 AM | 0 (0.0%) | 0 (0.0%) |
| 12:00 PM to 3:59 PM | 0 (0.0%) | 0 (0.0%) |
| 4:00 PM to 11:59 PM | 0 (0.0%) | 0 (0.0%) |
| Total | 44 (100.0%) | 14 (100.0%) |
Housing Occupancy in Crystal Rock
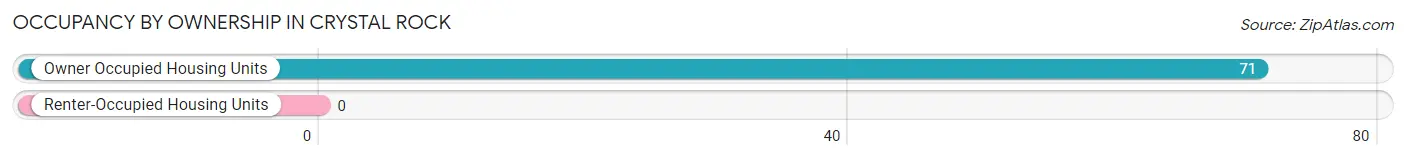
Occupancy by Ownership in Crystal Rock
Of the total 71 dwellings in Crystal Rock, owner-occupied units account for 71 (100.0%), while renter-occupied units make up 0 (0.0%).
| Occupancy | # Housing Units | % Housing Units |
| Owner Occupied Housing Units | 71 | 100.0% |
| Renter-Occupied Housing Units | 0 | 0.0% |
| Total Occupied Housing Units | 71 | 100.0% |
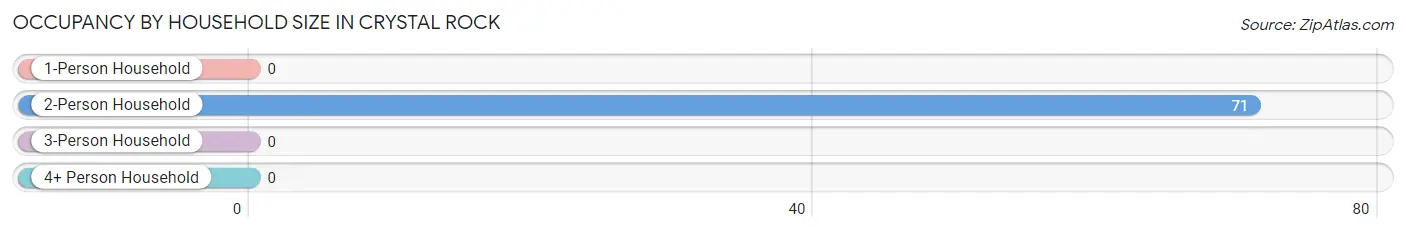
Occupancy by Household Size in Crystal Rock
| Household Size | # Housing Units | % Housing Units |
| 1-Person Household | 0 | 0.0% |
| 2-Person Household | 71 | 100.0% |
| 3-Person Household | 0 | 0.0% |
| 4+ Person Household | 0 | 0.0% |
| Total Housing Units | 71 | 100.0% |
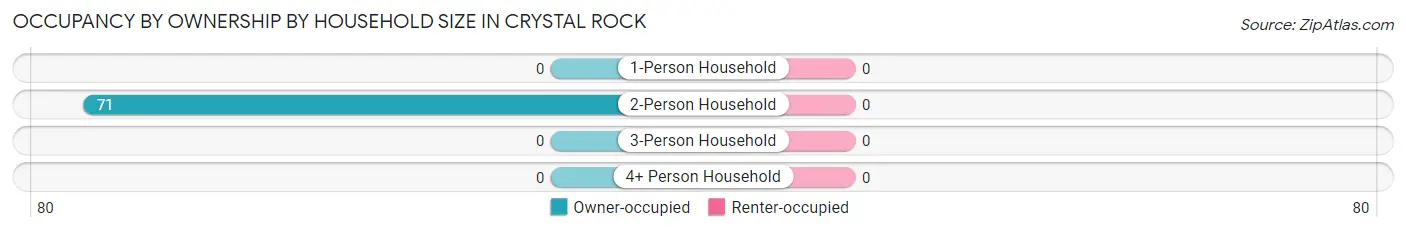
Occupancy by Ownership by Household Size in Crystal Rock
| Household Size | Owner-occupied | Renter-occupied |
| 1-Person Household | 0 (0.0%) | 0 (0.0%) |
| 2-Person Household | 71 (100.0%) | 0 (0.0%) |
| 3-Person Household | 0 (0.0%) | 0 (0.0%) |
| 4+ Person Household | 0 (0.0%) | 0 (0.0%) |
| Total Housing Units | 71 (100.0%) | 0 (0.0%) |
Occupancy by Educational Attainment in Crystal Rock
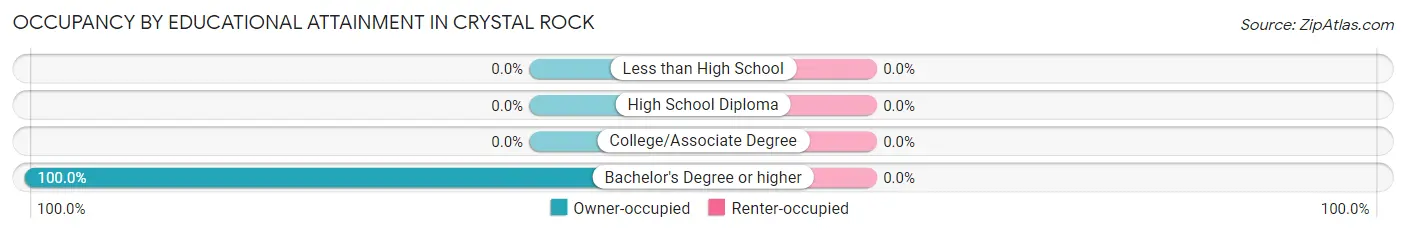
| Household Size | Owner-occupied | Renter-occupied |
| Less than High School | 0 (0.0%) | 0 (0.0%) |
| High School Diploma | 0 (0.0%) | 0 (0.0%) |
| College/Associate Degree | 0 (0.0%) | 0 (0.0%) |
| Bachelor's Degree or higher | 71 (100.0%) | 0 (0.0%) |
Occupancy by Age of Householder in Crystal Rock
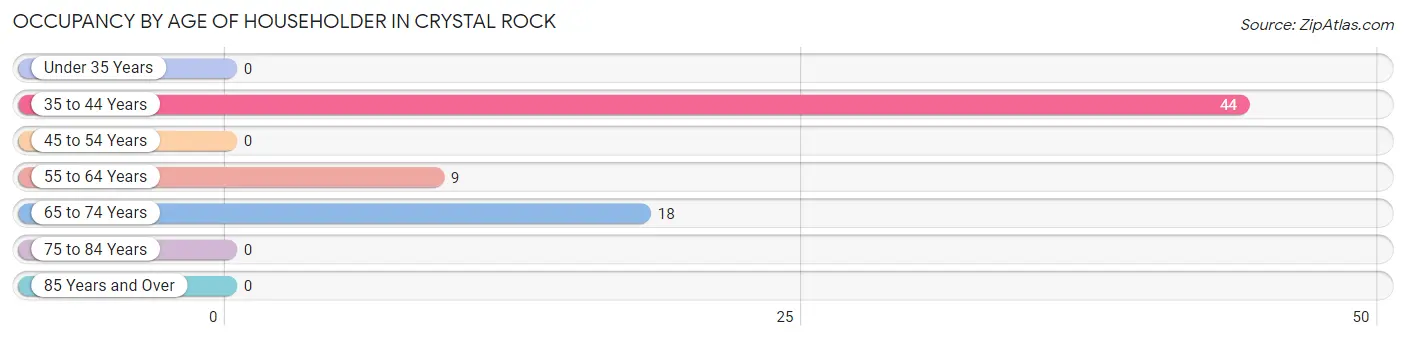
| Age Bracket | # Households | % Households |
| Under 35 Years | 0 | 0.0% |
| 35 to 44 Years | 44 | 62.0% |
| 45 to 54 Years | 0 | 0.0% |
| 55 to 64 Years | 9 | 12.7% |
| 65 to 74 Years | 18 | 25.4% |
| 75 to 84 Years | 0 | 0.0% |
| 85 Years and Over | 0 | 0.0% |
| Total | 71 | 100.0% |
Housing Finances in Crystal Rock
Median Income by Occupancy in Crystal Rock
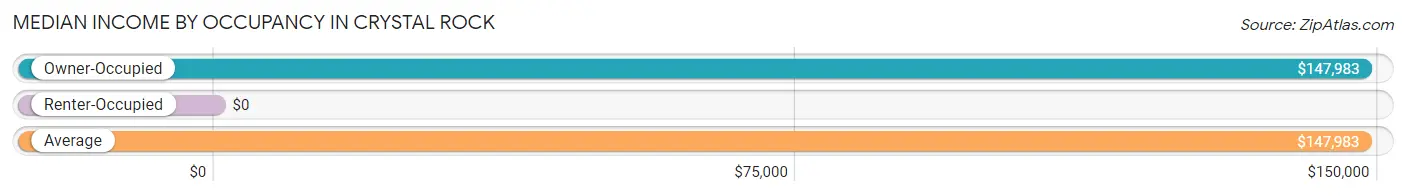
| Occupancy Type | # Households | Median Income |
| Owner-Occupied | 71 (100.0%) | $147,983 |
| Renter-Occupied | 0 (0.0%) | $0 |
| Average | 71 (100.0%) | $147,983 |
Occupancy by Householder Income Bracket in Crystal Rock
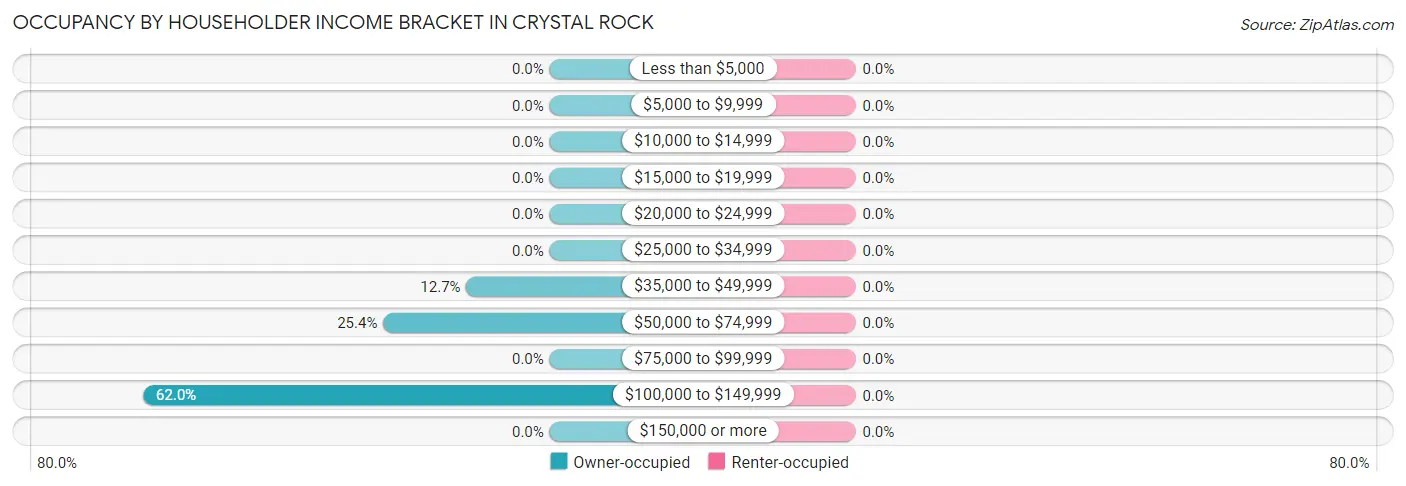
| Income Bracket | Owner-occupied | Renter-occupied |
| Less than $5,000 | 0 (0.0%) | 0 (0.0%) |
| $5,000 to $9,999 | 0 (0.0%) | 0 (0.0%) |
| $10,000 to $14,999 | 0 (0.0%) | 0 (0.0%) |
| $15,000 to $19,999 | 0 (0.0%) | 0 (0.0%) |
| $20,000 to $24,999 | 0 (0.0%) | 0 (0.0%) |
| $25,000 to $34,999 | 0 (0.0%) | 0 (0.0%) |
| $35,000 to $49,999 | 9 (12.7%) | 0 (0.0%) |
| $50,000 to $74,999 | 18 (25.4%) | 0 (0.0%) |
| $75,000 to $99,999 | 0 (0.0%) | 0 (0.0%) |
| $100,000 to $149,999 | 44 (62.0%) | 0 (0.0%) |
| $150,000 or more | 0 (0.0%) | 0 (0.0%) |
| Total | 71 (100.0%) | 0 (0.0%) |
Monthly Housing Cost Tiers in Crystal Rock
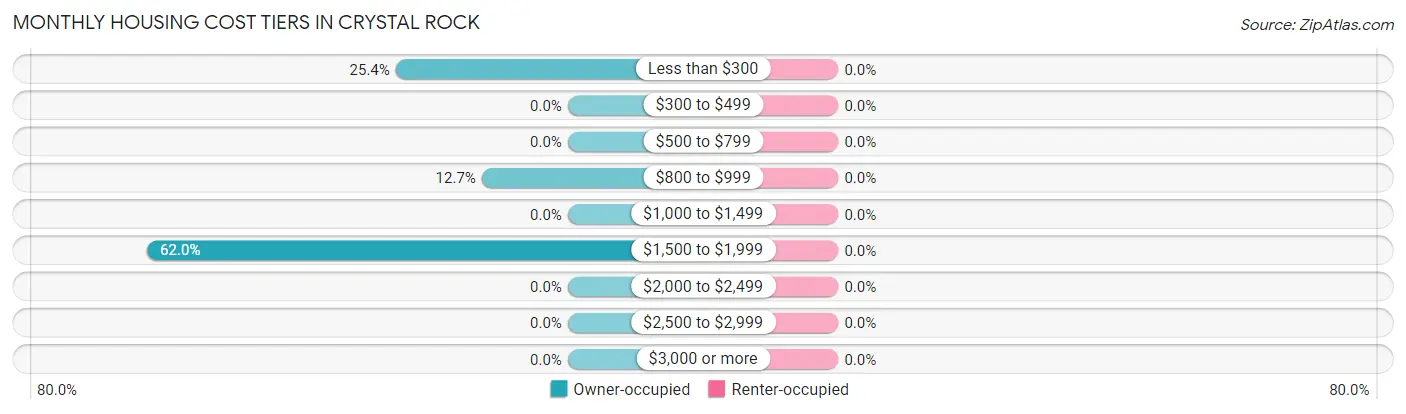
| Monthly Cost | Owner-occupied | Renter-occupied |
| Less than $300 | 18 (25.4%) | 0 (0.0%) |
| $300 to $499 | 0 (0.0%) | 0 (0.0%) |
| $500 to $799 | 0 (0.0%) | 0 (0.0%) |
| $800 to $999 | 9 (12.7%) | 0 (0.0%) |
| $1,000 to $1,499 | 0 (0.0%) | 0 (0.0%) |
| $1,500 to $1,999 | 44 (62.0%) | 0 (0.0%) |
| $2,000 to $2,499 | 0 (0.0%) | 0 (0.0%) |
| $2,500 to $2,999 | 0 (0.0%) | 0 (0.0%) |
| $3,000 or more | 0 (0.0%) | 0 (0.0%) |
| Total | 71 (100.0%) | 0 (0.0%) |
Physical Housing Characteristics in Crystal Rock
Housing Structures in Crystal Rock
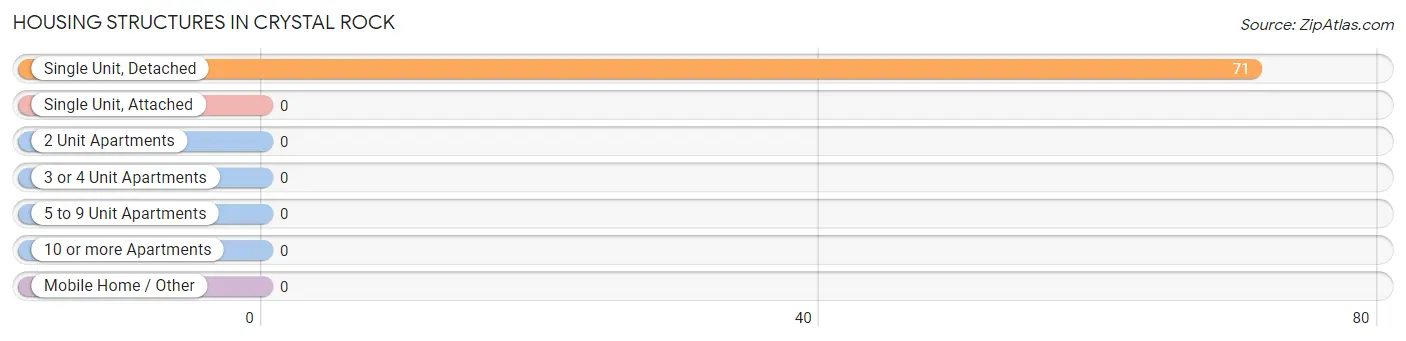
| Structure Type | # Housing Units | % Housing Units |
| Single Unit, Detached | 71 | 100.0% |
| Single Unit, Attached | 0 | 0.0% |
| 2 Unit Apartments | 0 | 0.0% |
| 3 or 4 Unit Apartments | 0 | 0.0% |
| 5 to 9 Unit Apartments | 0 | 0.0% |
| 10 or more Apartments | 0 | 0.0% |
| Mobile Home / Other | 0 | 0.0% |
| Total | 71 | 100.0% |
Housing Structures by Occupancy in Crystal Rock
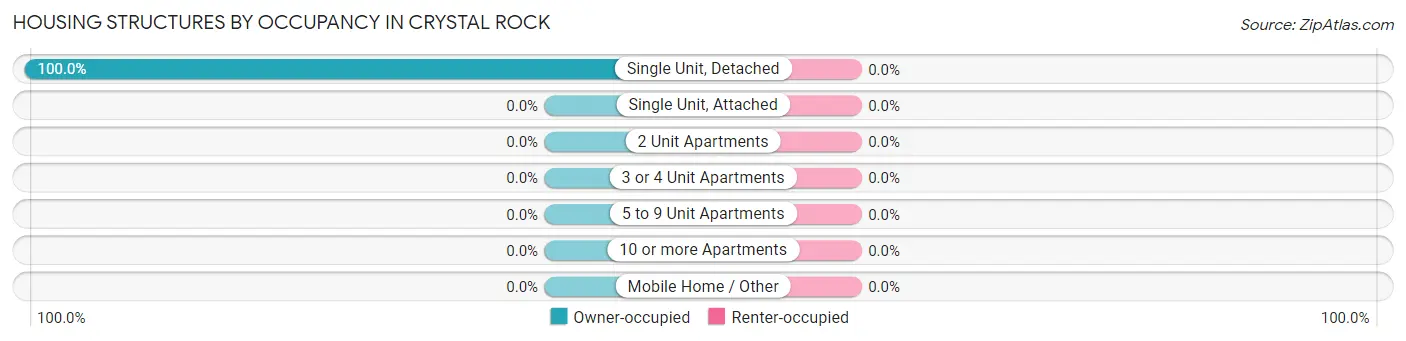
| Structure Type | Owner-occupied | Renter-occupied |
| Single Unit, Detached | 71 (100.0%) | 0 (0.0%) |
| Single Unit, Attached | 0 (0.0%) | 0 (0.0%) |
| 2 Unit Apartments | 0 (0.0%) | 0 (0.0%) |
| 3 or 4 Unit Apartments | 0 (0.0%) | 0 (0.0%) |
| 5 to 9 Unit Apartments | 0 (0.0%) | 0 (0.0%) |
| 10 or more Apartments | 0 (0.0%) | 0 (0.0%) |
| Mobile Home / Other | 0 (0.0%) | 0 (0.0%) |
| Total | 71 (100.0%) | 0 (0.0%) |
Housing Structures by Number of Rooms in Crystal Rock
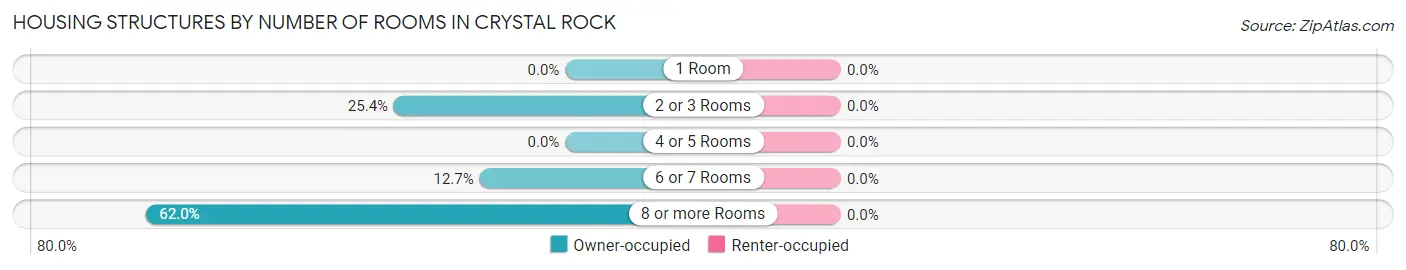
| Number of Rooms | Owner-occupied | Renter-occupied |
| 1 Room | 0 (0.0%) | 0 (0.0%) |
| 2 or 3 Rooms | 18 (25.4%) | 0 (0.0%) |
| 4 or 5 Rooms | 0 (0.0%) | 0 (0.0%) |
| 6 or 7 Rooms | 9 (12.7%) | 0 (0.0%) |
| 8 or more Rooms | 44 (62.0%) | 0 (0.0%) |
| Total | 71 (100.0%) | 0 (0.0%) |
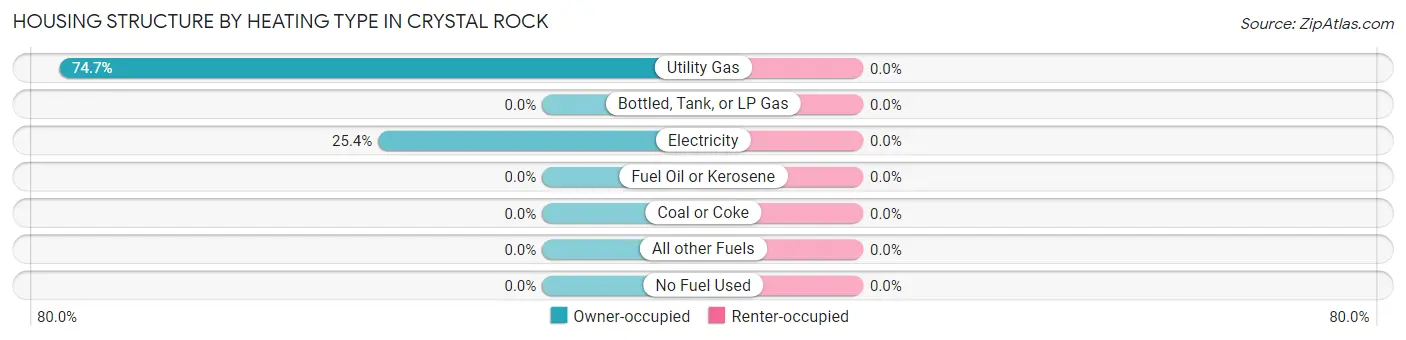
Housing Structure by Heating Type in Crystal Rock
| Heating Type | Owner-occupied | Renter-occupied |
| Utility Gas | 53 (74.7%) | 0 (0.0%) |
| Bottled, Tank, or LP Gas | 0 (0.0%) | 0 (0.0%) |
| Electricity | 18 (25.4%) | 0 (0.0%) |
| Fuel Oil or Kerosene | 0 (0.0%) | 0 (0.0%) |
| Coal or Coke | 0 (0.0%) | 0 (0.0%) |
| All other Fuels | 0 (0.0%) | 0 (0.0%) |
| No Fuel Used | 0 (0.0%) | 0 (0.0%) |
| Total | 71 (100.0%) | 0 (0.0%) |
Household Vehicle Usage in Crystal Rock
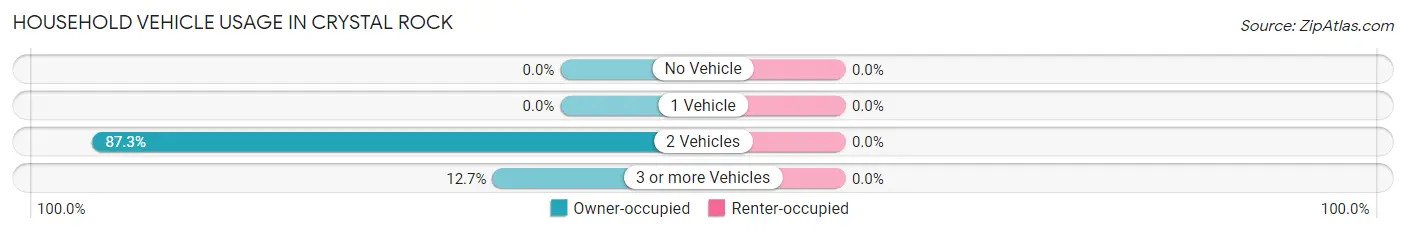
| Vehicles per Household | Owner-occupied | Renter-occupied |
| No Vehicle | 0 (0.0%) | 0 (0.0%) |
| 1 Vehicle | 0 (0.0%) | 0 (0.0%) |
| 2 Vehicles | 62 (87.3%) | 0 (0.0%) |
| 3 or more Vehicles | 9 (12.7%) | 0 (0.0%) |
| Total | 71 (100.0%) | 0 (0.0%) |
Real Estate & Mortgages in Crystal Rock
Real Estate and Mortgage Overview in Crystal Rock
| Characteristic | Without Mortgage | With Mortgage |
| Housing Units | 18 | 53 |
| Median Property Value | - | - |
| Median Household Income | - | - |
| Monthly Housing Costs | - | - |
| Real Estate Taxes | - | - |
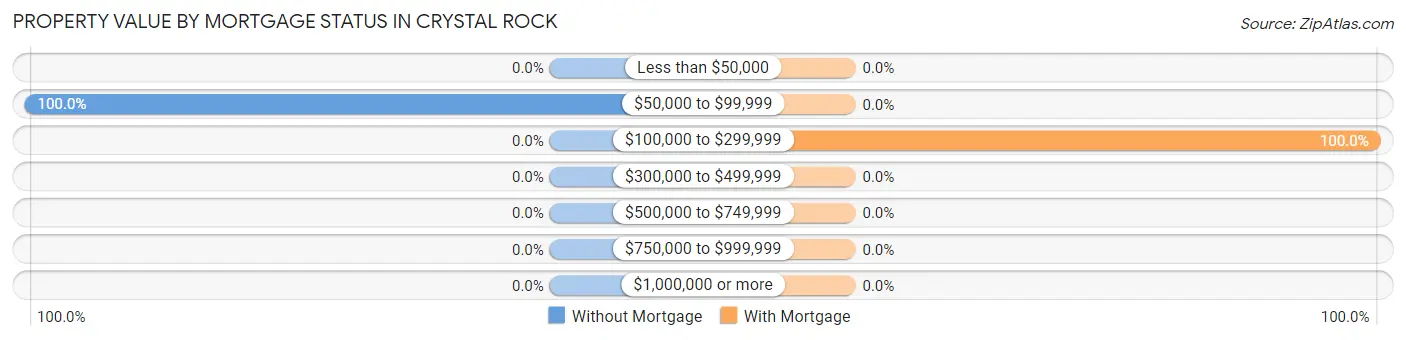
Property Value by Mortgage Status in Crystal Rock
| Property Value | Without Mortgage | With Mortgage |
| Less than $50,000 | 0 (0.0%) | 0 (0.0%) |
| $50,000 to $99,999 | 18 (100.0%) | 0 (0.0%) |
| $100,000 to $299,999 | 0 (0.0%) | 53 (100.0%) |
| $300,000 to $499,999 | 0 (0.0%) | 0 (0.0%) |
| $500,000 to $749,999 | 0 (0.0%) | 0 (0.0%) |
| $750,000 to $999,999 | 0 (0.0%) | 0 (0.0%) |
| $1,000,000 or more | 0 (0.0%) | 0 (0.0%) |
| Total | 18 (100.0%) | 53 (100.0%) |
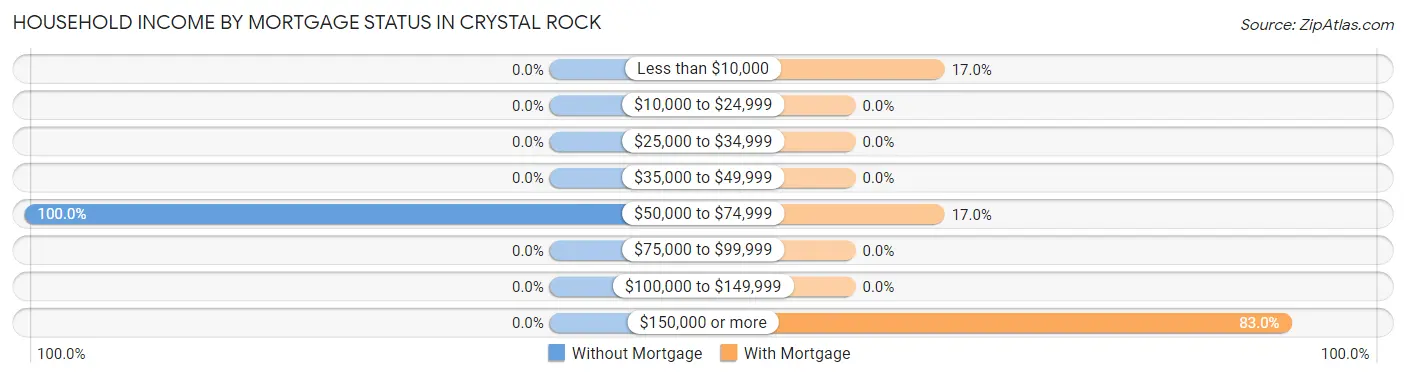
Household Income by Mortgage Status in Crystal Rock
| Household Income | Without Mortgage | With Mortgage |
| Less than $10,000 | 0 (0.0%) | 9 (17.0%) |
| $10,000 to $24,999 | 0 (0.0%) | 0 (0.0%) |
| $25,000 to $34,999 | 0 (0.0%) | 0 (0.0%) |
| $35,000 to $49,999 | 0 (0.0%) | 0 (0.0%) |
| $50,000 to $74,999 | 18 (100.0%) | 9 (17.0%) |
| $75,000 to $99,999 | 0 (0.0%) | 0 (0.0%) |
| $100,000 to $149,999 | 0 (0.0%) | 0 (0.0%) |
| $150,000 or more | 0 (0.0%) | 44 (83.0%) |
| Total | 18 (100.0%) | 53 (100.0%) |
Property Value to Household Income Ratio in Crystal Rock
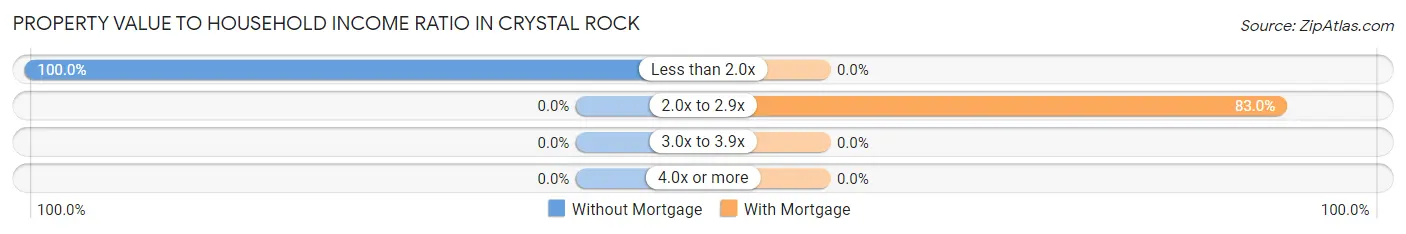
| Value-to-Income Ratio | Without Mortgage | With Mortgage |
| Less than 2.0x | 18 (100.0%) | 0 (0.0%) |
| 2.0x to 2.9x | 0 (0.0%) | 44 (83.0%) |
| 3.0x to 3.9x | 0 (0.0%) | 0 (0.0%) |
| 4.0x or more | 0 (0.0%) | 0 (0.0%) |
| Total | 18 (100.0%) | 53 (100.0%) |
Real Estate Taxes by Mortgage Status in Crystal Rock
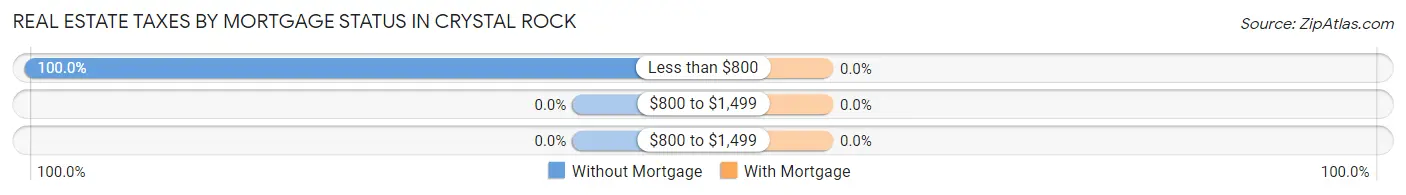
| Property Taxes | Without Mortgage | With Mortgage |
| Less than $800 | 18 (100.0%) | 0 (0.0%) |
| $800 to $1,499 | 0 (0.0%) | 0 (0.0%) |
| $800 to $1,499 | 0 (0.0%) | 0 (0.0%) |
| Total | 18 (100.0%) | 53 (100.0%) |
Health & Disability in Crystal Rock
Health Insurance Coverage by Age in Crystal Rock
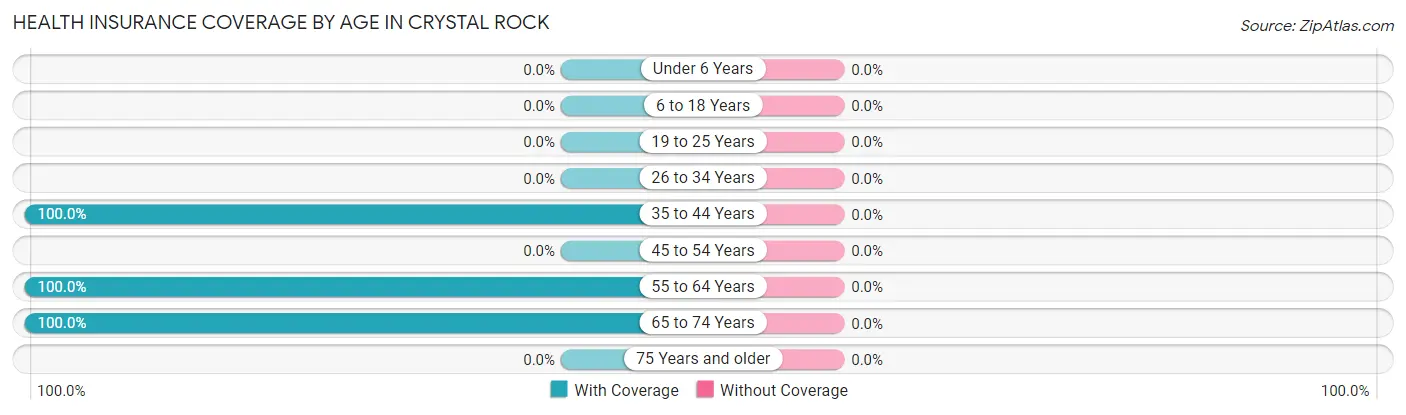
| Age Bracket | With Coverage | Without Coverage |
| Under 6 Years | 0 (0.0%) | 0 (0.0%) |
| 6 to 18 Years | 0 (0.0%) | 0 (0.0%) |
| 19 to 25 Years | 0 (0.0%) | 0 (0.0%) |
| 26 to 34 Years | 0 (0.0%) | 0 (0.0%) |
| 35 to 44 Years | 58 (100.0%) | 0 (0.0%) |
| 45 to 54 Years | 0 (0.0%) | 0 (0.0%) |
| 55 to 64 Years | 9 (100.0%) | 0 (0.0%) |
| 65 to 74 Years | 41 (100.0%) | 0 (0.0%) |
| 75 Years and older | 0 (0.0%) | 0 (0.0%) |
| Total | 108 (100.0%) | 0 (0.0%) |
Health Insurance Coverage by Citizenship Status in Crystal Rock
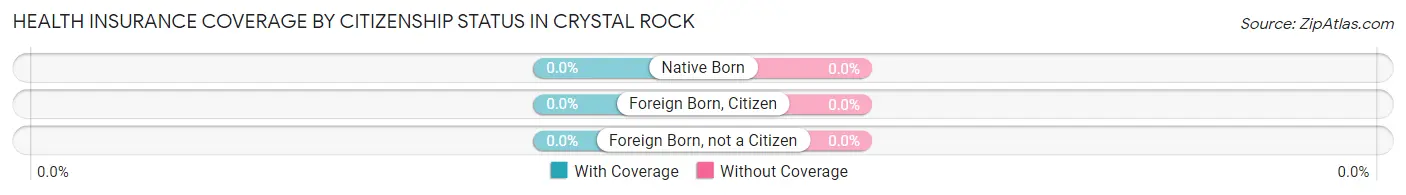
| Citizenship Status | With Coverage | Without Coverage |
| Native Born | 0 (0.0%) | 0 (0.0%) |
| Foreign Born, Citizen | 0 (0.0%) | 0 (0.0%) |
| Foreign Born, not a Citizen | 0 (0.0%) | 0 (0.0%) |
Health Insurance Coverage by Household Income in Crystal Rock
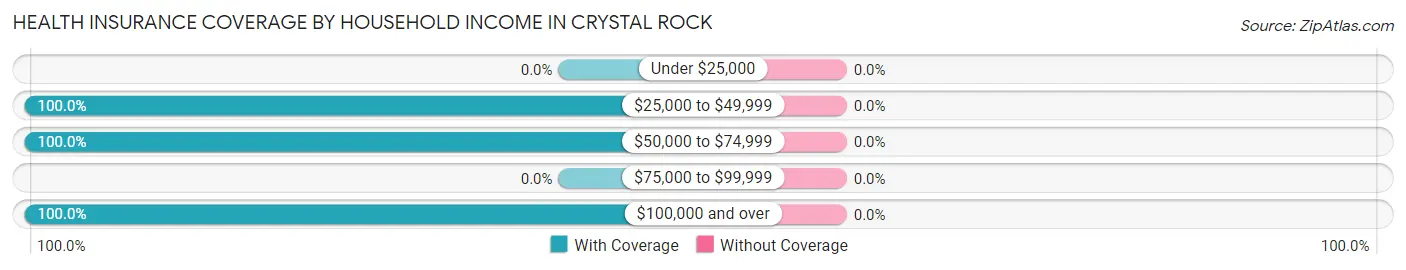
| Household Income | With Coverage | Without Coverage |
| Under $25,000 | 0 (0.0%) | 0 (0.0%) |
| $25,000 to $49,999 | 16 (100.0%) | 0 (0.0%) |
| $50,000 to $74,999 | 34 (100.0%) | 0 (0.0%) |
| $75,000 to $99,999 | 0 (0.0%) | 0 (0.0%) |
| $100,000 and over | 58 (100.0%) | 0 (0.0%) |
Public vs Private Health Insurance Coverage by Age in Crystal Rock
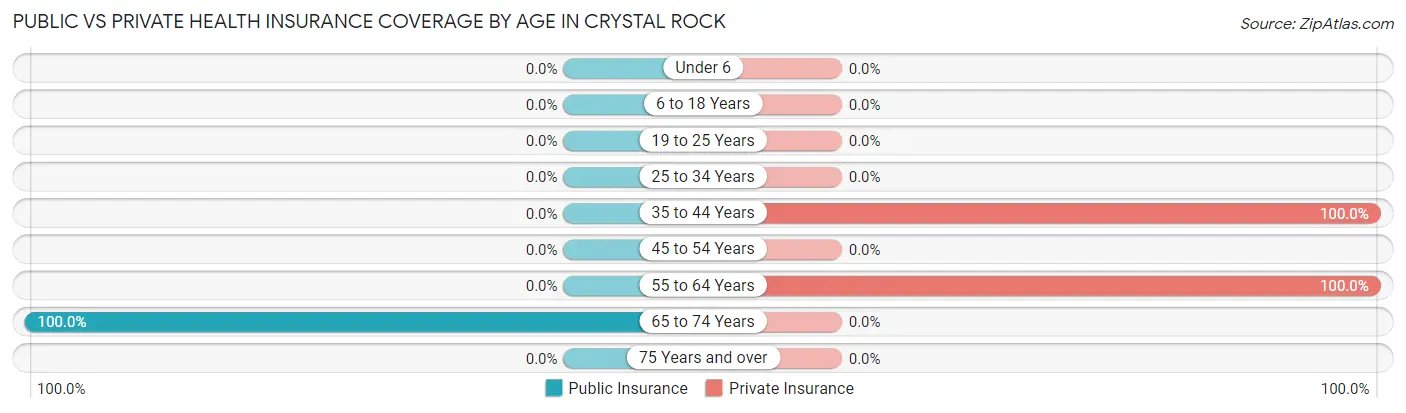
| Age Bracket | Public Insurance | Private Insurance |
| Under 6 | 0 (0.0%) | 0 (0.0%) |
| 6 to 18 Years | 0 (0.0%) | 0 (0.0%) |
| 19 to 25 Years | 0 (0.0%) | 0 (0.0%) |
| 25 to 34 Years | 0 (0.0%) | 0 (0.0%) |
| 35 to 44 Years | 0 (0.0%) | 58 (100.0%) |
| 45 to 54 Years | 0 (0.0%) | 0 (0.0%) |
| 55 to 64 Years | 0 (0.0%) | 9 (100.0%) |
| 65 to 74 Years | 41 (100.0%) | 0 (0.0%) |
| 75 Years and over | 0 (0.0%) | 0 (0.0%) |
| Total | 41 (38.0%) | 67 (62.0%) |
Disability Status by Sex by Age in Crystal Rock
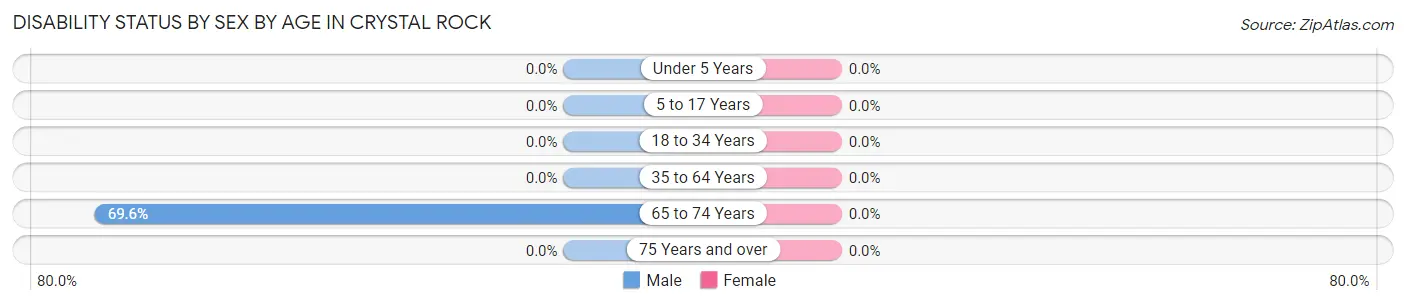
| Age Bracket | Male | Female |
| Under 5 Years | 0 (0.0%) | 0 (0.0%) |
| 5 to 17 Years | 0 (0.0%) | 0 (0.0%) |
| 18 to 34 Years | 0 (0.0%) | 0 (0.0%) |
| 35 to 64 Years | 0 (0.0%) | 0 (0.0%) |
| 65 to 74 Years | 16 (69.6%) | 0 (0.0%) |
| 75 Years and over | 0 (0.0%) | 0 (0.0%) |
Disability Class by Sex by Age in Crystal Rock
Disability Class: Hearing Difficulty
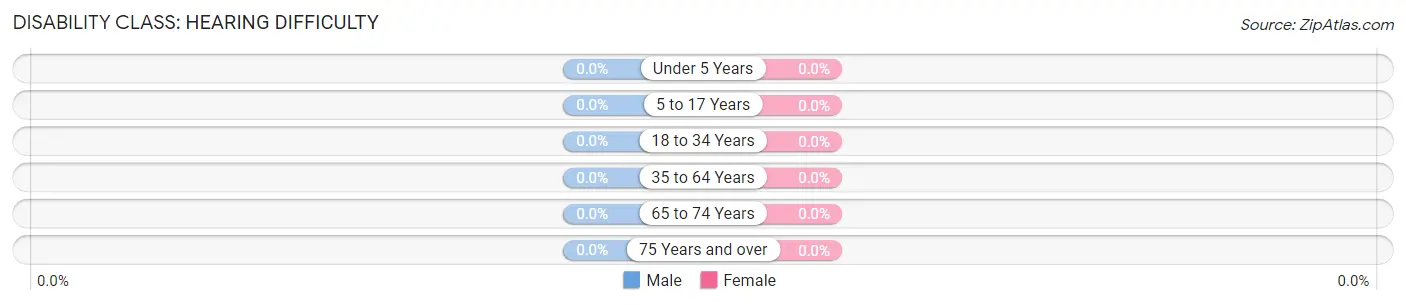
| Age Bracket | Male | Female |
| Under 5 Years | 0 (0.0%) | 0 (0.0%) |
| 5 to 17 Years | 0 (0.0%) | 0 (0.0%) |
| 18 to 34 Years | 0 (0.0%) | 0 (0.0%) |
| 35 to 64 Years | 0 (0.0%) | 0 (0.0%) |
| 65 to 74 Years | 0 (0.0%) | 0 (0.0%) |
| 75 Years and over | 0 (0.0%) | 0 (0.0%) |
Disability Class: Vision Difficulty
| Age Bracket | Male | Female |
| Under 5 Years | 0 (0.0%) | 0 (0.0%) |
| 5 to 17 Years | 0 (0.0%) | 0 (0.0%) |
| 18 to 34 Years | 0 (0.0%) | 0 (0.0%) |
| 35 to 64 Years | 0 (0.0%) | 0 (0.0%) |
| 65 to 74 Years | 0 (0.0%) | 0 (0.0%) |
| 75 Years and over | 0 (0.0%) | 0 (0.0%) |
Disability Class: Cognitive Difficulty
| Age Bracket | Male | Female |
| 5 to 17 Years | 0 (0.0%) | 0 (0.0%) |
| 18 to 34 Years | 0 (0.0%) | 0 (0.0%) |
| 35 to 64 Years | 0 (0.0%) | 0 (0.0%) |
| 65 to 74 Years | 0 (0.0%) | 0 (0.0%) |
| 75 Years and over | 0 (0.0%) | 0 (0.0%) |
Disability Class: Ambulatory Difficulty
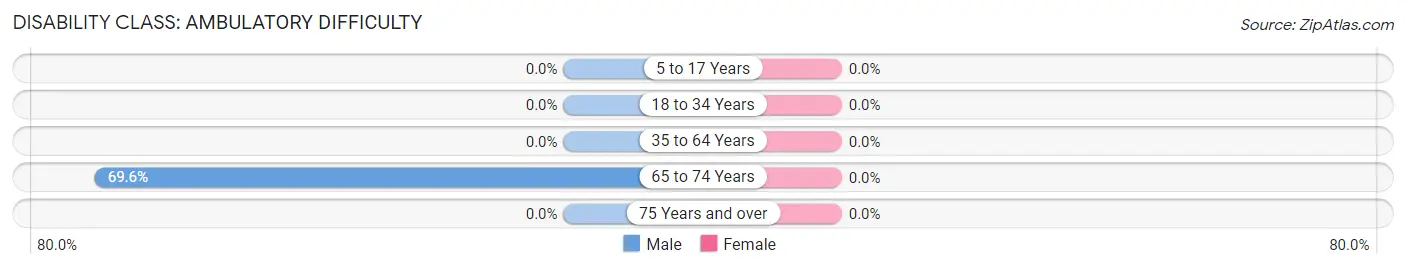
| Age Bracket | Male | Female |
| 5 to 17 Years | 0 (0.0%) | 0 (0.0%) |
| 18 to 34 Years | 0 (0.0%) | 0 (0.0%) |
| 35 to 64 Years | 0 (0.0%) | 0 (0.0%) |
| 65 to 74 Years | 16 (69.6%) | 0 (0.0%) |
| 75 Years and over | 0 (0.0%) | 0 (0.0%) |
Disability Class: Self-Care Difficulty
| Age Bracket | Male | Female |
| 5 to 17 Years | 0 (0.0%) | 0 (0.0%) |
| 18 to 34 Years | 0 (0.0%) | 0 (0.0%) |
| 35 to 64 Years | 0 (0.0%) | 0 (0.0%) |
| 65 to 74 Years | 0 (0.0%) | 0 (0.0%) |
| 75 Years and over | 0 (0.0%) | 0 (0.0%) |
Technology Access in Crystal Rock
Computing Device Access in Crystal Rock
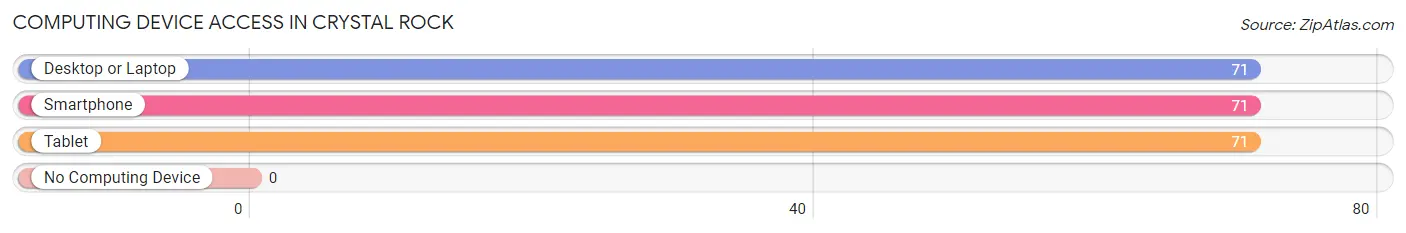
| Device Type | # Households | % Households |
| Desktop or Laptop | 71 | 100.0% |
| Smartphone | 71 | 100.0% |
| Tablet | 71 | 100.0% |
| No Computing Device | 0 | 0.0% |
| Total | 71 | 100.0% |
Internet Access in Crystal Rock
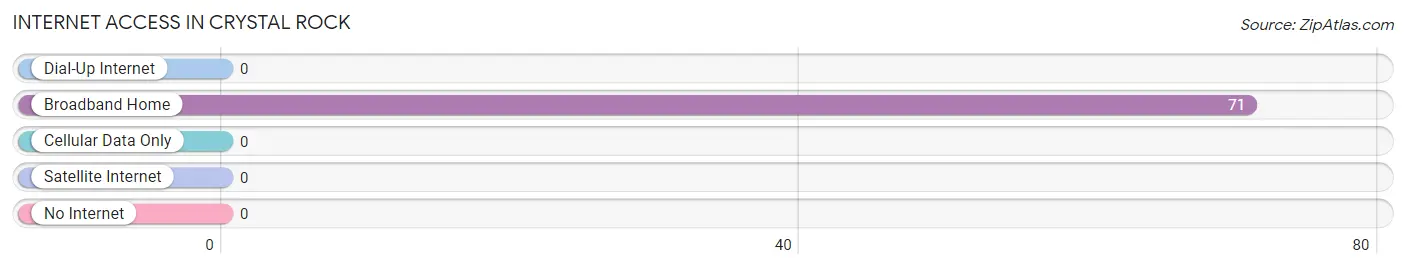
| Internet Type | # Households | % Households |
| Dial-Up Internet | 0 | 0.0% |
| Broadband Home | 71 | 100.0% |
| Cellular Data Only | 0 | 0.0% |
| Satellite Internet | 0 | 0.0% |
| No Internet | 0 | 0.0% |
| Total | 71 | 100.0% |
Crystal Rock Summary
Rock Crystal, Ohio is a small village located in the southeastern corner of the state, in the Appalachian foothills. It is situated in the county of Hocking, and is part of the Nelsonville-York City School District. The village is home to a population of just over 500 people, and is known for its rural charm and small-town atmosphere.
History
Rock Crystal was founded in 1820 by a group of settlers from Pennsylvania. The village was originally known as “Rocky Creek”, and was named after the nearby creek of the same name. The settlers were attracted to the area due to its abundance of natural resources, including timber, coal, and limestone. The village was officially incorporated in 1837, and the name was changed to Rock Crystal.
The village was a major center of coal mining in the late 19th and early 20th centuries. The coal industry provided jobs and economic stability to the area, and the village grew rapidly. By the 1920s, the population had grown to over 1,000 people.
Geography
Rock Crystal is located in the Appalachian foothills, in the southeastern corner of Ohio. The village is situated in the county of Hocking, and is part of the Nelsonville-York City School District. The village is located at an elevation of 890 feet above sea level.
The village is surrounded by rolling hills and lush forests. The nearby Rocky Creek provides a scenic backdrop to the village. The village is located near the Hocking River, which is a popular destination for fishing and canoeing.
Economy
The economy of Rock Crystal is largely based on agriculture and tourism. The village is home to several small farms, which produce a variety of crops, including corn, soybeans, and hay. The village is also home to several small businesses, including a general store, a hardware store, and a restaurant.
Tourism is an important part of the local economy. The village is home to several attractions, including the Rock Crystal Caverns, a natural limestone cave system. The village is also home to several historic sites, including the Rock Crystal Church, which was built in 1837.
Demographics
As of the 2010 census, the population of Rock Crystal was 514 people. The racial makeup of the village was 97.3% White, 0.6% African American, 0.2% Native American, 0.4% Asian, and 1.5% from other races. The median household income was $37,500, and the median family income was $45,000.
The village is home to a variety of religious denominations, including Baptist, Methodist, and Catholic. The village is also home to a variety of cultural and recreational activities, including festivals, concerts, and sporting events.
Rock Crystal is a small village with a rich history and a unique culture. The village is home to a diverse population, and offers a variety of attractions and activities. The village is a great place to live, work, and play.
Common Questions
What is Per Capita Income in Crystal Rock?
Per Capita income in Crystal Rock is $57,440.
What is the Median Household income in Crystal Rock?
Median Household Income in Crystal Rock is $147,983.
What is Inequality or Gini Index in Crystal Rock?
Inequality or Gini Index in Crystal Rock is 0.18.
What is the Total Population of Crystal Rock?
Total Population of Crystal Rock is 108.
What is the Total Male Population of Crystal Rock?
Total Male Population of Crystal Rock is 67.
What is the Total Female Population of Crystal Rock?
Total Female Population of Crystal Rock is 41.
What is the Ratio of Males per 100 Females in Crystal Rock?
There are 163.41 Males per 100 Females in Crystal Rock.
What is the Ratio of Females per 100 Males in Crystal Rock?
There are 61.19 Females per 100 Males in Crystal Rock.
What is the Median Population Age in Crystal Rock?
Median Population Age in Crystal Rock is 38.9 Years.
What is the Average Family Size in Crystal Rock
Average Family Size in Crystal Rock is 1.8 People.
What is the Average Household Size in Crystal Rock
Average Household Size in Crystal Rock is 1.5 People.
How Large is the Labor Force in Crystal Rock?
There are 58 People in the Labor Forcein in Crystal Rock.
What is the Percentage of People in the Labor Force in Crystal Rock?
53.7% of People are in the Labor Force in Crystal Rock.