Monfort Heights, OH Map & Demographics
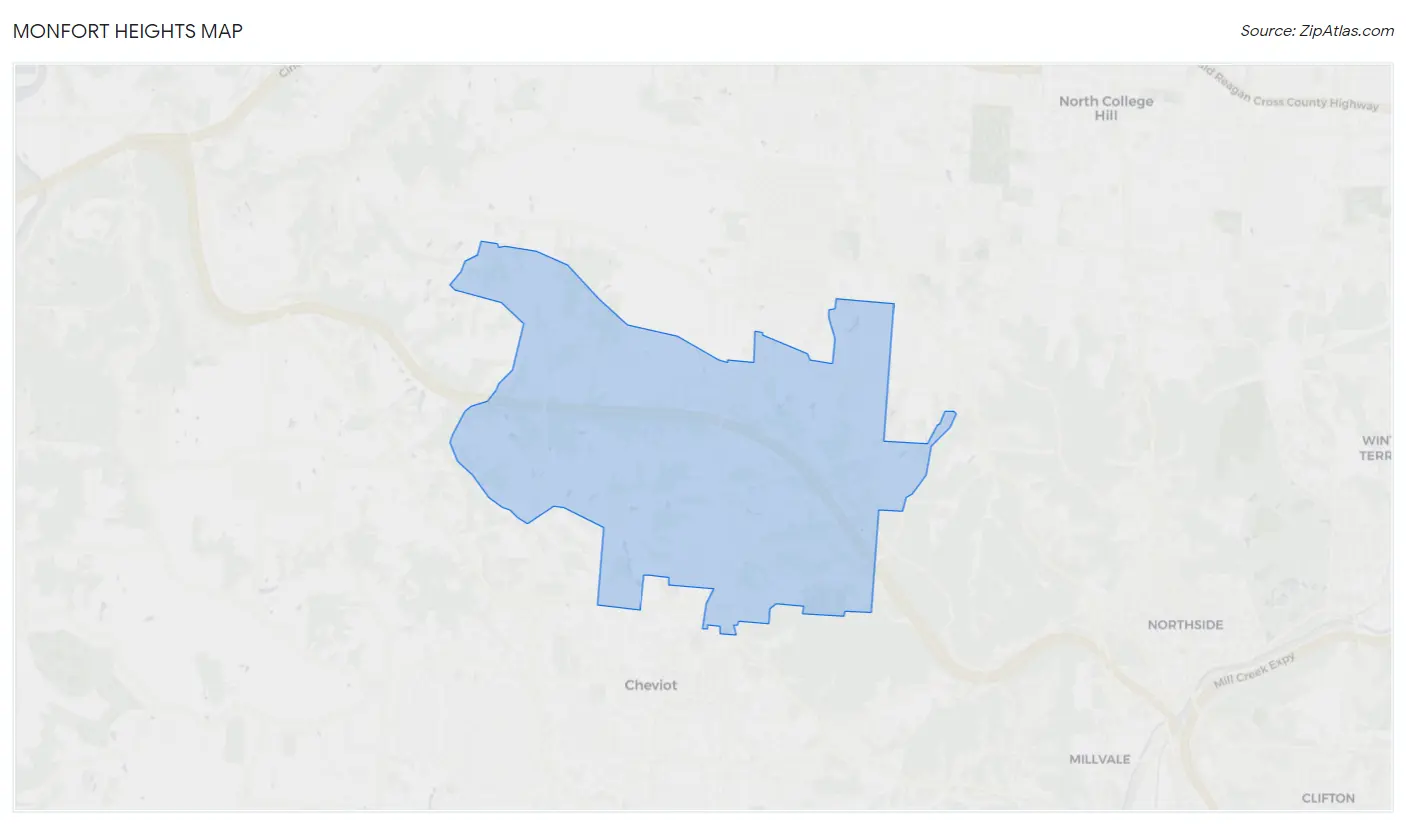
Monfort Heights Map
Monfort Heights Overview
$43,336
PER CAPITA INCOME
$100,923
AVG FAMILY INCOME
$80,625
AVG HOUSEHOLD INCOME
24.0%
WAGE / INCOME GAP [ % ]
76.0¢/ $1
WAGE / INCOME GAP [ $ ]
0.40
INEQUALITY / GINI INDEX
12,012
TOTAL POPULATION
5,165
MALE POPULATION
6,847
FEMALE POPULATION
75.43
MALES / 100 FEMALES
132.57
FEMALES / 100 MALES
35.8
MEDIAN AGE
3.1
AVG FAMILY SIZE
2.4
AVG HOUSEHOLD SIZE
6,525
LABOR FORCE [ PEOPLE ]
70.4%
PERCENT IN LABOR FORCE
3.2%
UNEMPLOYMENT RATE
Income in Monfort Heights
Income Overview in Monfort Heights
Per Capita Income in Monfort Heights is $43,336, while median incomes of families and households are $100,923 and $80,625 respectively.
| Characteristic | Number | Measure |
| Per Capita Income | 12,012 | $43,336 |
| Median Family Income | 3,136 | $100,923 |
| Mean Family Income | 3,136 | $126,350 |
| Median Household Income | 4,902 | $80,625 |
| Mean Household Income | 4,902 | $104,271 |
| Income Deficit | 3,136 | $0 |
| Wage / Income Gap (%) | 12,012 | 23.99% |
| Wage / Income Gap ($) | 12,012 | 76.01¢ per $1 |
| Gini / Inequality Index | 12,012 | 0.40 |
Earnings by Sex in Monfort Heights
Average Earnings in Monfort Heights are $49,171, $57,622 for men and $43,798 for women, a difference of 24.0%.
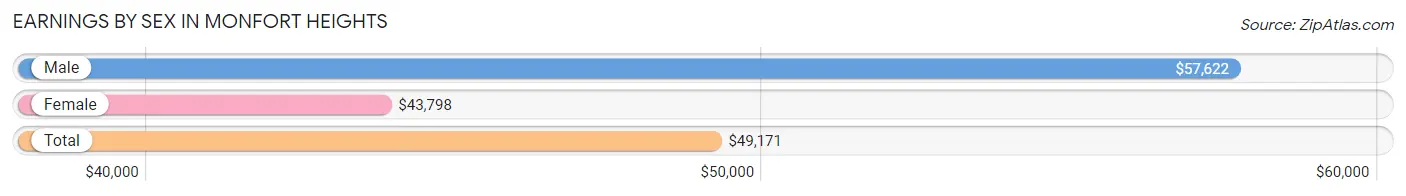
| Sex | Number | Average Earnings |
| Male | 3,120 (46.3%) | $57,622 |
| Female | 3,613 (53.7%) | $43,798 |
| Total | 6,733 (100.0%) | $49,171 |
Earnings by Sex by Income Bracket in Monfort Heights
The most common earnings brackets in Monfort Heights are $100,000+ for men (686 | 22.0%) and $65,000 to $74,999 for women (431 | 11.9%).
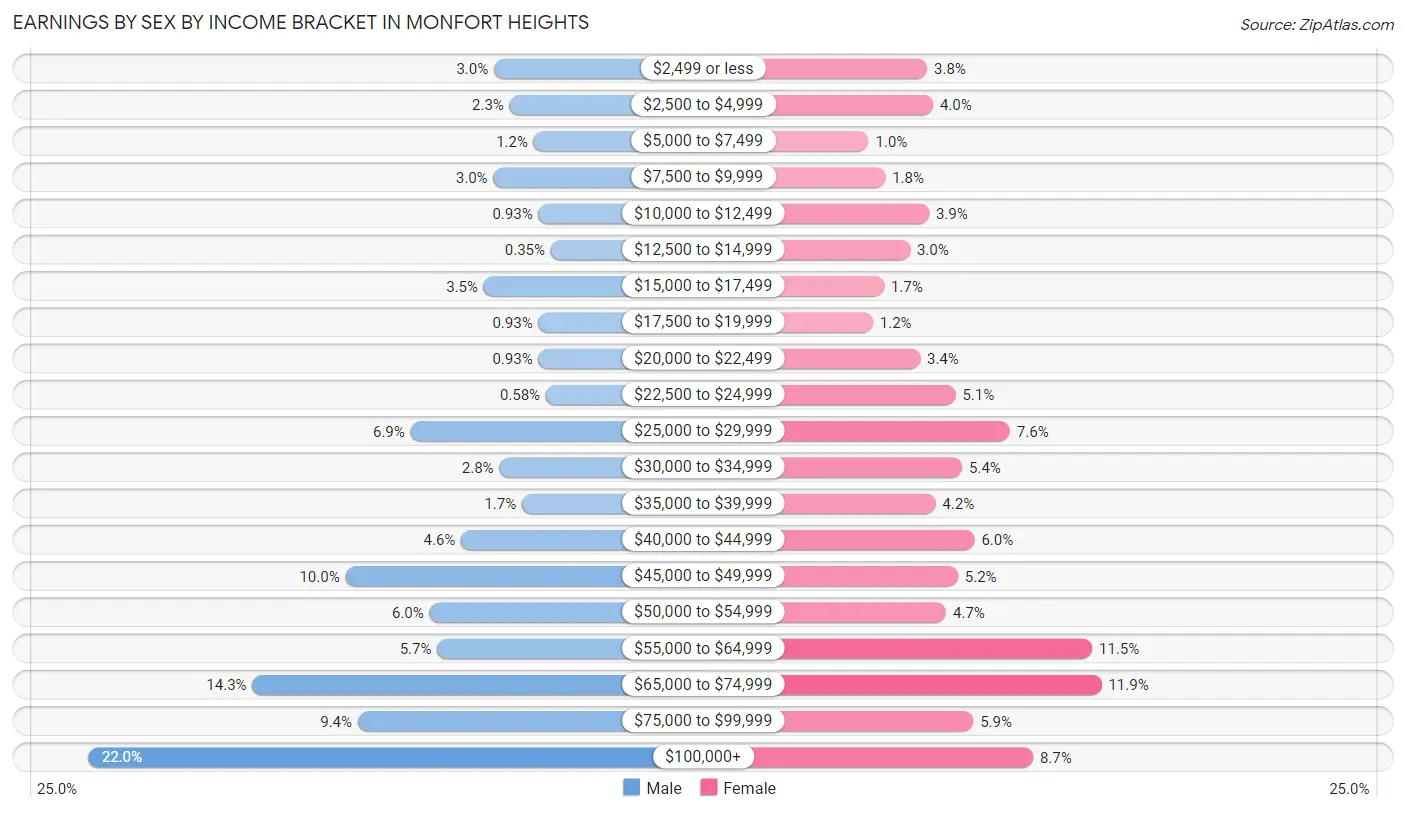
| Income | Male | Female |
| $2,499 or less | 94 (3.0%) | 136 (3.8%) |
| $2,500 to $4,999 | 71 (2.3%) | 146 (4.0%) |
| $5,000 to $7,499 | 36 (1.1%) | 37 (1.0%) |
| $7,500 to $9,999 | 95 (3.0%) | 65 (1.8%) |
| $10,000 to $12,499 | 29 (0.9%) | 139 (3.8%) |
| $12,500 to $14,999 | 11 (0.4%) | 107 (3.0%) |
| $15,000 to $17,499 | 109 (3.5%) | 63 (1.7%) |
| $17,500 to $19,999 | 29 (0.9%) | 44 (1.2%) |
| $20,000 to $22,499 | 29 (0.9%) | 124 (3.4%) |
| $22,500 to $24,999 | 18 (0.6%) | 184 (5.1%) |
| $25,000 to $29,999 | 216 (6.9%) | 276 (7.6%) |
| $30,000 to $34,999 | 86 (2.8%) | 195 (5.4%) |
| $35,000 to $39,999 | 53 (1.7%) | 150 (4.2%) |
| $40,000 to $44,999 | 142 (4.5%) | 216 (6.0%) |
| $45,000 to $49,999 | 311 (10.0%) | 188 (5.2%) |
| $50,000 to $54,999 | 188 (6.0%) | 168 (4.6%) |
| $55,000 to $64,999 | 177 (5.7%) | 415 (11.5%) |
| $65,000 to $74,999 | 447 (14.3%) | 431 (11.9%) |
| $75,000 to $99,999 | 293 (9.4%) | 214 (5.9%) |
| $100,000+ | 686 (22.0%) | 315 (8.7%) |
| Total | 3,120 (100.0%) | 3,613 (100.0%) |
Earnings by Sex by Educational Attainment in Monfort Heights
Average earnings in Monfort Heights are $65,537 for men and $50,341 for women, a difference of 23.2%. Men with an educational attainment of graduate degree enjoy the highest average annual earnings of $135,625, while those with high school diploma education earn the least with $41,563. Women with an educational attainment of bachelor's degree earn the most with the average annual earnings of $63,862, while those with less than high school education have the smallest earnings of $21,141.
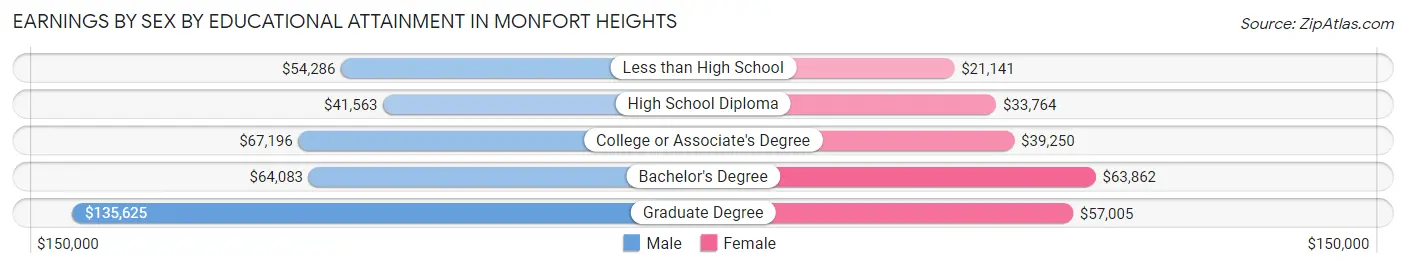
| Educational Attainment | Male Income | Female Income |
| Less than High School | $54,286 | $21,141 |
| High School Diploma | $41,563 | $33,764 |
| College or Associate's Degree | $67,196 | $39,250 |
| Bachelor's Degree | $64,083 | $63,862 |
| Graduate Degree | $135,625 | $57,005 |
| Total | $65,537 | $50,341 |
Family Income in Monfort Heights
Family Income Brackets in Monfort Heights
According to the Monfort Heights family income data, there are 693 families falling into the $100,000 to $149,999 income range, which is the most common income bracket and makes up 22.1% of all families.
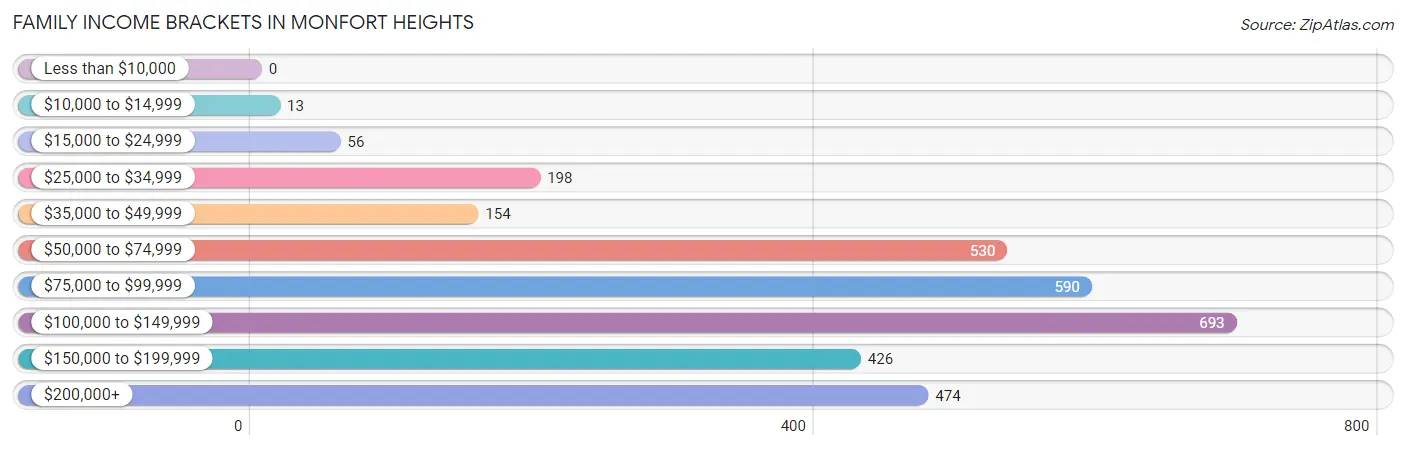
| Income Bracket | # Families | % Families |
| Less than $10,000 | 0 | 0.0% |
| $10,000 to $14,999 | 13 | 0.4% |
| $15,000 to $24,999 | 56 | 1.8% |
| $25,000 to $34,999 | 198 | 6.3% |
| $35,000 to $49,999 | 154 | 4.9% |
| $50,000 to $74,999 | 530 | 16.9% |
| $75,000 to $99,999 | 590 | 18.8% |
| $100,000 to $149,999 | 693 | 22.1% |
| $150,000 to $199,999 | 426 | 13.6% |
| $200,000+ | 474 | 15.1% |
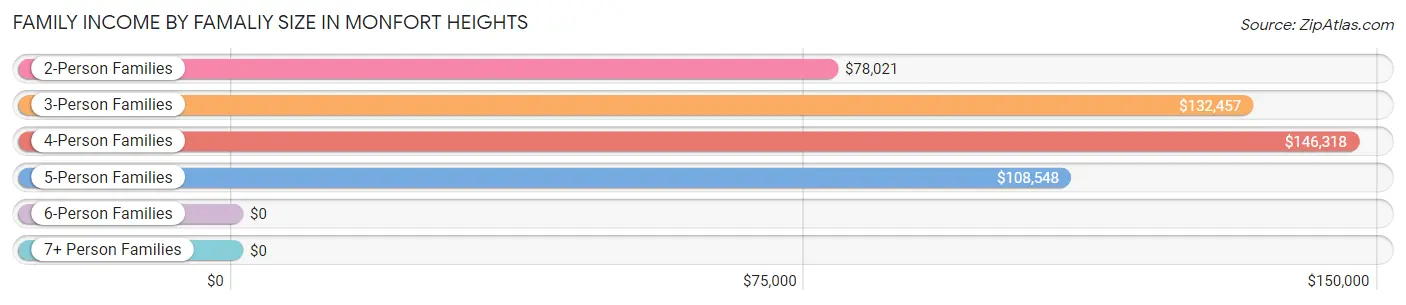
Family Income by Famaliy Size in Monfort Heights
4-person families (698 | 22.3%) account for the highest median family income in Monfort Heights with $146,318 per family, while 3-person families (567 | 18.1%) have the highest median income of $44,152 per family member.
| Income Bracket | # Families | Median Income |
| 2-Person Families | 1,521 (48.5%) | $78,021 |
| 3-Person Families | 567 (18.1%) | $132,457 |
| 4-Person Families | 698 (22.3%) | $146,318 |
| 5-Person Families | 323 (10.3%) | $108,548 |
| 6-Person Families | 19 (0.6%) | $0 |
| 7+ Person Families | 8 (0.3%) | $0 |
| Total | 3,136 (100.0%) | $100,923 |
Family Income by Number of Earners in Monfort Heights
The median family income in Monfort Heights is $100,923, with families comprising 3+ earners (409) having the highest median family income of $220,110, while families with no earners (457) have the lowest median family income of $66,898, accounting for 13.0% and 14.6% of families, respectively.
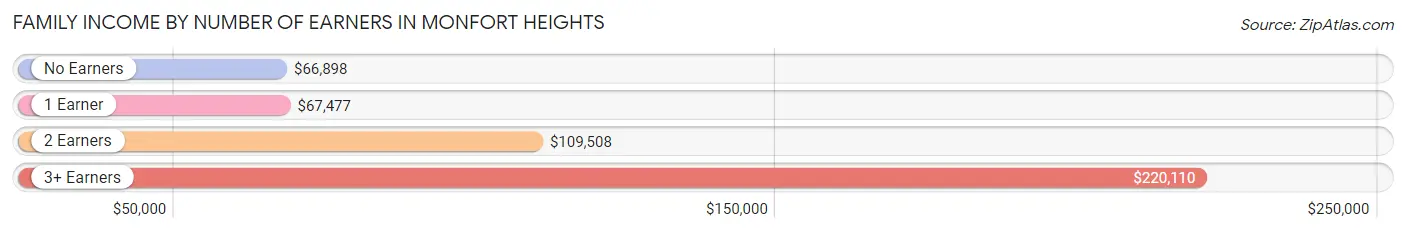
| Number of Earners | # Families | Median Income |
| No Earners | 457 (14.6%) | $66,898 |
| 1 Earner | 653 (20.8%) | $67,477 |
| 2 Earners | 1,617 (51.6%) | $109,508 |
| 3+ Earners | 409 (13.0%) | $220,110 |
| Total | 3,136 (100.0%) | $100,923 |
Household Income in Monfort Heights
Household Income Brackets in Monfort Heights
With 961 households falling in the category, the $50,000 to $74,999 income range is the most frequent in Monfort Heights, accounting for 19.6% of all households. In contrast, only 54 households (1.1%) fall into the $10,000 to $14,999 income bracket, making it the least populous group.
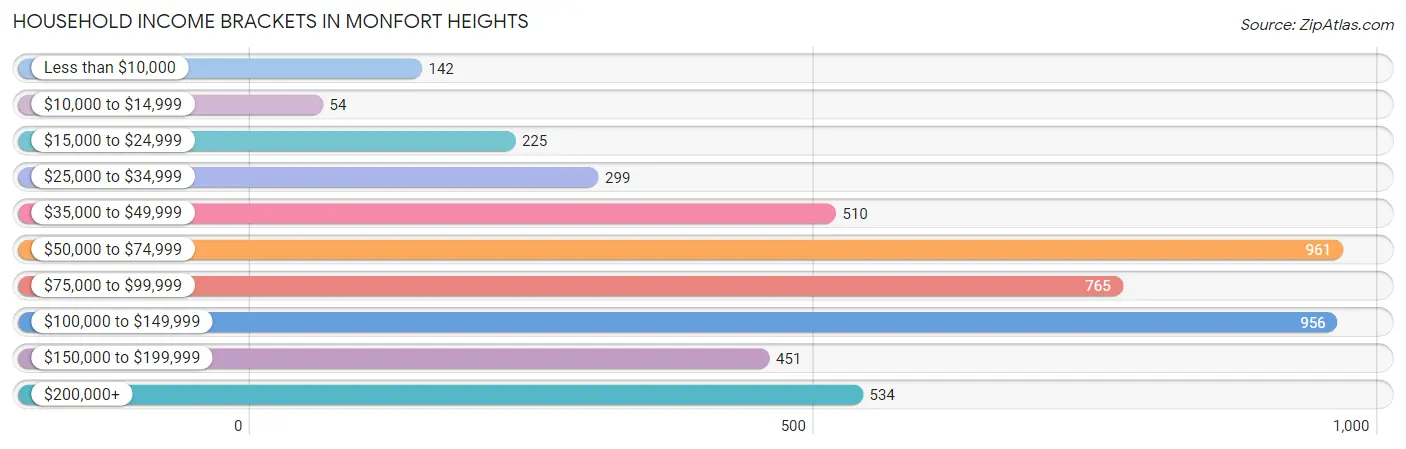
| Income Bracket | # Households | % Households |
| Less than $10,000 | 142 | 2.9% |
| $10,000 to $14,999 | 54 | 1.1% |
| $15,000 to $24,999 | 225 | 4.6% |
| $25,000 to $34,999 | 299 | 6.1% |
| $35,000 to $49,999 | 510 | 10.4% |
| $50,000 to $74,999 | 961 | 19.6% |
| $75,000 to $99,999 | 765 | 15.6% |
| $100,000 to $149,999 | 956 | 19.5% |
| $150,000 to $199,999 | 451 | 9.2% |
| $200,000+ | 534 | 10.9% |
Household Income by Householder Age in Monfort Heights
The median household income in Monfort Heights is $80,625, with the highest median household income of $101,341 found in the 45 to 64 years age bracket for the primary householder. A total of 1,616 households (33.0%) fall into this category. Meanwhile, the 15 to 24 years age bracket for the primary householder has the lowest median household income of $31,929, with 156 households (3.2%) in this group.
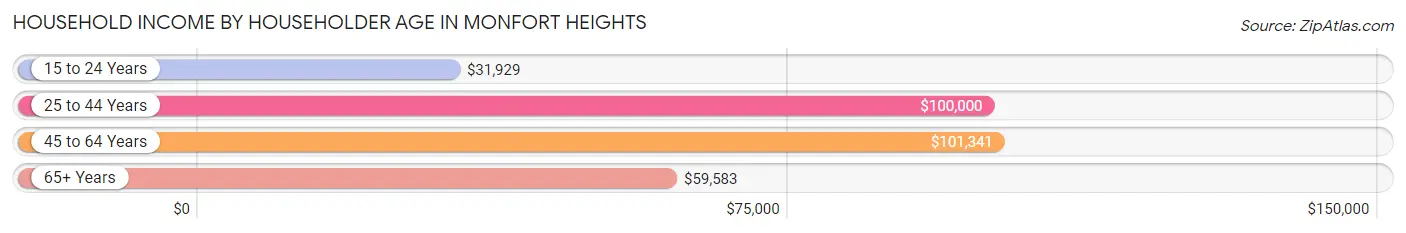
| Income Bracket | # Households | Median Income |
| 15 to 24 Years | 156 (3.2%) | $31,929 |
| 25 to 44 Years | 1,656 (33.8%) | $100,000 |
| 45 to 64 Years | 1,616 (33.0%) | $101,341 |
| 65+ Years | 1,474 (30.1%) | $59,583 |
| Total | 4,902 (100.0%) | $80,625 |
Poverty in Monfort Heights
Income Below Poverty by Sex and Age in Monfort Heights
With 3.0% poverty level for males and 2.4% for females among the residents of Monfort Heights, 55 to 64 year old males and 75 year old and over females are the most vulnerable to poverty, with 62 males (11.2%) and 100 females (15.5%) in their respective age groups living below the poverty level.
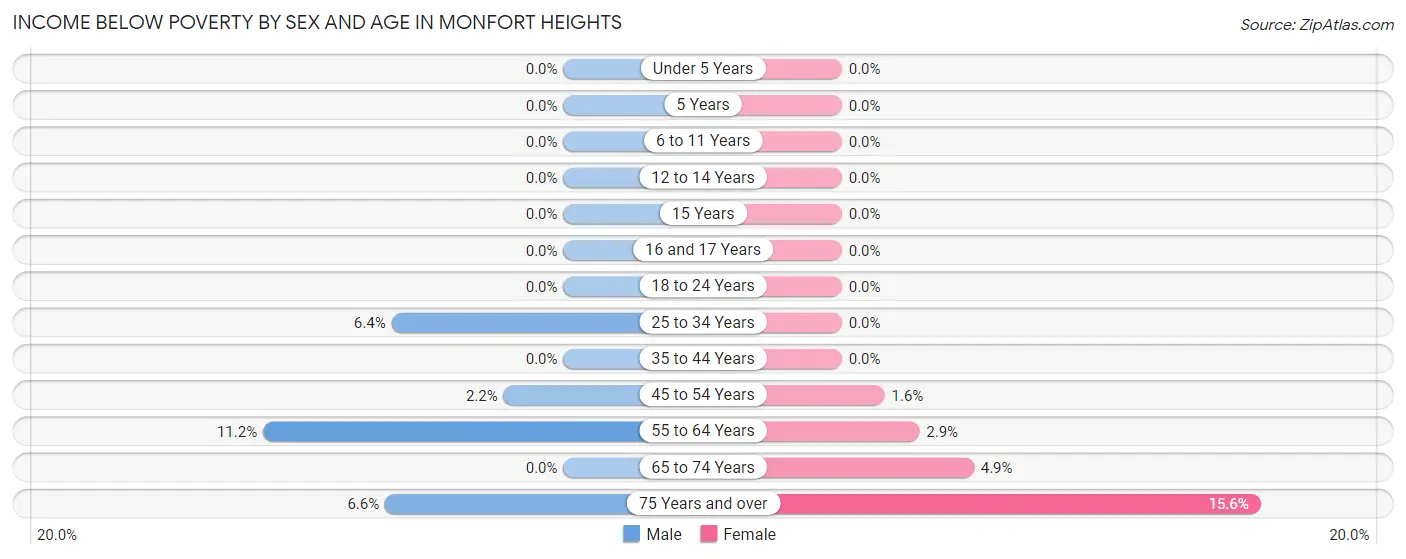
| Age Bracket | Male | Female |
| Under 5 Years | 0 (0.0%) | 0 (0.0%) |
| 5 Years | 0 (0.0%) | 0 (0.0%) |
| 6 to 11 Years | 0 (0.0%) | 0 (0.0%) |
| 12 to 14 Years | 0 (0.0%) | 0 (0.0%) |
| 15 Years | 0 (0.0%) | 0 (0.0%) |
| 16 and 17 Years | 0 (0.0%) | 0 (0.0%) |
| 18 to 24 Years | 0 (0.0%) | 0 (0.0%) |
| 25 to 34 Years | 49 (6.4%) | 0 (0.0%) |
| 35 to 44 Years | 0 (0.0%) | 0 (0.0%) |
| 45 to 54 Years | 16 (2.2%) | 12 (1.6%) |
| 55 to 64 Years | 62 (11.2%) | 20 (2.9%) |
| 65 to 74 Years | 0 (0.0%) | 27 (4.9%) |
| 75 Years and over | 28 (6.6%) | 100 (15.5%) |
| Total | 155 (3.0%) | 159 (2.4%) |
Income Above Poverty by Sex and Age in Monfort Heights
According to the poverty statistics in Monfort Heights, males aged under 5 years and females aged under 5 years are the age groups that are most secure financially, with 100.0% of males and 100.0% of females in these age groups living above the poverty line.
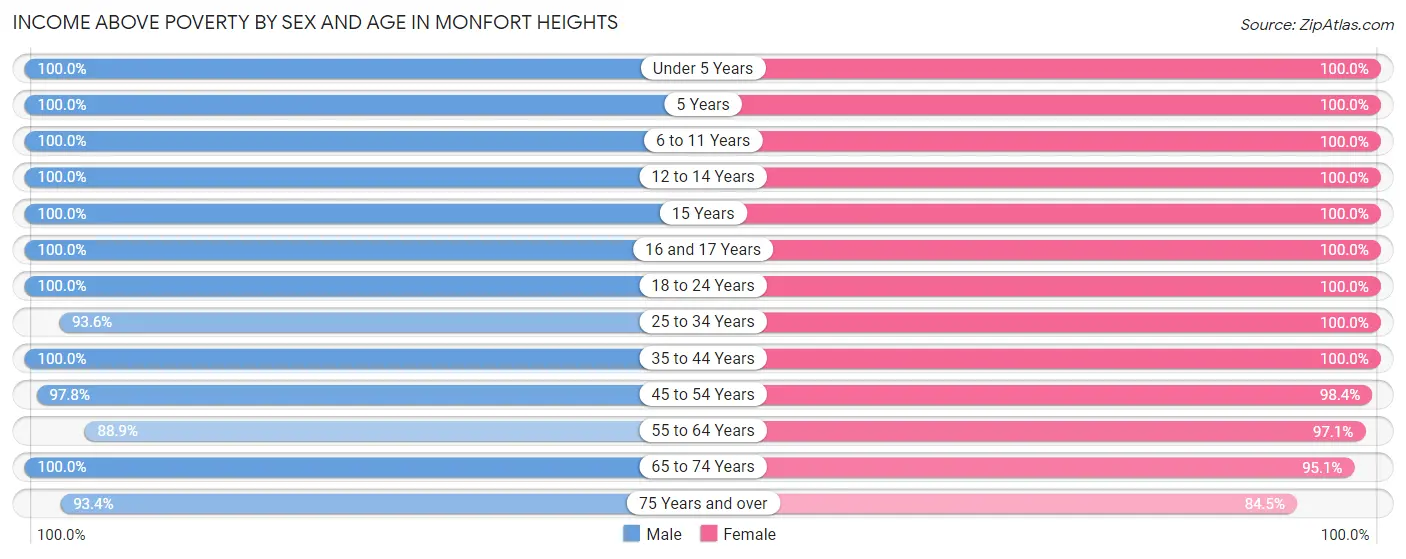
| Age Bracket | Male | Female |
| Under 5 Years | 352 (100.0%) | 508 (100.0%) |
| 5 Years | 53 (100.0%) | 49 (100.0%) |
| 6 to 11 Years | 349 (100.0%) | 701 (100.0%) |
| 12 to 14 Years | 197 (100.0%) | 108 (100.0%) |
| 15 Years | 13 (100.0%) | 281 (100.0%) |
| 16 and 17 Years | 80 (100.0%) | 171 (100.0%) |
| 18 to 24 Years | 369 (100.0%) | 567 (100.0%) |
| 25 to 34 Years | 719 (93.6%) | 928 (100.0%) |
| 35 to 44 Years | 759 (100.0%) | 732 (100.0%) |
| 45 to 54 Years | 704 (97.8%) | 744 (98.4%) |
| 55 to 64 Years | 494 (88.8%) | 675 (97.1%) |
| 65 to 74 Years | 447 (100.0%) | 524 (95.1%) |
| 75 Years and over | 395 (93.4%) | 543 (84.5%) |
| Total | 4,931 (97.0%) | 6,531 (97.6%) |
Income Below Poverty Among Married-Couple Families in Monfort Heights
The poverty statistics for married-couple families in Monfort Heights show that 0.5% or 13 of the total 2,345 families live below the poverty line. Families with no children have the highest poverty rate of 1.1%, comprising of 13 families. On the other hand, families with 1 or 2 children have the lowest poverty rate of 0.0%, which includes 0 families.
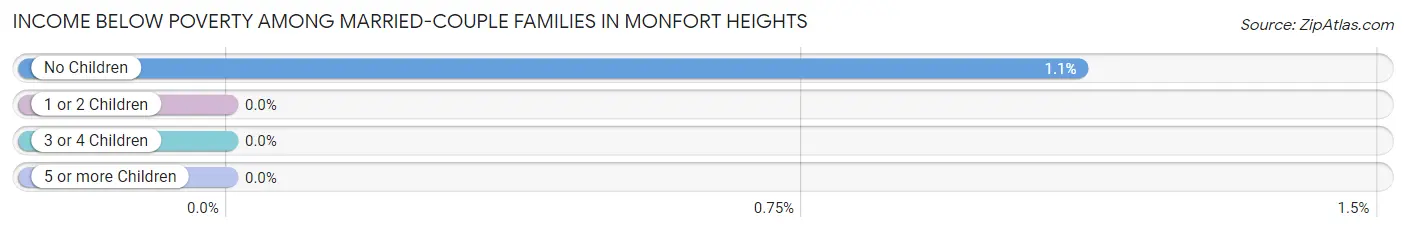
| Children | Above Poverty | Below Poverty |
| No Children | 1,153 (98.9%) | 13 (1.1%) |
| 1 or 2 Children | 960 (100.0%) | 0 (0.0%) |
| 3 or 4 Children | 219 (100.0%) | 0 (0.0%) |
| 5 or more Children | 0 (0.0%) | 0 (0.0%) |
| Total | 2,332 (99.5%) | 13 (0.5%) |
Income Below Poverty Among Single-Parent Households in Monfort Heights
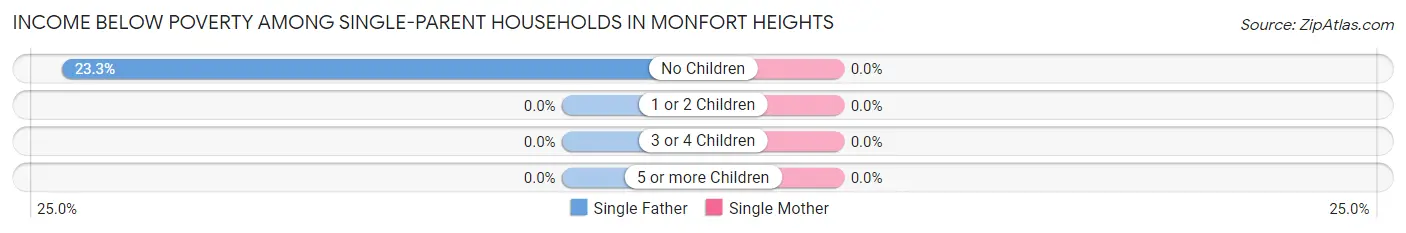
| Children | Single Father | Single Mother |
| No Children | 47 (23.3%) | 0 (0.0%) |
| 1 or 2 Children | 0 (0.0%) | 0 (0.0%) |
| 3 or 4 Children | 0 (0.0%) | 0 (0.0%) |
| 5 or more Children | 0 (0.0%) | 0 (0.0%) |
| Total | 47 (13.2%) | 0 (0.0%) |
Income Below Poverty Among Married-Couple vs Single-Parent Households in Monfort Heights
The poverty data for Monfort Heights shows that 13 of the married-couple family households (0.5%) and 47 of the single-parent households (5.9%) are living below the poverty level. Within the married-couple family households, those with no children have the highest poverty rate, with 13 households (1.1%) falling below the poverty line. Among the single-parent households, those with no children have the highest poverty rate, with 47 household (12.5%) living below poverty.
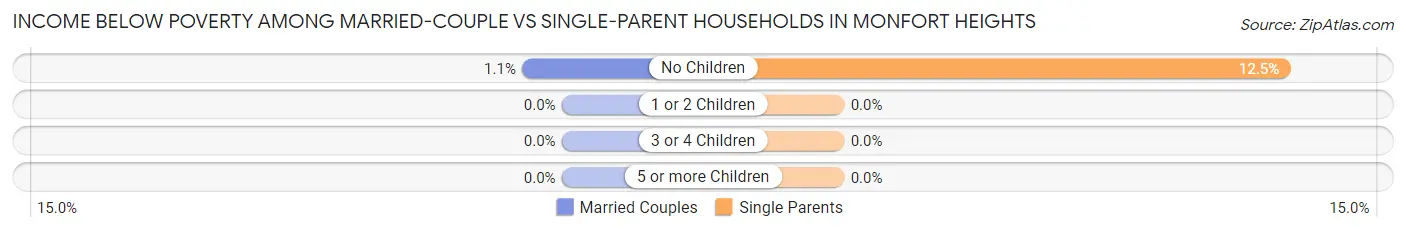
| Children | Married-Couple Families | Single-Parent Households |
| No Children | 13 (1.1%) | 47 (12.5%) |
| 1 or 2 Children | 0 (0.0%) | 0 (0.0%) |
| 3 or 4 Children | 0 (0.0%) | 0 (0.0%) |
| 5 or more Children | 0 (0.0%) | 0 (0.0%) |
| Total | 13 (0.5%) | 47 (5.9%) |
Race in Monfort Heights
The most populous races in Monfort Heights are White / Caucasian (9,361 | 77.9%), Black / African American (1,698 | 14.1%), and Two or more Races (521 | 4.3%).
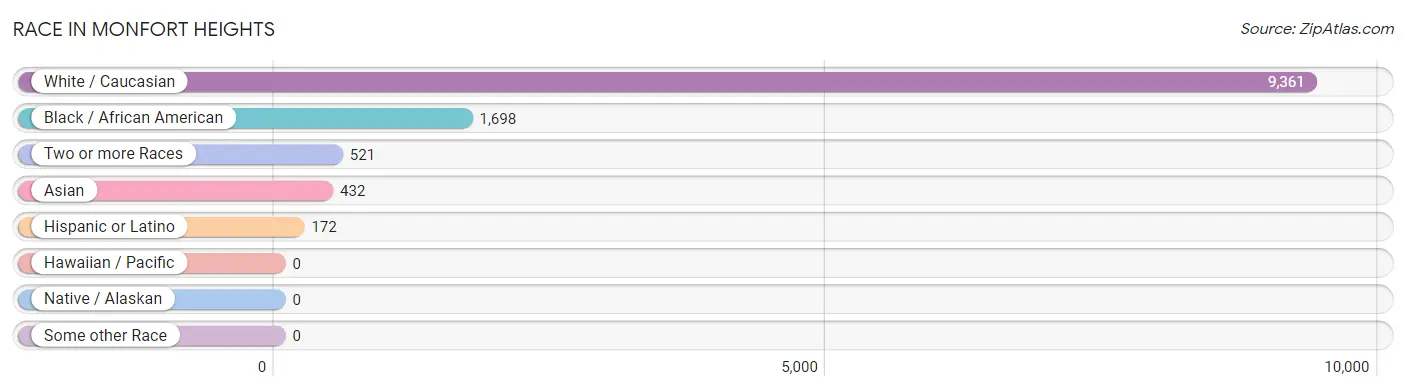
| Race | # Population | % Population |
| Asian | 432 | 3.6% |
| Black / African American | 1,698 | 14.1% |
| Hawaiian / Pacific | 0 | 0.0% |
| Hispanic or Latino | 172 | 1.4% |
| Native / Alaskan | 0 | 0.0% |
| White / Caucasian | 9,361 | 77.9% |
| Two or more Races | 521 | 4.3% |
| Some other Race | 0 | 0.0% |
| Total | 12,012 | 100.0% |
Ancestry in Monfort Heights
The most populous ancestries reported in Monfort Heights are German (4,756 | 39.6%), Irish (1,930 | 16.1%), English (624 | 5.2%), Italian (610 | 5.1%), and American (507 | 4.2%), together accounting for 70.2% of all Monfort Heights residents.
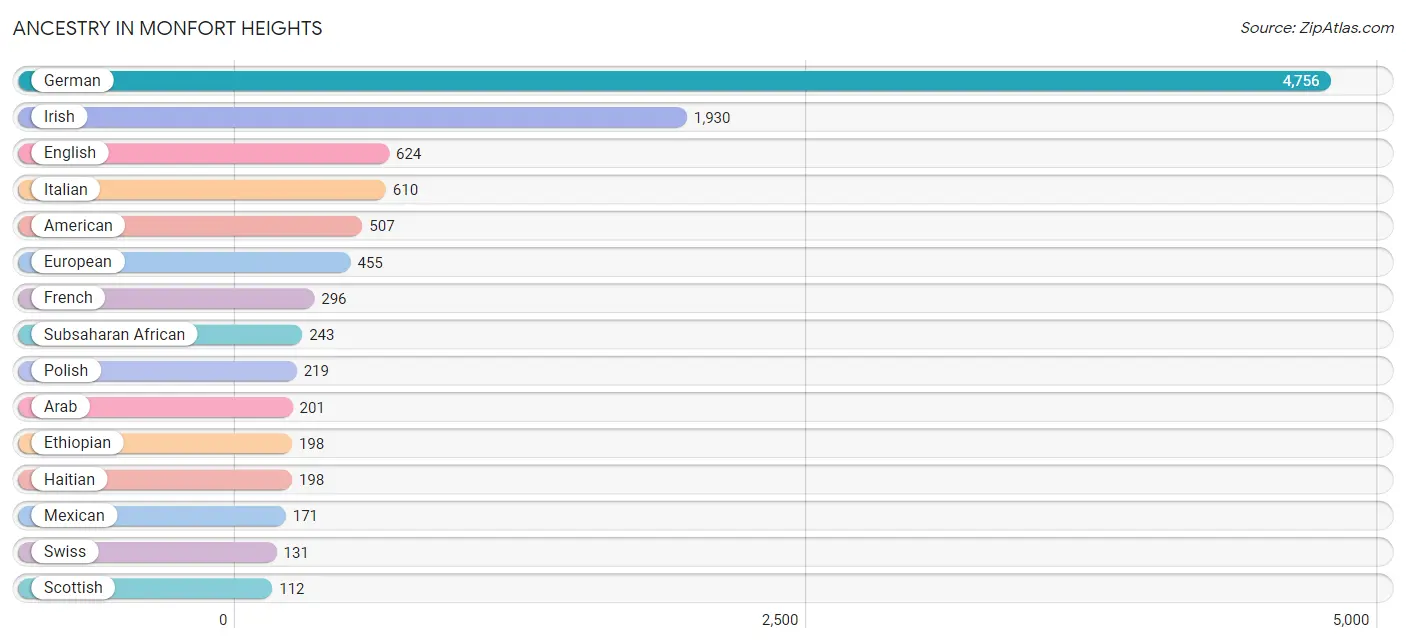
| Ancestry | # Population | % Population |
| African | 17 | 0.1% |
| American | 507 | 4.2% |
| Arab | 201 | 1.7% |
| Austrian | 15 | 0.1% |
| British | 51 | 0.4% |
| Central American | 1 | 0.0% |
| Cherokee | 18 | 0.2% |
| Croatian | 11 | 0.1% |
| Czechoslovakian | 13 | 0.1% |
| Danish | 15 | 0.1% |
| English | 624 | 5.2% |
| Ethiopian | 198 | 1.7% |
| European | 455 | 3.8% |
| French | 296 | 2.5% |
| French Canadian | 23 | 0.2% |
| German | 4,756 | 39.6% |
| Greek | 106 | 0.9% |
| Guatemalan | 1 | 0.0% |
| Haitian | 198 | 1.7% |
| Indian (Asian) | 16 | 0.1% |
| Irish | 1,930 | 16.1% |
| Italian | 610 | 5.1% |
| Korean | 24 | 0.2% |
| Lebanese | 34 | 0.3% |
| Macedonian | 50 | 0.4% |
| Mexican | 171 | 1.4% |
| Northern European | 51 | 0.4% |
| Pakistani | 33 | 0.3% |
| Palestinian | 79 | 0.7% |
| Pennsylvania German | 24 | 0.2% |
| Polish | 219 | 1.8% |
| Romanian | 16 | 0.1% |
| Scotch-Irish | 95 | 0.8% |
| Scottish | 112 | 0.9% |
| Sierra Leonean | 28 | 0.2% |
| Sioux | 12 | 0.1% |
| Subsaharan African | 243 | 2.0% |
| Swedish | 28 | 0.2% |
| Swiss | 131 | 1.1% |
| Syrian | 7 | 0.1% |
| Welsh | 29 | 0.2% | View All 41 Rows |
Immigrants in Monfort Heights
The most numerous immigrant groups reported in Monfort Heights came from Asia (290 | 2.4%), Africa (164 | 1.4%), South Central Asia (150 | 1.3%), Eastern Africa (108 | 0.9%), and Eritrea (108 | 0.9%), together accounting for 6.8% of all Monfort Heights residents.
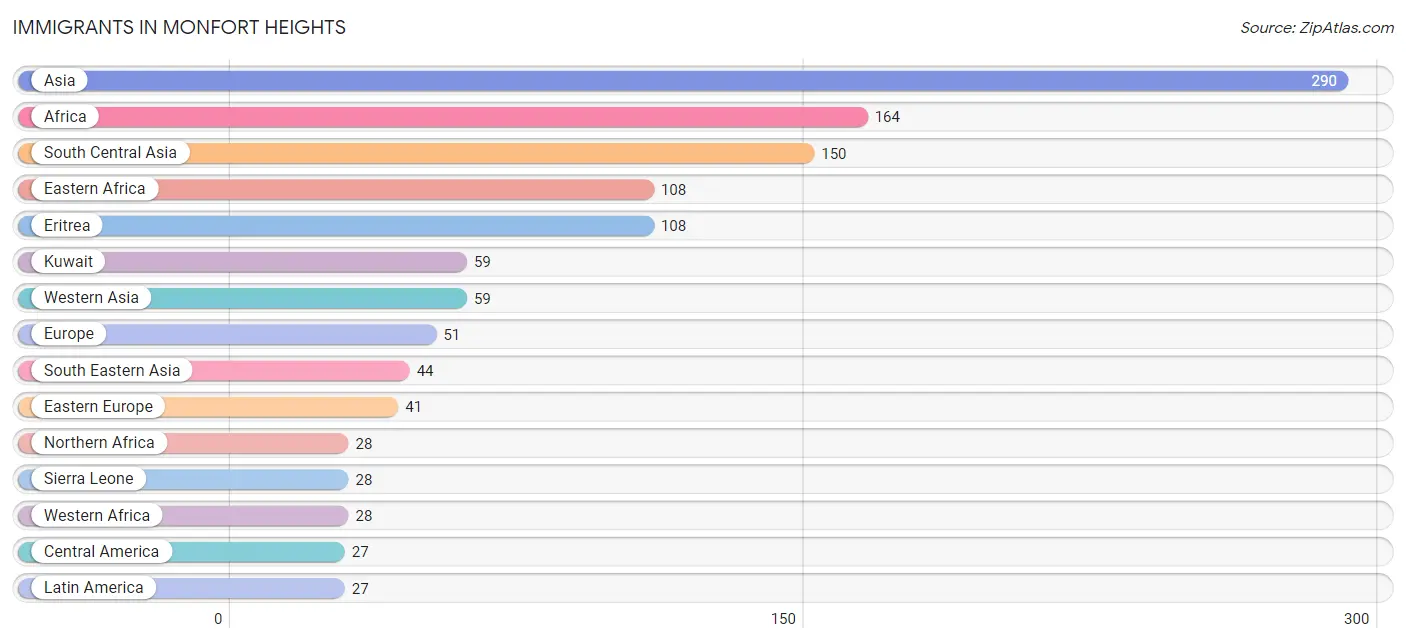
| Immigration Origin | # Population | % Population |
| Africa | 164 | 1.4% |
| Asia | 290 | 2.4% |
| Central America | 27 | 0.2% |
| Eastern Africa | 108 | 0.9% |
| Eastern Europe | 41 | 0.3% |
| Eritrea | 108 | 0.9% |
| Europe | 51 | 0.4% |
| Germany | 10 | 0.1% |
| Guatemala | 1 | 0.0% |
| Kuwait | 59 | 0.5% |
| Latin America | 27 | 0.2% |
| Mexico | 26 | 0.2% |
| North Macedonia | 25 | 0.2% |
| Northern Africa | 28 | 0.2% |
| Philippines | 24 | 0.2% |
| Romania | 16 | 0.1% |
| Sierra Leone | 28 | 0.2% |
| South Central Asia | 150 | 1.3% |
| South Eastern Asia | 44 | 0.4% |
| Thailand | 20 | 0.2% |
| Western Africa | 28 | 0.2% |
| Western Asia | 59 | 0.5% |
| Western Europe | 10 | 0.1% | View All 23 Rows |
Sex and Age in Monfort Heights
Sex and Age in Monfort Heights
The most populous age groups in Monfort Heights are 50 to 54 Years (559 | 10.8%) for men and 15 to 19 Years (704 | 10.3%) for women.
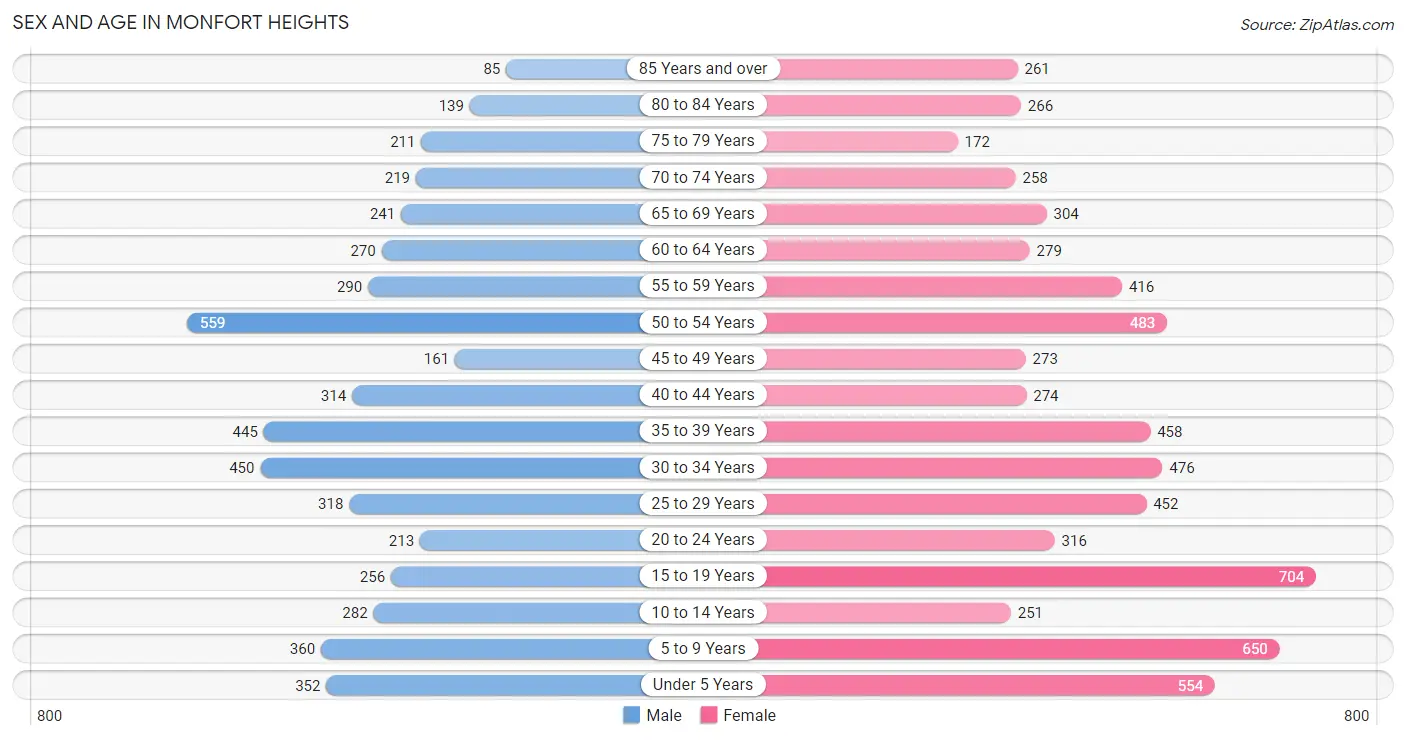
| Age Bracket | Male | Female |
| Under 5 Years | 352 (6.8%) | 554 (8.1%) |
| 5 to 9 Years | 360 (7.0%) | 650 (9.5%) |
| 10 to 14 Years | 282 (5.5%) | 251 (3.7%) |
| 15 to 19 Years | 256 (5.0%) | 704 (10.3%) |
| 20 to 24 Years | 213 (4.1%) | 316 (4.6%) |
| 25 to 29 Years | 318 (6.2%) | 452 (6.6%) |
| 30 to 34 Years | 450 (8.7%) | 476 (7.0%) |
| 35 to 39 Years | 445 (8.6%) | 458 (6.7%) |
| 40 to 44 Years | 314 (6.1%) | 274 (4.0%) |
| 45 to 49 Years | 161 (3.1%) | 273 (4.0%) |
| 50 to 54 Years | 559 (10.8%) | 483 (7.0%) |
| 55 to 59 Years | 290 (5.6%) | 416 (6.1%) |
| 60 to 64 Years | 270 (5.2%) | 279 (4.1%) |
| 65 to 69 Years | 241 (4.7%) | 304 (4.4%) |
| 70 to 74 Years | 219 (4.2%) | 258 (3.8%) |
| 75 to 79 Years | 211 (4.1%) | 172 (2.5%) |
| 80 to 84 Years | 139 (2.7%) | 266 (3.9%) |
| 85 Years and over | 85 (1.7%) | 261 (3.8%) |
| Total | 5,165 (100.0%) | 6,847 (100.0%) |
Families and Households in Monfort Heights
Median Family Size in Monfort Heights
The median family size in Monfort Heights is 3.08 persons per family, with married-couple families (2,345 | 74.8%) accounting for the largest median family size of 3.22 persons per family. On the other hand, single female/mother families (434 | 13.8%) represent the smallest median family size with 2.47 persons per family.
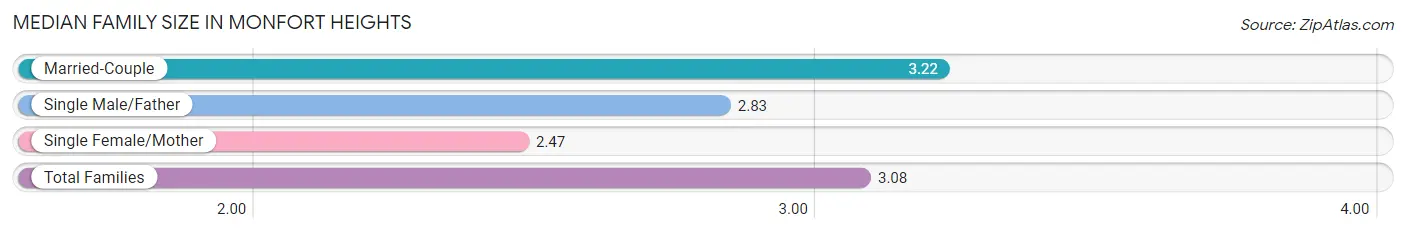
| Family Type | # Families | Family Size |
| Married-Couple | 2,345 (74.8%) | 3.22 |
| Single Male/Father | 357 (11.4%) | 2.83 |
| Single Female/Mother | 434 (13.8%) | 2.47 |
| Total Families | 3,136 (100.0%) | 3.08 |
Median Household Size in Monfort Heights
The median household size in Monfort Heights is 2.42 persons per household, with married-couple households (2,345 | 47.8%) accounting for the largest median household size of 3.22 persons per household. non-family households (1,766 | 36.0%) represent the smallest median household size with 1.25 persons per household.
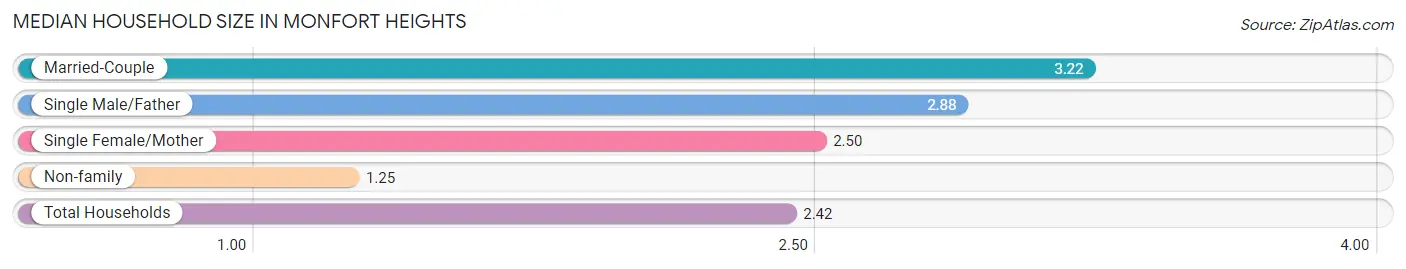
| Household Type | # Households | Household Size |
| Married-Couple | 2,345 (47.8%) | 3.22 |
| Single Male/Father | 357 (7.3%) | 2.88 |
| Single Female/Mother | 434 (8.8%) | 2.50 |
| Non-family | 1,766 (36.0%) | 1.25 |
| Total Households | 4,902 (100.0%) | 2.42 |
Household Size by Marriage Status in Monfort Heights
Out of a total of 4,902 households in Monfort Heights, 3,136 (64.0%) are family households, while 1,766 (36.0%) are nonfamily households. The most numerous type of family households are 2-person households, comprising 1,506, and the most common type of nonfamily households are 1-person households, comprising 1,505.
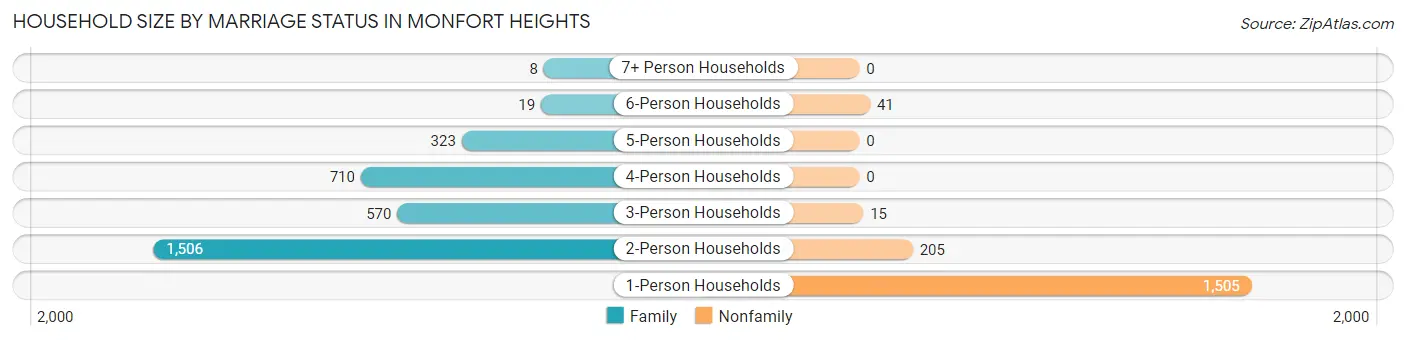
| Household Size | Family Households | Nonfamily Households |
| 1-Person Households | - | 1,505 (30.7%) |
| 2-Person Households | 1,506 (30.7%) | 205 (4.2%) |
| 3-Person Households | 570 (11.6%) | 15 (0.3%) |
| 4-Person Households | 710 (14.5%) | 0 (0.0%) |
| 5-Person Households | 323 (6.6%) | 0 (0.0%) |
| 6-Person Households | 19 (0.4%) | 41 (0.8%) |
| 7+ Person Households | 8 (0.2%) | 0 (0.0%) |
| Total | 3,136 (64.0%) | 1,766 (36.0%) |
Female Fertility in Monfort Heights
Fertility by Age in Monfort Heights
Average fertility rate in Monfort Heights is 66.0 births per 1,000 women. Women in the age bracket of 20 to 34 years have the highest fertility rate with 143.0 births per 1,000 women. Women in the age bracket of 20 to 34 years acount for 89.0% of all women with births.
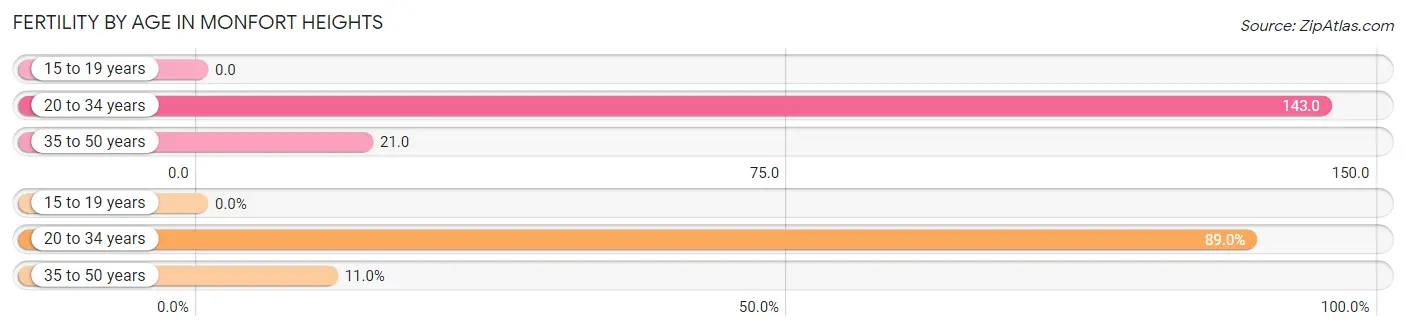
| Age Bracket | Women with Births | Births / 1,000 Women |
| 15 to 19 years | 0 (0.0%) | 0.0 |
| 20 to 34 years | 178 (89.0%) | 143.0 |
| 35 to 50 years | 22 (11.0%) | 21.0 |
| Total | 200 (100.0%) | 66.0 |
Fertility by Age by Marriage Status in Monfort Heights
74.5% of women with births (200) in Monfort Heights are married. The highest percentage of unmarried women with births falls into 20 to 34 years age bracket with 28.6% of them unmarried at the time of birth, while the lowest percentage of unmarried women with births belong to 35 to 50 years age bracket with 0.0% of them unmarried.
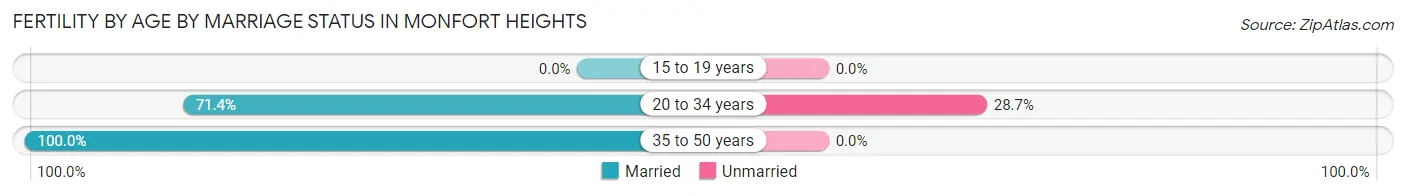
| Age Bracket | Married | Unmarried |
| 15 to 19 years | 0 (0.0%) | 0 (0.0%) |
| 20 to 34 years | 127 (71.4%) | 51 (28.6%) |
| 35 to 50 years | 22 (100.0%) | 0 (0.0%) |
| Total | 149 (74.5%) | 51 (25.5%) |
Fertility by Education in Monfort Heights
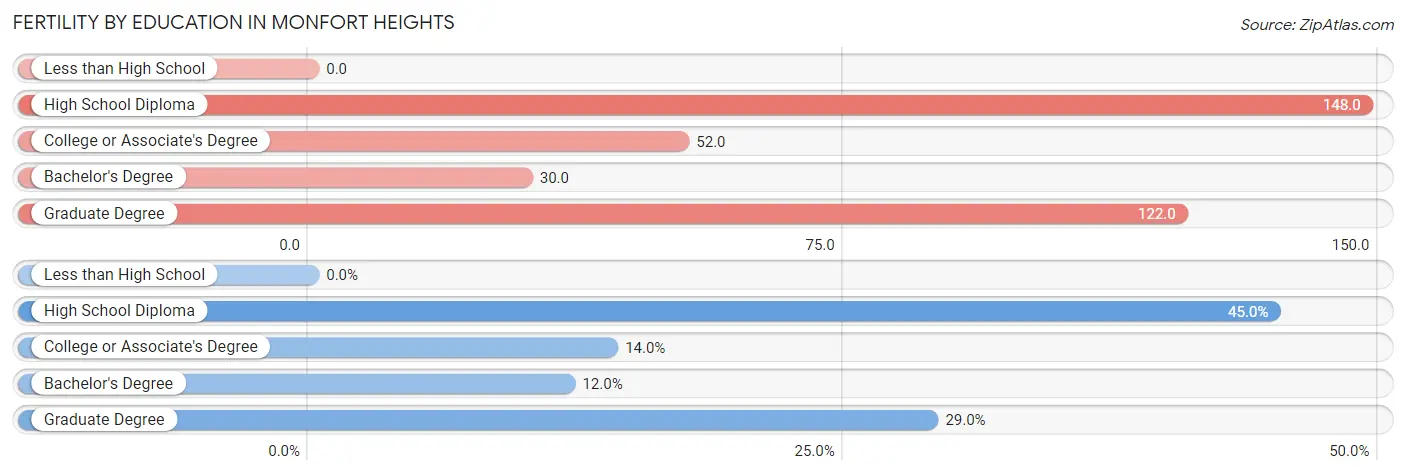
| Educational Attainment | Women with Births | Births / 1,000 Women |
| Less than High School | 0 (0.0%) | 0.0 |
| High School Diploma | 90 (45.0%) | 148.0 |
| College or Associate's Degree | 28 (14.0%) | 52.0 |
| Bachelor's Degree | 24 (12.0%) | 30.0 |
| Graduate Degree | 58 (29.0%) | 122.0 |
| Total | 200 (100.0%) | 66.0 |
Fertility by Education by Marriage Status in Monfort Heights
25.5% of women with births in Monfort Heights are unmarried. Women with the educational attainment of college or associate's degree are most likely to be married with 100.0% of them married at childbirth, while women with the educational attainment of high school diploma are least likely to be married with 56.7% of them unmarried at childbirth.
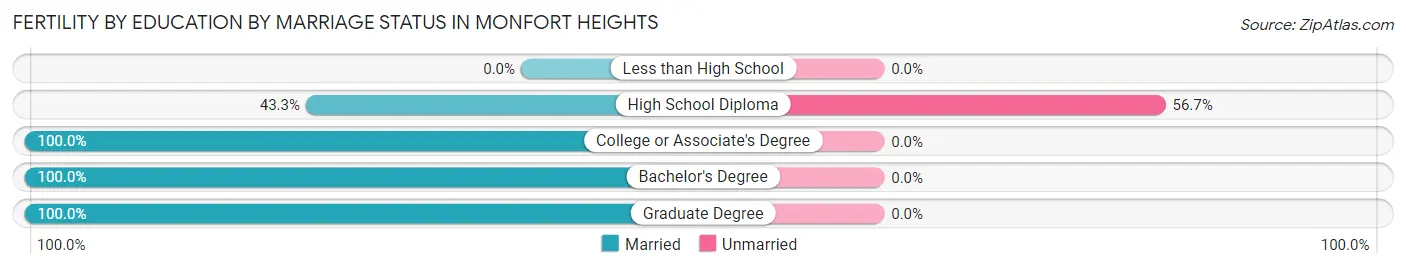
| Educational Attainment | Married | Unmarried |
| Less than High School | 0 (0.0%) | 0 (0.0%) |
| High School Diploma | 39 (43.3%) | 51 (56.7%) |
| College or Associate's Degree | 28 (100.0%) | 0 (0.0%) |
| Bachelor's Degree | 24 (100.0%) | 0 (0.0%) |
| Graduate Degree | 58 (100.0%) | 0 (0.0%) |
| Total | 149 (74.5%) | 51 (25.5%) |
Employment Characteristics in Monfort Heights
Employment by Class of Employer in Monfort Heights
Among the 6,162 employed individuals in Monfort Heights, private company employees (4,218 | 68.4%), not-for-profit organizations (823 | 13.4%), and local government employees (384 | 6.2%) make up the most common classes of employment.
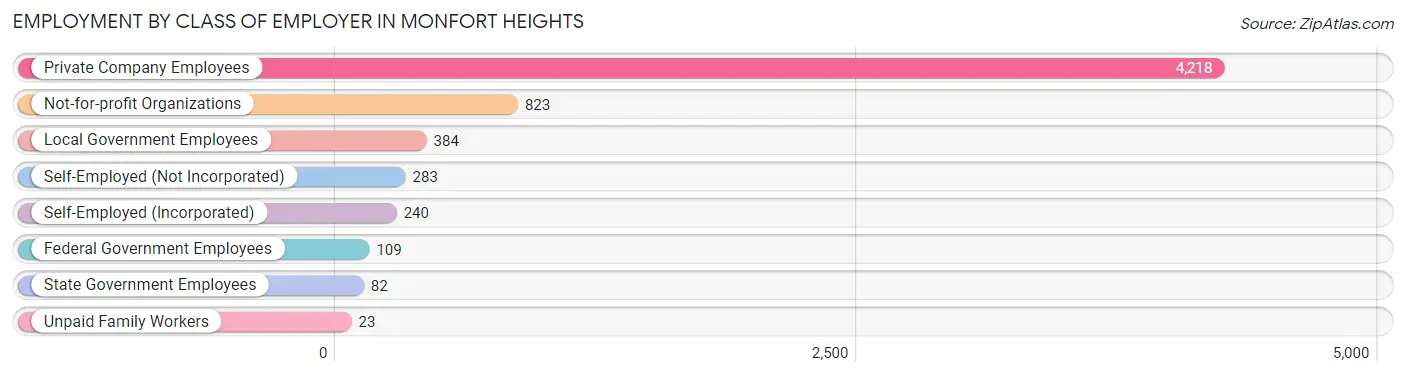
| Employer Class | # Employees | % Employees |
| Private Company Employees | 4,218 | 68.4% |
| Self-Employed (Incorporated) | 240 | 3.9% |
| Self-Employed (Not Incorporated) | 283 | 4.6% |
| Not-for-profit Organizations | 823 | 13.4% |
| Local Government Employees | 384 | 6.2% |
| State Government Employees | 82 | 1.3% |
| Federal Government Employees | 109 | 1.8% |
| Unpaid Family Workers | 23 | 0.4% |
| Total | 6,162 | 100.0% |
Employment Status by Age in Monfort Heights
According to the labor force statistics for Monfort Heights, out of the total population over 16 years of age (9,268), 70.4% or 6,525 individuals are in the labor force, with 3.2% or 209 of them unemployed. The age group with the highest labor force participation rate is 30 to 34 years, with 97.0% or 898 individuals in the labor force. Within the labor force, the 16 to 19 years age range has the highest percentage of unemployed individuals, with 22.9% or 99 of them being unemployed.
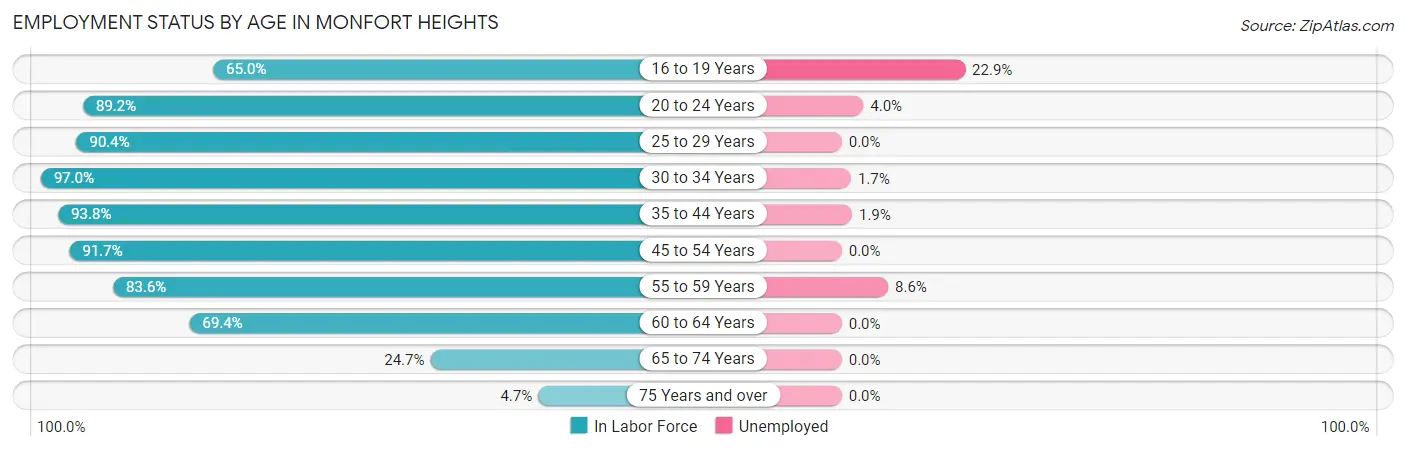
| Age Bracket | In Labor Force | Unemployed |
| 16 to 19 Years | 432 (65.0%) | 99 (22.9%) |
| 20 to 24 Years | 472 (89.2%) | 19 (4.0%) |
| 25 to 29 Years | 696 (90.4%) | 0 (0.0%) |
| 30 to 34 Years | 898 (97.0%) | 15 (1.7%) |
| 35 to 44 Years | 1,399 (93.8%) | 27 (1.9%) |
| 45 to 54 Years | 1,353 (91.7%) | 0 (0.0%) |
| 55 to 59 Years | 590 (83.6%) | 51 (8.6%) |
| 60 to 64 Years | 381 (69.4%) | 0 (0.0%) |
| 65 to 74 Years | 252 (24.7%) | 0 (0.0%) |
| 75 Years and over | 53 (4.7%) | 0 (0.0%) |
| Total | 6,525 (70.4%) | 209 (3.2%) |
Employment Status by Educational Attainment in Monfort Heights
According to labor force statistics for Monfort Heights, 89.9% of individuals (5,320) out of the total population between 25 and 64 years of age (5,918) are in the labor force, with 1.7% or 90 of them being unemployed. The group with the highest labor force participation rate are those with the educational attainment of bachelor's degree or higher, with 92.7% or 2,790 individuals in the labor force. Within the labor force, individuals with college / associate degree education have the highest percentage of unemployment, with 2.6% or 30 of them being unemployed.
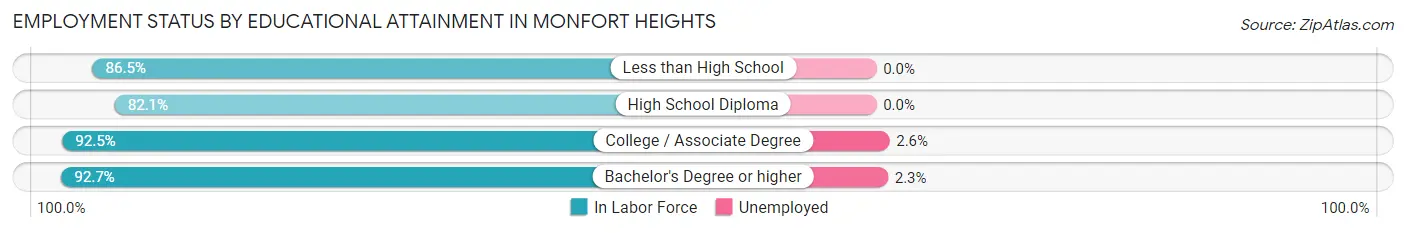
| Educational Attainment | In Labor Force | Unemployed |
| Less than High School | 173 (86.5%) | 0 (0.0%) |
| High School Diploma | 1,187 (82.1%) | 0 (0.0%) |
| College / Associate Degree | 1,167 (92.5%) | 33 (2.6%) |
| Bachelor's Degree or higher | 2,790 (92.7%) | 69 (2.3%) |
| Total | 5,320 (89.9%) | 101 (1.7%) |
Employment Occupations by Sex in Monfort Heights
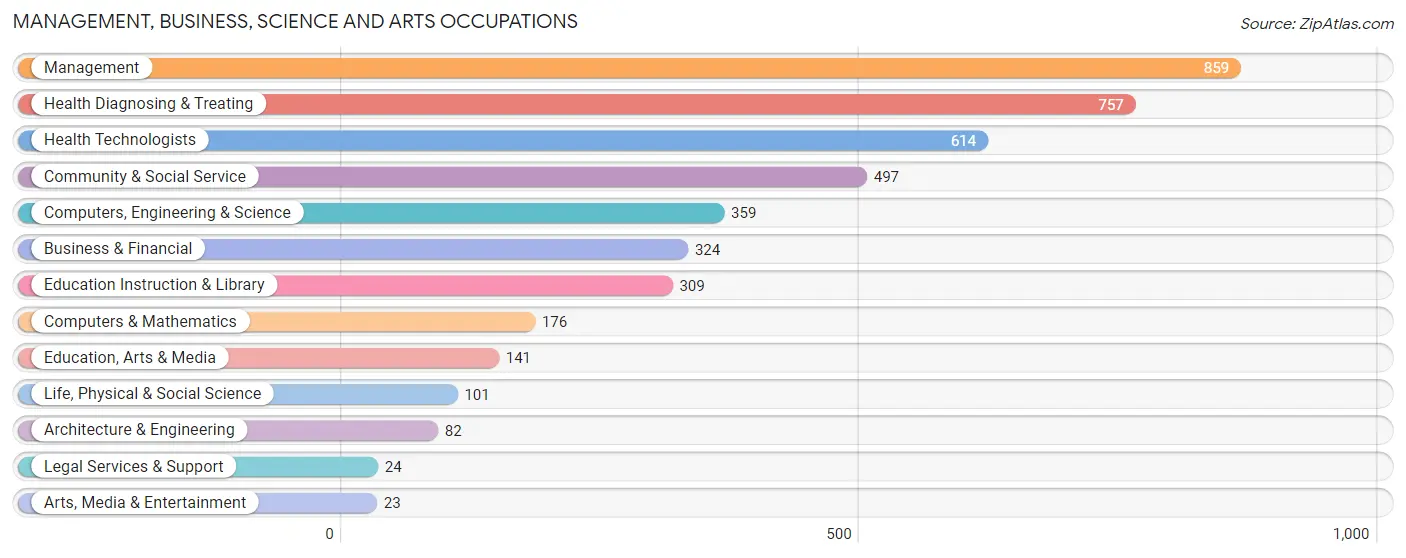
Management, Business, Science and Arts Occupations
The most common Management, Business, Science and Arts occupations in Monfort Heights are Management (859 | 13.6%), Health Diagnosing & Treating (757 | 12.0%), Health Technologists (614 | 9.7%), Community & Social Service (497 | 7.9%), and Computers, Engineering & Science (359 | 5.7%).
Management, Business, Science and Arts Occupations by Sex
Within the Management, Business, Science and Arts occupations in Monfort Heights, the most male-oriented occupations are Architecture & Engineering (81.7%), Computers & Mathematics (77.8%), and Management (72.3%), while the most female-oriented occupations are Life, Physical & Social Science (100.0%), Education, Arts & Media (98.6%), and Health Diagnosing & Treating (92.1%).
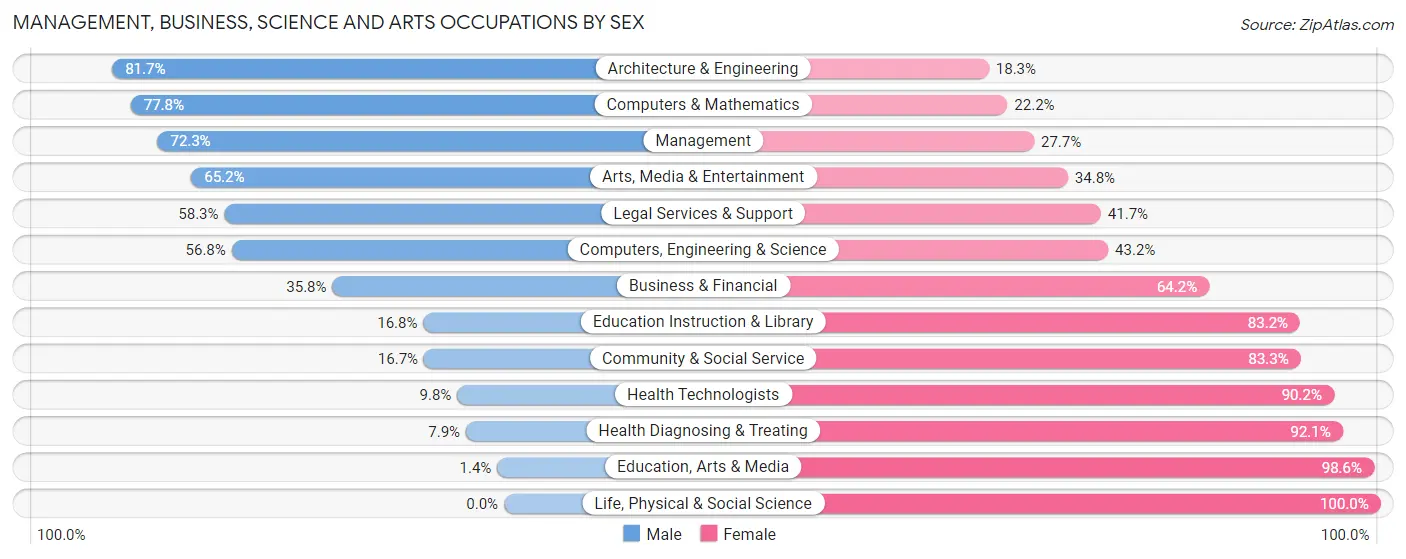
| Occupation | Male | Female |
| Management | 621 (72.3%) | 238 (27.7%) |
| Business & Financial | 116 (35.8%) | 208 (64.2%) |
| Computers, Engineering & Science | 204 (56.8%) | 155 (43.2%) |
| Computers & Mathematics | 137 (77.8%) | 39 (22.2%) |
| Architecture & Engineering | 67 (81.7%) | 15 (18.3%) |
| Life, Physical & Social Science | 0 (0.0%) | 101 (100.0%) |
| Community & Social Service | 83 (16.7%) | 414 (83.3%) |
| Education, Arts & Media | 2 (1.4%) | 139 (98.6%) |
| Legal Services & Support | 14 (58.3%) | 10 (41.7%) |
| Education Instruction & Library | 52 (16.8%) | 257 (83.2%) |
| Arts, Media & Entertainment | 15 (65.2%) | 8 (34.8%) |
| Health Diagnosing & Treating | 60 (7.9%) | 697 (92.1%) |
| Health Technologists | 60 (9.8%) | 554 (90.2%) |
| Total (Category) | 1,084 (38.8%) | 1,712 (61.2%) |
| Total (Overall) | 2,950 (46.7%) | 3,366 (53.3%) |
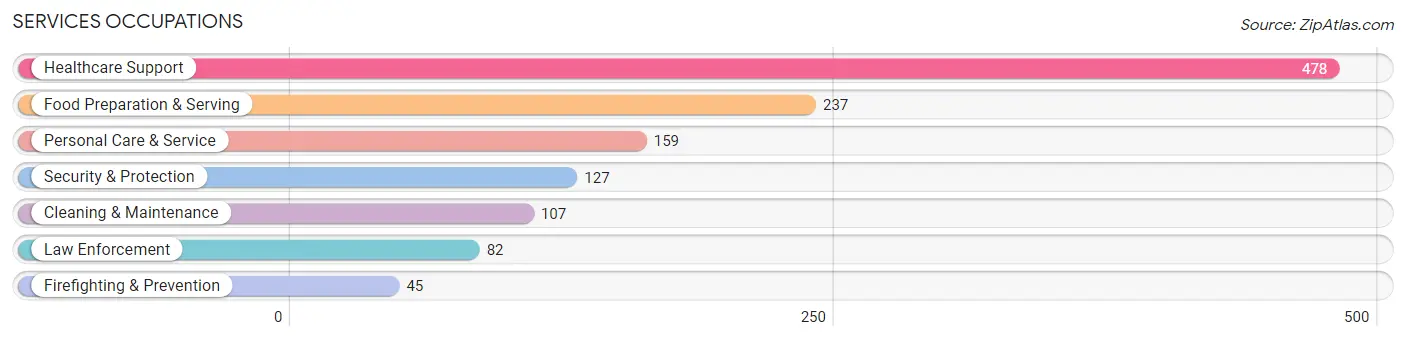
Services Occupations
The most common Services occupations in Monfort Heights are Healthcare Support (478 | 7.6%), Food Preparation & Serving (237 | 3.7%), Personal Care & Service (159 | 2.5%), Security & Protection (127 | 2.0%), and Cleaning & Maintenance (107 | 1.7%).
Services Occupations by Sex
Within the Services occupations in Monfort Heights, the most male-oriented occupations are Cleaning & Maintenance (92.5%), Firefighting & Prevention (71.1%), and Food Preparation & Serving (53.2%), while the most female-oriented occupations are Personal Care & Service (83.0%), Law Enforcement (64.6%), and Healthcare Support (64.4%).
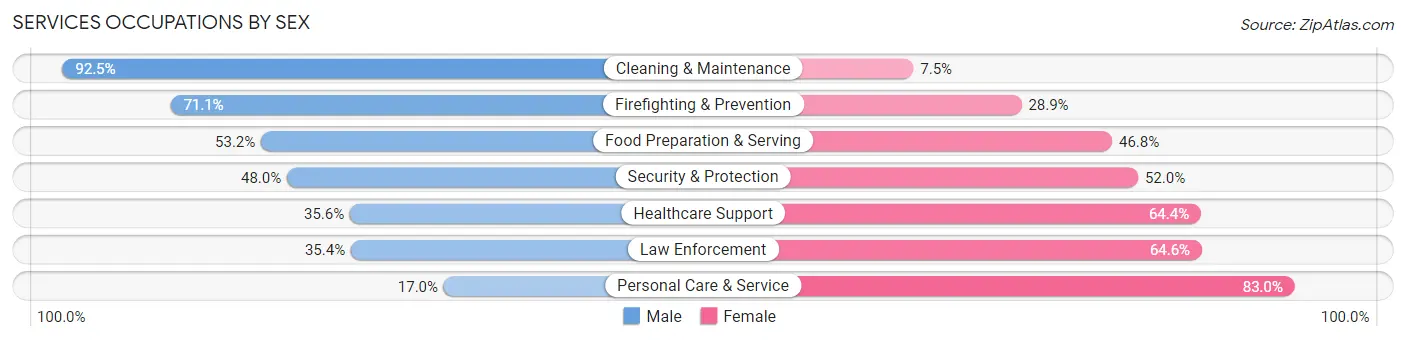
| Occupation | Male | Female |
| Healthcare Support | 170 (35.6%) | 308 (64.4%) |
| Security & Protection | 61 (48.0%) | 66 (52.0%) |
| Firefighting & Prevention | 32 (71.1%) | 13 (28.9%) |
| Law Enforcement | 29 (35.4%) | 53 (64.6%) |
| Food Preparation & Serving | 126 (53.2%) | 111 (46.8%) |
| Cleaning & Maintenance | 99 (92.5%) | 8 (7.5%) |
| Personal Care & Service | 27 (17.0%) | 132 (83.0%) |
| Total (Category) | 483 (43.6%) | 625 (56.4%) |
| Total (Overall) | 2,950 (46.7%) | 3,366 (53.3%) |
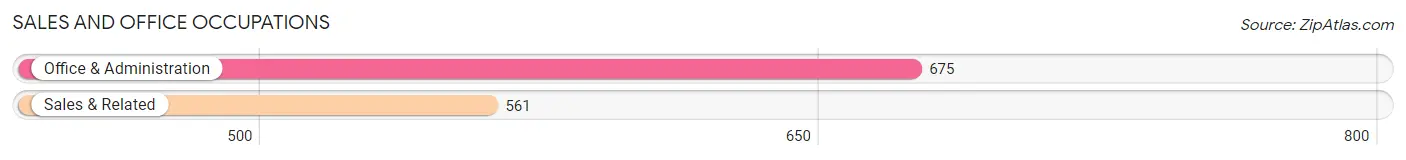
Sales and Office Occupations
The most common Sales and Office occupations in Monfort Heights are Office & Administration (675 | 10.7%), and Sales & Related (561 | 8.9%).
Sales and Office Occupations by Sex
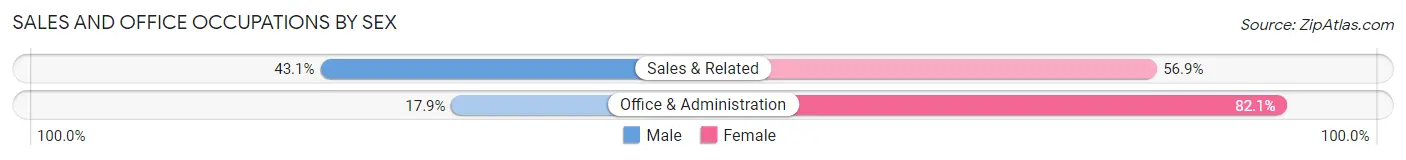
| Occupation | Male | Female |
| Sales & Related | 242 (43.1%) | 319 (56.9%) |
| Office & Administration | 121 (17.9%) | 554 (82.1%) |
| Total (Category) | 363 (29.4%) | 873 (70.6%) |
| Total (Overall) | 2,950 (46.7%) | 3,366 (53.3%) |
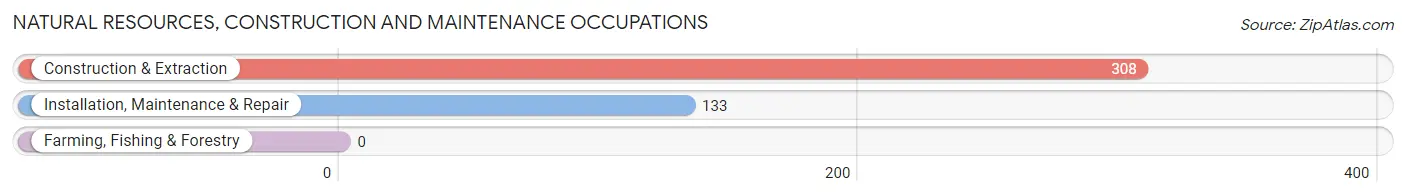
Natural Resources, Construction and Maintenance Occupations
The most common Natural Resources, Construction and Maintenance occupations in Monfort Heights are Construction & Extraction (308 | 4.9%), and Installation, Maintenance & Repair (133 | 2.1%).
Natural Resources, Construction and Maintenance Occupations by Sex
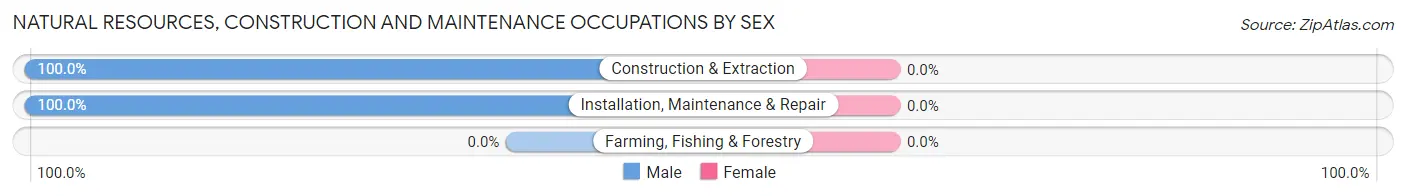
| Occupation | Male | Female |
| Farming, Fishing & Forestry | 0 (0.0%) | 0 (0.0%) |
| Construction & Extraction | 308 (100.0%) | 0 (0.0%) |
| Installation, Maintenance & Repair | 133 (100.0%) | 0 (0.0%) |
| Total (Category) | 441 (100.0%) | 0 (0.0%) |
| Total (Overall) | 2,950 (46.7%) | 3,366 (53.3%) |
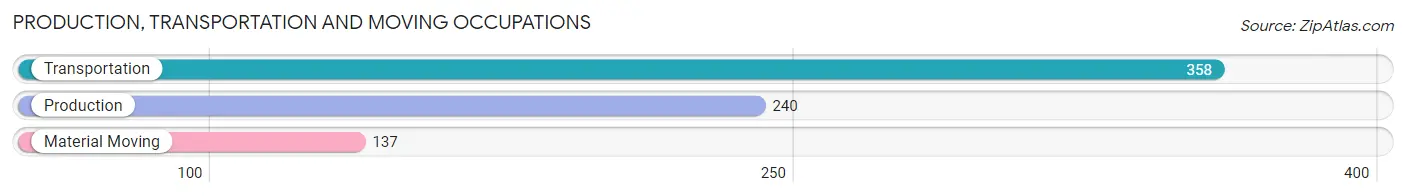
Production, Transportation and Moving Occupations
The most common Production, Transportation and Moving occupations in Monfort Heights are Transportation (358 | 5.7%), Production (240 | 3.8%), and Material Moving (137 | 2.2%).
Production, Transportation and Moving Occupations by Sex
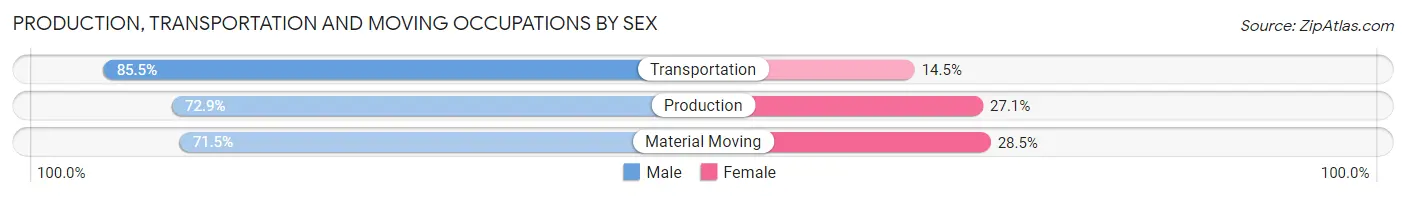
| Occupation | Male | Female |
| Production | 175 (72.9%) | 65 (27.1%) |
| Transportation | 306 (85.5%) | 52 (14.5%) |
| Material Moving | 98 (71.5%) | 39 (28.5%) |
| Total (Category) | 579 (78.8%) | 156 (21.2%) |
| Total (Overall) | 2,950 (46.7%) | 3,366 (53.3%) |
Employment Industries by Sex in Monfort Heights
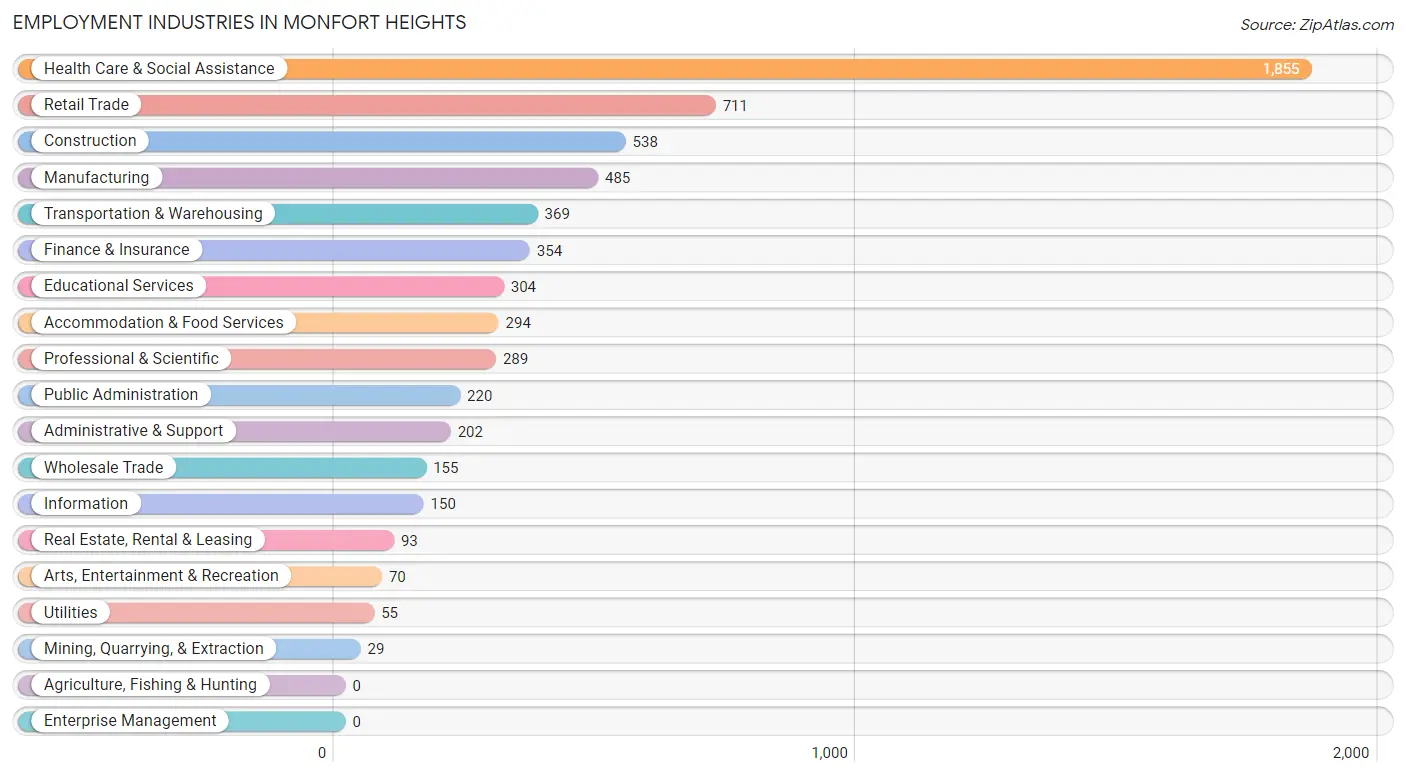
Employment Industries in Monfort Heights
The major employment industries in Monfort Heights include Health Care & Social Assistance (1,855 | 29.4%), Retail Trade (711 | 11.3%), Construction (538 | 8.5%), Manufacturing (485 | 7.7%), and Transportation & Warehousing (369 | 5.8%).
Employment Industries by Sex in Monfort Heights
The Monfort Heights industries that see more men than women are Mining, Quarrying, & Extraction (100.0%), Utilities (100.0%), and Construction (97.8%), whereas the industries that tend to have a higher number of women are Health Care & Social Assistance (81.1%), Educational Services (79.3%), and Public Administration (74.1%).
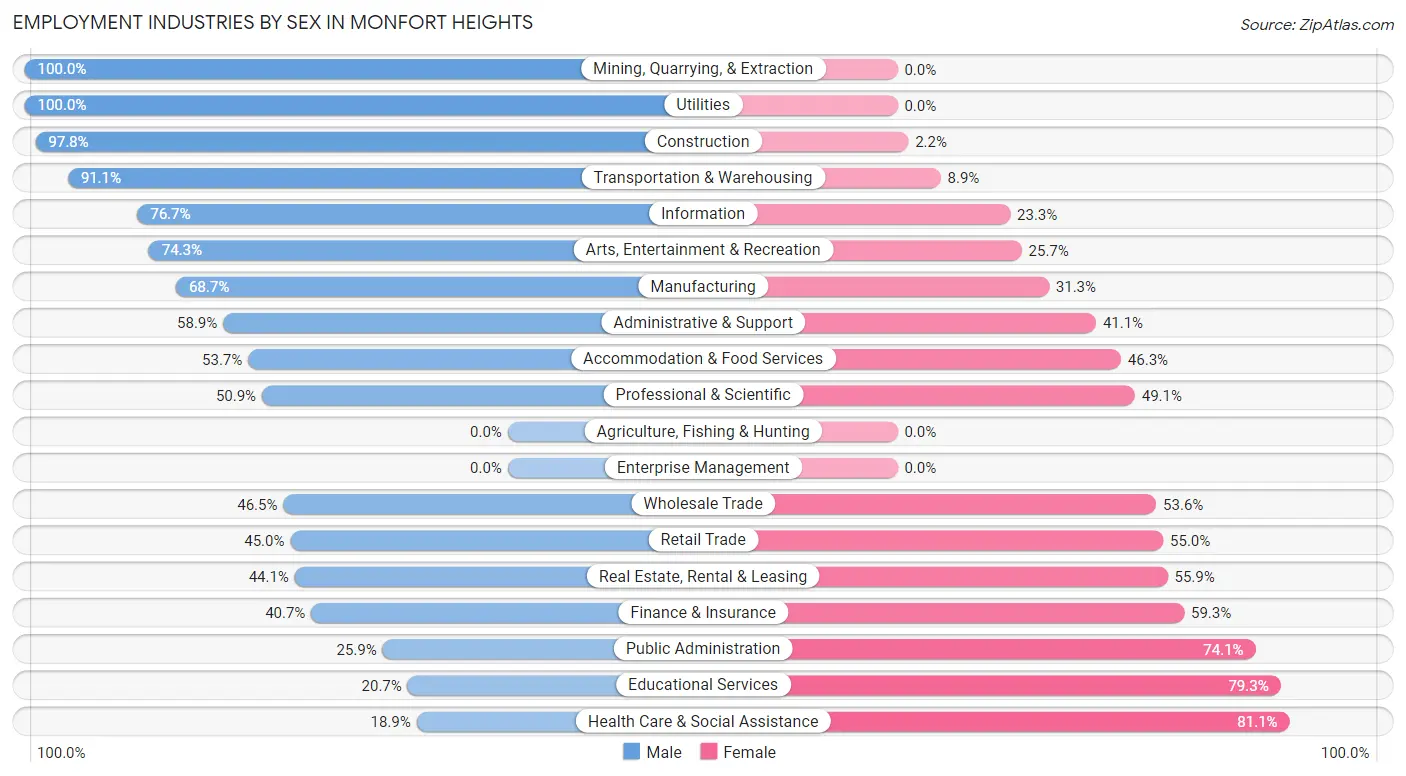
| Industry | Male | Female |
| Agriculture, Fishing & Hunting | 0 (0.0%) | 0 (0.0%) |
| Mining, Quarrying, & Extraction | 29 (100.0%) | 0 (0.0%) |
| Construction | 526 (97.8%) | 12 (2.2%) |
| Manufacturing | 333 (68.7%) | 152 (31.3%) |
| Wholesale Trade | 72 (46.5%) | 83 (53.5%) |
| Retail Trade | 320 (45.0%) | 391 (55.0%) |
| Transportation & Warehousing | 336 (91.1%) | 33 (8.9%) |
| Utilities | 55 (100.0%) | 0 (0.0%) |
| Information | 115 (76.7%) | 35 (23.3%) |
| Finance & Insurance | 144 (40.7%) | 210 (59.3%) |
| Real Estate, Rental & Leasing | 41 (44.1%) | 52 (55.9%) |
| Professional & Scientific | 147 (50.9%) | 142 (49.1%) |
| Enterprise Management | 0 (0.0%) | 0 (0.0%) |
| Administrative & Support | 119 (58.9%) | 83 (41.1%) |
| Educational Services | 63 (20.7%) | 241 (79.3%) |
| Health Care & Social Assistance | 350 (18.9%) | 1,505 (81.1%) |
| Arts, Entertainment & Recreation | 52 (74.3%) | 18 (25.7%) |
| Accommodation & Food Services | 158 (53.7%) | 136 (46.3%) |
| Public Administration | 57 (25.9%) | 163 (74.1%) |
| Total | 2,950 (46.7%) | 3,366 (53.3%) |
Education in Monfort Heights
School Enrollment in Monfort Heights
The most common levels of schooling among the 2,803 students in Monfort Heights are elementary school (957 | 34.1%), high school (603 | 21.5%), and college / undergraduate (400 | 14.3%).
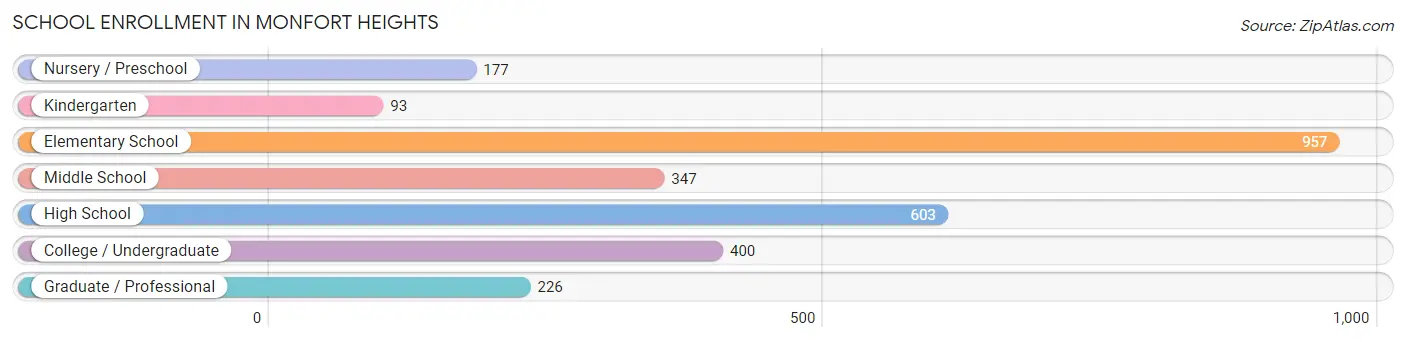
| School Level | # Students | % Students |
| Nursery / Preschool | 177 | 6.3% |
| Kindergarten | 93 | 3.3% |
| Elementary School | 957 | 34.1% |
| Middle School | 347 | 12.4% |
| High School | 603 | 21.5% |
| College / Undergraduate | 400 | 14.3% |
| Graduate / Professional | 226 | 8.1% |
| Total | 2,803 | 100.0% |
School Enrollment by Age by Funding Source in Monfort Heights
Out of a total of 2,803 students who are enrolled in schools in Monfort Heights, 1,261 (45.0%) attend a private institution, while the remaining 1,542 (55.0%) are enrolled in public schools. The age group of 35 years and over has the highest likelihood of being enrolled in private schools, with 66 (84.6% in the age bracket) enrolled. Conversely, the age group of 25 to 34 year olds has the lowest likelihood of being enrolled in a private school, with 184 (83.3% in the age bracket) attending a public institution.
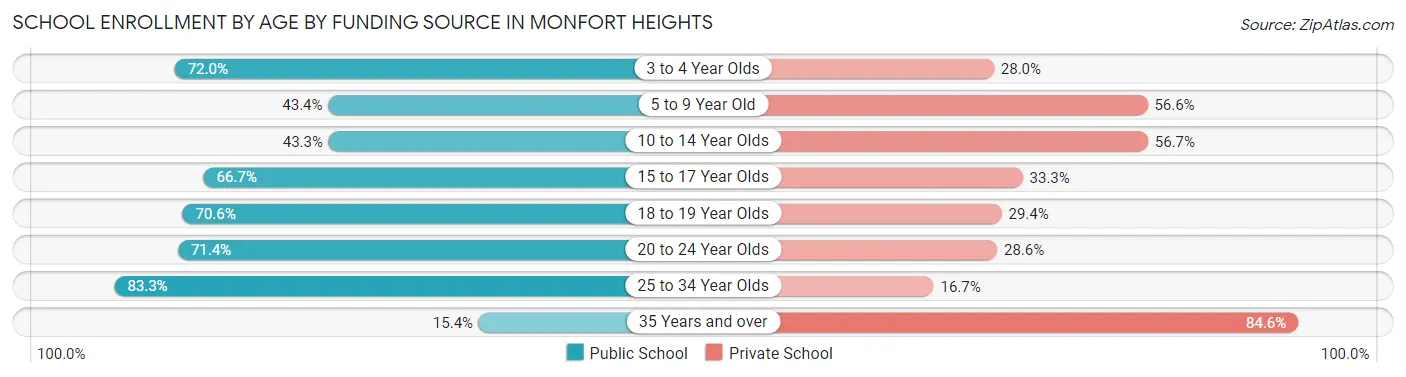
| Age Bracket | Public School | Private School |
| 3 to 4 Year Olds | 85 (72.0%) | 33 (28.0%) |
| 5 to 9 Year Old | 416 (43.4%) | 542 (56.6%) |
| 10 to 14 Year Olds | 231 (43.3%) | 302 (56.7%) |
| 15 to 17 Year Olds | 324 (66.7%) | 162 (33.3%) |
| 18 to 19 Year Olds | 180 (70.6%) | 75 (29.4%) |
| 20 to 24 Year Olds | 110 (71.4%) | 44 (28.6%) |
| 25 to 34 Year Olds | 184 (83.3%) | 37 (16.7%) |
| 35 Years and over | 12 (15.4%) | 66 (84.6%) |
| Total | 1,542 (55.0%) | 1,261 (45.0%) |
Educational Attainment by Field of Study in Monfort Heights
Business (1,004 | 24.9%), science & technology (765 | 19.0%), education (490 | 12.1%), bio, nature & agricultural (277 | 6.9%), and psychology (270 | 6.7%) are the most common fields of study among 4,038 individuals in Monfort Heights who have obtained a bachelor's degree or higher.
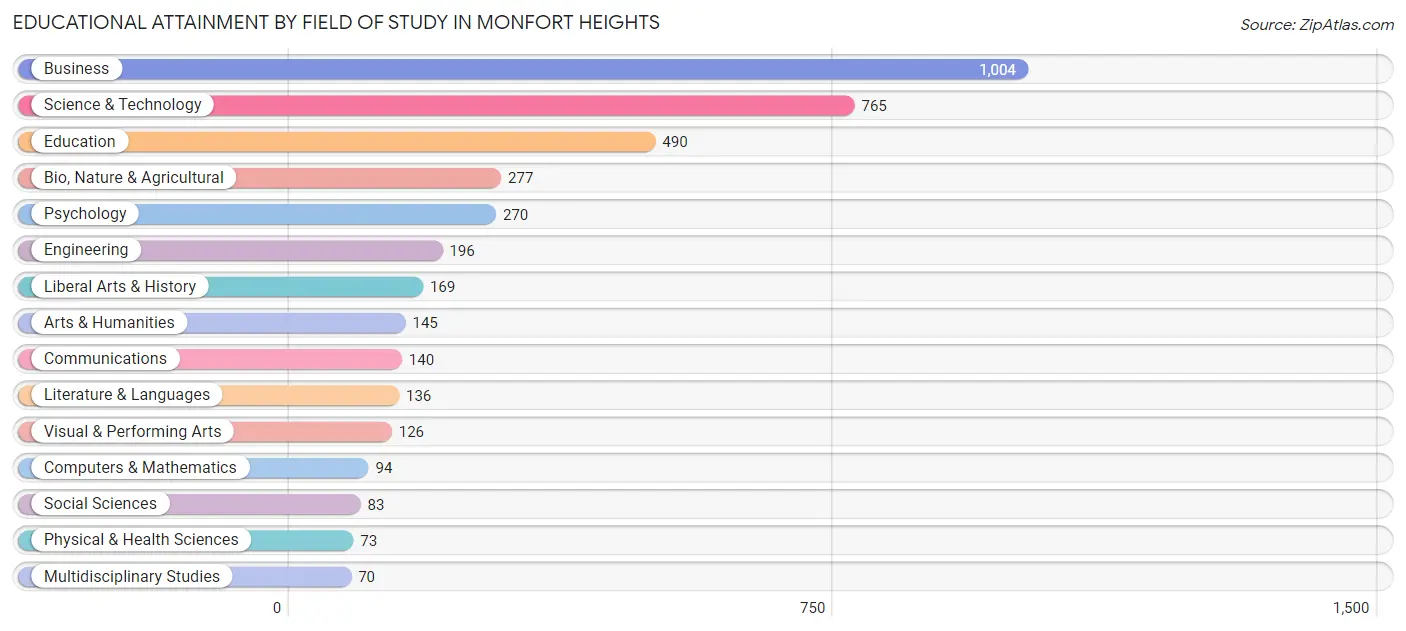
| Field of Study | # Graduates | % Graduates |
| Computers & Mathematics | 94 | 2.3% |
| Bio, Nature & Agricultural | 277 | 6.9% |
| Physical & Health Sciences | 73 | 1.8% |
| Psychology | 270 | 6.7% |
| Social Sciences | 83 | 2.1% |
| Engineering | 196 | 4.9% |
| Multidisciplinary Studies | 70 | 1.7% |
| Science & Technology | 765 | 19.0% |
| Business | 1,004 | 24.9% |
| Education | 490 | 12.1% |
| Literature & Languages | 136 | 3.4% |
| Liberal Arts & History | 169 | 4.2% |
| Visual & Performing Arts | 126 | 3.1% |
| Communications | 140 | 3.5% |
| Arts & Humanities | 145 | 3.6% |
| Total | 4,038 | 100.0% |
Transportation & Commute in Monfort Heights
Vehicle Availability by Sex in Monfort Heights
The most prevalent vehicle ownership categories in Monfort Heights are males with 2 vehicles (1,360, accounting for 47.0%) and females with 2 vehicles (1,317, making up 41.6%).
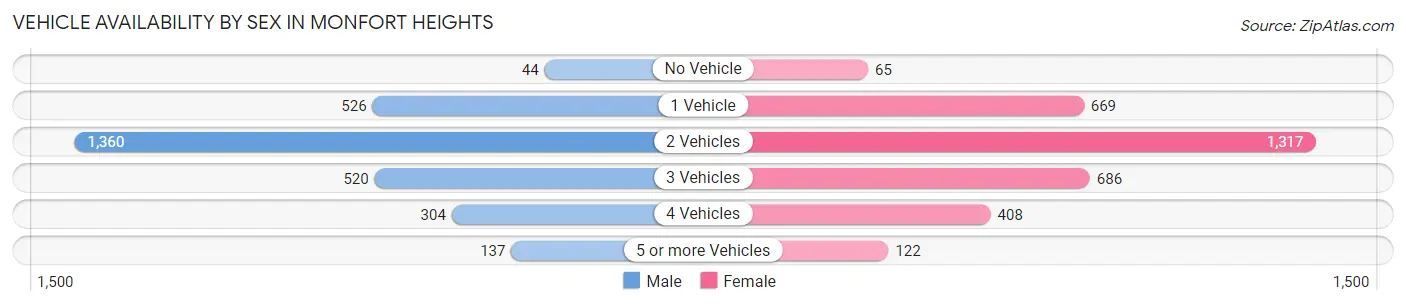
| Vehicles Available | Male | Female |
| No Vehicle | 44 (1.5%) | 65 (2.0%) |
| 1 Vehicle | 526 (18.2%) | 669 (20.5%) |
| 2 Vehicles | 1,360 (47.0%) | 1,317 (40.3%) |
| 3 Vehicles | 520 (18.0%) | 686 (21.0%) |
| 4 Vehicles | 304 (10.5%) | 408 (12.5%) |
| 5 or more Vehicles | 137 (4.7%) | 122 (3.7%) |
| Total | 2,891 (100.0%) | 3,267 (100.0%) |
Commute Time in Monfort Heights
The most frequently occuring commute durations in Monfort Heights are 20 to 24 minutes (1,192 commuters, 21.3%), 10 to 14 minutes (928 commuters, 16.6%), and 30 to 34 minutes (766 commuters, 13.7%).
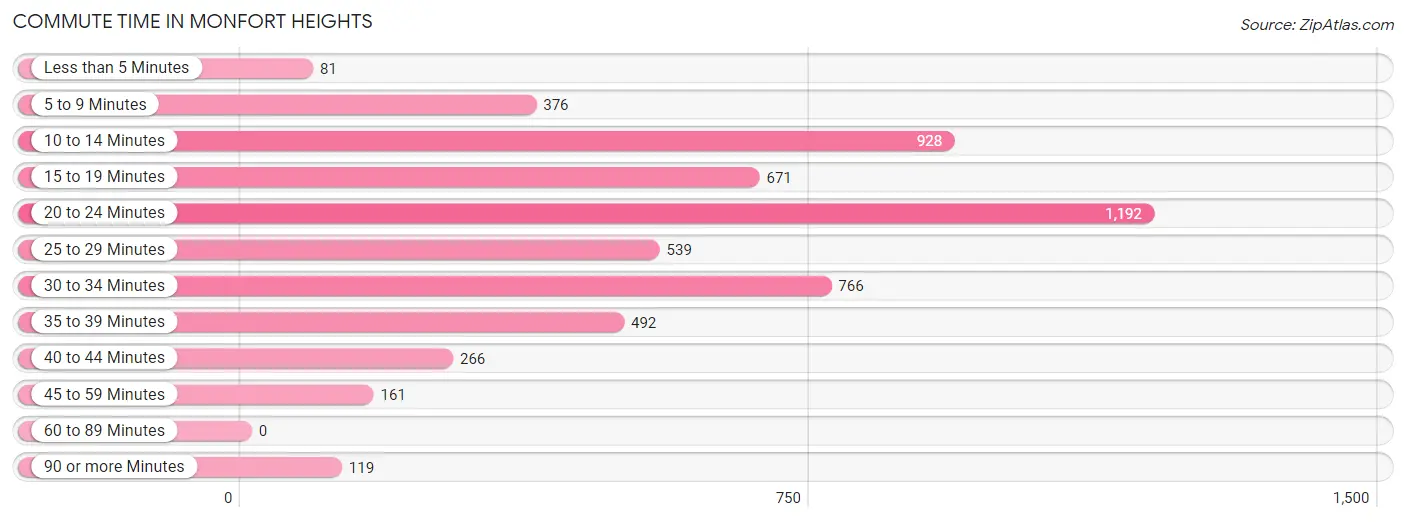
| Commute Time | # Commuters | % Commuters |
| Less than 5 Minutes | 81 | 1.5% |
| 5 to 9 Minutes | 376 | 6.7% |
| 10 to 14 Minutes | 928 | 16.6% |
| 15 to 19 Minutes | 671 | 12.0% |
| 20 to 24 Minutes | 1,192 | 21.3% |
| 25 to 29 Minutes | 539 | 9.6% |
| 30 to 34 Minutes | 766 | 13.7% |
| 35 to 39 Minutes | 492 | 8.8% |
| 40 to 44 Minutes | 266 | 4.8% |
| 45 to 59 Minutes | 161 | 2.9% |
| 60 to 89 Minutes | 0 | 0.0% |
| 90 or more Minutes | 119 | 2.1% |
Commute Time by Sex in Monfort Heights
The most common commute times in Monfort Heights are 20 to 24 minutes (635 commuters, 23.0%) for males and 20 to 24 minutes (557 commuters, 19.7%) for females.
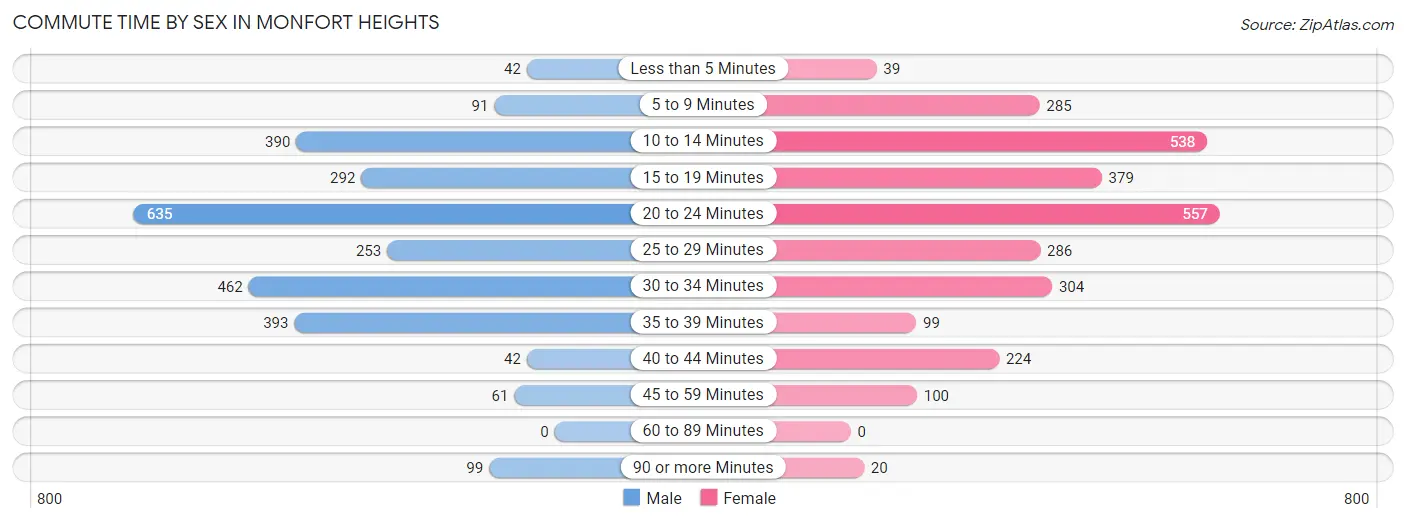
| Commute Time | Male | Female |
| Less than 5 Minutes | 42 (1.5%) | 39 (1.4%) |
| 5 to 9 Minutes | 91 (3.3%) | 285 (10.1%) |
| 10 to 14 Minutes | 390 (14.1%) | 538 (19.0%) |
| 15 to 19 Minutes | 292 (10.6%) | 379 (13.4%) |
| 20 to 24 Minutes | 635 (23.0%) | 557 (19.7%) |
| 25 to 29 Minutes | 253 (9.2%) | 286 (10.1%) |
| 30 to 34 Minutes | 462 (16.7%) | 304 (10.7%) |
| 35 to 39 Minutes | 393 (14.2%) | 99 (3.5%) |
| 40 to 44 Minutes | 42 (1.5%) | 224 (7.9%) |
| 45 to 59 Minutes | 61 (2.2%) | 100 (3.5%) |
| 60 to 89 Minutes | 0 (0.0%) | 0 (0.0%) |
| 90 or more Minutes | 99 (3.6%) | 20 (0.7%) |
Time of Departure to Work by Sex in Monfort Heights
The most frequent times of departure to work in Monfort Heights are 7:00 AM to 7:29 AM (558, 20.2%) for males and 7:00 AM to 7:29 AM (517, 18.3%) for females.
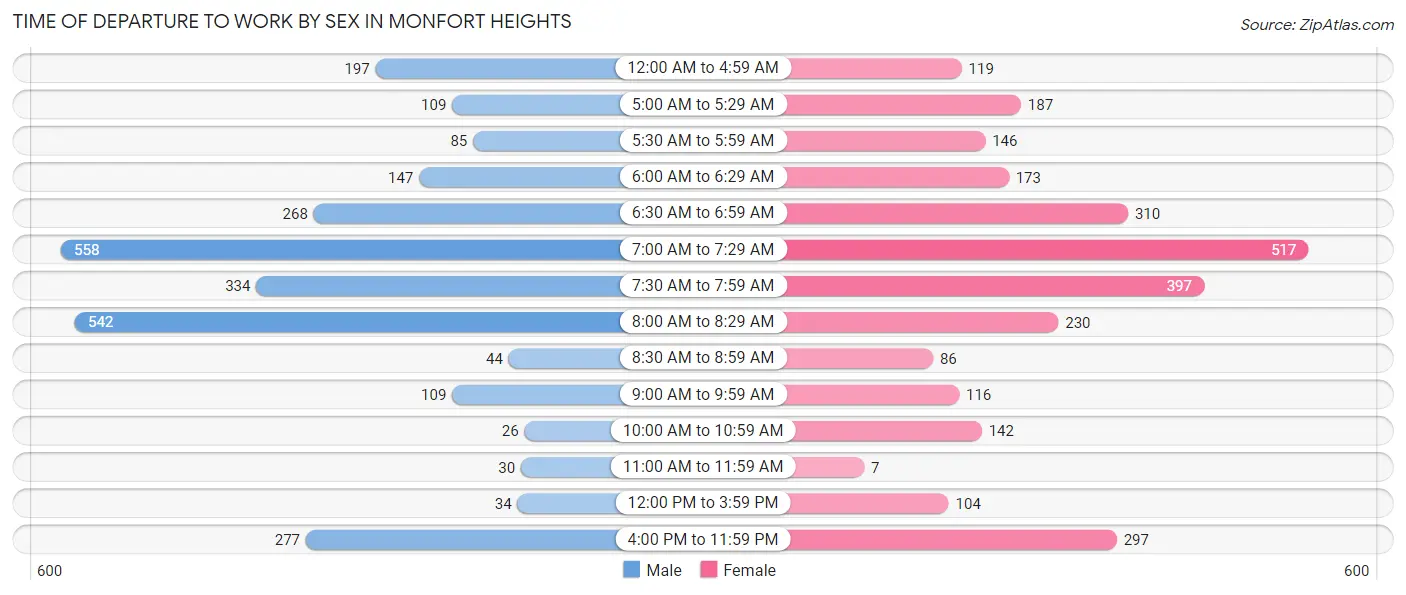
| Time of Departure | Male | Female |
| 12:00 AM to 4:59 AM | 197 (7.1%) | 119 (4.2%) |
| 5:00 AM to 5:29 AM | 109 (4.0%) | 187 (6.6%) |
| 5:30 AM to 5:59 AM | 85 (3.1%) | 146 (5.2%) |
| 6:00 AM to 6:29 AM | 147 (5.3%) | 173 (6.1%) |
| 6:30 AM to 6:59 AM | 268 (9.7%) | 310 (11.0%) |
| 7:00 AM to 7:29 AM | 558 (20.2%) | 517 (18.3%) |
| 7:30 AM to 7:59 AM | 334 (12.1%) | 397 (14.0%) |
| 8:00 AM to 8:29 AM | 542 (19.6%) | 230 (8.1%) |
| 8:30 AM to 8:59 AM | 44 (1.6%) | 86 (3.0%) |
| 9:00 AM to 9:59 AM | 109 (4.0%) | 116 (4.1%) |
| 10:00 AM to 10:59 AM | 26 (0.9%) | 142 (5.0%) |
| 11:00 AM to 11:59 AM | 30 (1.1%) | 7 (0.3%) |
| 12:00 PM to 3:59 PM | 34 (1.2%) | 104 (3.7%) |
| 4:00 PM to 11:59 PM | 277 (10.0%) | 297 (10.5%) |
| Total | 2,760 (100.0%) | 2,831 (100.0%) |
Housing Occupancy in Monfort Heights
Occupancy by Ownership in Monfort Heights
Of the total 4,902 dwellings in Monfort Heights, owner-occupied units account for 3,863 (78.8%), while renter-occupied units make up 1,039 (21.2%).
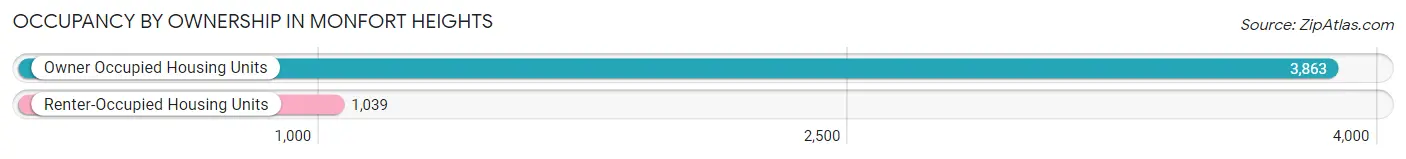
| Occupancy | # Housing Units | % Housing Units |
| Owner Occupied Housing Units | 3,863 | 78.8% |
| Renter-Occupied Housing Units | 1,039 | 21.2% |
| Total Occupied Housing Units | 4,902 | 100.0% |
Occupancy by Household Size in Monfort Heights
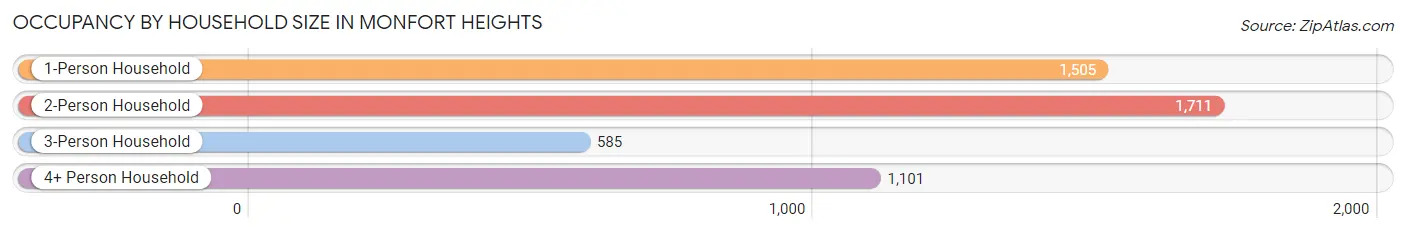
| Household Size | # Housing Units | % Housing Units |
| 1-Person Household | 1,505 | 30.7% |
| 2-Person Household | 1,711 | 34.9% |
| 3-Person Household | 585 | 11.9% |
| 4+ Person Household | 1,101 | 22.5% |
| Total Housing Units | 4,902 | 100.0% |
Occupancy by Ownership by Household Size in Monfort Heights
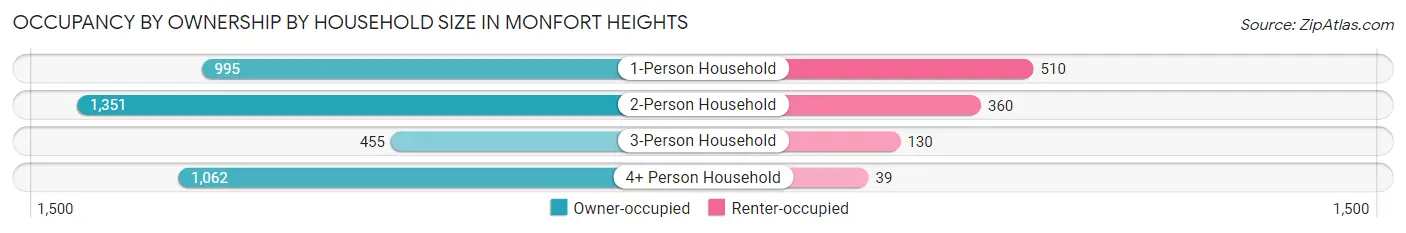
| Household Size | Owner-occupied | Renter-occupied |
| 1-Person Household | 995 (66.1%) | 510 (33.9%) |
| 2-Person Household | 1,351 (79.0%) | 360 (21.0%) |
| 3-Person Household | 455 (77.8%) | 130 (22.2%) |
| 4+ Person Household | 1,062 (96.5%) | 39 (3.5%) |
| Total Housing Units | 3,863 (78.8%) | 1,039 (21.2%) |
Occupancy by Educational Attainment in Monfort Heights
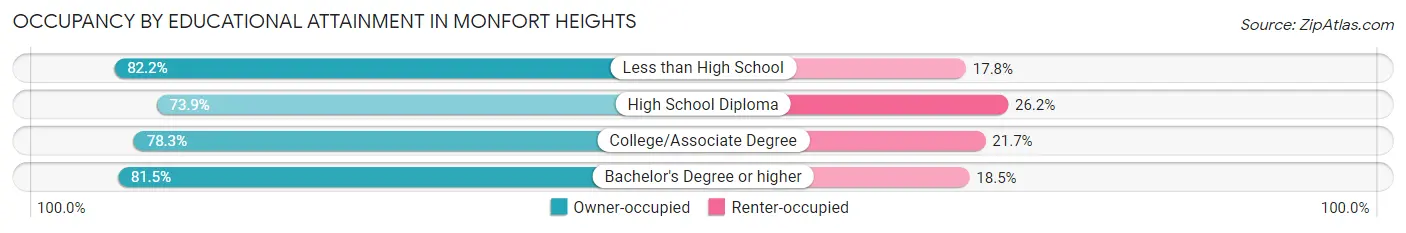
| Household Size | Owner-occupied | Renter-occupied |
| Less than High School | 74 (82.2%) | 16 (17.8%) |
| High School Diploma | 912 (73.9%) | 323 (26.2%) |
| College/Associate Degree | 951 (78.3%) | 263 (21.7%) |
| Bachelor's Degree or higher | 1,926 (81.5%) | 437 (18.5%) |
Occupancy by Age of Householder in Monfort Heights
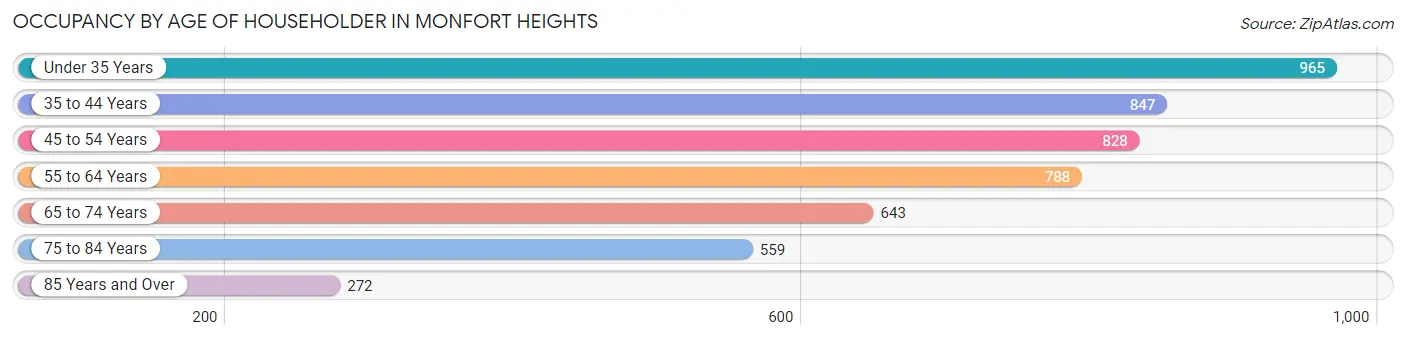
| Age Bracket | # Households | % Households |
| Under 35 Years | 965 | 19.7% |
| 35 to 44 Years | 847 | 17.3% |
| 45 to 54 Years | 828 | 16.9% |
| 55 to 64 Years | 788 | 16.1% |
| 65 to 74 Years | 643 | 13.1% |
| 75 to 84 Years | 559 | 11.4% |
| 85 Years and Over | 272 | 5.6% |
| Total | 4,902 | 100.0% |
Housing Finances in Monfort Heights
Median Income by Occupancy in Monfort Heights
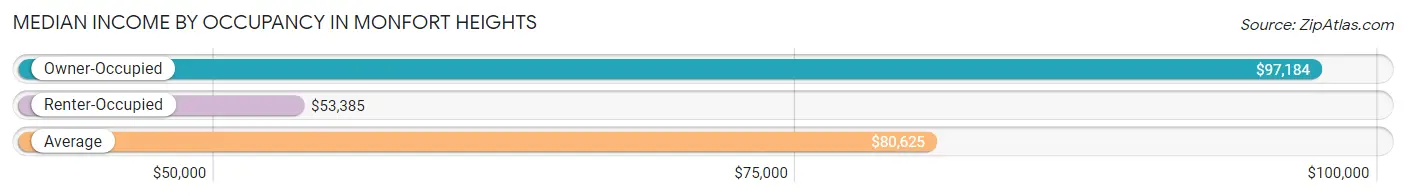
| Occupancy Type | # Households | Median Income |
| Owner-Occupied | 3,863 (78.8%) | $97,184 |
| Renter-Occupied | 1,039 (21.2%) | $53,385 |
| Average | 4,902 (100.0%) | $80,625 |
Occupancy by Householder Income Bracket in Monfort Heights
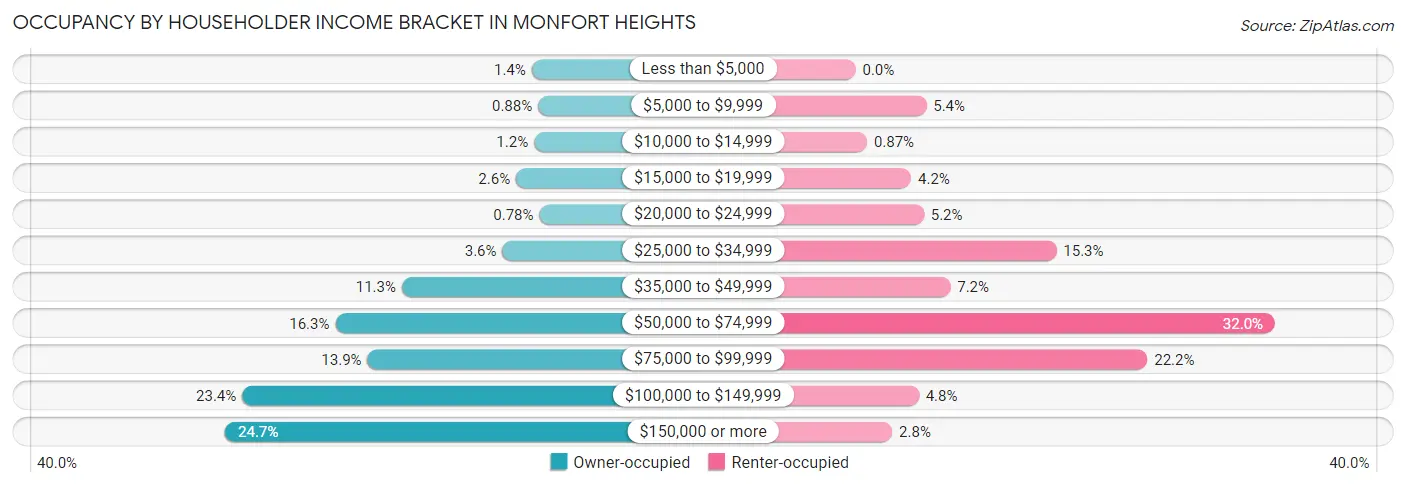
| Income Bracket | Owner-occupied | Renter-occupied |
| Less than $5,000 | 53 (1.4%) | 0 (0.0%) |
| $5,000 to $9,999 | 34 (0.9%) | 56 (5.4%) |
| $10,000 to $14,999 | 46 (1.2%) | 9 (0.9%) |
| $15,000 to $19,999 | 99 (2.6%) | 44 (4.2%) |
| $20,000 to $24,999 | 30 (0.8%) | 54 (5.2%) |
| $25,000 to $34,999 | 139 (3.6%) | 159 (15.3%) |
| $35,000 to $49,999 | 435 (11.3%) | 75 (7.2%) |
| $50,000 to $74,999 | 631 (16.3%) | 332 (32.0%) |
| $75,000 to $99,999 | 536 (13.9%) | 231 (22.2%) |
| $100,000 to $149,999 | 905 (23.4%) | 50 (4.8%) |
| $150,000 or more | 955 (24.7%) | 29 (2.8%) |
| Total | 3,863 (100.0%) | 1,039 (100.0%) |
Monthly Housing Cost Tiers in Monfort Heights
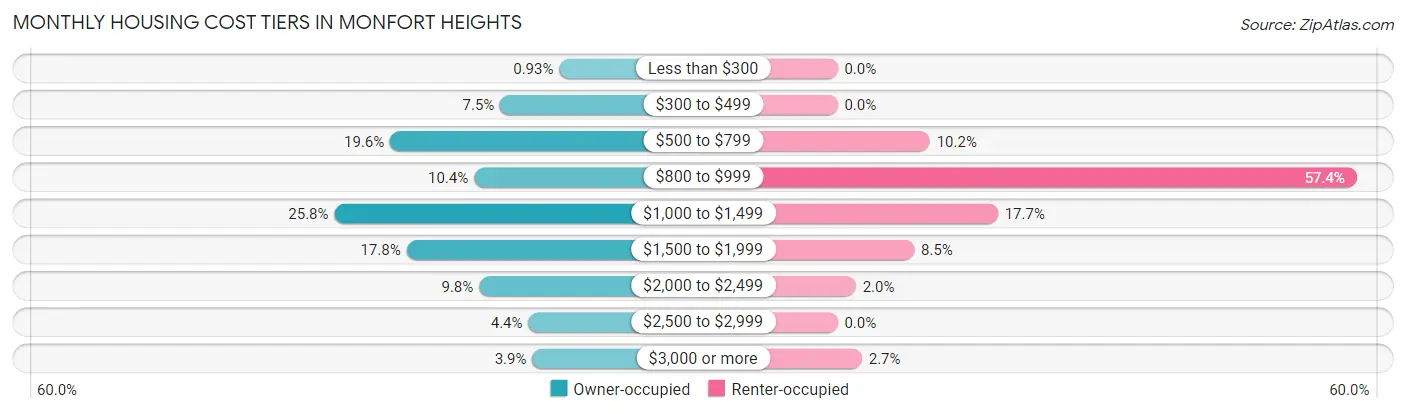
| Monthly Cost | Owner-occupied | Renter-occupied |
| Less than $300 | 36 (0.9%) | 0 (0.0%) |
| $300 to $499 | 288 (7.5%) | 0 (0.0%) |
| $500 to $799 | 758 (19.6%) | 106 (10.2%) |
| $800 to $999 | 400 (10.3%) | 596 (57.4%) |
| $1,000 to $1,499 | 996 (25.8%) | 184 (17.7%) |
| $1,500 to $1,999 | 688 (17.8%) | 88 (8.5%) |
| $2,000 to $2,499 | 378 (9.8%) | 21 (2.0%) |
| $2,500 to $2,999 | 168 (4.3%) | 0 (0.0%) |
| $3,000 or more | 151 (3.9%) | 28 (2.7%) |
| Total | 3,863 (100.0%) | 1,039 (100.0%) |
Physical Housing Characteristics in Monfort Heights
Housing Structures in Monfort Heights
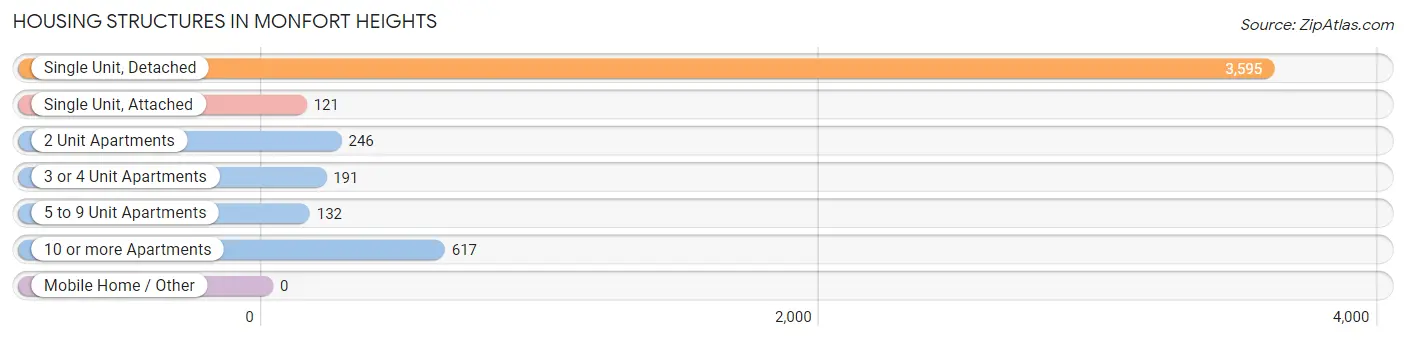
| Structure Type | # Housing Units | % Housing Units |
| Single Unit, Detached | 3,595 | 73.3% |
| Single Unit, Attached | 121 | 2.5% |
| 2 Unit Apartments | 246 | 5.0% |
| 3 or 4 Unit Apartments | 191 | 3.9% |
| 5 to 9 Unit Apartments | 132 | 2.7% |
| 10 or more Apartments | 617 | 12.6% |
| Mobile Home / Other | 0 | 0.0% |
| Total | 4,902 | 100.0% |
Housing Structures by Occupancy in Monfort Heights
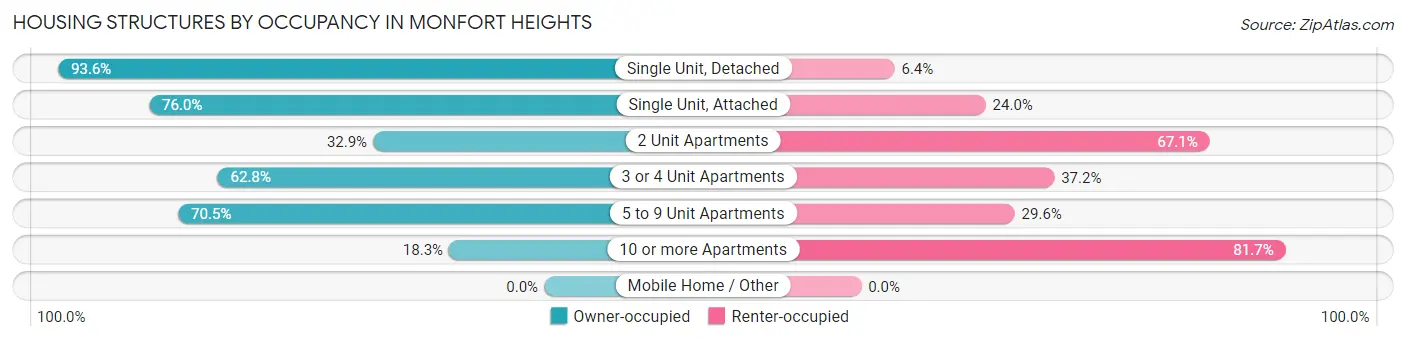
| Structure Type | Owner-occupied | Renter-occupied |
| Single Unit, Detached | 3,364 (93.6%) | 231 (6.4%) |
| Single Unit, Attached | 92 (76.0%) | 29 (24.0%) |
| 2 Unit Apartments | 81 (32.9%) | 165 (67.1%) |
| 3 or 4 Unit Apartments | 120 (62.8%) | 71 (37.2%) |
| 5 to 9 Unit Apartments | 93 (70.5%) | 39 (29.5%) |
| 10 or more Apartments | 113 (18.3%) | 504 (81.7%) |
| Mobile Home / Other | 0 (0.0%) | 0 (0.0%) |
| Total | 3,863 (78.8%) | 1,039 (21.2%) |
Housing Structures by Number of Rooms in Monfort Heights
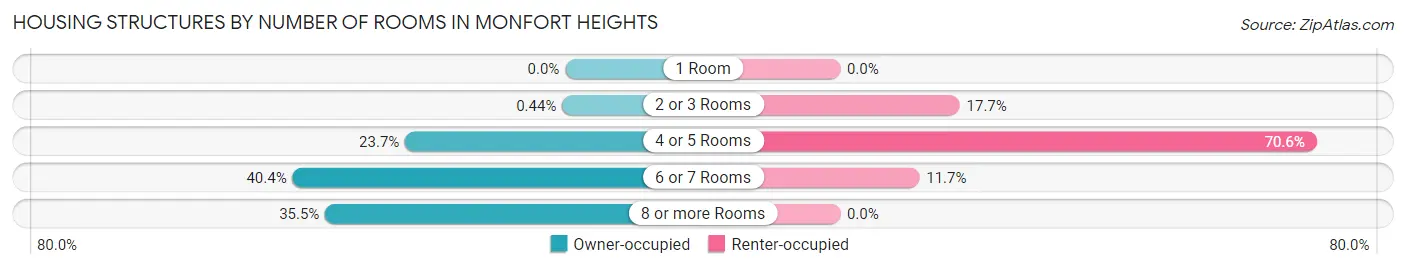
| Number of Rooms | Owner-occupied | Renter-occupied |
| 1 Room | 0 (0.0%) | 0 (0.0%) |
| 2 or 3 Rooms | 17 (0.4%) | 184 (17.7%) |
| 4 or 5 Rooms | 915 (23.7%) | 733 (70.6%) |
| 6 or 7 Rooms | 1,559 (40.4%) | 122 (11.7%) |
| 8 or more Rooms | 1,372 (35.5%) | 0 (0.0%) |
| Total | 3,863 (100.0%) | 1,039 (100.0%) |
Housing Structure by Heating Type in Monfort Heights
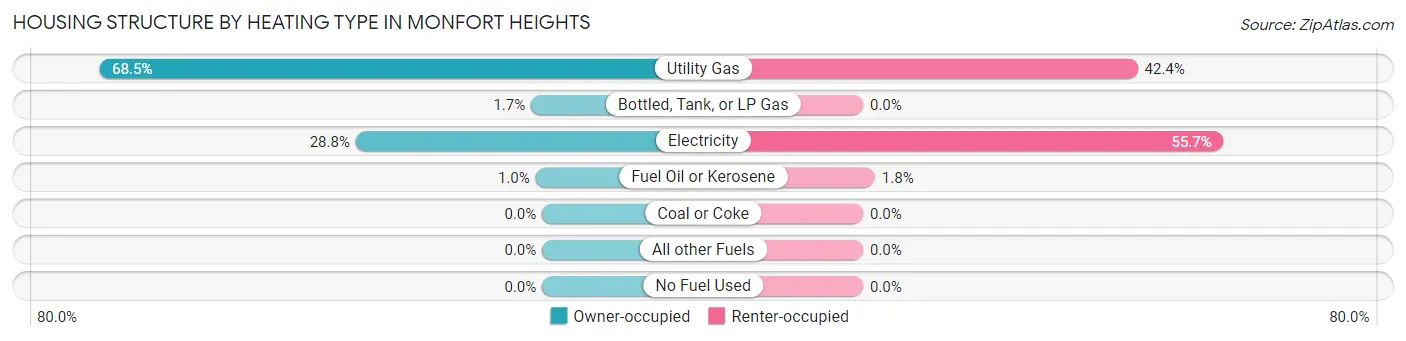
| Heating Type | Owner-occupied | Renter-occupied |
| Utility Gas | 2,645 (68.5%) | 441 (42.4%) |
| Bottled, Tank, or LP Gas | 66 (1.7%) | 0 (0.0%) |
| Electricity | 1,113 (28.8%) | 579 (55.7%) |
| Fuel Oil or Kerosene | 39 (1.0%) | 19 (1.8%) |
| Coal or Coke | 0 (0.0%) | 0 (0.0%) |
| All other Fuels | 0 (0.0%) | 0 (0.0%) |
| No Fuel Used | 0 (0.0%) | 0 (0.0%) |
| Total | 3,863 (100.0%) | 1,039 (100.0%) |
Household Vehicle Usage in Monfort Heights
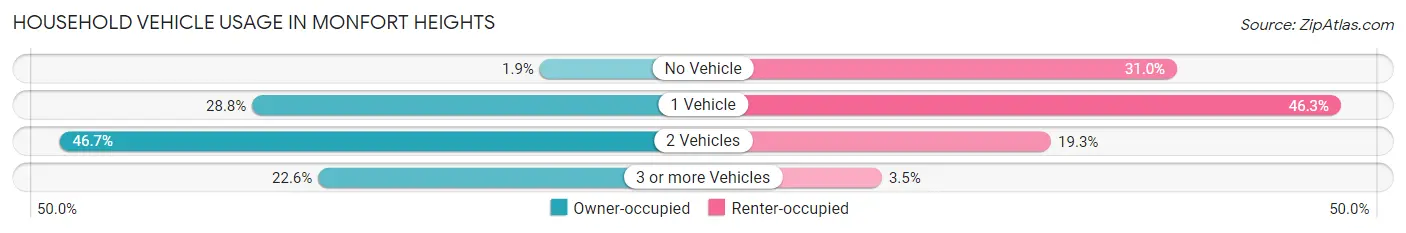
| Vehicles per Household | Owner-occupied | Renter-occupied |
| No Vehicle | 74 (1.9%) | 322 (31.0%) |
| 1 Vehicle | 1,111 (28.8%) | 481 (46.3%) |
| 2 Vehicles | 1,805 (46.7%) | 200 (19.3%) |
| 3 or more Vehicles | 873 (22.6%) | 36 (3.5%) |
| Total | 3,863 (100.0%) | 1,039 (100.0%) |
Real Estate & Mortgages in Monfort Heights
Real Estate and Mortgage Overview in Monfort Heights
| Characteristic | Without Mortgage | With Mortgage |
| Housing Units | 1,246 | 2,617 |
| Median Property Value | $179,800 | $196,400 |
| Median Household Income | $64,833 | $814 |
| Monthly Housing Costs | $630 | $151 |
| Real Estate Taxes | $3,086 | $27 |
Property Value by Mortgage Status in Monfort Heights
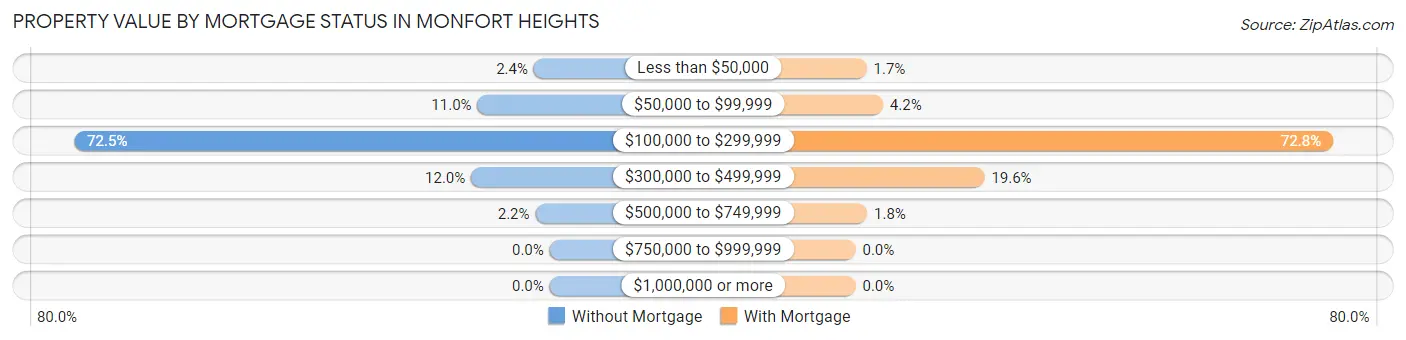
| Property Value | Without Mortgage | With Mortgage |
| Less than $50,000 | 30 (2.4%) | 44 (1.7%) |
| $50,000 to $99,999 | 137 (11.0%) | 109 (4.2%) |
| $100,000 to $299,999 | 903 (72.5%) | 1,904 (72.8%) |
| $300,000 to $499,999 | 149 (12.0%) | 514 (19.6%) |
| $500,000 to $749,999 | 27 (2.2%) | 46 (1.8%) |
| $750,000 to $999,999 | 0 (0.0%) | 0 (0.0%) |
| $1,000,000 or more | 0 (0.0%) | 0 (0.0%) |
| Total | 1,246 (100.0%) | 2,617 (100.0%) |
Household Income by Mortgage Status in Monfort Heights
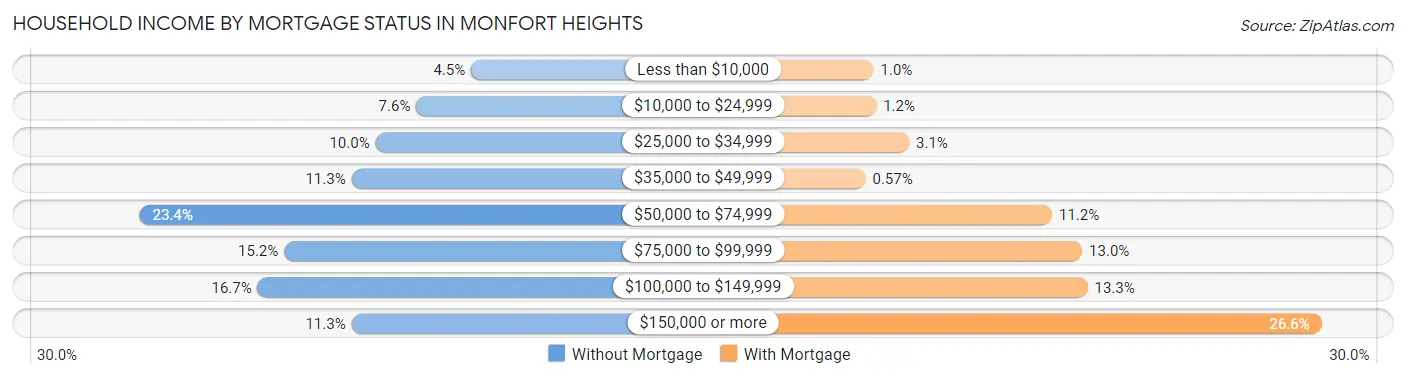
| Household Income | Without Mortgage | With Mortgage |
| Less than $10,000 | 56 (4.5%) | 27 (1.0%) |
| $10,000 to $24,999 | 95 (7.6%) | 31 (1.2%) |
| $25,000 to $34,999 | 124 (10.0%) | 80 (3.1%) |
| $35,000 to $49,999 | 141 (11.3%) | 15 (0.6%) |
| $50,000 to $74,999 | 292 (23.4%) | 294 (11.2%) |
| $75,000 to $99,999 | 189 (15.2%) | 339 (13.0%) |
| $100,000 to $149,999 | 208 (16.7%) | 347 (13.3%) |
| $150,000 or more | 141 (11.3%) | 697 (26.6%) |
| Total | 1,246 (100.0%) | 2,617 (100.0%) |
Property Value to Household Income Ratio in Monfort Heights
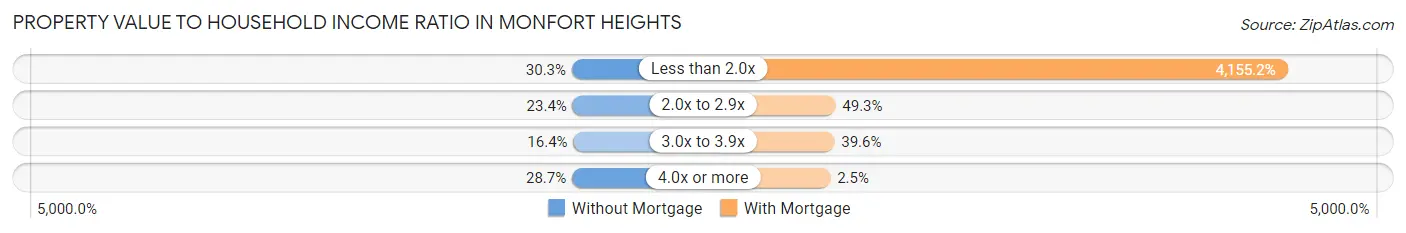
| Value-to-Income Ratio | Without Mortgage | With Mortgage |
| Less than 2.0x | 378 (30.3%) | 108,741 (4,155.2%) |
| 2.0x to 2.9x | 291 (23.4%) | 1,289 (49.2%) |
| 3.0x to 3.9x | 204 (16.4%) | 1,036 (39.6%) |
| 4.0x or more | 358 (28.7%) | 64 (2.5%) |
| Total | 1,246 (100.0%) | 2,617 (100.0%) |
Real Estate Taxes by Mortgage Status in Monfort Heights
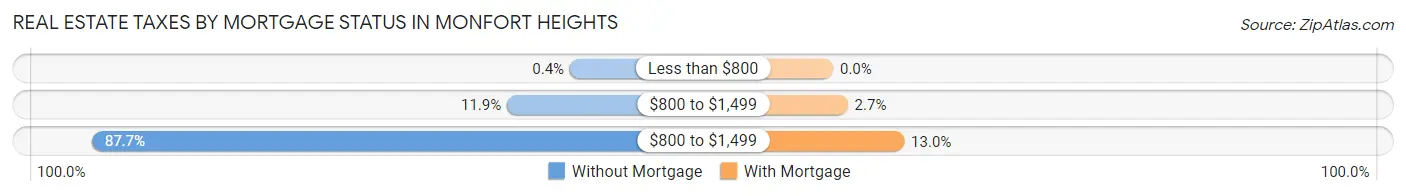
| Property Taxes | Without Mortgage | With Mortgage |
| Less than $800 | 5 (0.4%) | 0 (0.0%) |
| $800 to $1,499 | 148 (11.9%) | 70 (2.7%) |
| $800 to $1,499 | 1,093 (87.7%) | 340 (13.0%) |
| Total | 1,246 (100.0%) | 2,617 (100.0%) |
Health & Disability in Monfort Heights
Health Insurance Coverage by Age in Monfort Heights
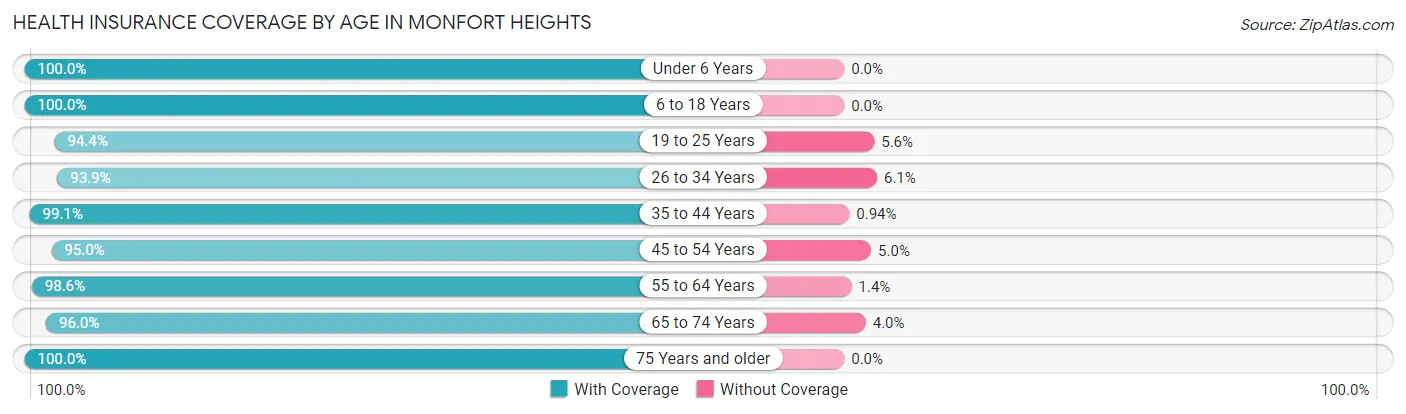
| Age Bracket | With Coverage | Without Coverage |
| Under 6 Years | 1,008 (100.0%) | 0 (0.0%) |
| 6 to 18 Years | 2,086 (100.0%) | 0 (0.0%) |
| 19 to 25 Years | 845 (94.4%) | 50 (5.6%) |
| 26 to 34 Years | 1,537 (93.9%) | 100 (6.1%) |
| 35 to 44 Years | 1,477 (99.1%) | 14 (0.9%) |
| 45 to 54 Years | 1,402 (95.0%) | 74 (5.0%) |
| 55 to 64 Years | 1,234 (98.6%) | 17 (1.4%) |
| 65 to 74 Years | 958 (96.0%) | 40 (4.0%) |
| 75 Years and older | 1,066 (100.0%) | 0 (0.0%) |
| Total | 11,613 (97.5%) | 295 (2.5%) |
Health Insurance Coverage by Citizenship Status in Monfort Heights
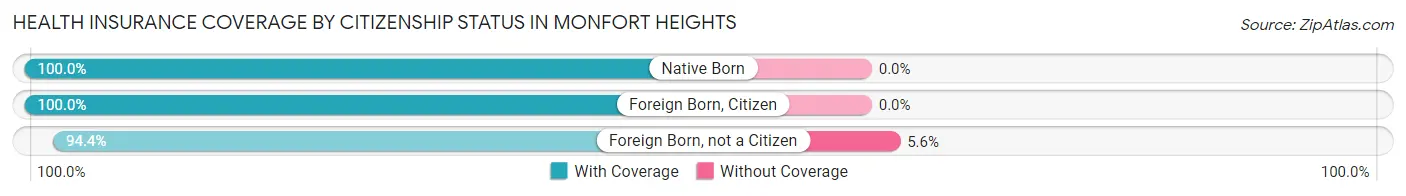
| Citizenship Status | With Coverage | Without Coverage |
| Native Born | 1,008 (100.0%) | 0 (0.0%) |
| Foreign Born, Citizen | 2,086 (100.0%) | 0 (0.0%) |
| Foreign Born, not a Citizen | 845 (94.4%) | 50 (5.6%) |
Health Insurance Coverage by Household Income in Monfort Heights
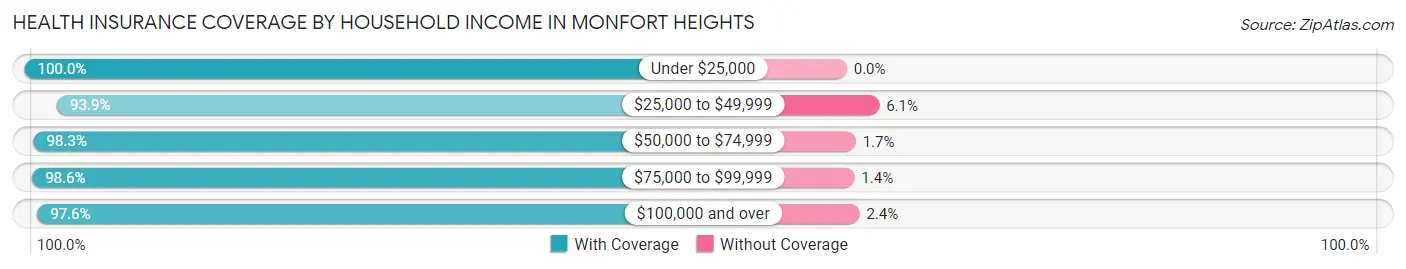
| Household Income | With Coverage | Without Coverage |
| Under $25,000 | 514 (100.0%) | 0 (0.0%) |
| $25,000 to $49,999 | 1,329 (93.9%) | 86 (6.1%) |
| $50,000 to $74,999 | 1,825 (98.3%) | 31 (1.7%) |
| $75,000 to $99,999 | 1,580 (98.6%) | 23 (1.4%) |
| $100,000 and over | 6,344 (97.6%) | 155 (2.4%) |
Public vs Private Health Insurance Coverage by Age in Monfort Heights
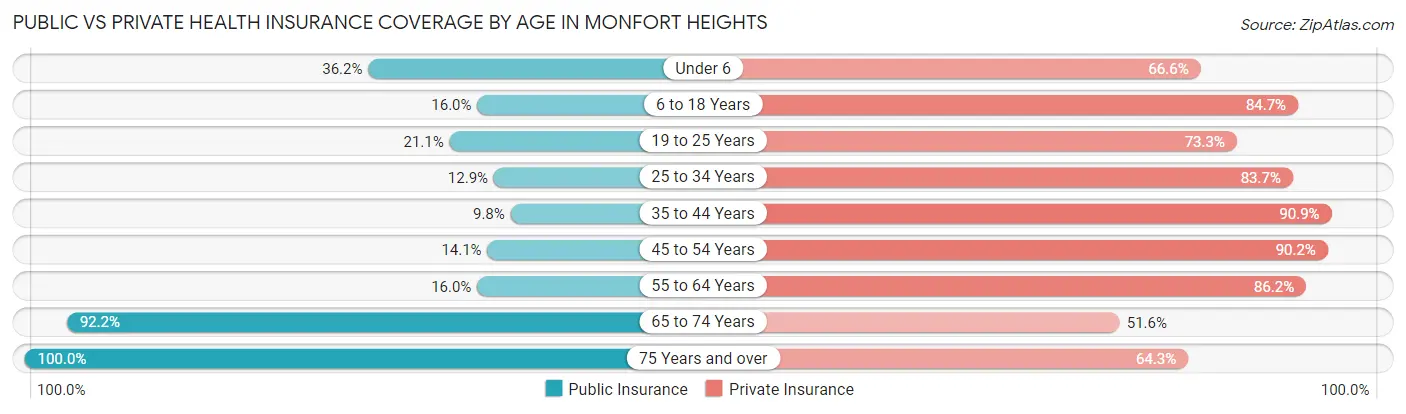
| Age Bracket | Public Insurance | Private Insurance |
| Under 6 | 365 (36.2%) | 671 (66.6%) |
| 6 to 18 Years | 333 (16.0%) | 1,766 (84.7%) |
| 19 to 25 Years | 189 (21.1%) | 656 (73.3%) |
| 25 to 34 Years | 211 (12.9%) | 1,370 (83.7%) |
| 35 to 44 Years | 146 (9.8%) | 1,355 (90.9%) |
| 45 to 54 Years | 208 (14.1%) | 1,331 (90.2%) |
| 55 to 64 Years | 200 (16.0%) | 1,078 (86.2%) |
| 65 to 74 Years | 920 (92.2%) | 515 (51.6%) |
| 75 Years and over | 1,066 (100.0%) | 685 (64.3%) |
| Total | 3,638 (30.5%) | 9,427 (79.2%) |
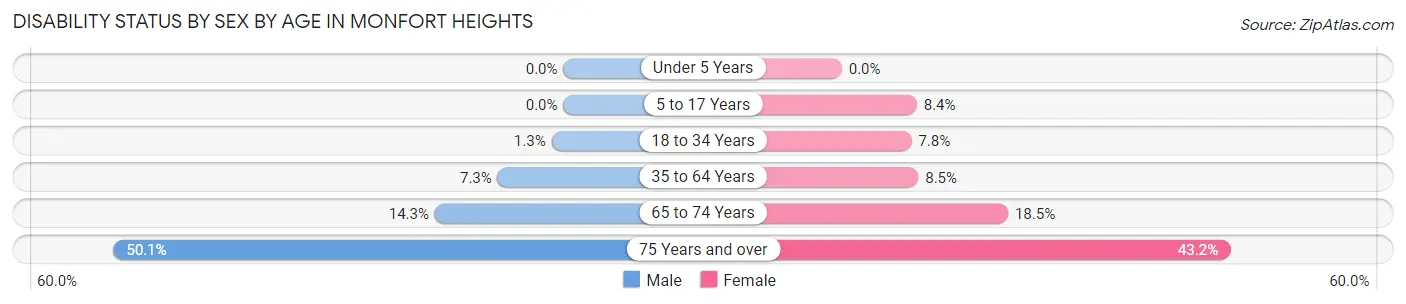
Disability Status by Sex by Age in Monfort Heights
| Age Bracket | Male | Female |
| Under 5 Years | 0 (0.0%) | 0 (0.0%) |
| 5 to 17 Years | 0 (0.0%) | 113 (8.4%) |
| 18 to 34 Years | 15 (1.3%) | 116 (7.8%) |
| 35 to 64 Years | 149 (7.3%) | 186 (8.5%) |
| 65 to 74 Years | 64 (14.3%) | 102 (18.5%) |
| 75 Years and over | 212 (50.1%) | 278 (43.2%) |
Disability Class by Sex by Age in Monfort Heights
Disability Class: Hearing Difficulty
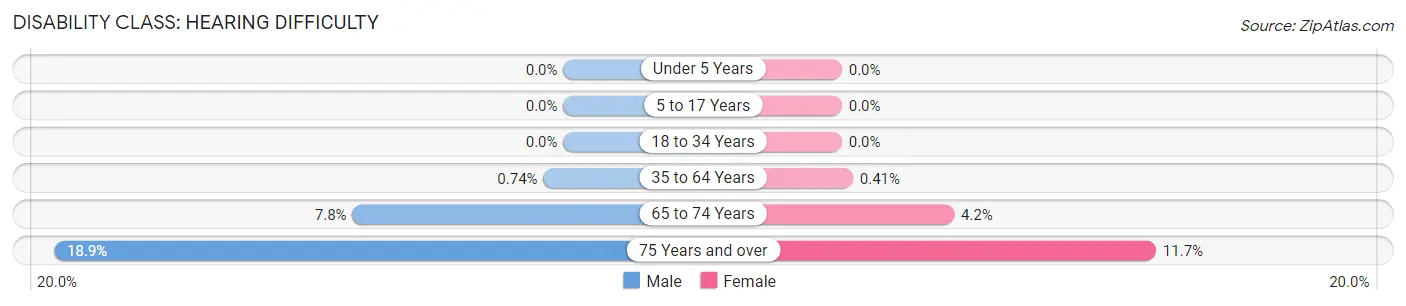
| Age Bracket | Male | Female |
| Under 5 Years | 0 (0.0%) | 0 (0.0%) |
| 5 to 17 Years | 0 (0.0%) | 0 (0.0%) |
| 18 to 34 Years | 0 (0.0%) | 0 (0.0%) |
| 35 to 64 Years | 15 (0.7%) | 9 (0.4%) |
| 65 to 74 Years | 35 (7.8%) | 23 (4.2%) |
| 75 Years and over | 80 (18.9%) | 75 (11.7%) |
Disability Class: Vision Difficulty
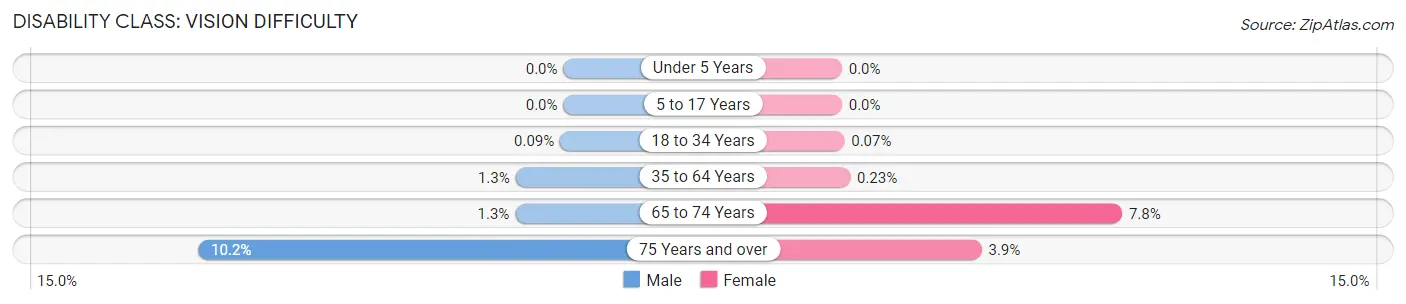
| Age Bracket | Male | Female |
| Under 5 Years | 0 (0.0%) | 0 (0.0%) |
| 5 to 17 Years | 0 (0.0%) | 0 (0.0%) |
| 18 to 34 Years | 1 (0.1%) | 1 (0.1%) |
| 35 to 64 Years | 27 (1.3%) | 5 (0.2%) |
| 65 to 74 Years | 6 (1.3%) | 43 (7.8%) |
| 75 Years and over | 43 (10.2%) | 25 (3.9%) |
Disability Class: Cognitive Difficulty
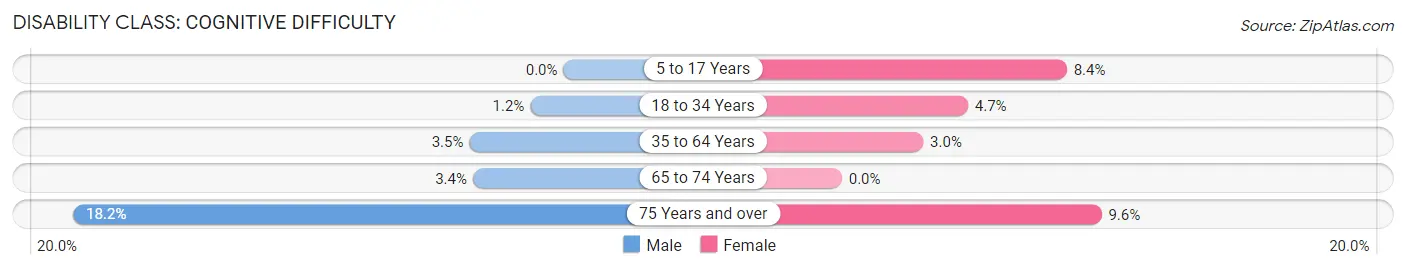
| Age Bracket | Male | Female |
| 5 to 17 Years | 0 (0.0%) | 113 (8.4%) |
| 18 to 34 Years | 14 (1.2%) | 70 (4.7%) |
| 35 to 64 Years | 71 (3.5%) | 66 (3.0%) |
| 65 to 74 Years | 15 (3.4%) | 0 (0.0%) |
| 75 Years and over | 77 (18.2%) | 62 (9.6%) |
Disability Class: Ambulatory Difficulty
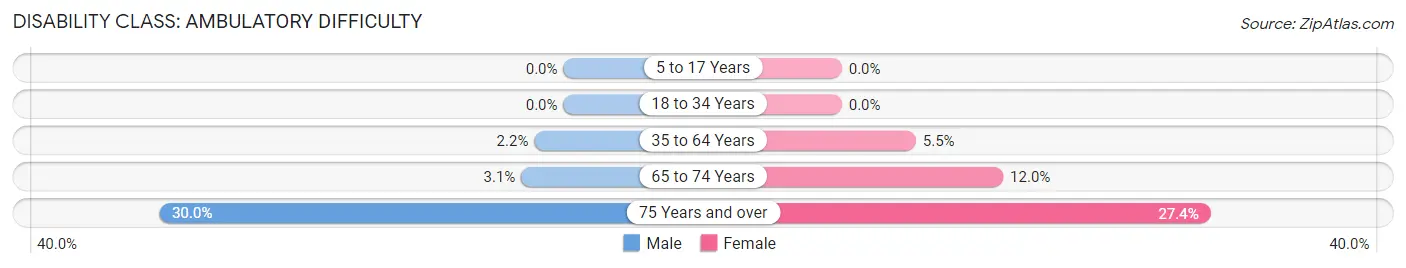
| Age Bracket | Male | Female |
| 5 to 17 Years | 0 (0.0%) | 0 (0.0%) |
| 18 to 34 Years | 0 (0.0%) | 0 (0.0%) |
| 35 to 64 Years | 44 (2.2%) | 120 (5.5%) |
| 65 to 74 Years | 14 (3.1%) | 66 (12.0%) |
| 75 Years and over | 127 (30.0%) | 176 (27.4%) |
Disability Class: Self-Care Difficulty
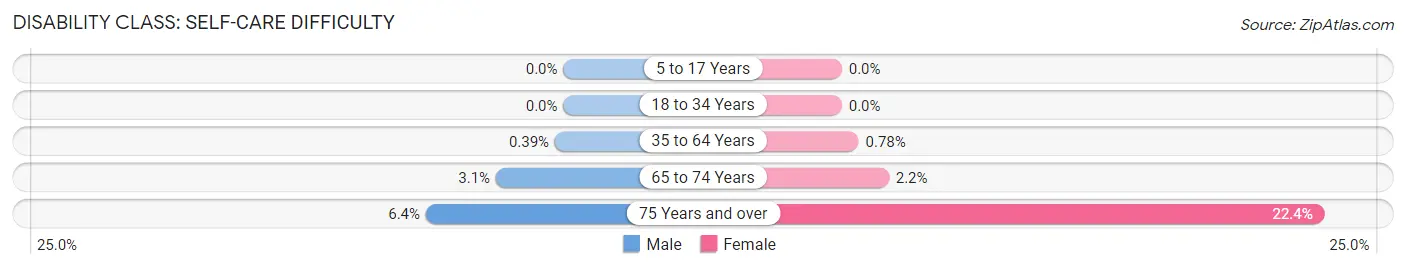
| Age Bracket | Male | Female |
| 5 to 17 Years | 0 (0.0%) | 0 (0.0%) |
| 18 to 34 Years | 0 (0.0%) | 0 (0.0%) |
| 35 to 64 Years | 8 (0.4%) | 17 (0.8%) |
| 65 to 74 Years | 14 (3.1%) | 12 (2.2%) |
| 75 Years and over | 27 (6.4%) | 144 (22.4%) |
Technology Access in Monfort Heights
Computing Device Access in Monfort Heights
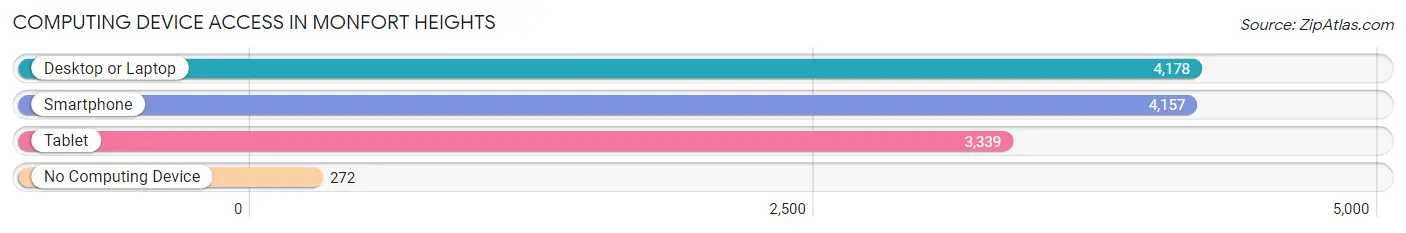
| Device Type | # Households | % Households |
| Desktop or Laptop | 4,178 | 85.2% |
| Smartphone | 4,157 | 84.8% |
| Tablet | 3,339 | 68.1% |
| No Computing Device | 272 | 5.6% |
| Total | 4,902 | 100.0% |
Internet Access in Monfort Heights
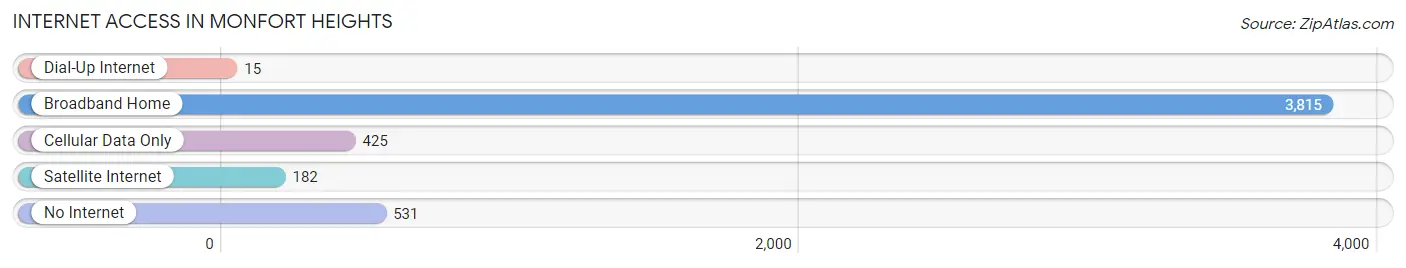
| Internet Type | # Households | % Households |
| Dial-Up Internet | 15 | 0.3% |
| Broadband Home | 3,815 | 77.8% |
| Cellular Data Only | 425 | 8.7% |
| Satellite Internet | 182 | 3.7% |
| No Internet | 531 | 10.8% |
| Total | 4,902 | 100.0% |
Monfort Heights Summary
Monfort Heights is a census-designated place (CDP) located in Hamilton County, Ohio. It is a suburb of Cincinnati, located approximately 10 miles north of the city. The population of Monfort Heights was 8,845 at the 2010 census.
History
Monfort Heights was originally part of Green Township, which was established in 1793. The area was largely rural until the 1950s, when the population began to grow rapidly due to the expansion of Cincinnati. The area was annexed by the city of Cincinnati in 1961, but the residents voted to become an independent village in 1965. The village was officially incorporated in 1966.
Geography
Monfort Heights is located at 39°14'25" North, 84°30'45" West (39.240278, -84.5125). According to the United States Census Bureau, the CDP has a total area of 4.2 square miles, all of it land.
Economy
Monfort Heights is primarily a residential community, with no major employers located within the CDP. The largest employers in the area are located in nearby Cincinnati.
Demographics
As of the 2010 census, there were 8,845 people, 3,541 households, and 2,541 families residing in the CDP. The population density was 2,097.6 people per square mile. The racial makeup of the CDP was 94.2% White, 2.2% African American, 0.2% Native American, 1.3% Asian, 0.1% Pacific Islander, 0.7% from other races, and 1.3% from two or more races. Hispanic or Latino of any race were 2.2% of the population.
There were 3,541 households, out of which 32.2% had children under the age of 18 living with them, 57.2% were married couples living together, 10.2% had a female householder with no husband present, and 28.3% were non-families. 24.2% of all households were made up of individuals, and 10.2% had someone living alone who was 65 years of age or older. The average household size was 2.51 and the average family size was 3.00.
In the CDP, the population was spread out, with 24.2% under the age of 18, 6.7% from 18 to 24, 28.2% from 25 to 44, 25.2% from 45 to 64, and 15.7% who were 65 years of age or older. The median age was 39 years. For every 100 females, there were 93.2 males. For every 100 females age 18 and over, there were 90.2 males.
The median income for a household in the CDP was $54,917, and the median income for a family was $63,917. Males had a median income of $45,917 versus $32,917 for females. The per capita income for the CDP was $25,917. About 3.2% of families and 4.2% of the population were below the poverty line, including 5.2% of those under age 18 and 4.2% of those age 65 or over.
Common Questions
What is Per Capita Income in Monfort Heights?
Per Capita income in Monfort Heights is $43,336.
What is the Median Family Income in Monfort Heights?
Median Family Income in Monfort Heights is $100,923.
What is the Median Household income in Monfort Heights?
Median Household Income in Monfort Heights is $80,625.
What is Income or Wage Gap in Monfort Heights?
Income or Wage Gap in Monfort Heights is 24.0%.
Women in Monfort Heights earn 76.0 cents for every dollar earned by a man.
What is Inequality or Gini Index in Monfort Heights?
Inequality or Gini Index in Monfort Heights is 0.40.
What is the Total Population of Monfort Heights?
Total Population of Monfort Heights is 12,012.
What is the Total Male Population of Monfort Heights?
Total Male Population of Monfort Heights is 5,165.
What is the Total Female Population of Monfort Heights?
Total Female Population of Monfort Heights is 6,847.
What is the Ratio of Males per 100 Females in Monfort Heights?
There are 75.43 Males per 100 Females in Monfort Heights.
What is the Ratio of Females per 100 Males in Monfort Heights?
There are 132.57 Females per 100 Males in Monfort Heights.
What is the Median Population Age in Monfort Heights?
Median Population Age in Monfort Heights is 35.8 Years.
What is the Average Family Size in Monfort Heights
Average Family Size in Monfort Heights is 3.1 People.
What is the Average Household Size in Monfort Heights
Average Household Size in Monfort Heights is 2.4 People.
How Large is the Labor Force in Monfort Heights?
There are 6,525 People in the Labor Forcein in Monfort Heights.
What is the Percentage of People in the Labor Force in Monfort Heights?
70.4% of People are in the Labor Force in Monfort Heights.
What is the Unemployment Rate in Monfort Heights?
Unemployment Rate in Monfort Heights is 3.2%.