Bryan, OH Map & Demographics
Bryan Map
Bryan Overview
$34,524
PER CAPITA INCOME
$61,681
AVG FAMILY INCOME
$51,415
AVG HOUSEHOLD INCOME
33.8%
WAGE / INCOME GAP [ % ]
66.2¢/ $1
WAGE / INCOME GAP [ $ ]
0.44
INEQUALITY / GINI INDEX
8,670
TOTAL POPULATION
4,329
MALE POPULATION
4,341
FEMALE POPULATION
99.72
MALES / 100 FEMALES
100.28
FEMALES / 100 MALES
46.5
MEDIAN AGE
2.6
AVG FAMILY SIZE
2.1
AVG HOUSEHOLD SIZE
4,371
LABOR FORCE [ PEOPLE ]
59.5%
PERCENT IN LABOR FORCE
3.2%
UNEMPLOYMENT RATE
Bryan Zip Codes
Income in Bryan
Income Overview in Bryan
Per Capita Income in Bryan is $34,524, while median incomes of families and households are $61,681 and $51,415 respectively.
| Characteristic | Number | Measure |
| Per Capita Income | 8,670 | $34,524 |
| Median Family Income | 2,324 | $61,681 |
| Mean Family Income | 2,324 | $74,056 |
| Median Household Income | 4,142 | $51,415 |
| Mean Household Income | 4,142 | $70,966 |
| Income Deficit | 2,324 | $0 |
| Wage / Income Gap (%) | 8,670 | 33.81% |
| Wage / Income Gap ($) | 8,670 | 66.19¢ per $1 |
| Gini / Inequality Index | 8,670 | 0.44 |
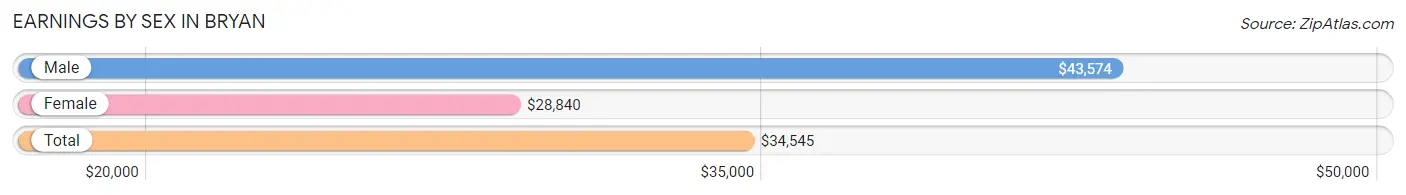
Earnings by Sex in Bryan
Average Earnings in Bryan are $34,545, $43,574 for men and $28,840 for women, a difference of 33.8%.
| Sex | Number | Average Earnings |
| Male | 2,298 (50.1%) | $43,574 |
| Female | 2,285 (49.9%) | $28,840 |
| Total | 4,583 (100.0%) | $34,545 |
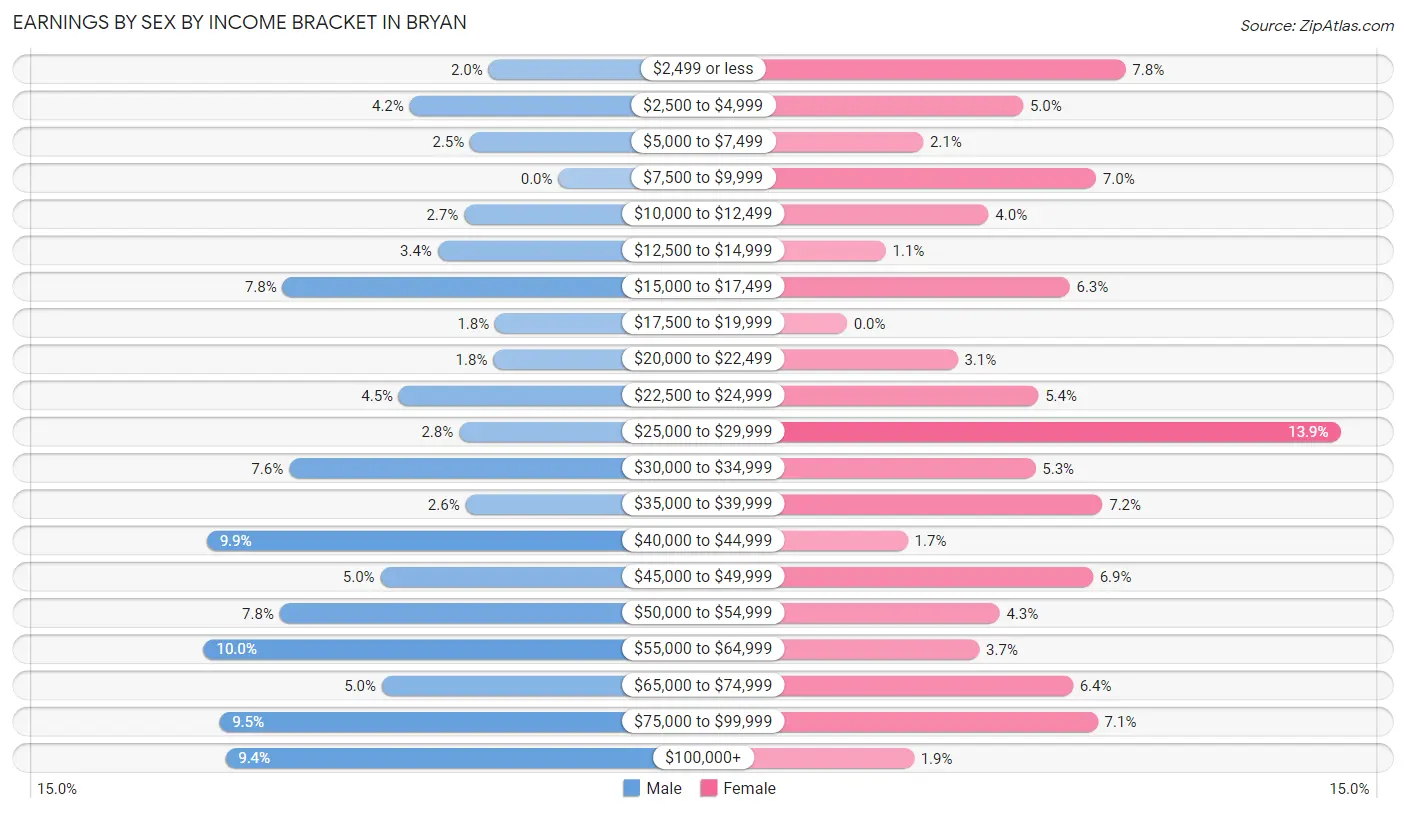
Earnings by Sex by Income Bracket in Bryan
The most common earnings brackets in Bryan are $55,000 to $64,999 for men (229 | 10.0%) and $25,000 to $29,999 for women (317 | 13.9%).
| Income | Male | Female |
| $2,499 or less | 45 (2.0%) | 179 (7.8%) |
| $2,500 to $4,999 | 96 (4.2%) | 113 (5.0%) |
| $5,000 to $7,499 | 57 (2.5%) | 49 (2.1%) |
| $7,500 to $9,999 | 0 (0.0%) | 160 (7.0%) |
| $10,000 to $12,499 | 61 (2.6%) | 91 (4.0%) |
| $12,500 to $14,999 | 78 (3.4%) | 25 (1.1%) |
| $15,000 to $17,499 | 178 (7.7%) | 143 (6.3%) |
| $17,500 to $19,999 | 41 (1.8%) | 0 (0.0%) |
| $20,000 to $22,499 | 42 (1.8%) | 71 (3.1%) |
| $22,500 to $24,999 | 103 (4.5%) | 123 (5.4%) |
| $25,000 to $29,999 | 64 (2.8%) | 317 (13.9%) |
| $30,000 to $34,999 | 174 (7.6%) | 121 (5.3%) |
| $35,000 to $39,999 | 60 (2.6%) | 164 (7.2%) |
| $40,000 to $44,999 | 227 (9.9%) | 39 (1.7%) |
| $45,000 to $49,999 | 115 (5.0%) | 158 (6.9%) |
| $50,000 to $54,999 | 180 (7.8%) | 98 (4.3%) |
| $55,000 to $64,999 | 229 (10.0%) | 85 (3.7%) |
| $65,000 to $74,999 | 114 (5.0%) | 145 (6.4%) |
| $75,000 to $99,999 | 219 (9.5%) | 161 (7.0%) |
| $100,000+ | 215 (9.4%) | 43 (1.9%) |
| Total | 2,298 (100.0%) | 2,285 (100.0%) |
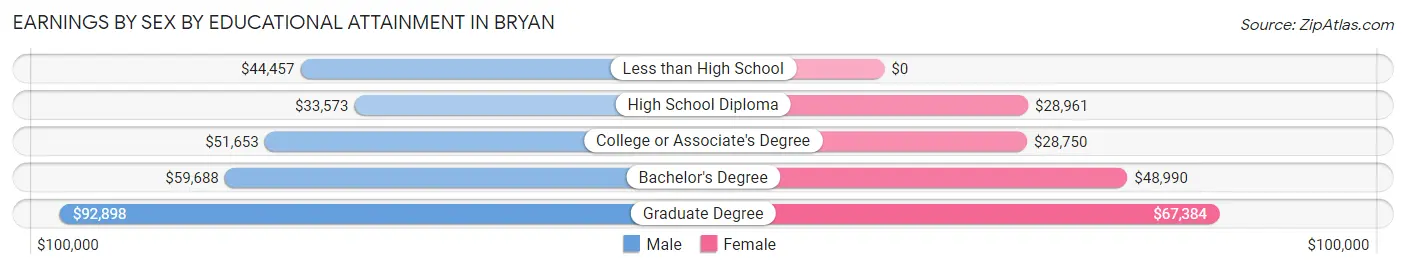
Earnings by Sex by Educational Attainment in Bryan
Average earnings in Bryan are $45,270 for men and $32,816 for women, a difference of 27.5%. Men with an educational attainment of graduate degree enjoy the highest average annual earnings of $92,898, while those with high school diploma education earn the least with $33,573. Women with an educational attainment of graduate degree earn the most with the average annual earnings of $67,384, while those with college or associate's degree education have the smallest earnings of $28,750.
| Educational Attainment | Male Income | Female Income |
| Less than High School | $44,457 | $0 |
| High School Diploma | $33,573 | $28,961 |
| College or Associate's Degree | $51,653 | $28,750 |
| Bachelor's Degree | $59,688 | $48,990 |
| Graduate Degree | $92,898 | $67,384 |
| Total | $45,270 | $32,816 |
Family Income in Bryan
Family Income Brackets in Bryan
According to the Bryan family income data, there are 511 families falling into the $50,000 to $74,999 income range, which is the most common income bracket and makes up 22.0% of all families. Conversely, the $200,000+ income bracket is the least frequent group with only 74 families (3.2%) belonging to this category.
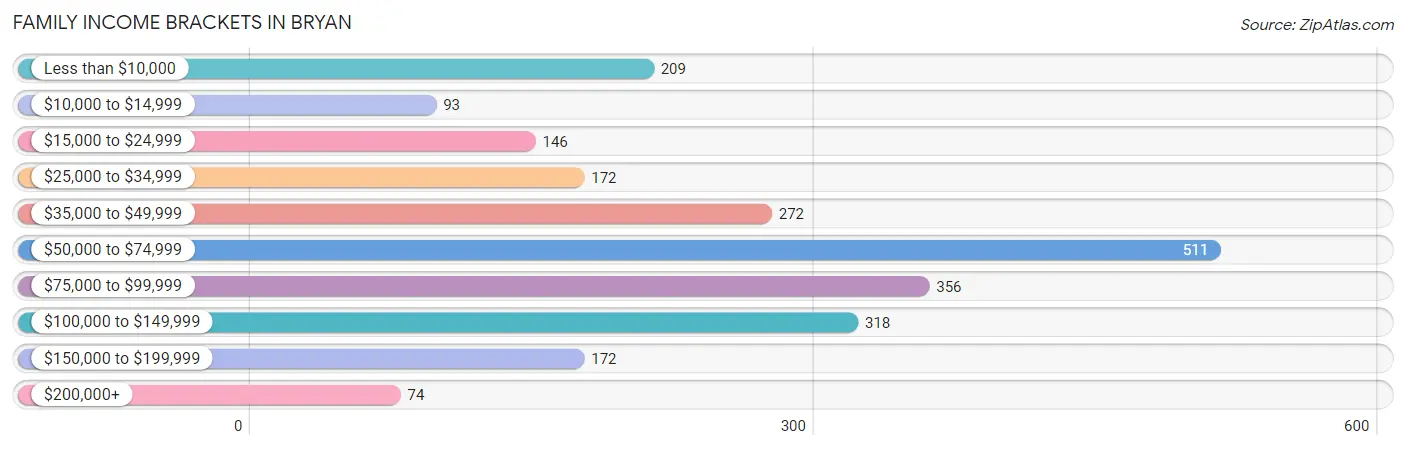
| Income Bracket | # Families | % Families |
| Less than $10,000 | 209 | 9.0% |
| $10,000 to $14,999 | 93 | 4.0% |
| $15,000 to $24,999 | 146 | 6.3% |
| $25,000 to $34,999 | 172 | 7.4% |
| $35,000 to $49,999 | 272 | 11.7% |
| $50,000 to $74,999 | 511 | 22.0% |
| $75,000 to $99,999 | 356 | 15.3% |
| $100,000 to $149,999 | 318 | 13.7% |
| $150,000 to $199,999 | 172 | 7.4% |
| $200,000+ | 74 | 3.2% |
Family Income by Famaliy Size in Bryan
6-person families (54 | 2.3%) account for the highest median family income in Bryan with $93,788 per family, while 2-person families (1,268 | 54.6%) have the highest median income of $29,867 per family member.
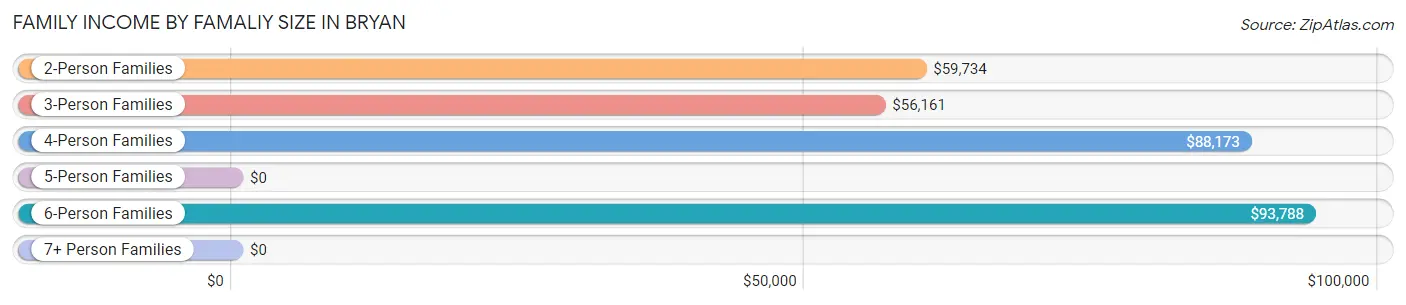
| Income Bracket | # Families | Median Income |
| 2-Person Families | 1,268 (54.6%) | $59,734 |
| 3-Person Families | 585 (25.2%) | $56,161 |
| 4-Person Families | 373 (16.1%) | $88,173 |
| 5-Person Families | 26 (1.1%) | $0 |
| 6-Person Families | 54 (2.3%) | $93,788 |
| 7+ Person Families | 18 (0.8%) | $0 |
| Total | 2,324 (100.0%) | $61,681 |
Family Income by Number of Earners in Bryan
The median family income in Bryan is $61,681, with families comprising 3+ earners (207) having the highest median family income of $143,750, while families with 1 earner (589) have the lowest median family income of $33,166, accounting for 8.9% and 25.3% of families, respectively.
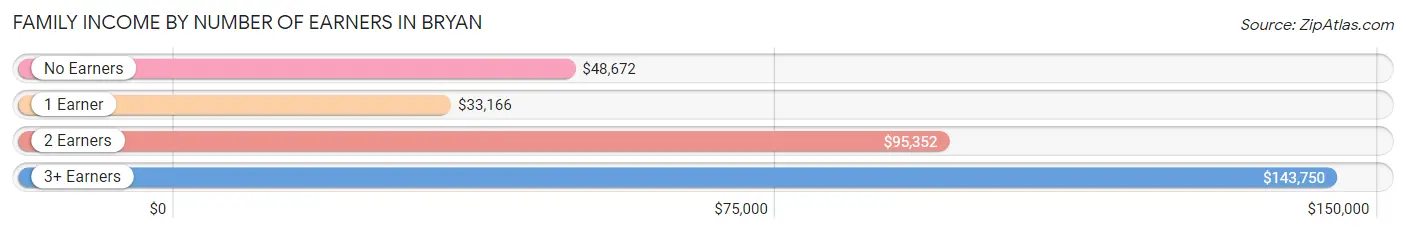
| Number of Earners | # Families | Median Income |
| No Earners | 727 (31.3%) | $48,672 |
| 1 Earner | 589 (25.3%) | $33,166 |
| 2 Earners | 801 (34.5%) | $95,352 |
| 3+ Earners | 207 (8.9%) | $143,750 |
| Total | 2,324 (100.0%) | $61,681 |
Household Income in Bryan
Household Income Brackets in Bryan
With 903 households falling in the category, the $50,000 to $74,999 income range is the most frequent in Bryan, accounting for 21.8% of all households. In contrast, only 95 households (2.3%) fall into the $200,000+ income bracket, making it the least populous group.
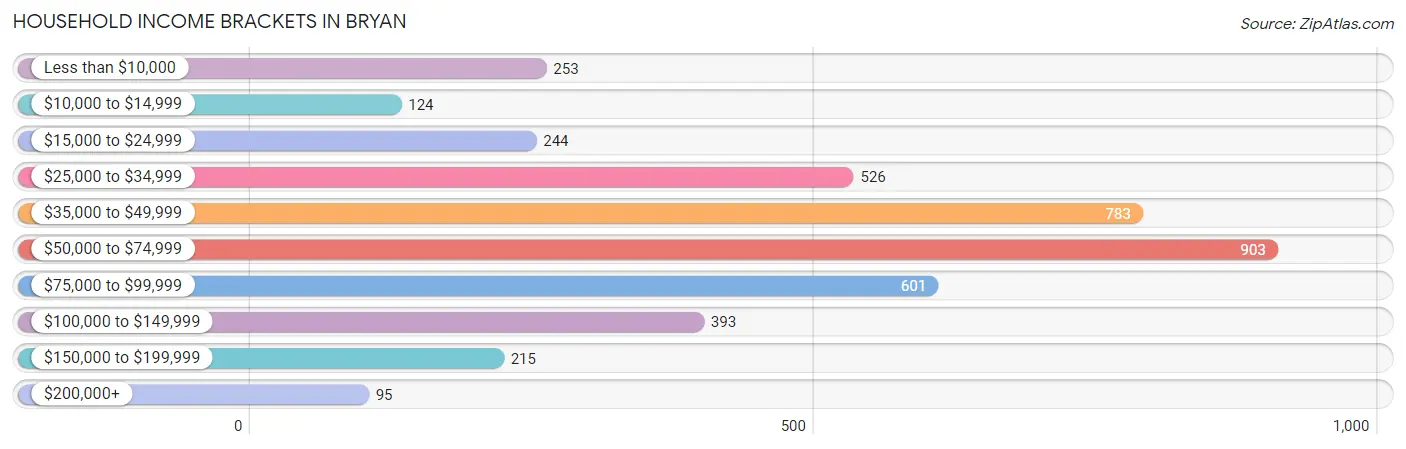
| Income Bracket | # Households | % Households |
| Less than $10,000 | 253 | 6.1% |
| $10,000 to $14,999 | 124 | 3.0% |
| $15,000 to $24,999 | 244 | 5.9% |
| $25,000 to $34,999 | 526 | 12.7% |
| $35,000 to $49,999 | 783 | 18.9% |
| $50,000 to $74,999 | 903 | 21.8% |
| $75,000 to $99,999 | 601 | 14.5% |
| $100,000 to $149,999 | 393 | 9.5% |
| $150,000 to $199,999 | 215 | 5.2% |
| $200,000+ | 95 | 2.3% |
Household Income by Householder Age in Bryan
The median household income in Bryan is $51,415, with the highest median household income of $62,656 found in the 25 to 44 years age bracket for the primary householder. A total of 1,024 households (24.7%) fall into this category. Meanwhile, the 15 to 24 years age bracket for the primary householder has the lowest median household income of $46,573, with 241 households (5.8%) in this group.
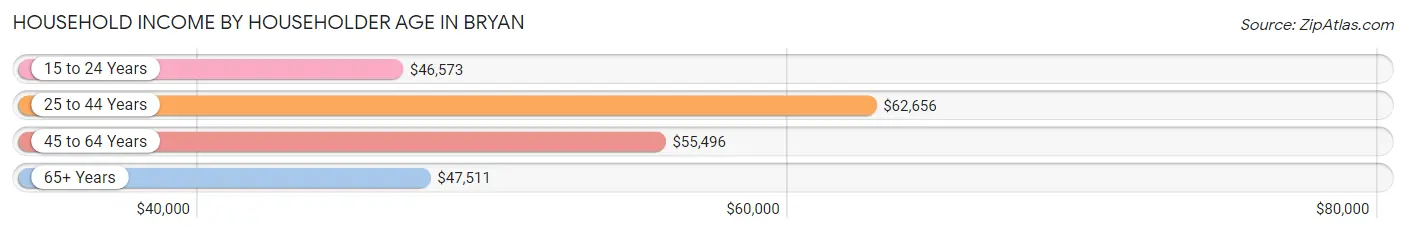
| Income Bracket | # Households | Median Income |
| 15 to 24 Years | 241 (5.8%) | $46,573 |
| 25 to 44 Years | 1,024 (24.7%) | $62,656 |
| 45 to 64 Years | 1,464 (35.3%) | $55,496 |
| 65+ Years | 1,413 (34.1%) | $47,511 |
| Total | 4,142 (100.0%) | $51,415 |
Poverty in Bryan
Income Below Poverty by Sex and Age in Bryan
With 11.3% poverty level for males and 17.6% for females among the residents of Bryan, under 5 year old males and under 5 year old females are the most vulnerable to poverty, with 121 males (51.3%) and 78 females (57.4%) in their respective age groups living below the poverty level.
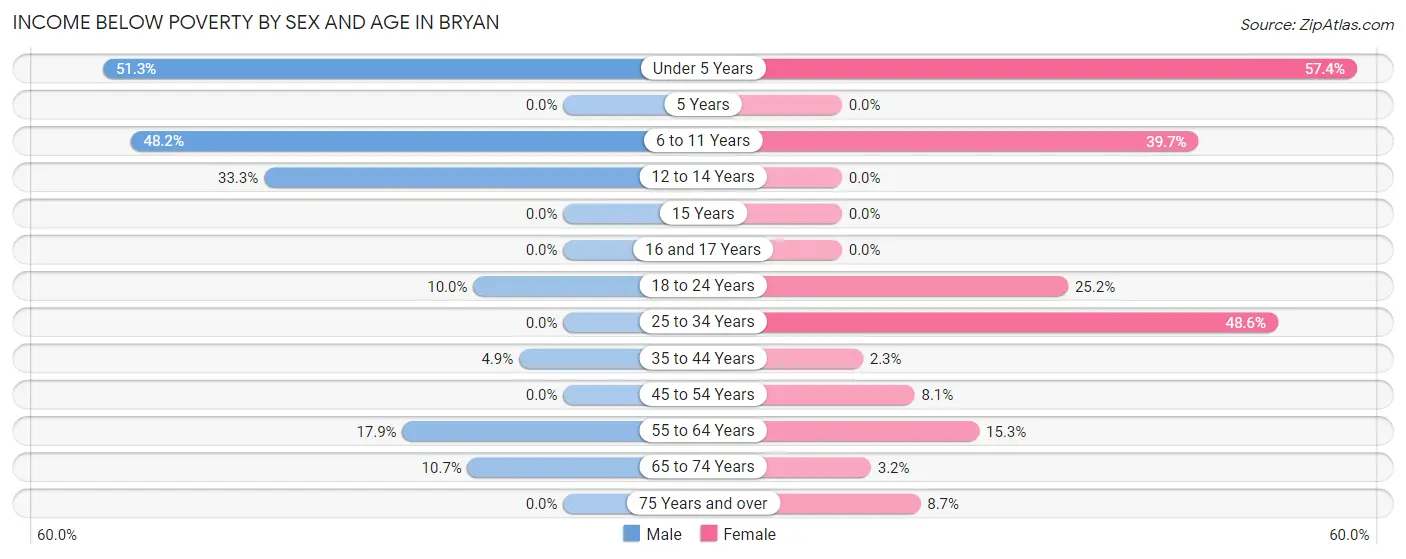
| Age Bracket | Male | Female |
| Under 5 Years | 121 (51.3%) | 78 (57.4%) |
| 5 Years | 0 (0.0%) | 0 (0.0%) |
| 6 to 11 Years | 107 (48.2%) | 137 (39.7%) |
| 12 to 14 Years | 38 (33.3%) | 0 (0.0%) |
| 15 Years | 0 (0.0%) | 0 (0.0%) |
| 16 and 17 Years | 0 (0.0%) | 0 (0.0%) |
| 18 to 24 Years | 33 (10.0%) | 97 (25.2%) |
| 25 to 34 Years | 0 (0.0%) | 217 (48.5%) |
| 35 to 44 Years | 30 (4.9%) | 11 (2.3%) |
| 45 to 54 Years | 0 (0.0%) | 34 (8.1%) |
| 55 to 64 Years | 88 (17.9%) | 107 (15.3%) |
| 65 to 74 Years | 66 (10.7%) | 17 (3.2%) |
| 75 Years and over | 0 (0.0%) | 52 (8.7%) |
| Total | 483 (11.3%) | 750 (17.6%) |
Income Above Poverty by Sex and Age in Bryan
According to the poverty statistics in Bryan, males aged 5 years and females aged 5 years are the age groups that are most secure financially, with 100.0% of males and 100.0% of females in these age groups living above the poverty line.
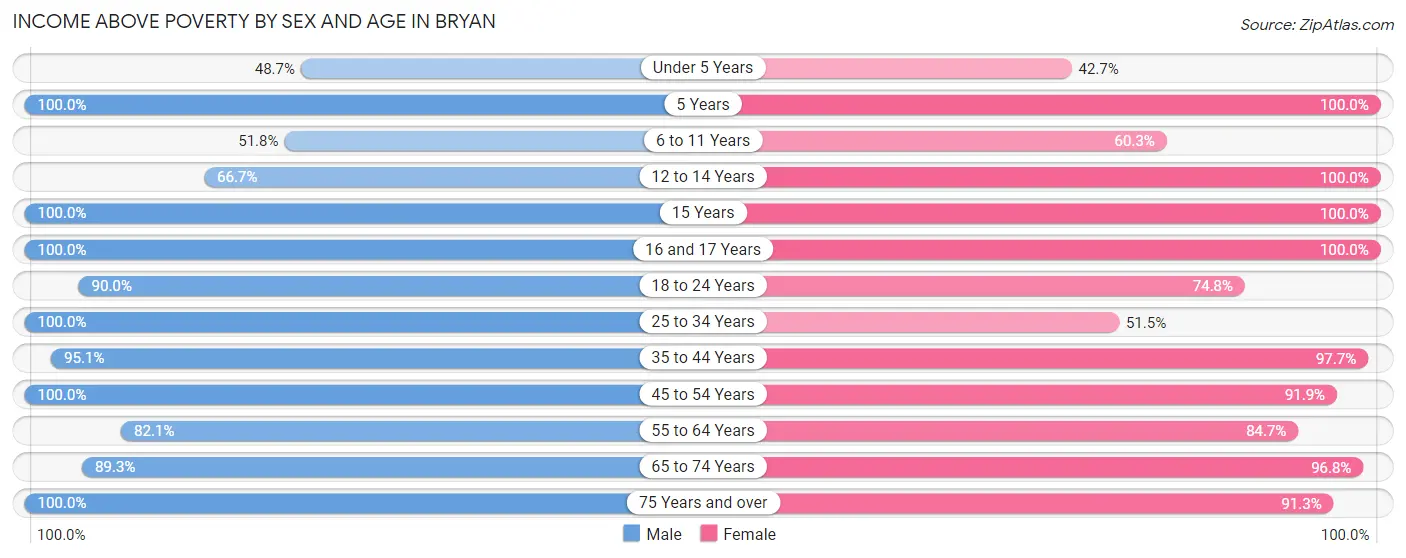
| Age Bracket | Male | Female |
| Under 5 Years | 115 (48.7%) | 58 (42.6%) |
| 5 Years | 10 (100.0%) | 16 (100.0%) |
| 6 to 11 Years | 115 (51.8%) | 208 (60.3%) |
| 12 to 14 Years | 76 (66.7%) | 92 (100.0%) |
| 15 Years | 59 (100.0%) | 77 (100.0%) |
| 16 and 17 Years | 62 (100.0%) | 55 (100.0%) |
| 18 to 24 Years | 296 (90.0%) | 288 (74.8%) |
| 25 to 34 Years | 573 (100.0%) | 230 (51.4%) |
| 35 to 44 Years | 579 (95.1%) | 459 (97.7%) |
| 45 to 54 Years | 514 (100.0%) | 386 (91.9%) |
| 55 to 64 Years | 403 (82.1%) | 593 (84.7%) |
| 65 to 74 Years | 553 (89.3%) | 509 (96.8%) |
| 75 Years and over | 429 (100.0%) | 543 (91.3%) |
| Total | 3,784 (88.7%) | 3,514 (82.4%) |
Income Below Poverty Among Married-Couple Families in Bryan
The poverty statistics for married-couple families in Bryan show that 0.7% or 9 of the total 1,371 families live below the poverty line. Families with no children have the highest poverty rate of 1.0%, comprising of 9 families. On the other hand, families with 1 or 2 children have the lowest poverty rate of 0.0%, which includes 0 families.
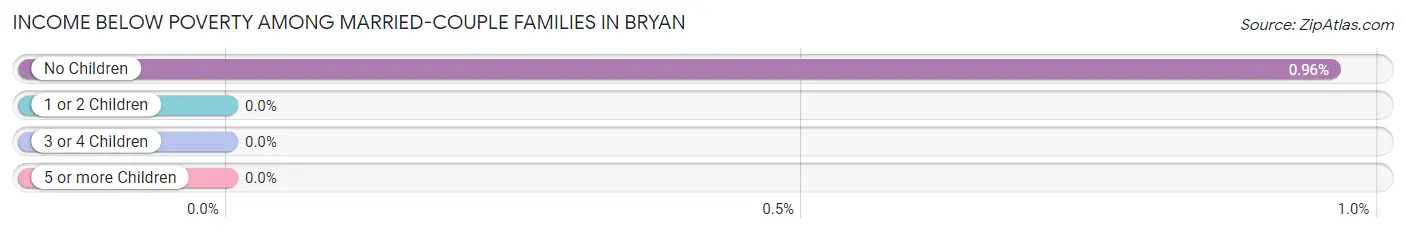
| Children | Above Poverty | Below Poverty |
| No Children | 930 (99.0%) | 9 (1.0%) |
| 1 or 2 Children | 344 (100.0%) | 0 (0.0%) |
| 3 or 4 Children | 70 (100.0%) | 0 (0.0%) |
| 5 or more Children | 18 (100.0%) | 0 (0.0%) |
| Total | 1,362 (99.3%) | 9 (0.7%) |
Income Below Poverty Among Single-Parent Households in Bryan
According to the poverty data in Bryan, 49.3% or 110 single-father households and 40.4% or 295 single-mother households are living below the poverty line. Among single-father households, those with 1 or 2 children have the highest poverty rate, with 110 households (79.7%) experiencing poverty. Likewise, among single-mother households, those with 3 or 4 children have the highest poverty rate, with 103 households (83.1%) falling below the poverty line.
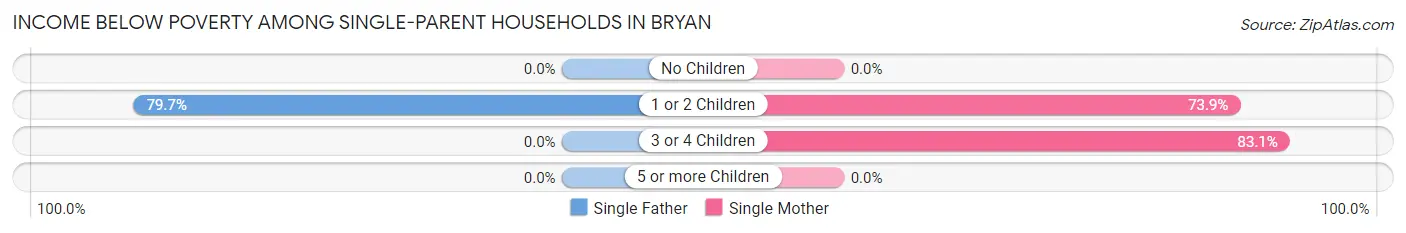
| Children | Single Father | Single Mother |
| No Children | 0 (0.0%) | 0 (0.0%) |
| 1 or 2 Children | 110 (79.7%) | 192 (73.9%) |
| 3 or 4 Children | 0 (0.0%) | 103 (83.1%) |
| 5 or more Children | 0 (0.0%) | 0 (0.0%) |
| Total | 110 (49.3%) | 295 (40.4%) |
Income Below Poverty Among Married-Couple vs Single-Parent Households in Bryan
The poverty data for Bryan shows that 9 of the married-couple family households (0.7%) and 405 of the single-parent households (42.5%) are living below the poverty level. Within the married-couple family households, those with no children have the highest poverty rate, with 9 households (1.0%) falling below the poverty line. Among the single-parent households, those with 3 or 4 children have the highest poverty rate, with 103 household (83.1%) living below poverty.
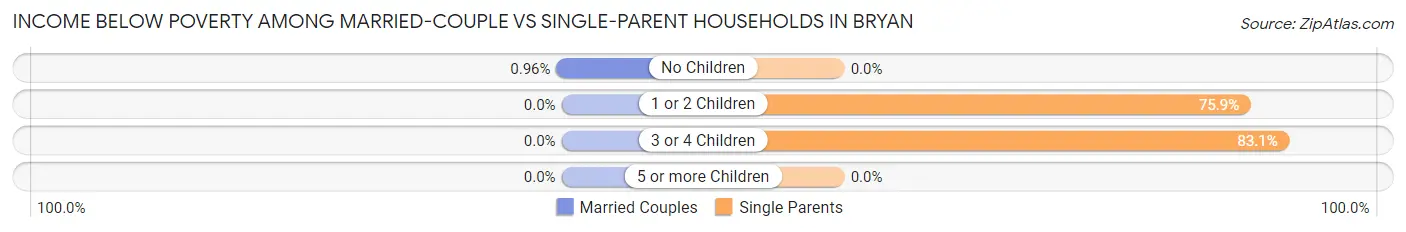
| Children | Married-Couple Families | Single-Parent Households |
| No Children | 9 (1.0%) | 0 (0.0%) |
| 1 or 2 Children | 0 (0.0%) | 302 (75.9%) |
| 3 or 4 Children | 0 (0.0%) | 103 (83.1%) |
| 5 or more Children | 0 (0.0%) | 0 (0.0%) |
| Total | 9 (0.7%) | 405 (42.5%) |
Race in Bryan
The most populous races in Bryan are White / Caucasian (8,164 | 94.2%), Hispanic or Latino (317 | 3.7%), and Some other Race (155 | 1.8%).
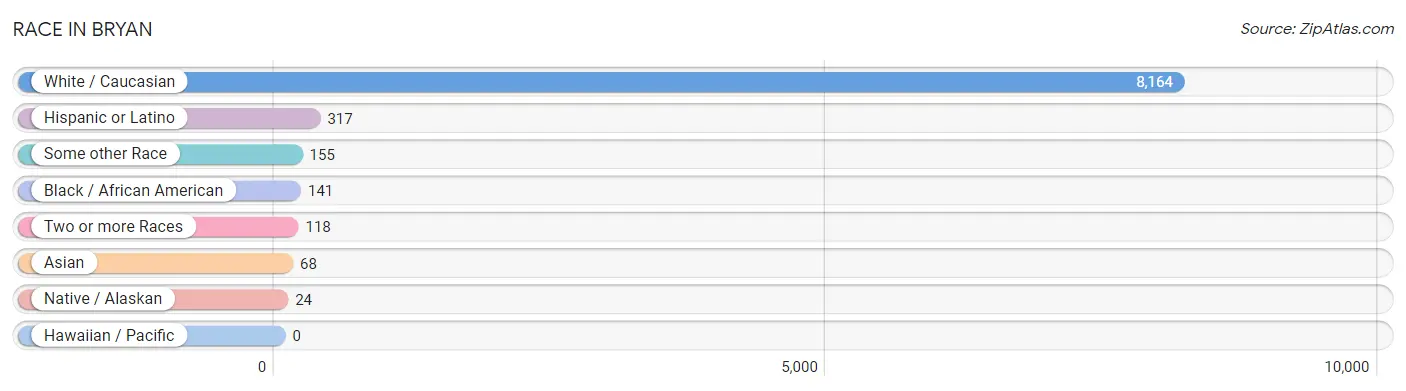
| Race | # Population | % Population |
| Asian | 68 | 0.8% |
| Black / African American | 141 | 1.6% |
| Hawaiian / Pacific | 0 | 0.0% |
| Hispanic or Latino | 317 | 3.7% |
| Native / Alaskan | 24 | 0.3% |
| White / Caucasian | 8,164 | 94.2% |
| Two or more Races | 118 | 1.4% |
| Some other Race | 155 | 1.8% |
| Total | 8,670 | 100.0% |
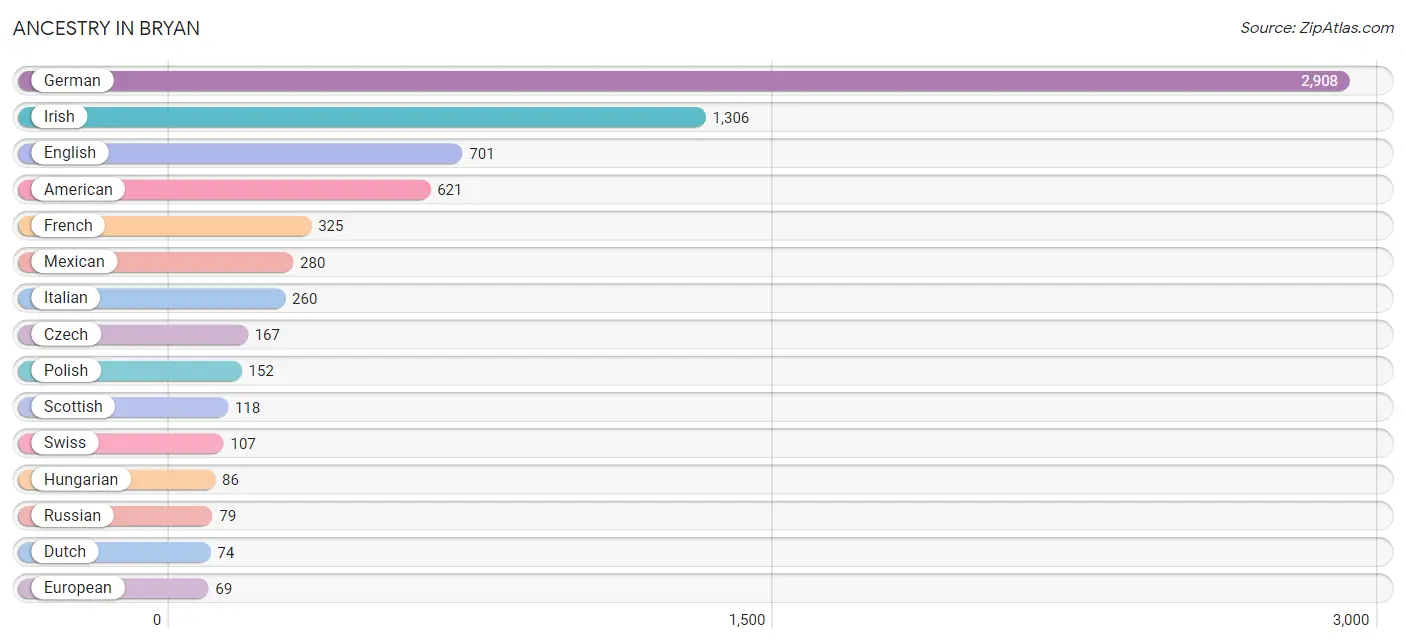
Ancestry in Bryan
The most populous ancestries reported in Bryan are German (2,908 | 33.5%), Irish (1,306 | 15.1%), English (701 | 8.1%), American (621 | 7.2%), and French (325 | 3.7%), together accounting for 67.6% of all Bryan residents.
| Ancestry | # Population | % Population |
| African | 22 | 0.3% |
| American | 621 | 7.2% |
| Arab | 4 | 0.1% |
| Australian | 48 | 0.5% |
| Austrian | 31 | 0.4% |
| Belgian | 64 | 0.7% |
| Burmese | 13 | 0.2% |
| Cherokee | 19 | 0.2% |
| Croatian | 44 | 0.5% |
| Czech | 167 | 1.9% |
| Dutch | 74 | 0.9% |
| English | 701 | 8.1% |
| European | 69 | 0.8% |
| French | 325 | 3.7% |
| French Canadian | 15 | 0.2% |
| German | 2,908 | 33.5% |
| Greek | 65 | 0.7% |
| Hungarian | 86 | 1.0% |
| Indian (Asian) | 12 | 0.1% |
| Irish | 1,306 | 15.1% |
| Italian | 260 | 3.0% |
| Korean | 56 | 0.6% |
| Lebanese | 4 | 0.1% |
| Mexican | 280 | 3.2% |
| Mexican American Indian | 17 | 0.2% |
| Northern European | 19 | 0.2% |
| Pennsylvania German | 15 | 0.2% |
| Polish | 152 | 1.8% |
| Puerto Rican | 37 | 0.4% |
| Romanian | 23 | 0.3% |
| Russian | 79 | 0.9% |
| Scotch-Irish | 67 | 0.8% |
| Scottish | 118 | 1.4% |
| Subsaharan African | 22 | 0.3% |
| Swedish | 43 | 0.5% |
| Swiss | 107 | 1.2% |
| Welsh | 29 | 0.3% |
| Yugoslavian | 11 | 0.1% | View All 38 Rows |
Immigrants in Bryan
The most numerous immigrant groups reported in Bryan came from Central America (77 | 0.9%), Latin America (77 | 0.9%), Mexico (77 | 0.9%), Asia (68 | 0.8%), and Philippines (43 | 0.5%), together accounting for 4.0% of all Bryan residents.
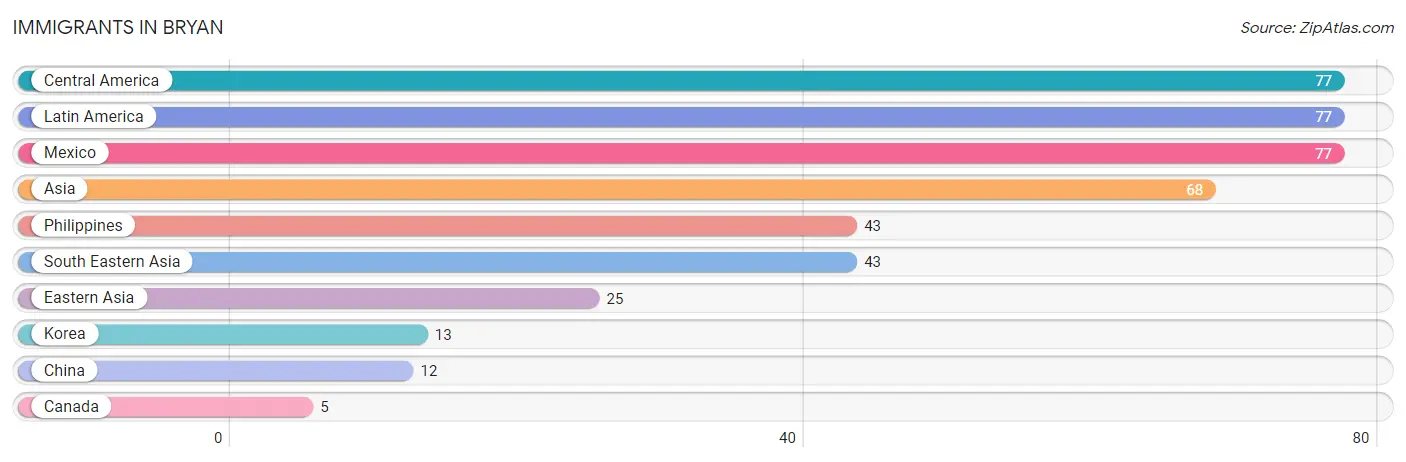
| Immigration Origin | # Population | % Population |
| Asia | 68 | 0.8% |
| Canada | 5 | 0.1% |
| Central America | 77 | 0.9% |
| China | 12 | 0.1% |
| Eastern Asia | 25 | 0.3% |
| Korea | 13 | 0.2% |
| Latin America | 77 | 0.9% |
| Mexico | 77 | 0.9% |
| Philippines | 43 | 0.5% |
| South Eastern Asia | 43 | 0.5% | View All 10 Rows |
Sex and Age in Bryan
Sex and Age in Bryan
The most populous age groups in Bryan are 25 to 29 Years (411 | 9.5%) for men and 55 to 59 Years (404 | 9.3%) for women.
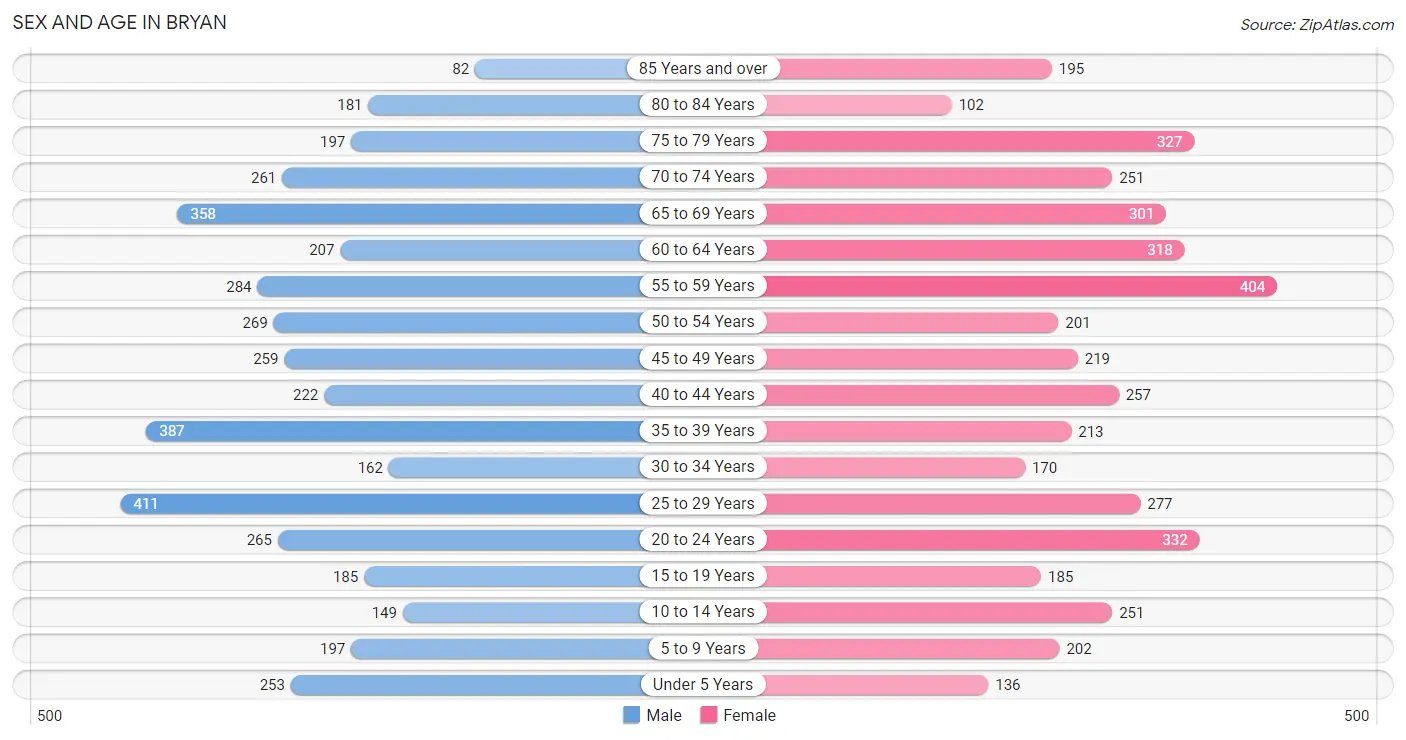
| Age Bracket | Male | Female |
| Under 5 Years | 253 (5.8%) | 136 (3.1%) |
| 5 to 9 Years | 197 (4.5%) | 202 (4.6%) |
| 10 to 14 Years | 149 (3.4%) | 251 (5.8%) |
| 15 to 19 Years | 185 (4.3%) | 185 (4.3%) |
| 20 to 24 Years | 265 (6.1%) | 332 (7.6%) |
| 25 to 29 Years | 411 (9.5%) | 277 (6.4%) |
| 30 to 34 Years | 162 (3.7%) | 170 (3.9%) |
| 35 to 39 Years | 387 (8.9%) | 213 (4.9%) |
| 40 to 44 Years | 222 (5.1%) | 257 (5.9%) |
| 45 to 49 Years | 259 (6.0%) | 219 (5.0%) |
| 50 to 54 Years | 269 (6.2%) | 201 (4.6%) |
| 55 to 59 Years | 284 (6.6%) | 404 (9.3%) |
| 60 to 64 Years | 207 (4.8%) | 318 (7.3%) |
| 65 to 69 Years | 358 (8.3%) | 301 (6.9%) |
| 70 to 74 Years | 261 (6.0%) | 251 (5.8%) |
| 75 to 79 Years | 197 (4.5%) | 327 (7.5%) |
| 80 to 84 Years | 181 (4.2%) | 102 (2.4%) |
| 85 Years and over | 82 (1.9%) | 195 (4.5%) |
| Total | 4,329 (100.0%) | 4,341 (100.0%) |
Families and Households in Bryan
Median Family Size in Bryan
The median family size in Bryan is 2.65 persons per family, with married-couple families (1,371 | 59.0%) accounting for the largest median family size of 2.87 persons per family. On the other hand, single male/father families (223 | 9.6%) represent the smallest median family size with 1.89 persons per family.
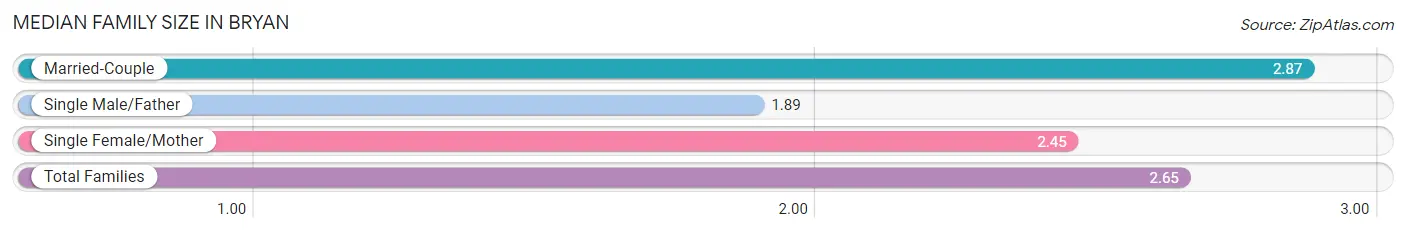
| Family Type | # Families | Family Size |
| Married-Couple | 1,371 (59.0%) | 2.87 |
| Single Male/Father | 223 (9.6%) | 1.89 |
| Single Female/Mother | 730 (31.4%) | 2.45 |
| Total Families | 2,324 (100.0%) | 2.65 |
Median Household Size in Bryan
The median household size in Bryan is 2.06 persons per household, with married-couple households (1,371 | 33.1%) accounting for the largest median household size of 2.91 persons per household. non-family households (1,818 | 43.9%) represent the smallest median household size with 1.14 persons per household.
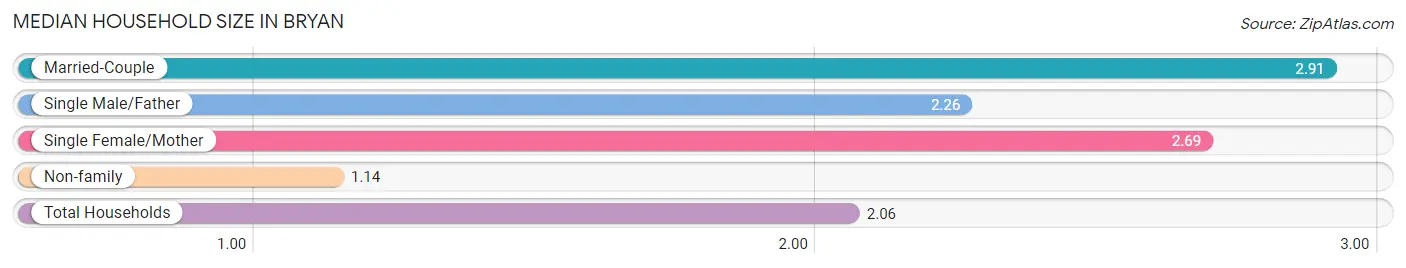
| Household Type | # Households | Household Size |
| Married-Couple | 1,371 (33.1%) | 2.91 |
| Single Male/Father | 223 (5.4%) | 2.26 |
| Single Female/Mother | 730 (17.6%) | 2.69 |
| Non-family | 1,818 (43.9%) | 1.14 |
| Total Households | 4,142 (100.0%) | 2.06 |
Household Size by Marriage Status in Bryan
Out of a total of 4,142 households in Bryan, 2,324 (56.1%) are family households, while 1,818 (43.9%) are nonfamily households. The most numerous type of family households are 2-person households, comprising 1,210, and the most common type of nonfamily households are 1-person households, comprising 1,620.
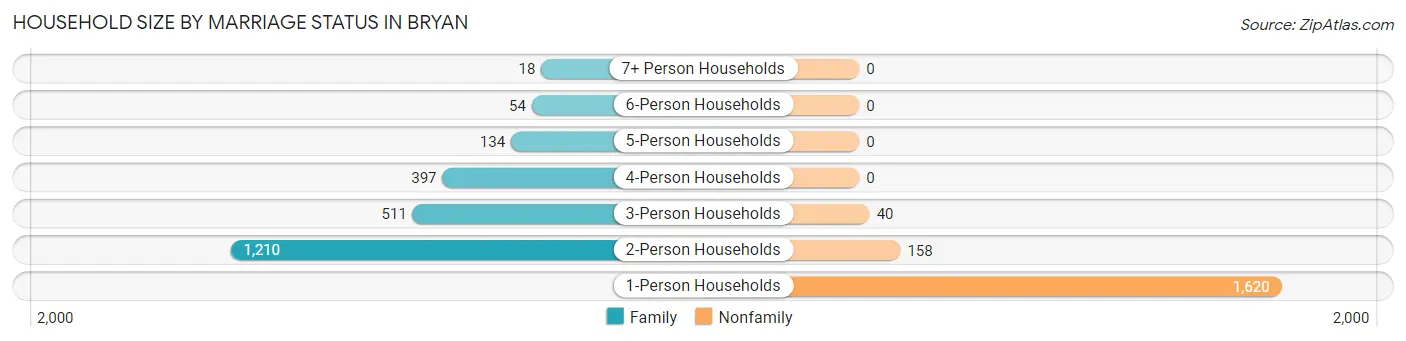
| Household Size | Family Households | Nonfamily Households |
| 1-Person Households | - | 1,620 (39.1%) |
| 2-Person Households | 1,210 (29.2%) | 158 (3.8%) |
| 3-Person Households | 511 (12.3%) | 40 (1.0%) |
| 4-Person Households | 397 (9.6%) | 0 (0.0%) |
| 5-Person Households | 134 (3.2%) | 0 (0.0%) |
| 6-Person Households | 54 (1.3%) | 0 (0.0%) |
| 7+ Person Households | 18 (0.4%) | 0 (0.0%) |
| Total | 2,324 (56.1%) | 1,818 (43.9%) |
Female Fertility in Bryan
Fertility by Age in Bryan
Average fertility rate in Bryan is 97.0 births per 1,000 women. Women in the age bracket of 20 to 34 years have the highest fertility rate with 209.0 births per 1,000 women. Women in the age bracket of 20 to 34 years acount for 100.0% of all women with births.
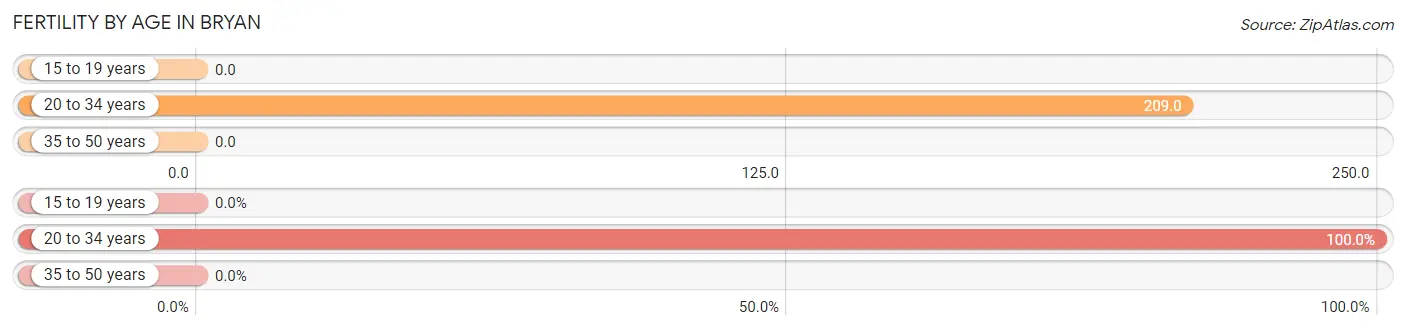
| Age Bracket | Women with Births | Births / 1,000 Women |
| 15 to 19 years | 0 (0.0%) | 0.0 |
| 20 to 34 years | 163 (100.0%) | 209.0 |
| 35 to 50 years | 0 (0.0%) | 0.0 |
| Total | 163 (100.0%) | 97.0 |
Fertility by Age by Marriage Status in Bryan
18.4% of women with births (163) in Bryan are married. The highest percentage of unmarried women with births falls into 20 to 34 years age bracket with 81.6% of them unmarried at the time of birth, while the lowest percentage of unmarried women with births belong to 20 to 34 years age bracket with 81.6% of them unmarried.
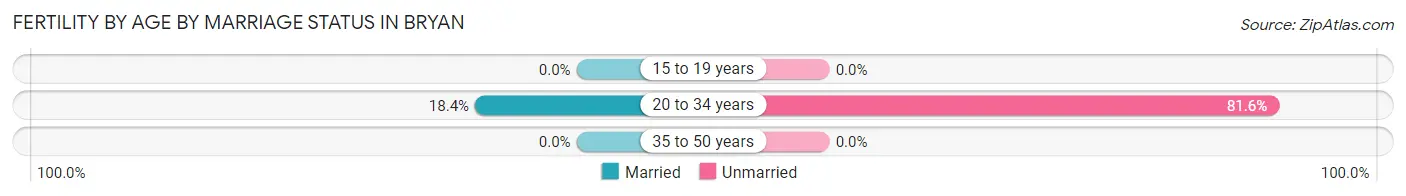
| Age Bracket | Married | Unmarried |
| 15 to 19 years | 0 (0.0%) | 0 (0.0%) |
| 20 to 34 years | 30 (18.4%) | 133 (81.6%) |
| 35 to 50 years | 0 (0.0%) | 0 (0.0%) |
| Total | 30 (18.4%) | 133 (81.6%) |
Fertility by Education in Bryan
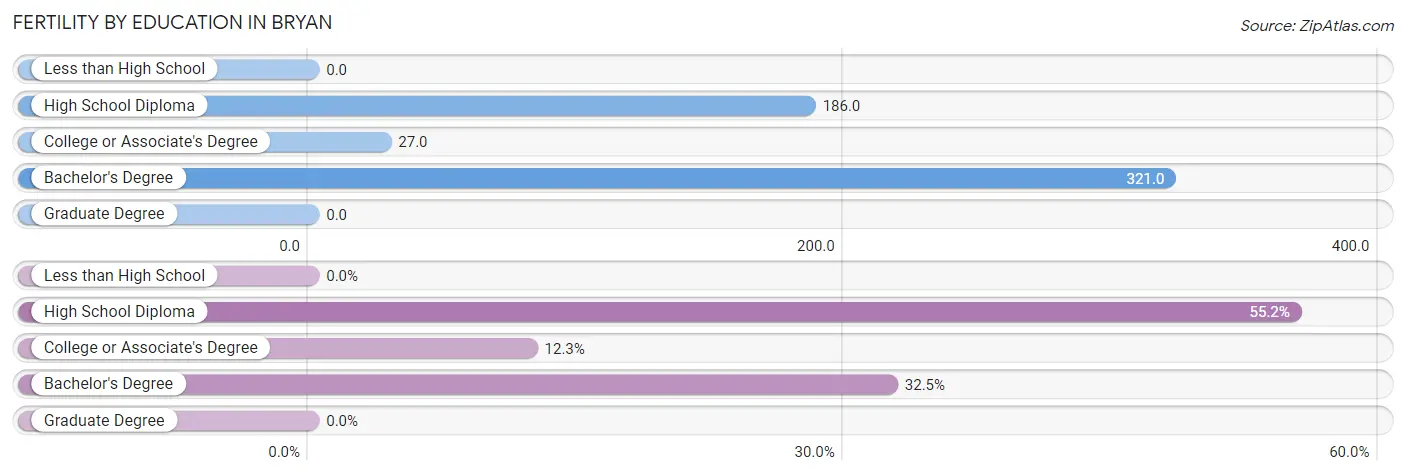
| Educational Attainment | Women with Births | Births / 1,000 Women |
| Less than High School | 0 (0.0%) | 0.0 |
| High School Diploma | 90 (55.2%) | 186.0 |
| College or Associate's Degree | 20 (12.3%) | 27.0 |
| Bachelor's Degree | 53 (32.5%) | 321.0 |
| Graduate Degree | 0 (0.0%) | 0.0 |
| Total | 163 (100.0%) | 97.0 |
Fertility by Education by Marriage Status in Bryan
81.6% of women with births in Bryan are unmarried. Women with the educational attainment of bachelor's degree are most likely to be married with 22.6% of them married at childbirth, while women with the educational attainment of college or associate's degree are least likely to be married with 100.0% of them unmarried at childbirth.
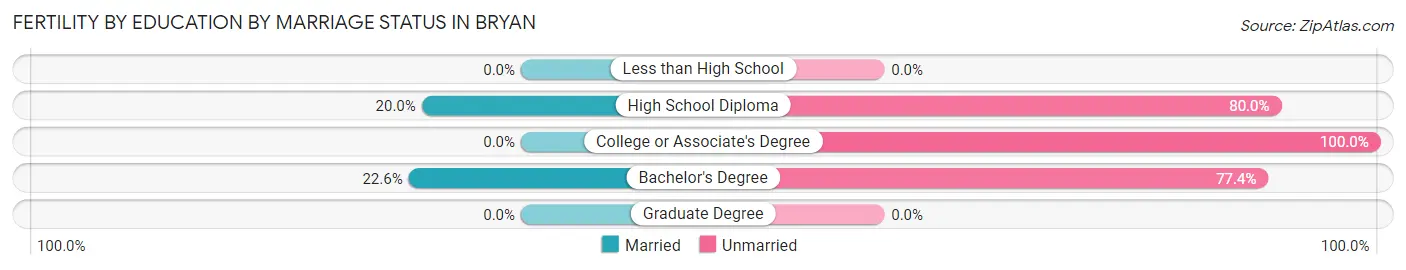
| Educational Attainment | Married | Unmarried |
| Less than High School | 0 (0.0%) | 0 (0.0%) |
| High School Diploma | 18 (20.0%) | 72 (80.0%) |
| College or Associate's Degree | 0 (0.0%) | 20 (100.0%) |
| Bachelor's Degree | 12 (22.6%) | 41 (77.4%) |
| Graduate Degree | 0 (0.0%) | 0 (0.0%) |
| Total | 30 (18.4%) | 133 (81.6%) |
Employment Characteristics in Bryan
Employment by Class of Employer in Bryan
Among the 4,231 employed individuals in Bryan, private company employees (3,388 | 80.1%), local government employees (361 | 8.5%), and not-for-profit organizations (181 | 4.3%) make up the most common classes of employment.
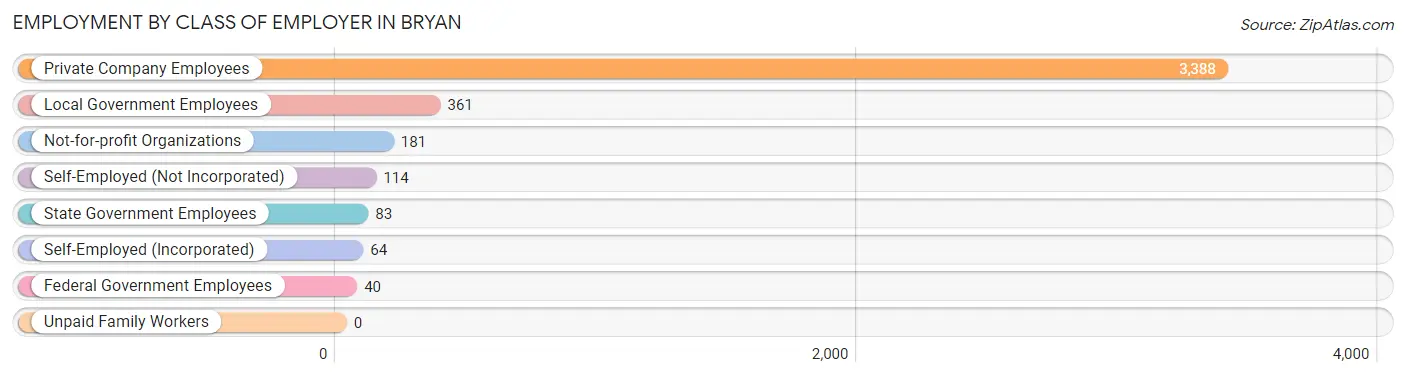
| Employer Class | # Employees | % Employees |
| Private Company Employees | 3,388 | 80.1% |
| Self-Employed (Incorporated) | 64 | 1.5% |
| Self-Employed (Not Incorporated) | 114 | 2.7% |
| Not-for-profit Organizations | 181 | 4.3% |
| Local Government Employees | 361 | 8.5% |
| State Government Employees | 83 | 2.0% |
| Federal Government Employees | 40 | 0.9% |
| Unpaid Family Workers | 0 | 0.0% |
| Total | 4,231 | 100.0% |
Employment Status by Age in Bryan
According to the labor force statistics for Bryan, out of the total population over 16 years of age (7,346), 59.5% or 4,371 individuals are in the labor force, with 3.2% or 140 of them unemployed. The age group with the highest labor force participation rate is 45 to 54 years, with 91.1% or 864 individuals in the labor force. Within the labor force, the 55 to 59 years age range has the highest percentage of unemployed individuals, with 16.6% or 84 of them being unemployed.
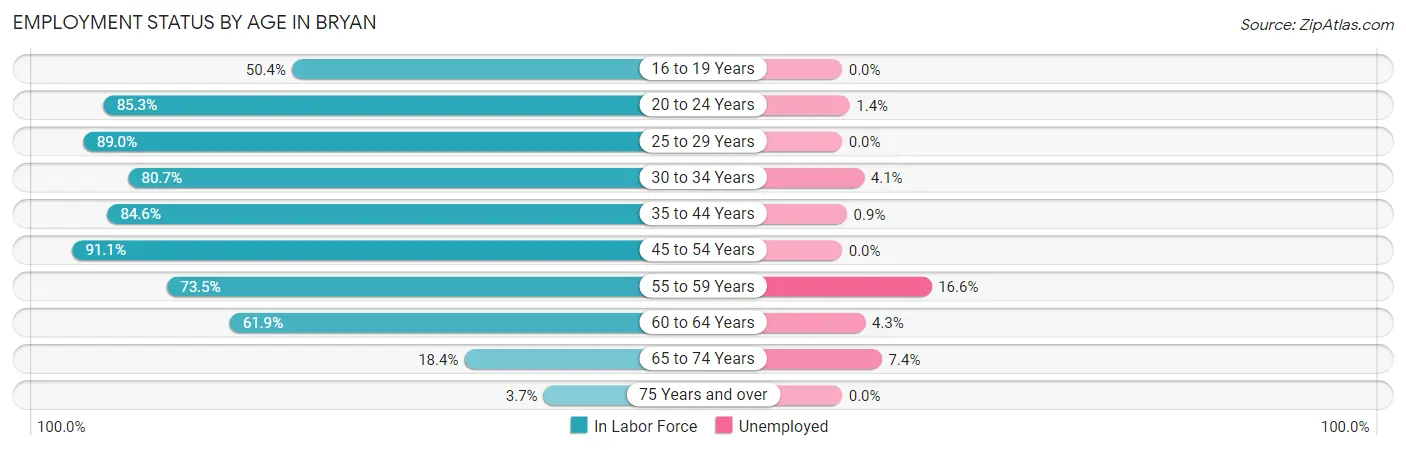
| Age Bracket | In Labor Force | Unemployed |
| 16 to 19 Years | 118 (50.4%) | 0 (0.0%) |
| 20 to 24 Years | 509 (85.3%) | 7 (1.4%) |
| 25 to 29 Years | 612 (89.0%) | 0 (0.0%) |
| 30 to 34 Years | 268 (80.7%) | 11 (4.1%) |
| 35 to 44 Years | 913 (84.6%) | 8 (0.9%) |
| 45 to 54 Years | 864 (91.1%) | 0 (0.0%) |
| 55 to 59 Years | 506 (73.5%) | 84 (16.6%) |
| 60 to 64 Years | 325 (61.9%) | 14 (4.3%) |
| 65 to 74 Years | 215 (18.4%) | 16 (7.4%) |
| 75 Years and over | 40 (3.7%) | 0 (0.0%) |
| Total | 4,371 (59.5%) | 140 (3.2%) |
Employment Status by Educational Attainment in Bryan
According to labor force statistics for Bryan, 81.9% of individuals (3,489) out of the total population between 25 and 64 years of age (4,260) are in the labor force, with 3.4% or 119 of them being unemployed. The group with the highest labor force participation rate are those with the educational attainment of college / associate degree, with 86.9% or 1,448 individuals in the labor force. Within the labor force, individuals with high school diploma education have the highest percentage of unemployment, with 7.6% or 103 of them being unemployed.
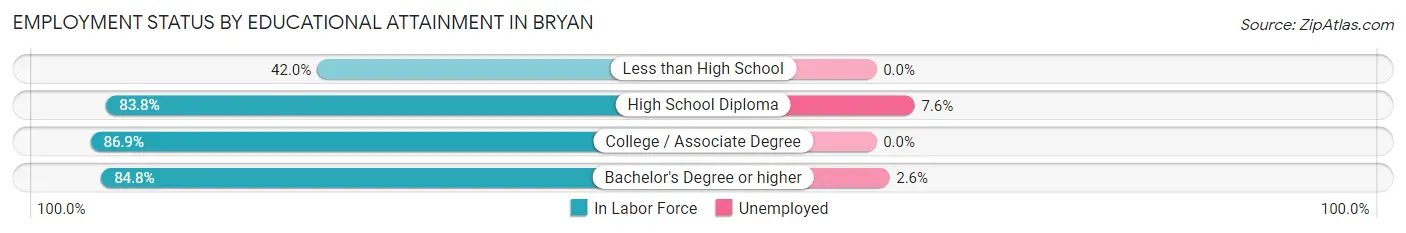
| Educational Attainment | In Labor Force | Unemployed |
| Less than High School | 141 (42.0%) | 0 (0.0%) |
| High School Diploma | 1,353 (83.8%) | 123 (7.6%) |
| College / Associate Degree | 1,448 (86.9%) | 0 (0.0%) |
| Bachelor's Degree or higher | 545 (84.8%) | 17 (2.6%) |
| Total | 3,489 (81.9%) | 145 (3.4%) |
Employment Occupations by Sex in Bryan
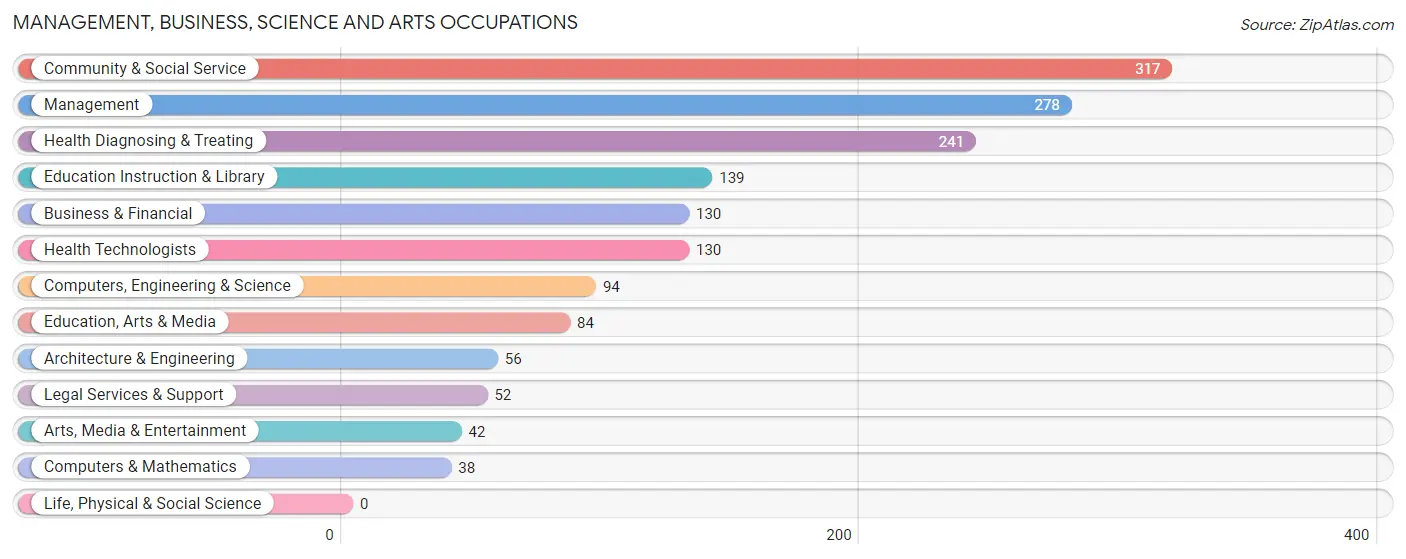
Management, Business, Science and Arts Occupations
The most common Management, Business, Science and Arts occupations in Bryan are Community & Social Service (317 | 7.5%), Management (278 | 6.6%), Health Diagnosing & Treating (241 | 5.7%), Education Instruction & Library (139 | 3.3%), and Business & Financial (130 | 3.1%).
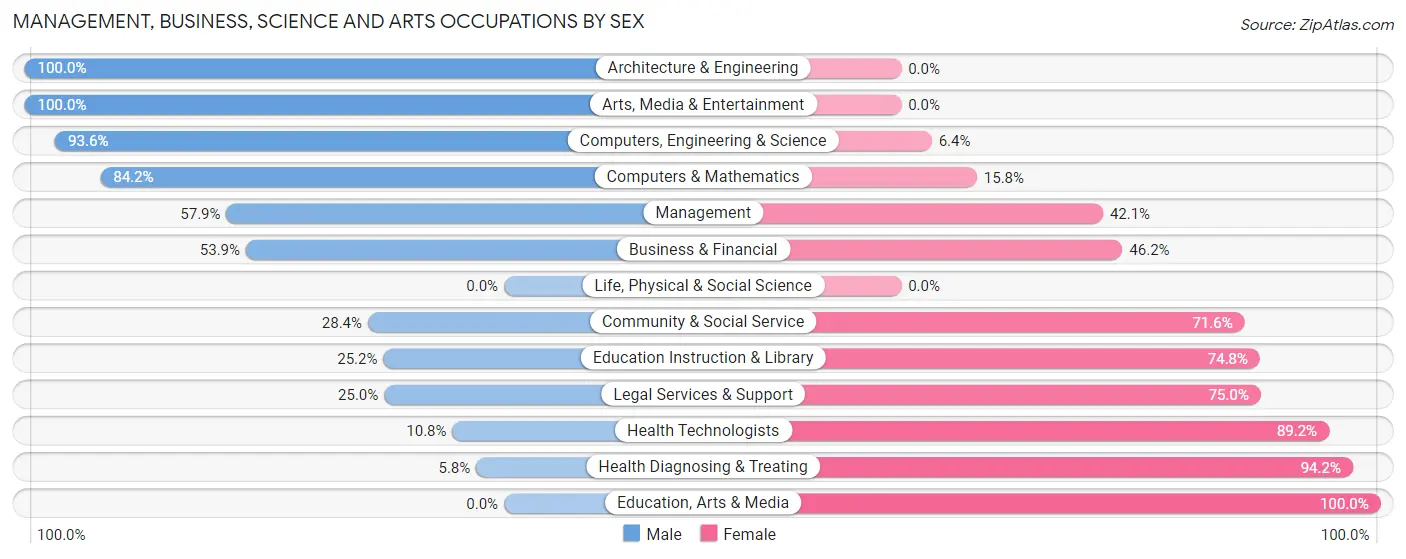
Management, Business, Science and Arts Occupations by Sex
Within the Management, Business, Science and Arts occupations in Bryan, the most male-oriented occupations are Architecture & Engineering (100.0%), Arts, Media & Entertainment (100.0%), and Computers, Engineering & Science (93.6%), while the most female-oriented occupations are Education, Arts & Media (100.0%), Health Diagnosing & Treating (94.2%), and Health Technologists (89.2%).
| Occupation | Male | Female |
| Management | 161 (57.9%) | 117 (42.1%) |
| Business & Financial | 70 (53.8%) | 60 (46.2%) |
| Computers, Engineering & Science | 88 (93.6%) | 6 (6.4%) |
| Computers & Mathematics | 32 (84.2%) | 6 (15.8%) |
| Architecture & Engineering | 56 (100.0%) | 0 (0.0%) |
| Life, Physical & Social Science | 0 (0.0%) | 0 (0.0%) |
| Community & Social Service | 90 (28.4%) | 227 (71.6%) |
| Education, Arts & Media | 0 (0.0%) | 84 (100.0%) |
| Legal Services & Support | 13 (25.0%) | 39 (75.0%) |
| Education Instruction & Library | 35 (25.2%) | 104 (74.8%) |
| Arts, Media & Entertainment | 42 (100.0%) | 0 (0.0%) |
| Health Diagnosing & Treating | 14 (5.8%) | 227 (94.2%) |
| Health Technologists | 14 (10.8%) | 116 (89.2%) |
| Total (Category) | 423 (39.9%) | 637 (60.1%) |
| Total (Overall) | 2,176 (51.4%) | 2,055 (48.6%) |
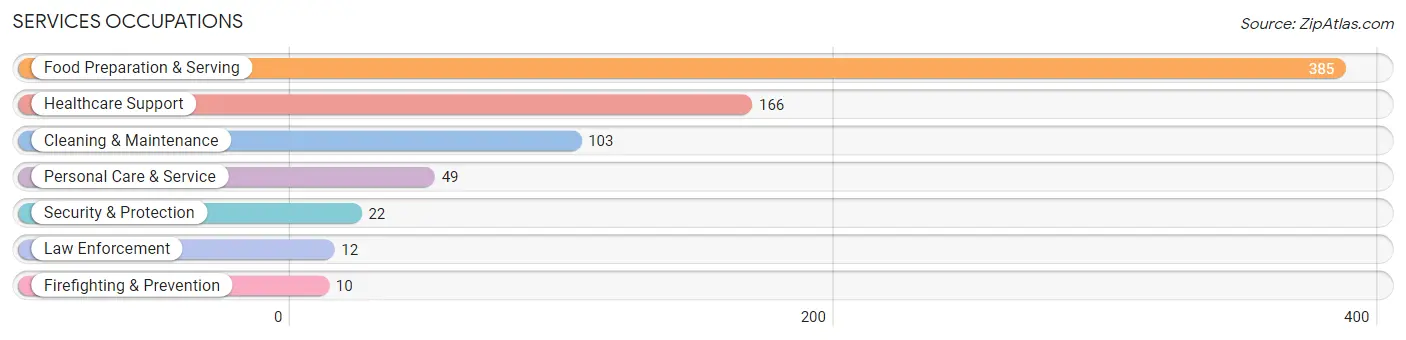
Services Occupations
The most common Services occupations in Bryan are Food Preparation & Serving (385 | 9.1%), Healthcare Support (166 | 3.9%), Cleaning & Maintenance (103 | 2.4%), Personal Care & Service (49 | 1.2%), and Security & Protection (22 | 0.5%).
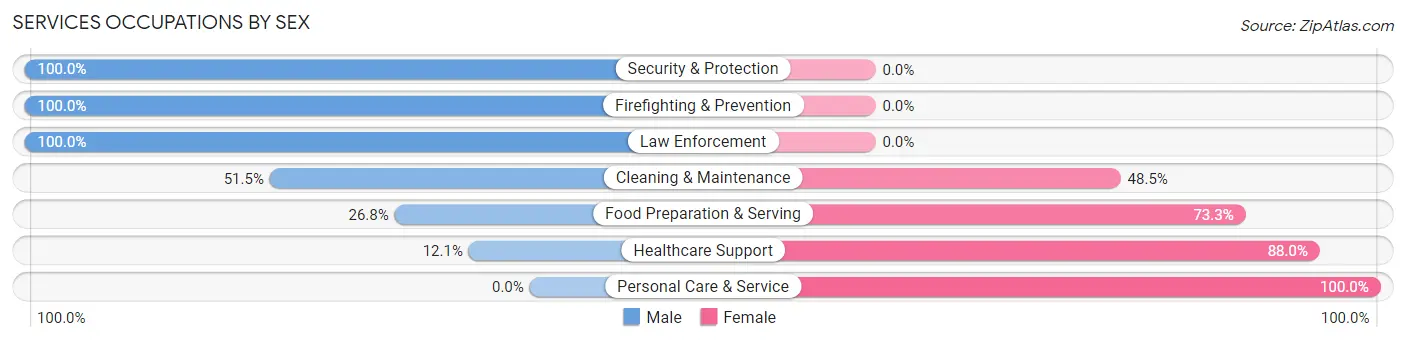
Services Occupations by Sex
Within the Services occupations in Bryan, the most male-oriented occupations are Security & Protection (100.0%), Firefighting & Prevention (100.0%), and Law Enforcement (100.0%), while the most female-oriented occupations are Personal Care & Service (100.0%), Healthcare Support (87.9%), and Food Preparation & Serving (73.3%).
| Occupation | Male | Female |
| Healthcare Support | 20 (12.0%) | 146 (87.9%) |
| Security & Protection | 22 (100.0%) | 0 (0.0%) |
| Firefighting & Prevention | 10 (100.0%) | 0 (0.0%) |
| Law Enforcement | 12 (100.0%) | 0 (0.0%) |
| Food Preparation & Serving | 103 (26.8%) | 282 (73.3%) |
| Cleaning & Maintenance | 53 (51.5%) | 50 (48.5%) |
| Personal Care & Service | 0 (0.0%) | 49 (100.0%) |
| Total (Category) | 198 (27.3%) | 527 (72.7%) |
| Total (Overall) | 2,176 (51.4%) | 2,055 (48.6%) |
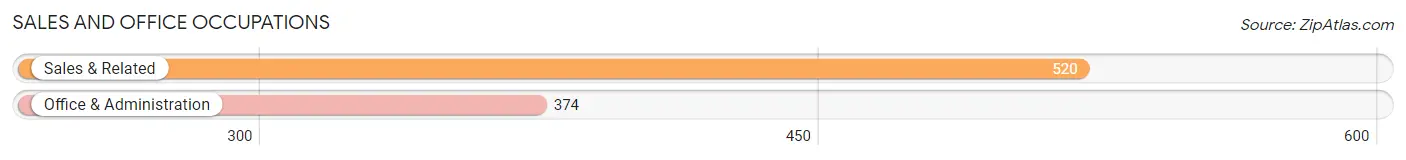
Sales and Office Occupations
The most common Sales and Office occupations in Bryan are Sales & Related (520 | 12.3%), and Office & Administration (374 | 8.8%).
Sales and Office Occupations by Sex
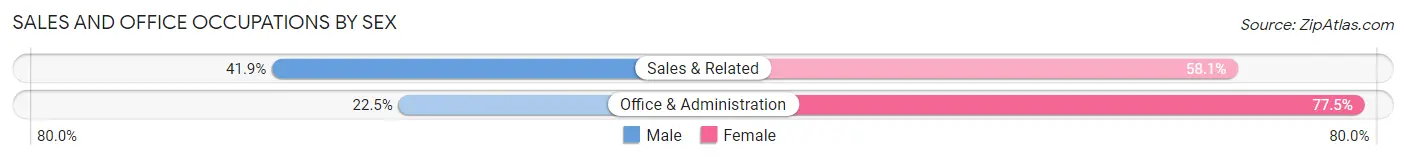
| Occupation | Male | Female |
| Sales & Related | 218 (41.9%) | 302 (58.1%) |
| Office & Administration | 84 (22.5%) | 290 (77.5%) |
| Total (Category) | 302 (33.8%) | 592 (66.2%) |
| Total (Overall) | 2,176 (51.4%) | 2,055 (48.6%) |
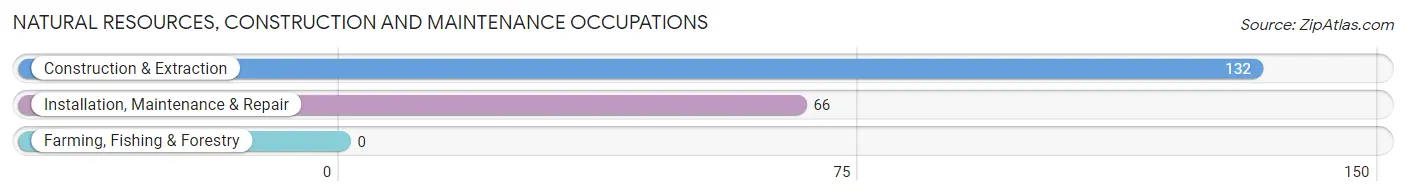
Natural Resources, Construction and Maintenance Occupations
The most common Natural Resources, Construction and Maintenance occupations in Bryan are Construction & Extraction (132 | 3.1%), and Installation, Maintenance & Repair (66 | 1.6%).
Natural Resources, Construction and Maintenance Occupations by Sex
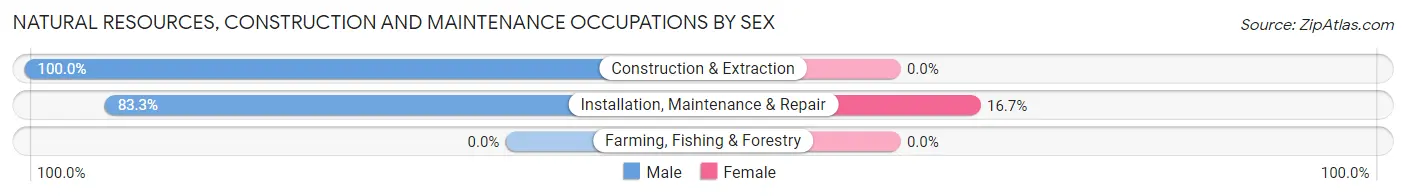
| Occupation | Male | Female |
| Farming, Fishing & Forestry | 0 (0.0%) | 0 (0.0%) |
| Construction & Extraction | 132 (100.0%) | 0 (0.0%) |
| Installation, Maintenance & Repair | 55 (83.3%) | 11 (16.7%) |
| Total (Category) | 187 (94.4%) | 11 (5.6%) |
| Total (Overall) | 2,176 (51.4%) | 2,055 (48.6%) |
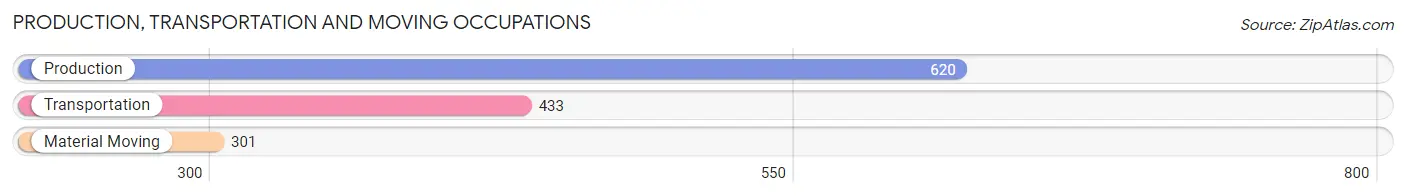
Production, Transportation and Moving Occupations
The most common Production, Transportation and Moving occupations in Bryan are Production (620 | 14.6%), Transportation (433 | 10.2%), and Material Moving (301 | 7.1%).
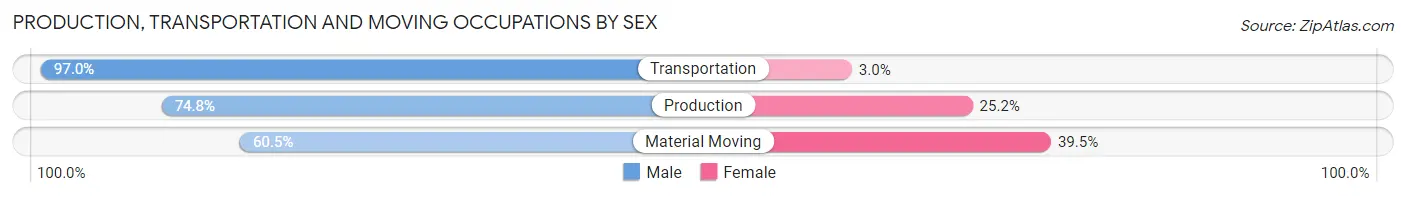
Production, Transportation and Moving Occupations by Sex
| Occupation | Male | Female |
| Production | 464 (74.8%) | 156 (25.2%) |
| Transportation | 420 (97.0%) | 13 (3.0%) |
| Material Moving | 182 (60.5%) | 119 (39.5%) |
| Total (Category) | 1,066 (78.7%) | 288 (21.3%) |
| Total (Overall) | 2,176 (51.4%) | 2,055 (48.6%) |
Employment Industries by Sex in Bryan
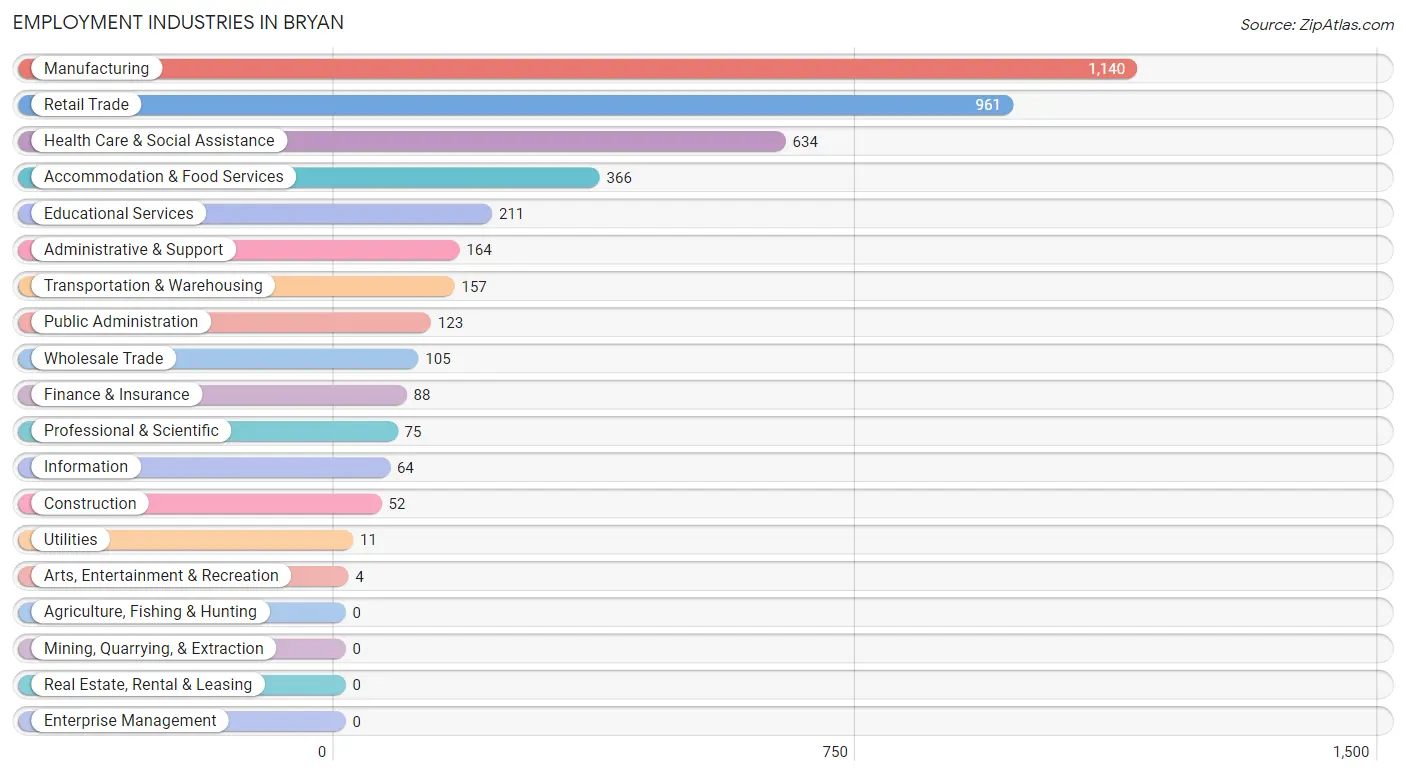
Employment Industries in Bryan
The major employment industries in Bryan include Manufacturing (1,140 | 26.9%), Retail Trade (961 | 22.7%), Health Care & Social Assistance (634 | 15.0%), Accommodation & Food Services (366 | 8.6%), and Educational Services (211 | 5.0%).
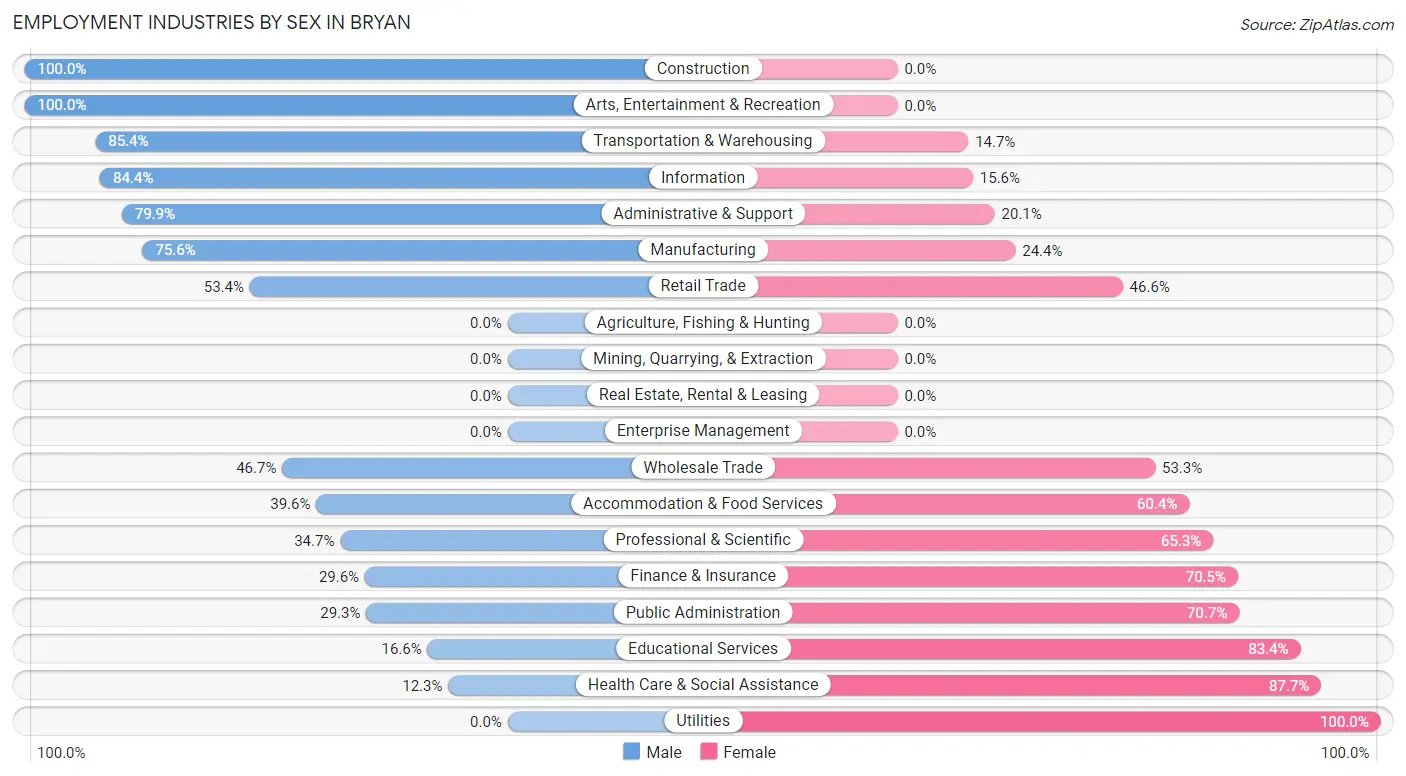
Employment Industries by Sex in Bryan
The Bryan industries that see more men than women are Construction (100.0%), Arts, Entertainment & Recreation (100.0%), and Transportation & Warehousing (85.4%), whereas the industries that tend to have a higher number of women are Utilities (100.0%), Health Care & Social Assistance (87.7%), and Educational Services (83.4%).
| Industry | Male | Female |
| Agriculture, Fishing & Hunting | 0 (0.0%) | 0 (0.0%) |
| Mining, Quarrying, & Extraction | 0 (0.0%) | 0 (0.0%) |
| Construction | 52 (100.0%) | 0 (0.0%) |
| Manufacturing | 862 (75.6%) | 278 (24.4%) |
| Wholesale Trade | 49 (46.7%) | 56 (53.3%) |
| Retail Trade | 513 (53.4%) | 448 (46.6%) |
| Transportation & Warehousing | 134 (85.4%) | 23 (14.6%) |
| Utilities | 0 (0.0%) | 11 (100.0%) |
| Information | 54 (84.4%) | 10 (15.6%) |
| Finance & Insurance | 26 (29.5%) | 62 (70.5%) |
| Real Estate, Rental & Leasing | 0 (0.0%) | 0 (0.0%) |
| Professional & Scientific | 26 (34.7%) | 49 (65.3%) |
| Enterprise Management | 0 (0.0%) | 0 (0.0%) |
| Administrative & Support | 131 (79.9%) | 33 (20.1%) |
| Educational Services | 35 (16.6%) | 176 (83.4%) |
| Health Care & Social Assistance | 78 (12.3%) | 556 (87.7%) |
| Arts, Entertainment & Recreation | 4 (100.0%) | 0 (0.0%) |
| Accommodation & Food Services | 145 (39.6%) | 221 (60.4%) |
| Public Administration | 36 (29.3%) | 87 (70.7%) |
| Total | 2,176 (51.4%) | 2,055 (48.6%) |
Education in Bryan
School Enrollment in Bryan
The most common levels of schooling among the 1,300 students in Bryan are elementary school (373 | 28.7%), high school (358 | 27.5%), and middle school (225 | 17.3%).
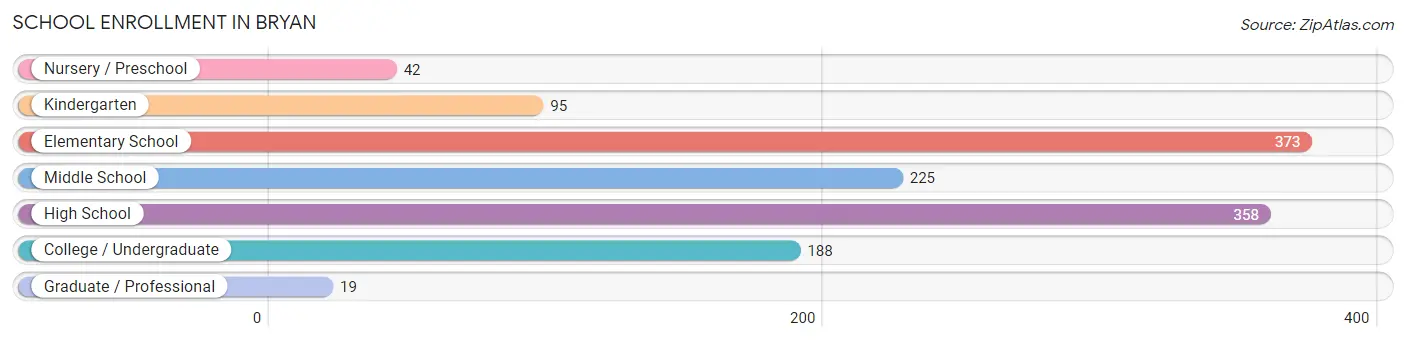
| School Level | # Students | % Students |
| Nursery / Preschool | 42 | 3.2% |
| Kindergarten | 95 | 7.3% |
| Elementary School | 373 | 28.7% |
| Middle School | 225 | 17.3% |
| High School | 358 | 27.5% |
| College / Undergraduate | 188 | 14.5% |
| Graduate / Professional | 19 | 1.5% |
| Total | 1,300 | 100.0% |
School Enrollment by Age by Funding Source in Bryan
Out of a total of 1,300 students who are enrolled in schools in Bryan, 32 (2.5%) attend a private institution, while the remaining 1,268 (97.5%) are enrolled in public schools. The age group of 35 years and over has the highest likelihood of being enrolled in private schools, with 21 (34.4% in the age bracket) enrolled. Conversely, the age group of 3 to 4 year olds has the lowest likelihood of being enrolled in a private school, with 16 (100.0% in the age bracket) attending a public institution.
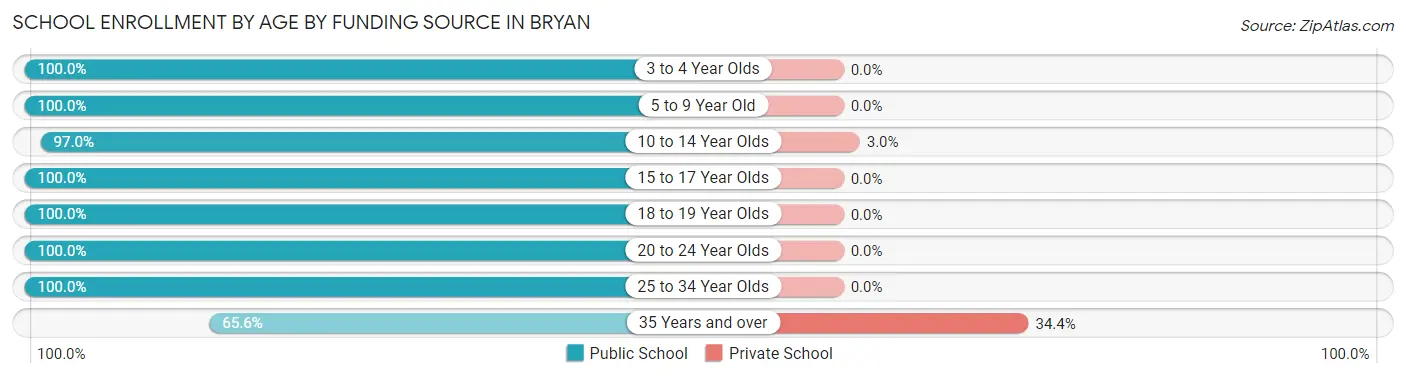
| Age Bracket | Public School | Private School |
| 3 to 4 Year Olds | 16 (100.0%) | 0 (0.0%) |
| 5 to 9 Year Old | 399 (100.0%) | 0 (0.0%) |
| 10 to 14 Year Olds | 388 (97.0%) | 12 (3.0%) |
| 15 to 17 Year Olds | 253 (100.0%) | 0 (0.0%) |
| 18 to 19 Year Olds | 65 (100.0%) | 0 (0.0%) |
| 20 to 24 Year Olds | 78 (100.0%) | 0 (0.0%) |
| 25 to 34 Year Olds | 28 (100.0%) | 0 (0.0%) |
| 35 Years and over | 40 (65.6%) | 21 (34.4%) |
| Total | 1,268 (97.5%) | 32 (2.5%) |
Educational Attainment by Field of Study in Bryan
Education (355 | 34.9%), business (203 | 19.9%), science & technology (124 | 12.2%), arts & humanities (108 | 10.6%), and bio, nature & agricultural (40 | 3.9%) are the most common fields of study among 1,018 individuals in Bryan who have obtained a bachelor's degree or higher.
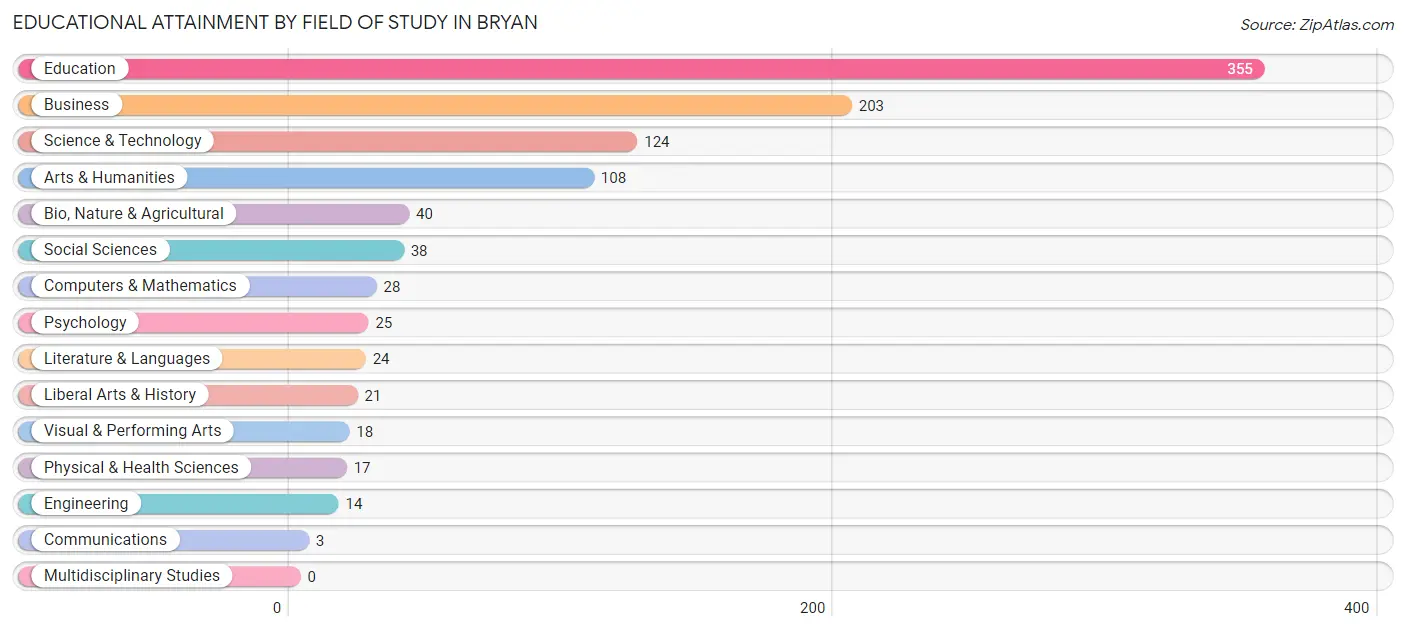
| Field of Study | # Graduates | % Graduates |
| Computers & Mathematics | 28 | 2.8% |
| Bio, Nature & Agricultural | 40 | 3.9% |
| Physical & Health Sciences | 17 | 1.7% |
| Psychology | 25 | 2.5% |
| Social Sciences | 38 | 3.7% |
| Engineering | 14 | 1.4% |
| Multidisciplinary Studies | 0 | 0.0% |
| Science & Technology | 124 | 12.2% |
| Business | 203 | 19.9% |
| Education | 355 | 34.9% |
| Literature & Languages | 24 | 2.4% |
| Liberal Arts & History | 21 | 2.1% |
| Visual & Performing Arts | 18 | 1.8% |
| Communications | 3 | 0.3% |
| Arts & Humanities | 108 | 10.6% |
| Total | 1,018 | 100.0% |
Transportation & Commute in Bryan
Vehicle Availability by Sex in Bryan
The most prevalent vehicle ownership categories in Bryan are males with 2 vehicles (774, accounting for 35.7%) and females with 2 vehicles (859, making up 37.7%).
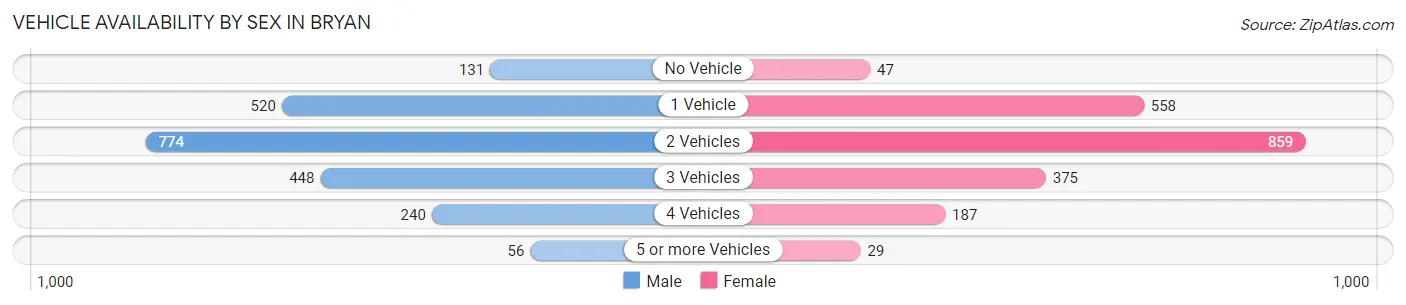
| Vehicles Available | Male | Female |
| No Vehicle | 131 (6.0%) | 47 (2.3%) |
| 1 Vehicle | 520 (24.0%) | 558 (27.2%) |
| 2 Vehicles | 774 (35.7%) | 859 (41.8%) |
| 3 Vehicles | 448 (20.6%) | 375 (18.2%) |
| 4 Vehicles | 240 (11.1%) | 187 (9.1%) |
| 5 or more Vehicles | 56 (2.6%) | 29 (1.4%) |
| Total | 2,169 (100.0%) | 2,055 (100.0%) |
Commute Time in Bryan
The most frequently occuring commute durations in Bryan are 5 to 9 minutes (1,528 commuters, 36.8%), 10 to 14 minutes (619 commuters, 14.9%), and 20 to 24 minutes (503 commuters, 12.1%).
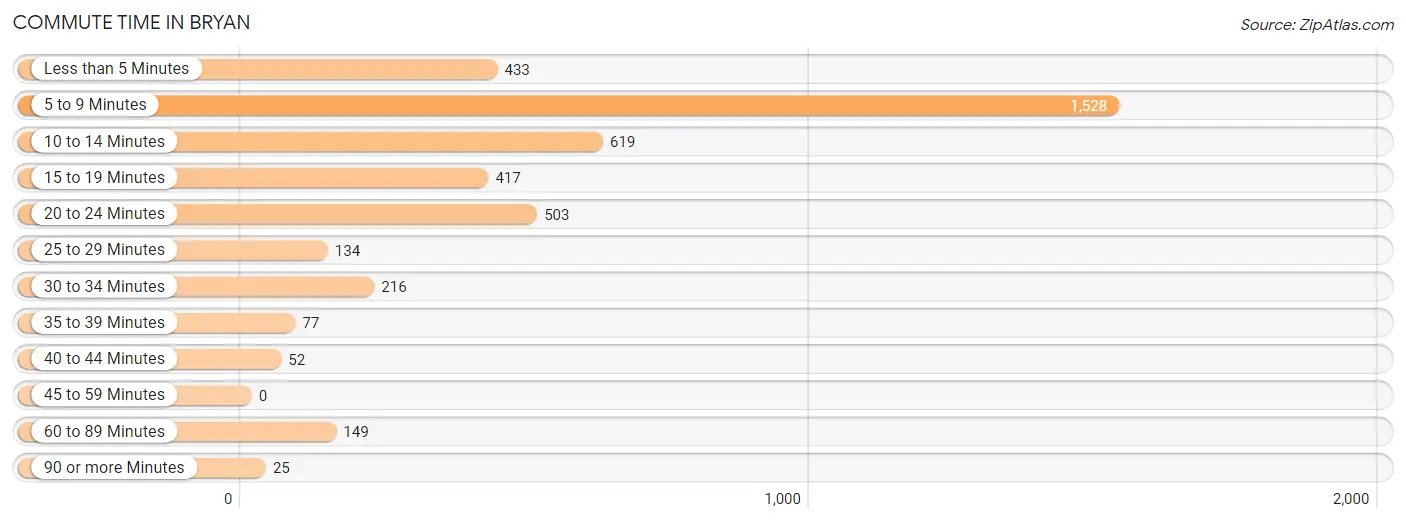
| Commute Time | # Commuters | % Commuters |
| Less than 5 Minutes | 433 | 10.4% |
| 5 to 9 Minutes | 1,528 | 36.8% |
| 10 to 14 Minutes | 619 | 14.9% |
| 15 to 19 Minutes | 417 | 10.0% |
| 20 to 24 Minutes | 503 | 12.1% |
| 25 to 29 Minutes | 134 | 3.2% |
| 30 to 34 Minutes | 216 | 5.2% |
| 35 to 39 Minutes | 77 | 1.8% |
| 40 to 44 Minutes | 52 | 1.3% |
| 45 to 59 Minutes | 0 | 0.0% |
| 60 to 89 Minutes | 149 | 3.6% |
| 90 or more Minutes | 25 | 0.6% |
Commute Time by Sex in Bryan
The most common commute times in Bryan are 5 to 9 minutes (713 commuters, 33.0%) for males and 5 to 9 minutes (815 commuters, 40.9%) for females.
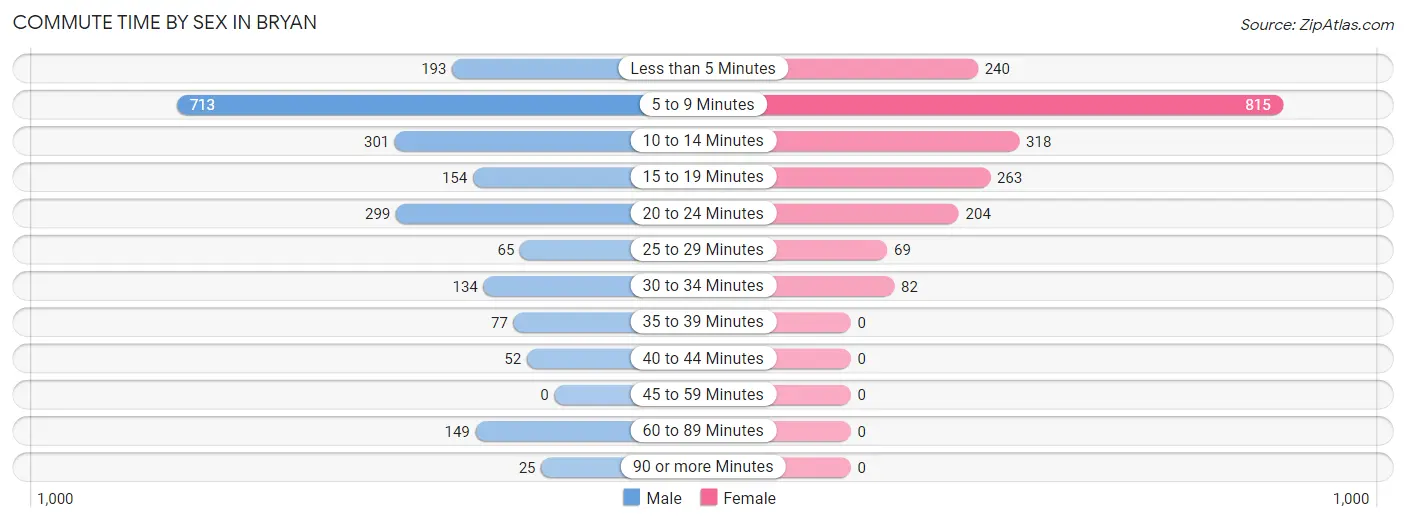
| Commute Time | Male | Female |
| Less than 5 Minutes | 193 (8.9%) | 240 (12.0%) |
| 5 to 9 Minutes | 713 (33.0%) | 815 (40.9%) |
| 10 to 14 Minutes | 301 (13.9%) | 318 (16.0%) |
| 15 to 19 Minutes | 154 (7.1%) | 263 (13.2%) |
| 20 to 24 Minutes | 299 (13.8%) | 204 (10.2%) |
| 25 to 29 Minutes | 65 (3.0%) | 69 (3.5%) |
| 30 to 34 Minutes | 134 (6.2%) | 82 (4.1%) |
| 35 to 39 Minutes | 77 (3.6%) | 0 (0.0%) |
| 40 to 44 Minutes | 52 (2.4%) | 0 (0.0%) |
| 45 to 59 Minutes | 0 (0.0%) | 0 (0.0%) |
| 60 to 89 Minutes | 149 (6.9%) | 0 (0.0%) |
| 90 or more Minutes | 25 (1.2%) | 0 (0.0%) |
Time of Departure to Work by Sex in Bryan
The most frequent times of departure to work in Bryan are 6:30 AM to 6:59 AM (391, 18.1%) for males and 12:00 PM to 3:59 PM (288, 14.5%) for females.
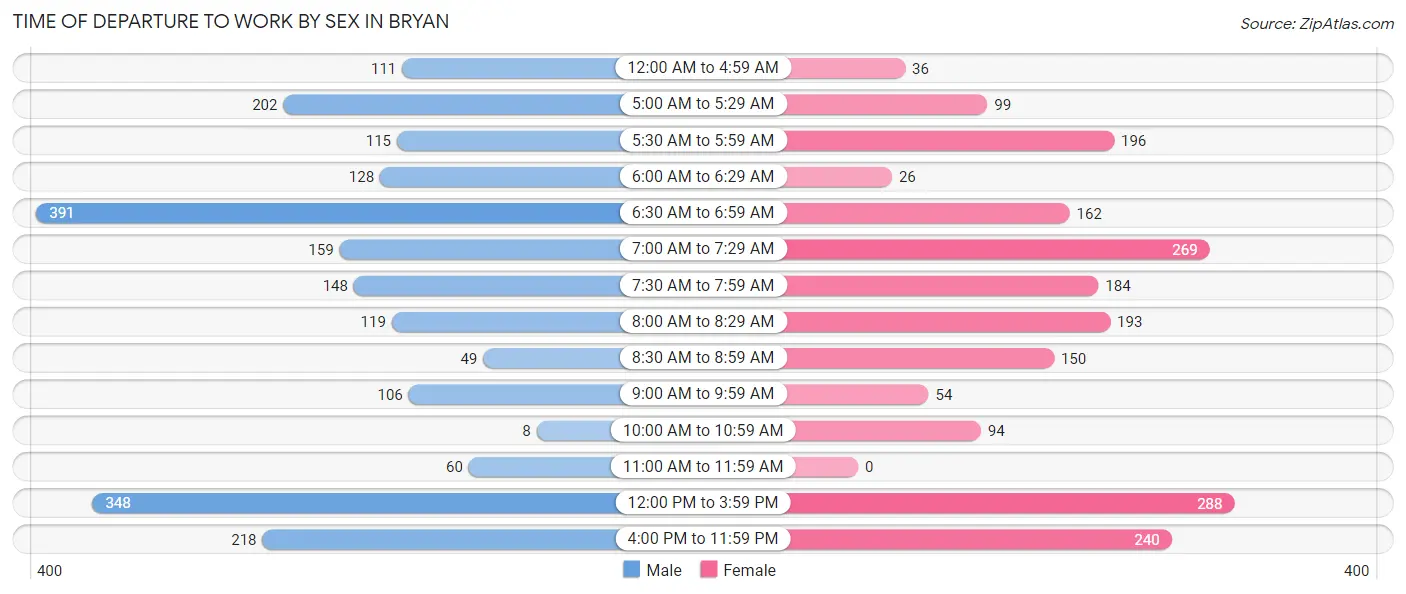
| Time of Departure | Male | Female |
| 12:00 AM to 4:59 AM | 111 (5.1%) | 36 (1.8%) |
| 5:00 AM to 5:29 AM | 202 (9.3%) | 99 (5.0%) |
| 5:30 AM to 5:59 AM | 115 (5.3%) | 196 (9.8%) |
| 6:00 AM to 6:29 AM | 128 (5.9%) | 26 (1.3%) |
| 6:30 AM to 6:59 AM | 391 (18.1%) | 162 (8.1%) |
| 7:00 AM to 7:29 AM | 159 (7.3%) | 269 (13.5%) |
| 7:30 AM to 7:59 AM | 148 (6.9%) | 184 (9.2%) |
| 8:00 AM to 8:29 AM | 119 (5.5%) | 193 (9.7%) |
| 8:30 AM to 8:59 AM | 49 (2.3%) | 150 (7.5%) |
| 9:00 AM to 9:59 AM | 106 (4.9%) | 54 (2.7%) |
| 10:00 AM to 10:59 AM | 8 (0.4%) | 94 (4.7%) |
| 11:00 AM to 11:59 AM | 60 (2.8%) | 0 (0.0%) |
| 12:00 PM to 3:59 PM | 348 (16.1%) | 288 (14.5%) |
| 4:00 PM to 11:59 PM | 218 (10.1%) | 240 (12.0%) |
| Total | 2,162 (100.0%) | 1,991 (100.0%) |
Housing Occupancy in Bryan
Occupancy by Ownership in Bryan
Of the total 4,142 dwellings in Bryan, owner-occupied units account for 2,548 (61.5%), while renter-occupied units make up 1,594 (38.5%).
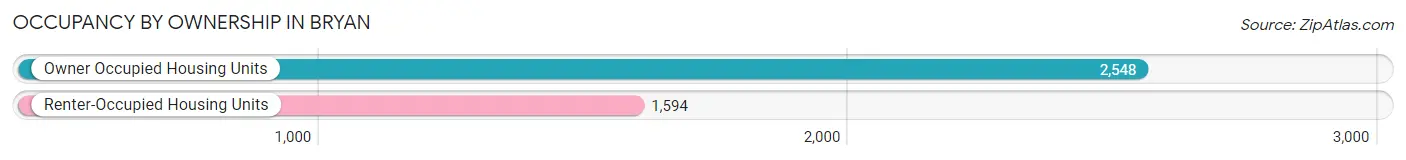
| Occupancy | # Housing Units | % Housing Units |
| Owner Occupied Housing Units | 2,548 | 61.5% |
| Renter-Occupied Housing Units | 1,594 | 38.5% |
| Total Occupied Housing Units | 4,142 | 100.0% |
Occupancy by Household Size in Bryan
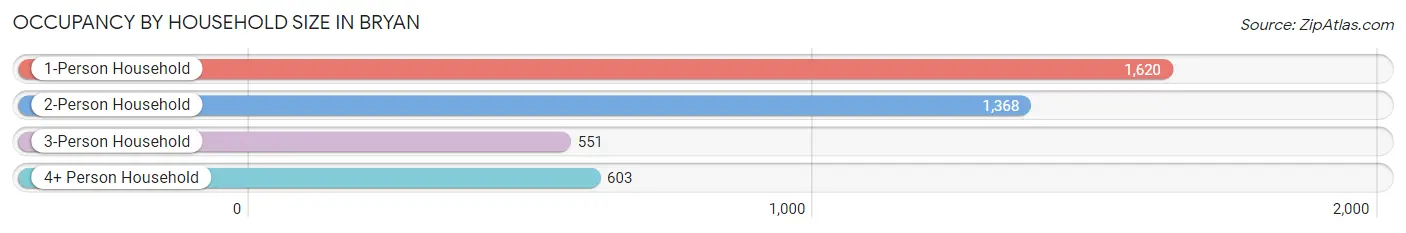
| Household Size | # Housing Units | % Housing Units |
| 1-Person Household | 1,620 | 39.1% |
| 2-Person Household | 1,368 | 33.0% |
| 3-Person Household | 551 | 13.3% |
| 4+ Person Household | 603 | 14.6% |
| Total Housing Units | 4,142 | 100.0% |
Occupancy by Ownership by Household Size in Bryan
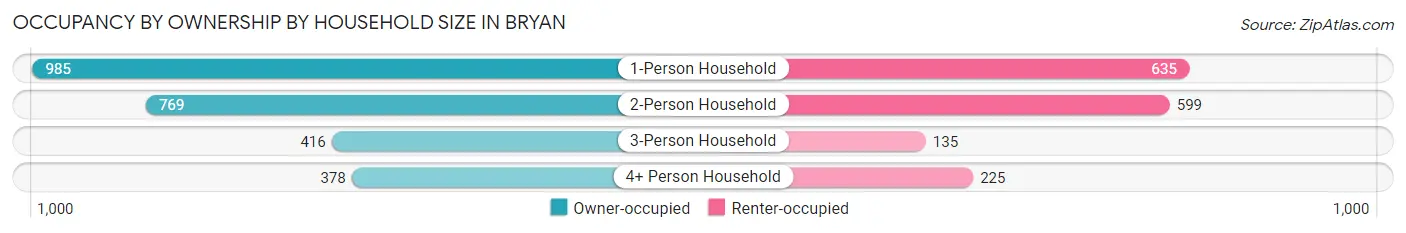
| Household Size | Owner-occupied | Renter-occupied |
| 1-Person Household | 985 (60.8%) | 635 (39.2%) |
| 2-Person Household | 769 (56.2%) | 599 (43.8%) |
| 3-Person Household | 416 (75.5%) | 135 (24.5%) |
| 4+ Person Household | 378 (62.7%) | 225 (37.3%) |
| Total Housing Units | 2,548 (61.5%) | 1,594 (38.5%) |
Occupancy by Educational Attainment in Bryan
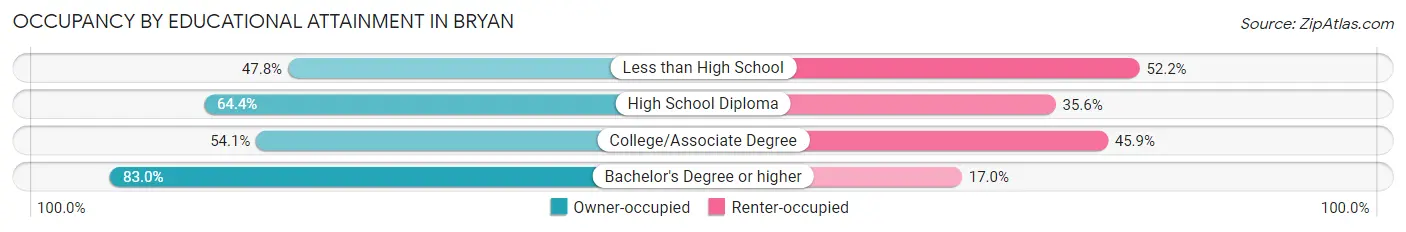
| Household Size | Owner-occupied | Renter-occupied |
| Less than High School | 174 (47.8%) | 190 (52.2%) |
| High School Diploma | 1,060 (64.4%) | 585 (35.6%) |
| College/Associate Degree | 854 (54.1%) | 725 (45.9%) |
| Bachelor's Degree or higher | 460 (83.0%) | 94 (17.0%) |
Occupancy by Age of Householder in Bryan
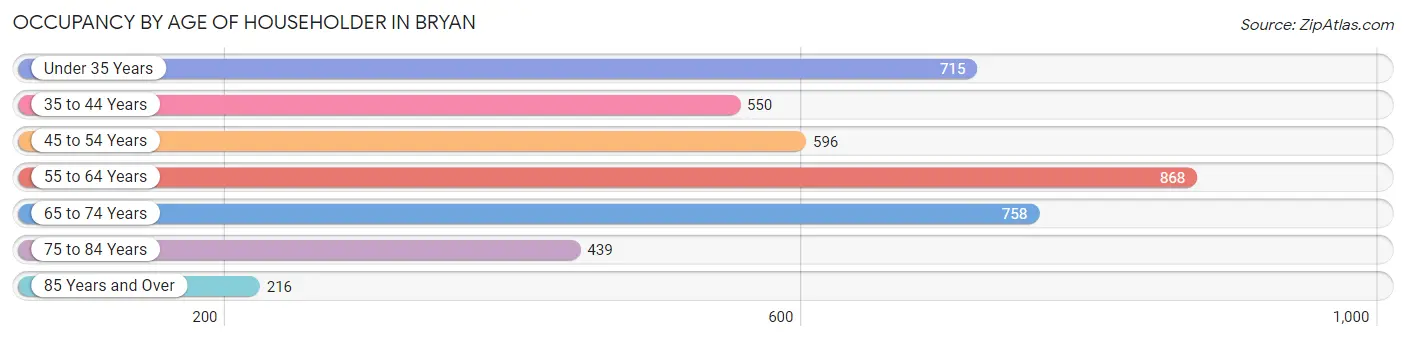
| Age Bracket | # Households | % Households |
| Under 35 Years | 715 | 17.3% |
| 35 to 44 Years | 550 | 13.3% |
| 45 to 54 Years | 596 | 14.4% |
| 55 to 64 Years | 868 | 21.0% |
| 65 to 74 Years | 758 | 18.3% |
| 75 to 84 Years | 439 | 10.6% |
| 85 Years and Over | 216 | 5.2% |
| Total | 4,142 | 100.0% |
Housing Finances in Bryan
Median Income by Occupancy in Bryan
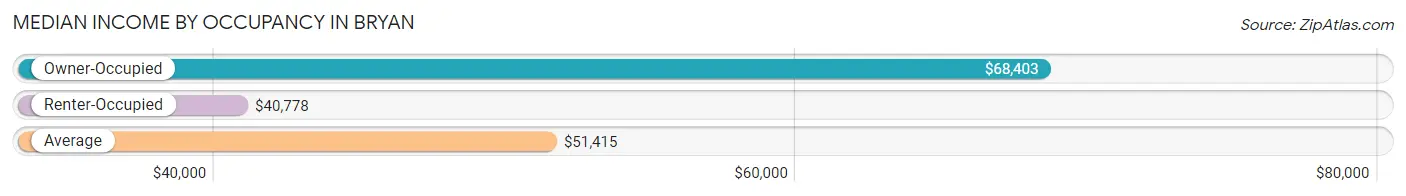
| Occupancy Type | # Households | Median Income |
| Owner-Occupied | 2,548 (61.5%) | $68,403 |
| Renter-Occupied | 1,594 (38.5%) | $40,778 |
| Average | 4,142 (100.0%) | $51,415 |
Occupancy by Householder Income Bracket in Bryan
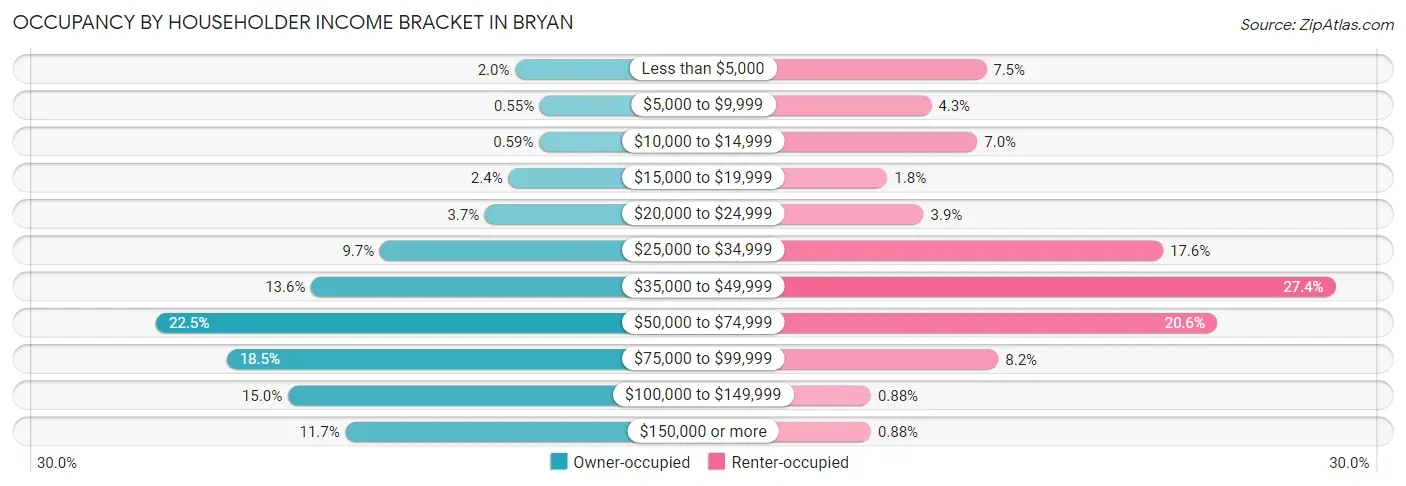
| Income Bracket | Owner-occupied | Renter-occupied |
| Less than $5,000 | 50 (2.0%) | 119 (7.5%) |
| $5,000 to $9,999 | 14 (0.5%) | 69 (4.3%) |
| $10,000 to $14,999 | 15 (0.6%) | 111 (7.0%) |
| $15,000 to $19,999 | 60 (2.4%) | 29 (1.8%) |
| $20,000 to $24,999 | 94 (3.7%) | 62 (3.9%) |
| $25,000 to $34,999 | 247 (9.7%) | 280 (17.6%) |
| $35,000 to $49,999 | 347 (13.6%) | 437 (27.4%) |
| $50,000 to $74,999 | 573 (22.5%) | 329 (20.6%) |
| $75,000 to $99,999 | 470 (18.4%) | 130 (8.2%) |
| $100,000 to $149,999 | 381 (14.9%) | 14 (0.9%) |
| $150,000 or more | 297 (11.7%) | 14 (0.9%) |
| Total | 2,548 (100.0%) | 1,594 (100.0%) |
Monthly Housing Cost Tiers in Bryan
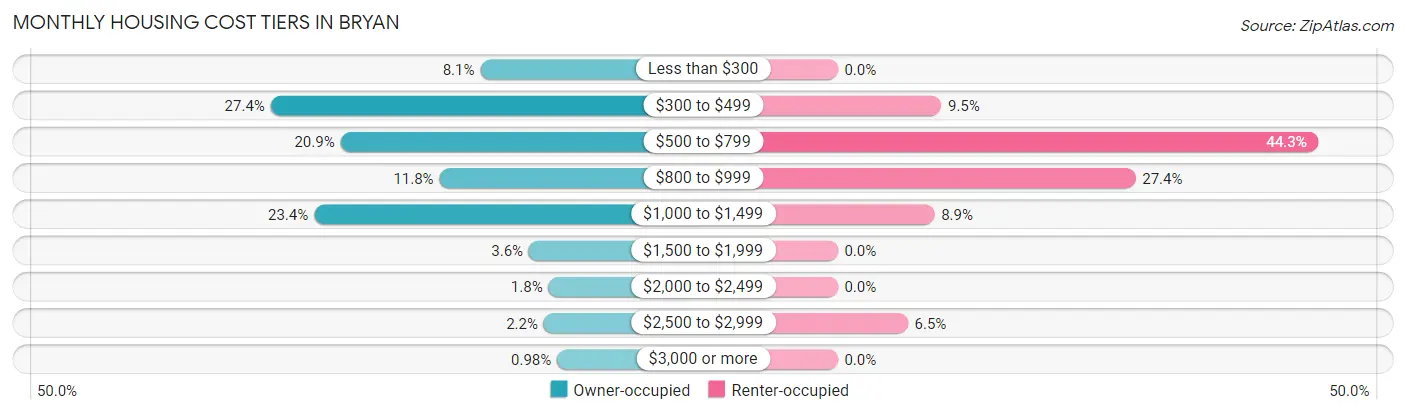
| Monthly Cost | Owner-occupied | Renter-occupied |
| Less than $300 | 205 (8.1%) | 0 (0.0%) |
| $300 to $499 | 697 (27.4%) | 152 (9.5%) |
| $500 to $799 | 533 (20.9%) | 706 (44.3%) |
| $800 to $999 | 301 (11.8%) | 437 (27.4%) |
| $1,000 to $1,499 | 595 (23.4%) | 142 (8.9%) |
| $1,500 to $1,999 | 91 (3.6%) | 0 (0.0%) |
| $2,000 to $2,499 | 45 (1.8%) | 0 (0.0%) |
| $2,500 to $2,999 | 56 (2.2%) | 103 (6.5%) |
| $3,000 or more | 25 (1.0%) | 0 (0.0%) |
| Total | 2,548 (100.0%) | 1,594 (100.0%) |
Physical Housing Characteristics in Bryan
Housing Structures in Bryan
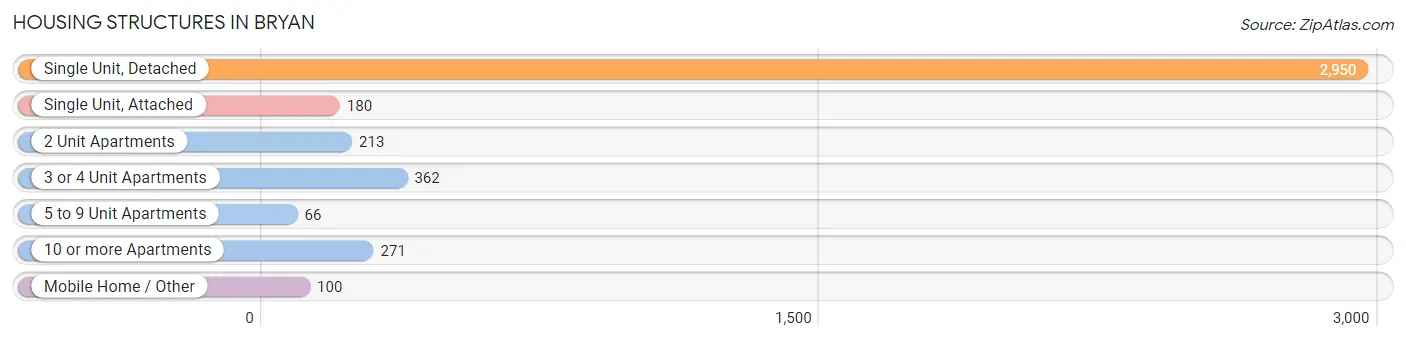
| Structure Type | # Housing Units | % Housing Units |
| Single Unit, Detached | 2,950 | 71.2% |
| Single Unit, Attached | 180 | 4.3% |
| 2 Unit Apartments | 213 | 5.1% |
| 3 or 4 Unit Apartments | 362 | 8.7% |
| 5 to 9 Unit Apartments | 66 | 1.6% |
| 10 or more Apartments | 271 | 6.5% |
| Mobile Home / Other | 100 | 2.4% |
| Total | 4,142 | 100.0% |
Housing Structures by Occupancy in Bryan
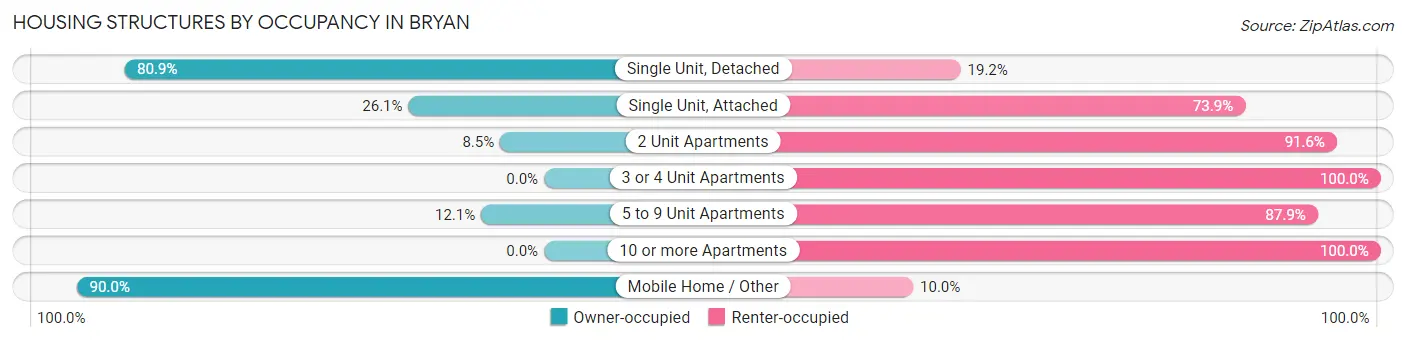
| Structure Type | Owner-occupied | Renter-occupied |
| Single Unit, Detached | 2,385 (80.8%) | 565 (19.2%) |
| Single Unit, Attached | 47 (26.1%) | 133 (73.9%) |
| 2 Unit Apartments | 18 (8.5%) | 195 (91.5%) |
| 3 or 4 Unit Apartments | 0 (0.0%) | 362 (100.0%) |
| 5 to 9 Unit Apartments | 8 (12.1%) | 58 (87.9%) |
| 10 or more Apartments | 0 (0.0%) | 271 (100.0%) |
| Mobile Home / Other | 90 (90.0%) | 10 (10.0%) |
| Total | 2,548 (61.5%) | 1,594 (38.5%) |
Housing Structures by Number of Rooms in Bryan
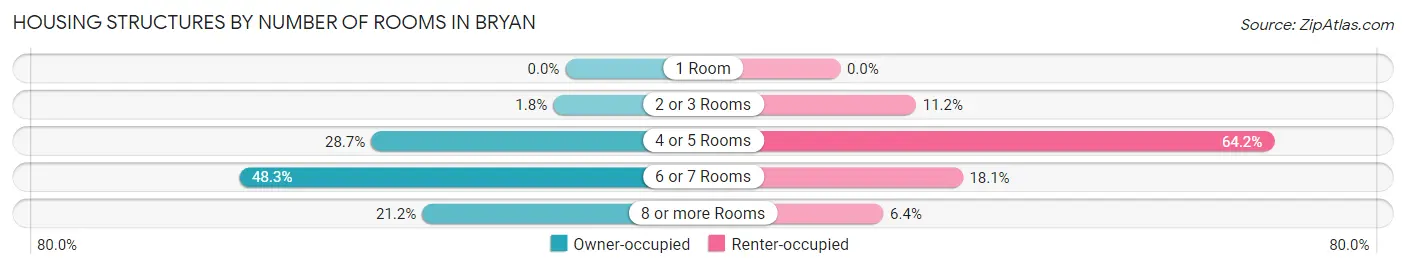
| Number of Rooms | Owner-occupied | Renter-occupied |
| 1 Room | 0 (0.0%) | 0 (0.0%) |
| 2 or 3 Rooms | 46 (1.8%) | 179 (11.2%) |
| 4 or 5 Rooms | 732 (28.7%) | 1,024 (64.2%) |
| 6 or 7 Rooms | 1,230 (48.3%) | 289 (18.1%) |
| 8 or more Rooms | 540 (21.2%) | 102 (6.4%) |
| Total | 2,548 (100.0%) | 1,594 (100.0%) |
Housing Structure by Heating Type in Bryan
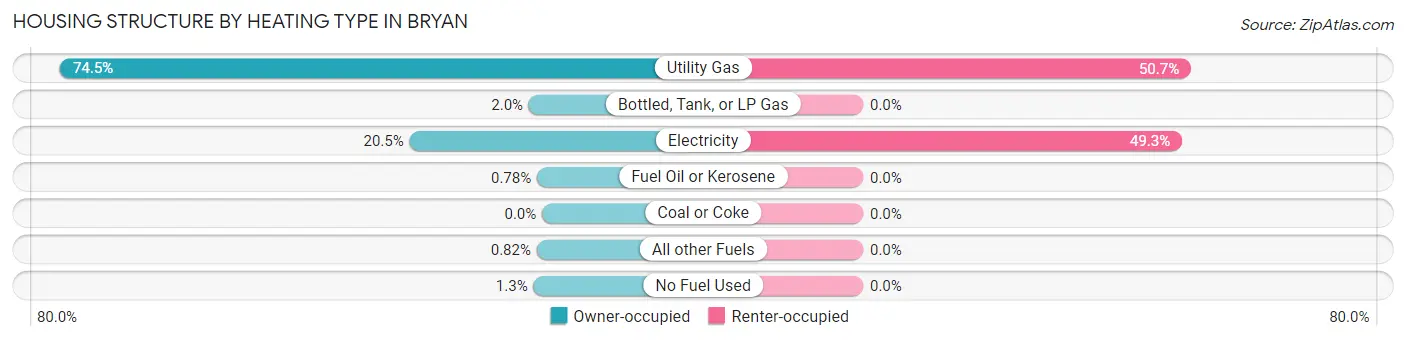
| Heating Type | Owner-occupied | Renter-occupied |
| Utility Gas | 1,899 (74.5%) | 808 (50.7%) |
| Bottled, Tank, or LP Gas | 52 (2.0%) | 0 (0.0%) |
| Electricity | 522 (20.5%) | 786 (49.3%) |
| Fuel Oil or Kerosene | 20 (0.8%) | 0 (0.0%) |
| Coal or Coke | 0 (0.0%) | 0 (0.0%) |
| All other Fuels | 21 (0.8%) | 0 (0.0%) |
| No Fuel Used | 34 (1.3%) | 0 (0.0%) |
| Total | 2,548 (100.0%) | 1,594 (100.0%) |
Household Vehicle Usage in Bryan
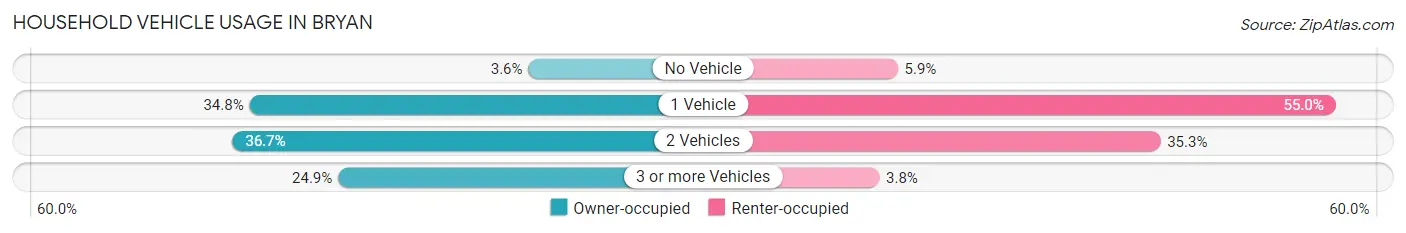
| Vehicles per Household | Owner-occupied | Renter-occupied |
| No Vehicle | 91 (3.6%) | 94 (5.9%) |
| 1 Vehicle | 887 (34.8%) | 876 (55.0%) |
| 2 Vehicles | 936 (36.7%) | 563 (35.3%) |
| 3 or more Vehicles | 634 (24.9%) | 61 (3.8%) |
| Total | 2,548 (100.0%) | 1,594 (100.0%) |
Real Estate & Mortgages in Bryan
Real Estate and Mortgage Overview in Bryan
| Characteristic | Without Mortgage | With Mortgage |
| Housing Units | 1,222 | 1,326 |
| Median Property Value | $112,700 | $140,500 |
| Median Household Income | $51,384 | $232 |
| Monthly Housing Costs | $434 | $25 |
| Real Estate Taxes | $1,503 | $13 |
Property Value by Mortgage Status in Bryan
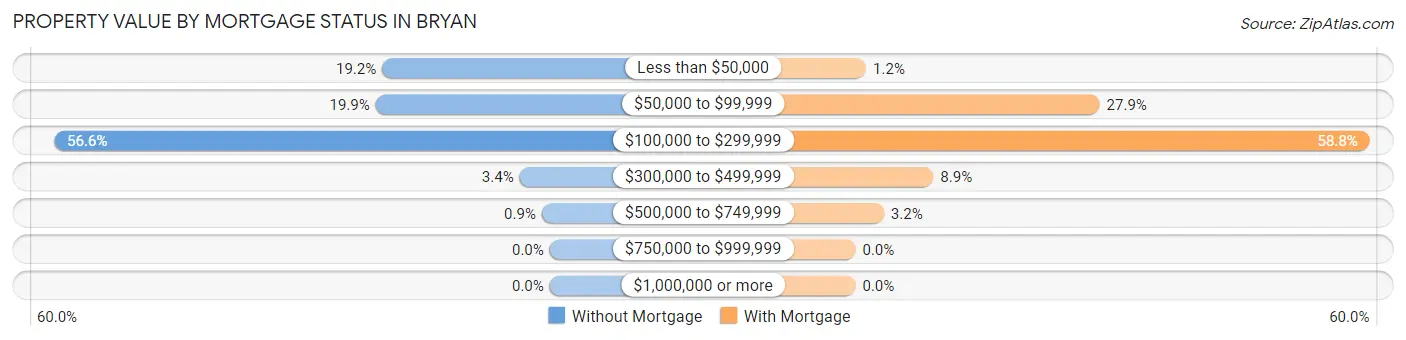
| Property Value | Without Mortgage | With Mortgage |
| Less than $50,000 | 234 (19.2%) | 16 (1.2%) |
| $50,000 to $99,999 | 243 (19.9%) | 370 (27.9%) |
| $100,000 to $299,999 | 692 (56.6%) | 779 (58.8%) |
| $300,000 to $499,999 | 42 (3.4%) | 118 (8.9%) |
| $500,000 to $749,999 | 11 (0.9%) | 43 (3.2%) |
| $750,000 to $999,999 | 0 (0.0%) | 0 (0.0%) |
| $1,000,000 or more | 0 (0.0%) | 0 (0.0%) |
| Total | 1,222 (100.0%) | 1,326 (100.0%) |
Household Income by Mortgage Status in Bryan
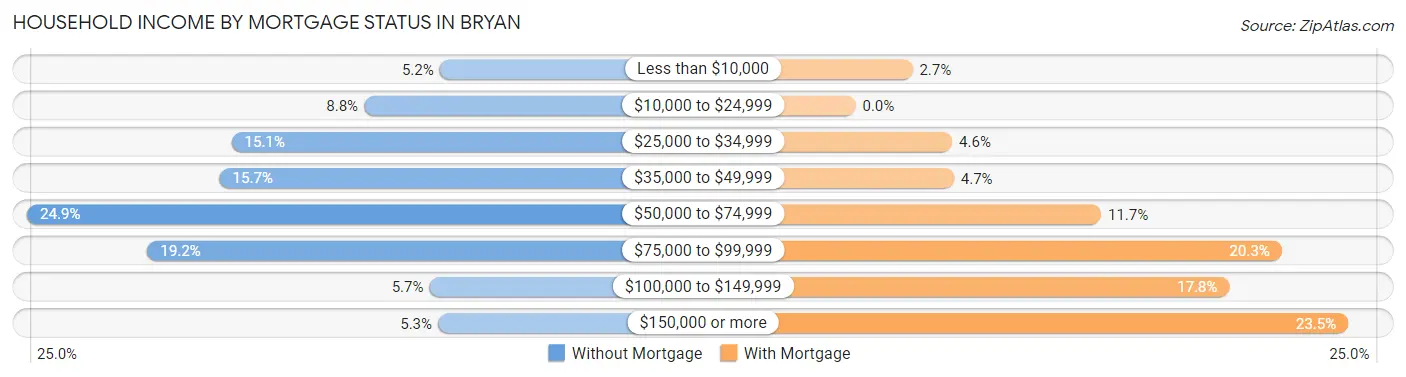
| Household Income | Without Mortgage | With Mortgage |
| Less than $10,000 | 64 (5.2%) | 36 (2.7%) |
| $10,000 to $24,999 | 108 (8.8%) | 0 (0.0%) |
| $25,000 to $34,999 | 185 (15.1%) | 61 (4.6%) |
| $35,000 to $49,999 | 192 (15.7%) | 62 (4.7%) |
| $50,000 to $74,999 | 304 (24.9%) | 155 (11.7%) |
| $75,000 to $99,999 | 234 (19.2%) | 269 (20.3%) |
| $100,000 to $149,999 | 70 (5.7%) | 236 (17.8%) |
| $150,000 or more | 65 (5.3%) | 311 (23.4%) |
| Total | 1,222 (100.0%) | 1,326 (100.0%) |
Property Value to Household Income Ratio in Bryan
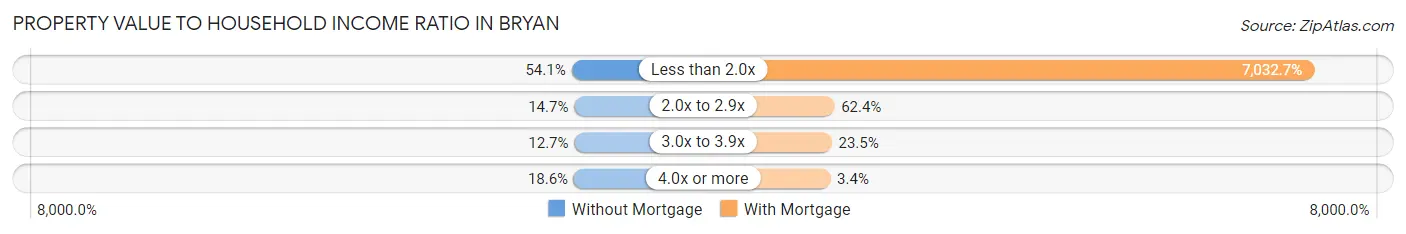
| Value-to-Income Ratio | Without Mortgage | With Mortgage |
| Less than 2.0x | 661 (54.1%) | 93,254 (7,032.7%) |
| 2.0x to 2.9x | 179 (14.6%) | 827 (62.4%) |
| 3.0x to 3.9x | 155 (12.7%) | 312 (23.5%) |
| 4.0x or more | 227 (18.6%) | 45 (3.4%) |
| Total | 1,222 (100.0%) | 1,326 (100.0%) |
Real Estate Taxes by Mortgage Status in Bryan
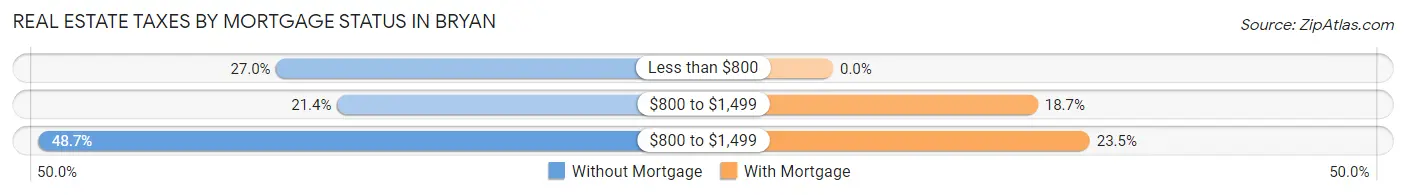
| Property Taxes | Without Mortgage | With Mortgage |
| Less than $800 | 330 (27.0%) | 0 (0.0%) |
| $800 to $1,499 | 262 (21.4%) | 248 (18.7%) |
| $800 to $1,499 | 595 (48.7%) | 311 (23.4%) |
| Total | 1,222 (100.0%) | 1,326 (100.0%) |
Health & Disability in Bryan
Health Insurance Coverage by Age in Bryan
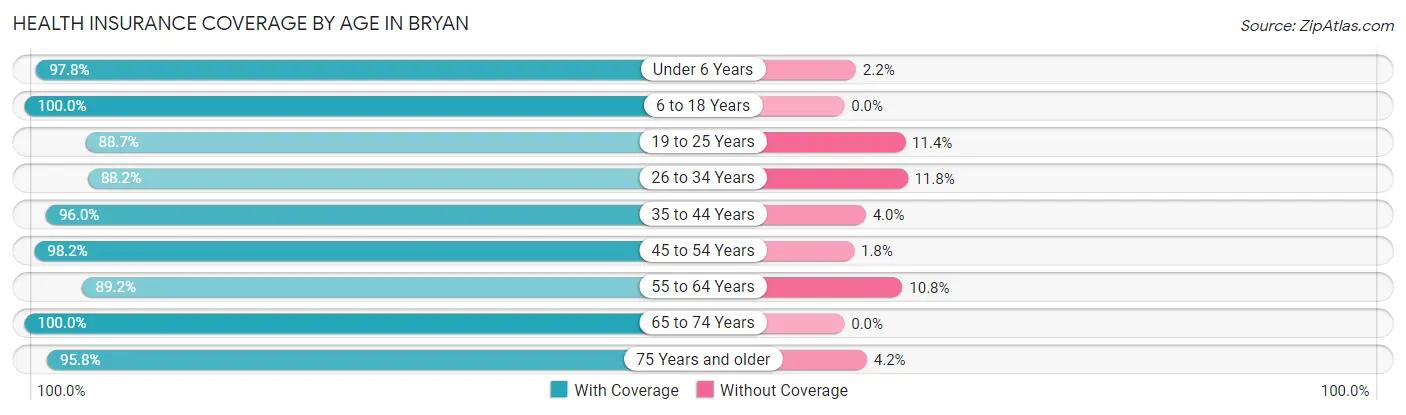
| Age Bracket | With Coverage | Without Coverage |
| Under 6 Years | 406 (97.8%) | 9 (2.2%) |
| 6 to 18 Years | 1,059 (100.0%) | 0 (0.0%) |
| 19 to 25 Years | 703 (88.6%) | 90 (11.4%) |
| 26 to 34 Years | 801 (88.2%) | 107 (11.8%) |
| 35 to 44 Years | 1,036 (96.0%) | 43 (4.0%) |
| 45 to 54 Years | 917 (98.2%) | 17 (1.8%) |
| 55 to 64 Years | 1,062 (89.2%) | 129 (10.8%) |
| 65 to 74 Years | 1,145 (100.0%) | 0 (0.0%) |
| 75 Years and older | 981 (95.8%) | 43 (4.2%) |
| Total | 8,110 (94.9%) | 438 (5.1%) |
Health Insurance Coverage by Citizenship Status in Bryan
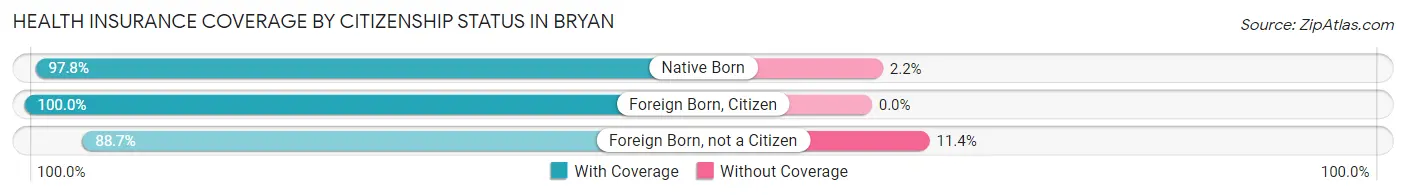
| Citizenship Status | With Coverage | Without Coverage |
| Native Born | 406 (97.8%) | 9 (2.2%) |
| Foreign Born, Citizen | 1,059 (100.0%) | 0 (0.0%) |
| Foreign Born, not a Citizen | 703 (88.6%) | 90 (11.4%) |
Health Insurance Coverage by Household Income in Bryan
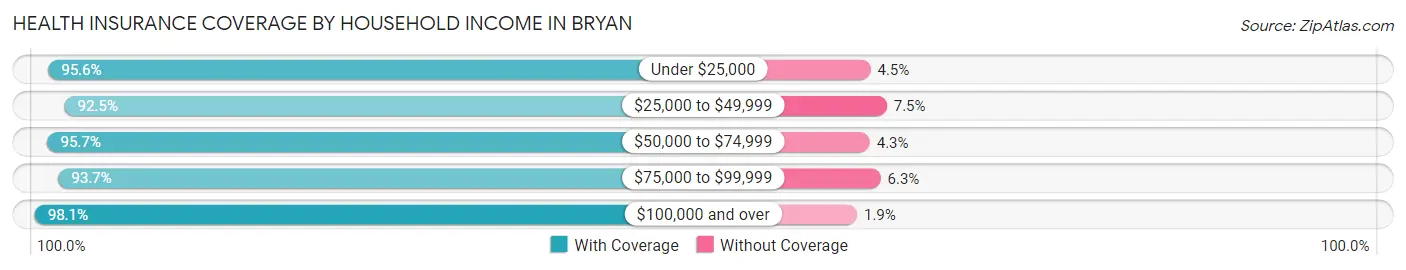
| Household Income | With Coverage | Without Coverage |
| Under $25,000 | 924 (95.6%) | 43 (4.4%) |
| $25,000 to $49,999 | 2,237 (92.5%) | 181 (7.5%) |
| $50,000 to $74,999 | 1,687 (95.7%) | 76 (4.3%) |
| $75,000 to $99,999 | 1,465 (93.7%) | 99 (6.3%) |
| $100,000 and over | 1,787 (98.1%) | 35 (1.9%) |
Public vs Private Health Insurance Coverage by Age in Bryan
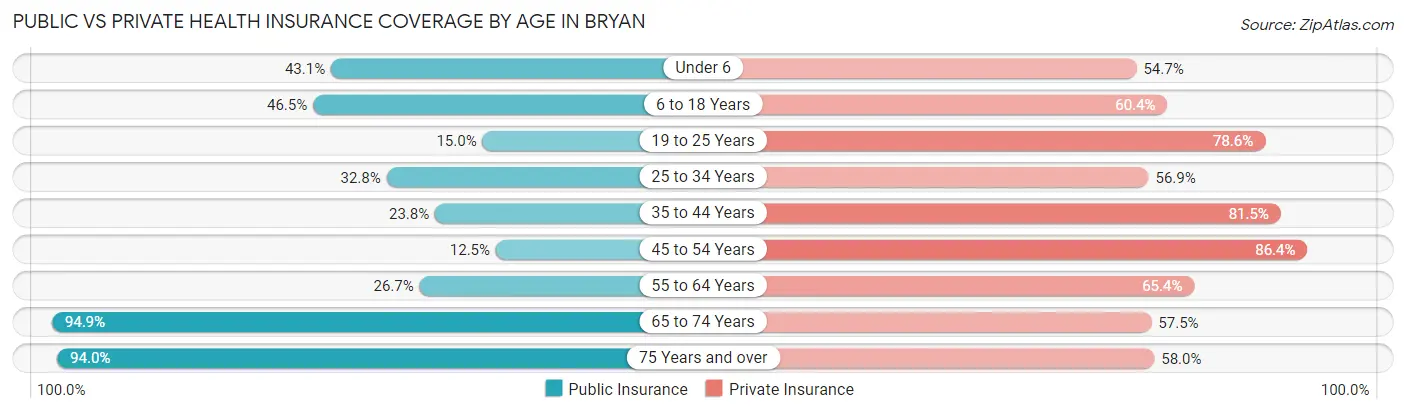
| Age Bracket | Public Insurance | Private Insurance |
| Under 6 | 179 (43.1%) | 227 (54.7%) |
| 6 to 18 Years | 492 (46.5%) | 640 (60.4%) |
| 19 to 25 Years | 119 (15.0%) | 623 (78.6%) |
| 25 to 34 Years | 298 (32.8%) | 517 (56.9%) |
| 35 to 44 Years | 257 (23.8%) | 879 (81.5%) |
| 45 to 54 Years | 117 (12.5%) | 807 (86.4%) |
| 55 to 64 Years | 318 (26.7%) | 779 (65.4%) |
| 65 to 74 Years | 1,087 (94.9%) | 658 (57.5%) |
| 75 Years and over | 962 (94.0%) | 594 (58.0%) |
| Total | 3,829 (44.8%) | 5,724 (67.0%) |
Disability Status by Sex by Age in Bryan
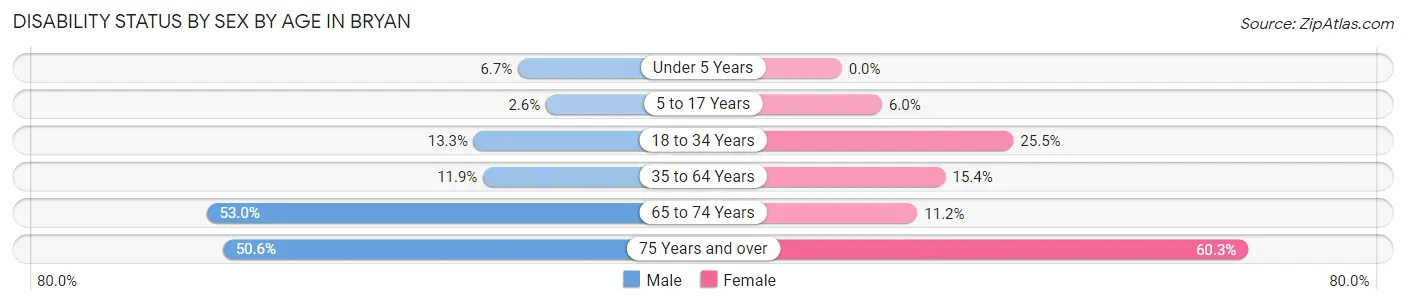
| Age Bracket | Male | Female |
| Under 5 Years | 17 (6.7%) | 0 (0.0%) |
| 5 to 17 Years | 12 (2.6%) | 35 (6.0%) |
| 18 to 34 Years | 120 (13.3%) | 212 (25.5%) |
| 35 to 64 Years | 192 (11.9%) | 245 (15.4%) |
| 65 to 74 Years | 328 (53.0%) | 59 (11.2%) |
| 75 Years and over | 217 (50.6%) | 359 (60.3%) |
Disability Class by Sex by Age in Bryan
Disability Class: Hearing Difficulty
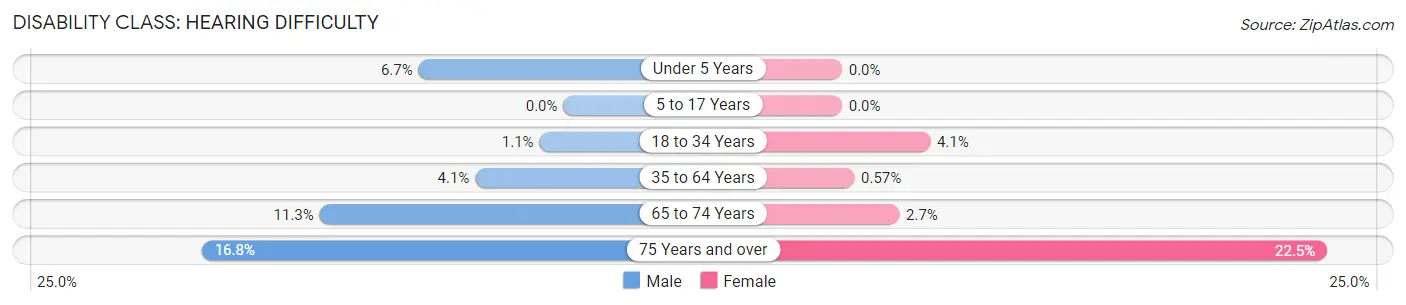
| Age Bracket | Male | Female |
| Under 5 Years | 17 (6.7%) | 0 (0.0%) |
| 5 to 17 Years | 0 (0.0%) | 0 (0.0%) |
| 18 to 34 Years | 10 (1.1%) | 34 (4.1%) |
| 35 to 64 Years | 66 (4.1%) | 9 (0.6%) |
| 65 to 74 Years | 70 (11.3%) | 14 (2.7%) |
| 75 Years and over | 72 (16.8%) | 134 (22.5%) |
Disability Class: Vision Difficulty
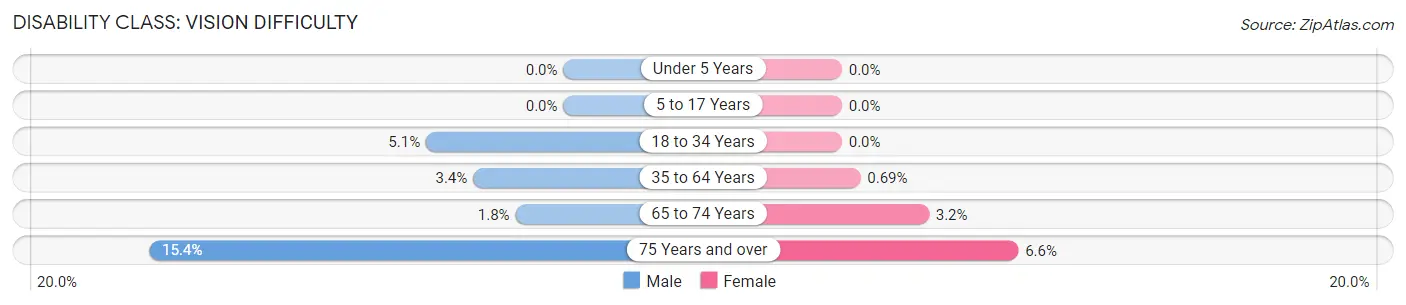
| Age Bracket | Male | Female |
| Under 5 Years | 0 (0.0%) | 0 (0.0%) |
| 5 to 17 Years | 0 (0.0%) | 0 (0.0%) |
| 18 to 34 Years | 46 (5.1%) | 0 (0.0%) |
| 35 to 64 Years | 54 (3.4%) | 11 (0.7%) |
| 65 to 74 Years | 11 (1.8%) | 17 (3.2%) |
| 75 Years and over | 66 (15.4%) | 39 (6.6%) |
Disability Class: Cognitive Difficulty
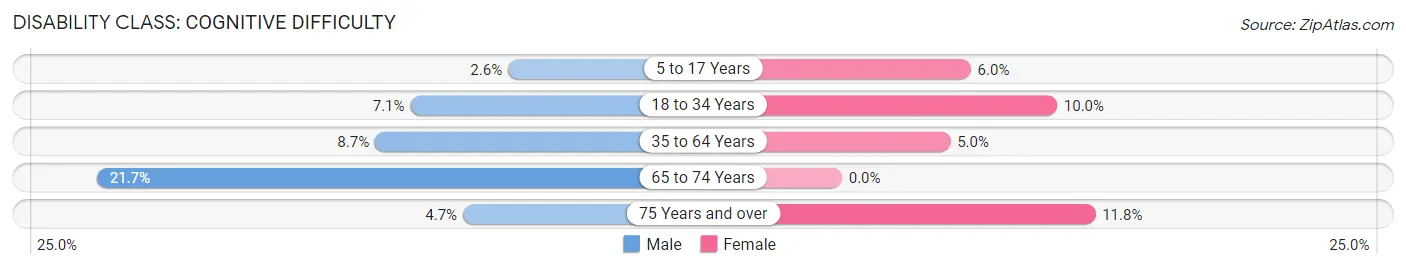
| Age Bracket | Male | Female |
| 5 to 17 Years | 12 (2.6%) | 35 (6.0%) |
| 18 to 34 Years | 64 (7.1%) | 83 (10.0%) |
| 35 to 64 Years | 141 (8.7%) | 80 (5.0%) |
| 65 to 74 Years | 134 (21.6%) | 0 (0.0%) |
| 75 Years and over | 20 (4.7%) | 70 (11.8%) |
Disability Class: Ambulatory Difficulty
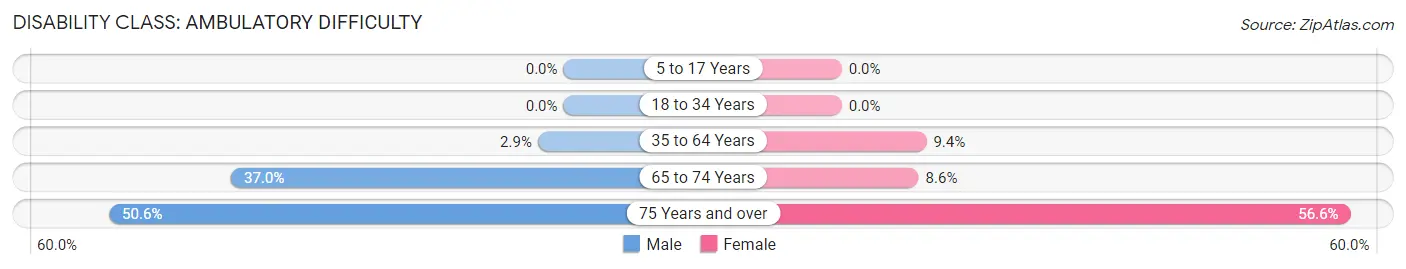
| Age Bracket | Male | Female |
| 5 to 17 Years | 0 (0.0%) | 0 (0.0%) |
| 18 to 34 Years | 0 (0.0%) | 0 (0.0%) |
| 35 to 64 Years | 46 (2.9%) | 150 (9.4%) |
| 65 to 74 Years | 229 (37.0%) | 45 (8.6%) |
| 75 Years and over | 217 (50.6%) | 337 (56.6%) |
Disability Class: Self-Care Difficulty
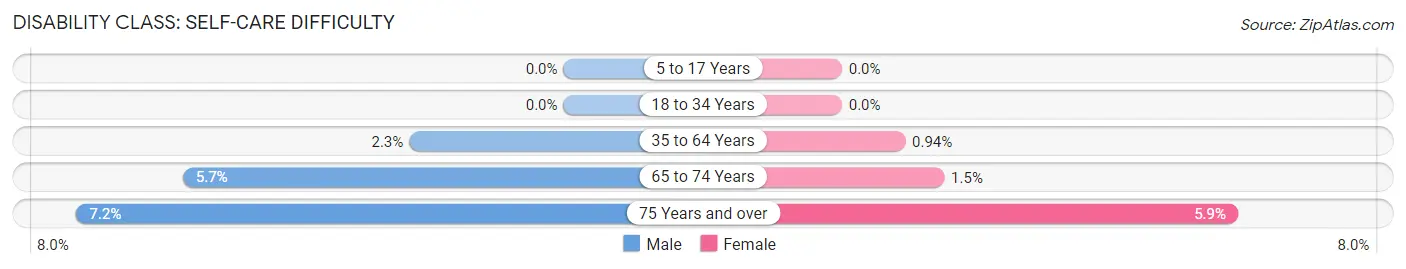
| Age Bracket | Male | Female |
| 5 to 17 Years | 0 (0.0%) | 0 (0.0%) |
| 18 to 34 Years | 0 (0.0%) | 0 (0.0%) |
| 35 to 64 Years | 37 (2.3%) | 15 (0.9%) |
| 65 to 74 Years | 35 (5.7%) | 8 (1.5%) |
| 75 Years and over | 31 (7.2%) | 35 (5.9%) |
Technology Access in Bryan
Computing Device Access in Bryan
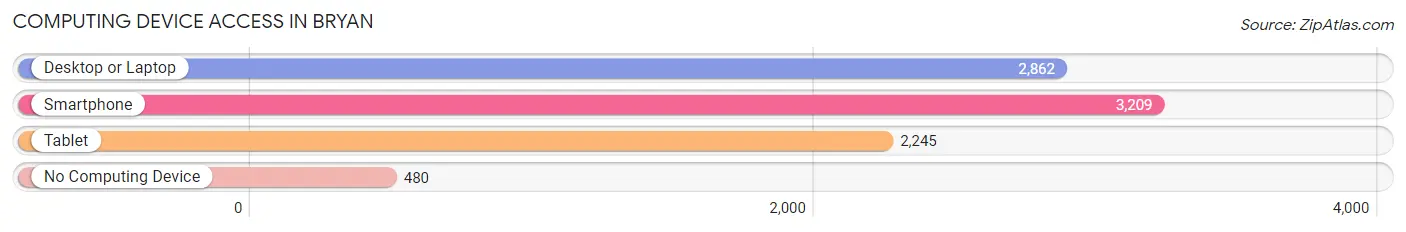
| Device Type | # Households | % Households |
| Desktop or Laptop | 2,862 | 69.1% |
| Smartphone | 3,209 | 77.5% |
| Tablet | 2,245 | 54.2% |
| No Computing Device | 480 | 11.6% |
| Total | 4,142 | 100.0% |
Internet Access in Bryan
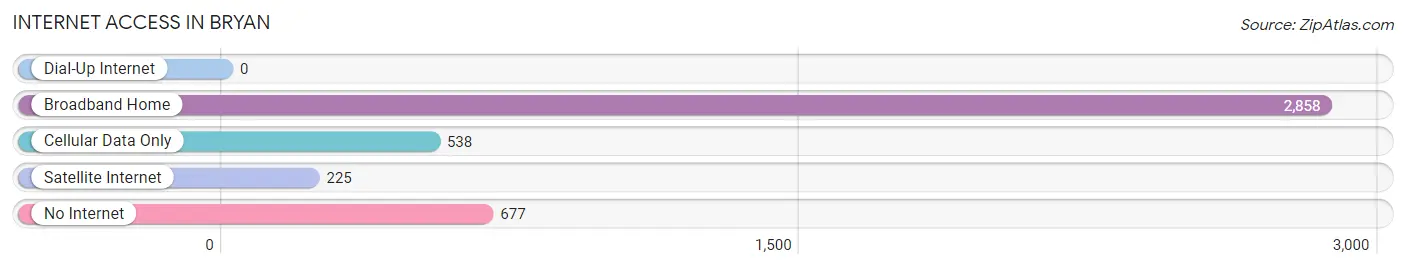
| Internet Type | # Households | % Households |
| Dial-Up Internet | 0 | 0.0% |
| Broadband Home | 2,858 | 69.0% |
| Cellular Data Only | 538 | 13.0% |
| Satellite Internet | 225 | 5.4% |
| No Internet | 677 | 16.3% |
| Total | 4,142 | 100.0% |
Bryan Summary
Bryan, Ohio is a small city located in Williams County in the northwestern part of the state. It is situated on the banks of the Maumee River, and is the county seat of Williams County. The city has a population of 8,545 as of the 2010 census, and is the largest city in the county.
History
Bryan was founded in 1845 by William T. Bryan, a local landowner and businessman. The city was named after him, and was incorporated in 1854. The city was originally a small farming community, but grew rapidly in the late 19th and early 20th centuries due to the development of the railroad and the oil and gas industry. The city was also home to a large number of factories, including a glass factory, a paper mill, and a furniture factory.
Geography
Bryan is located in northwestern Ohio, in Williams County. It is situated on the banks of the Maumee River, and is the county seat of Williams County. The city has a total area of 4.3 square miles, all of which is land. The city is located approximately 50 miles west of Toledo, and is part of the Toledo Metropolitan Statistical Area.
Economy
Bryan’s economy is largely based on manufacturing and agriculture. The city is home to a number of factories, including a glass factory, a paper mill, and a furniture factory. The city is also home to a number of agricultural businesses, including a dairy farm, a hog farm, and a grain elevator. The city is also home to a number of retail businesses, including a grocery store, a hardware store, and a variety of restaurants.
Demographics
As of the 2010 census, Bryan had a population of 8,545. The racial makeup of the city was 95.2% White, 0.7% African American, 0.3% Native American, 0.5% Asian, 0.1% Pacific Islander, 1.2% from other races, and 2.0% from two or more races. Hispanic or Latino of any race were 3.2% of the population.
The median income for a household in Bryan was $41,945, and the median income for a family was $50,945. The per capita income for the city was $20,845. About 11.2% of families and 14.2% of the population were below the poverty line, including 19.2% of those under age 18 and 8.2% of those age 65 or over.
Bryan is a small city with a rich history and a diverse economy. It is home to a number of factories, agricultural businesses, and retail stores, and has a population of 8,545 as of the 2010 census. The city is located in northwestern Ohio, and is part of the Toledo Metropolitan Statistical Area.
Common Questions
What is Per Capita Income in Bryan?
Per Capita income in Bryan is $34,524.
What is the Median Family Income in Bryan?
Median Family Income in Bryan is $61,681.
What is the Median Household income in Bryan?
Median Household Income in Bryan is $51,415.
What is Income or Wage Gap in Bryan?
Income or Wage Gap in Bryan is 33.8%.
Women in Bryan earn 66.2 cents for every dollar earned by a man.
What is Inequality or Gini Index in Bryan?
Inequality or Gini Index in Bryan is 0.44.
What is the Total Population of Bryan?
Total Population of Bryan is 8,670.
What is the Total Male Population of Bryan?
Total Male Population of Bryan is 4,329.
What is the Total Female Population of Bryan?
Total Female Population of Bryan is 4,341.
What is the Ratio of Males per 100 Females in Bryan?
There are 99.72 Males per 100 Females in Bryan.
What is the Ratio of Females per 100 Males in Bryan?
There are 100.28 Females per 100 Males in Bryan.
What is the Median Population Age in Bryan?
Median Population Age in Bryan is 46.5 Years.
What is the Average Family Size in Bryan
Average Family Size in Bryan is 2.6 People.
What is the Average Household Size in Bryan
Average Household Size in Bryan is 2.1 People.
How Large is the Labor Force in Bryan?
There are 4,371 People in the Labor Forcein in Bryan.
What is the Percentage of People in the Labor Force in Bryan?
59.5% of People are in the Labor Force in Bryan.
What is the Unemployment Rate in Bryan?
Unemployment Rate in Bryan is 3.2%.