Chesterland, OH Map & Demographics
Chesterland Map
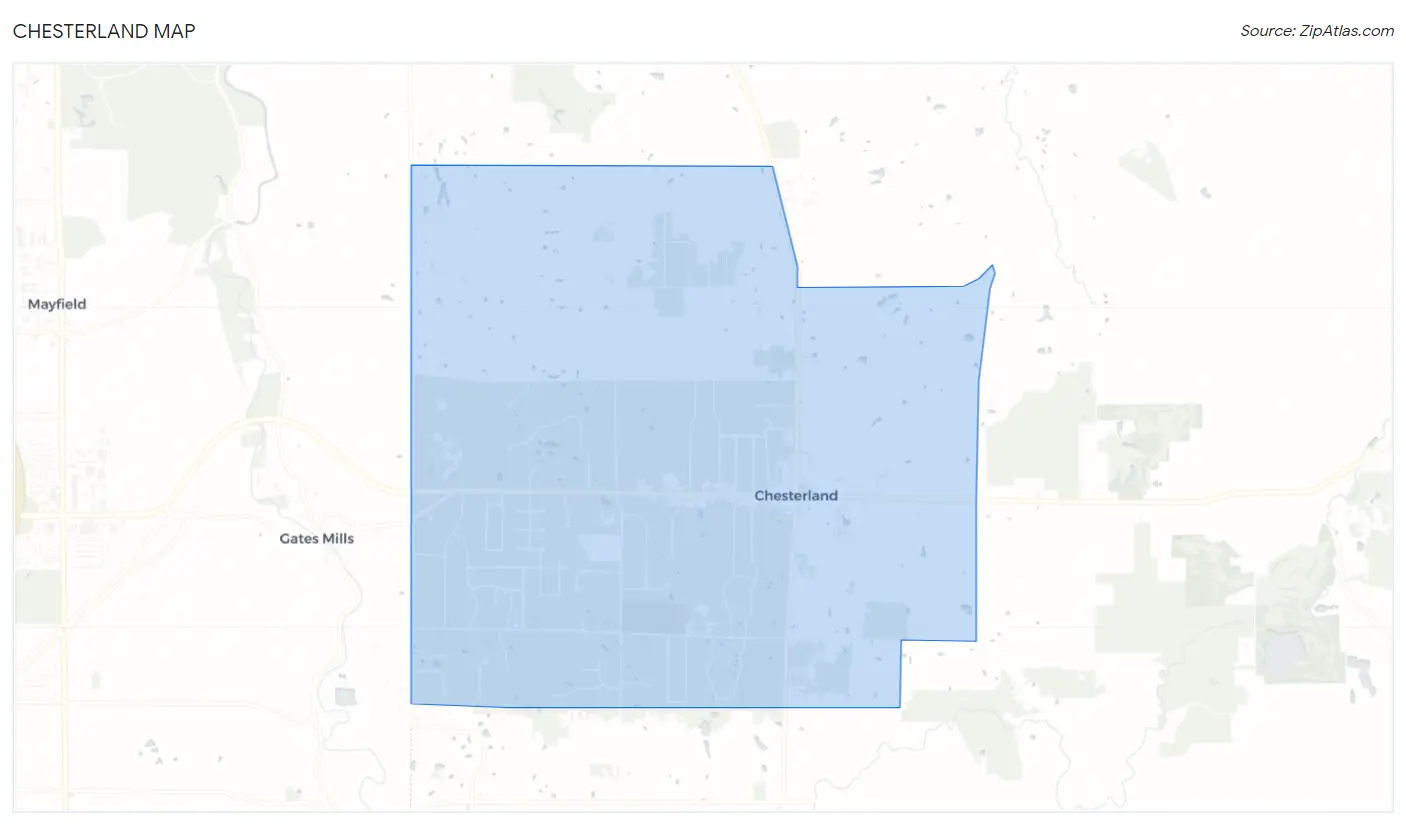
Chesterland Overview
$44,066
PER CAPITA INCOME
$102,783
AVG FAMILY INCOME
$95,723
AVG HOUSEHOLD INCOME
17.1%
WAGE / INCOME GAP [ % ]
82.9¢/ $1
WAGE / INCOME GAP [ $ ]
0.45
INEQUALITY / GINI INDEX
7,317
TOTAL POPULATION
3,931
MALE POPULATION
3,386
FEMALE POPULATION
116.10
MALES / 100 FEMALES
86.14
FEMALES / 100 MALES
53.0
MEDIAN AGE
2.8
AVG FAMILY SIZE
2.5
AVG HOUSEHOLD SIZE
3,789
LABOR FORCE [ PEOPLE ]
60.2%
PERCENT IN LABOR FORCE
5.6%
UNEMPLOYMENT RATE
Chesterland Zip Codes
Chesterland Area Codes
Income in Chesterland
Income Overview in Chesterland
Per Capita Income in Chesterland is $44,066, while median incomes of families and households are $102,783 and $95,723 respectively.
| Characteristic | Number | Measure |
| Per Capita Income | 7,317 | $44,066 |
| Median Family Income | 2,093 | $102,783 |
| Mean Family Income | 2,093 | $127,786 |
| Median Household Income | 2,972 | $95,723 |
| Mean Household Income | 2,972 | $115,235 |
| Income Deficit | 2,093 | $0 |
| Wage / Income Gap (%) | 7,317 | 17.09% |
| Wage / Income Gap ($) | 7,317 | 82.91¢ per $1 |
| Gini / Inequality Index | 7,317 | 0.45 |
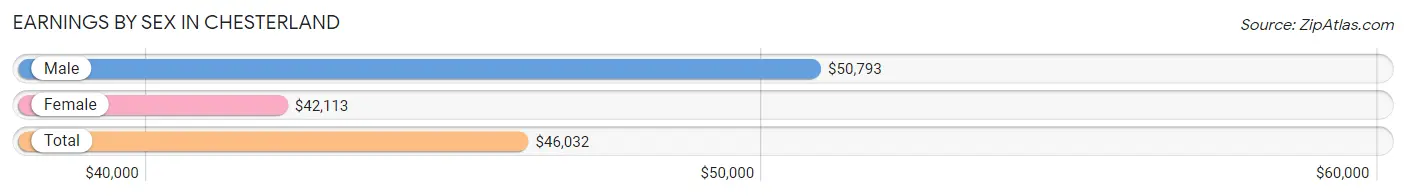
Earnings by Sex in Chesterland
Average Earnings in Chesterland are $46,032, $50,793 for men and $42,113 for women, a difference of 17.1%.
| Sex | Number | Average Earnings |
| Male | 2,020 (52.5%) | $50,793 |
| Female | 1,828 (47.5%) | $42,113 |
| Total | 3,848 (100.0%) | $46,032 |
Earnings by Sex by Income Bracket in Chesterland
The most common earnings brackets in Chesterland are $100,000+ for men (325 | 16.1%) and $75,000 to $99,999 for women (259 | 14.2%).
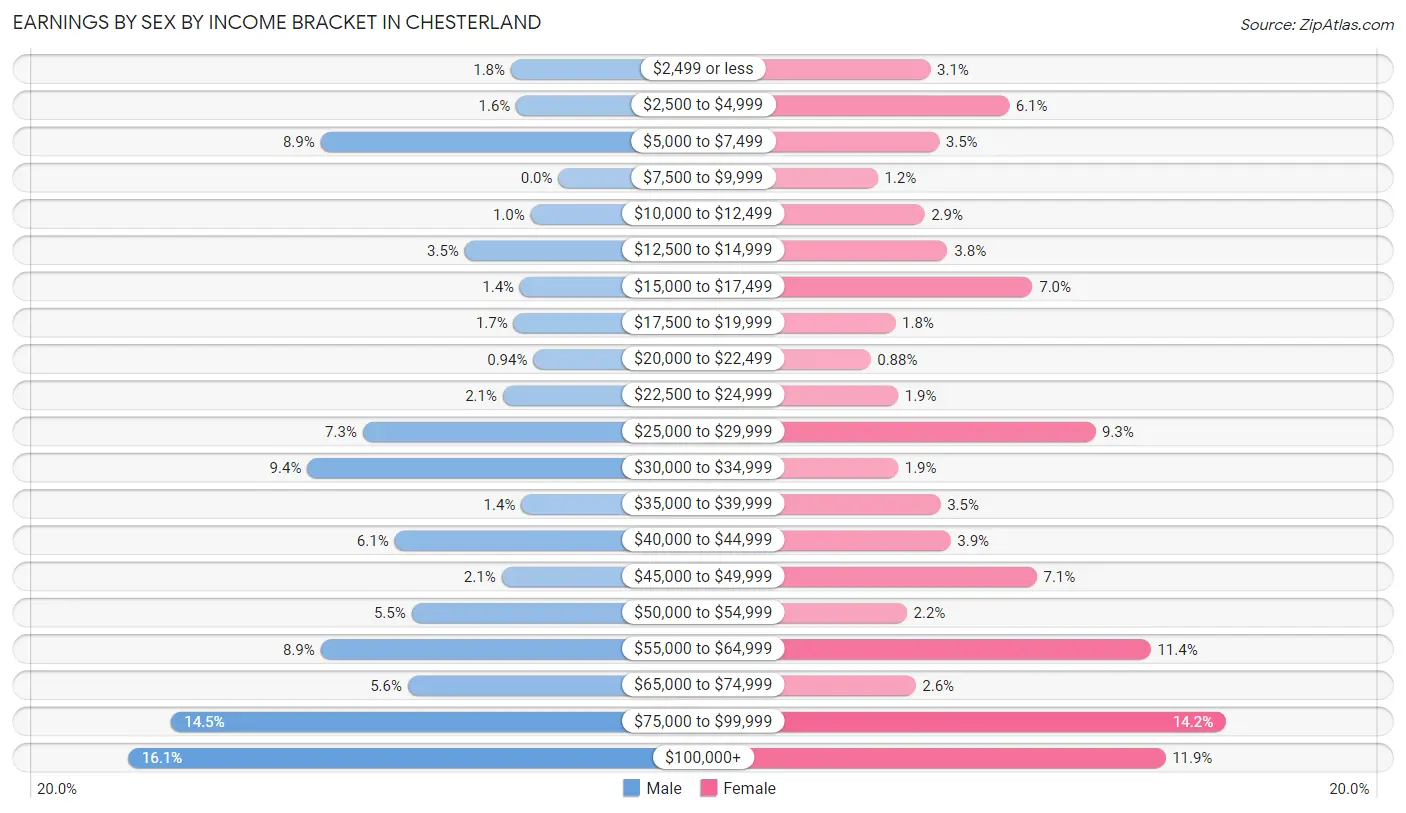
| Income | Male | Female |
| $2,499 or less | 36 (1.8%) | 57 (3.1%) |
| $2,500 to $4,999 | 32 (1.6%) | 111 (6.1%) |
| $5,000 to $7,499 | 180 (8.9%) | 63 (3.5%) |
| $7,500 to $9,999 | 0 (0.0%) | 21 (1.1%) |
| $10,000 to $12,499 | 21 (1.0%) | 53 (2.9%) |
| $12,500 to $14,999 | 71 (3.5%) | 69 (3.8%) |
| $15,000 to $17,499 | 29 (1.4%) | 127 (7.0%) |
| $17,500 to $19,999 | 34 (1.7%) | 33 (1.8%) |
| $20,000 to $22,499 | 19 (0.9%) | 16 (0.9%) |
| $22,500 to $24,999 | 42 (2.1%) | 35 (1.9%) |
| $25,000 to $29,999 | 148 (7.3%) | 170 (9.3%) |
| $30,000 to $34,999 | 190 (9.4%) | 35 (1.9%) |
| $35,000 to $39,999 | 28 (1.4%) | 64 (3.5%) |
| $40,000 to $44,999 | 124 (6.1%) | 71 (3.9%) |
| $45,000 to $49,999 | 43 (2.1%) | 130 (7.1%) |
| $50,000 to $54,999 | 111 (5.5%) | 41 (2.2%) |
| $55,000 to $64,999 | 180 (8.9%) | 208 (11.4%) |
| $65,000 to $74,999 | 114 (5.6%) | 47 (2.6%) |
| $75,000 to $99,999 | 293 (14.5%) | 259 (14.2%) |
| $100,000+ | 325 (16.1%) | 218 (11.9%) |
| Total | 2,020 (100.0%) | 1,828 (100.0%) |
Earnings by Sex by Educational Attainment in Chesterland
Average earnings in Chesterland are $55,513 for men and $49,877 for women, a difference of 10.2%. Men with an educational attainment of graduate degree enjoy the highest average annual earnings of $82,386, while those with college or associate's degree education earn the least with $44,773. Women with an educational attainment of graduate degree earn the most with the average annual earnings of $90,905, while those with high school diploma education have the smallest earnings of $36,042.
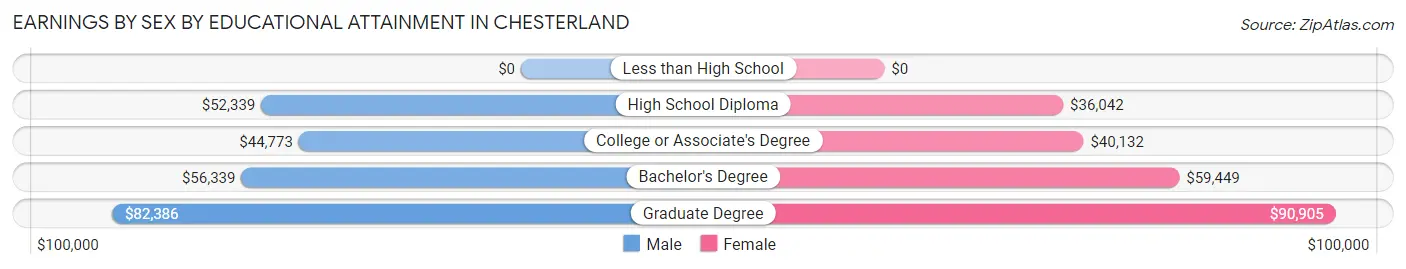
| Educational Attainment | Male Income | Female Income |
| Less than High School | - | - |
| High School Diploma | $52,339 | $36,042 |
| College or Associate's Degree | $44,773 | $40,132 |
| Bachelor's Degree | $56,339 | $59,449 |
| Graduate Degree | $82,386 | $90,905 |
| Total | $55,513 | $49,877 |
Family Income in Chesterland
Family Income Brackets in Chesterland
According to the Chesterland family income data, there are 517 families falling into the $100,000 to $149,999 income range, which is the most common income bracket and makes up 24.7% of all families.
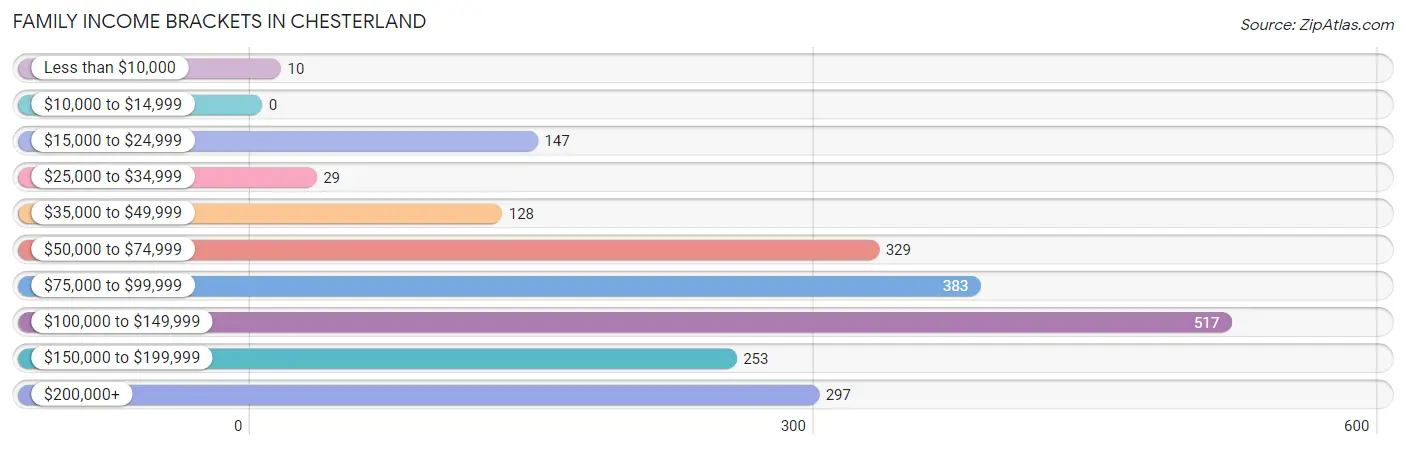
| Income Bracket | # Families | % Families |
| Less than $10,000 | 10 | 0.5% |
| $10,000 to $14,999 | 0 | 0.0% |
| $15,000 to $24,999 | 147 | 7.0% |
| $25,000 to $34,999 | 29 | 1.4% |
| $35,000 to $49,999 | 128 | 6.1% |
| $50,000 to $74,999 | 329 | 15.7% |
| $75,000 to $99,999 | 383 | 18.3% |
| $100,000 to $149,999 | 517 | 24.7% |
| $150,000 to $199,999 | 253 | 12.1% |
| $200,000+ | 297 | 14.2% |
Family Income by Famaliy Size in Chesterland
3-person families (368 | 17.6%) account for the highest median family income in Chesterland with $144,120 per family, while 3-person families (368 | 17.6%) have the highest median income of $48,040 per family member.
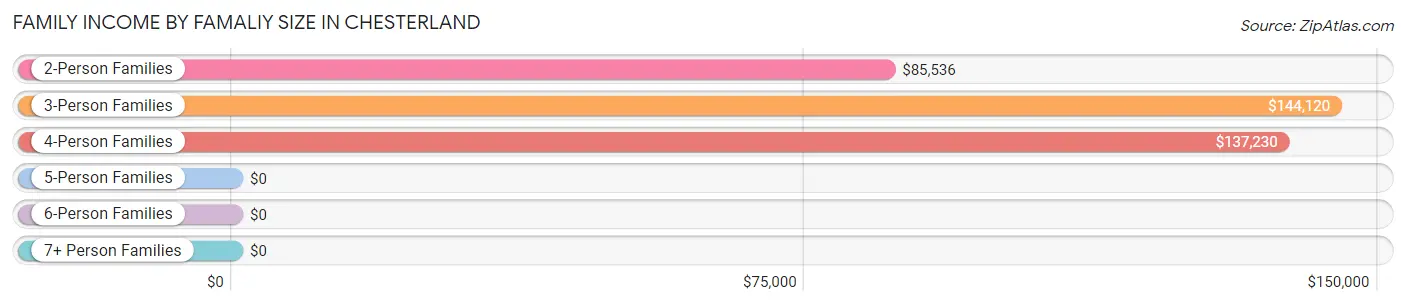
| Income Bracket | # Families | Median Income |
| 2-Person Families | 1,189 (56.8%) | $85,536 |
| 3-Person Families | 368 (17.6%) | $144,120 |
| 4-Person Families | 376 (18.0%) | $137,230 |
| 5-Person Families | 122 (5.8%) | $0 |
| 6-Person Families | 27 (1.3%) | $0 |
| 7+ Person Families | 11 (0.5%) | $0 |
| Total | 2,093 (100.0%) | $102,783 |
Family Income by Number of Earners in Chesterland
The median family income in Chesterland is $102,783, with families comprising 3+ earners (281) having the highest median family income of $166,359, while families with no earners (434) have the lowest median family income of $71,351, accounting for 13.4% and 20.7% of families, respectively.
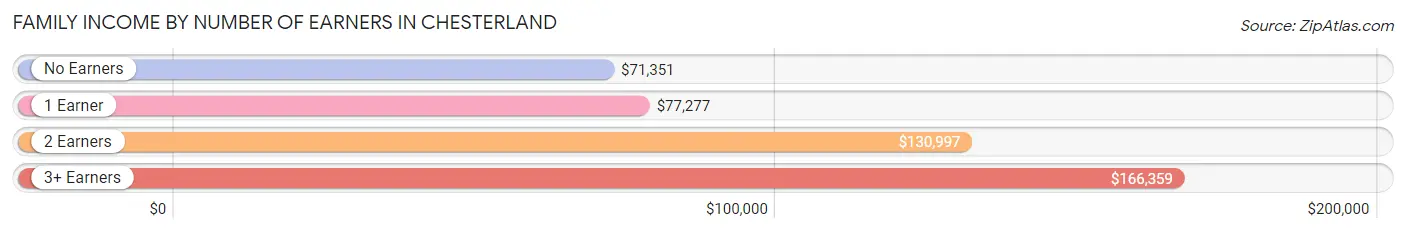
| Number of Earners | # Families | Median Income |
| No Earners | 434 (20.7%) | $71,351 |
| 1 Earner | 565 (27.0%) | $77,277 |
| 2 Earners | 813 (38.8%) | $130,997 |
| 3+ Earners | 281 (13.4%) | $166,359 |
| Total | 2,093 (100.0%) | $102,783 |
Household Income in Chesterland
Household Income Brackets in Chesterland
With 701 households falling in the category, the $100,000 to $149,999 income range is the most frequent in Chesterland, accounting for 23.6% of all households. In contrast, only 18 households (0.6%) fall into the $10,000 to $14,999 income bracket, making it the least populous group.
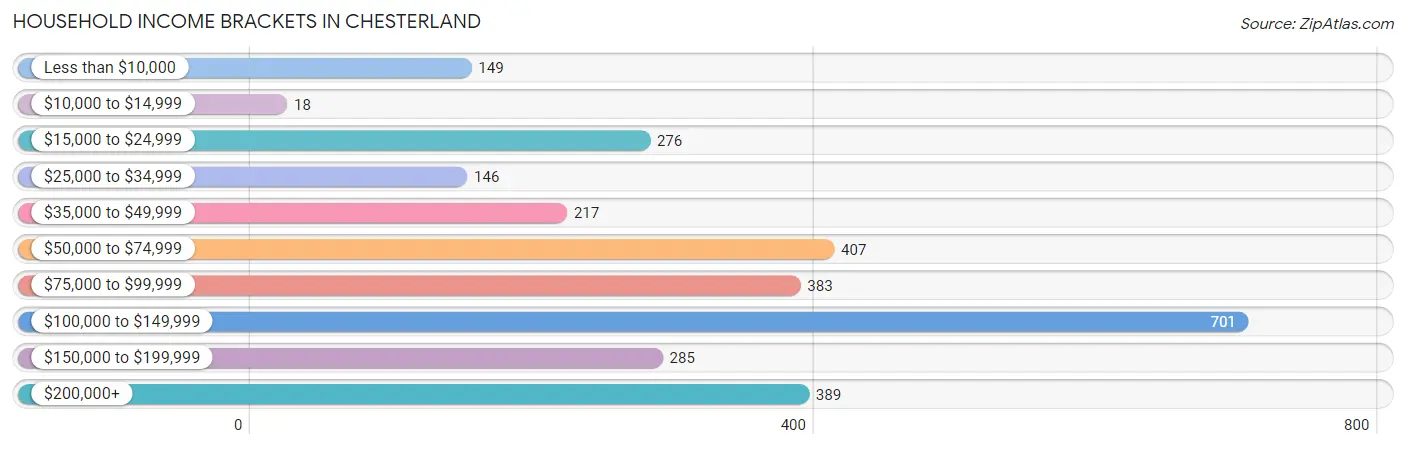
| Income Bracket | # Households | % Households |
| Less than $10,000 | 149 | 5.0% |
| $10,000 to $14,999 | 18 | 0.6% |
| $15,000 to $24,999 | 276 | 9.3% |
| $25,000 to $34,999 | 146 | 4.9% |
| $35,000 to $49,999 | 217 | 7.3% |
| $50,000 to $74,999 | 407 | 13.7% |
| $75,000 to $99,999 | 383 | 12.9% |
| $100,000 to $149,999 | 701 | 23.6% |
| $150,000 to $199,999 | 285 | 9.6% |
| $200,000+ | 389 | 13.1% |
Household Income by Householder Age in Chesterland
The median household income in Chesterland is $95,723, with the highest median household income of $135,439 found in the 45 to 64 years age bracket for the primary householder. A total of 1,199 households (40.3%) fall into this category. Meanwhile, the 15 to 24 years age bracket for the primary householder has the lowest median household income of $0, with 103 households (3.5%) in this group.
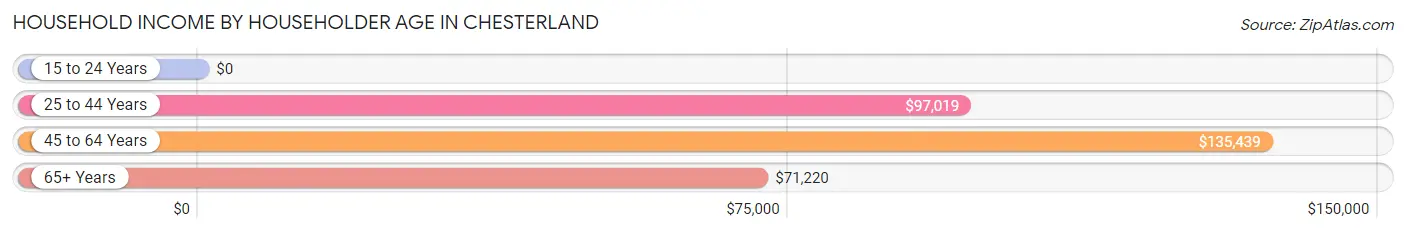
| Income Bracket | # Households | Median Income |
| 15 to 24 Years | 103 (3.5%) | $0 |
| 25 to 44 Years | 525 (17.7%) | $97,019 |
| 45 to 64 Years | 1,199 (40.3%) | $135,439 |
| 65+ Years | 1,145 (38.5%) | $71,220 |
| Total | 2,972 (100.0%) | $95,723 |
Poverty in Chesterland
Income Below Poverty by Sex and Age in Chesterland
With 7.2% poverty level for males and 11.1% for females among the residents of Chesterland, 35 to 44 year old males and under 5 year old females are the most vulnerable to poverty, with 46 males (14.1%) and 91 females (59.5%) in their respective age groups living below the poverty level.
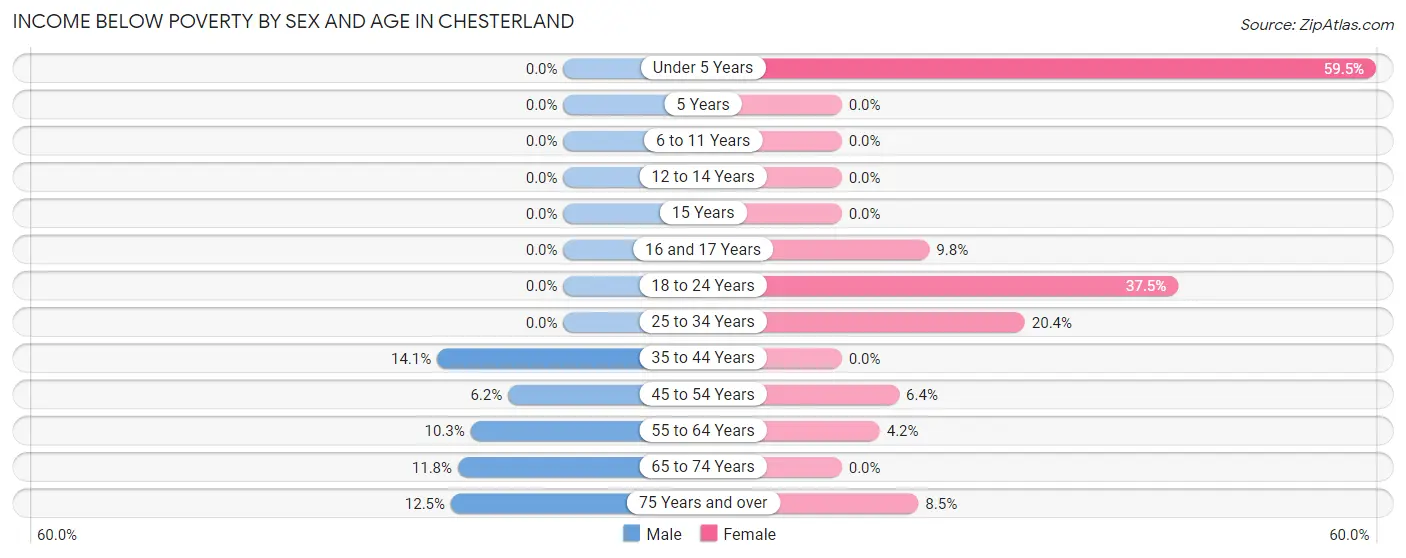
| Age Bracket | Male | Female |
| Under 5 Years | 0 (0.0%) | 91 (59.5%) |
| 5 Years | 0 (0.0%) | 0 (0.0%) |
| 6 to 11 Years | 0 (0.0%) | 0 (0.0%) |
| 12 to 14 Years | 0 (0.0%) | 0 (0.0%) |
| 15 Years | 0 (0.0%) | 0 (0.0%) |
| 16 and 17 Years | 0 (0.0%) | 12 (9.8%) |
| 18 to 24 Years | 0 (0.0%) | 103 (37.4%) |
| 25 to 34 Years | 0 (0.0%) | 62 (20.4%) |
| 35 to 44 Years | 46 (14.1%) | 0 (0.0%) |
| 45 to 54 Years | 33 (6.2%) | 31 (6.4%) |
| 55 to 64 Years | 69 (10.3%) | 24 (4.2%) |
| 65 to 74 Years | 74 (11.7%) | 0 (0.0%) |
| 75 Years and over | 59 (12.5%) | 54 (8.5%) |
| Total | 281 (7.2%) | 377 (11.1%) |
Income Above Poverty by Sex and Age in Chesterland
According to the poverty statistics in Chesterland, males aged under 5 years and females aged 5 years are the age groups that are most secure financially, with 100.0% of males and 100.0% of females in these age groups living above the poverty line.
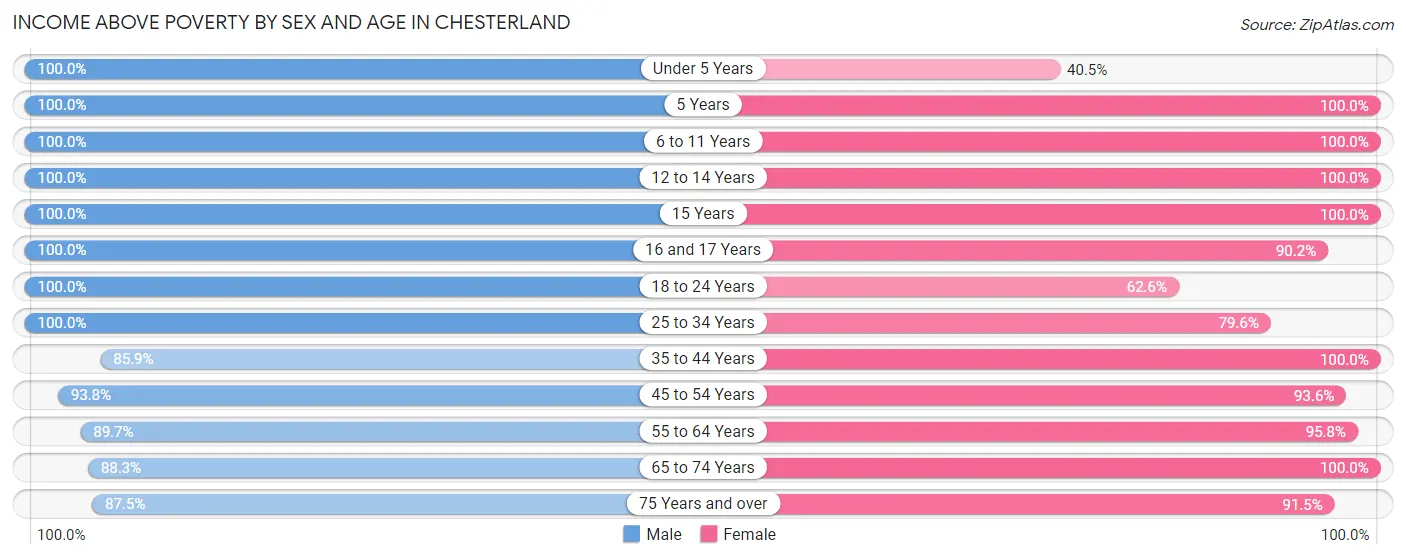
| Age Bracket | Male | Female |
| Under 5 Years | 99 (100.0%) | 62 (40.5%) |
| 5 Years | 11 (100.0%) | 7 (100.0%) |
| 6 to 11 Years | 324 (100.0%) | 90 (100.0%) |
| 12 to 14 Years | 156 (100.0%) | 97 (100.0%) |
| 15 Years | 21 (100.0%) | 34 (100.0%) |
| 16 and 17 Years | 24 (100.0%) | 111 (90.2%) |
| 18 to 24 Years | 307 (100.0%) | 172 (62.5%) |
| 25 to 34 Years | 327 (100.0%) | 242 (79.6%) |
| 35 to 44 Years | 281 (85.9%) | 178 (100.0%) |
| 45 to 54 Years | 503 (93.8%) | 454 (93.6%) |
| 55 to 64 Years | 598 (89.7%) | 544 (95.8%) |
| 65 to 74 Years | 556 (88.2%) | 439 (100.0%) |
| 75 Years and over | 412 (87.5%) | 579 (91.5%) |
| Total | 3,619 (92.8%) | 3,009 (88.9%) |
Income Below Poverty Among Married-Couple Families in Chesterland
The poverty statistics for married-couple families in Chesterland show that 0.6% or 11 of the total 1,754 families live below the poverty line. Families with no children have the highest poverty rate of 0.9%, comprising of 11 families. On the other hand, families with 1 or 2 children have the lowest poverty rate of 0.0%, which includes 0 families.
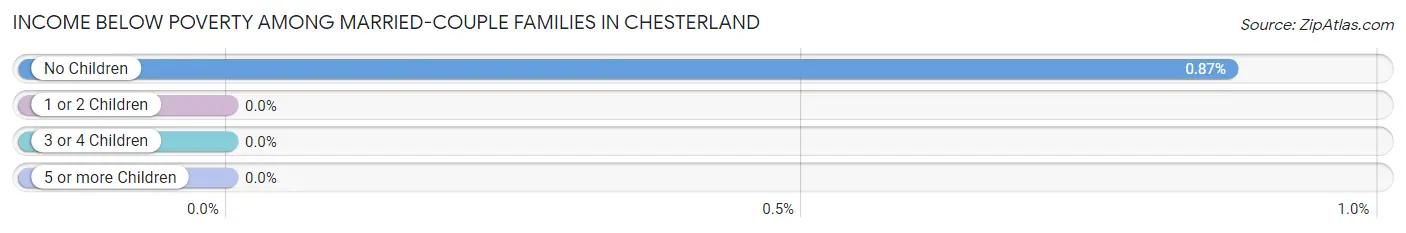
| Children | Above Poverty | Below Poverty |
| No Children | 1,257 (99.1%) | 11 (0.9%) |
| 1 or 2 Children | 414 (100.0%) | 0 (0.0%) |
| 3 or 4 Children | 72 (100.0%) | 0 (0.0%) |
| 5 or more Children | 0 (0.0%) | 0 (0.0%) |
| Total | 1,743 (99.4%) | 11 (0.6%) |
Income Below Poverty Among Single-Parent Households in Chesterland
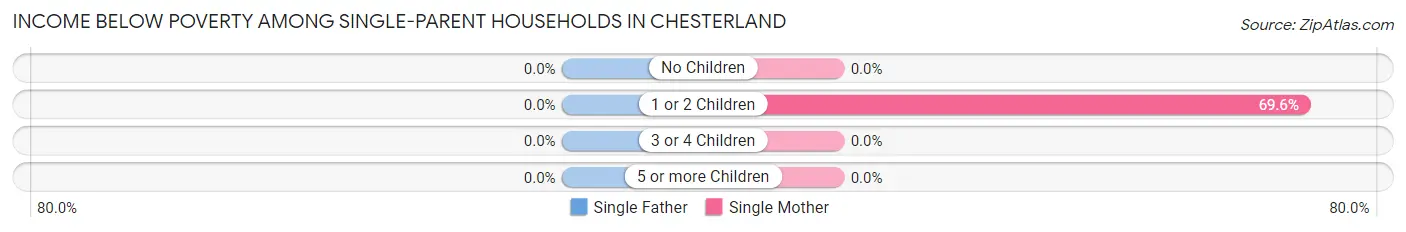
| Children | Single Father | Single Mother |
| No Children | 0 (0.0%) | 0 (0.0%) |
| 1 or 2 Children | 0 (0.0%) | 103 (69.6%) |
| 3 or 4 Children | 0 (0.0%) | 0 (0.0%) |
| 5 or more Children | 0 (0.0%) | 0 (0.0%) |
| Total | 0 (0.0%) | 103 (39.3%) |
Income Below Poverty Among Married-Couple vs Single-Parent Households in Chesterland
The poverty data for Chesterland shows that 11 of the married-couple family households (0.6%) and 103 of the single-parent households (30.4%) are living below the poverty level. Within the married-couple family households, those with no children have the highest poverty rate, with 11 households (0.9%) falling below the poverty line. Among the single-parent households, those with 1 or 2 children have the highest poverty rate, with 103 household (64.0%) living below poverty.
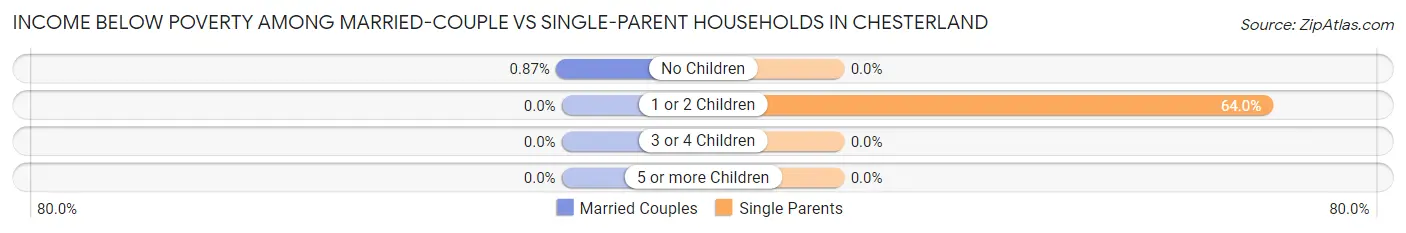
| Children | Married-Couple Families | Single-Parent Households |
| No Children | 11 (0.9%) | 0 (0.0%) |
| 1 or 2 Children | 0 (0.0%) | 103 (64.0%) |
| 3 or 4 Children | 0 (0.0%) | 0 (0.0%) |
| 5 or more Children | 0 (0.0%) | 0 (0.0%) |
| Total | 11 (0.6%) | 103 (30.4%) |
Race in Chesterland
The most populous races in Chesterland are White / Caucasian (6,979 | 95.4%), Two or more Races (213 | 2.9%), and Asian (125 | 1.7%).
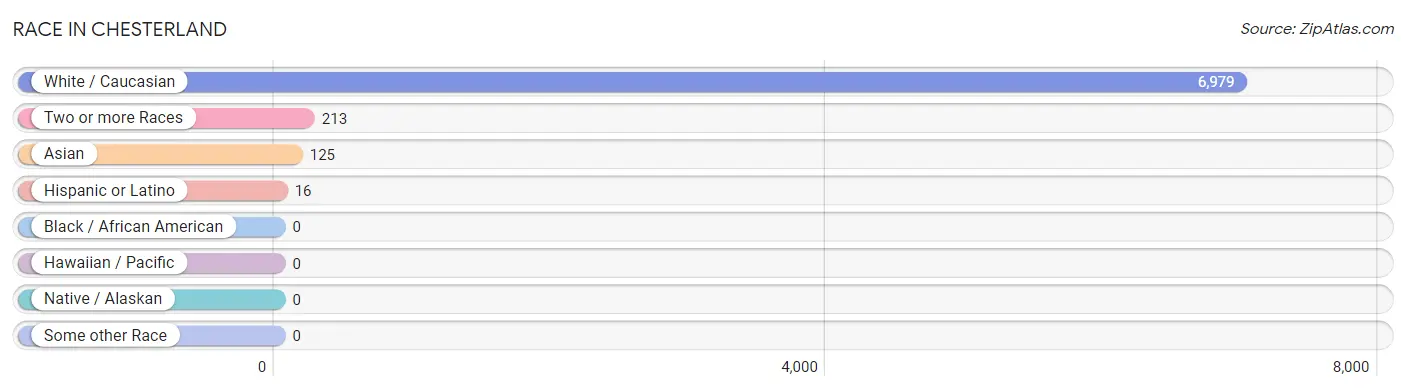
| Race | # Population | % Population |
| Asian | 125 | 1.7% |
| Black / African American | 0 | 0.0% |
| Hawaiian / Pacific | 0 | 0.0% |
| Hispanic or Latino | 16 | 0.2% |
| Native / Alaskan | 0 | 0.0% |
| White / Caucasian | 6,979 | 95.4% |
| Two or more Races | 213 | 2.9% |
| Some other Race | 0 | 0.0% |
| Total | 7,317 | 100.0% |
Ancestry in Chesterland
The most populous ancestries reported in Chesterland are Italian (1,486 | 20.3%), German (1,481 | 20.2%), Irish (1,193 | 16.3%), English (799 | 10.9%), and Polish (566 | 7.7%), together accounting for 75.5% of all Chesterland residents.
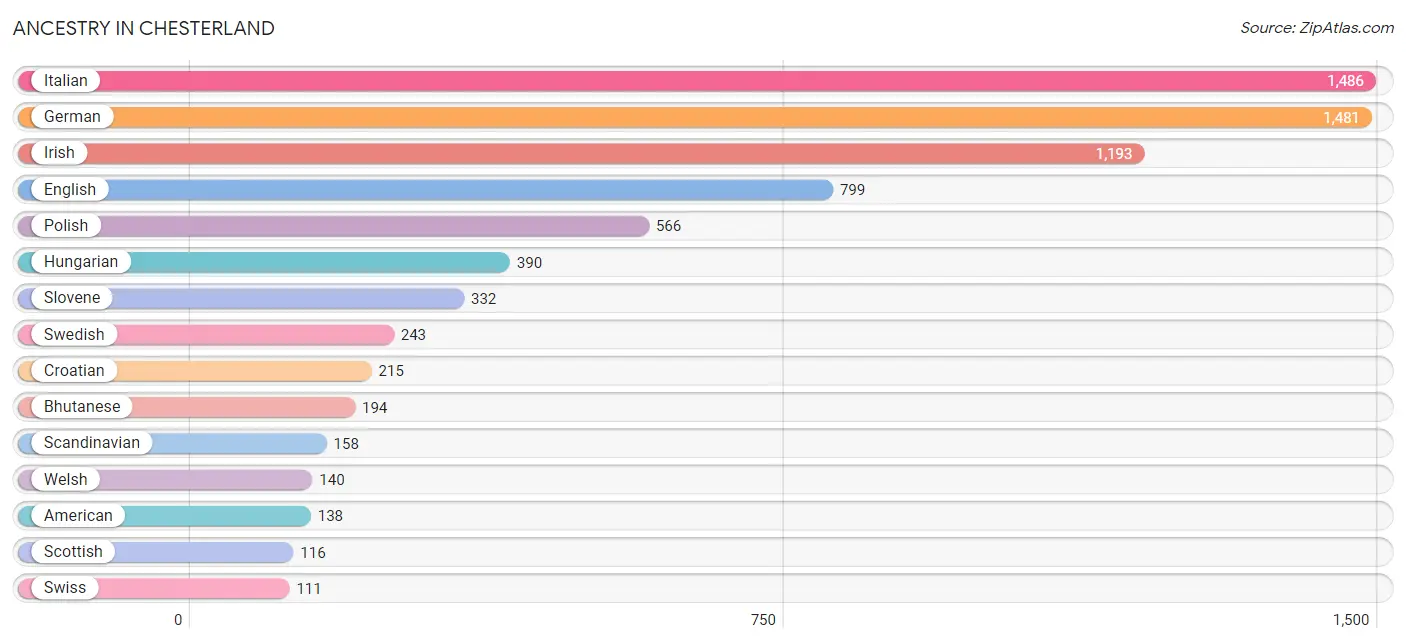
| Ancestry | # Population | % Population |
| American | 138 | 1.9% |
| Arab | 29 | 0.4% |
| Austrian | 29 | 0.4% |
| Bhutanese | 194 | 2.6% |
| Burmese | 99 | 1.3% |
| Canadian | 17 | 0.2% |
| Croatian | 215 | 2.9% |
| Cuban | 11 | 0.2% |
| Czech | 99 | 1.3% |
| Czechoslovakian | 16 | 0.2% |
| Dutch | 47 | 0.6% |
| Eastern European | 74 | 1.0% |
| English | 799 | 10.9% |
| European | 66 | 0.9% |
| Finnish | 10 | 0.1% |
| French | 71 | 1.0% |
| French Canadian | 18 | 0.3% |
| German | 1,481 | 20.2% |
| Hungarian | 390 | 5.3% |
| Irish | 1,193 | 16.3% |
| Israeli | 15 | 0.2% |
| Italian | 1,486 | 20.3% |
| Latvian | 7 | 0.1% |
| Lebanese | 20 | 0.3% |
| Lithuanian | 87 | 1.2% |
| Lumbee | 5 | 0.1% |
| Norwegian | 65 | 0.9% |
| Peruvian | 5 | 0.1% |
| Polish | 566 | 7.7% |
| Portuguese | 81 | 1.1% |
| Scandinavian | 158 | 2.2% |
| Scotch-Irish | 32 | 0.4% |
| Scottish | 116 | 1.6% |
| Serbian | 44 | 0.6% |
| Slavic | 15 | 0.2% |
| Slovak | 72 | 1.0% |
| Slovene | 332 | 4.5% |
| South American | 5 | 0.1% |
| Swedish | 243 | 3.3% |
| Swiss | 111 | 1.5% |
| Thai | 26 | 0.4% |
| Ukrainian | 51 | 0.7% |
| Welsh | 140 | 1.9% | View All 43 Rows |
Immigrants in Chesterland
The most numerous immigrant groups reported in Chesterland came from Europe (179 | 2.5%), Italy (179 | 2.5%), Southern Europe (179 | 2.5%), Asia (124 | 1.7%), and Eastern Asia (78 | 1.1%), together accounting for 10.1% of all Chesterland residents.
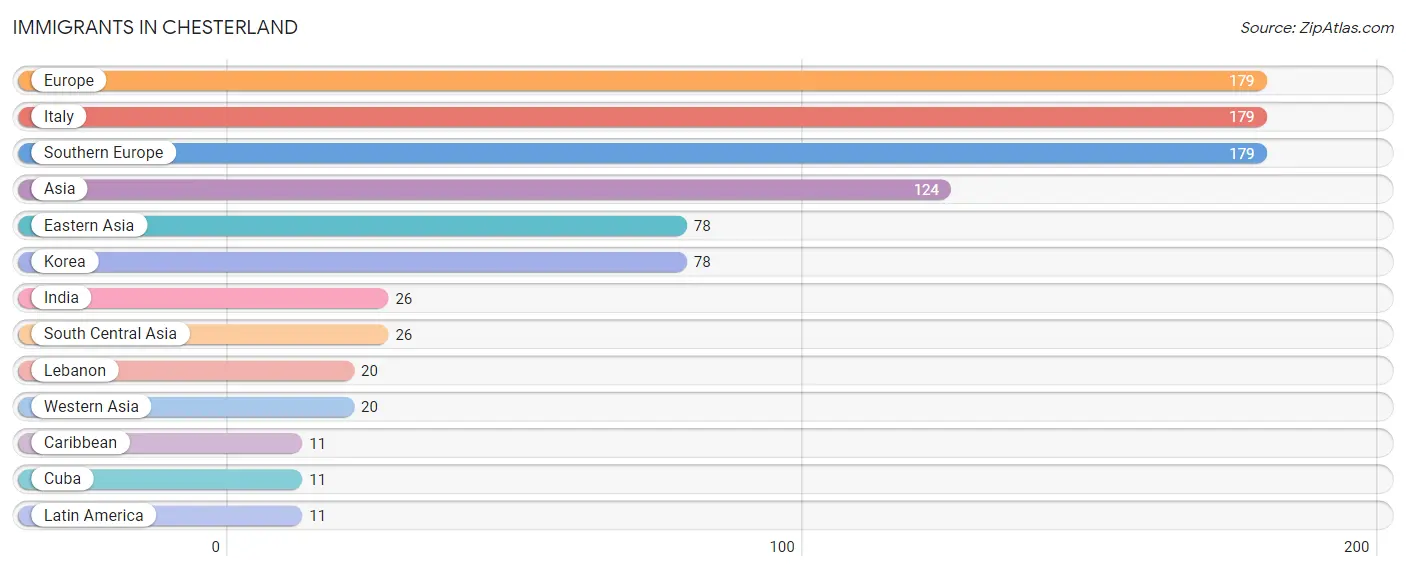
| Immigration Origin | # Population | % Population |
| Asia | 124 | 1.7% |
| Caribbean | 11 | 0.2% |
| Cuba | 11 | 0.2% |
| Eastern Asia | 78 | 1.1% |
| Europe | 179 | 2.5% |
| India | 26 | 0.4% |
| Italy | 179 | 2.5% |
| Korea | 78 | 1.1% |
| Latin America | 11 | 0.2% |
| Lebanon | 20 | 0.3% |
| South Central Asia | 26 | 0.4% |
| Southern Europe | 179 | 2.5% |
| Western Asia | 20 | 0.3% | View All 13 Rows |
Sex and Age in Chesterland
Sex and Age in Chesterland
The most populous age groups in Chesterland are 65 to 69 Years (417 | 10.6%) for men and 85 Years and over (368 | 10.9%) for women.
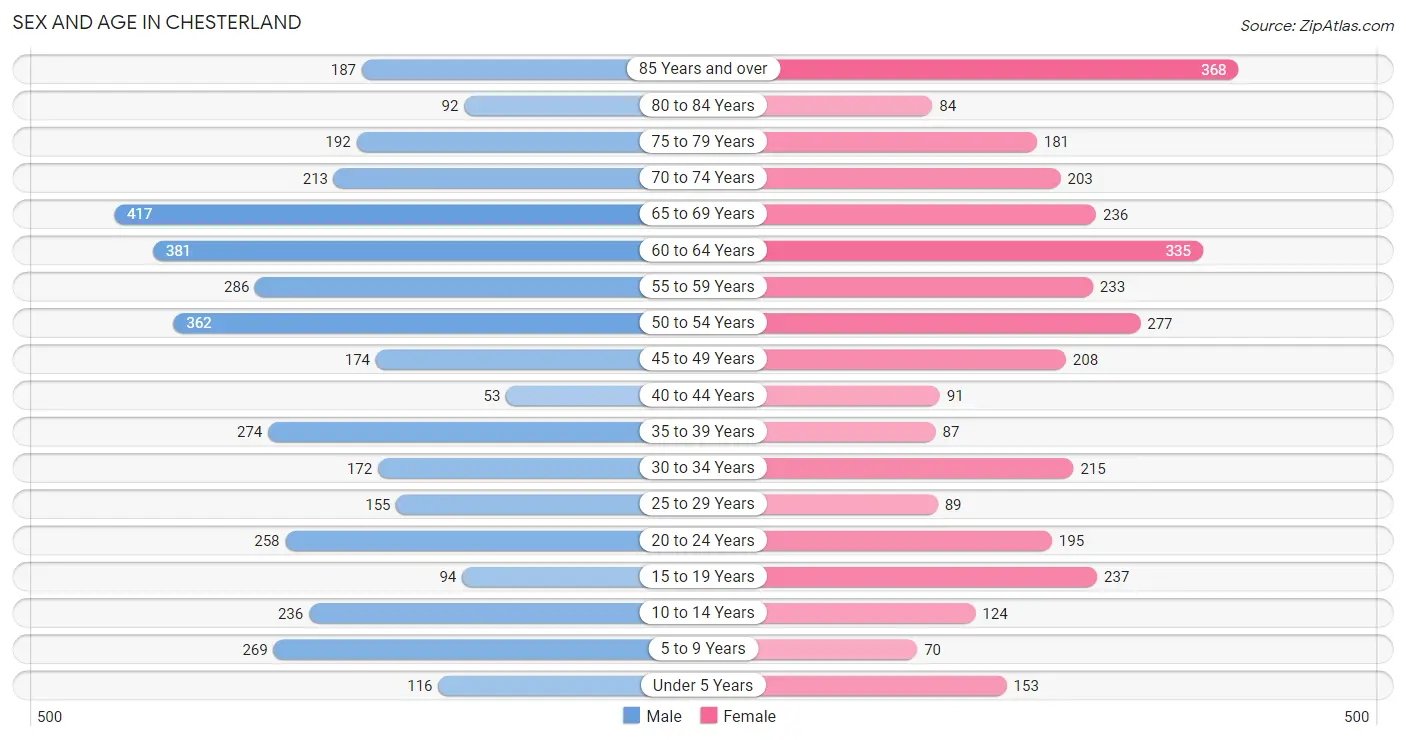
| Age Bracket | Male | Female |
| Under 5 Years | 116 (2.9%) | 153 (4.5%) |
| 5 to 9 Years | 269 (6.8%) | 70 (2.1%) |
| 10 to 14 Years | 236 (6.0%) | 124 (3.7%) |
| 15 to 19 Years | 94 (2.4%) | 237 (7.0%) |
| 20 to 24 Years | 258 (6.6%) | 195 (5.8%) |
| 25 to 29 Years | 155 (3.9%) | 89 (2.6%) |
| 30 to 34 Years | 172 (4.4%) | 215 (6.4%) |
| 35 to 39 Years | 274 (7.0%) | 87 (2.6%) |
| 40 to 44 Years | 53 (1.3%) | 91 (2.7%) |
| 45 to 49 Years | 174 (4.4%) | 208 (6.1%) |
| 50 to 54 Years | 362 (9.2%) | 277 (8.2%) |
| 55 to 59 Years | 286 (7.3%) | 233 (6.9%) |
| 60 to 64 Years | 381 (9.7%) | 335 (9.9%) |
| 65 to 69 Years | 417 (10.6%) | 236 (7.0%) |
| 70 to 74 Years | 213 (5.4%) | 203 (6.0%) |
| 75 to 79 Years | 192 (4.9%) | 181 (5.3%) |
| 80 to 84 Years | 92 (2.3%) | 84 (2.5%) |
| 85 Years and over | 187 (4.8%) | 368 (10.9%) |
| Total | 3,931 (100.0%) | 3,386 (100.0%) |
Families and Households in Chesterland
Median Family Size in Chesterland
The median family size in Chesterland is 2.78 persons per family, with married-couple families (1,754 | 83.8%) accounting for the largest median family size of 2.87 persons per family. On the other hand, single male/father families (77 | 3.7%) represent the smallest median family size with 2.08 persons per family.
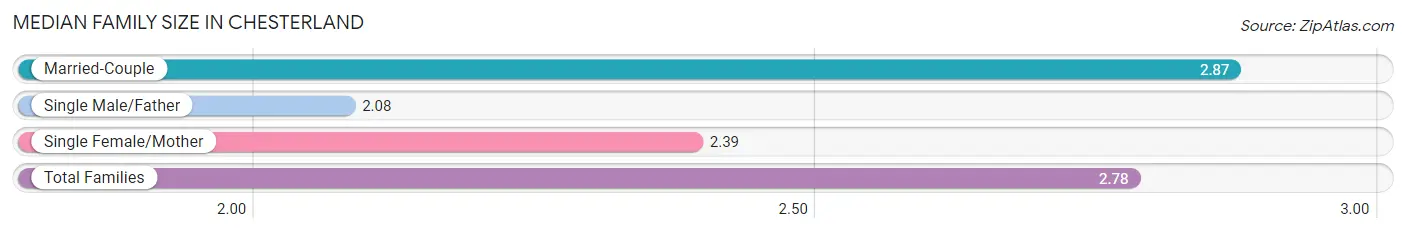
| Family Type | # Families | Family Size |
| Married-Couple | 1,754 (83.8%) | 2.87 |
| Single Male/Father | 77 (3.7%) | 2.08 |
| Single Female/Mother | 262 (12.5%) | 2.39 |
| Total Families | 2,093 (100.0%) | 2.78 |
Median Household Size in Chesterland
The median household size in Chesterland is 2.45 persons per household, with single female/mother households (262 | 8.8%) accounting for the largest median household size of 3.47 persons per household. non-family households (879 | 29.6%) represent the smallest median household size with 1.25 persons per household.
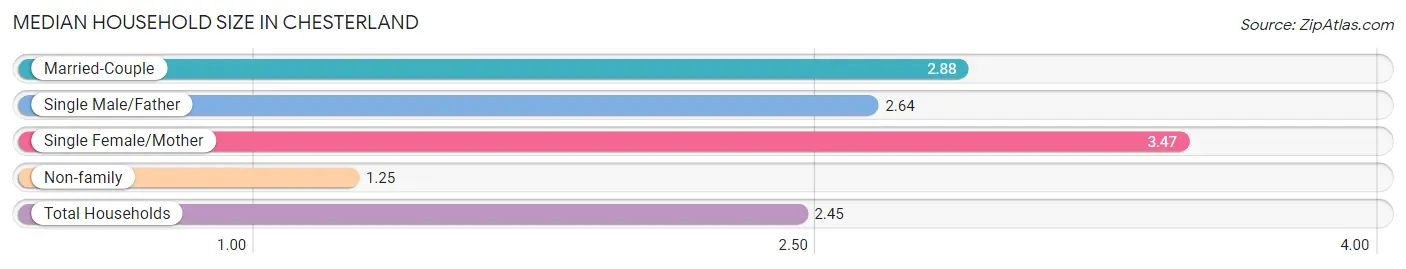
| Household Type | # Households | Household Size |
| Married-Couple | 1,754 (59.0%) | 2.88 |
| Single Male/Father | 77 (2.6%) | 2.64 |
| Single Female/Mother | 262 (8.8%) | 3.47 |
| Non-family | 879 (29.6%) | 1.25 |
| Total Households | 2,972 (100.0%) | 2.45 |
Household Size by Marriage Status in Chesterland
Out of a total of 2,972 households in Chesterland, 2,093 (70.4%) are family households, while 879 (29.6%) are nonfamily households. The most numerous type of family households are 2-person households, comprising 1,141, and the most common type of nonfamily households are 1-person households, comprising 716.
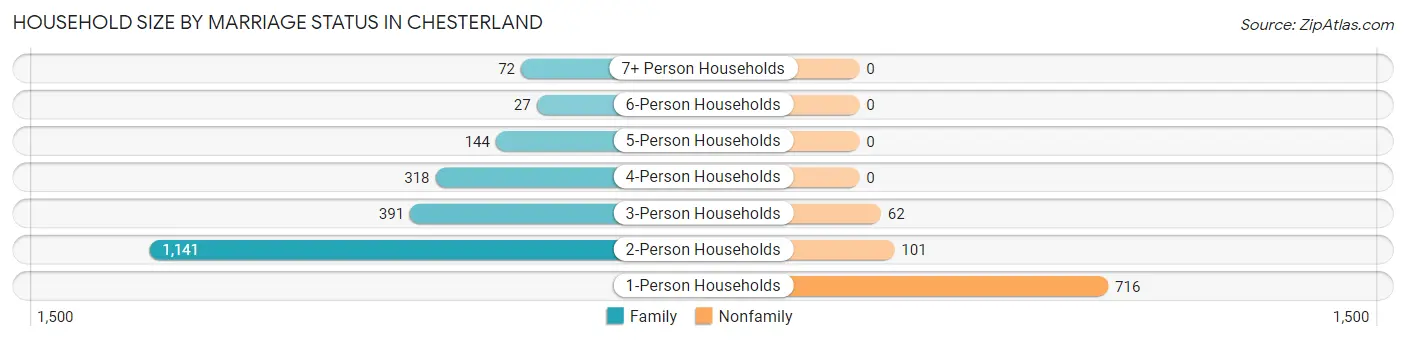
| Household Size | Family Households | Nonfamily Households |
| 1-Person Households | - | 716 (24.1%) |
| 2-Person Households | 1,141 (38.4%) | 101 (3.4%) |
| 3-Person Households | 391 (13.2%) | 62 (2.1%) |
| 4-Person Households | 318 (10.7%) | 0 (0.0%) |
| 5-Person Households | 144 (4.9%) | 0 (0.0%) |
| 6-Person Households | 27 (0.9%) | 0 (0.0%) |
| 7+ Person Households | 72 (2.4%) | 0 (0.0%) |
| Total | 2,093 (70.4%) | 879 (29.6%) |
Female Fertility in Chesterland
Fertility by Age in Chesterland
Average fertility rate in Chesterland is 17.0 births per 1,000 women. Women in the age bracket of 20 to 34 years have the highest fertility rate with 40.0 births per 1,000 women. Women in the age bracket of 20 to 34 years acount for 100.0% of all women with births.
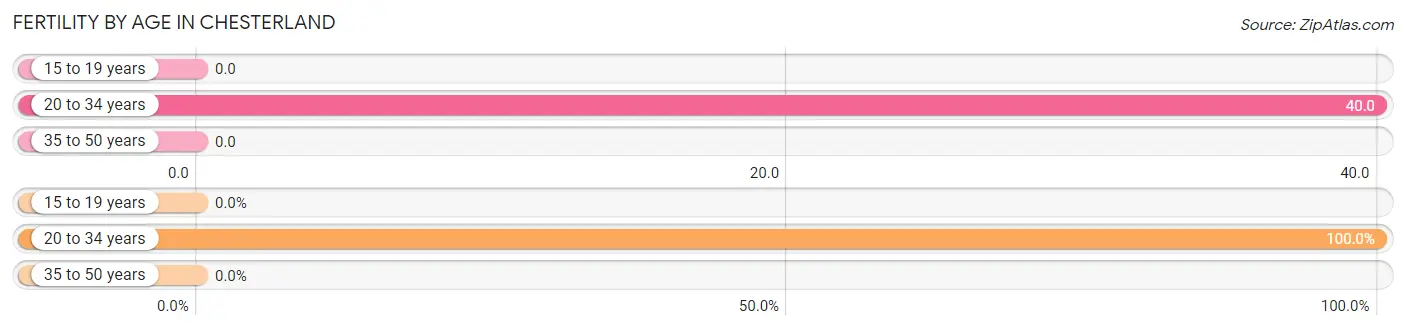
| Age Bracket | Women with Births | Births / 1,000 Women |
| 15 to 19 years | 0 (0.0%) | 0.0 |
| 20 to 34 years | 20 (100.0%) | 40.0 |
| 35 to 50 years | 0 (0.0%) | 0.0 |
| Total | 20 (100.0%) | 17.0 |
Fertility by Age by Marriage Status in Chesterland
40.0% of women with births (20) in Chesterland are married. The highest percentage of unmarried women with births falls into 20 to 34 years age bracket with 60.0% of them unmarried at the time of birth, while the lowest percentage of unmarried women with births belong to 20 to 34 years age bracket with 60.0% of them unmarried.
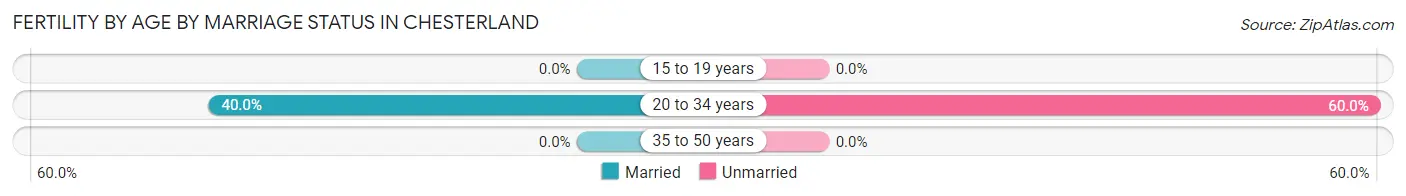
| Age Bracket | Married | Unmarried |
| 15 to 19 years | 0 (0.0%) | 0 (0.0%) |
| 20 to 34 years | 8 (40.0%) | 12 (60.0%) |
| 35 to 50 years | 0 (0.0%) | 0 (0.0%) |
| Total | 8 (40.0%) | 12 (60.0%) |
Fertility by Education in Chesterland
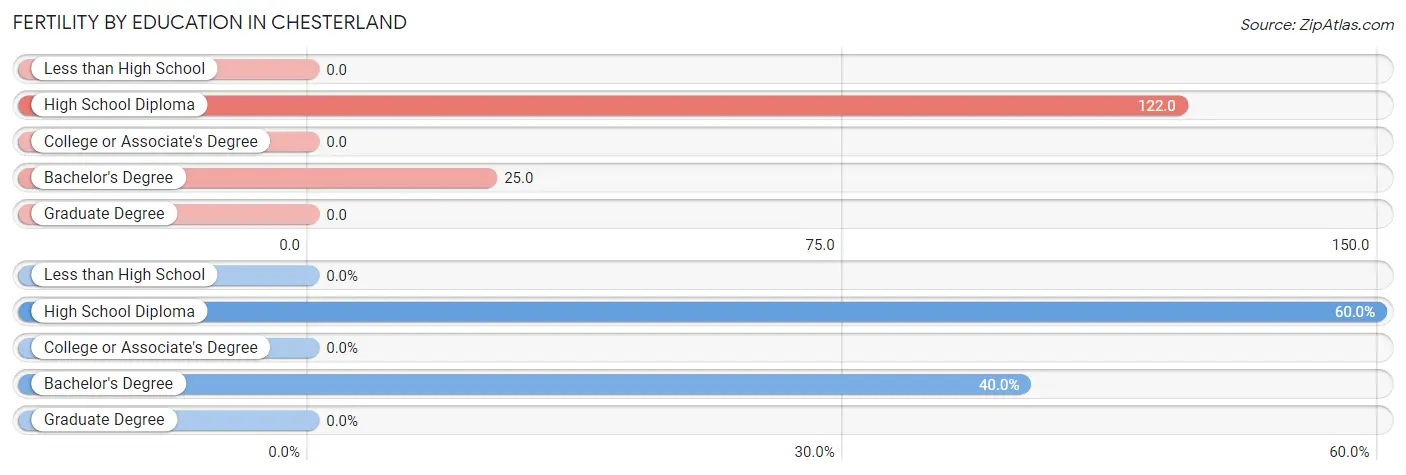
| Educational Attainment | Women with Births | Births / 1,000 Women |
| Less than High School | 0 (0.0%) | 0.0 |
| High School Diploma | 12 (60.0%) | 122.0 |
| College or Associate's Degree | 0 (0.0%) | 0.0 |
| Bachelor's Degree | 8 (40.0%) | 25.0 |
| Graduate Degree | 0 (0.0%) | 0.0 |
| Total | 20 (100.0%) | 17.0 |
Fertility by Education by Marriage Status in Chesterland
60.0% of women with births in Chesterland are unmarried. Women with the educational attainment of bachelor's degree are most likely to be married with 100.0% of them married at childbirth, while women with the educational attainment of high school diploma are least likely to be married with 100.0% of them unmarried at childbirth.
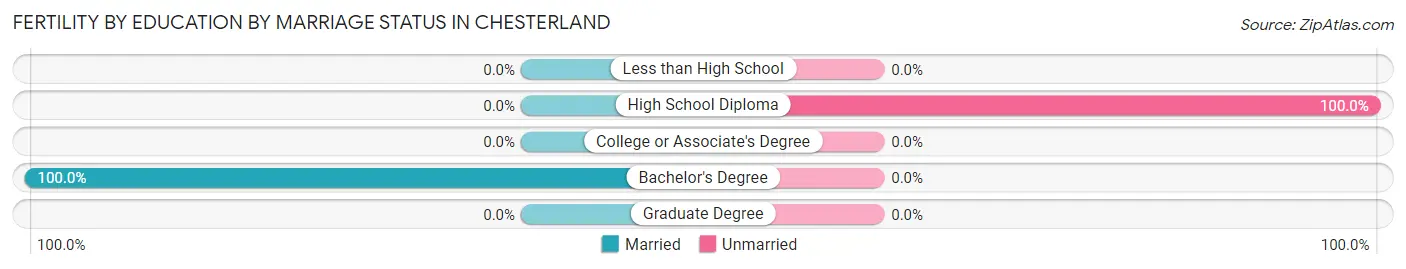
| Educational Attainment | Married | Unmarried |
| Less than High School | 0 (0.0%) | 0 (0.0%) |
| High School Diploma | 0 (0.0%) | 12 (100.0%) |
| College or Associate's Degree | 0 (0.0%) | 0 (0.0%) |
| Bachelor's Degree | 8 (100.0%) | 0 (0.0%) |
| Graduate Degree | 0 (0.0%) | 0 (0.0%) |
| Total | 8 (40.0%) | 12 (60.0%) |
Employment Characteristics in Chesterland
Employment by Class of Employer in Chesterland
Among the 3,426 employed individuals in Chesterland, private company employees (2,086 | 60.9%), local government employees (370 | 10.8%), and self-employed (incorporated) (344 | 10.0%) make up the most common classes of employment.
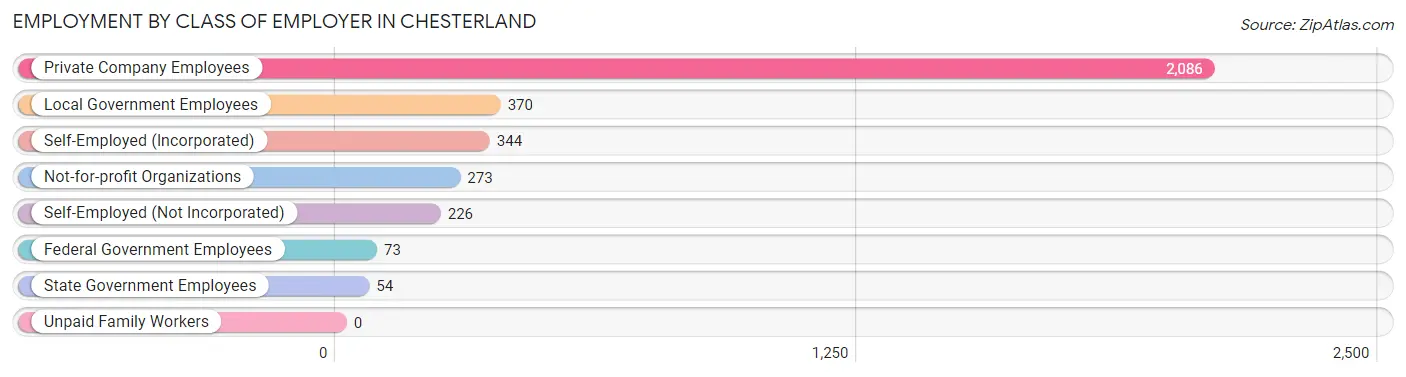
| Employer Class | # Employees | % Employees |
| Private Company Employees | 2,086 | 60.9% |
| Self-Employed (Incorporated) | 344 | 10.0% |
| Self-Employed (Not Incorporated) | 226 | 6.6% |
| Not-for-profit Organizations | 273 | 8.0% |
| Local Government Employees | 370 | 10.8% |
| State Government Employees | 54 | 1.6% |
| Federal Government Employees | 73 | 2.1% |
| Unpaid Family Workers | 0 | 0.0% |
| Total | 3,426 | 100.0% |
Employment Status by Age in Chesterland
According to the labor force statistics for Chesterland, out of the total population over 16 years of age (6,294), 60.2% or 3,789 individuals are in the labor force, with 5.6% or 212 of them unemployed. The age group with the highest labor force participation rate is 35 to 44 years, with 93.7% or 473 individuals in the labor force. Within the labor force, the 20 to 24 years age range has the highest percentage of unemployed individuals, with 29.3% or 103 of them being unemployed.
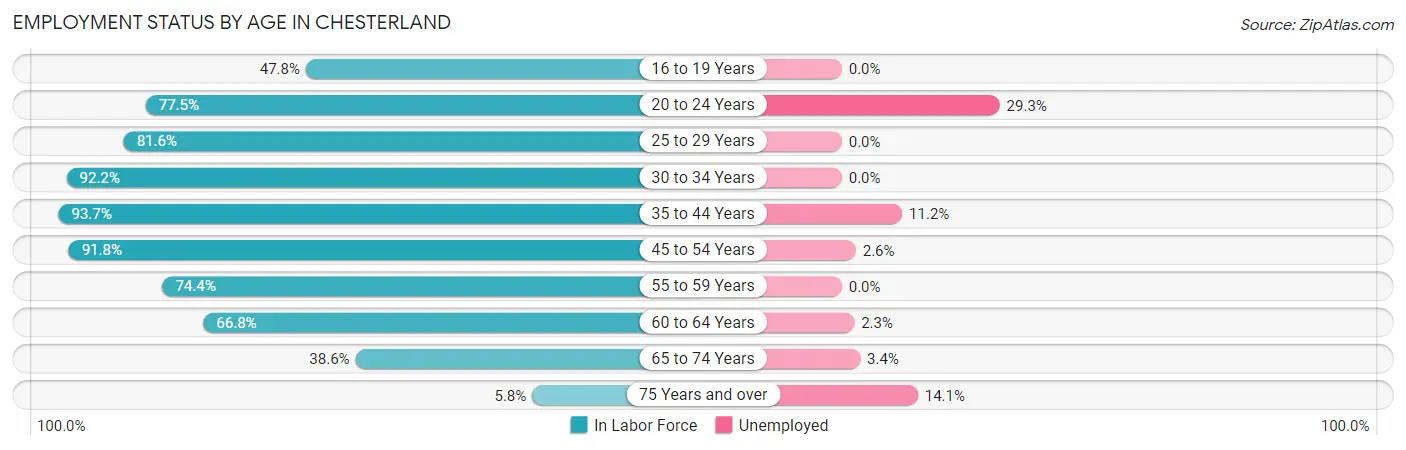
| Age Bracket | In Labor Force | Unemployed |
| 16 to 19 Years | 132 (47.8%) | 0 (0.0%) |
| 20 to 24 Years | 351 (77.5%) | 103 (29.3%) |
| 25 to 29 Years | 199 (81.6%) | 0 (0.0%) |
| 30 to 34 Years | 357 (92.2%) | 0 (0.0%) |
| 35 to 44 Years | 473 (93.7%) | 53 (11.2%) |
| 45 to 54 Years | 937 (91.8%) | 24 (2.6%) |
| 55 to 59 Years | 386 (74.4%) | 0 (0.0%) |
| 60 to 64 Years | 478 (66.8%) | 11 (2.3%) |
| 65 to 74 Years | 413 (38.6%) | 14 (3.4%) |
| 75 Years and over | 64 (5.8%) | 9 (14.1%) |
| Total | 3,789 (60.2%) | 212 (5.6%) |
Employment Status by Educational Attainment in Chesterland
According to labor force statistics for Chesterland, 83.4% of individuals (2,829) out of the total population between 25 and 64 years of age (3,392) are in the labor force, with 3.1% or 88 of them being unemployed. The group with the highest labor force participation rate are those with the educational attainment of college / associate degree, with 90.1% or 1,103 individuals in the labor force. Within the labor force, individuals with bachelor's degree or higher education have the highest percentage of unemployment, with 6.3% or 77 of them being unemployed.
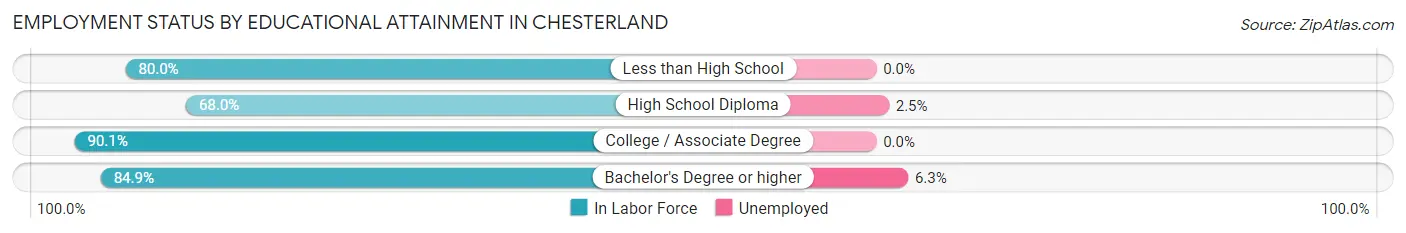
| Educational Attainment | In Labor Force | Unemployed |
| Less than High School | 56 (80.0%) | 0 (0.0%) |
| High School Diploma | 444 (68.0%) | 16 (2.5%) |
| College / Associate Degree | 1,103 (90.1%) | 0 (0.0%) |
| Bachelor's Degree or higher | 1,227 (84.9%) | 91 (6.3%) |
| Total | 2,829 (83.4%) | 105 (3.1%) |
Employment Occupations by Sex in Chesterland
Management, Business, Science and Arts Occupations
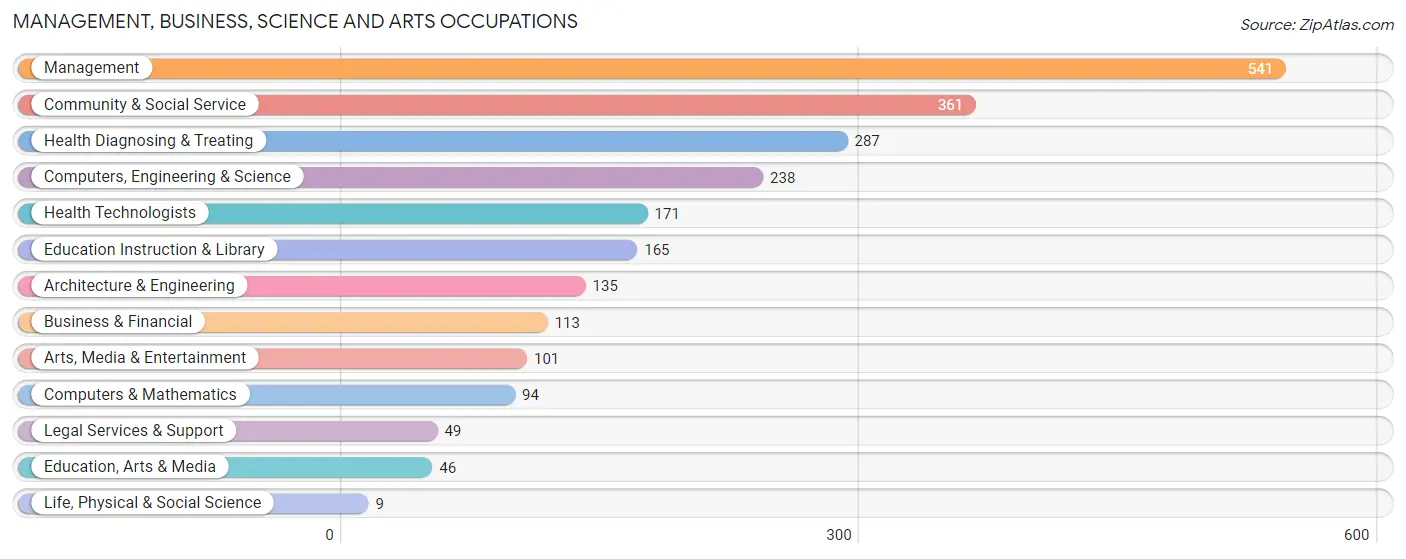
The most common Management, Business, Science and Arts occupations in Chesterland are Management (541 | 15.1%), Community & Social Service (361 | 10.1%), Health Diagnosing & Treating (287 | 8.0%), Computers, Engineering & Science (238 | 6.7%), and Health Technologists (171 | 4.8%).
Management, Business, Science and Arts Occupations by Sex
Within the Management, Business, Science and Arts occupations in Chesterland, the most male-oriented occupations are Architecture & Engineering (92.6%), Computers, Engineering & Science (81.5%), and Computers & Mathematics (73.4%), while the most female-oriented occupations are Business & Financial (100.0%), Life, Physical & Social Science (100.0%), and Education, Arts & Media (100.0%).
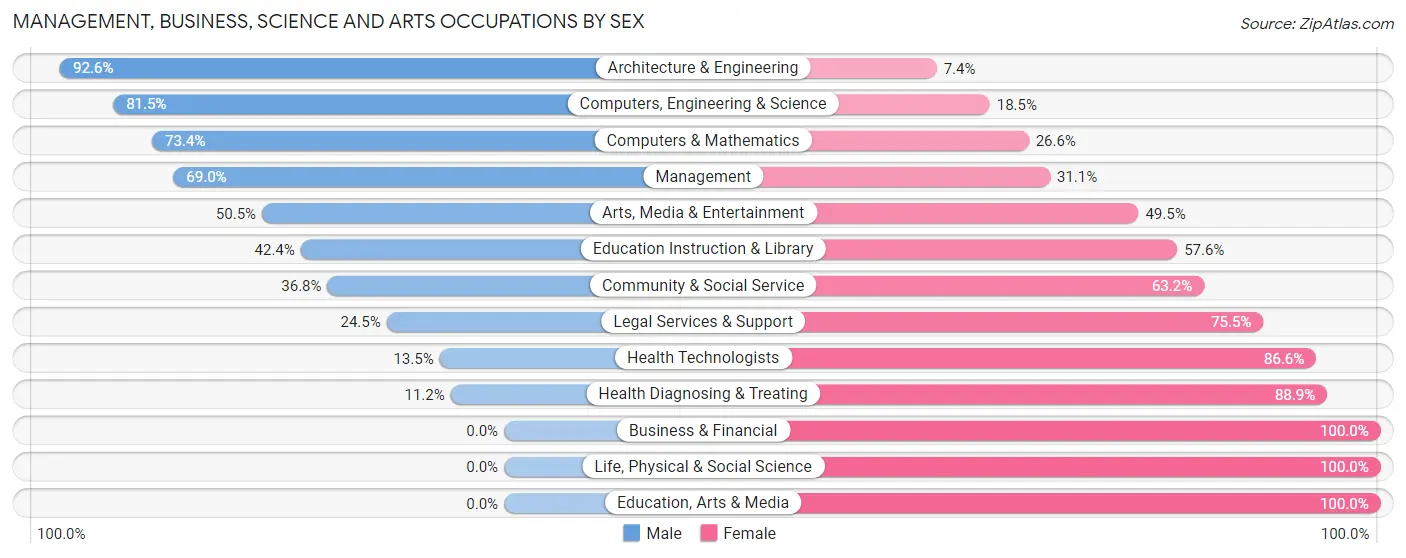
| Occupation | Male | Female |
| Management | 373 (69.0%) | 168 (31.0%) |
| Business & Financial | 0 (0.0%) | 113 (100.0%) |
| Computers, Engineering & Science | 194 (81.5%) | 44 (18.5%) |
| Computers & Mathematics | 69 (73.4%) | 25 (26.6%) |
| Architecture & Engineering | 125 (92.6%) | 10 (7.4%) |
| Life, Physical & Social Science | 0 (0.0%) | 9 (100.0%) |
| Community & Social Service | 133 (36.8%) | 228 (63.2%) |
| Education, Arts & Media | 0 (0.0%) | 46 (100.0%) |
| Legal Services & Support | 12 (24.5%) | 37 (75.5%) |
| Education Instruction & Library | 70 (42.4%) | 95 (57.6%) |
| Arts, Media & Entertainment | 51 (50.5%) | 50 (49.5%) |
| Health Diagnosing & Treating | 32 (11.2%) | 255 (88.8%) |
| Health Technologists | 23 (13.5%) | 148 (86.6%) |
| Total (Category) | 732 (47.5%) | 808 (52.5%) |
| Total (Overall) | 1,911 (53.4%) | 1,665 (46.6%) |
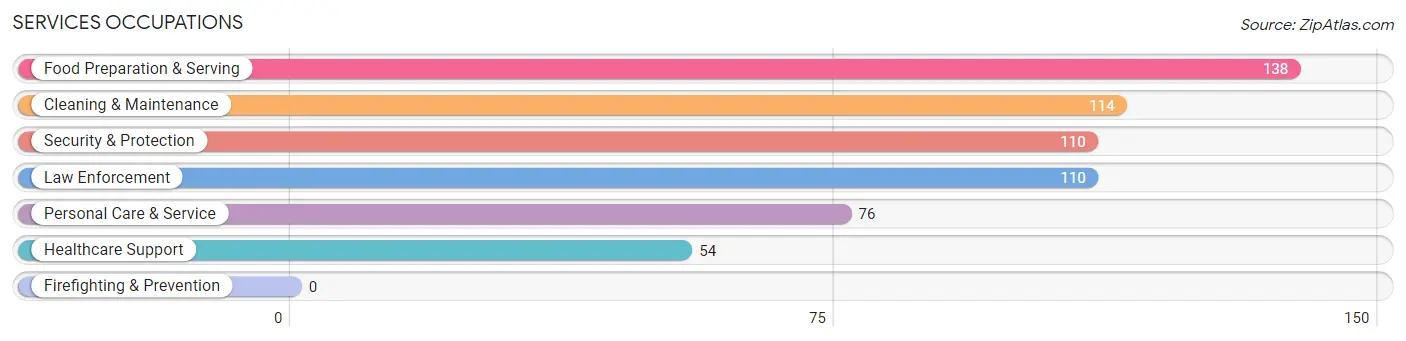
Services Occupations
The most common Services occupations in Chesterland are Food Preparation & Serving (138 | 3.9%), Cleaning & Maintenance (114 | 3.2%), Security & Protection (110 | 3.1%), Law Enforcement (110 | 3.1%), and Personal Care & Service (76 | 2.1%).
Services Occupations by Sex
Within the Services occupations in Chesterland, the most male-oriented occupations are Cleaning & Maintenance (79.8%), Security & Protection (69.1%), and Law Enforcement (69.1%), while the most female-oriented occupations are Healthcare Support (79.6%), Personal Care & Service (71.1%), and Food Preparation & Serving (52.9%).
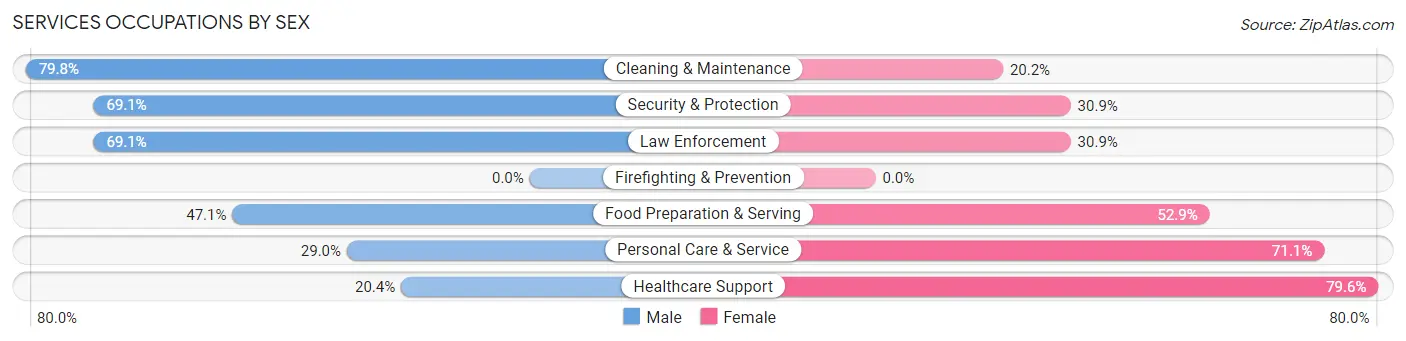
| Occupation | Male | Female |
| Healthcare Support | 11 (20.4%) | 43 (79.6%) |
| Security & Protection | 76 (69.1%) | 34 (30.9%) |
| Firefighting & Prevention | 0 (0.0%) | 0 (0.0%) |
| Law Enforcement | 76 (69.1%) | 34 (30.9%) |
| Food Preparation & Serving | 65 (47.1%) | 73 (52.9%) |
| Cleaning & Maintenance | 91 (79.8%) | 23 (20.2%) |
| Personal Care & Service | 22 (28.9%) | 54 (71.1%) |
| Total (Category) | 265 (53.9%) | 227 (46.1%) |
| Total (Overall) | 1,911 (53.4%) | 1,665 (46.6%) |
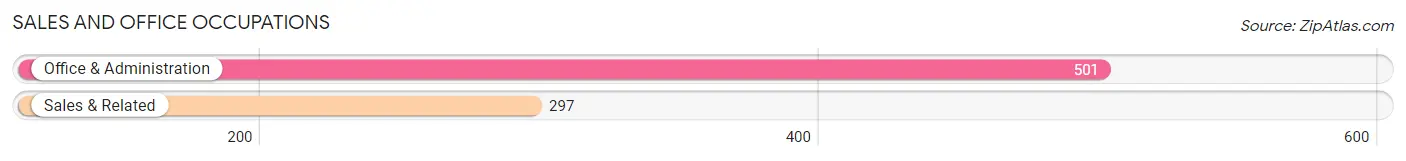
Sales and Office Occupations
The most common Sales and Office occupations in Chesterland are Office & Administration (501 | 14.0%), and Sales & Related (297 | 8.3%).
Sales and Office Occupations by Sex
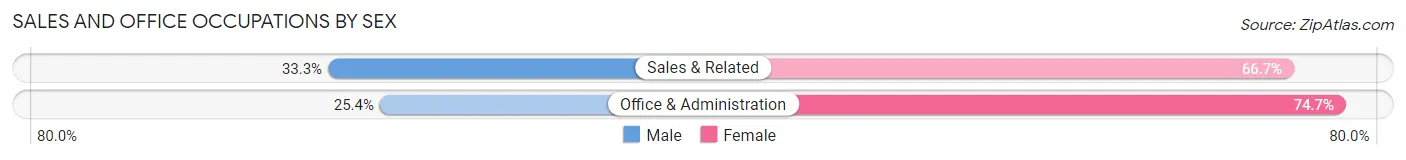
| Occupation | Male | Female |
| Sales & Related | 99 (33.3%) | 198 (66.7%) |
| Office & Administration | 127 (25.4%) | 374 (74.7%) |
| Total (Category) | 226 (28.3%) | 572 (71.7%) |
| Total (Overall) | 1,911 (53.4%) | 1,665 (46.6%) |
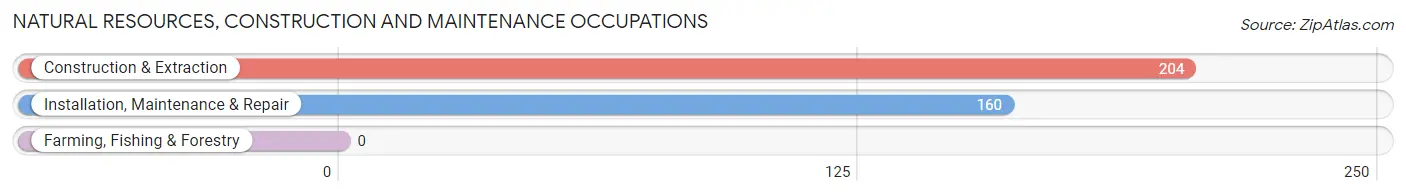
Natural Resources, Construction and Maintenance Occupations
The most common Natural Resources, Construction and Maintenance occupations in Chesterland are Construction & Extraction (204 | 5.7%), and Installation, Maintenance & Repair (160 | 4.5%).
Natural Resources, Construction and Maintenance Occupations by Sex
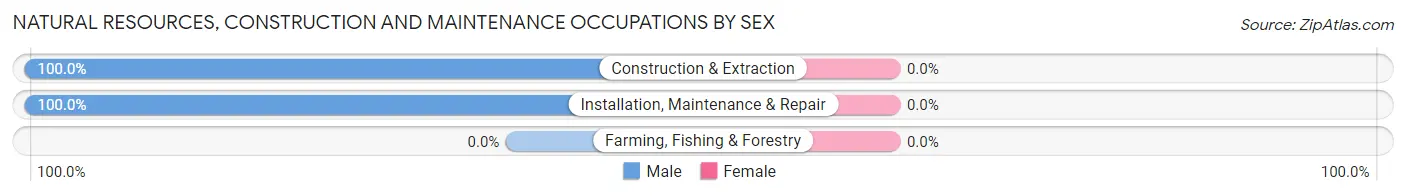
| Occupation | Male | Female |
| Farming, Fishing & Forestry | 0 (0.0%) | 0 (0.0%) |
| Construction & Extraction | 204 (100.0%) | 0 (0.0%) |
| Installation, Maintenance & Repair | 160 (100.0%) | 0 (0.0%) |
| Total (Category) | 364 (100.0%) | 0 (0.0%) |
| Total (Overall) | 1,911 (53.4%) | 1,665 (46.6%) |
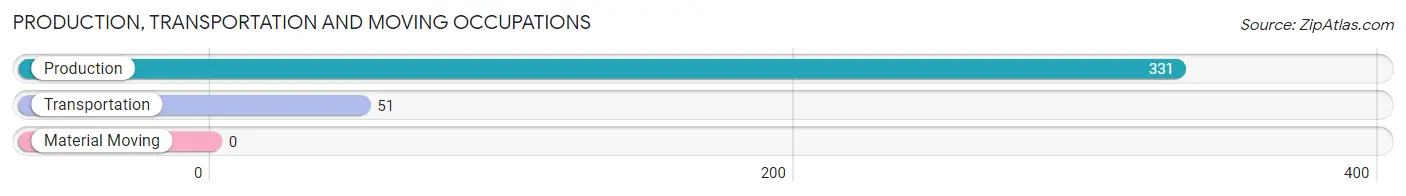
Production, Transportation and Moving Occupations
The most common Production, Transportation and Moving occupations in Chesterland are Production (331 | 9.3%), and Transportation (51 | 1.4%).
Production, Transportation and Moving Occupations by Sex
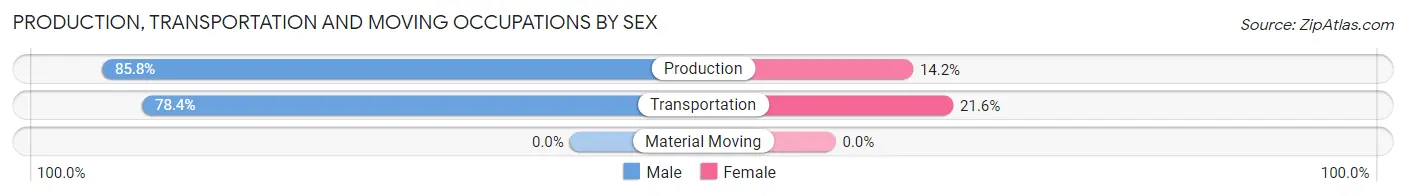
| Occupation | Male | Female |
| Production | 284 (85.8%) | 47 (14.2%) |
| Transportation | 40 (78.4%) | 11 (21.6%) |
| Material Moving | 0 (0.0%) | 0 (0.0%) |
| Total (Category) | 324 (84.8%) | 58 (15.2%) |
| Total (Overall) | 1,911 (53.4%) | 1,665 (46.6%) |
Employment Industries by Sex in Chesterland
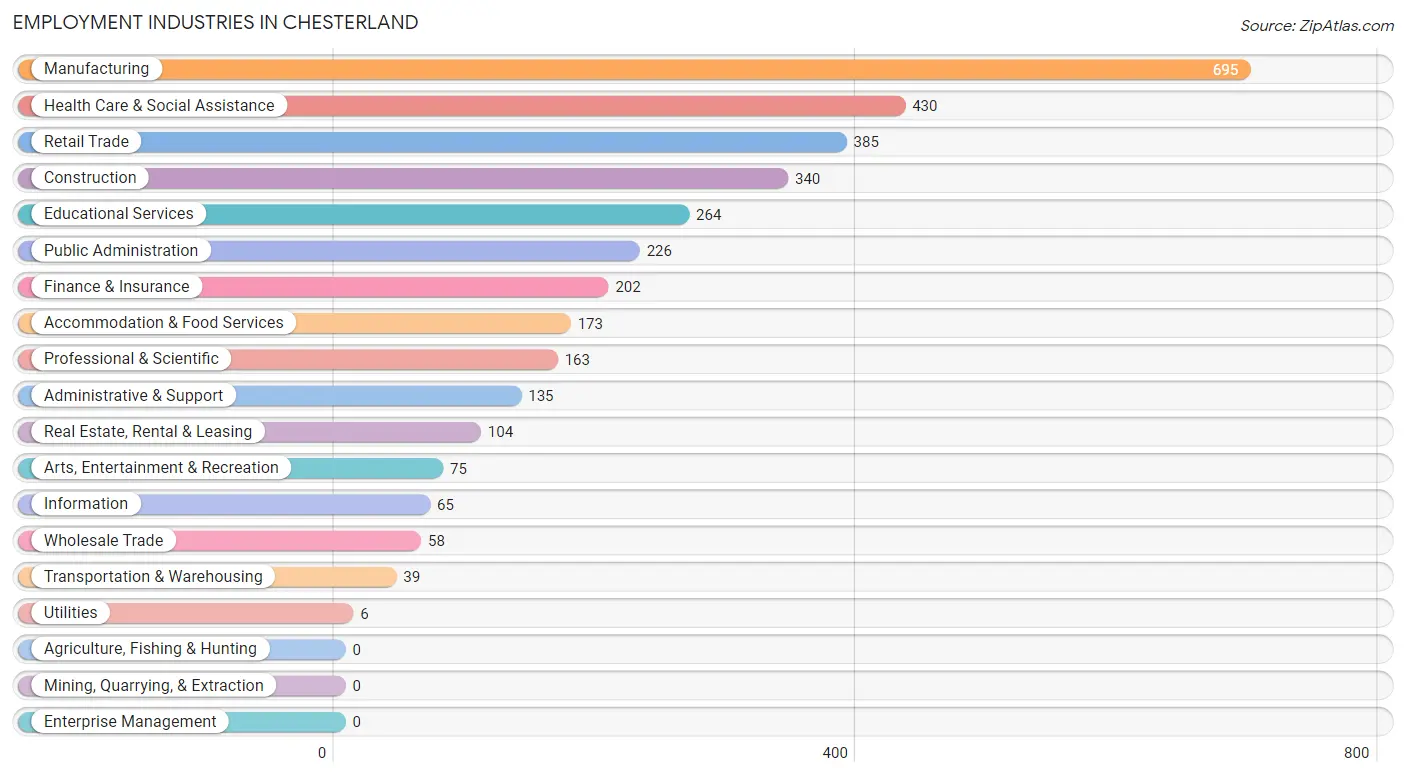
Employment Industries in Chesterland
The major employment industries in Chesterland include Manufacturing (695 | 19.4%), Health Care & Social Assistance (430 | 12.0%), Retail Trade (385 | 10.8%), Construction (340 | 9.5%), and Educational Services (264 | 7.4%).
Employment Industries by Sex in Chesterland
The Chesterland industries that see more men than women are Utilities (100.0%), Construction (88.8%), and Manufacturing (73.8%), whereas the industries that tend to have a higher number of women are Arts, Entertainment & Recreation (92.0%), Wholesale Trade (84.5%), and Health Care & Social Assistance (76.0%).
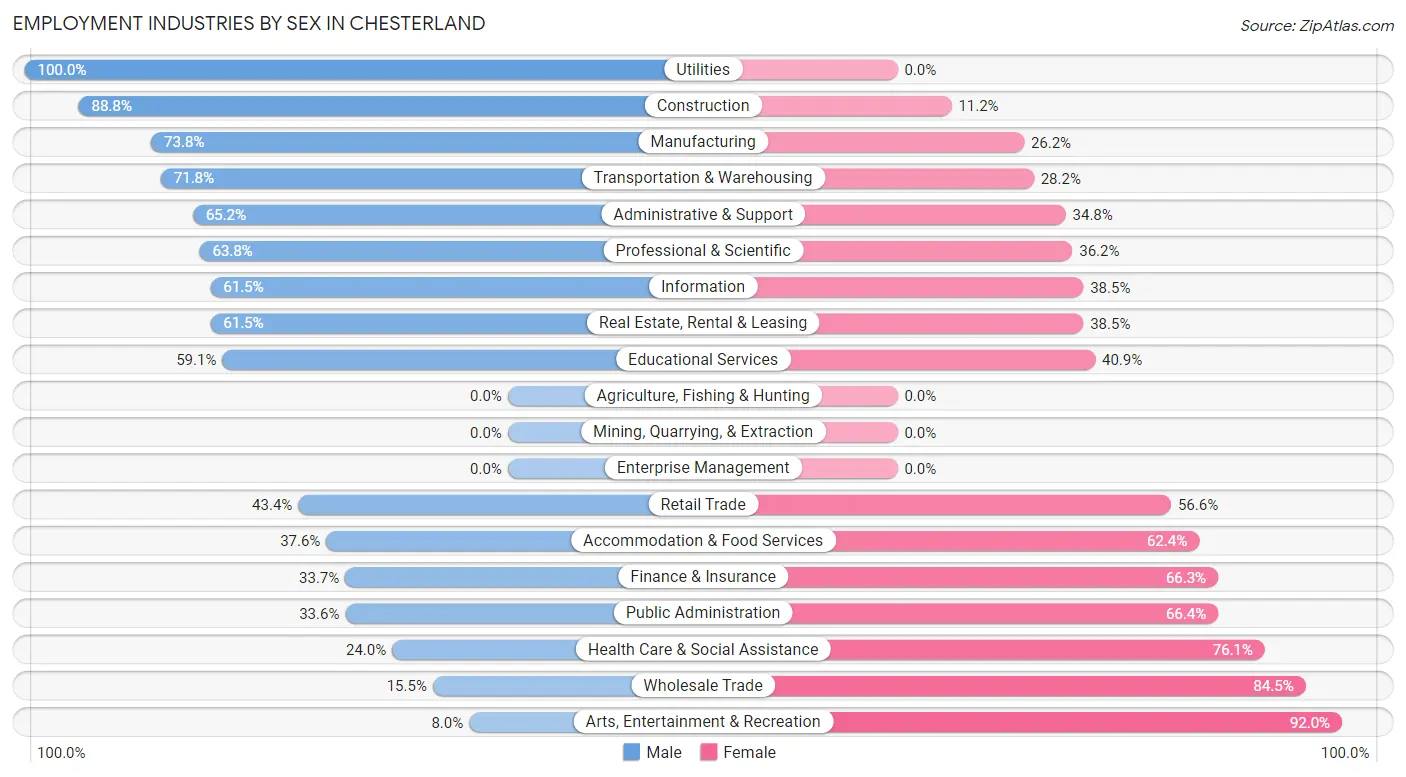
| Industry | Male | Female |
| Agriculture, Fishing & Hunting | 0 (0.0%) | 0 (0.0%) |
| Mining, Quarrying, & Extraction | 0 (0.0%) | 0 (0.0%) |
| Construction | 302 (88.8%) | 38 (11.2%) |
| Manufacturing | 513 (73.8%) | 182 (26.2%) |
| Wholesale Trade | 9 (15.5%) | 49 (84.5%) |
| Retail Trade | 167 (43.4%) | 218 (56.6%) |
| Transportation & Warehousing | 28 (71.8%) | 11 (28.2%) |
| Utilities | 6 (100.0%) | 0 (0.0%) |
| Information | 40 (61.5%) | 25 (38.5%) |
| Finance & Insurance | 68 (33.7%) | 134 (66.3%) |
| Real Estate, Rental & Leasing | 64 (61.5%) | 40 (38.5%) |
| Professional & Scientific | 104 (63.8%) | 59 (36.2%) |
| Enterprise Management | 0 (0.0%) | 0 (0.0%) |
| Administrative & Support | 88 (65.2%) | 47 (34.8%) |
| Educational Services | 156 (59.1%) | 108 (40.9%) |
| Health Care & Social Assistance | 103 (23.9%) | 327 (76.0%) |
| Arts, Entertainment & Recreation | 6 (8.0%) | 69 (92.0%) |
| Accommodation & Food Services | 65 (37.6%) | 108 (62.4%) |
| Public Administration | 76 (33.6%) | 150 (66.4%) |
| Total | 1,911 (53.4%) | 1,665 (46.6%) |
Education in Chesterland
School Enrollment in Chesterland
The most common levels of schooling among the 1,349 students in Chesterland are high school (369 | 27.4%), elementary school (334 | 24.8%), and college / undergraduate (278 | 20.6%).
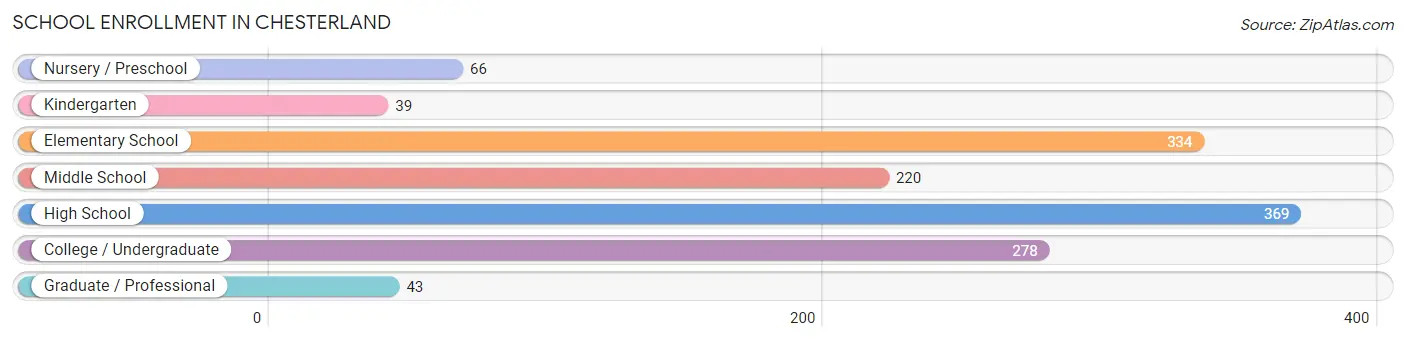
| School Level | # Students | % Students |
| Nursery / Preschool | 66 | 4.9% |
| Kindergarten | 39 | 2.9% |
| Elementary School | 334 | 24.8% |
| Middle School | 220 | 16.3% |
| High School | 369 | 27.4% |
| College / Undergraduate | 278 | 20.6% |
| Graduate / Professional | 43 | 3.2% |
| Total | 1,349 | 100.0% |
School Enrollment by Age by Funding Source in Chesterland
Out of a total of 1,349 students who are enrolled in schools in Chesterland, 353 (26.2%) attend a private institution, while the remaining 996 (73.8%) are enrolled in public schools. The age group of 3 to 4 year olds has the highest likelihood of being enrolled in private schools, with 40 (83.3% in the age bracket) enrolled. Conversely, the age group of 18 to 19 year olds has the lowest likelihood of being enrolled in a private school, with 99 (100.0% in the age bracket) attending a public institution.
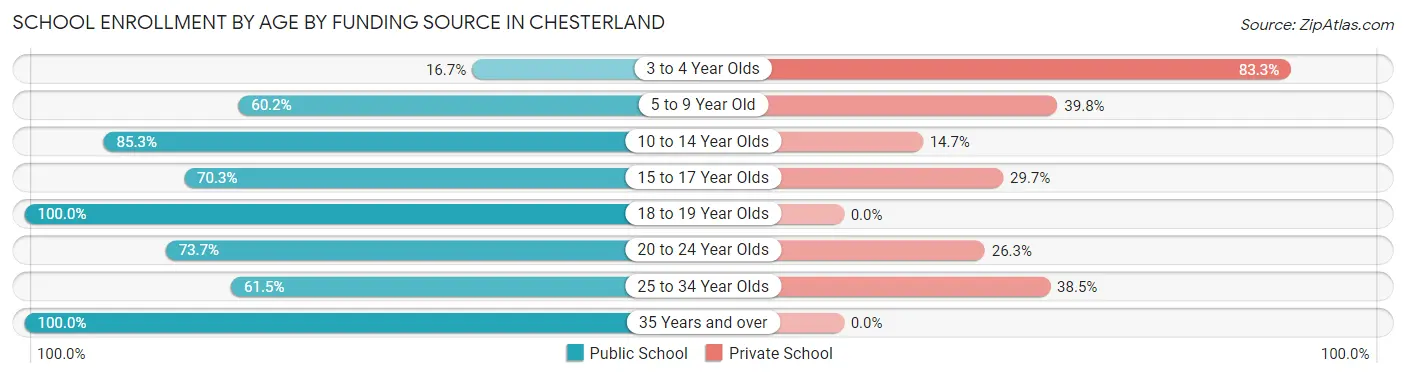
| Age Bracket | Public School | Private School |
| 3 to 4 Year Olds | 8 (16.7%) | 40 (83.3%) |
| 5 to 9 Year Old | 195 (60.2%) | 129 (39.8%) |
| 10 to 14 Year Olds | 307 (85.3%) | 53 (14.7%) |
| 15 to 17 Year Olds | 142 (70.3%) | 60 (29.7%) |
| 18 to 19 Year Olds | 99 (100.0%) | 0 (0.0%) |
| 20 to 24 Year Olds | 171 (73.7%) | 61 (26.3%) |
| 25 to 34 Year Olds | 16 (61.5%) | 10 (38.5%) |
| 35 Years and over | 58 (100.0%) | 0 (0.0%) |
| Total | 996 (73.8%) | 353 (26.2%) |
Educational Attainment by Field of Study in Chesterland
Engineering (334 | 15.0%), business (332 | 14.9%), education (256 | 11.5%), science & technology (246 | 11.1%), and literature & languages (156 | 7.0%) are the most common fields of study among 2,226 individuals in Chesterland who have obtained a bachelor's degree or higher.
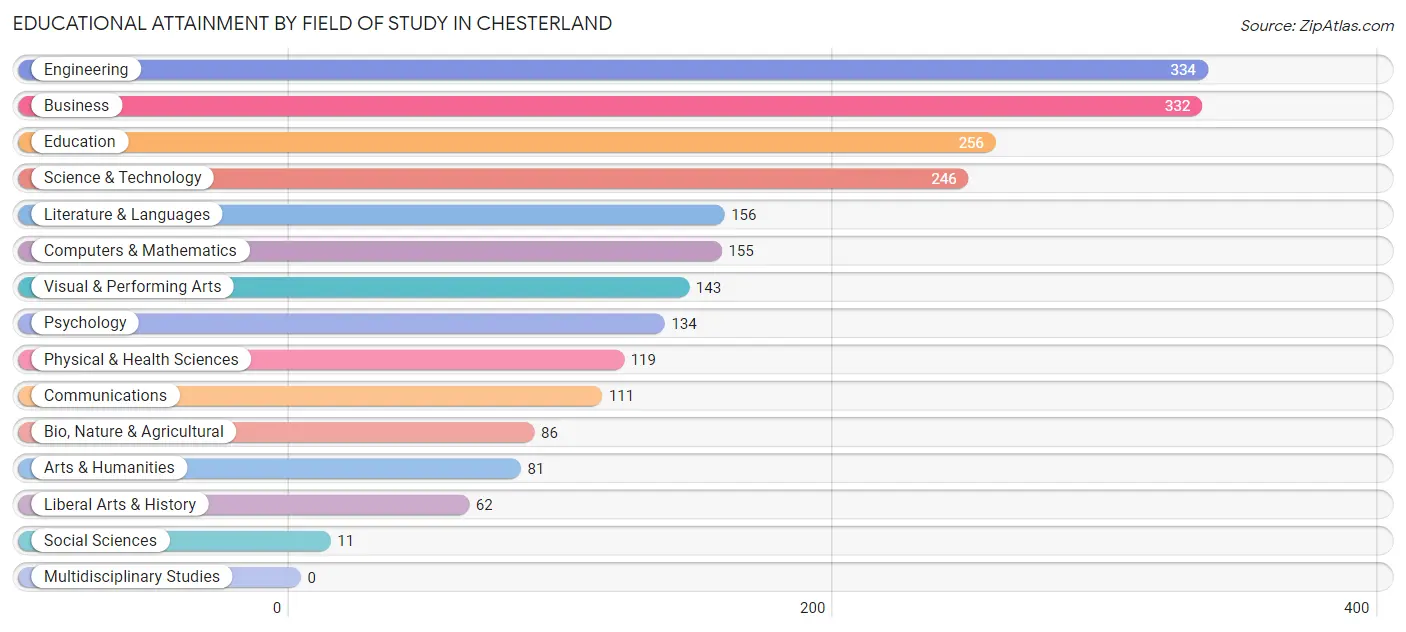
| Field of Study | # Graduates | % Graduates |
| Computers & Mathematics | 155 | 7.0% |
| Bio, Nature & Agricultural | 86 | 3.9% |
| Physical & Health Sciences | 119 | 5.3% |
| Psychology | 134 | 6.0% |
| Social Sciences | 11 | 0.5% |
| Engineering | 334 | 15.0% |
| Multidisciplinary Studies | 0 | 0.0% |
| Science & Technology | 246 | 11.1% |
| Business | 332 | 14.9% |
| Education | 256 | 11.5% |
| Literature & Languages | 156 | 7.0% |
| Liberal Arts & History | 62 | 2.8% |
| Visual & Performing Arts | 143 | 6.4% |
| Communications | 111 | 5.0% |
| Arts & Humanities | 81 | 3.6% |
| Total | 2,226 | 100.0% |
Transportation & Commute in Chesterland
Vehicle Availability by Sex in Chesterland
The most prevalent vehicle ownership categories in Chesterland are males with 2 vehicles (652, accounting for 35.1%) and females with 2 vehicles (727, making up 41.6%).
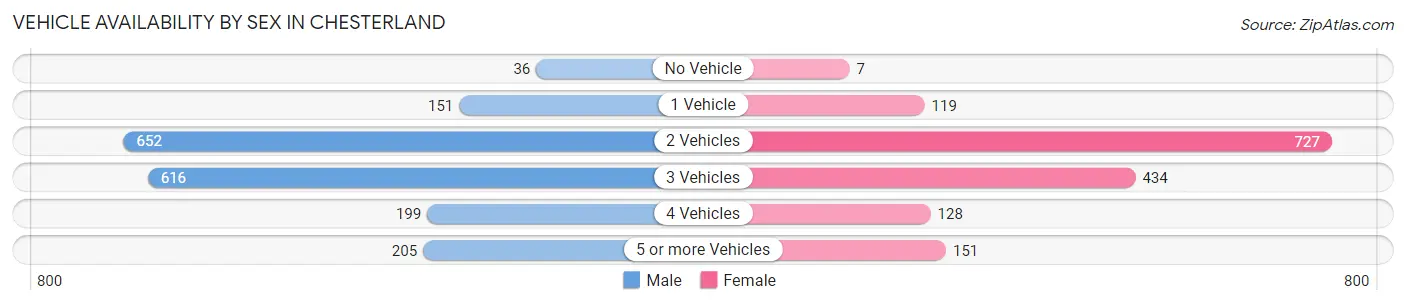
| Vehicles Available | Male | Female |
| No Vehicle | 36 (1.9%) | 7 (0.4%) |
| 1 Vehicle | 151 (8.1%) | 119 (7.6%) |
| 2 Vehicles | 652 (35.1%) | 727 (46.4%) |
| 3 Vehicles | 616 (33.1%) | 434 (27.7%) |
| 4 Vehicles | 199 (10.7%) | 128 (8.2%) |
| 5 or more Vehicles | 205 (11.0%) | 151 (9.6%) |
| Total | 1,859 (100.0%) | 1,566 (100.0%) |
Commute Time in Chesterland
The most frequently occuring commute durations in Chesterland are 30 to 34 minutes (611 commuters, 19.5%), 20 to 24 minutes (478 commuters, 15.2%), and 5 to 9 minutes (466 commuters, 14.8%).
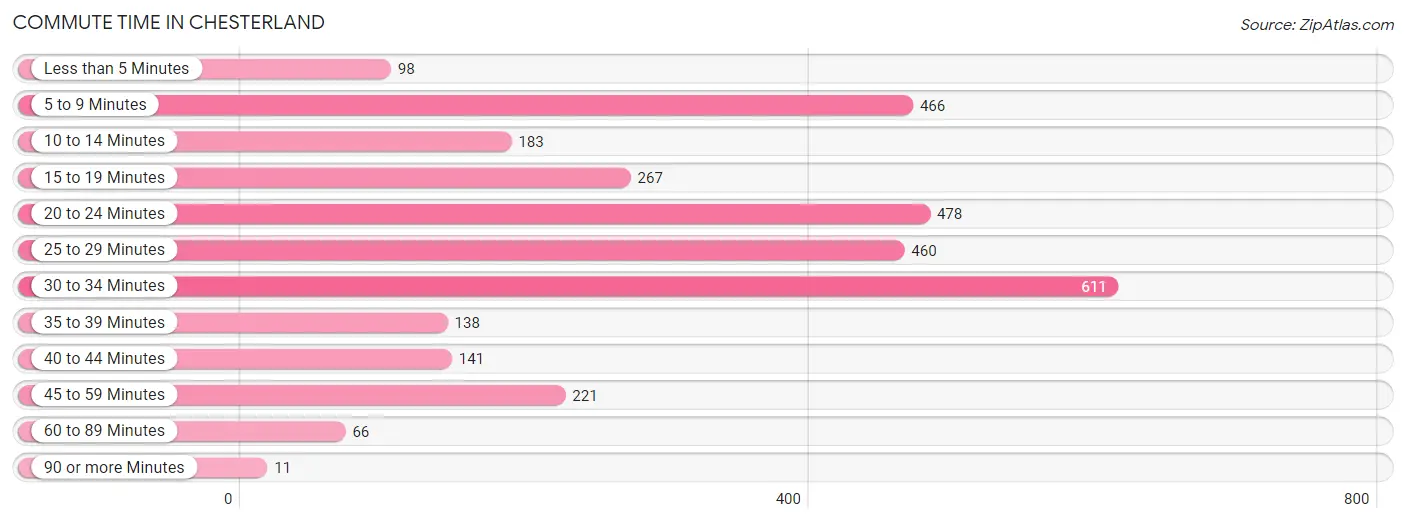
| Commute Time | # Commuters | % Commuters |
| Less than 5 Minutes | 98 | 3.1% |
| 5 to 9 Minutes | 466 | 14.8% |
| 10 to 14 Minutes | 183 | 5.8% |
| 15 to 19 Minutes | 267 | 8.5% |
| 20 to 24 Minutes | 478 | 15.2% |
| 25 to 29 Minutes | 460 | 14.6% |
| 30 to 34 Minutes | 611 | 19.5% |
| 35 to 39 Minutes | 138 | 4.4% |
| 40 to 44 Minutes | 141 | 4.5% |
| 45 to 59 Minutes | 221 | 7.0% |
| 60 to 89 Minutes | 66 | 2.1% |
| 90 or more Minutes | 11 | 0.4% |
Commute Time by Sex in Chesterland
The most common commute times in Chesterland are 30 to 34 minutes (375 commuters, 21.4%) for males and 5 to 9 minutes (250 commuters, 18.0%) for females.
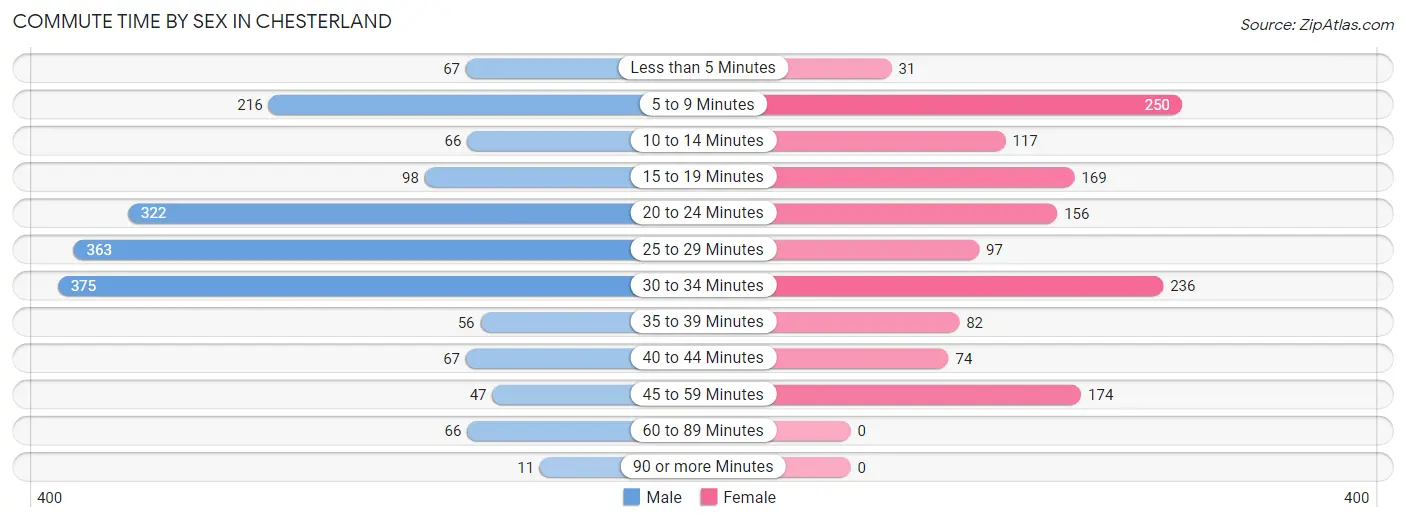
| Commute Time | Male | Female |
| Less than 5 Minutes | 67 (3.8%) | 31 (2.2%) |
| 5 to 9 Minutes | 216 (12.3%) | 250 (18.0%) |
| 10 to 14 Minutes | 66 (3.8%) | 117 (8.4%) |
| 15 to 19 Minutes | 98 (5.6%) | 169 (12.2%) |
| 20 to 24 Minutes | 322 (18.4%) | 156 (11.3%) |
| 25 to 29 Minutes | 363 (20.7%) | 97 (7.0%) |
| 30 to 34 Minutes | 375 (21.4%) | 236 (17.0%) |
| 35 to 39 Minutes | 56 (3.2%) | 82 (5.9%) |
| 40 to 44 Minutes | 67 (3.8%) | 74 (5.3%) |
| 45 to 59 Minutes | 47 (2.7%) | 174 (12.6%) |
| 60 to 89 Minutes | 66 (3.8%) | 0 (0.0%) |
| 90 or more Minutes | 11 (0.6%) | 0 (0.0%) |
Time of Departure to Work by Sex in Chesterland
The most frequent times of departure to work in Chesterland are 7:00 AM to 7:29 AM (376, 21.4%) for males and 7:00 AM to 7:29 AM (320, 23.1%) for females.
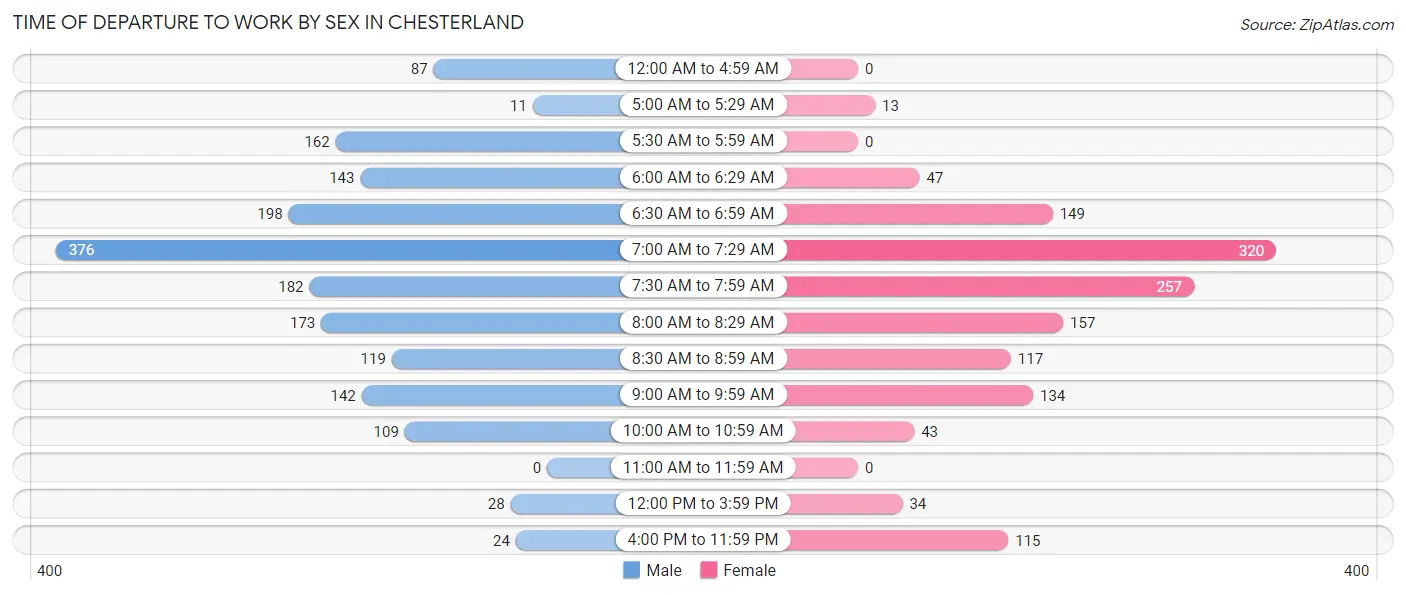
| Time of Departure | Male | Female |
| 12:00 AM to 4:59 AM | 87 (5.0%) | 0 (0.0%) |
| 5:00 AM to 5:29 AM | 11 (0.6%) | 13 (0.9%) |
| 5:30 AM to 5:59 AM | 162 (9.2%) | 0 (0.0%) |
| 6:00 AM to 6:29 AM | 143 (8.2%) | 47 (3.4%) |
| 6:30 AM to 6:59 AM | 198 (11.3%) | 149 (10.7%) |
| 7:00 AM to 7:29 AM | 376 (21.4%) | 320 (23.1%) |
| 7:30 AM to 7:59 AM | 182 (10.4%) | 257 (18.5%) |
| 8:00 AM to 8:29 AM | 173 (9.9%) | 157 (11.3%) |
| 8:30 AM to 8:59 AM | 119 (6.8%) | 117 (8.4%) |
| 9:00 AM to 9:59 AM | 142 (8.1%) | 134 (9.7%) |
| 10:00 AM to 10:59 AM | 109 (6.2%) | 43 (3.1%) |
| 11:00 AM to 11:59 AM | 0 (0.0%) | 0 (0.0%) |
| 12:00 PM to 3:59 PM | 28 (1.6%) | 34 (2.5%) |
| 4:00 PM to 11:59 PM | 24 (1.4%) | 115 (8.3%) |
| Total | 1,754 (100.0%) | 1,386 (100.0%) |
Housing Occupancy in Chesterland
Occupancy by Ownership in Chesterland
Of the total 2,972 dwellings in Chesterland, owner-occupied units account for 2,674 (90.0%), while renter-occupied units make up 298 (10.0%).
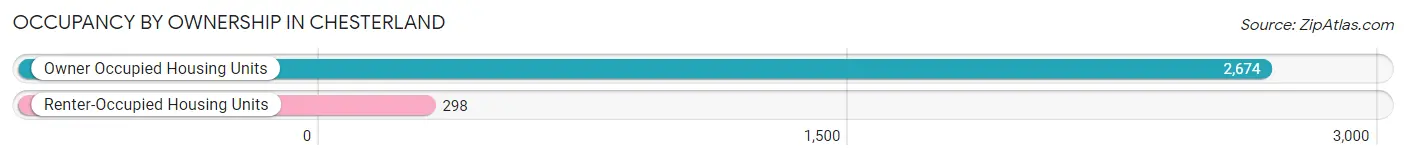
| Occupancy | # Housing Units | % Housing Units |
| Owner Occupied Housing Units | 2,674 | 90.0% |
| Renter-Occupied Housing Units | 298 | 10.0% |
| Total Occupied Housing Units | 2,972 | 100.0% |
Occupancy by Household Size in Chesterland
| Household Size | # Housing Units | % Housing Units |
| 1-Person Household | 716 | 24.1% |
| 2-Person Household | 1,242 | 41.8% |
| 3-Person Household | 453 | 15.2% |
| 4+ Person Household | 561 | 18.9% |
| Total Housing Units | 2,972 | 100.0% |
Occupancy by Ownership by Household Size in Chesterland
| Household Size | Owner-occupied | Renter-occupied |
| 1-Person Household | 628 (87.7%) | 88 (12.3%) |
| 2-Person Household | 1,098 (88.4%) | 144 (11.6%) |
| 3-Person Household | 411 (90.7%) | 42 (9.3%) |
| 4+ Person Household | 537 (95.7%) | 24 (4.3%) |
| Total Housing Units | 2,674 (90.0%) | 298 (10.0%) |
Occupancy by Educational Attainment in Chesterland
| Household Size | Owner-occupied | Renter-occupied |
| Less than High School | 78 (86.7%) | 12 (13.3%) |
| High School Diploma | 447 (85.6%) | 75 (14.4%) |
| College/Associate Degree | 960 (85.5%) | 163 (14.5%) |
| Bachelor's Degree or higher | 1,189 (96.1%) | 48 (3.9%) |
Occupancy by Age of Householder in Chesterland
| Age Bracket | # Households | % Households |
| Under 35 Years | 352 | 11.8% |
| 35 to 44 Years | 276 | 9.3% |
| 45 to 54 Years | 536 | 18.0% |
| 55 to 64 Years | 663 | 22.3% |
| 65 to 74 Years | 682 | 23.0% |
| 75 to 84 Years | 277 | 9.3% |
| 85 Years and Over | 186 | 6.3% |
| Total | 2,972 | 100.0% |
Housing Finances in Chesterland
Median Income by Occupancy in Chesterland
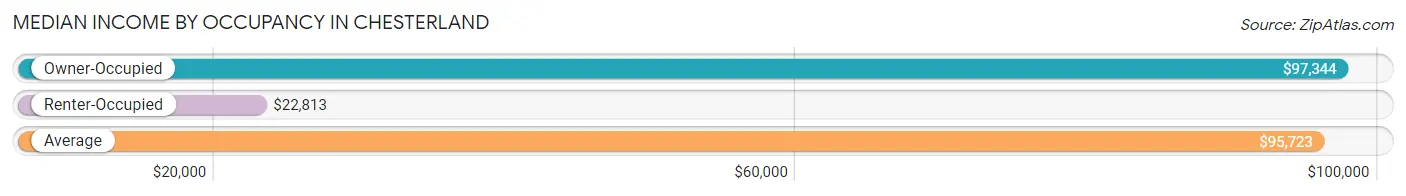
| Occupancy Type | # Households | Median Income |
| Owner-Occupied | 2,674 (90.0%) | $97,344 |
| Renter-Occupied | 298 (10.0%) | $22,813 |
| Average | 2,972 (100.0%) | $95,723 |
Occupancy by Householder Income Bracket in Chesterland
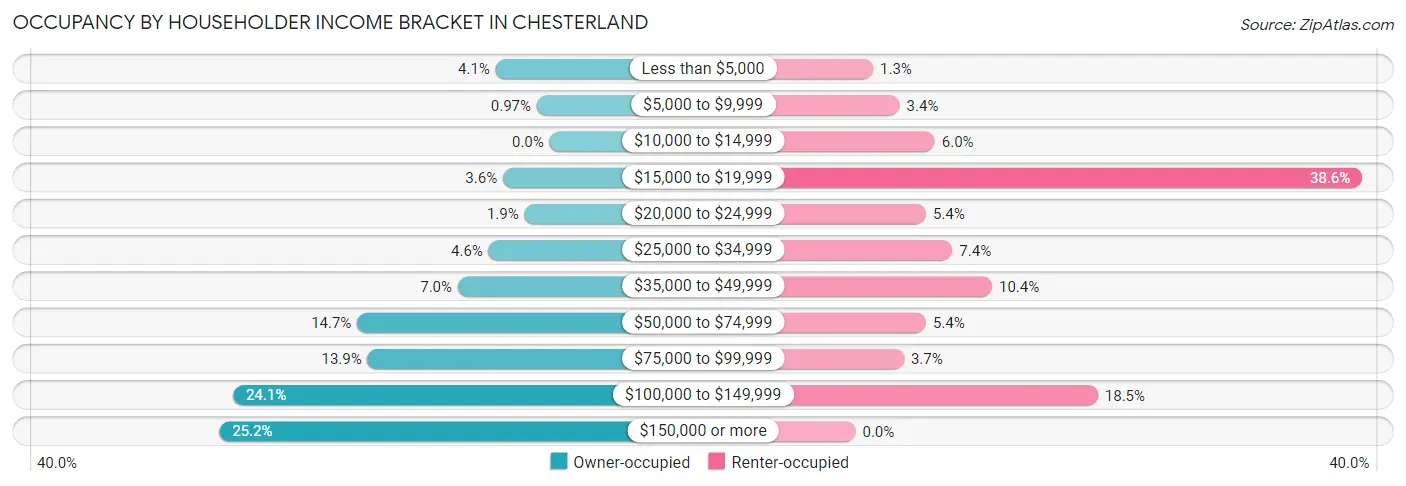
| Income Bracket | Owner-occupied | Renter-occupied |
| Less than $5,000 | 110 (4.1%) | 4 (1.3%) |
| $5,000 to $9,999 | 26 (1.0%) | 10 (3.4%) |
| $10,000 to $14,999 | 0 (0.0%) | 18 (6.0%) |
| $15,000 to $19,999 | 95 (3.5%) | 115 (38.6%) |
| $20,000 to $24,999 | 51 (1.9%) | 16 (5.4%) |
| $25,000 to $34,999 | 124 (4.6%) | 22 (7.4%) |
| $35,000 to $49,999 | 187 (7.0%) | 31 (10.4%) |
| $50,000 to $74,999 | 392 (14.7%) | 16 (5.4%) |
| $75,000 to $99,999 | 371 (13.9%) | 11 (3.7%) |
| $100,000 to $149,999 | 645 (24.1%) | 55 (18.5%) |
| $150,000 or more | 673 (25.2%) | 0 (0.0%) |
| Total | 2,674 (100.0%) | 298 (100.0%) |
Monthly Housing Cost Tiers in Chesterland
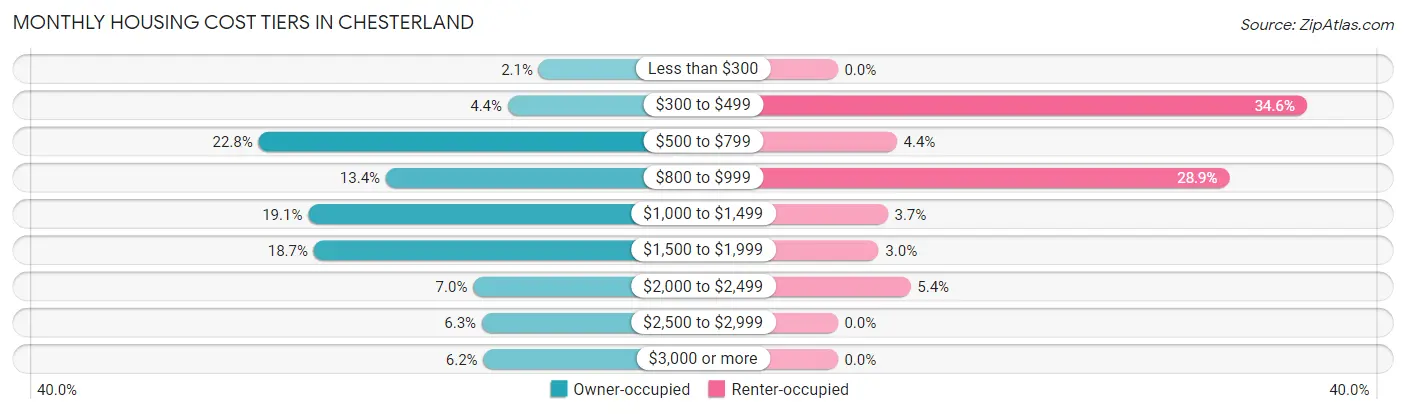
| Monthly Cost | Owner-occupied | Renter-occupied |
| Less than $300 | 57 (2.1%) | 0 (0.0%) |
| $300 to $499 | 118 (4.4%) | 103 (34.6%) |
| $500 to $799 | 609 (22.8%) | 13 (4.4%) |
| $800 to $999 | 358 (13.4%) | 86 (28.9%) |
| $1,000 to $1,499 | 511 (19.1%) | 11 (3.7%) |
| $1,500 to $1,999 | 500 (18.7%) | 9 (3.0%) |
| $2,000 to $2,499 | 186 (7.0%) | 16 (5.4%) |
| $2,500 to $2,999 | 169 (6.3%) | 0 (0.0%) |
| $3,000 or more | 166 (6.2%) | 0 (0.0%) |
| Total | 2,674 (100.0%) | 298 (100.0%) |
Physical Housing Characteristics in Chesterland
Housing Structures in Chesterland
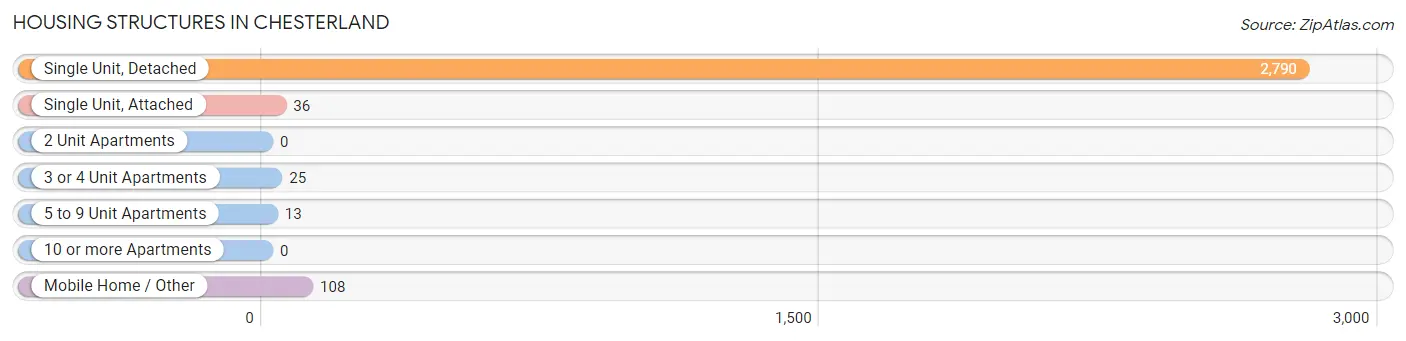
| Structure Type | # Housing Units | % Housing Units |
| Single Unit, Detached | 2,790 | 93.9% |
| Single Unit, Attached | 36 | 1.2% |
| 2 Unit Apartments | 0 | 0.0% |
| 3 or 4 Unit Apartments | 25 | 0.8% |
| 5 to 9 Unit Apartments | 13 | 0.4% |
| 10 or more Apartments | 0 | 0.0% |
| Mobile Home / Other | 108 | 3.6% |
| Total | 2,972 | 100.0% |
Housing Structures by Occupancy in Chesterland
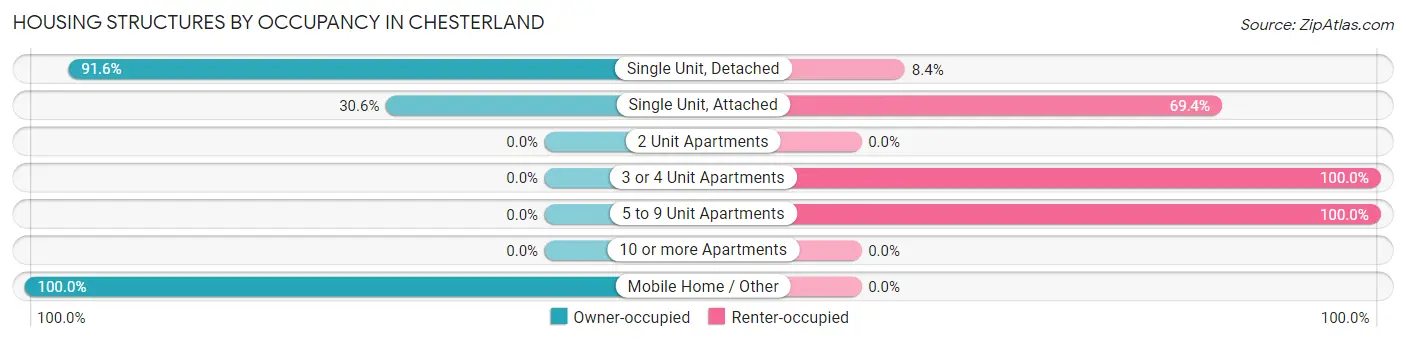
| Structure Type | Owner-occupied | Renter-occupied |
| Single Unit, Detached | 2,555 (91.6%) | 235 (8.4%) |
| Single Unit, Attached | 11 (30.6%) | 25 (69.4%) |
| 2 Unit Apartments | 0 (0.0%) | 0 (0.0%) |
| 3 or 4 Unit Apartments | 0 (0.0%) | 25 (100.0%) |
| 5 to 9 Unit Apartments | 0 (0.0%) | 13 (100.0%) |
| 10 or more Apartments | 0 (0.0%) | 0 (0.0%) |
| Mobile Home / Other | 108 (100.0%) | 0 (0.0%) |
| Total | 2,674 (90.0%) | 298 (10.0%) |
Housing Structures by Number of Rooms in Chesterland
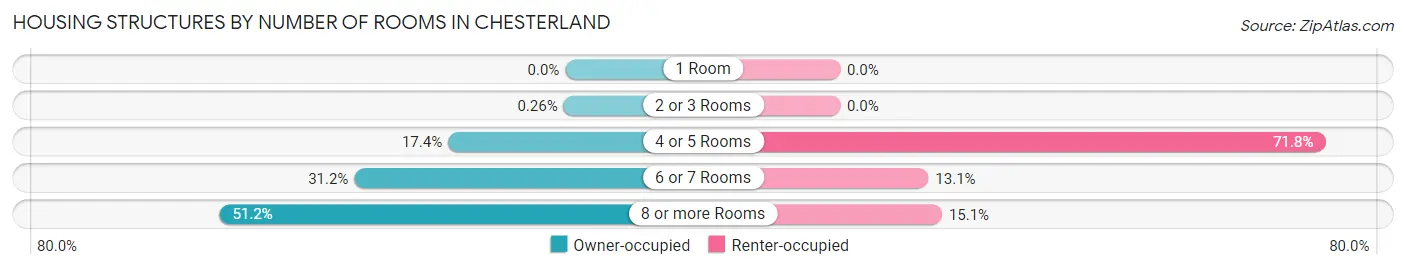
| Number of Rooms | Owner-occupied | Renter-occupied |
| 1 Room | 0 (0.0%) | 0 (0.0%) |
| 2 or 3 Rooms | 7 (0.3%) | 0 (0.0%) |
| 4 or 5 Rooms | 464 (17.3%) | 214 (71.8%) |
| 6 or 7 Rooms | 835 (31.2%) | 39 (13.1%) |
| 8 or more Rooms | 1,368 (51.2%) | 45 (15.1%) |
| Total | 2,674 (100.0%) | 298 (100.0%) |
Housing Structure by Heating Type in Chesterland
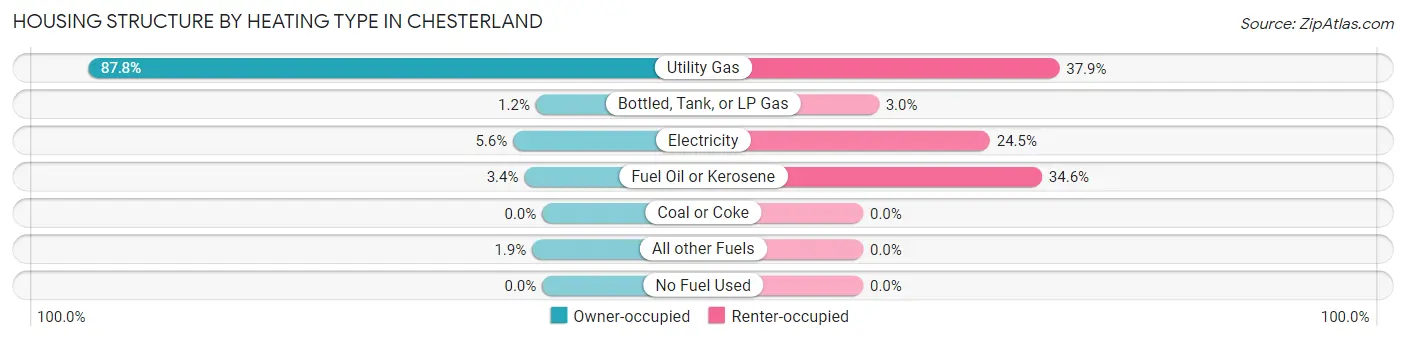
| Heating Type | Owner-occupied | Renter-occupied |
| Utility Gas | 2,347 (87.8%) | 113 (37.9%) |
| Bottled, Tank, or LP Gas | 33 (1.2%) | 9 (3.0%) |
| Electricity | 150 (5.6%) | 73 (24.5%) |
| Fuel Oil or Kerosene | 92 (3.4%) | 103 (34.6%) |
| Coal or Coke | 0 (0.0%) | 0 (0.0%) |
| All other Fuels | 52 (1.9%) | 0 (0.0%) |
| No Fuel Used | 0 (0.0%) | 0 (0.0%) |
| Total | 2,674 (100.0%) | 298 (100.0%) |
Household Vehicle Usage in Chesterland
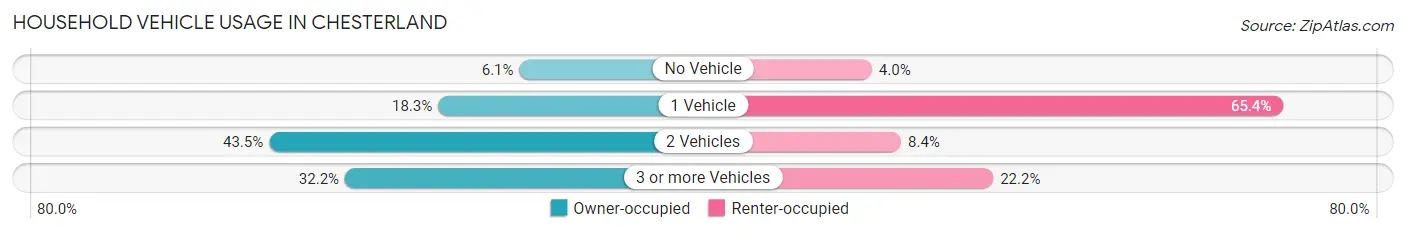
| Vehicles per Household | Owner-occupied | Renter-occupied |
| No Vehicle | 163 (6.1%) | 12 (4.0%) |
| 1 Vehicle | 488 (18.2%) | 195 (65.4%) |
| 2 Vehicles | 1,163 (43.5%) | 25 (8.4%) |
| 3 or more Vehicles | 860 (32.2%) | 66 (22.2%) |
| Total | 2,674 (100.0%) | 298 (100.0%) |
Real Estate & Mortgages in Chesterland
Real Estate and Mortgage Overview in Chesterland
| Characteristic | Without Mortgage | With Mortgage |
| Housing Units | 1,164 | 1,510 |
| Median Property Value | $246,000 | $286,300 |
| Median Household Income | $77,500 | $508 |
| Monthly Housing Costs | $728 | $166 |
| Real Estate Taxes | $4,171 | $22 |
Property Value by Mortgage Status in Chesterland
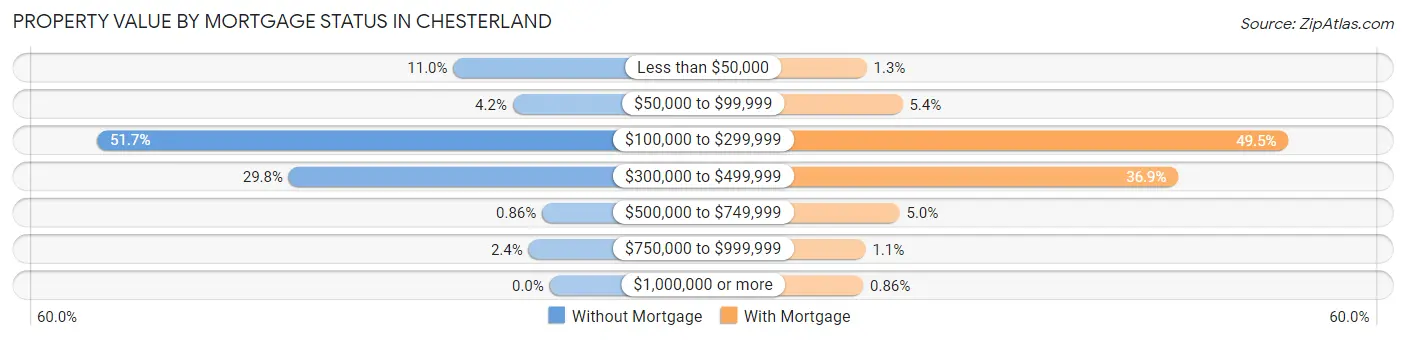
| Property Value | Without Mortgage | With Mortgage |
| Less than $50,000 | 128 (11.0%) | 19 (1.3%) |
| $50,000 to $99,999 | 49 (4.2%) | 81 (5.4%) |
| $100,000 to $299,999 | 602 (51.7%) | 747 (49.5%) |
| $300,000 to $499,999 | 347 (29.8%) | 557 (36.9%) |
| $500,000 to $749,999 | 10 (0.9%) | 76 (5.0%) |
| $750,000 to $999,999 | 28 (2.4%) | 17 (1.1%) |
| $1,000,000 or more | 0 (0.0%) | 13 (0.9%) |
| Total | 1,164 (100.0%) | 1,510 (100.0%) |
Household Income by Mortgage Status in Chesterland
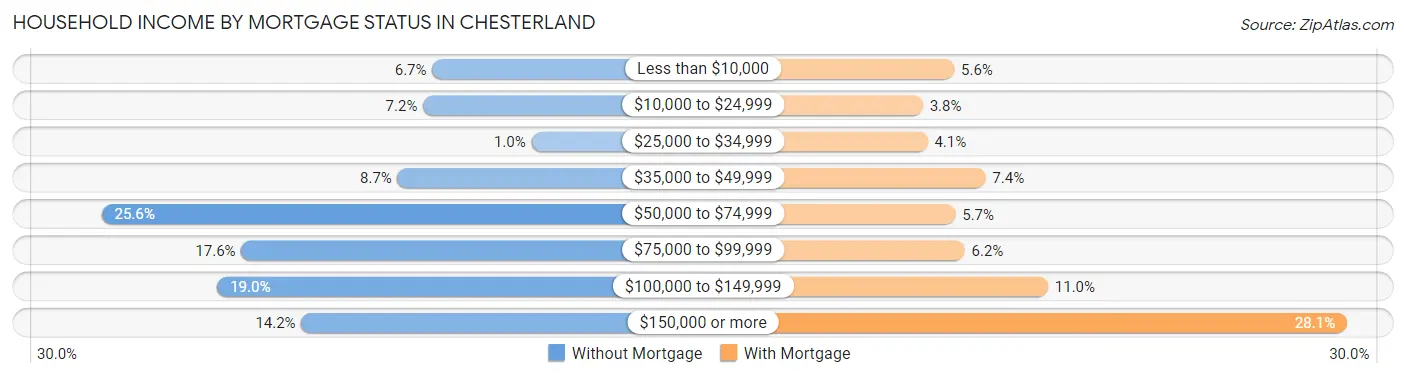
| Household Income | Without Mortgage | With Mortgage |
| Less than $10,000 | 78 (6.7%) | 85 (5.6%) |
| $10,000 to $24,999 | 84 (7.2%) | 58 (3.8%) |
| $25,000 to $34,999 | 12 (1.0%) | 62 (4.1%) |
| $35,000 to $49,999 | 101 (8.7%) | 112 (7.4%) |
| $50,000 to $74,999 | 298 (25.6%) | 86 (5.7%) |
| $75,000 to $99,999 | 205 (17.6%) | 94 (6.2%) |
| $100,000 to $149,999 | 221 (19.0%) | 166 (11.0%) |
| $150,000 or more | 165 (14.2%) | 424 (28.1%) |
| Total | 1,164 (100.0%) | 1,510 (100.0%) |
Property Value to Household Income Ratio in Chesterland
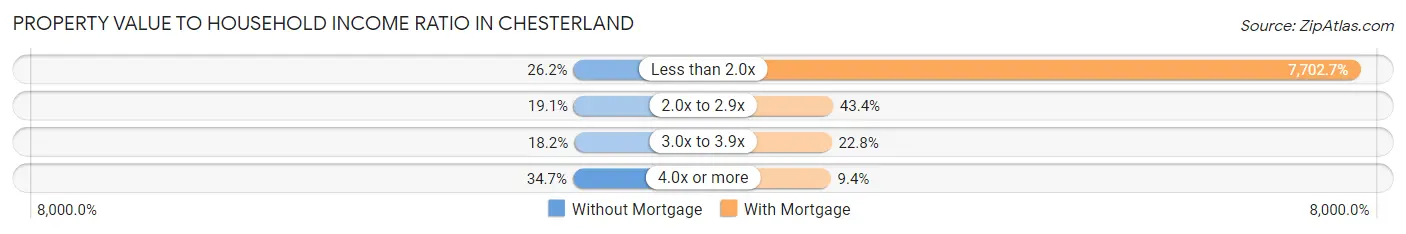
| Value-to-Income Ratio | Without Mortgage | With Mortgage |
| Less than 2.0x | 305 (26.2%) | 116,310 (7,702.6%) |
| 2.0x to 2.9x | 222 (19.1%) | 656 (43.4%) |
| 3.0x to 3.9x | 212 (18.2%) | 344 (22.8%) |
| 4.0x or more | 404 (34.7%) | 142 (9.4%) |
| Total | 1,164 (100.0%) | 1,510 (100.0%) |
Real Estate Taxes by Mortgage Status in Chesterland
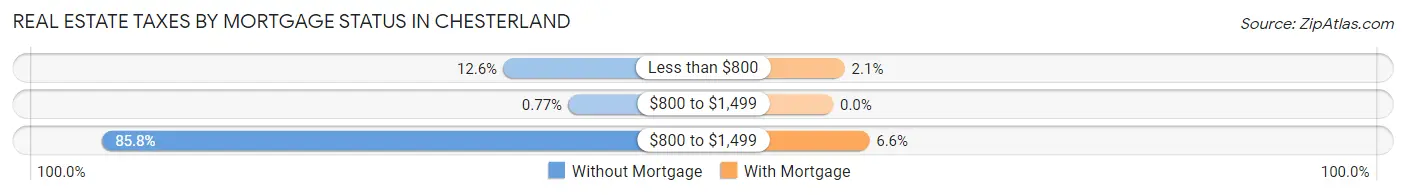
| Property Taxes | Without Mortgage | With Mortgage |
| Less than $800 | 147 (12.6%) | 32 (2.1%) |
| $800 to $1,499 | 9 (0.8%) | 0 (0.0%) |
| $800 to $1,499 | 999 (85.8%) | 100 (6.6%) |
| Total | 1,164 (100.0%) | 1,510 (100.0%) |
Health & Disability in Chesterland
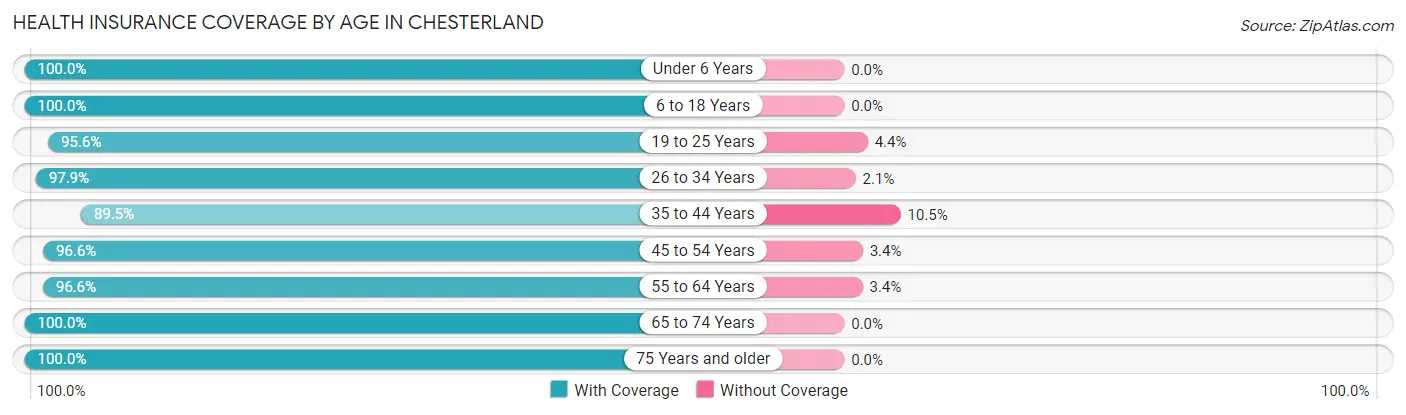
Health Insurance Coverage by Age in Chesterland
| Age Bracket | With Coverage | Without Coverage |
| Under 6 Years | 287 (100.0%) | 0 (0.0%) |
| 6 to 18 Years | 977 (100.0%) | 0 (0.0%) |
| 19 to 25 Years | 481 (95.6%) | 22 (4.4%) |
| 26 to 34 Years | 603 (97.9%) | 13 (2.1%) |
| 35 to 44 Years | 452 (89.5%) | 53 (10.5%) |
| 45 to 54 Years | 986 (96.6%) | 35 (3.4%) |
| 55 to 64 Years | 1,193 (96.6%) | 42 (3.4%) |
| 65 to 74 Years | 1,069 (100.0%) | 0 (0.0%) |
| 75 Years and older | 1,104 (100.0%) | 0 (0.0%) |
| Total | 7,152 (97.7%) | 165 (2.3%) |
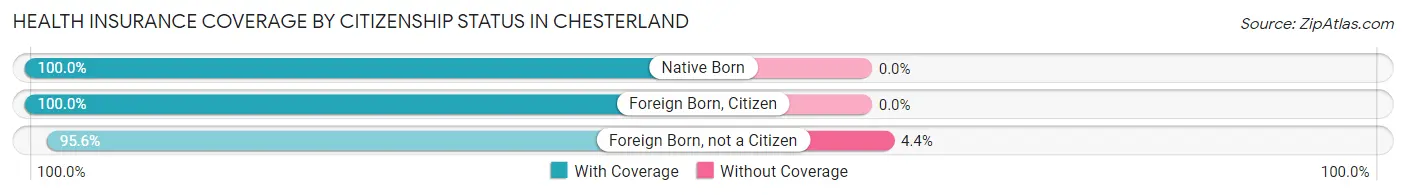
Health Insurance Coverage by Citizenship Status in Chesterland
| Citizenship Status | With Coverage | Without Coverage |
| Native Born | 287 (100.0%) | 0 (0.0%) |
| Foreign Born, Citizen | 977 (100.0%) | 0 (0.0%) |
| Foreign Born, not a Citizen | 481 (95.6%) | 22 (4.4%) |
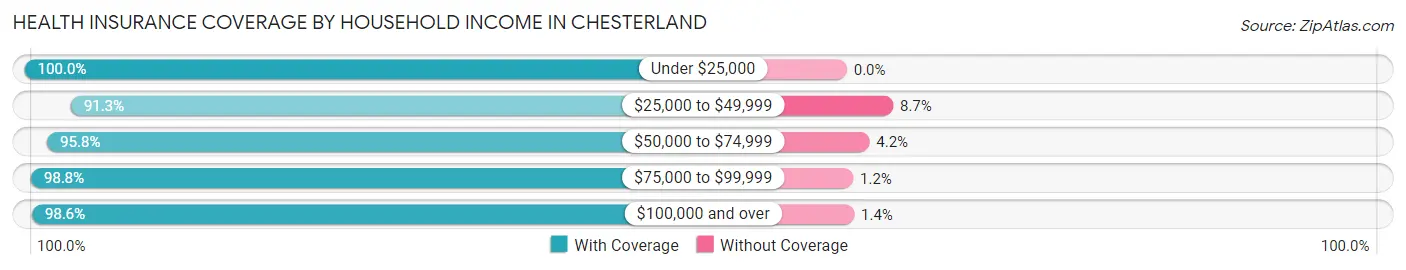
Health Insurance Coverage by Household Income in Chesterland
| Household Income | With Coverage | Without Coverage |
| Under $25,000 | 639 (100.0%) | 0 (0.0%) |
| $25,000 to $49,999 | 654 (91.3%) | 62 (8.7%) |
| $50,000 to $74,999 | 793 (95.8%) | 35 (4.2%) |
| $75,000 to $99,999 | 838 (98.8%) | 10 (1.2%) |
| $100,000 and over | 4,184 (98.6%) | 58 (1.4%) |
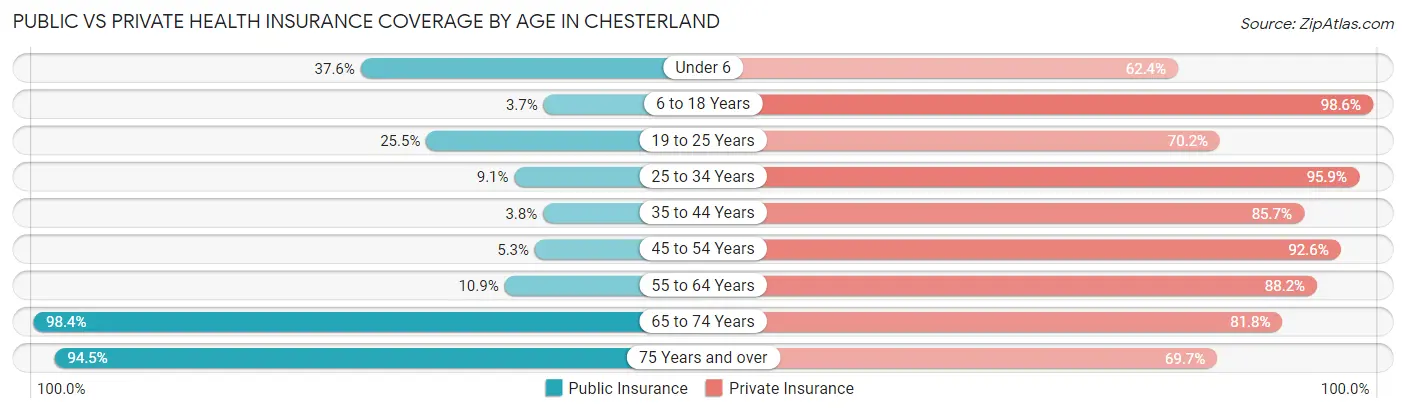
Public vs Private Health Insurance Coverage by Age in Chesterland
| Age Bracket | Public Insurance | Private Insurance |
| Under 6 | 108 (37.6%) | 179 (62.4%) |
| 6 to 18 Years | 36 (3.7%) | 963 (98.6%) |
| 19 to 25 Years | 128 (25.5%) | 353 (70.2%) |
| 25 to 34 Years | 56 (9.1%) | 591 (95.9%) |
| 35 to 44 Years | 19 (3.8%) | 433 (85.7%) |
| 45 to 54 Years | 54 (5.3%) | 945 (92.6%) |
| 55 to 64 Years | 135 (10.9%) | 1,089 (88.2%) |
| 65 to 74 Years | 1,052 (98.4%) | 874 (81.8%) |
| 75 Years and over | 1,043 (94.5%) | 769 (69.7%) |
| Total | 2,631 (36.0%) | 6,196 (84.7%) |
Disability Status by Sex by Age in Chesterland
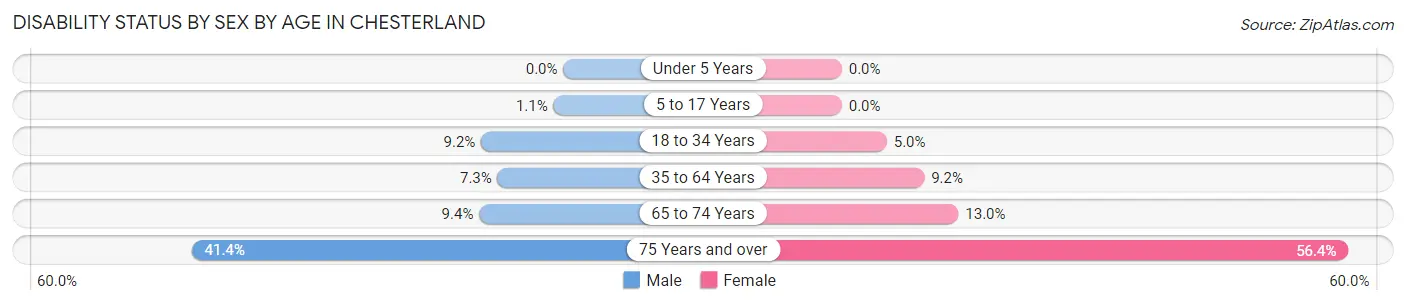
| Age Bracket | Male | Female |
| Under 5 Years | 0 (0.0%) | 0 (0.0%) |
| 5 to 17 Years | 6 (1.1%) | 0 (0.0%) |
| 18 to 34 Years | 58 (9.1%) | 29 (5.0%) |
| 35 to 64 Years | 112 (7.3%) | 113 (9.2%) |
| 65 to 74 Years | 59 (9.4%) | 57 (13.0%) |
| 75 Years and over | 195 (41.4%) | 357 (56.4%) |
Disability Class by Sex by Age in Chesterland
Disability Class: Hearing Difficulty
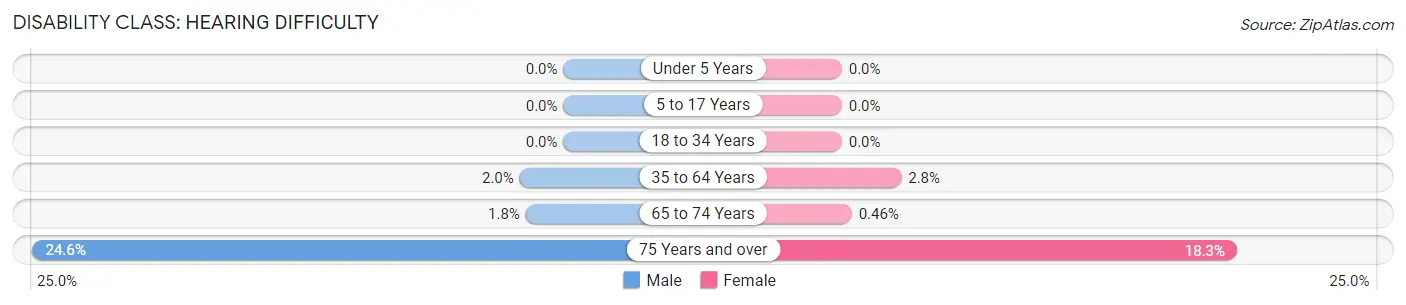
| Age Bracket | Male | Female |
| Under 5 Years | 0 (0.0%) | 0 (0.0%) |
| 5 to 17 Years | 0 (0.0%) | 0 (0.0%) |
| 18 to 34 Years | 0 (0.0%) | 0 (0.0%) |
| 35 to 64 Years | 31 (2.0%) | 34 (2.8%) |
| 65 to 74 Years | 11 (1.8%) | 2 (0.5%) |
| 75 Years and over | 116 (24.6%) | 116 (18.3%) |
Disability Class: Vision Difficulty
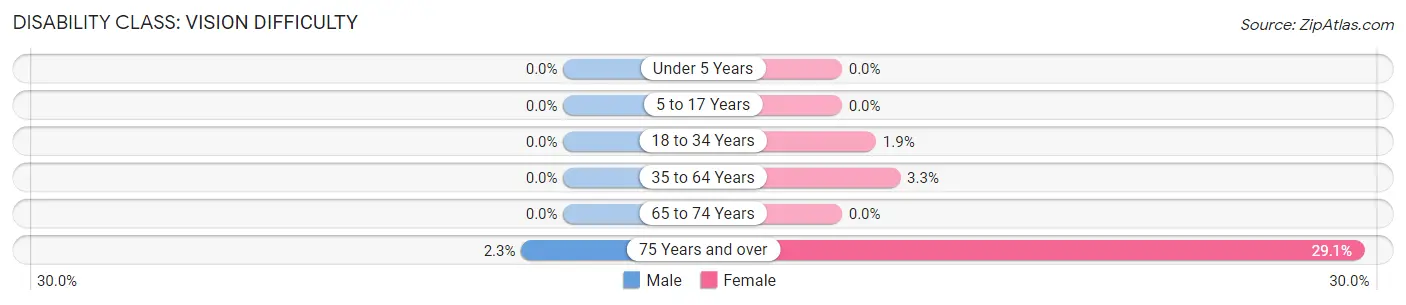
| Age Bracket | Male | Female |
| Under 5 Years | 0 (0.0%) | 0 (0.0%) |
| 5 to 17 Years | 0 (0.0%) | 0 (0.0%) |
| 18 to 34 Years | 0 (0.0%) | 11 (1.9%) |
| 35 to 64 Years | 0 (0.0%) | 40 (3.3%) |
| 65 to 74 Years | 0 (0.0%) | 0 (0.0%) |
| 75 Years and over | 11 (2.3%) | 184 (29.1%) |
Disability Class: Cognitive Difficulty
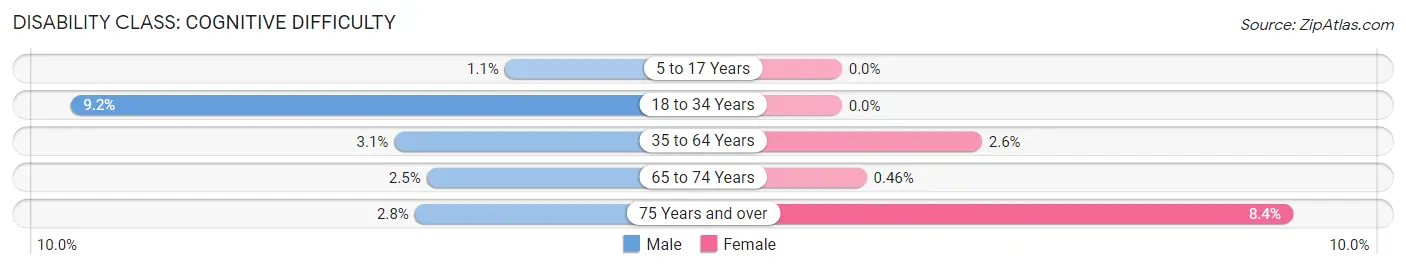
| Age Bracket | Male | Female |
| 5 to 17 Years | 6 (1.1%) | 0 (0.0%) |
| 18 to 34 Years | 58 (9.1%) | 0 (0.0%) |
| 35 to 64 Years | 48 (3.1%) | 32 (2.6%) |
| 65 to 74 Years | 16 (2.5%) | 2 (0.5%) |
| 75 Years and over | 13 (2.8%) | 53 (8.4%) |
Disability Class: Ambulatory Difficulty
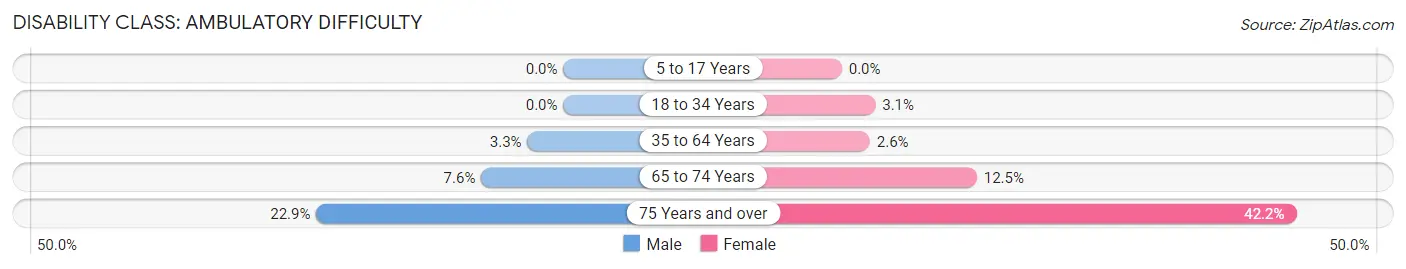
| Age Bracket | Male | Female |
| 5 to 17 Years | 0 (0.0%) | 0 (0.0%) |
| 18 to 34 Years | 0 (0.0%) | 18 (3.1%) |
| 35 to 64 Years | 51 (3.3%) | 32 (2.6%) |
| 65 to 74 Years | 48 (7.6%) | 55 (12.5%) |
| 75 Years and over | 108 (22.9%) | 267 (42.2%) |
Disability Class: Self-Care Difficulty
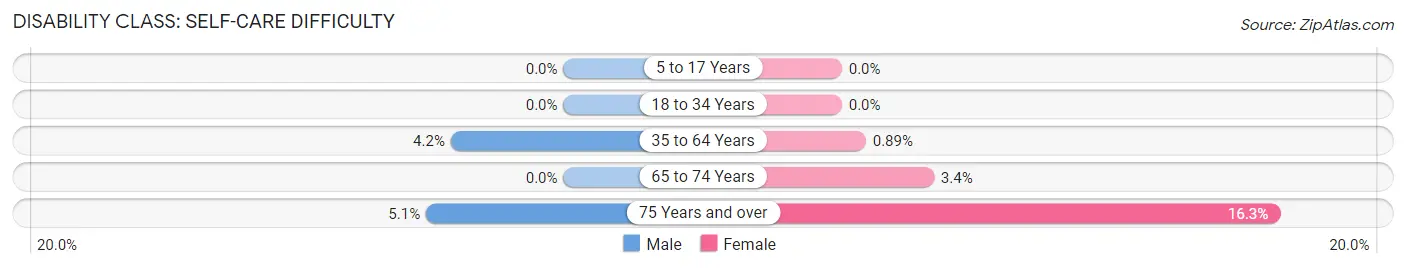
| Age Bracket | Male | Female |
| 5 to 17 Years | 0 (0.0%) | 0 (0.0%) |
| 18 to 34 Years | 0 (0.0%) | 0 (0.0%) |
| 35 to 64 Years | 64 (4.2%) | 11 (0.9%) |
| 65 to 74 Years | 0 (0.0%) | 15 (3.4%) |
| 75 Years and over | 24 (5.1%) | 103 (16.3%) |
Technology Access in Chesterland
Computing Device Access in Chesterland
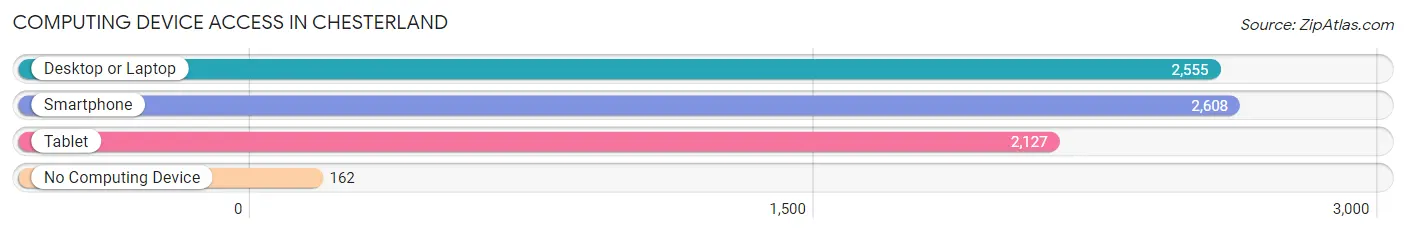
| Device Type | # Households | % Households |
| Desktop or Laptop | 2,555 | 86.0% |
| Smartphone | 2,608 | 87.7% |
| Tablet | 2,127 | 71.6% |
| No Computing Device | 162 | 5.4% |
| Total | 2,972 | 100.0% |
Internet Access in Chesterland
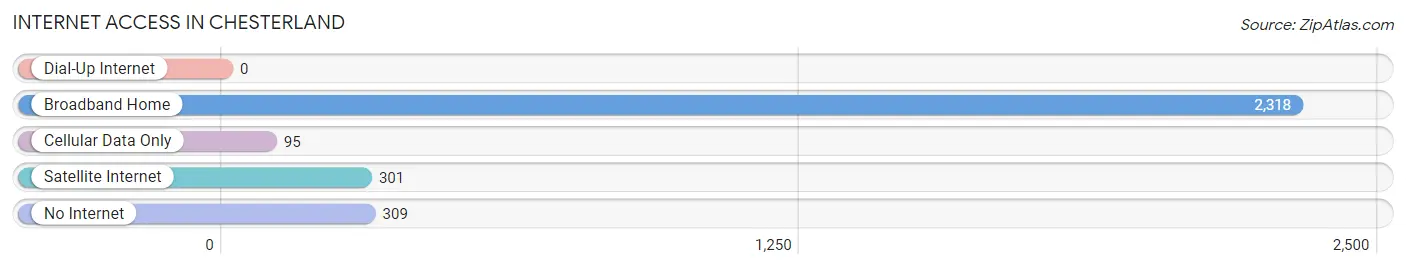
| Internet Type | # Households | % Households |
| Dial-Up Internet | 0 | 0.0% |
| Broadband Home | 2,318 | 78.0% |
| Cellular Data Only | 95 | 3.2% |
| Satellite Internet | 301 | 10.1% |
| No Internet | 309 | 10.4% |
| Total | 2,972 | 100.0% |
Chesterland Summary
Chesterland, Ohio is a small village located in Geauga County, Ohio. It is situated about 30 miles east of Cleveland and is part of the Greater Cleveland Metropolitan Area. The village has a population of approximately 4,000 people and is known for its rural charm and small-town atmosphere.
History
Chesterland was founded in 1818 by a group of settlers from Connecticut. The village was named after Chester, Connecticut, the hometown of the settlers. The settlers were attracted to the area due to its fertile soil and abundant natural resources. The village quickly grew and by the mid-1800s, it had become a thriving agricultural community.
In the late 1800s, the village began to experience a period of growth and development. The railroad arrived in Chesterland in 1871, connecting the village to the larger cities of Cleveland and Akron. This allowed for the transportation of goods and services, which helped to spur economic growth.
In the early 1900s, Chesterland began to experience a period of industrialization. Several factories were built in the village, including a paper mill, a brickyard, and a furniture factory. These factories provided employment opportunities for the residents of Chesterland and helped to further spur economic growth.
Geography
Chesterland is located in Geauga County, Ohio. It is situated about 30 miles east of Cleveland and is part of the Greater Cleveland Metropolitan Area. The village is situated on the western edge of the Allegheny Plateau, which is a region of rolling hills and valleys. The village is surrounded by several small lakes and ponds, which provide a picturesque backdrop.
The village is located in a humid continental climate zone, which is characterized by hot summers and cold winters. The average temperature in the summer is around 75 degrees Fahrenheit, while the average temperature in the winter is around 25 degrees Fahrenheit.
Economy
Chesterland’s economy is largely based on agriculture and manufacturing. The village is home to several farms, which produce a variety of crops, including corn, soybeans, and wheat. The village also has several factories, which produce a variety of products, including furniture, paper, and bricks.
The village also has several small businesses, including restaurants, retail stores, and service providers. These businesses provide employment opportunities for the residents of Chesterland and help to support the local economy.
Demographics
As of the 2010 census, the population of Chesterland was 4,000. The village is predominantly white, with approximately 95% of the population identifying as Caucasian. The remaining 5% of the population is made up of African Americans, Asians, and Hispanics.
The median household income in Chesterland is $50,000, which is slightly lower than the national average. The median home value in the village is $150,000, which is slightly higher than the national average.
Conclusion
Chesterland, Ohio is a small village located in Geauga County, Ohio. It is situated about 30 miles east of Cleveland and is part of the Greater Cleveland Metropolitan Area. The village has a population of approximately 4,000 people and is known for its rural charm and small-town atmosphere. The village’s economy is largely based on agriculture and manufacturing, and it has several small businesses that provide employment opportunities for the residents of Chesterland. The village is predominantly white, with approximately 95% of the population identifying as Caucasian. The median household income in Chesterland is $50,000, which is slightly lower than the national average.
Common Questions
What is Per Capita Income in Chesterland?
Per Capita income in Chesterland is $44,066.
What is the Median Family Income in Chesterland?
Median Family Income in Chesterland is $102,783.
What is the Median Household income in Chesterland?
Median Household Income in Chesterland is $95,723.
What is Income or Wage Gap in Chesterland?
Income or Wage Gap in Chesterland is 17.1%.
Women in Chesterland earn 82.9 cents for every dollar earned by a man.
What is Inequality or Gini Index in Chesterland?
Inequality or Gini Index in Chesterland is 0.45.
What is the Total Population of Chesterland?
Total Population of Chesterland is 7,317.
What is the Total Male Population of Chesterland?
Total Male Population of Chesterland is 3,931.
What is the Total Female Population of Chesterland?
Total Female Population of Chesterland is 3,386.
What is the Ratio of Males per 100 Females in Chesterland?
There are 116.10 Males per 100 Females in Chesterland.
What is the Ratio of Females per 100 Males in Chesterland?
There are 86.14 Females per 100 Males in Chesterland.
What is the Median Population Age in Chesterland?
Median Population Age in Chesterland is 53.0 Years.
What is the Average Family Size in Chesterland
Average Family Size in Chesterland is 2.8 People.
What is the Average Household Size in Chesterland
Average Household Size in Chesterland is 2.5 People.
How Large is the Labor Force in Chesterland?
There are 3,789 People in the Labor Forcein in Chesterland.
What is the Percentage of People in the Labor Force in Chesterland?
60.2% of People are in the Labor Force in Chesterland.
What is the Unemployment Rate in Chesterland?
Unemployment Rate in Chesterland is 5.6%.