Brooklyn Heights, OH Map & Demographics
Brooklyn Heights Map
Brooklyn Heights Overview
$41,463
PER CAPITA INCOME
$103,274
AVG FAMILY INCOME
$96,458
AVG HOUSEHOLD INCOME
31.2%
WAGE / INCOME GAP [ % ]
68.8¢/ $1
WAGE / INCOME GAP [ $ ]
0.33
INEQUALITY / GINI INDEX
1,500
TOTAL POPULATION
731
MALE POPULATION
769
FEMALE POPULATION
95.06
MALES / 100 FEMALES
105.20
FEMALES / 100 MALES
43.9
MEDIAN AGE
3.0
AVG FAMILY SIZE
2.6
AVG HOUSEHOLD SIZE
763
LABOR FORCE [ PEOPLE ]
65.7%
PERCENT IN LABOR FORCE
1.4%
UNEMPLOYMENT RATE
Income in Brooklyn Heights
Income Overview in Brooklyn Heights
Per Capita Income in Brooklyn Heights is $41,463, while median incomes of families and households are $103,274 and $96,458 respectively.
| Characteristic | Number | Measure |
| Per Capita Income | 1,500 | $41,463 |
| Median Family Income | 421 | $103,274 |
| Mean Family Income | 421 | $112,626 |
| Median Household Income | 575 | $96,458 |
| Mean Household Income | 575 | $105,969 |
| Income Deficit | 421 | $0 |
| Wage / Income Gap (%) | 1,500 | 31.18% |
| Wage / Income Gap ($) | 1,500 | 68.82¢ per $1 |
| Gini / Inequality Index | 1,500 | 0.33 |
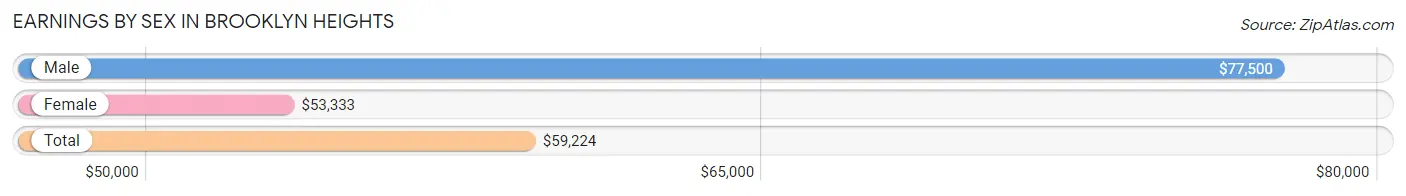
Earnings by Sex in Brooklyn Heights
Average Earnings in Brooklyn Heights are $59,224, $77,500 for men and $53,333 for women, a difference of 31.2%.
| Sex | Number | Average Earnings |
| Male | 398 (49.5%) | $77,500 |
| Female | 406 (50.5%) | $53,333 |
| Total | 804 (100.0%) | $59,224 |
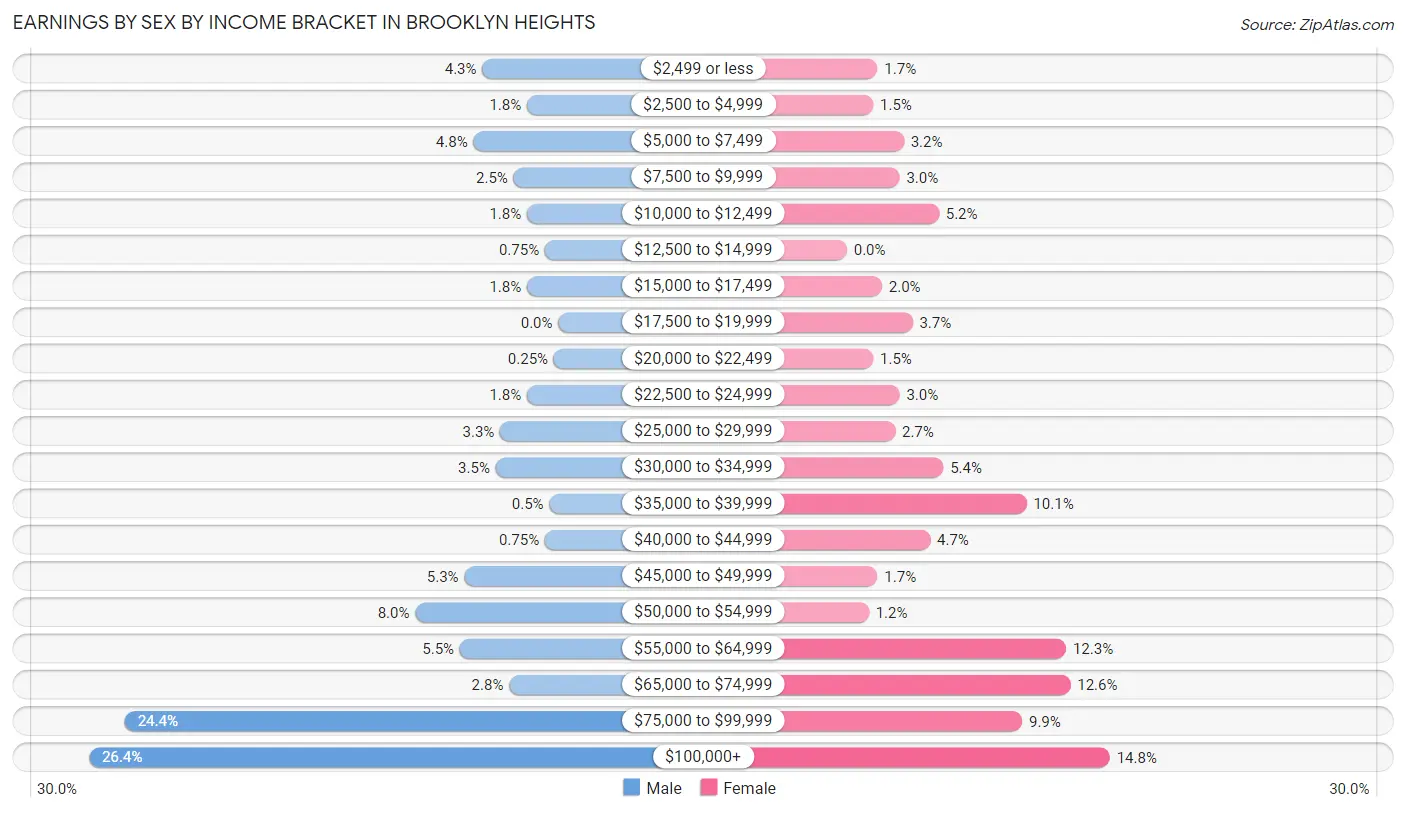
Earnings by Sex by Income Bracket in Brooklyn Heights
The most common earnings brackets in Brooklyn Heights are $100,000+ for men (105 | 26.4%) and $100,000+ for women (60 | 14.8%).
| Income | Male | Female |
| $2,499 or less | 17 (4.3%) | 7 (1.7%) |
| $2,500 to $4,999 | 7 (1.8%) | 6 (1.5%) |
| $5,000 to $7,499 | 19 (4.8%) | 13 (3.2%) |
| $7,500 to $9,999 | 10 (2.5%) | 12 (3.0%) |
| $10,000 to $12,499 | 7 (1.8%) | 21 (5.2%) |
| $12,500 to $14,999 | 3 (0.7%) | 0 (0.0%) |
| $15,000 to $17,499 | 7 (1.8%) | 8 (2.0%) |
| $17,500 to $19,999 | 0 (0.0%) | 15 (3.7%) |
| $20,000 to $22,499 | 1 (0.3%) | 6 (1.5%) |
| $22,500 to $24,999 | 7 (1.8%) | 12 (3.0%) |
| $25,000 to $29,999 | 13 (3.3%) | 11 (2.7%) |
| $30,000 to $34,999 | 14 (3.5%) | 22 (5.4%) |
| $35,000 to $39,999 | 2 (0.5%) | 41 (10.1%) |
| $40,000 to $44,999 | 3 (0.7%) | 19 (4.7%) |
| $45,000 to $49,999 | 21 (5.3%) | 7 (1.7%) |
| $50,000 to $54,999 | 32 (8.0%) | 5 (1.2%) |
| $55,000 to $64,999 | 22 (5.5%) | 50 (12.3%) |
| $65,000 to $74,999 | 11 (2.8%) | 51 (12.6%) |
| $75,000 to $99,999 | 97 (24.4%) | 40 (9.9%) |
| $100,000+ | 105 (26.4%) | 60 (14.8%) |
| Total | 398 (100.0%) | 406 (100.0%) |
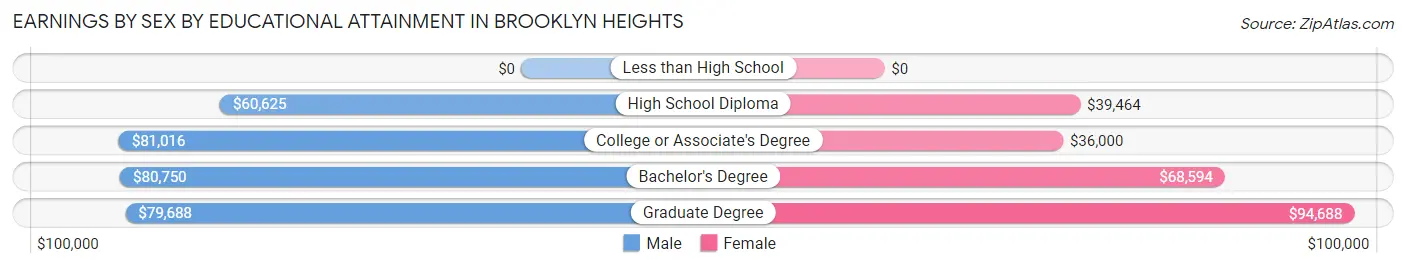
Earnings by Sex by Educational Attainment in Brooklyn Heights
Average earnings in Brooklyn Heights are $79,097 for men and $57,546 for women, a difference of 27.3%. Men with an educational attainment of college or associate's degree enjoy the highest average annual earnings of $81,016, while those with high school diploma education earn the least with $60,625. Women with an educational attainment of graduate degree earn the most with the average annual earnings of $94,688, while those with college or associate's degree education have the smallest earnings of $36,000.
| Educational Attainment | Male Income | Female Income |
| Less than High School | - | - |
| High School Diploma | $60,625 | $39,464 |
| College or Associate's Degree | $81,016 | $36,000 |
| Bachelor's Degree | $80,750 | $68,594 |
| Graduate Degree | $79,688 | $94,688 |
| Total | $79,097 | $57,546 |
Family Income in Brooklyn Heights
Family Income Brackets in Brooklyn Heights
According to the Brooklyn Heights family income data, there are 132 families falling into the $100,000 to $149,999 income range, which is the most common income bracket and makes up 31.4% of all families.
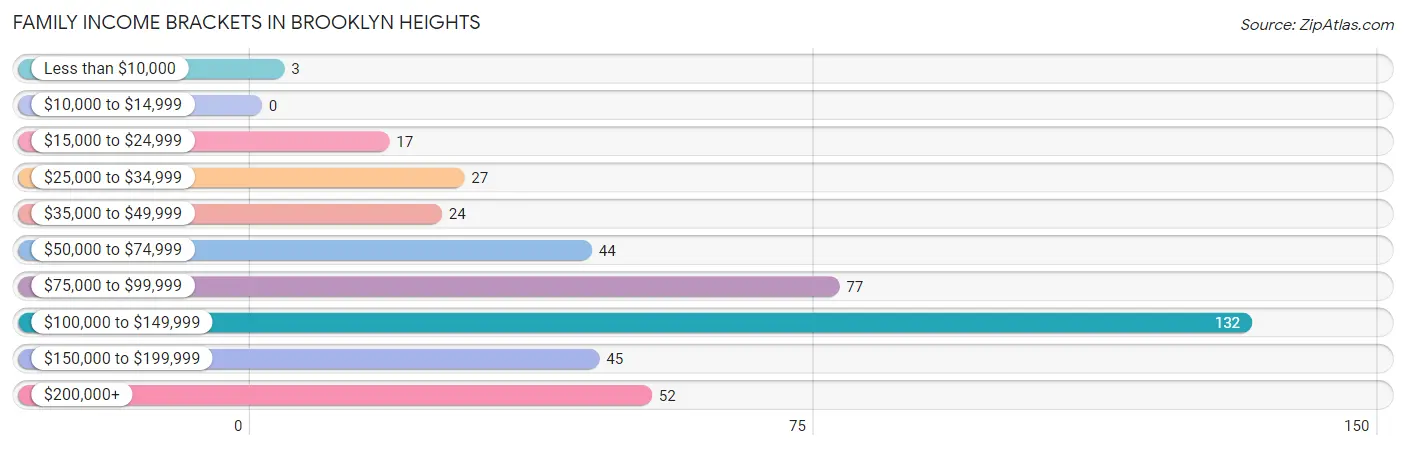
| Income Bracket | # Families | % Families |
| Less than $10,000 | 3 | 0.7% |
| $10,000 to $14,999 | 0 | 0.0% |
| $15,000 to $24,999 | 17 | 4.0% |
| $25,000 to $34,999 | 27 | 6.4% |
| $35,000 to $49,999 | 24 | 5.7% |
| $50,000 to $74,999 | 44 | 10.5% |
| $75,000 to $99,999 | 77 | 18.3% |
| $100,000 to $149,999 | 132 | 31.4% |
| $150,000 to $199,999 | 45 | 10.7% |
| $200,000+ | 52 | 12.4% |
Family Income by Famaliy Size in Brooklyn Heights
4-person families (53 | 12.6%) account for the highest median family income in Brooklyn Heights with $163,750 per family, while 3-person families (97 | 23.0%) have the highest median income of $41,435 per family member.
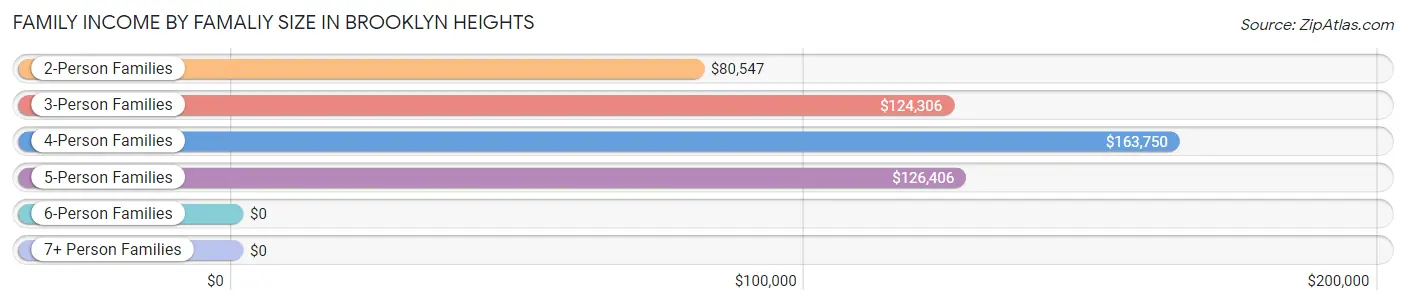
| Income Bracket | # Families | Median Income |
| 2-Person Families | 207 (49.2%) | $80,547 |
| 3-Person Families | 97 (23.0%) | $124,306 |
| 4-Person Families | 53 (12.6%) | $163,750 |
| 5-Person Families | 61 (14.5%) | $126,406 |
| 6-Person Families | 0 (0.0%) | $0 |
| 7+ Person Families | 3 (0.7%) | $0 |
| Total | 421 (100.0%) | $103,274 |
Family Income by Number of Earners in Brooklyn Heights
The median family income in Brooklyn Heights is $103,274, with families comprising 2 earners (157) having the highest median family income of $139,013, while families with no earners (70) have the lowest median family income of $40,938, accounting for 37.3% and 16.6% of families, respectively.
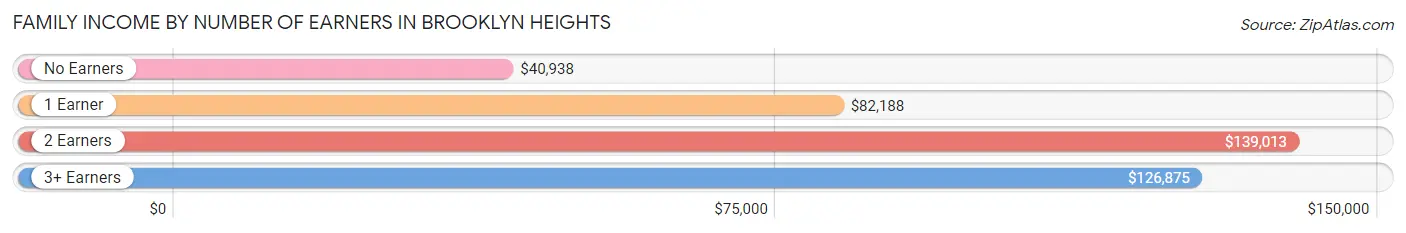
| Number of Earners | # Families | Median Income |
| No Earners | 70 (16.6%) | $40,938 |
| 1 Earner | 136 (32.3%) | $82,188 |
| 2 Earners | 157 (37.3%) | $139,013 |
| 3+ Earners | 58 (13.8%) | $126,875 |
| Total | 421 (100.0%) | $103,274 |
Household Income in Brooklyn Heights
Household Income Brackets in Brooklyn Heights
With 159 households falling in the category, the $100,000 to $149,999 income range is the most frequent in Brooklyn Heights, accounting for 27.7% of all households. In contrast, only 1 households (0.2%) fall into the $10,000 to $14,999 income bracket, making it the least populous group.
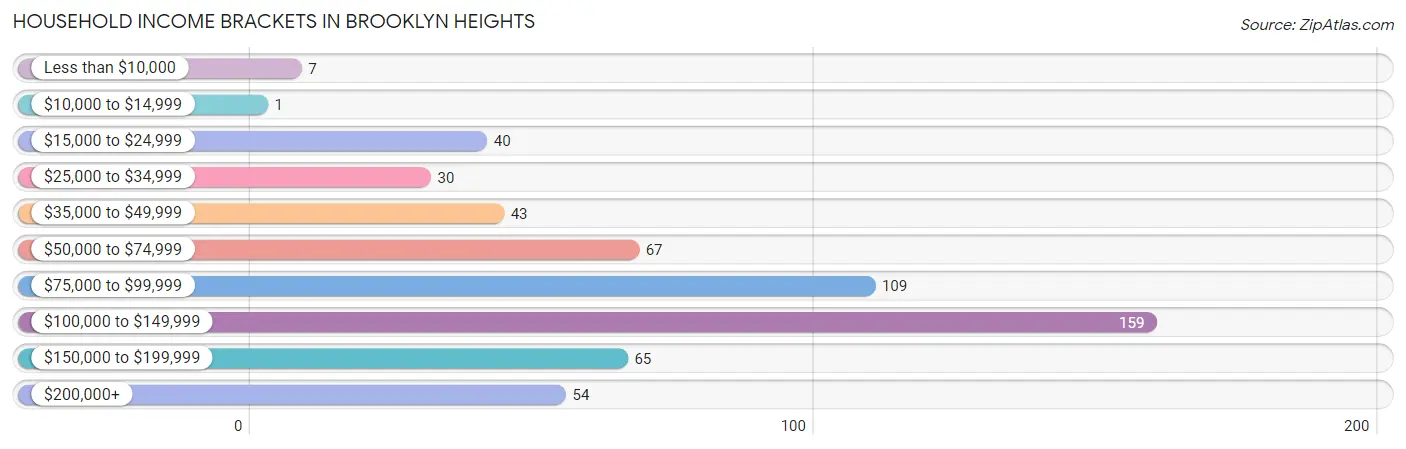
| Income Bracket | # Households | % Households |
| Less than $10,000 | 7 | 1.2% |
| $10,000 to $14,999 | 1 | 0.2% |
| $15,000 to $24,999 | 40 | 7.0% |
| $25,000 to $34,999 | 30 | 5.2% |
| $35,000 to $49,999 | 43 | 7.5% |
| $50,000 to $74,999 | 67 | 11.7% |
| $75,000 to $99,999 | 109 | 19.0% |
| $100,000 to $149,999 | 159 | 27.7% |
| $150,000 to $199,999 | 65 | 11.3% |
| $200,000+ | 54 | 9.4% |
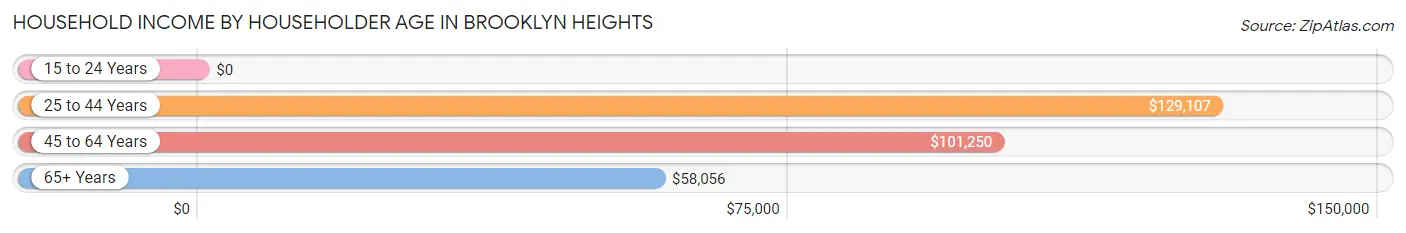
Household Income by Householder Age in Brooklyn Heights
The median household income in Brooklyn Heights is $96,458, with the highest median household income of $129,107 found in the 25 to 44 years age bracket for the primary householder. A total of 149 households (25.9%) fall into this category.
| Income Bracket | # Households | Median Income |
| 15 to 24 Years | 0 (0.0%) | $0 |
| 25 to 44 Years | 149 (25.9%) | $129,107 |
| 45 to 64 Years | 256 (44.5%) | $101,250 |
| 65+ Years | 170 (29.6%) | $58,056 |
| Total | 575 (100.0%) | $96,458 |
Poverty in Brooklyn Heights
Income Below Poverty by Sex and Age in Brooklyn Heights
With 4.8% poverty level for males and 5.1% for females among the residents of Brooklyn Heights, 16 and 17 year old males and 25 to 34 year old females are the most vulnerable to poverty, with 9 males (31.0%) and 13 females (16.9%) in their respective age groups living below the poverty level.
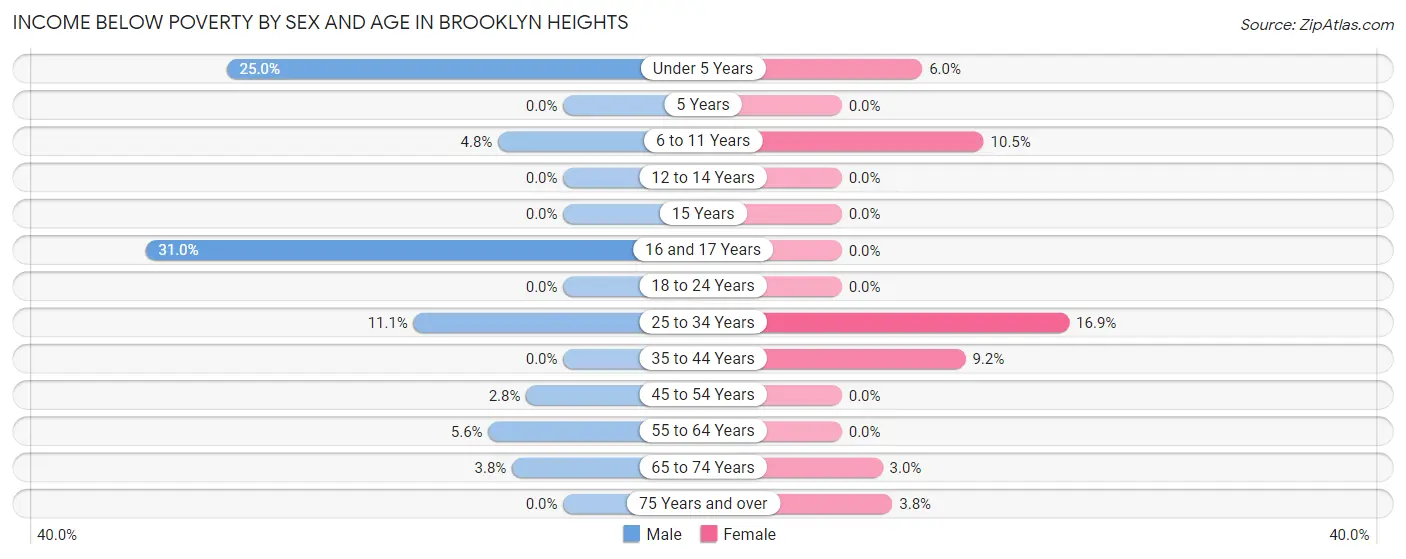
| Age Bracket | Male | Female |
| Under 5 Years | 4 (25.0%) | 4 (6.0%) |
| 5 Years | 0 (0.0%) | 0 (0.0%) |
| 6 to 11 Years | 3 (4.8%) | 8 (10.5%) |
| 12 to 14 Years | 0 (0.0%) | 0 (0.0%) |
| 15 Years | 0 (0.0%) | 0 (0.0%) |
| 16 and 17 Years | 9 (31.0%) | 0 (0.0%) |
| 18 to 24 Years | 0 (0.0%) | 0 (0.0%) |
| 25 to 34 Years | 8 (11.1%) | 13 (16.9%) |
| 35 to 44 Years | 0 (0.0%) | 9 (9.2%) |
| 45 to 54 Years | 3 (2.8%) | 0 (0.0%) |
| 55 to 64 Years | 5 (5.6%) | 0 (0.0%) |
| 65 to 74 Years | 3 (3.8%) | 2 (3.0%) |
| 75 Years and over | 0 (0.0%) | 3 (3.7%) |
| Total | 35 (4.8%) | 39 (5.1%) |
Income Above Poverty by Sex and Age in Brooklyn Heights
According to the poverty statistics in Brooklyn Heights, males aged 5 years and females aged 5 years are the age groups that are most secure financially, with 100.0% of males and 100.0% of females in these age groups living above the poverty line.
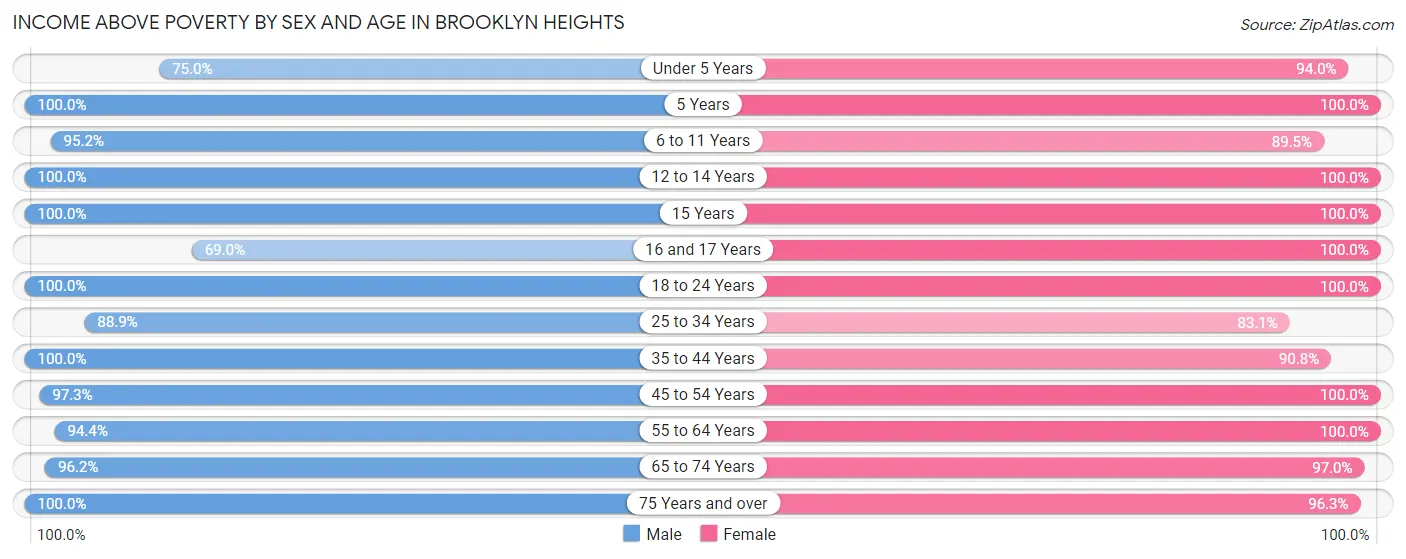
| Age Bracket | Male | Female |
| Under 5 Years | 12 (75.0%) | 63 (94.0%) |
| 5 Years | 7 (100.0%) | 3 (100.0%) |
| 6 to 11 Years | 59 (95.2%) | 68 (89.5%) |
| 12 to 14 Years | 70 (100.0%) | 19 (100.0%) |
| 15 Years | 7 (100.0%) | 7 (100.0%) |
| 16 and 17 Years | 20 (69.0%) | 12 (100.0%) |
| 18 to 24 Years | 34 (100.0%) | 29 (100.0%) |
| 25 to 34 Years | 64 (88.9%) | 64 (83.1%) |
| 35 to 44 Years | 93 (100.0%) | 89 (90.8%) |
| 45 to 54 Years | 106 (97.3%) | 99 (100.0%) |
| 55 to 64 Years | 85 (94.4%) | 136 (100.0%) |
| 65 to 74 Years | 76 (96.2%) | 64 (97.0%) |
| 75 Years and over | 59 (100.0%) | 77 (96.3%) |
| Total | 692 (95.2%) | 730 (94.9%) |
Income Below Poverty Among Married-Couple Families in Brooklyn Heights
The poverty statistics for married-couple families in Brooklyn Heights show that 1.2% or 4 of the total 324 families live below the poverty line. Families with 3 or 4 children have the highest poverty rate of 8.0%, comprising of 4 families. On the other hand, families with no children have the lowest poverty rate of 0.0%, which includes 0 families.
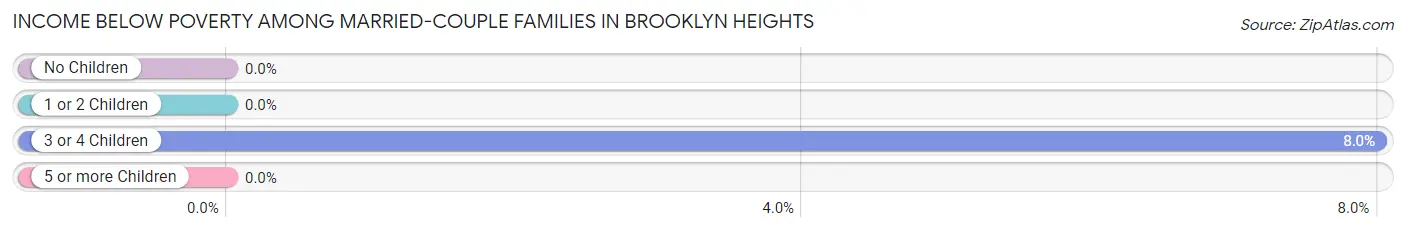
| Children | Above Poverty | Below Poverty |
| No Children | 192 (100.0%) | 0 (0.0%) |
| 1 or 2 Children | 80 (100.0%) | 0 (0.0%) |
| 3 or 4 Children | 46 (92.0%) | 4 (8.0%) |
| 5 or more Children | 2 (100.0%) | 0 (0.0%) |
| Total | 320 (98.8%) | 4 (1.2%) |
Income Below Poverty Among Single-Parent Households in Brooklyn Heights
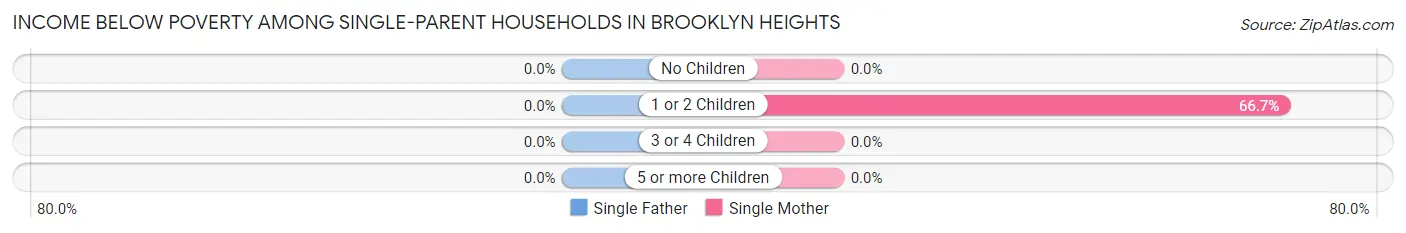
| Children | Single Father | Single Mother |
| No Children | 0 (0.0%) | 0 (0.0%) |
| 1 or 2 Children | 0 (0.0%) | 12 (66.7%) |
| 3 or 4 Children | 0 (0.0%) | 0 (0.0%) |
| 5 or more Children | 0 (0.0%) | 0 (0.0%) |
| Total | 0 (0.0%) | 12 (21.4%) |
Income Below Poverty Among Married-Couple vs Single-Parent Households in Brooklyn Heights
The poverty data for Brooklyn Heights shows that 4 of the married-couple family households (1.2%) and 12 of the single-parent households (12.4%) are living below the poverty level. Within the married-couple family households, those with 3 or 4 children have the highest poverty rate, with 4 households (8.0%) falling below the poverty line. Among the single-parent households, those with 1 or 2 children have the highest poverty rate, with 12 household (21.4%) living below poverty.
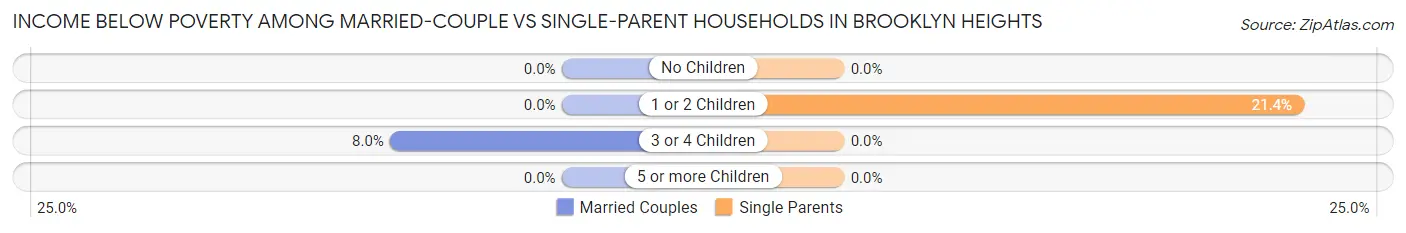
| Children | Married-Couple Families | Single-Parent Households |
| No Children | 0 (0.0%) | 0 (0.0%) |
| 1 or 2 Children | 0 (0.0%) | 12 (21.4%) |
| 3 or 4 Children | 4 (8.0%) | 0 (0.0%) |
| 5 or more Children | 0 (0.0%) | 0 (0.0%) |
| Total | 4 (1.2%) | 12 (12.4%) |
Race in Brooklyn Heights
The most populous races in Brooklyn Heights are White / Caucasian (1,422 | 94.8%), Hispanic or Latino (36 | 2.4%), and Black / African American (33 | 2.2%).
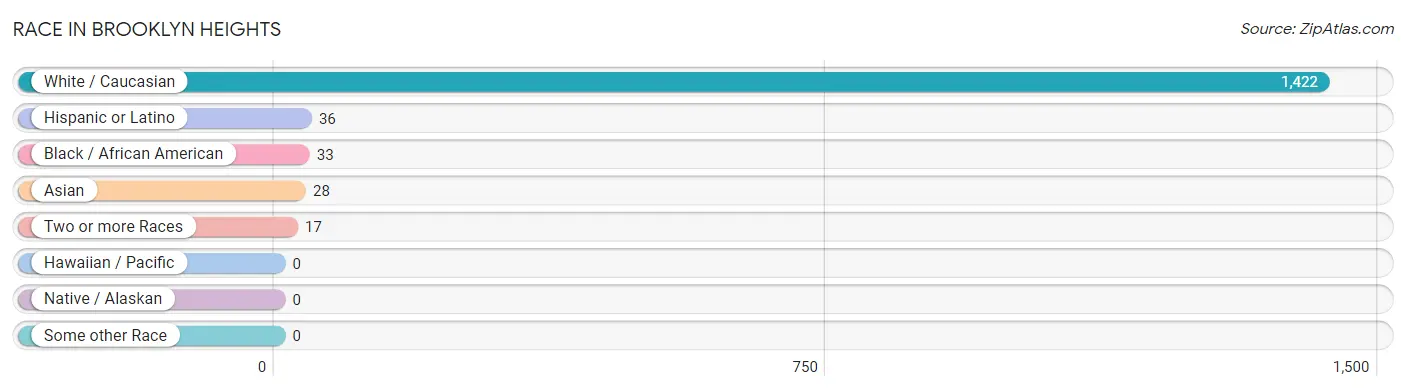
| Race | # Population | % Population |
| Asian | 28 | 1.9% |
| Black / African American | 33 | 2.2% |
| Hawaiian / Pacific | 0 | 0.0% |
| Hispanic or Latino | 36 | 2.4% |
| Native / Alaskan | 0 | 0.0% |
| White / Caucasian | 1,422 | 94.8% |
| Two or more Races | 17 | 1.1% |
| Some other Race | 0 | 0.0% |
| Total | 1,500 | 100.0% |
Ancestry in Brooklyn Heights
The most populous ancestries reported in Brooklyn Heights are Polish (401 | 26.7%), German (353 | 23.5%), Italian (281 | 18.7%), Irish (138 | 9.2%), and Slovak (109 | 7.3%), together accounting for 85.5% of all Brooklyn Heights residents.
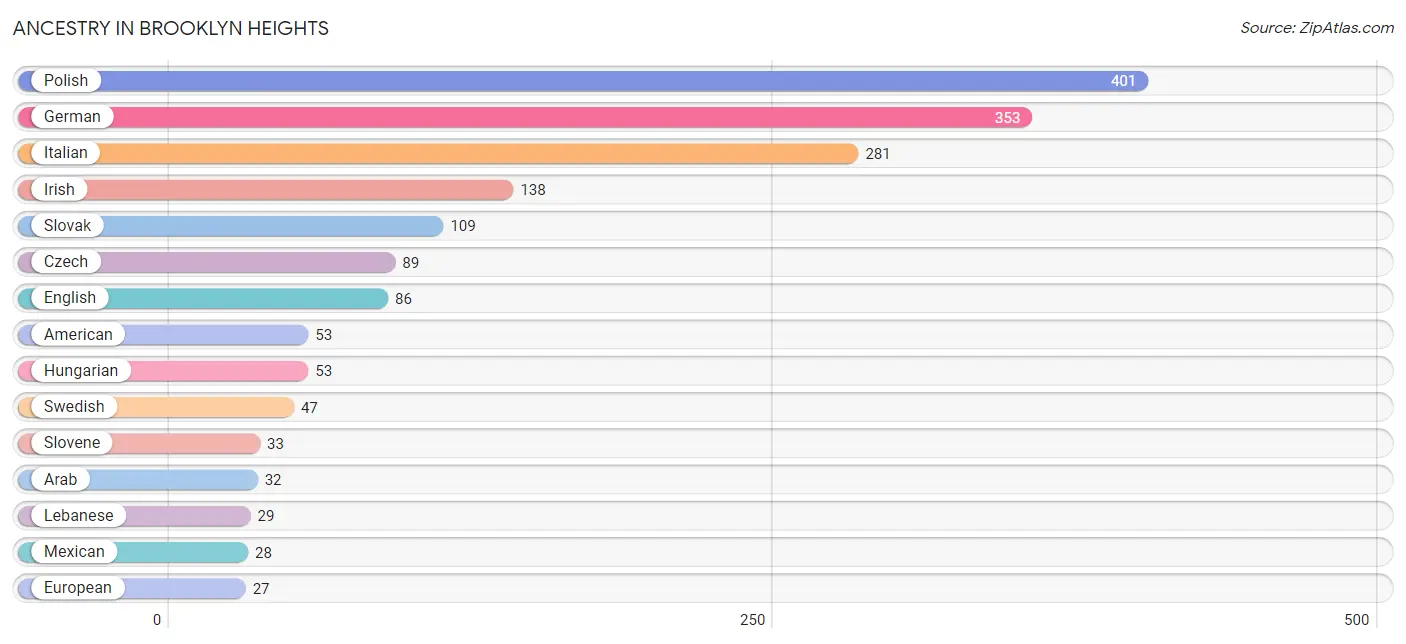
| Ancestry | # Population | % Population |
| American | 53 | 3.5% |
| Arab | 32 | 2.1% |
| Austrian | 3 | 0.2% |
| Canadian | 3 | 0.2% |
| Croatian | 3 | 0.2% |
| Czech | 89 | 5.9% |
| Dutch | 14 | 0.9% |
| Eastern European | 9 | 0.6% |
| English | 86 | 5.7% |
| European | 27 | 1.8% |
| French | 20 | 1.3% |
| German | 353 | 23.5% |
| Greek | 9 | 0.6% |
| Hungarian | 53 | 3.5% |
| Indian (Asian) | 9 | 0.6% |
| Irish | 138 | 9.2% |
| Italian | 281 | 18.7% |
| Korean | 4 | 0.3% |
| Lebanese | 29 | 1.9% |
| Lithuanian | 4 | 0.3% |
| Mexican | 28 | 1.9% |
| Polish | 401 | 26.7% |
| Portuguese | 6 | 0.4% |
| Puerto Rican | 8 | 0.5% |
| Romanian | 17 | 1.1% |
| Russian | 16 | 1.1% |
| Scotch-Irish | 22 | 1.5% |
| Scottish | 20 | 1.3% |
| Serbian | 8 | 0.5% |
| Slovak | 109 | 7.3% |
| Slovene | 33 | 2.2% |
| Swedish | 47 | 3.1% |
| Swiss | 3 | 0.2% |
| Syrian | 3 | 0.2% |
| Thai | 15 | 1.0% |
| Ukrainian | 19 | 1.3% |
| Welsh | 14 | 0.9% | View All 37 Rows |
Immigrants in Brooklyn Heights
The most numerous immigrant groups reported in Brooklyn Heights came from Asia (32 | 2.1%), Europe (22 | 1.5%), Eastern Europe (13 | 0.9%), Lebanon (11 | 0.7%), and Western Asia (11 | 0.7%), together accounting for 5.9% of all Brooklyn Heights residents.
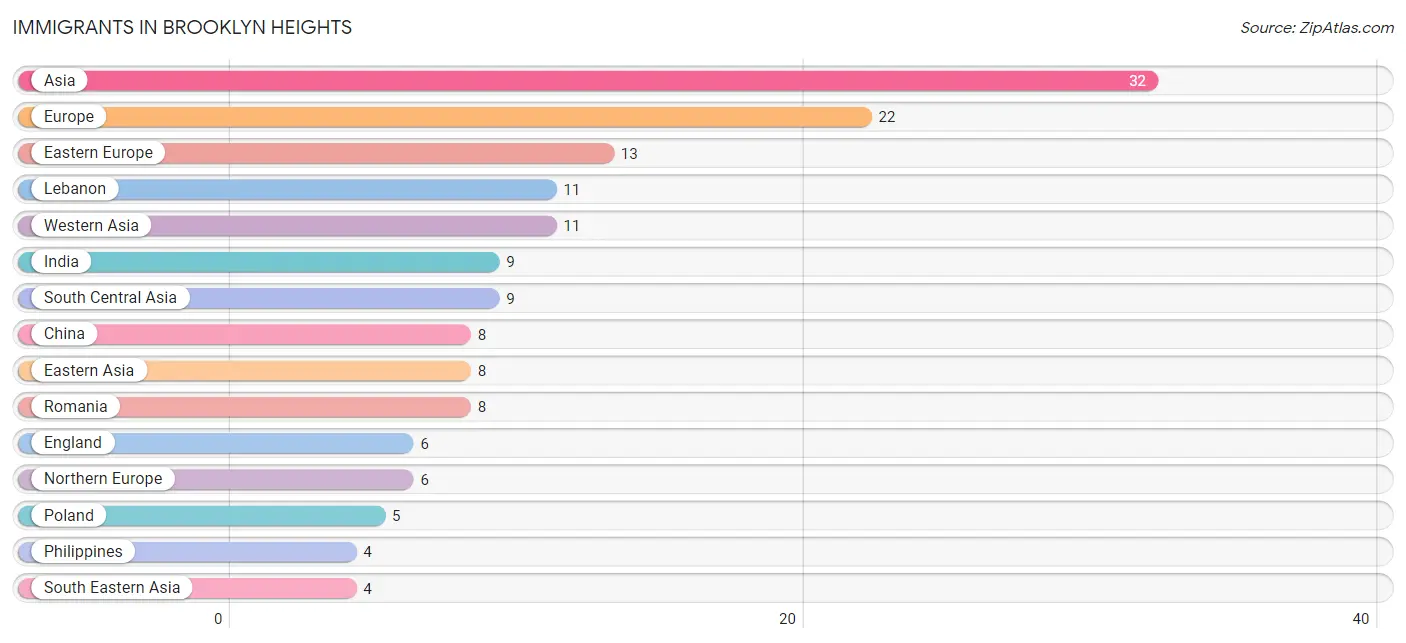
| Immigration Origin | # Population | % Population |
| Asia | 32 | 2.1% |
| Canada | 3 | 0.2% |
| China | 8 | 0.5% |
| Eastern Asia | 8 | 0.5% |
| Eastern Europe | 13 | 0.9% |
| England | 6 | 0.4% |
| Europe | 22 | 1.5% |
| Greece | 3 | 0.2% |
| India | 9 | 0.6% |
| Lebanon | 11 | 0.7% |
| Northern Europe | 6 | 0.4% |
| Philippines | 4 | 0.3% |
| Poland | 5 | 0.3% |
| Romania | 8 | 0.5% |
| South Central Asia | 9 | 0.6% |
| South Eastern Asia | 4 | 0.3% |
| Southern Europe | 3 | 0.2% |
| Western Asia | 11 | 0.7% | View All 18 Rows |
Sex and Age in Brooklyn Heights
Sex and Age in Brooklyn Heights
The most populous age groups in Brooklyn Heights are 10 to 14 Years (100 | 13.7%) for men and 60 to 64 Years (91 | 11.8%) for women.
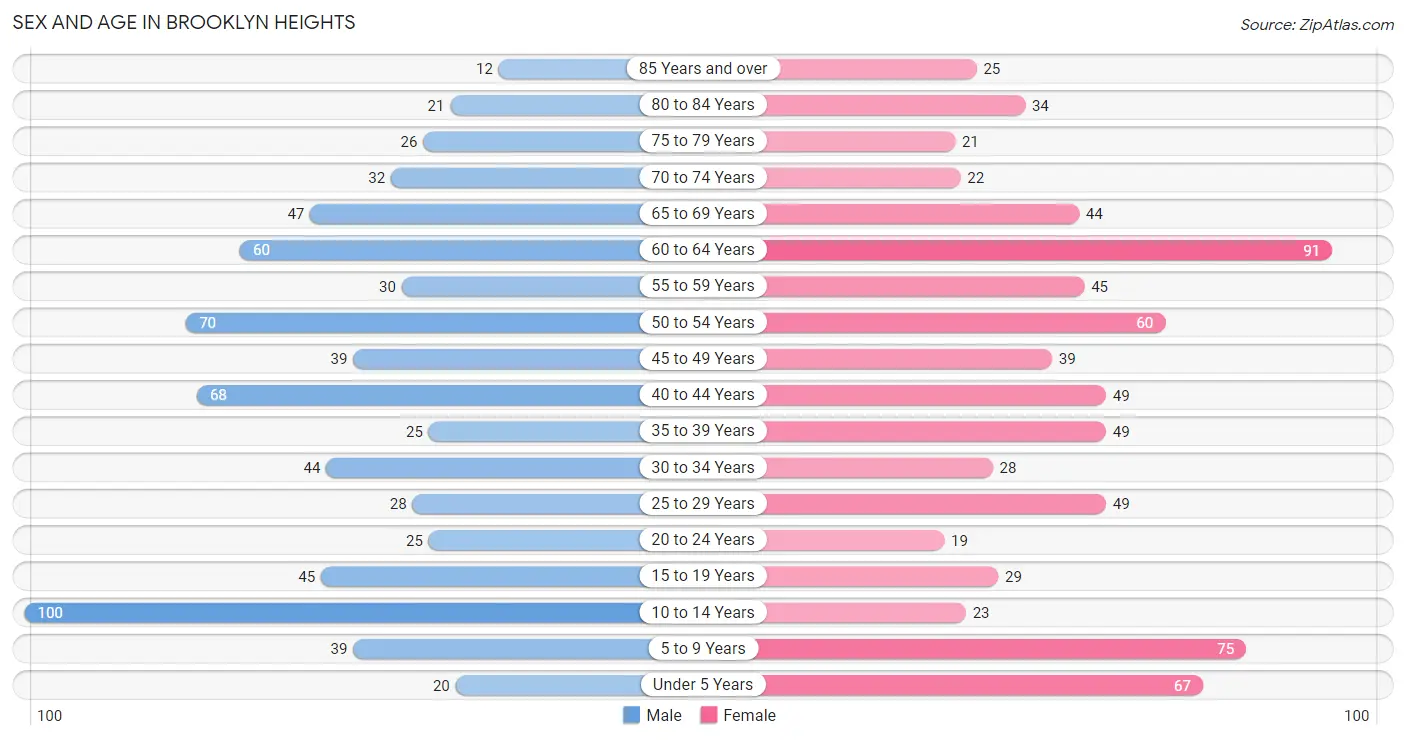
| Age Bracket | Male | Female |
| Under 5 Years | 20 (2.7%) | 67 (8.7%) |
| 5 to 9 Years | 39 (5.3%) | 75 (9.8%) |
| 10 to 14 Years | 100 (13.7%) | 23 (3.0%) |
| 15 to 19 Years | 45 (6.2%) | 29 (3.8%) |
| 20 to 24 Years | 25 (3.4%) | 19 (2.5%) |
| 25 to 29 Years | 28 (3.8%) | 49 (6.4%) |
| 30 to 34 Years | 44 (6.0%) | 28 (3.6%) |
| 35 to 39 Years | 25 (3.4%) | 49 (6.4%) |
| 40 to 44 Years | 68 (9.3%) | 49 (6.4%) |
| 45 to 49 Years | 39 (5.3%) | 39 (5.1%) |
| 50 to 54 Years | 70 (9.6%) | 60 (7.8%) |
| 55 to 59 Years | 30 (4.1%) | 45 (5.9%) |
| 60 to 64 Years | 60 (8.2%) | 91 (11.8%) |
| 65 to 69 Years | 47 (6.4%) | 44 (5.7%) |
| 70 to 74 Years | 32 (4.4%) | 22 (2.9%) |
| 75 to 79 Years | 26 (3.6%) | 21 (2.7%) |
| 80 to 84 Years | 21 (2.9%) | 34 (4.4%) |
| 85 Years and over | 12 (1.6%) | 25 (3.3%) |
| Total | 731 (100.0%) | 769 (100.0%) |
Families and Households in Brooklyn Heights
Median Family Size in Brooklyn Heights
The median family size in Brooklyn Heights is 3.01 persons per family, with married-couple families (324 | 77.0%) accounting for the largest median family size of 3.16 persons per family. On the other hand, single female/mother families (56 | 13.3%) represent the smallest median family size with 2.38 persons per family.
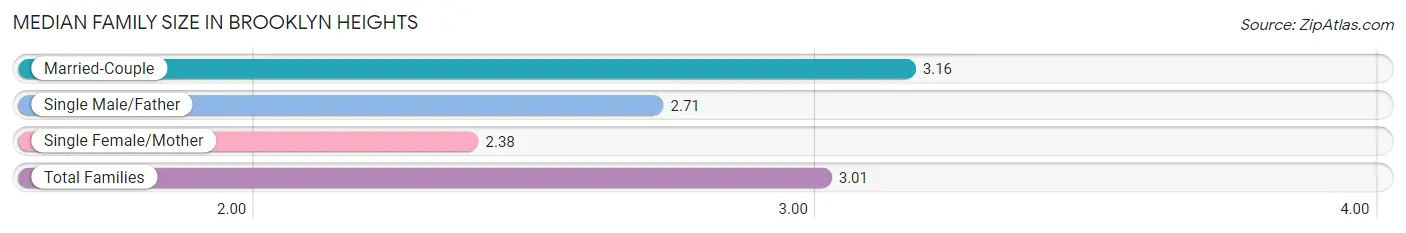
| Family Type | # Families | Family Size |
| Married-Couple | 324 (77.0%) | 3.16 |
| Single Male/Father | 41 (9.7%) | 2.71 |
| Single Female/Mother | 56 (13.3%) | 2.38 |
| Total Families | 421 (100.0%) | 3.01 |
Median Household Size in Brooklyn Heights
The median household size in Brooklyn Heights is 2.59 persons per household, with single male/father households (41 | 7.1%) accounting for the largest median household size of 3.24 persons per household. non-family households (154 | 26.8%) represent the smallest median household size with 1.16 persons per household.
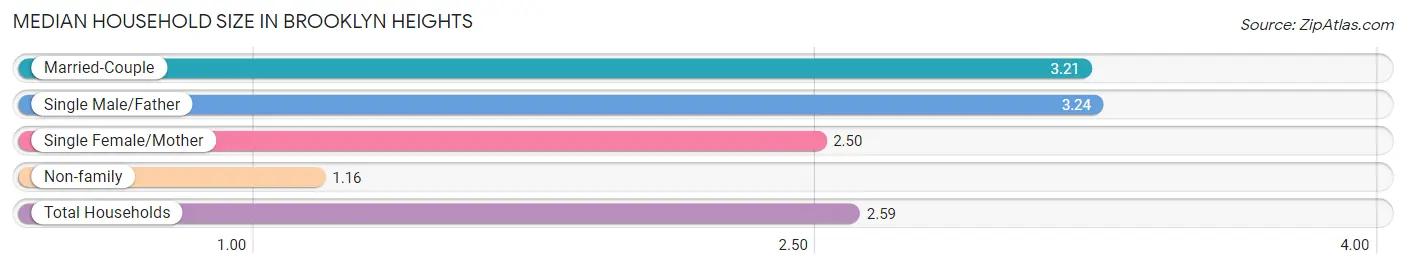
| Household Type | # Households | Household Size |
| Married-Couple | 324 (56.4%) | 3.21 |
| Single Male/Father | 41 (7.1%) | 3.24 |
| Single Female/Mother | 56 (9.7%) | 2.50 |
| Non-family | 154 (26.8%) | 1.16 |
| Total Households | 575 (100.0%) | 2.59 |
Household Size by Marriage Status in Brooklyn Heights
Out of a total of 575 households in Brooklyn Heights, 421 (73.2%) are family households, while 154 (26.8%) are nonfamily households. The most numerous type of family households are 2-person households, comprising 184, and the most common type of nonfamily households are 1-person households, comprising 130.
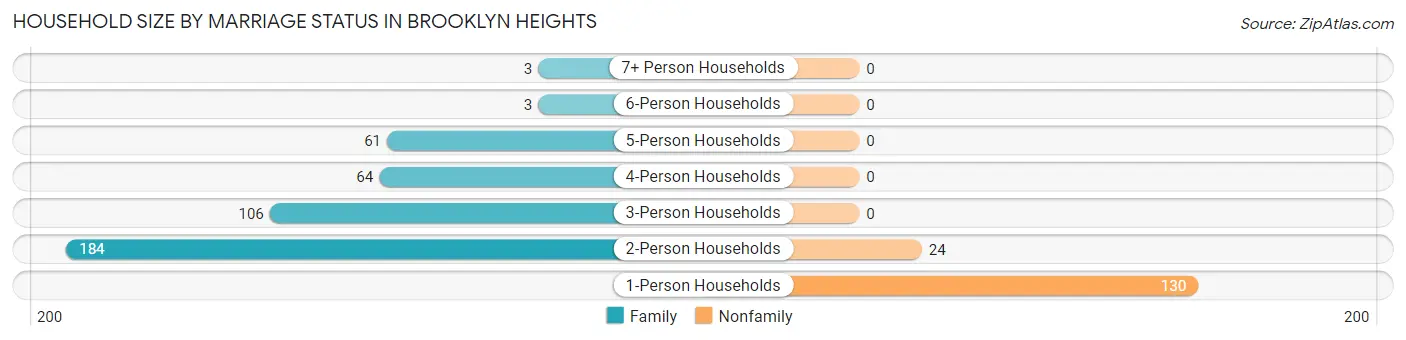
| Household Size | Family Households | Nonfamily Households |
| 1-Person Households | - | 130 (22.6%) |
| 2-Person Households | 184 (32.0%) | 24 (4.2%) |
| 3-Person Households | 106 (18.4%) | 0 (0.0%) |
| 4-Person Households | 64 (11.1%) | 0 (0.0%) |
| 5-Person Households | 61 (10.6%) | 0 (0.0%) |
| 6-Person Households | 3 (0.5%) | 0 (0.0%) |
| 7+ Person Households | 3 (0.5%) | 0 (0.0%) |
| Total | 421 (73.2%) | 154 (26.8%) |
Female Fertility in Brooklyn Heights
Fertility by Age in Brooklyn Heights
Average fertility rate in Brooklyn Heights is 31.0 births per 1,000 women. Women in the age bracket of 20 to 34 years have the highest fertility rate with 83.0 births per 1,000 women. Women in the age bracket of 20 to 34 years acount for 100.0% of all women with births.
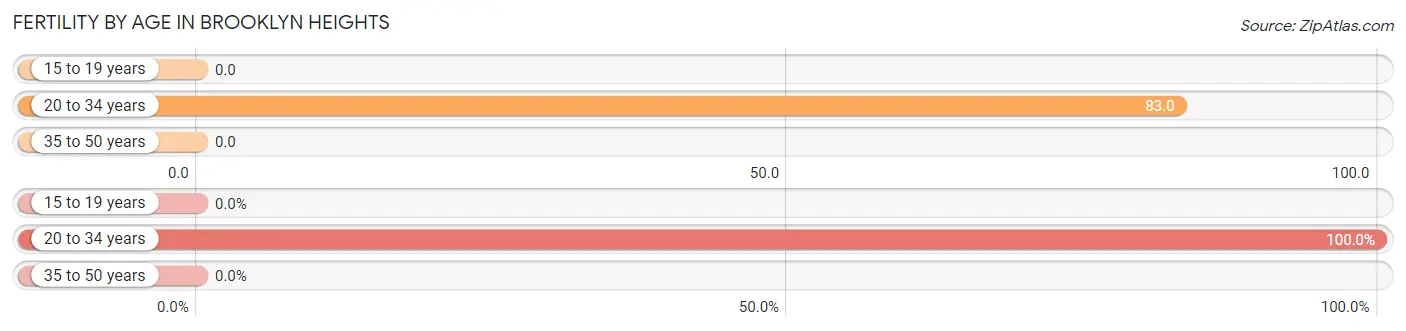
| Age Bracket | Women with Births | Births / 1,000 Women |
| 15 to 19 years | 0 (0.0%) | 0.0 |
| 20 to 34 years | 8 (100.0%) | 83.0 |
| 35 to 50 years | 0 (0.0%) | 0.0 |
| Total | 8 (100.0%) | 31.0 |
Fertility by Age by Marriage Status in Brooklyn Heights
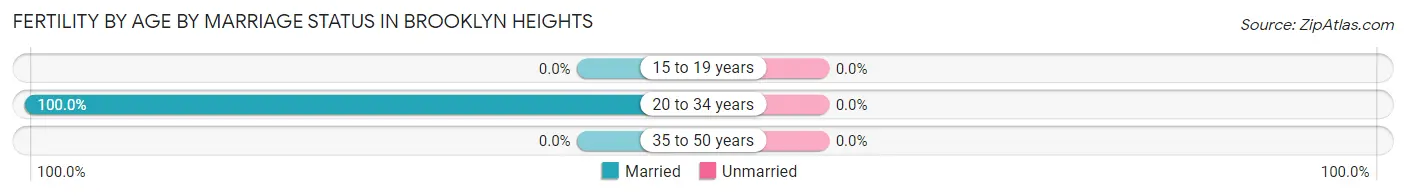
| Age Bracket | Married | Unmarried |
| 15 to 19 years | 0 (0.0%) | 0 (0.0%) |
| 20 to 34 years | 8 (100.0%) | 0 (0.0%) |
| 35 to 50 years | 0 (0.0%) | 0 (0.0%) |
| Total | 8 (100.0%) | 0 (0.0%) |
Fertility by Education in Brooklyn Heights
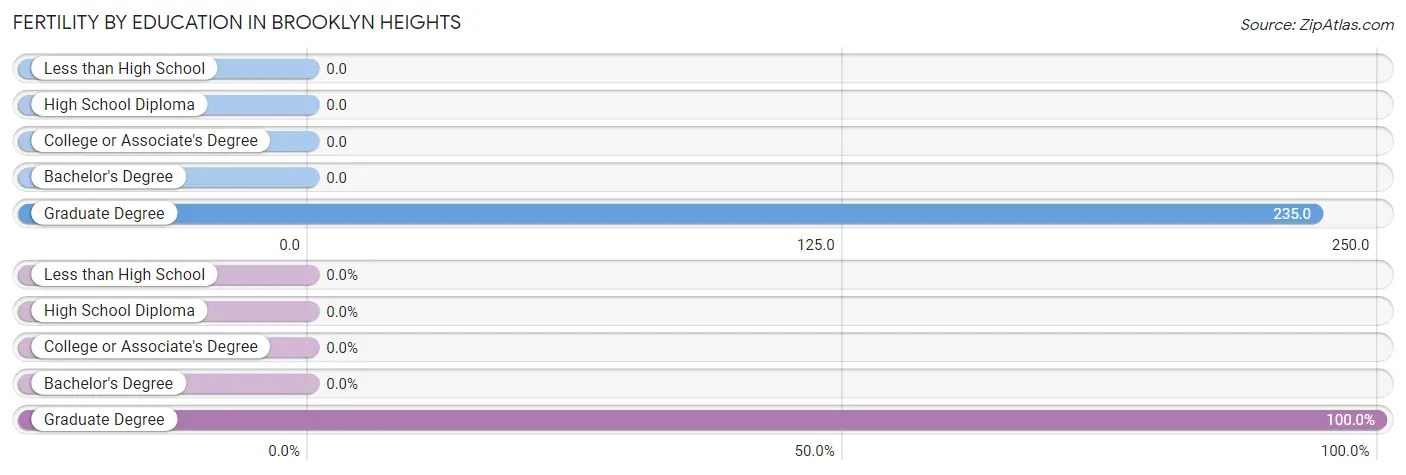
| Educational Attainment | Women with Births | Births / 1,000 Women |
| Less than High School | 0 (0.0%) | 0.0 |
| High School Diploma | 0 (0.0%) | 0.0 |
| College or Associate's Degree | 0 (0.0%) | 0.0 |
| Bachelor's Degree | 0 (0.0%) | 0.0 |
| Graduate Degree | 8 (100.0%) | 235.0 |
| Total | 8 (100.0%) | 31.0 |
Fertility by Education by Marriage Status in Brooklyn Heights
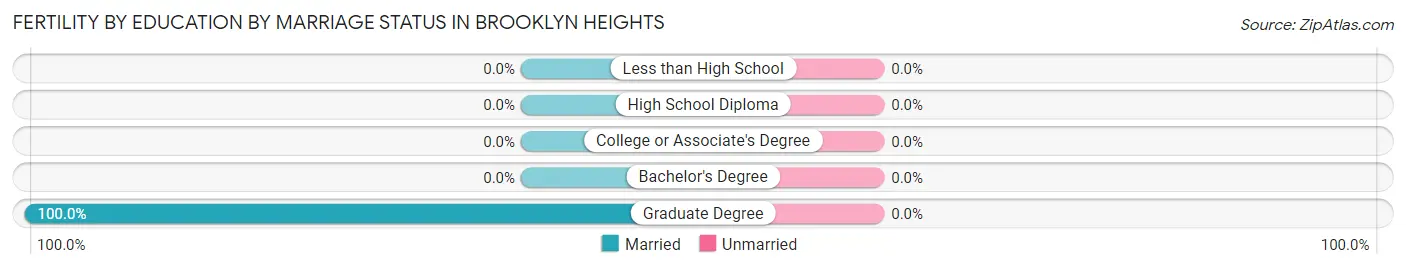
| Educational Attainment | Married | Unmarried |
| Less than High School | 0 (0.0%) | 0 (0.0%) |
| High School Diploma | 0 (0.0%) | 0 (0.0%) |
| College or Associate's Degree | 0 (0.0%) | 0 (0.0%) |
| Bachelor's Degree | 0 (0.0%) | 0 (0.0%) |
| Graduate Degree | 8 (100.0%) | 0 (0.0%) |
| Total | 8 (100.0%) | 0 (0.0%) |
Employment Characteristics in Brooklyn Heights
Employment by Class of Employer in Brooklyn Heights
Among the 751 employed individuals in Brooklyn Heights, private company employees (529 | 70.4%), local government employees (136 | 18.1%), and not-for-profit organizations (42 | 5.6%) make up the most common classes of employment.
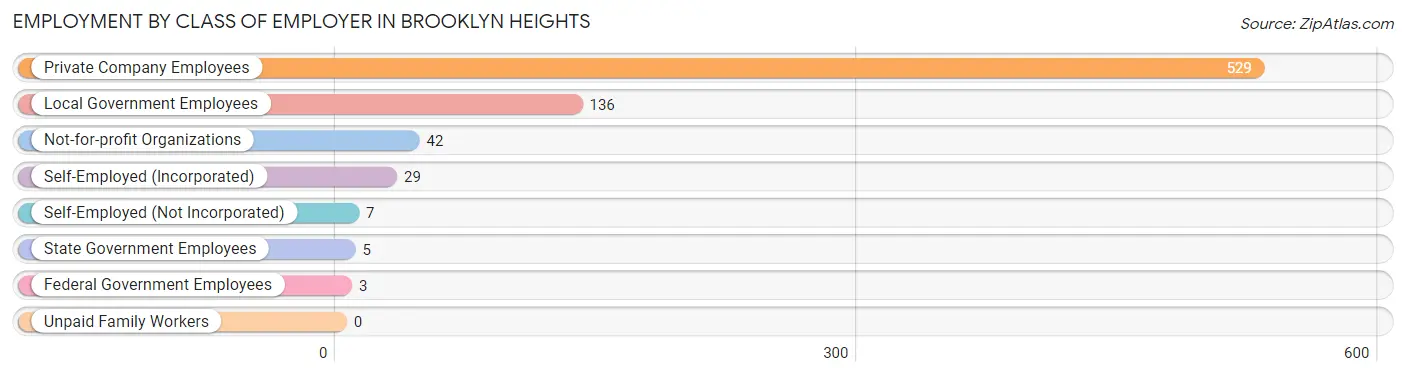
| Employer Class | # Employees | % Employees |
| Private Company Employees | 529 | 70.4% |
| Self-Employed (Incorporated) | 29 | 3.9% |
| Self-Employed (Not Incorporated) | 7 | 0.9% |
| Not-for-profit Organizations | 42 | 5.6% |
| Local Government Employees | 136 | 18.1% |
| State Government Employees | 5 | 0.7% |
| Federal Government Employees | 3 | 0.4% |
| Unpaid Family Workers | 0 | 0.0% |
| Total | 751 | 100.0% |
Employment Status by Age in Brooklyn Heights
According to the labor force statistics for Brooklyn Heights, out of the total population over 16 years of age (1,162), 65.7% or 763 individuals are in the labor force, with 1.4% or 11 of them unemployed. The age group with the highest labor force participation rate is 35 to 44 years, with 100.0% or 191 individuals in the labor force. Within the labor force, the 20 to 24 years age range has the highest percentage of unemployed individuals, with 12.8% or 5 of them being unemployed.
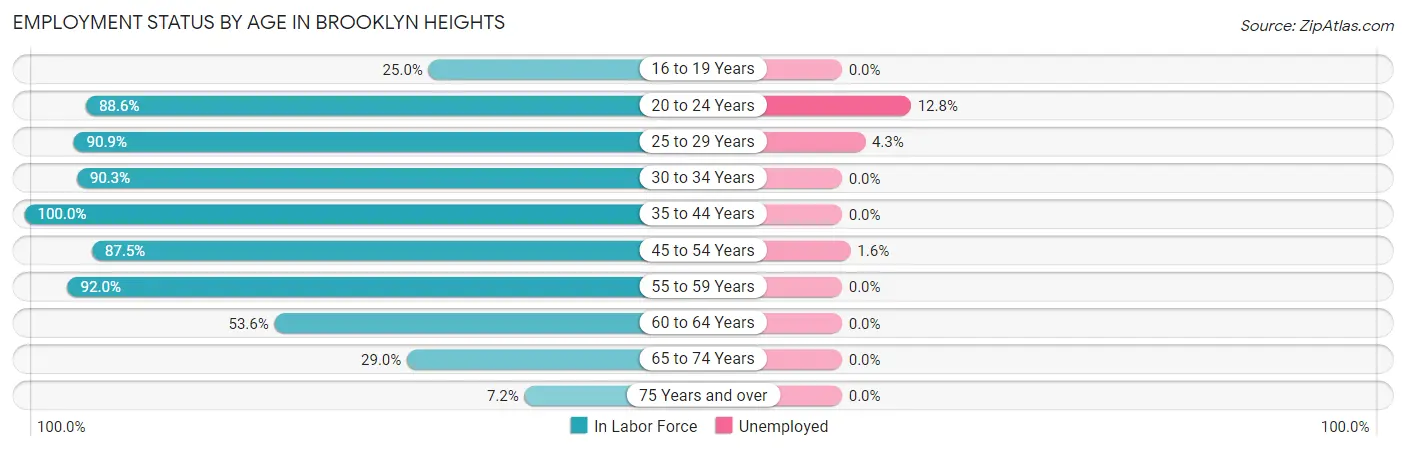
| Age Bracket | In Labor Force | Unemployed |
| 16 to 19 Years | 15 (25.0%) | 0 (0.0%) |
| 20 to 24 Years | 39 (88.6%) | 5 (12.8%) |
| 25 to 29 Years | 70 (90.9%) | 3 (4.3%) |
| 30 to 34 Years | 65 (90.3%) | 0 (0.0%) |
| 35 to 44 Years | 191 (100.0%) | 0 (0.0%) |
| 45 to 54 Years | 182 (87.5%) | 3 (1.6%) |
| 55 to 59 Years | 69 (92.0%) | 0 (0.0%) |
| 60 to 64 Years | 81 (53.6%) | 0 (0.0%) |
| 65 to 74 Years | 42 (29.0%) | 0 (0.0%) |
| 75 Years and over | 10 (7.2%) | 0 (0.0%) |
| Total | 763 (65.7%) | 11 (1.4%) |
Employment Status by Educational Attainment in Brooklyn Heights
According to labor force statistics for Brooklyn Heights, 85.0% of individuals (658) out of the total population between 25 and 64 years of age (774) are in the labor force, with 0.9% or 6 of them being unemployed. The group with the highest labor force participation rate are those with the educational attainment of bachelor's degree or higher, with 93.7% or 252 individuals in the labor force. Within the labor force, individuals with bachelor's degree or higher education have the highest percentage of unemployment, with 2.4% or 6 of them being unemployed.
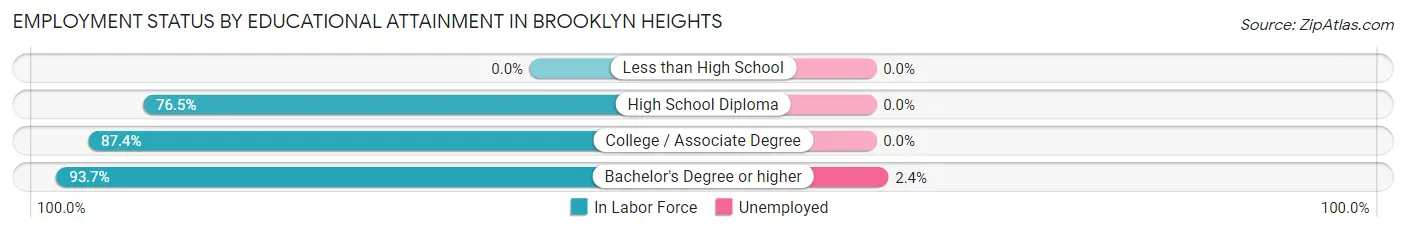
| Educational Attainment | In Labor Force | Unemployed |
| Less than High School | 0 (0.0%) | 0 (0.0%) |
| High School Diploma | 163 (76.5%) | 0 (0.0%) |
| College / Associate Degree | 243 (87.4%) | 0 (0.0%) |
| Bachelor's Degree or higher | 252 (93.7%) | 6 (2.4%) |
| Total | 658 (85.0%) | 7 (0.9%) |
Employment Occupations by Sex in Brooklyn Heights
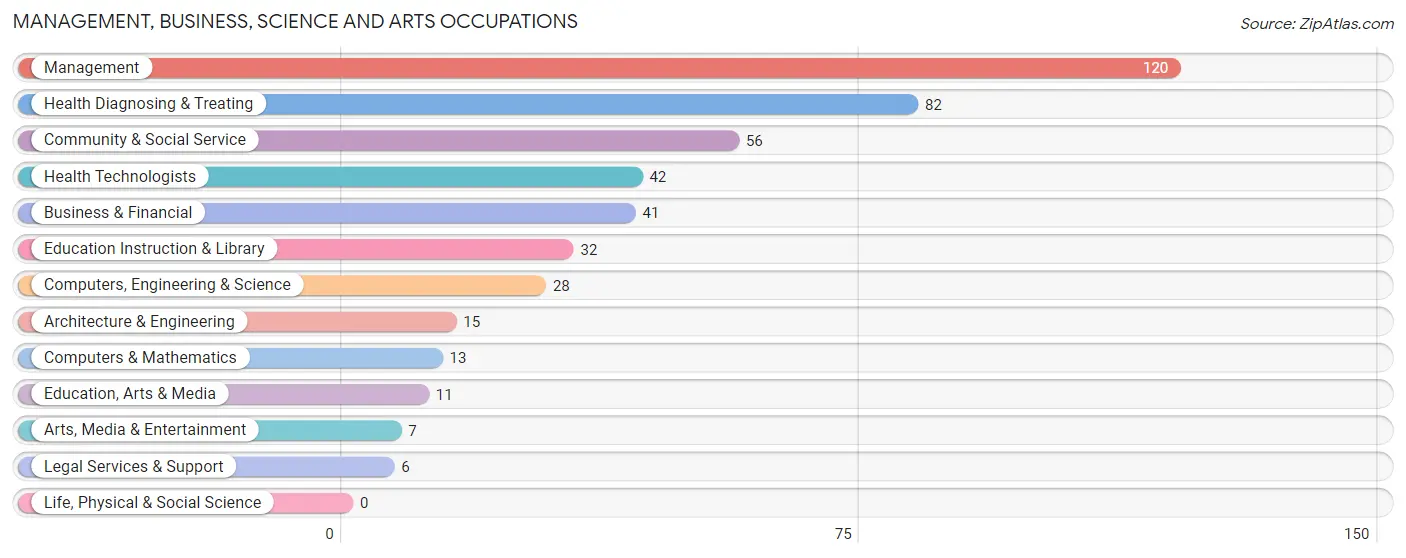
Management, Business, Science and Arts Occupations
The most common Management, Business, Science and Arts occupations in Brooklyn Heights are Management (120 | 15.9%), Health Diagnosing & Treating (82 | 10.9%), Community & Social Service (56 | 7.4%), Health Technologists (42 | 5.6%), and Business & Financial (41 | 5.4%).
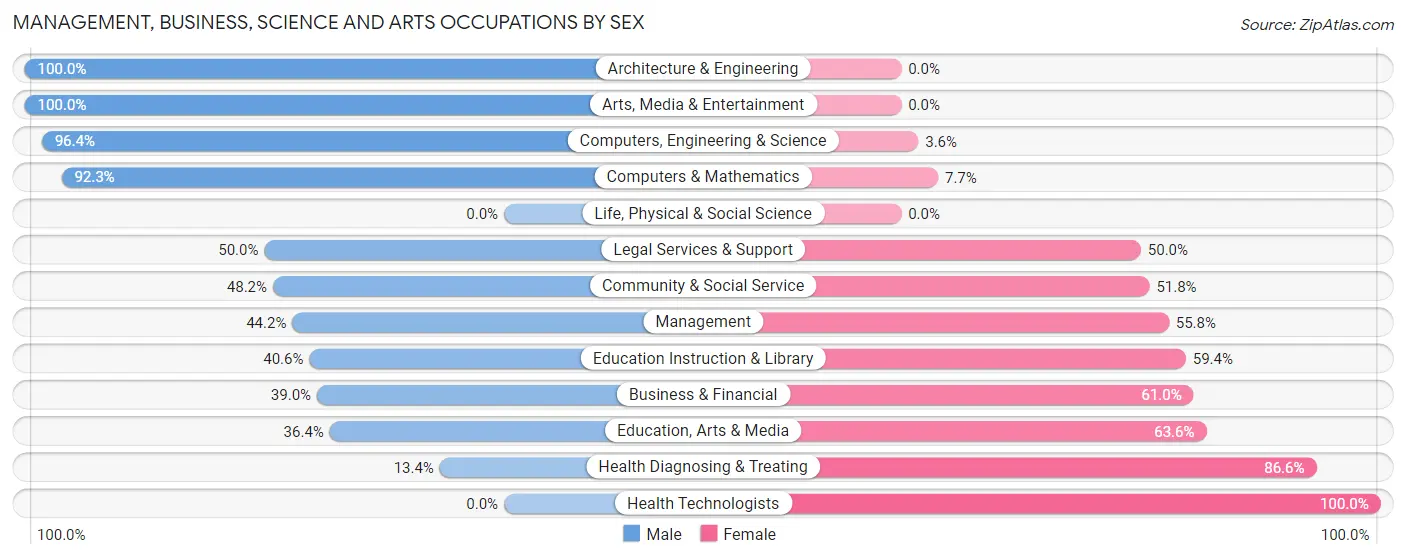
Management, Business, Science and Arts Occupations by Sex
Within the Management, Business, Science and Arts occupations in Brooklyn Heights, the most male-oriented occupations are Architecture & Engineering (100.0%), Arts, Media & Entertainment (100.0%), and Computers, Engineering & Science (96.4%), while the most female-oriented occupations are Health Technologists (100.0%), Health Diagnosing & Treating (86.6%), and Education, Arts & Media (63.6%).
| Occupation | Male | Female |
| Management | 53 (44.2%) | 67 (55.8%) |
| Business & Financial | 16 (39.0%) | 25 (61.0%) |
| Computers, Engineering & Science | 27 (96.4%) | 1 (3.6%) |
| Computers & Mathematics | 12 (92.3%) | 1 (7.7%) |
| Architecture & Engineering | 15 (100.0%) | 0 (0.0%) |
| Life, Physical & Social Science | 0 (0.0%) | 0 (0.0%) |
| Community & Social Service | 27 (48.2%) | 29 (51.8%) |
| Education, Arts & Media | 4 (36.4%) | 7 (63.6%) |
| Legal Services & Support | 3 (50.0%) | 3 (50.0%) |
| Education Instruction & Library | 13 (40.6%) | 19 (59.4%) |
| Arts, Media & Entertainment | 7 (100.0%) | 0 (0.0%) |
| Health Diagnosing & Treating | 11 (13.4%) | 71 (86.6%) |
| Health Technologists | 0 (0.0%) | 42 (100.0%) |
| Total (Category) | 134 (41.0%) | 193 (59.0%) |
| Total (Overall) | 371 (49.3%) | 382 (50.7%) |
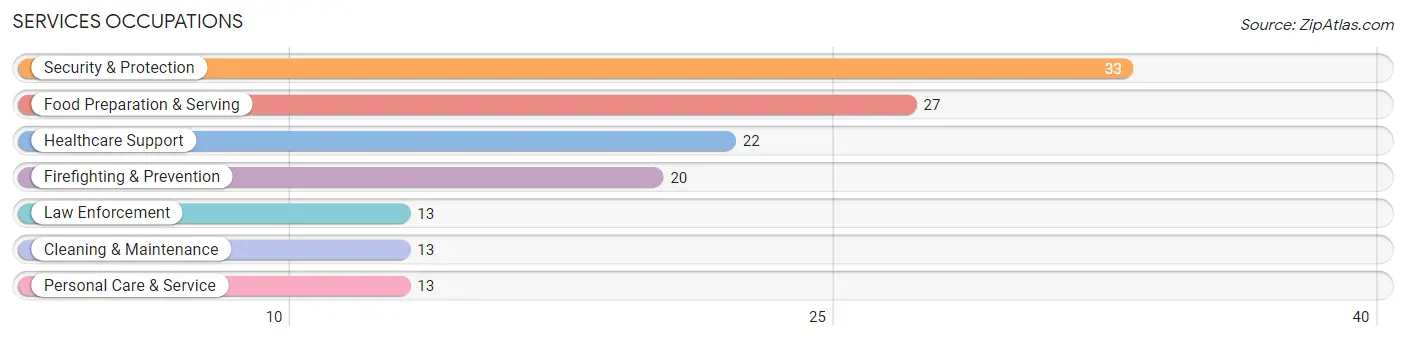
Services Occupations
The most common Services occupations in Brooklyn Heights are Security & Protection (33 | 4.4%), Food Preparation & Serving (27 | 3.6%), Healthcare Support (22 | 2.9%), Firefighting & Prevention (20 | 2.7%), and Law Enforcement (13 | 1.7%).
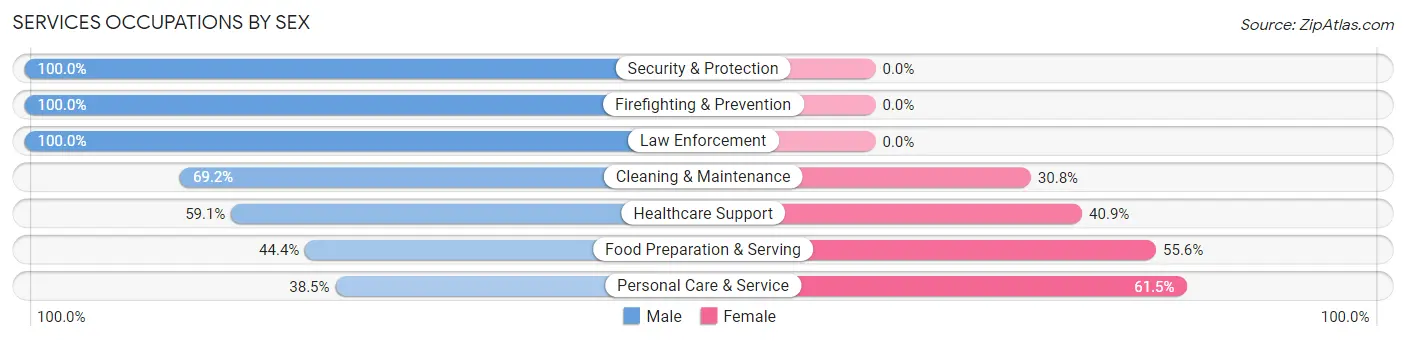
Services Occupations by Sex
Within the Services occupations in Brooklyn Heights, the most male-oriented occupations are Security & Protection (100.0%), Firefighting & Prevention (100.0%), and Law Enforcement (100.0%), while the most female-oriented occupations are Personal Care & Service (61.5%), Food Preparation & Serving (55.6%), and Healthcare Support (40.9%).
| Occupation | Male | Female |
| Healthcare Support | 13 (59.1%) | 9 (40.9%) |
| Security & Protection | 33 (100.0%) | 0 (0.0%) |
| Firefighting & Prevention | 20 (100.0%) | 0 (0.0%) |
| Law Enforcement | 13 (100.0%) | 0 (0.0%) |
| Food Preparation & Serving | 12 (44.4%) | 15 (55.6%) |
| Cleaning & Maintenance | 9 (69.2%) | 4 (30.8%) |
| Personal Care & Service | 5 (38.5%) | 8 (61.5%) |
| Total (Category) | 72 (66.7%) | 36 (33.3%) |
| Total (Overall) | 371 (49.3%) | 382 (50.7%) |
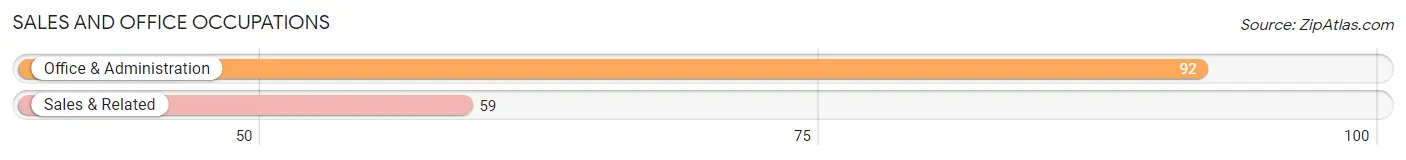
Sales and Office Occupations
The most common Sales and Office occupations in Brooklyn Heights are Office & Administration (92 | 12.2%), and Sales & Related (59 | 7.8%).
Sales and Office Occupations by Sex
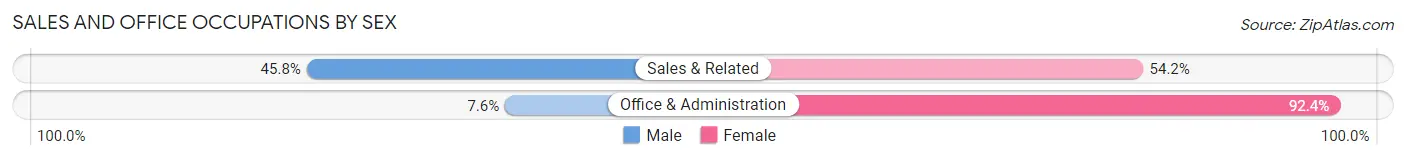
| Occupation | Male | Female |
| Sales & Related | 27 (45.8%) | 32 (54.2%) |
| Office & Administration | 7 (7.6%) | 85 (92.4%) |
| Total (Category) | 34 (22.5%) | 117 (77.5%) |
| Total (Overall) | 371 (49.3%) | 382 (50.7%) |
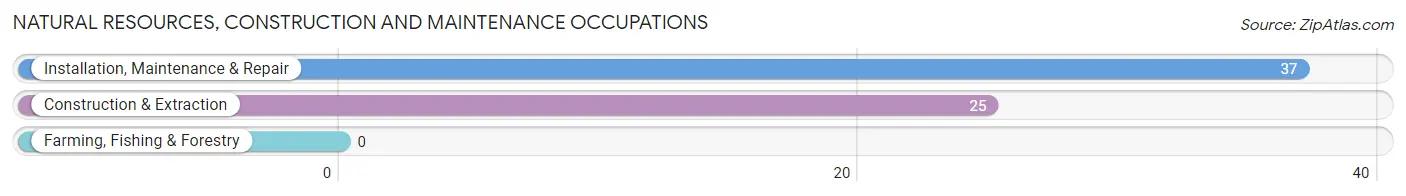
Natural Resources, Construction and Maintenance Occupations
The most common Natural Resources, Construction and Maintenance occupations in Brooklyn Heights are Installation, Maintenance & Repair (37 | 4.9%), and Construction & Extraction (25 | 3.3%).
Natural Resources, Construction and Maintenance Occupations by Sex
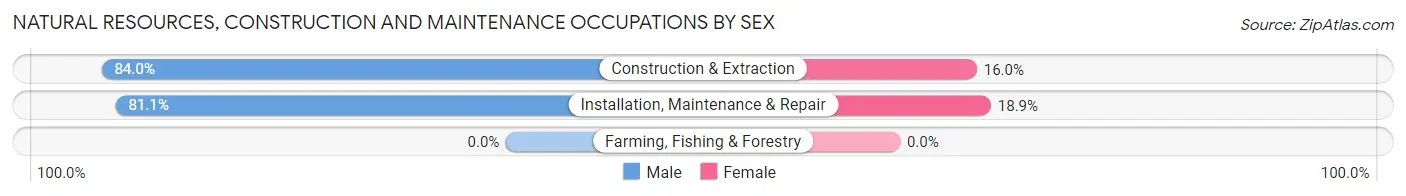
| Occupation | Male | Female |
| Farming, Fishing & Forestry | 0 (0.0%) | 0 (0.0%) |
| Construction & Extraction | 21 (84.0%) | 4 (16.0%) |
| Installation, Maintenance & Repair | 30 (81.1%) | 7 (18.9%) |
| Total (Category) | 51 (82.3%) | 11 (17.7%) |
| Total (Overall) | 371 (49.3%) | 382 (50.7%) |
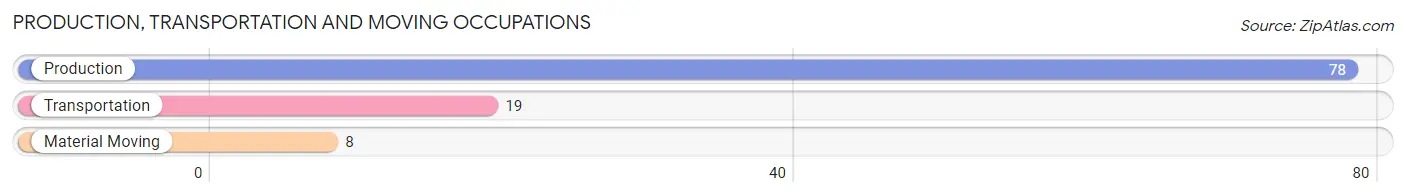
Production, Transportation and Moving Occupations
The most common Production, Transportation and Moving occupations in Brooklyn Heights are Production (78 | 10.4%), Transportation (19 | 2.5%), and Material Moving (8 | 1.1%).
Production, Transportation and Moving Occupations by Sex
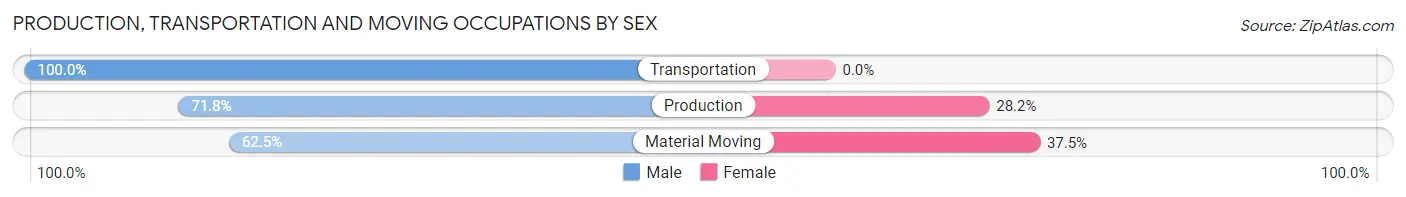
| Occupation | Male | Female |
| Production | 56 (71.8%) | 22 (28.2%) |
| Transportation | 19 (100.0%) | 0 (0.0%) |
| Material Moving | 5 (62.5%) | 3 (37.5%) |
| Total (Category) | 80 (76.2%) | 25 (23.8%) |
| Total (Overall) | 371 (49.3%) | 382 (50.7%) |
Employment Industries by Sex in Brooklyn Heights
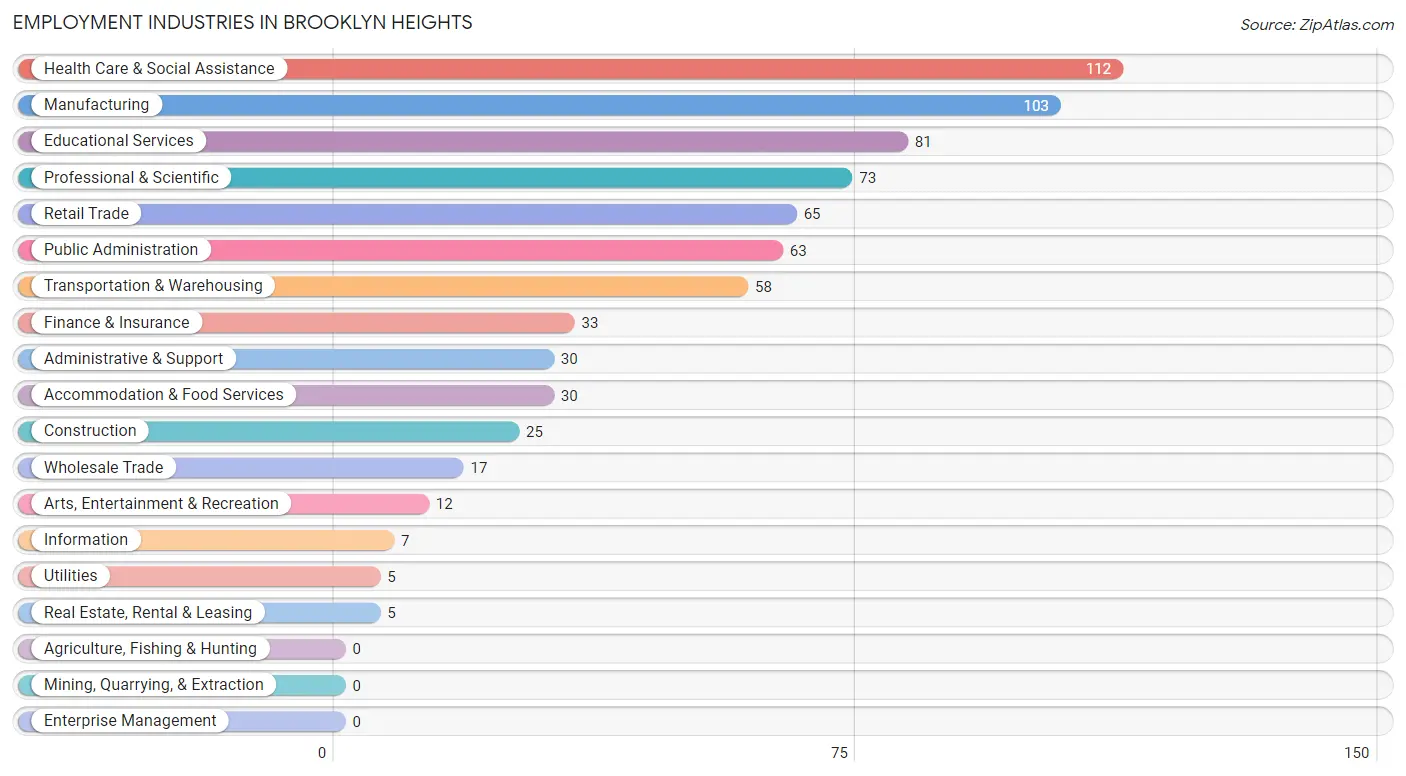
Employment Industries in Brooklyn Heights
The major employment industries in Brooklyn Heights include Health Care & Social Assistance (112 | 14.9%), Manufacturing (103 | 13.7%), Educational Services (81 | 10.8%), Professional & Scientific (73 | 9.7%), and Retail Trade (65 | 8.6%).
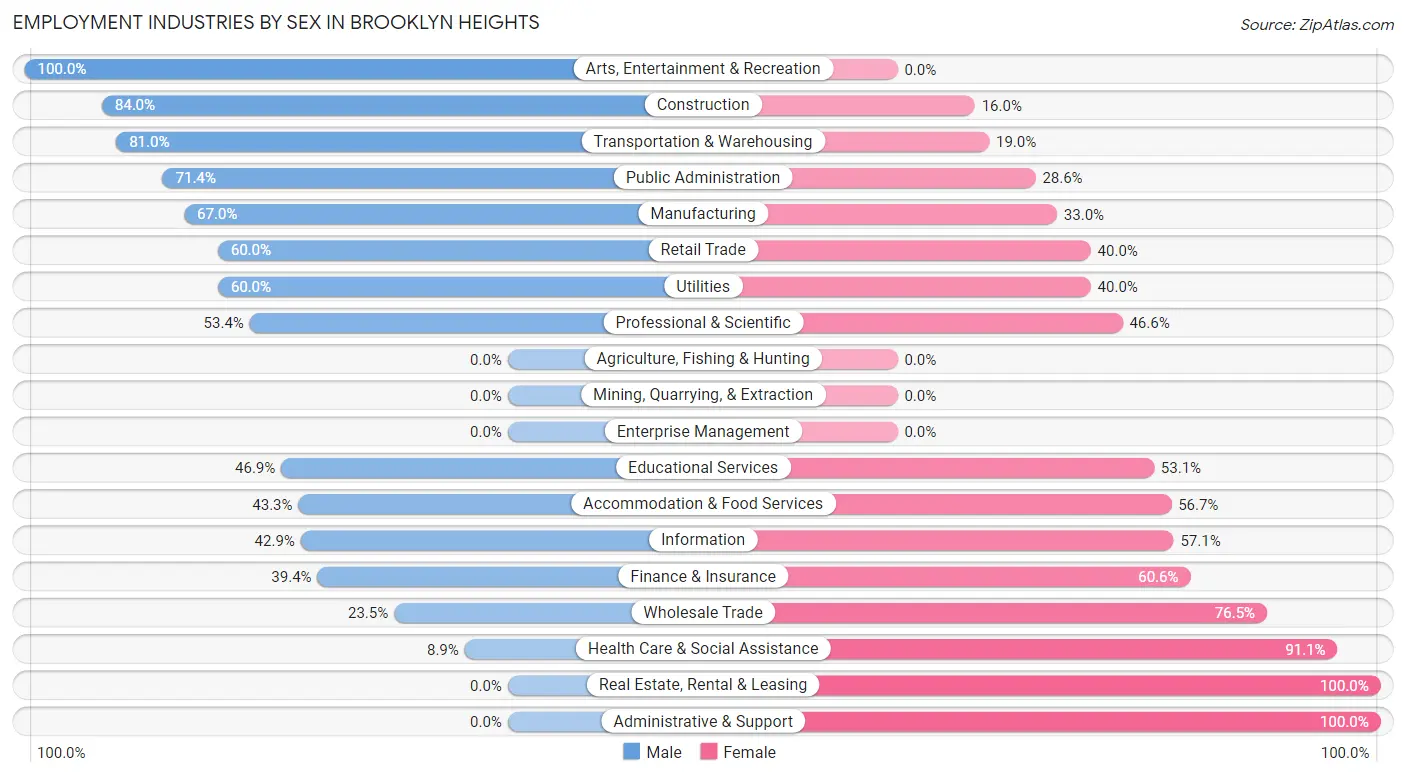
Employment Industries by Sex in Brooklyn Heights
The Brooklyn Heights industries that see more men than women are Arts, Entertainment & Recreation (100.0%), Construction (84.0%), and Transportation & Warehousing (81.0%), whereas the industries that tend to have a higher number of women are Real Estate, Rental & Leasing (100.0%), Administrative & Support (100.0%), and Health Care & Social Assistance (91.1%).
| Industry | Male | Female |
| Agriculture, Fishing & Hunting | 0 (0.0%) | 0 (0.0%) |
| Mining, Quarrying, & Extraction | 0 (0.0%) | 0 (0.0%) |
| Construction | 21 (84.0%) | 4 (16.0%) |
| Manufacturing | 69 (67.0%) | 34 (33.0%) |
| Wholesale Trade | 4 (23.5%) | 13 (76.5%) |
| Retail Trade | 39 (60.0%) | 26 (40.0%) |
| Transportation & Warehousing | 47 (81.0%) | 11 (19.0%) |
| Utilities | 3 (60.0%) | 2 (40.0%) |
| Information | 3 (42.9%) | 4 (57.1%) |
| Finance & Insurance | 13 (39.4%) | 20 (60.6%) |
| Real Estate, Rental & Leasing | 0 (0.0%) | 5 (100.0%) |
| Professional & Scientific | 39 (53.4%) | 34 (46.6%) |
| Enterprise Management | 0 (0.0%) | 0 (0.0%) |
| Administrative & Support | 0 (0.0%) | 30 (100.0%) |
| Educational Services | 38 (46.9%) | 43 (53.1%) |
| Health Care & Social Assistance | 10 (8.9%) | 102 (91.1%) |
| Arts, Entertainment & Recreation | 12 (100.0%) | 0 (0.0%) |
| Accommodation & Food Services | 13 (43.3%) | 17 (56.7%) |
| Public Administration | 45 (71.4%) | 18 (28.6%) |
| Total | 371 (49.3%) | 382 (50.7%) |
Education in Brooklyn Heights
School Enrollment in Brooklyn Heights
The most common levels of schooling among the 347 students in Brooklyn Heights are middle school (97 | 28.0%), elementary school (91 | 26.2%), and high school (77 | 22.2%).
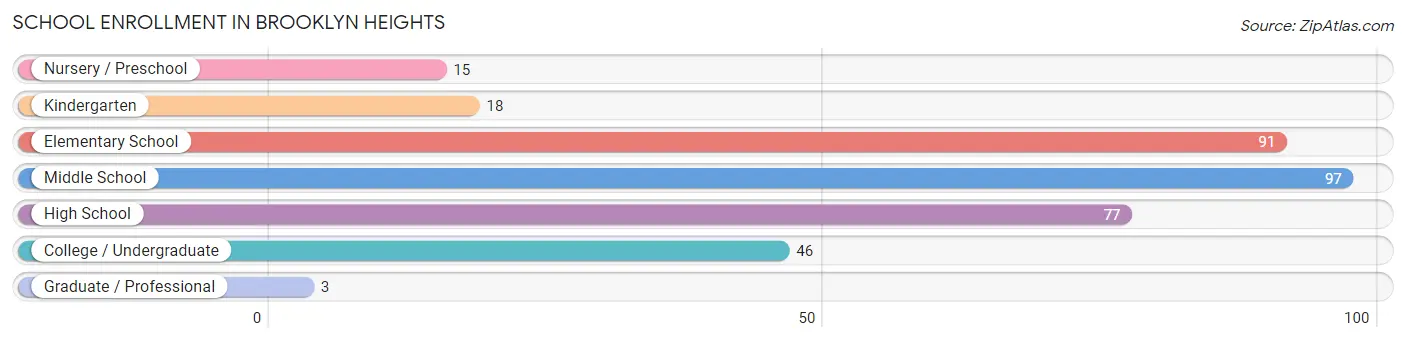
| School Level | # Students | % Students |
| Nursery / Preschool | 15 | 4.3% |
| Kindergarten | 18 | 5.2% |
| Elementary School | 91 | 26.2% |
| Middle School | 97 | 28.0% |
| High School | 77 | 22.2% |
| College / Undergraduate | 46 | 13.3% |
| Graduate / Professional | 3 | 0.9% |
| Total | 347 | 100.0% |
School Enrollment by Age by Funding Source in Brooklyn Heights
Out of a total of 347 students who are enrolled in schools in Brooklyn Heights, 37 (10.7%) attend a private institution, while the remaining 310 (89.3%) are enrolled in public schools. The age group of 35 years and over has the highest likelihood of being enrolled in private schools, with 6 (42.9% in the age bracket) enrolled. Conversely, the age group of 3 to 4 year olds has the lowest likelihood of being enrolled in a private school, with 12 (100.0% in the age bracket) attending a public institution.
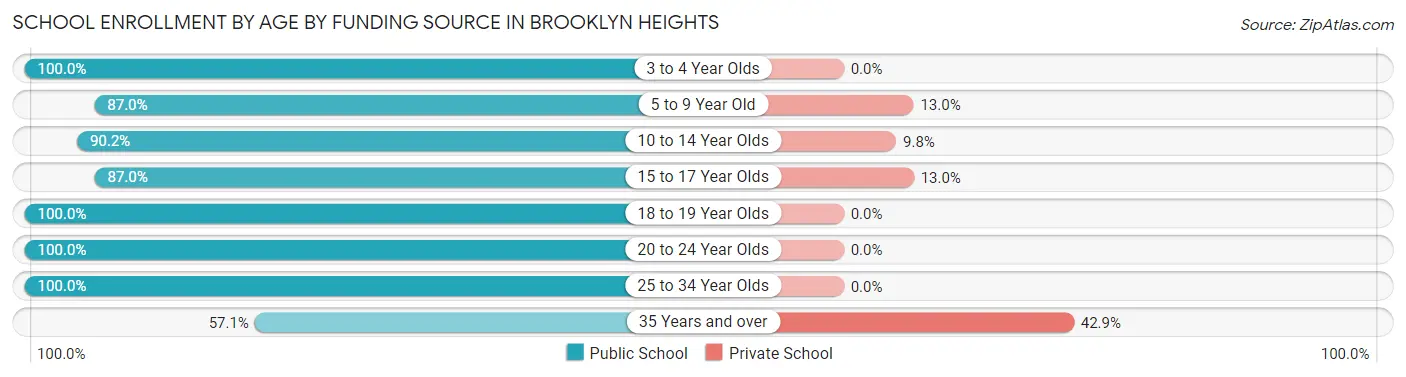
| Age Bracket | Public School | Private School |
| 3 to 4 Year Olds | 12 (100.0%) | 0 (0.0%) |
| 5 to 9 Year Old | 87 (87.0%) | 13 (13.0%) |
| 10 to 14 Year Olds | 111 (90.2%) | 12 (9.8%) |
| 15 to 17 Year Olds | 40 (87.0%) | 6 (13.0%) |
| 18 to 19 Year Olds | 19 (100.0%) | 0 (0.0%) |
| 20 to 24 Year Olds | 25 (100.0%) | 0 (0.0%) |
| 25 to 34 Year Olds | 8 (100.0%) | 0 (0.0%) |
| 35 Years and over | 8 (57.1%) | 6 (42.9%) |
| Total | 310 (89.3%) | 37 (10.7%) |
Educational Attainment by Field of Study in Brooklyn Heights
Business (112 | 32.0%), science & technology (52 | 14.9%), education (35 | 10.0%), communications (28 | 8.0%), and liberal arts & history (22 | 6.3%) are the most common fields of study among 350 individuals in Brooklyn Heights who have obtained a bachelor's degree or higher.
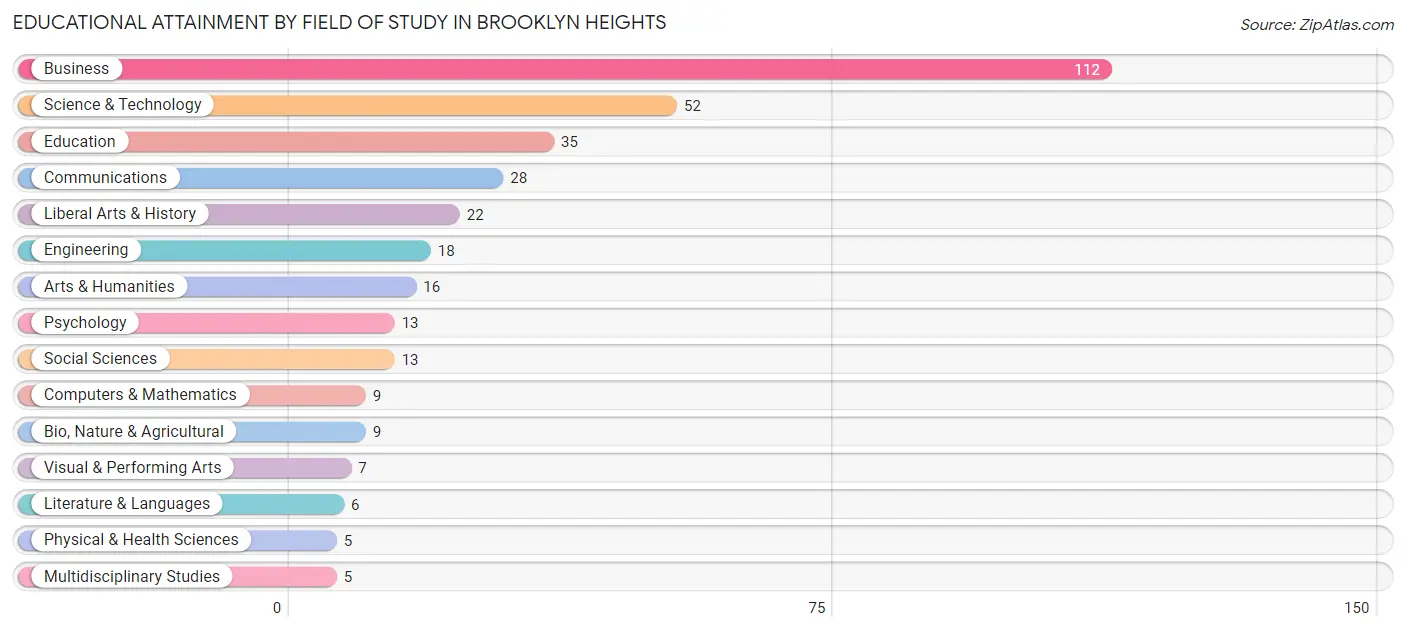
| Field of Study | # Graduates | % Graduates |
| Computers & Mathematics | 9 | 2.6% |
| Bio, Nature & Agricultural | 9 | 2.6% |
| Physical & Health Sciences | 5 | 1.4% |
| Psychology | 13 | 3.7% |
| Social Sciences | 13 | 3.7% |
| Engineering | 18 | 5.1% |
| Multidisciplinary Studies | 5 | 1.4% |
| Science & Technology | 52 | 14.9% |
| Business | 112 | 32.0% |
| Education | 35 | 10.0% |
| Literature & Languages | 6 | 1.7% |
| Liberal Arts & History | 22 | 6.3% |
| Visual & Performing Arts | 7 | 2.0% |
| Communications | 28 | 8.0% |
| Arts & Humanities | 16 | 4.6% |
| Total | 350 | 100.0% |
Transportation & Commute in Brooklyn Heights
Vehicle Availability by Sex in Brooklyn Heights
The most prevalent vehicle ownership categories in Brooklyn Heights are males with 2 vehicles (206, accounting for 55.8%) and females with 2 vehicles (152, making up 54.2%).
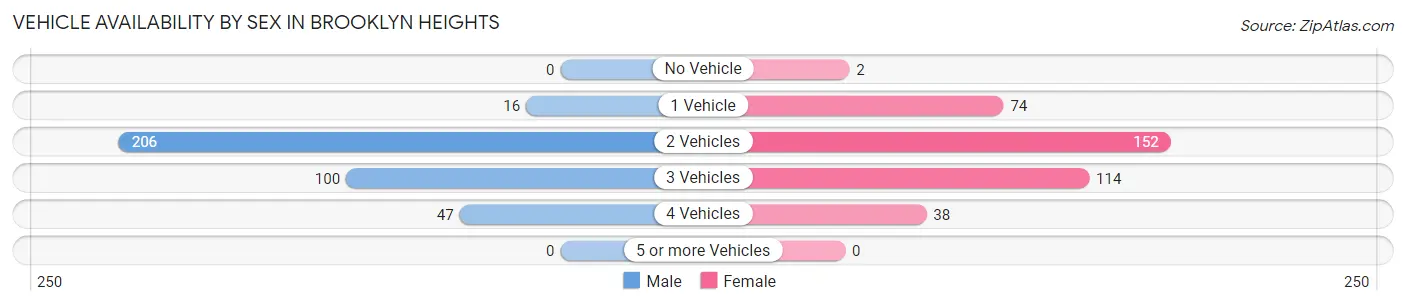
| Vehicles Available | Male | Female |
| No Vehicle | 0 (0.0%) | 2 (0.5%) |
| 1 Vehicle | 16 (4.3%) | 74 (19.5%) |
| 2 Vehicles | 206 (55.8%) | 152 (40.0%) |
| 3 Vehicles | 100 (27.1%) | 114 (30.0%) |
| 4 Vehicles | 47 (12.7%) | 38 (10.0%) |
| 5 or more Vehicles | 0 (0.0%) | 0 (0.0%) |
| Total | 369 (100.0%) | 380 (100.0%) |
Commute Time in Brooklyn Heights
The most frequently occuring commute durations in Brooklyn Heights are 20 to 24 minutes (122 commuters, 19.3%), 10 to 14 minutes (101 commuters, 16.0%), and 15 to 19 minutes (98 commuters, 15.5%).
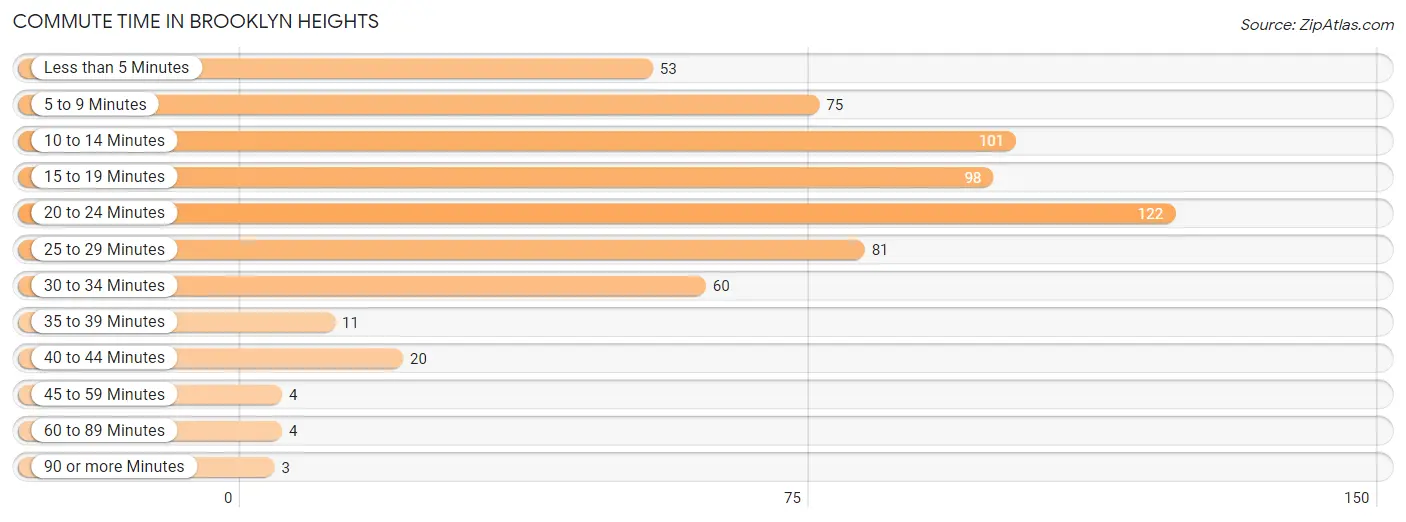
| Commute Time | # Commuters | % Commuters |
| Less than 5 Minutes | 53 | 8.4% |
| 5 to 9 Minutes | 75 | 11.9% |
| 10 to 14 Minutes | 101 | 16.0% |
| 15 to 19 Minutes | 98 | 15.5% |
| 20 to 24 Minutes | 122 | 19.3% |
| 25 to 29 Minutes | 81 | 12.8% |
| 30 to 34 Minutes | 60 | 9.5% |
| 35 to 39 Minutes | 11 | 1.7% |
| 40 to 44 Minutes | 20 | 3.2% |
| 45 to 59 Minutes | 4 | 0.6% |
| 60 to 89 Minutes | 4 | 0.6% |
| 90 or more Minutes | 3 | 0.5% |
Commute Time by Sex in Brooklyn Heights
The most common commute times in Brooklyn Heights are 20 to 24 minutes (68 commuters, 20.4%) for males and 15 to 19 minutes (68 commuters, 22.7%) for females.
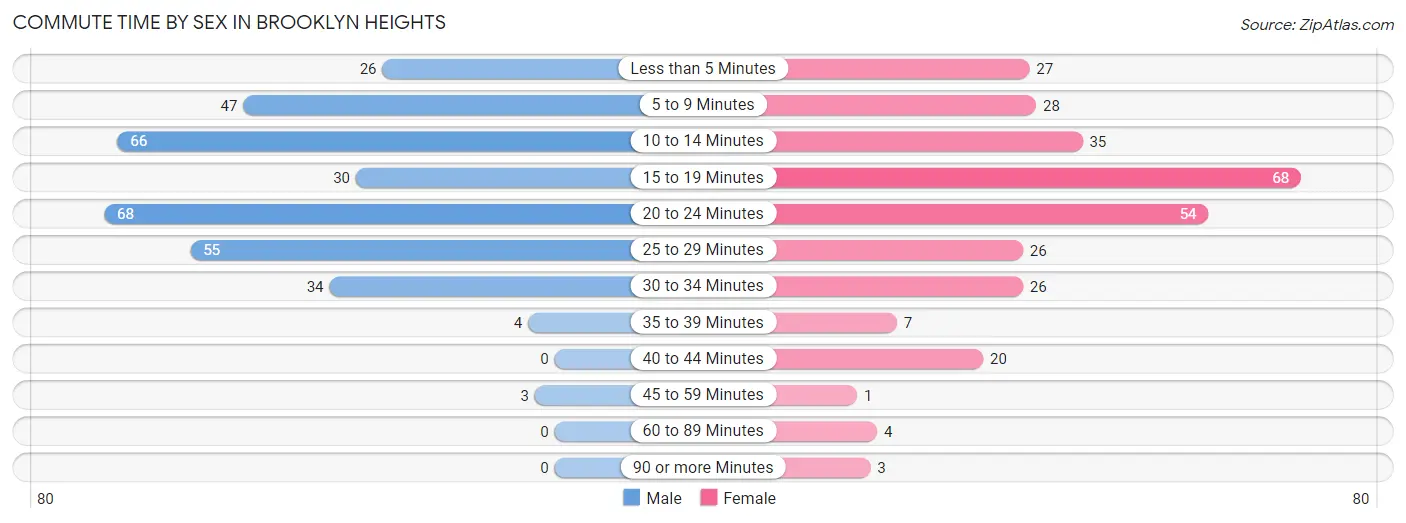
| Commute Time | Male | Female |
| Less than 5 Minutes | 26 (7.8%) | 27 (9.0%) |
| 5 to 9 Minutes | 47 (14.1%) | 28 (9.4%) |
| 10 to 14 Minutes | 66 (19.8%) | 35 (11.7%) |
| 15 to 19 Minutes | 30 (9.0%) | 68 (22.7%) |
| 20 to 24 Minutes | 68 (20.4%) | 54 (18.1%) |
| 25 to 29 Minutes | 55 (16.5%) | 26 (8.7%) |
| 30 to 34 Minutes | 34 (10.2%) | 26 (8.7%) |
| 35 to 39 Minutes | 4 (1.2%) | 7 (2.3%) |
| 40 to 44 Minutes | 0 (0.0%) | 20 (6.7%) |
| 45 to 59 Minutes | 3 (0.9%) | 1 (0.3%) |
| 60 to 89 Minutes | 0 (0.0%) | 4 (1.3%) |
| 90 or more Minutes | 0 (0.0%) | 3 (1.0%) |
Time of Departure to Work by Sex in Brooklyn Heights
The most frequent times of departure to work in Brooklyn Heights are 6:30 AM to 6:59 AM (52, 15.6%) for males and 8:00 AM to 8:29 AM (93, 31.1%) for females.
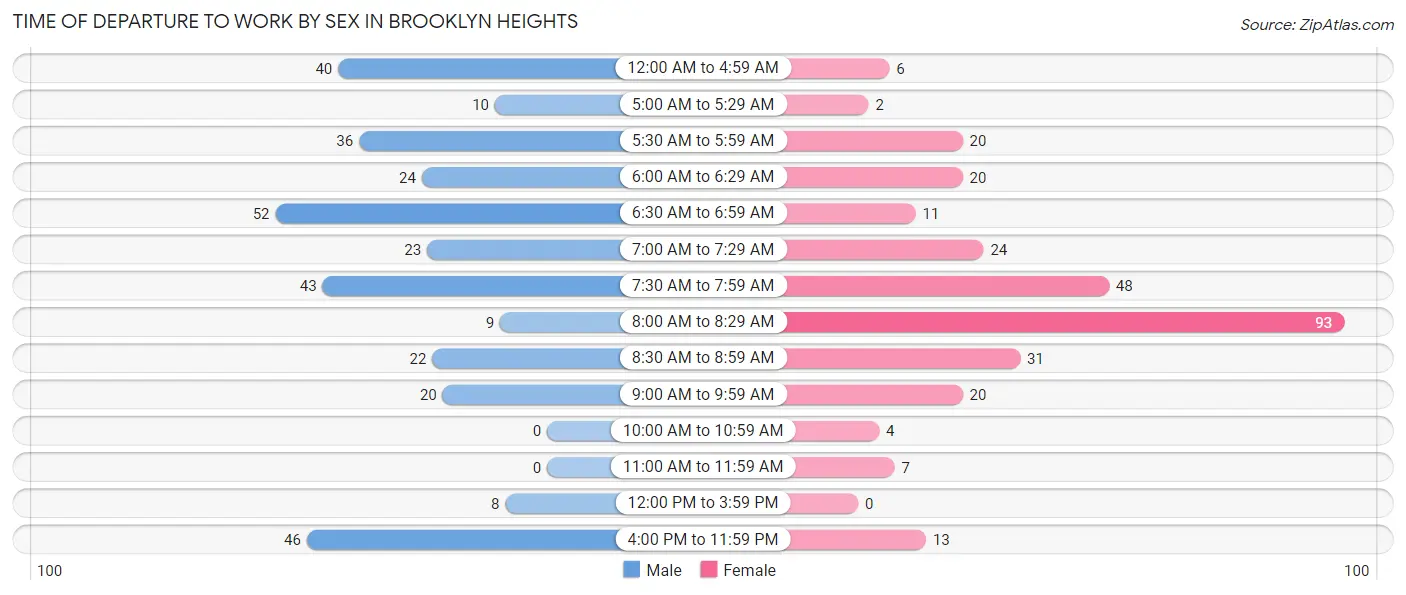
| Time of Departure | Male | Female |
| 12:00 AM to 4:59 AM | 40 (12.0%) | 6 (2.0%) |
| 5:00 AM to 5:29 AM | 10 (3.0%) | 2 (0.7%) |
| 5:30 AM to 5:59 AM | 36 (10.8%) | 20 (6.7%) |
| 6:00 AM to 6:29 AM | 24 (7.2%) | 20 (6.7%) |
| 6:30 AM to 6:59 AM | 52 (15.6%) | 11 (3.7%) |
| 7:00 AM to 7:29 AM | 23 (6.9%) | 24 (8.0%) |
| 7:30 AM to 7:59 AM | 43 (12.9%) | 48 (16.1%) |
| 8:00 AM to 8:29 AM | 9 (2.7%) | 93 (31.1%) |
| 8:30 AM to 8:59 AM | 22 (6.6%) | 31 (10.4%) |
| 9:00 AM to 9:59 AM | 20 (6.0%) | 20 (6.7%) |
| 10:00 AM to 10:59 AM | 0 (0.0%) | 4 (1.3%) |
| 11:00 AM to 11:59 AM | 0 (0.0%) | 7 (2.3%) |
| 12:00 PM to 3:59 PM | 8 (2.4%) | 0 (0.0%) |
| 4:00 PM to 11:59 PM | 46 (13.8%) | 13 (4.3%) |
| Total | 333 (100.0%) | 299 (100.0%) |
Housing Occupancy in Brooklyn Heights
Occupancy by Ownership in Brooklyn Heights
Of the total 575 dwellings in Brooklyn Heights, owner-occupied units account for 545 (94.8%), while renter-occupied units make up 30 (5.2%).
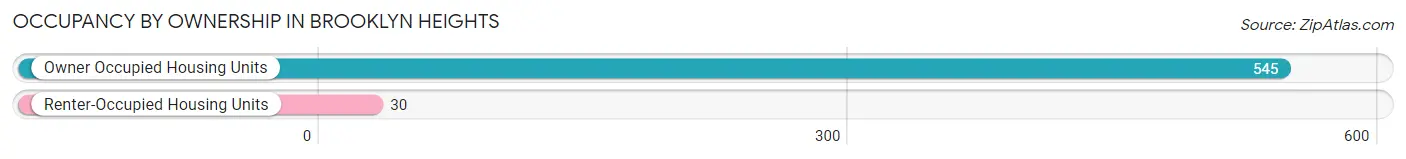
| Occupancy | # Housing Units | % Housing Units |
| Owner Occupied Housing Units | 545 | 94.8% |
| Renter-Occupied Housing Units | 30 | 5.2% |
| Total Occupied Housing Units | 575 | 100.0% |
Occupancy by Household Size in Brooklyn Heights
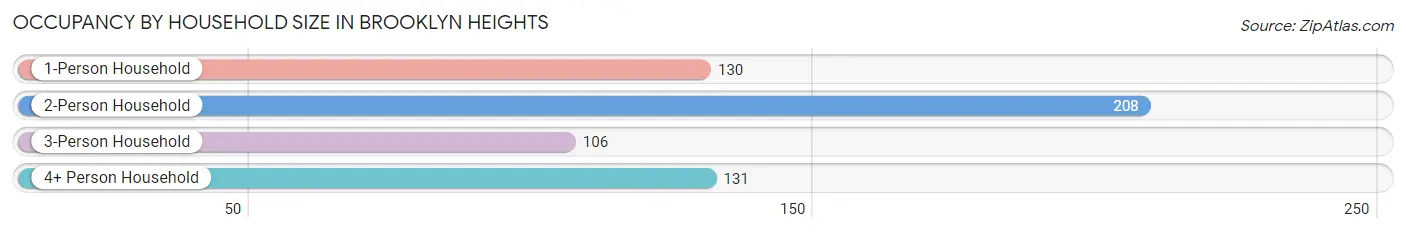
| Household Size | # Housing Units | % Housing Units |
| 1-Person Household | 130 | 22.6% |
| 2-Person Household | 208 | 36.2% |
| 3-Person Household | 106 | 18.4% |
| 4+ Person Household | 131 | 22.8% |
| Total Housing Units | 575 | 100.0% |
Occupancy by Ownership by Household Size in Brooklyn Heights
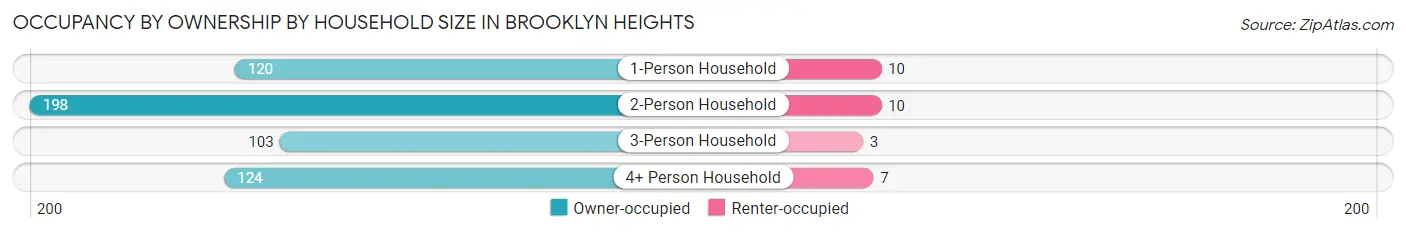
| Household Size | Owner-occupied | Renter-occupied |
| 1-Person Household | 120 (92.3%) | 10 (7.7%) |
| 2-Person Household | 198 (95.2%) | 10 (4.8%) |
| 3-Person Household | 103 (97.2%) | 3 (2.8%) |
| 4+ Person Household | 124 (94.7%) | 7 (5.3%) |
| Total Housing Units | 545 (94.8%) | 30 (5.2%) |
Occupancy by Educational Attainment in Brooklyn Heights
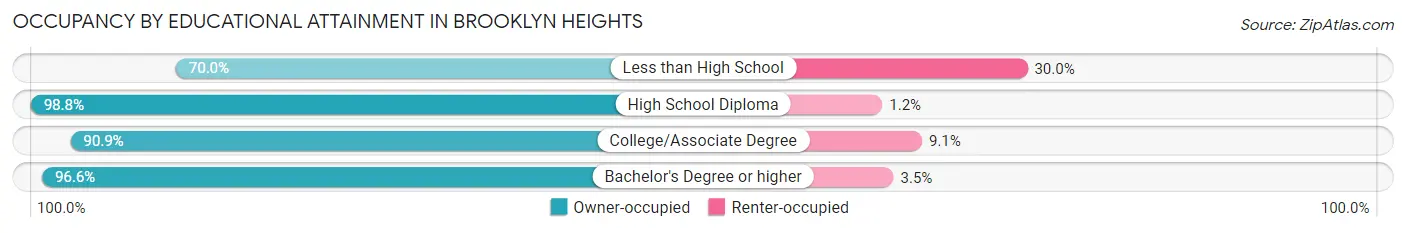
| Household Size | Owner-occupied | Renter-occupied |
| Less than High School | 7 (70.0%) | 3 (30.0%) |
| High School Diploma | 162 (98.8%) | 2 (1.2%) |
| College/Associate Degree | 180 (90.9%) | 18 (9.1%) |
| Bachelor's Degree or higher | 196 (96.6%) | 7 (3.5%) |
Occupancy by Age of Householder in Brooklyn Heights
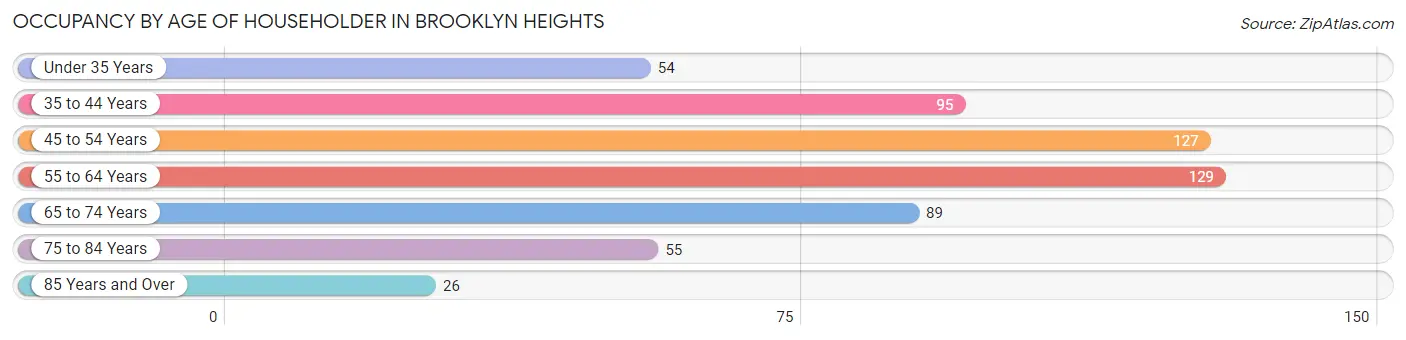
| Age Bracket | # Households | % Households |
| Under 35 Years | 54 | 9.4% |
| 35 to 44 Years | 95 | 16.5% |
| 45 to 54 Years | 127 | 22.1% |
| 55 to 64 Years | 129 | 22.4% |
| 65 to 74 Years | 89 | 15.5% |
| 75 to 84 Years | 55 | 9.6% |
| 85 Years and Over | 26 | 4.5% |
| Total | 575 | 100.0% |
Housing Finances in Brooklyn Heights
Median Income by Occupancy in Brooklyn Heights
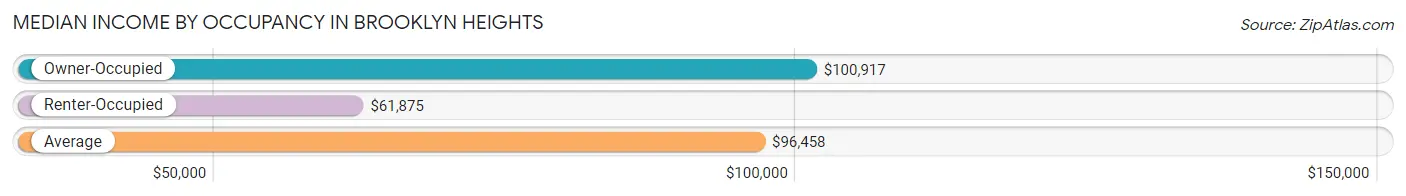
| Occupancy Type | # Households | Median Income |
| Owner-Occupied | 545 (94.8%) | $100,917 |
| Renter-Occupied | 30 (5.2%) | $61,875 |
| Average | 575 (100.0%) | $96,458 |
Occupancy by Householder Income Bracket in Brooklyn Heights
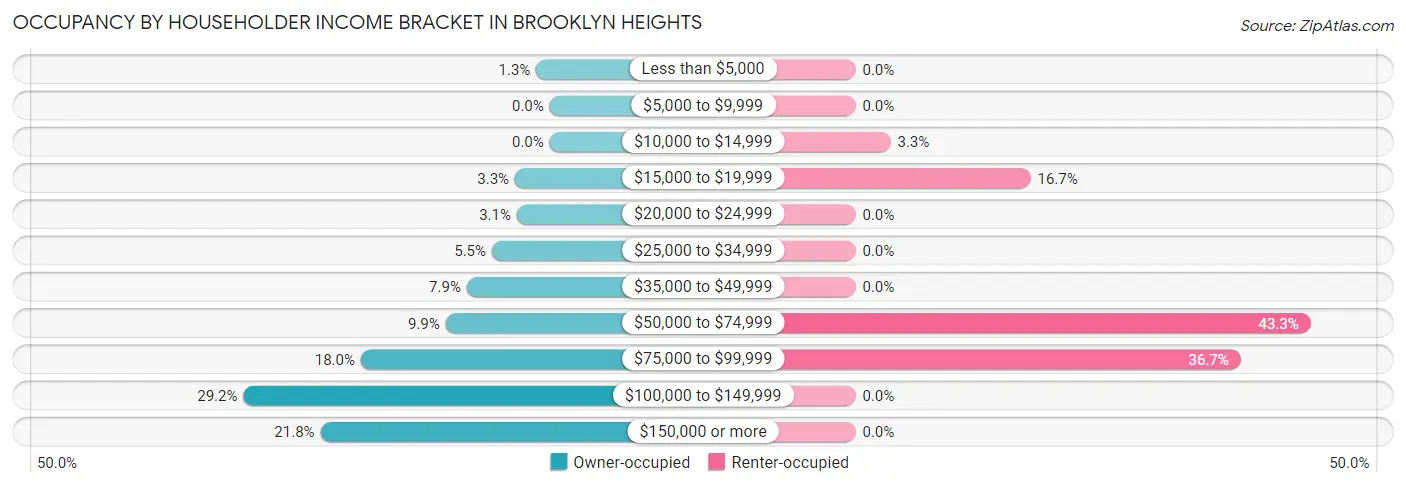
| Income Bracket | Owner-occupied | Renter-occupied |
| Less than $5,000 | 7 (1.3%) | 0 (0.0%) |
| $5,000 to $9,999 | 0 (0.0%) | 0 (0.0%) |
| $10,000 to $14,999 | 0 (0.0%) | 1 (3.3%) |
| $15,000 to $19,999 | 18 (3.3%) | 5 (16.7%) |
| $20,000 to $24,999 | 17 (3.1%) | 0 (0.0%) |
| $25,000 to $34,999 | 30 (5.5%) | 0 (0.0%) |
| $35,000 to $49,999 | 43 (7.9%) | 0 (0.0%) |
| $50,000 to $74,999 | 54 (9.9%) | 13 (43.3%) |
| $75,000 to $99,999 | 98 (18.0%) | 11 (36.7%) |
| $100,000 to $149,999 | 159 (29.2%) | 0 (0.0%) |
| $150,000 or more | 119 (21.8%) | 0 (0.0%) |
| Total | 545 (100.0%) | 30 (100.0%) |
Monthly Housing Cost Tiers in Brooklyn Heights
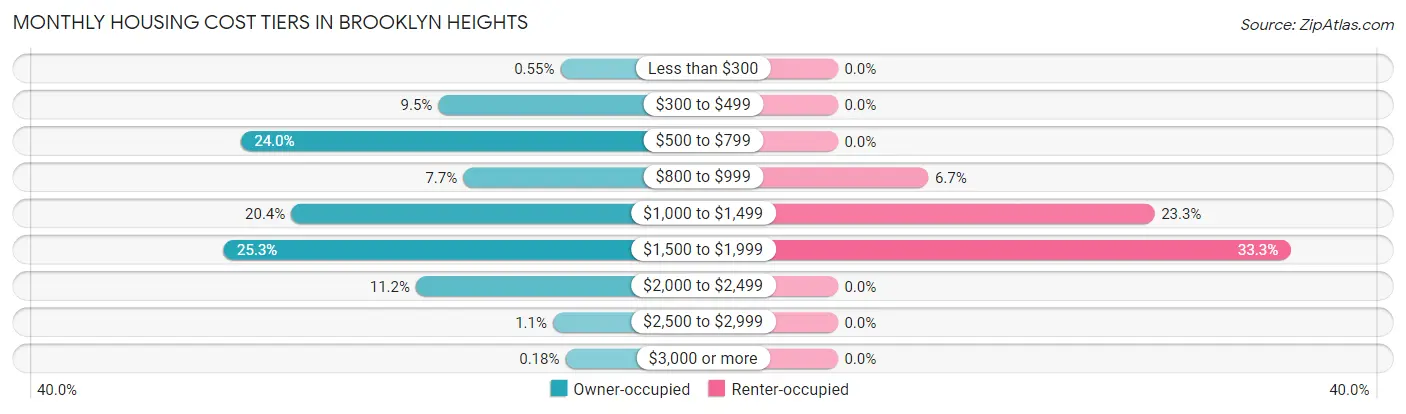
| Monthly Cost | Owner-occupied | Renter-occupied |
| Less than $300 | 3 (0.5%) | 0 (0.0%) |
| $300 to $499 | 52 (9.5%) | 0 (0.0%) |
| $500 to $799 | 131 (24.0%) | 0 (0.0%) |
| $800 to $999 | 42 (7.7%) | 2 (6.7%) |
| $1,000 to $1,499 | 111 (20.4%) | 7 (23.3%) |
| $1,500 to $1,999 | 138 (25.3%) | 10 (33.3%) |
| $2,000 to $2,499 | 61 (11.2%) | 0 (0.0%) |
| $2,500 to $2,999 | 6 (1.1%) | 0 (0.0%) |
| $3,000 or more | 1 (0.2%) | 0 (0.0%) |
| Total | 545 (100.0%) | 30 (100.0%) |
Physical Housing Characteristics in Brooklyn Heights
Housing Structures in Brooklyn Heights
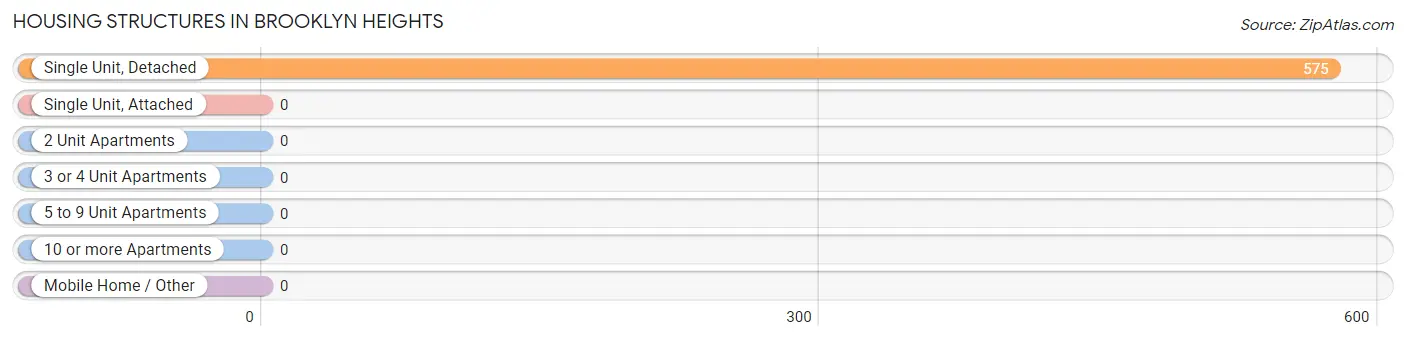
| Structure Type | # Housing Units | % Housing Units |
| Single Unit, Detached | 575 | 100.0% |
| Single Unit, Attached | 0 | 0.0% |
| 2 Unit Apartments | 0 | 0.0% |
| 3 or 4 Unit Apartments | 0 | 0.0% |
| 5 to 9 Unit Apartments | 0 | 0.0% |
| 10 or more Apartments | 0 | 0.0% |
| Mobile Home / Other | 0 | 0.0% |
| Total | 575 | 100.0% |
Housing Structures by Occupancy in Brooklyn Heights
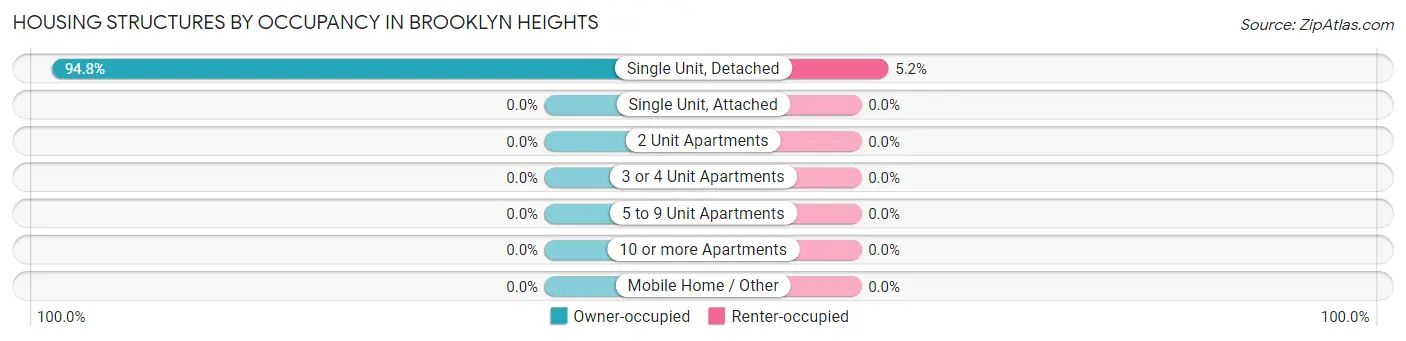
| Structure Type | Owner-occupied | Renter-occupied |
| Single Unit, Detached | 545 (94.8%) | 30 (5.2%) |
| Single Unit, Attached | 0 (0.0%) | 0 (0.0%) |
| 2 Unit Apartments | 0 (0.0%) | 0 (0.0%) |
| 3 or 4 Unit Apartments | 0 (0.0%) | 0 (0.0%) |
| 5 to 9 Unit Apartments | 0 (0.0%) | 0 (0.0%) |
| 10 or more Apartments | 0 (0.0%) | 0 (0.0%) |
| Mobile Home / Other | 0 (0.0%) | 0 (0.0%) |
| Total | 545 (94.8%) | 30 (5.2%) |
Housing Structures by Number of Rooms in Brooklyn Heights
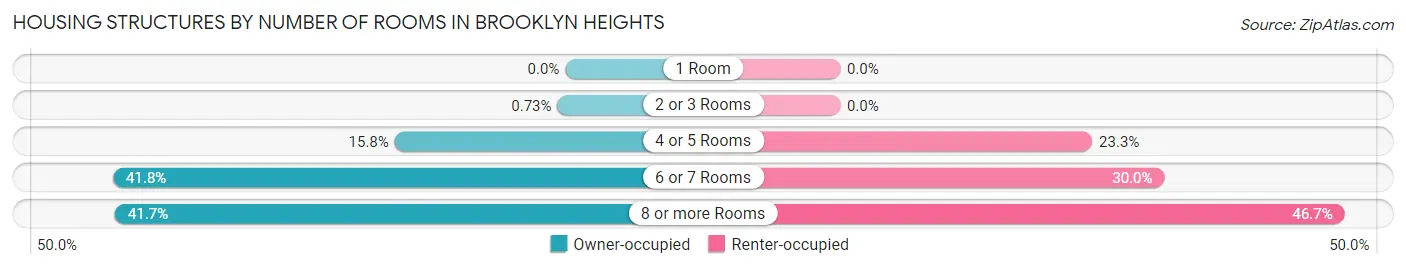
| Number of Rooms | Owner-occupied | Renter-occupied |
| 1 Room | 0 (0.0%) | 0 (0.0%) |
| 2 or 3 Rooms | 4 (0.7%) | 0 (0.0%) |
| 4 or 5 Rooms | 86 (15.8%) | 7 (23.3%) |
| 6 or 7 Rooms | 228 (41.8%) | 9 (30.0%) |
| 8 or more Rooms | 227 (41.6%) | 14 (46.7%) |
| Total | 545 (100.0%) | 30 (100.0%) |
Housing Structure by Heating Type in Brooklyn Heights
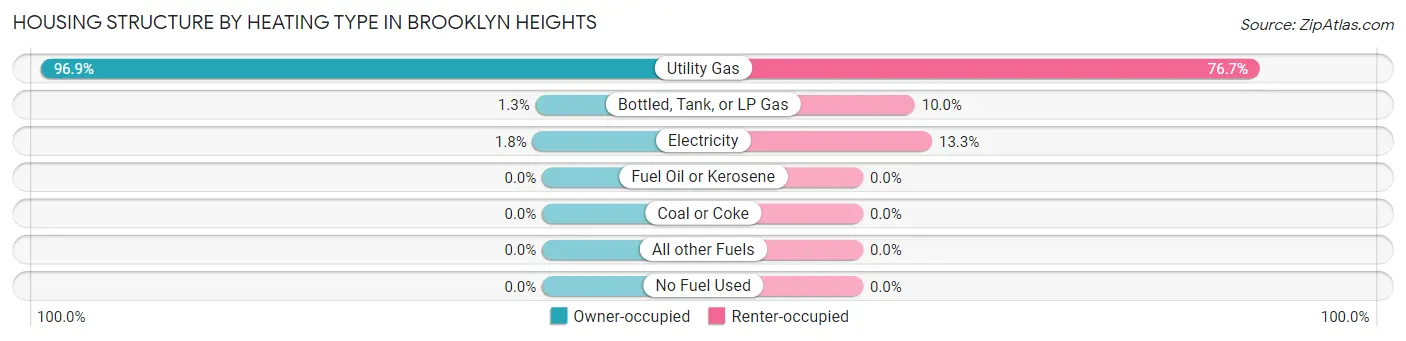
| Heating Type | Owner-occupied | Renter-occupied |
| Utility Gas | 528 (96.9%) | 23 (76.7%) |
| Bottled, Tank, or LP Gas | 7 (1.3%) | 3 (10.0%) |
| Electricity | 10 (1.8%) | 4 (13.3%) |
| Fuel Oil or Kerosene | 0 (0.0%) | 0 (0.0%) |
| Coal or Coke | 0 (0.0%) | 0 (0.0%) |
| All other Fuels | 0 (0.0%) | 0 (0.0%) |
| No Fuel Used | 0 (0.0%) | 0 (0.0%) |
| Total | 545 (100.0%) | 30 (100.0%) |
Household Vehicle Usage in Brooklyn Heights
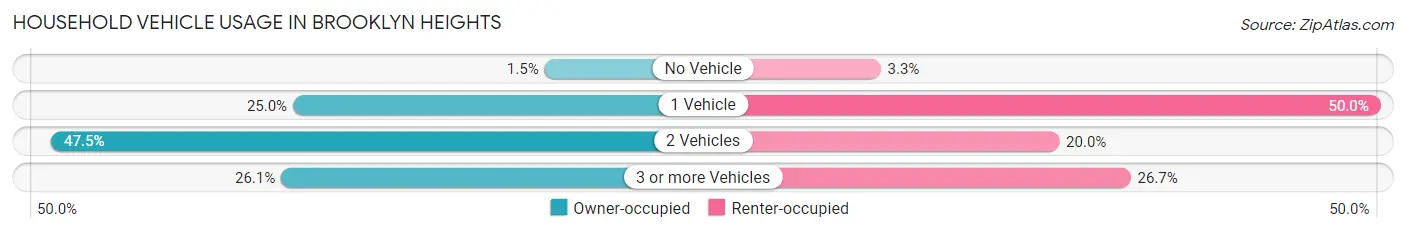
| Vehicles per Household | Owner-occupied | Renter-occupied |
| No Vehicle | 8 (1.5%) | 1 (3.3%) |
| 1 Vehicle | 136 (24.9%) | 15 (50.0%) |
| 2 Vehicles | 259 (47.5%) | 6 (20.0%) |
| 3 or more Vehicles | 142 (26.1%) | 8 (26.7%) |
| Total | 545 (100.0%) | 30 (100.0%) |
Real Estate & Mortgages in Brooklyn Heights
Real Estate and Mortgage Overview in Brooklyn Heights
| Characteristic | Without Mortgage | With Mortgage |
| Housing Units | 184 | 361 |
| Median Property Value | $213,000 | $217,300 |
| Median Household Income | $69,375 | $79 |
| Monthly Housing Costs | $607 | $1 |
| Real Estate Taxes | $3,352 | $12 |
Property Value by Mortgage Status in Brooklyn Heights
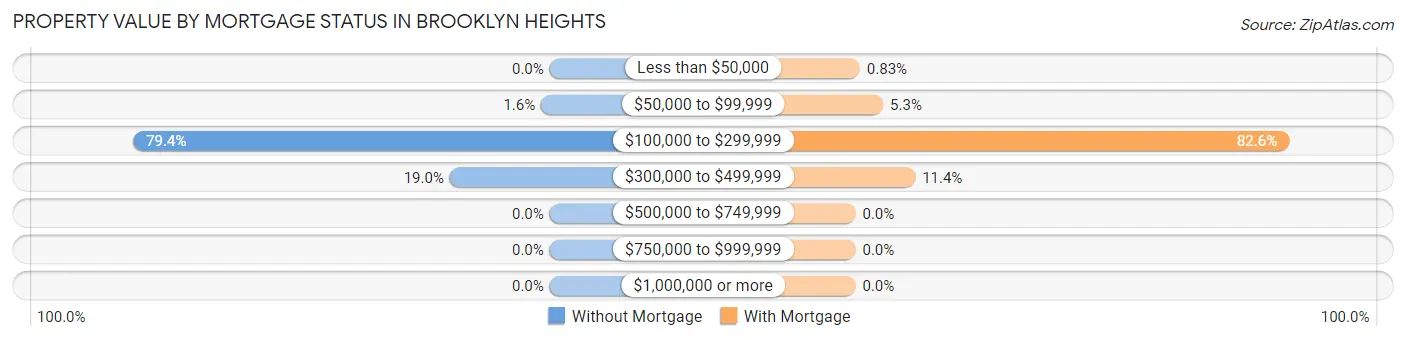
| Property Value | Without Mortgage | With Mortgage |
| Less than $50,000 | 0 (0.0%) | 3 (0.8%) |
| $50,000 to $99,999 | 3 (1.6%) | 19 (5.3%) |
| $100,000 to $299,999 | 146 (79.3%) | 298 (82.6%) |
| $300,000 to $499,999 | 35 (19.0%) | 41 (11.4%) |
| $500,000 to $749,999 | 0 (0.0%) | 0 (0.0%) |
| $750,000 to $999,999 | 0 (0.0%) | 0 (0.0%) |
| $1,000,000 or more | 0 (0.0%) | 0 (0.0%) |
| Total | 184 (100.0%) | 361 (100.0%) |
Household Income by Mortgage Status in Brooklyn Heights
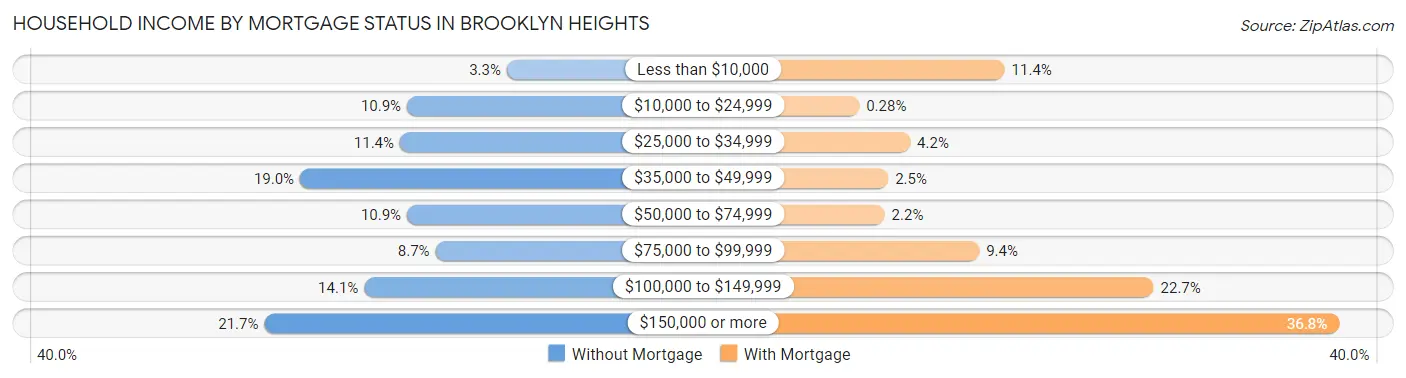
| Household Income | Without Mortgage | With Mortgage |
| Less than $10,000 | 6 (3.3%) | 41 (11.4%) |
| $10,000 to $24,999 | 20 (10.9%) | 1 (0.3%) |
| $25,000 to $34,999 | 21 (11.4%) | 15 (4.2%) |
| $35,000 to $49,999 | 35 (19.0%) | 9 (2.5%) |
| $50,000 to $74,999 | 20 (10.9%) | 8 (2.2%) |
| $75,000 to $99,999 | 16 (8.7%) | 34 (9.4%) |
| $100,000 to $149,999 | 26 (14.1%) | 82 (22.7%) |
| $150,000 or more | 40 (21.7%) | 133 (36.8%) |
| Total | 184 (100.0%) | 361 (100.0%) |
Property Value to Household Income Ratio in Brooklyn Heights
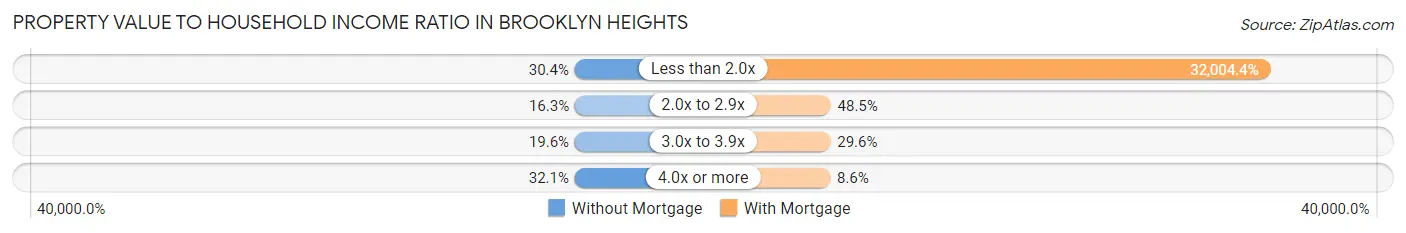
| Value-to-Income Ratio | Without Mortgage | With Mortgage |
| Less than 2.0x | 56 (30.4%) | 115,536 (32,004.4%) |
| 2.0x to 2.9x | 30 (16.3%) | 175 (48.5%) |
| 3.0x to 3.9x | 36 (19.6%) | 107 (29.6%) |
| 4.0x or more | 59 (32.1%) | 31 (8.6%) |
| Total | 184 (100.0%) | 361 (100.0%) |
Real Estate Taxes by Mortgage Status in Brooklyn Heights
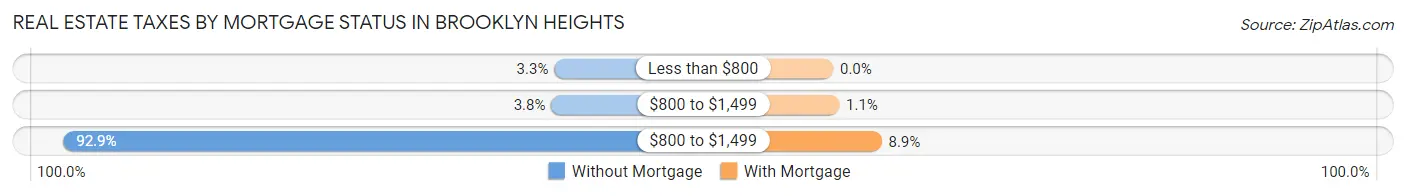
| Property Taxes | Without Mortgage | With Mortgage |
| Less than $800 | 6 (3.3%) | 0 (0.0%) |
| $800 to $1,499 | 7 (3.8%) | 4 (1.1%) |
| $800 to $1,499 | 171 (92.9%) | 32 (8.9%) |
| Total | 184 (100.0%) | 361 (100.0%) |
Health & Disability in Brooklyn Heights
Health Insurance Coverage by Age in Brooklyn Heights
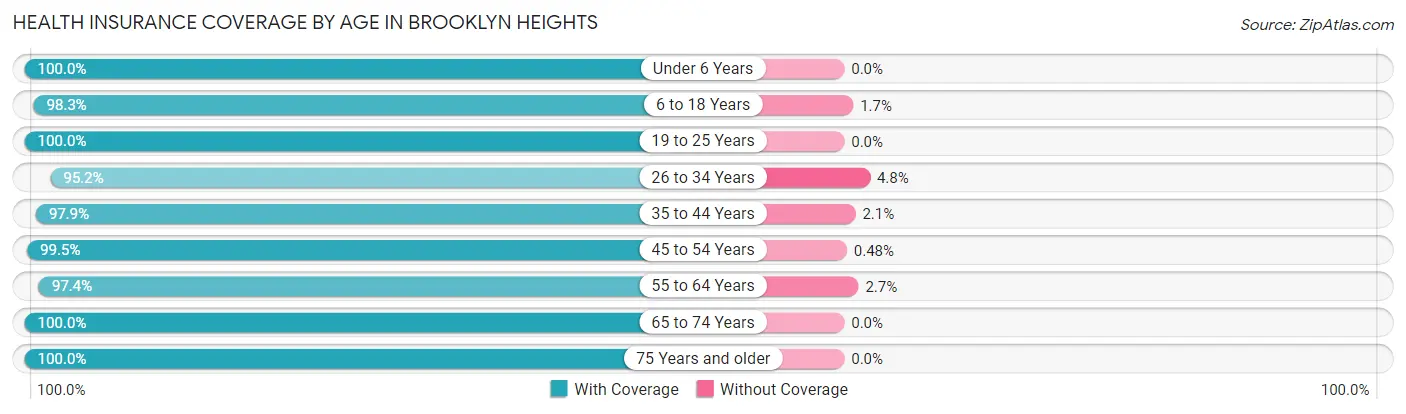
| Age Bracket | With Coverage | Without Coverage |
| Under 6 Years | 97 (100.0%) | 0 (0.0%) |
| 6 to 18 Years | 296 (98.3%) | 5 (1.7%) |
| 19 to 25 Years | 47 (100.0%) | 0 (0.0%) |
| 26 to 34 Years | 139 (95.2%) | 7 (4.8%) |
| 35 to 44 Years | 187 (97.9%) | 4 (2.1%) |
| 45 to 54 Years | 207 (99.5%) | 1 (0.5%) |
| 55 to 64 Years | 220 (97.4%) | 6 (2.6%) |
| 65 to 74 Years | 145 (100.0%) | 0 (0.0%) |
| 75 Years and older | 139 (100.0%) | 0 (0.0%) |
| Total | 1,477 (98.5%) | 23 (1.5%) |
Health Insurance Coverage by Citizenship Status in Brooklyn Heights
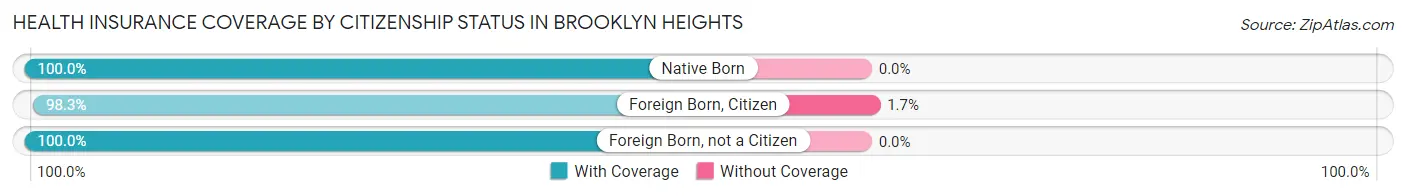
| Citizenship Status | With Coverage | Without Coverage |
| Native Born | 97 (100.0%) | 0 (0.0%) |
| Foreign Born, Citizen | 296 (98.3%) | 5 (1.7%) |
| Foreign Born, not a Citizen | 47 (100.0%) | 0 (0.0%) |
Health Insurance Coverage by Household Income in Brooklyn Heights
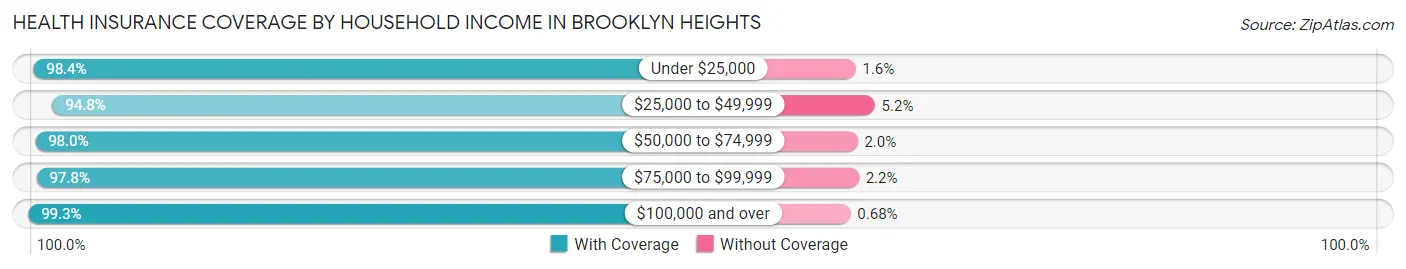
| Household Income | With Coverage | Without Coverage |
| Under $25,000 | 60 (98.4%) | 1 (1.6%) |
| $25,000 to $49,999 | 127 (94.8%) | 7 (5.2%) |
| $50,000 to $74,999 | 147 (98.0%) | 3 (2.0%) |
| $75,000 to $99,999 | 263 (97.8%) | 6 (2.2%) |
| $100,000 and over | 871 (99.3%) | 6 (0.7%) |
Public vs Private Health Insurance Coverage by Age in Brooklyn Heights
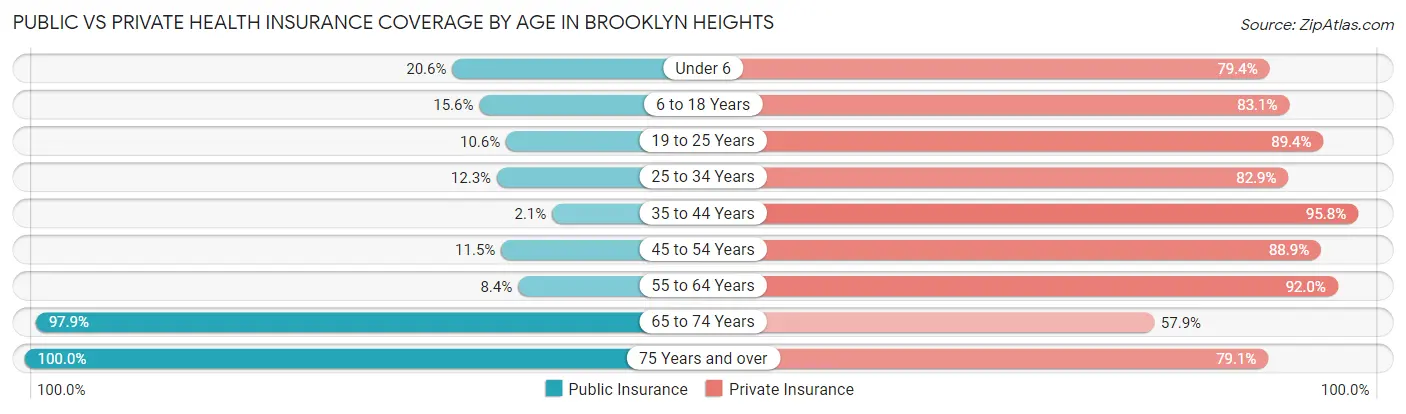
| Age Bracket | Public Insurance | Private Insurance |
| Under 6 | 20 (20.6%) | 77 (79.4%) |
| 6 to 18 Years | 47 (15.6%) | 250 (83.1%) |
| 19 to 25 Years | 5 (10.6%) | 42 (89.4%) |
| 25 to 34 Years | 18 (12.3%) | 121 (82.9%) |
| 35 to 44 Years | 4 (2.1%) | 183 (95.8%) |
| 45 to 54 Years | 24 (11.5%) | 185 (88.9%) |
| 55 to 64 Years | 19 (8.4%) | 208 (92.0%) |
| 65 to 74 Years | 142 (97.9%) | 84 (57.9%) |
| 75 Years and over | 139 (100.0%) | 110 (79.1%) |
| Total | 418 (27.9%) | 1,260 (84.0%) |
Disability Status by Sex by Age in Brooklyn Heights
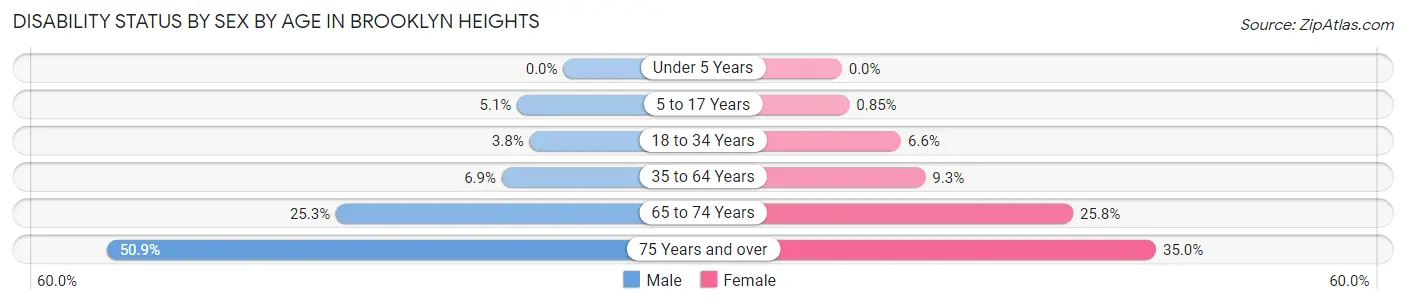
| Age Bracket | Male | Female |
| Under 5 Years | 0 (0.0%) | 0 (0.0%) |
| 5 to 17 Years | 9 (5.1%) | 1 (0.9%) |
| 18 to 34 Years | 4 (3.8%) | 7 (6.6%) |
| 35 to 64 Years | 20 (6.9%) | 31 (9.3%) |
| 65 to 74 Years | 20 (25.3%) | 17 (25.8%) |
| 75 Years and over | 30 (50.8%) | 28 (35.0%) |
Disability Class by Sex by Age in Brooklyn Heights
Disability Class: Hearing Difficulty
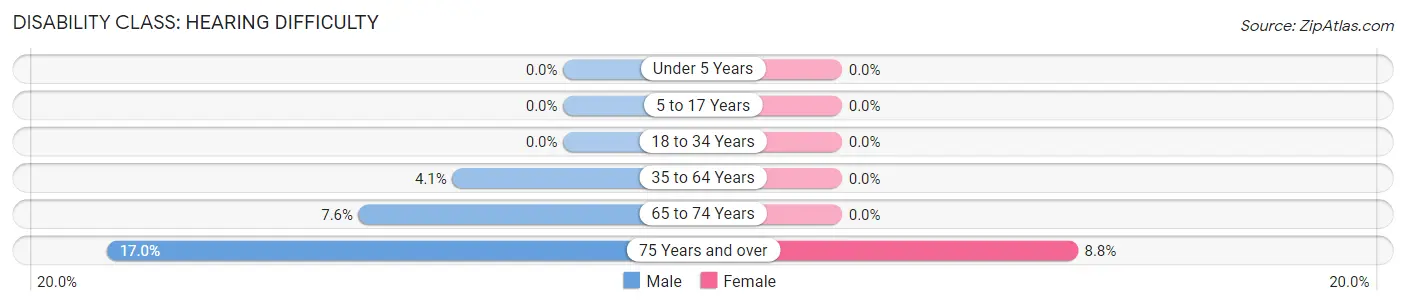
| Age Bracket | Male | Female |
| Under 5 Years | 0 (0.0%) | 0 (0.0%) |
| 5 to 17 Years | 0 (0.0%) | 0 (0.0%) |
| 18 to 34 Years | 0 (0.0%) | 0 (0.0%) |
| 35 to 64 Years | 12 (4.1%) | 0 (0.0%) |
| 65 to 74 Years | 6 (7.6%) | 0 (0.0%) |
| 75 Years and over | 10 (17.0%) | 7 (8.7%) |
Disability Class: Vision Difficulty
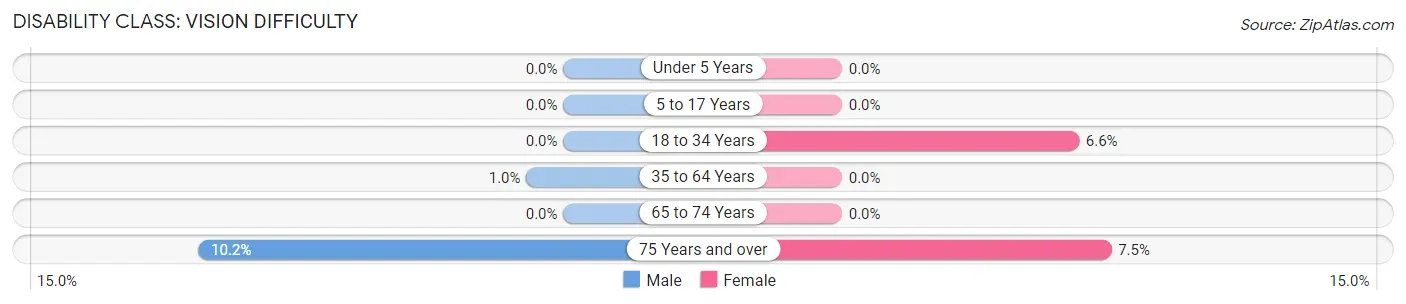
| Age Bracket | Male | Female |
| Under 5 Years | 0 (0.0%) | 0 (0.0%) |
| 5 to 17 Years | 0 (0.0%) | 0 (0.0%) |
| 18 to 34 Years | 0 (0.0%) | 7 (6.6%) |
| 35 to 64 Years | 3 (1.0%) | 0 (0.0%) |
| 65 to 74 Years | 0 (0.0%) | 0 (0.0%) |
| 75 Years and over | 6 (10.2%) | 6 (7.5%) |
Disability Class: Cognitive Difficulty
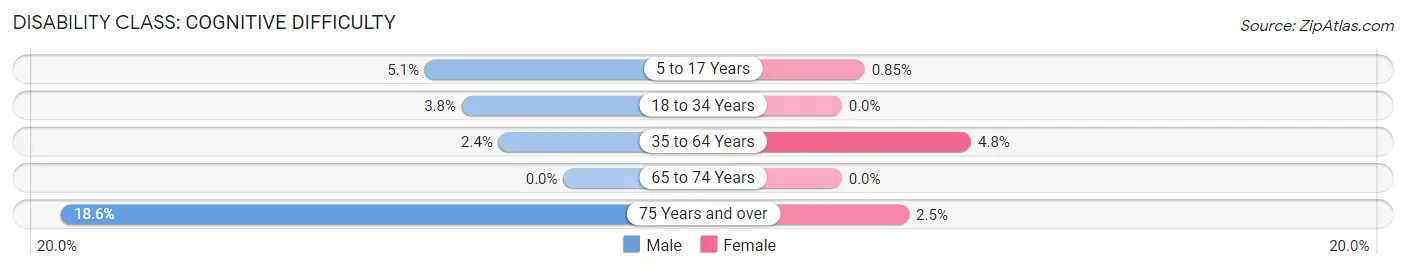
| Age Bracket | Male | Female |
| 5 to 17 Years | 9 (5.1%) | 1 (0.9%) |
| 18 to 34 Years | 4 (3.8%) | 0 (0.0%) |
| 35 to 64 Years | 7 (2.4%) | 16 (4.8%) |
| 65 to 74 Years | 0 (0.0%) | 0 (0.0%) |
| 75 Years and over | 11 (18.6%) | 2 (2.5%) |
Disability Class: Ambulatory Difficulty
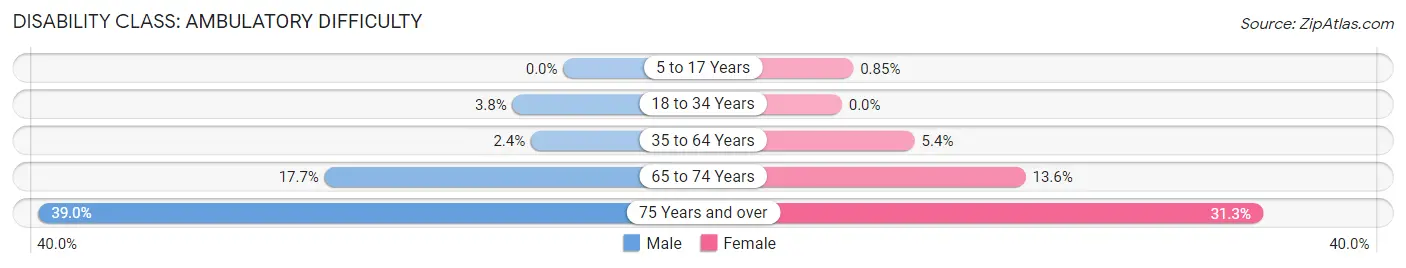
| Age Bracket | Male | Female |
| 5 to 17 Years | 0 (0.0%) | 1 (0.9%) |
| 18 to 34 Years | 4 (3.8%) | 0 (0.0%) |
| 35 to 64 Years | 7 (2.4%) | 18 (5.4%) |
| 65 to 74 Years | 14 (17.7%) | 9 (13.6%) |
| 75 Years and over | 23 (39.0%) | 25 (31.2%) |
Disability Class: Self-Care Difficulty
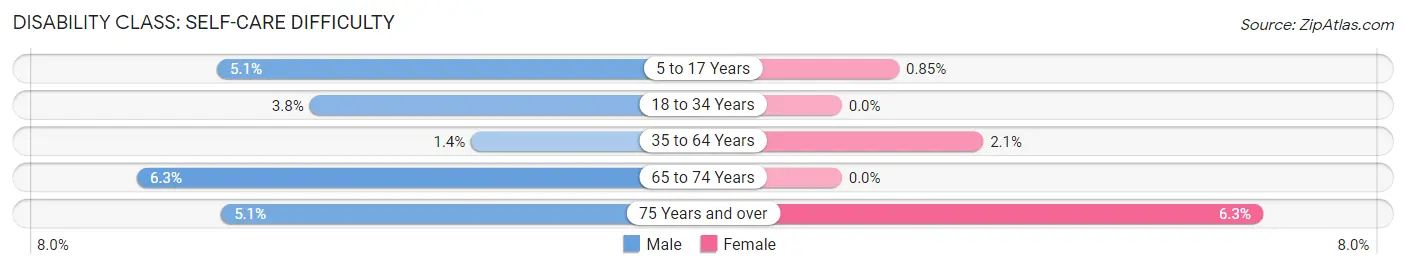
| Age Bracket | Male | Female |
| 5 to 17 Years | 9 (5.1%) | 1 (0.9%) |
| 18 to 34 Years | 4 (3.8%) | 0 (0.0%) |
| 35 to 64 Years | 4 (1.4%) | 7 (2.1%) |
| 65 to 74 Years | 5 (6.3%) | 0 (0.0%) |
| 75 Years and over | 3 (5.1%) | 5 (6.2%) |
Technology Access in Brooklyn Heights
Computing Device Access in Brooklyn Heights
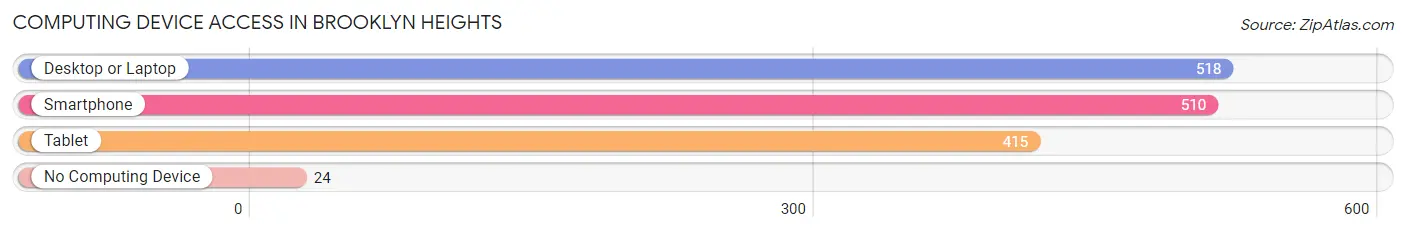
| Device Type | # Households | % Households |
| Desktop or Laptop | 518 | 90.1% |
| Smartphone | 510 | 88.7% |
| Tablet | 415 | 72.2% |
| No Computing Device | 24 | 4.2% |
| Total | 575 | 100.0% |
Internet Access in Brooklyn Heights
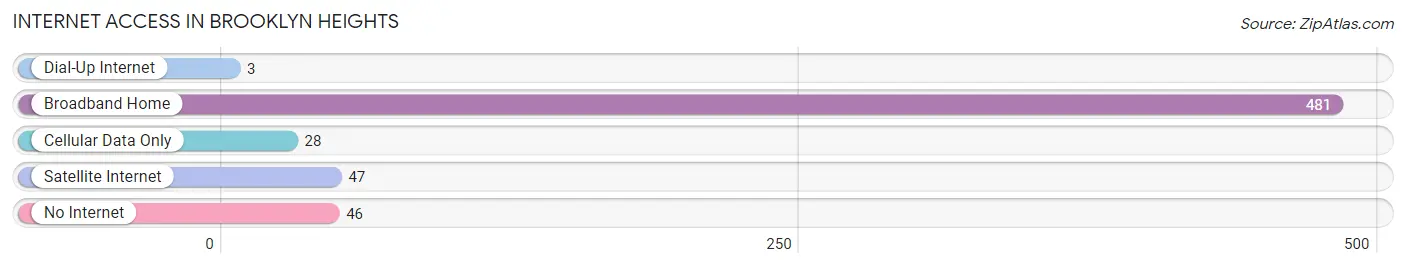
| Internet Type | # Households | % Households |
| Dial-Up Internet | 3 | 0.5% |
| Broadband Home | 481 | 83.7% |
| Cellular Data Only | 28 | 4.9% |
| Satellite Internet | 47 | 8.2% |
| No Internet | 46 | 8.0% |
| Total | 575 | 100.0% |
Brooklyn Heights Summary
Brooklyn Heights is a small village located in Cuyahoga County, Ohio. It is situated on the east side of Cleveland, Ohio, and is part of the Greater Cleveland metropolitan area. The village has a population of approximately 2,000 people, and is a part of the Cleveland-Elyria-Mentor Metropolitan Statistical Area.
History
Brooklyn Heights was founded in 1836 by a group of settlers from Connecticut. The village was originally known as "New Connecticut," and was later renamed Brooklyn Heights in 1845. The village was incorporated in 1867.
Brooklyn Heights was a small farming community until the late 19th century, when it began to experience rapid growth due to the development of the Cleveland and Mahoning Railroad. The railroad connected the village to Cleveland, and allowed for the transportation of goods and services. This led to the development of several factories and businesses in the area, which helped to spur the growth of the village.
Geography
Brooklyn Heights is located in Cuyahoga County, Ohio, and is situated on the east side of Cleveland. The village is bordered by the cities of Cleveland Heights, Euclid, and Garfield Heights. The village is located on the Cuyahoga River, and is approximately 8 miles from downtown Cleveland.
The village has a total area of 1.2 square miles, all of which is land. The terrain of the village is mostly flat, with some rolling hills. The village is located in the Great Lakes region, and is part of the humid continental climate zone.
Economy
The economy of Brooklyn Heights is largely based on manufacturing and retail. The village is home to several factories and businesses, including a steel mill, a paper mill, and a plastics factory. The village also has several retail stores, including a grocery store, a hardware store, and a pharmacy.
The village is also home to several small businesses, including restaurants, bars, and other service-oriented businesses. The village is also home to several medical facilities, including a hospital and several clinics.
Demographics
As of the 2010 census, the population of Brooklyn Heights was 2,000. The racial makeup of the village was 94.2% White, 2.2% African American, 0.7% Asian, 0.3% Native American, and 2.6% from other races. The median household income in the village was $45,000, and the median family income was $50,000.
The village has a high rate of homeownership, with approximately 75% of the population owning their own homes. The village also has a high rate of educational attainment, with approximately 90% of the population having at least a high school diploma.
Conclusion
Brooklyn Heights is a small village located in Cuyahoga County, Ohio. It is situated on the east side of Cleveland, and is part of the Greater Cleveland metropolitan area. The village has a population of approximately 2,000 people, and is a part of the Cleveland-Elyria-Mentor Metropolitan Statistical Area. The village has a largely manufacturing and retail-based economy, and has a high rate of homeownership and educational attainment.
Common Questions
What is Per Capita Income in Brooklyn Heights?
Per Capita income in Brooklyn Heights is $41,463.
What is the Median Family Income in Brooklyn Heights?
Median Family Income in Brooklyn Heights is $103,274.
What is the Median Household income in Brooklyn Heights?
Median Household Income in Brooklyn Heights is $96,458.
What is Income or Wage Gap in Brooklyn Heights?
Income or Wage Gap in Brooklyn Heights is 31.2%.
Women in Brooklyn Heights earn 68.8 cents for every dollar earned by a man.
What is Inequality or Gini Index in Brooklyn Heights?
Inequality or Gini Index in Brooklyn Heights is 0.33.
What is the Total Population of Brooklyn Heights?
Total Population of Brooklyn Heights is 1,500.
What is the Total Male Population of Brooklyn Heights?
Total Male Population of Brooklyn Heights is 731.
What is the Total Female Population of Brooklyn Heights?
Total Female Population of Brooklyn Heights is 769.
What is the Ratio of Males per 100 Females in Brooklyn Heights?
There are 95.06 Males per 100 Females in Brooklyn Heights.
What is the Ratio of Females per 100 Males in Brooklyn Heights?
There are 105.20 Females per 100 Males in Brooklyn Heights.
What is the Median Population Age in Brooklyn Heights?
Median Population Age in Brooklyn Heights is 43.9 Years.
What is the Average Family Size in Brooklyn Heights
Average Family Size in Brooklyn Heights is 3.0 People.
What is the Average Household Size in Brooklyn Heights
Average Household Size in Brooklyn Heights is 2.6 People.
How Large is the Labor Force in Brooklyn Heights?
There are 763 People in the Labor Forcein in Brooklyn Heights.
What is the Percentage of People in the Labor Force in Brooklyn Heights?
65.7% of People are in the Labor Force in Brooklyn Heights.
What is the Unemployment Rate in Brooklyn Heights?
Unemployment Rate in Brooklyn Heights is 1.4%.