Olmsted Falls, OH Map & Demographics
Olmsted Falls Map
Olmsted Falls Overview
$42,527
PER CAPITA INCOME
$115,357
AVG FAMILY INCOME
$92,416
AVG HOUSEHOLD INCOME
12.4%
WAGE / INCOME GAP [ % ]
87.6¢/ $1
WAGE / INCOME GAP [ $ ]
0.35
INEQUALITY / GINI INDEX
8,670
TOTAL POPULATION
3,922
MALE POPULATION
4,748
FEMALE POPULATION
82.60
MALES / 100 FEMALES
121.06
FEMALES / 100 MALES
44.8
MEDIAN AGE
3.0
AVG FAMILY SIZE
2.3
AVG HOUSEHOLD SIZE
4,614
LABOR FORCE [ PEOPLE ]
66.3%
PERCENT IN LABOR FORCE
3.1%
UNEMPLOYMENT RATE
Olmsted Falls Zip Codes
Income in Olmsted Falls
Income Overview in Olmsted Falls
Per Capita Income in Olmsted Falls is $42,527, while median incomes of families and households are $115,357 and $92,416 respectively.
| Characteristic | Number | Measure |
| Per Capita Income | 8,670 | $42,527 |
| Median Family Income | 2,228 | $115,357 |
| Mean Family Income | 2,228 | $120,776 |
| Median Household Income | 3,712 | $92,416 |
| Mean Household Income | 3,712 | $97,804 |
| Income Deficit | 2,228 | $0 |
| Wage / Income Gap (%) | 8,670 | 12.41% |
| Wage / Income Gap ($) | 8,670 | 87.59¢ per $1 |
| Gini / Inequality Index | 8,670 | 0.35 |
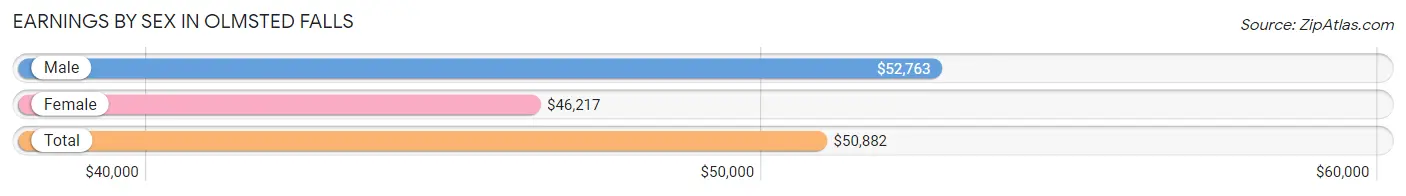
Earnings by Sex in Olmsted Falls
Average Earnings in Olmsted Falls are $50,882, $52,763 for men and $46,217 for women, a difference of 12.4%.
| Sex | Number | Average Earnings |
| Male | 2,468 (51.9%) | $52,763 |
| Female | 2,284 (48.1%) | $46,217 |
| Total | 4,752 (100.0%) | $50,882 |
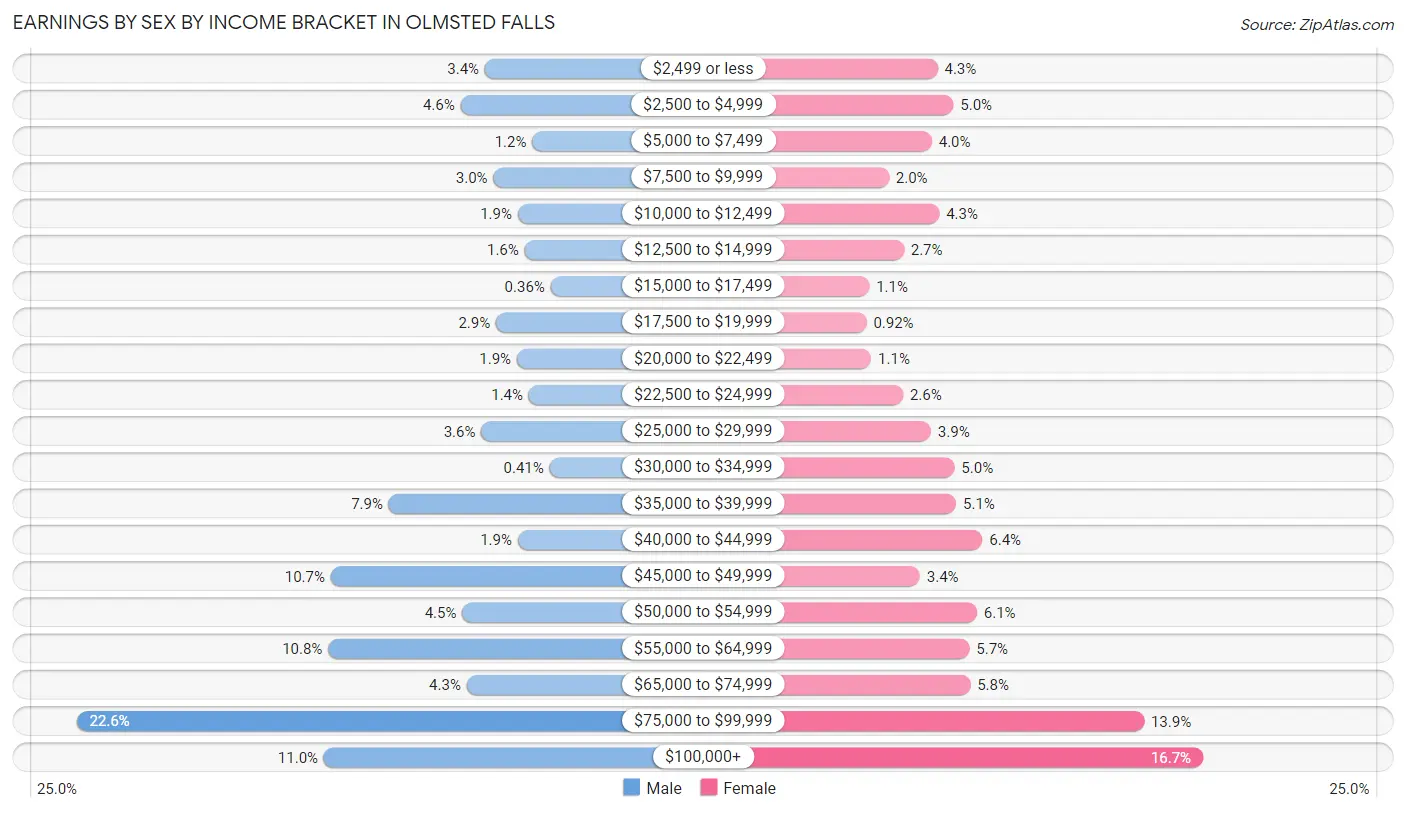
Earnings by Sex by Income Bracket in Olmsted Falls
The most common earnings brackets in Olmsted Falls are $75,000 to $99,999 for men (557 | 22.6%) and $100,000+ for women (381 | 16.7%).
| Income | Male | Female |
| $2,499 or less | 85 (3.4%) | 97 (4.3%) |
| $2,500 to $4,999 | 113 (4.6%) | 114 (5.0%) |
| $5,000 to $7,499 | 30 (1.2%) | 91 (4.0%) |
| $7,500 to $9,999 | 75 (3.0%) | 45 (2.0%) |
| $10,000 to $12,499 | 47 (1.9%) | 99 (4.3%) |
| $12,500 to $14,999 | 39 (1.6%) | 61 (2.7%) |
| $15,000 to $17,499 | 9 (0.4%) | 24 (1.1%) |
| $17,500 to $19,999 | 72 (2.9%) | 21 (0.9%) |
| $20,000 to $22,499 | 48 (1.9%) | 26 (1.1%) |
| $22,500 to $24,999 | 34 (1.4%) | 60 (2.6%) |
| $25,000 to $29,999 | 89 (3.6%) | 90 (3.9%) |
| $30,000 to $34,999 | 10 (0.4%) | 115 (5.0%) |
| $35,000 to $39,999 | 196 (7.9%) | 117 (5.1%) |
| $40,000 to $44,999 | 47 (1.9%) | 145 (6.4%) |
| $45,000 to $49,999 | 263 (10.7%) | 78 (3.4%) |
| $50,000 to $54,999 | 111 (4.5%) | 139 (6.1%) |
| $55,000 to $64,999 | 266 (10.8%) | 131 (5.7%) |
| $65,000 to $74,999 | 106 (4.3%) | 132 (5.8%) |
| $75,000 to $99,999 | 557 (22.6%) | 318 (13.9%) |
| $100,000+ | 271 (11.0%) | 381 (16.7%) |
| Total | 2,468 (100.0%) | 2,284 (100.0%) |
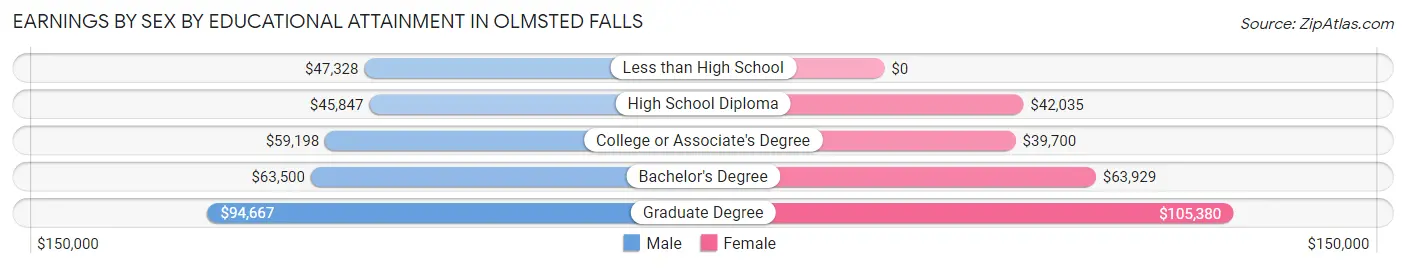
Earnings by Sex by Educational Attainment in Olmsted Falls
Average earnings in Olmsted Falls are $58,722 for men and $53,670 for women, a difference of 8.6%. Men with an educational attainment of graduate degree enjoy the highest average annual earnings of $94,667, while those with high school diploma education earn the least with $45,847. Women with an educational attainment of graduate degree earn the most with the average annual earnings of $105,380, while those with college or associate's degree education have the smallest earnings of $39,700.
| Educational Attainment | Male Income | Female Income |
| Less than High School | $47,328 | $0 |
| High School Diploma | $45,847 | $42,035 |
| College or Associate's Degree | $59,198 | $39,700 |
| Bachelor's Degree | $63,500 | $63,929 |
| Graduate Degree | $94,667 | $105,380 |
| Total | $58,722 | $53,670 |
Family Income in Olmsted Falls
Family Income Brackets in Olmsted Falls
According to the Olmsted Falls family income data, there are 791 families falling into the $100,000 to $149,999 income range, which is the most common income bracket and makes up 35.5% of all families.
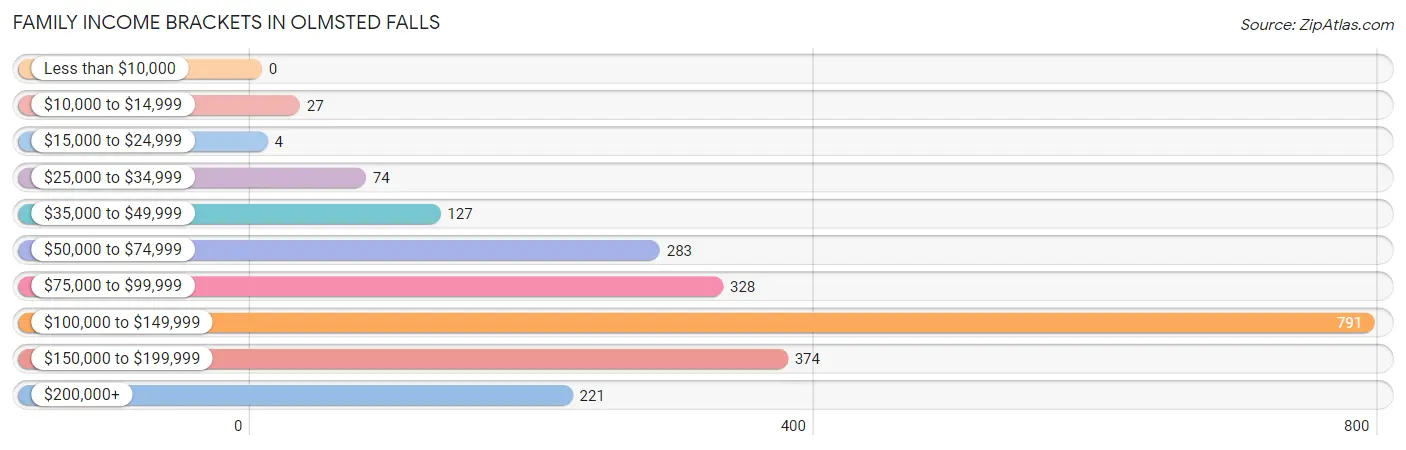
| Income Bracket | # Families | % Families |
| Less than $10,000 | 0 | 0.0% |
| $10,000 to $14,999 | 27 | 1.2% |
| $15,000 to $24,999 | 4 | 0.2% |
| $25,000 to $34,999 | 74 | 3.3% |
| $35,000 to $49,999 | 127 | 5.7% |
| $50,000 to $74,999 | 283 | 12.7% |
| $75,000 to $99,999 | 328 | 14.7% |
| $100,000 to $149,999 | 791 | 35.5% |
| $150,000 to $199,999 | 374 | 16.8% |
| $200,000+ | 221 | 9.9% |
Family Income by Famaliy Size in Olmsted Falls
6-person families (33 | 1.5%) account for the highest median family income in Olmsted Falls with $217,574 per family, while 2-person families (1,300 | 58.4%) have the highest median income of $57,544 per family member.
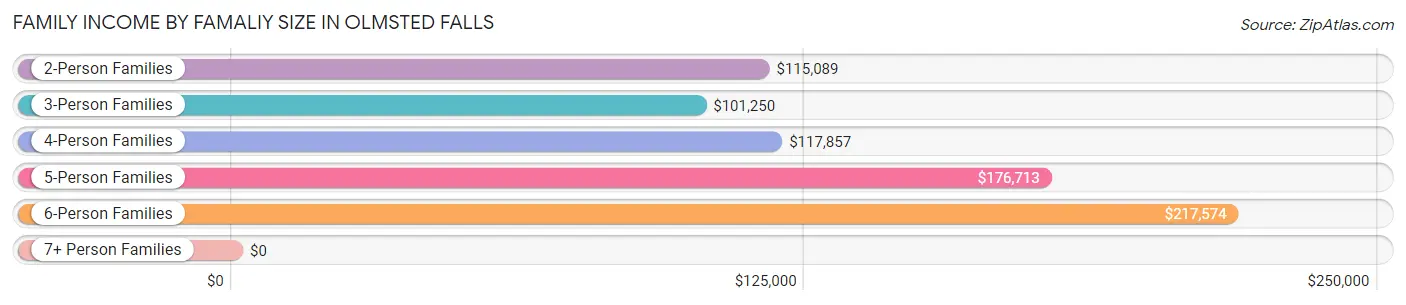
| Income Bracket | # Families | Median Income |
| 2-Person Families | 1,300 (58.4%) | $115,089 |
| 3-Person Families | 367 (16.5%) | $101,250 |
| 4-Person Families | 274 (12.3%) | $117,857 |
| 5-Person Families | 197 (8.8%) | $176,713 |
| 6-Person Families | 33 (1.5%) | $217,574 |
| 7+ Person Families | 57 (2.6%) | $0 |
| Total | 2,228 (100.0%) | $115,357 |
Family Income by Number of Earners in Olmsted Falls
The median family income in Olmsted Falls is $115,357, with families comprising 3+ earners (208) having the highest median family income of $157,024, while families with no earners (279) have the lowest median family income of $70,602, accounting for 9.3% and 12.5% of families, respectively.
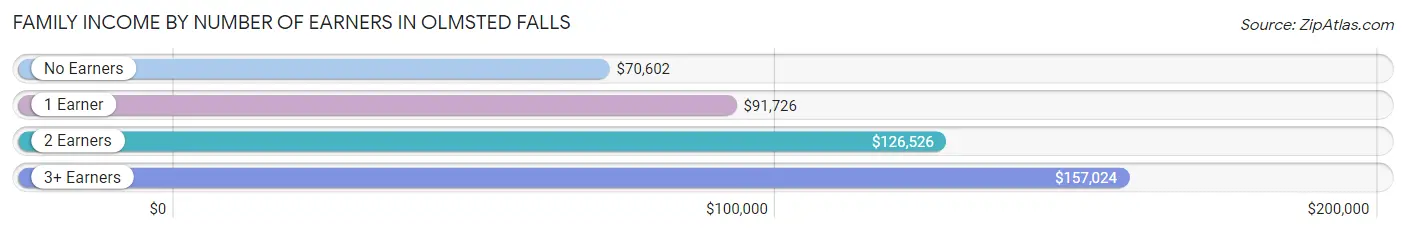
| Number of Earners | # Families | Median Income |
| No Earners | 279 (12.5%) | $70,602 |
| 1 Earner | 660 (29.6%) | $91,726 |
| 2 Earners | 1,081 (48.5%) | $126,526 |
| 3+ Earners | 208 (9.3%) | $157,024 |
| Total | 2,228 (100.0%) | $115,357 |
Household Income in Olmsted Falls
Household Income Brackets in Olmsted Falls
With 965 households falling in the category, the $100,000 to $149,999 income range is the most frequent in Olmsted Falls, accounting for 26.0% of all households. In contrast, only 111 households (3.0%) fall into the $10,000 to $14,999 income bracket, making it the least populous group.
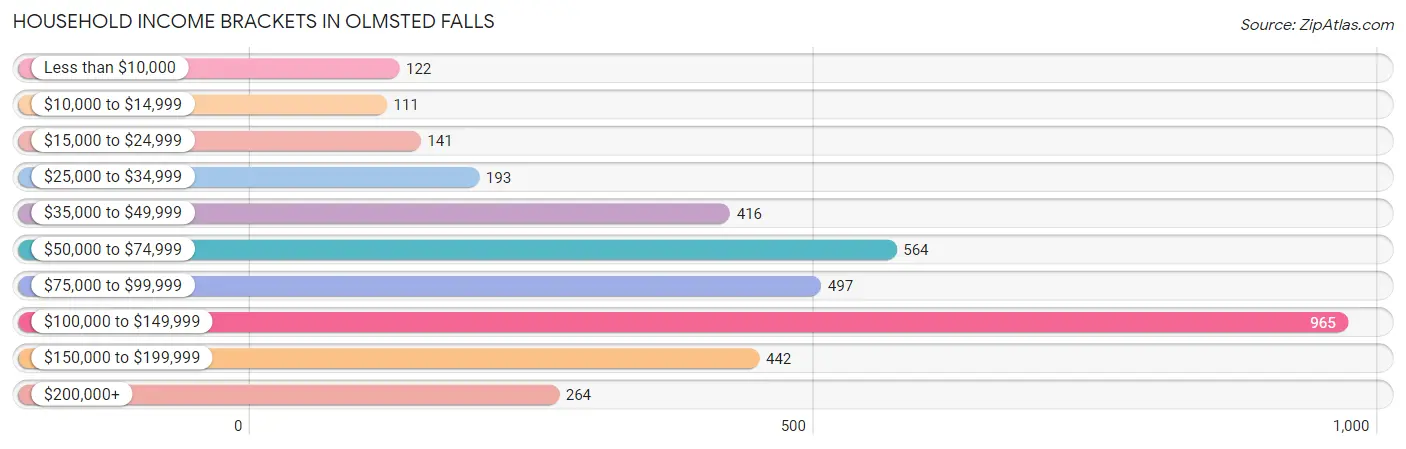
| Income Bracket | # Households | % Households |
| Less than $10,000 | 122 | 3.3% |
| $10,000 to $14,999 | 111 | 3.0% |
| $15,000 to $24,999 | 141 | 3.8% |
| $25,000 to $34,999 | 193 | 5.2% |
| $35,000 to $49,999 | 416 | 11.2% |
| $50,000 to $74,999 | 564 | 15.2% |
| $75,000 to $99,999 | 497 | 13.4% |
| $100,000 to $149,999 | 965 | 26.0% |
| $150,000 to $199,999 | 442 | 11.9% |
| $200,000+ | 264 | 7.1% |
Household Income by Householder Age in Olmsted Falls
The median household income in Olmsted Falls is $92,416, with the highest median household income of $120,278 found in the 45 to 64 years age bracket for the primary householder. A total of 1,502 households (40.5%) fall into this category. Meanwhile, the 15 to 24 years age bracket for the primary householder has the lowest median household income of $0, with 57 households (1.5%) in this group.
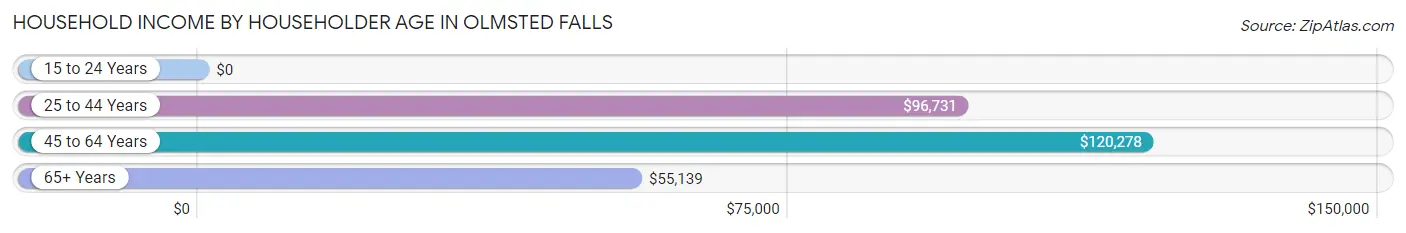
| Income Bracket | # Households | Median Income |
| 15 to 24 Years | 57 (1.5%) | $0 |
| 25 to 44 Years | 880 (23.7%) | $96,731 |
| 45 to 64 Years | 1,502 (40.5%) | $120,278 |
| 65+ Years | 1,273 (34.3%) | $55,139 |
| Total | 3,712 (100.0%) | $92,416 |
Poverty in Olmsted Falls
Income Below Poverty by Sex and Age in Olmsted Falls
With 3.3% poverty level for males and 7.1% for females among the residents of Olmsted Falls, 5 year old males and 25 to 34 year old females are the most vulnerable to poverty, with 6 males (20.7%) and 96 females (17.1%) in their respective age groups living below the poverty level.
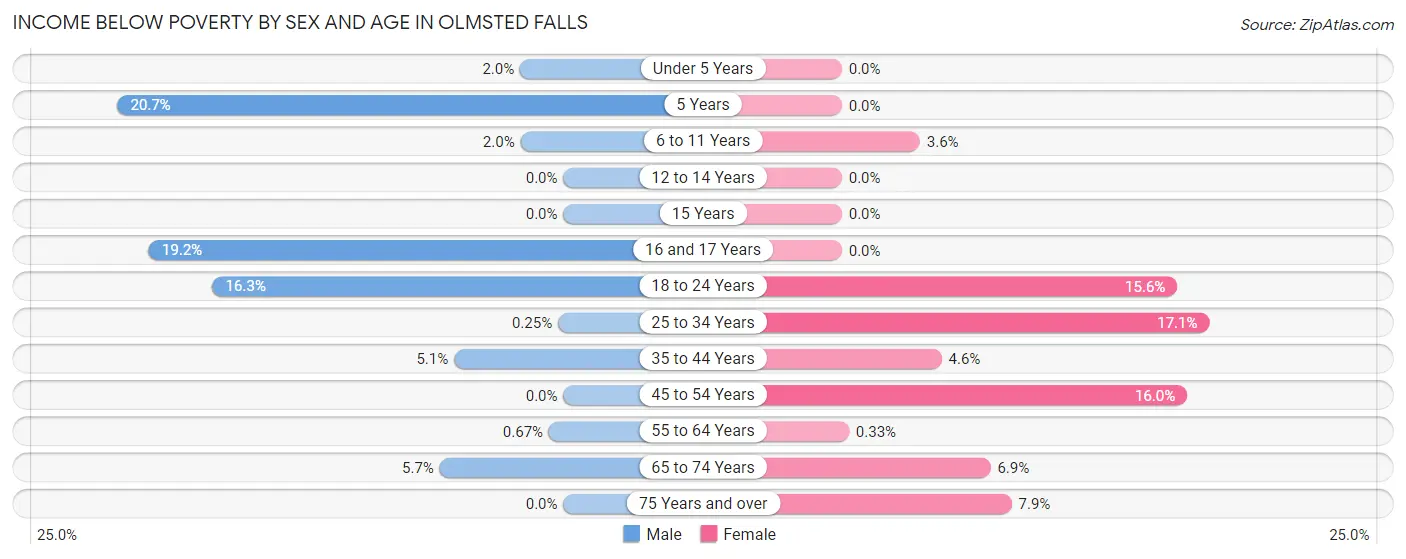
| Age Bracket | Male | Female |
| Under 5 Years | 6 (2.0%) | 0 (0.0%) |
| 5 Years | 6 (20.7%) | 0 (0.0%) |
| 6 to 11 Years | 5 (2.0%) | 13 (3.6%) |
| 12 to 14 Years | 0 (0.0%) | 0 (0.0%) |
| 15 Years | 0 (0.0%) | 0 (0.0%) |
| 16 and 17 Years | 15 (19.2%) | 0 (0.0%) |
| 18 to 24 Years | 35 (16.3%) | 35 (15.6%) |
| 25 to 34 Years | 1 (0.3%) | 96 (17.1%) |
| 35 to 44 Years | 24 (5.1%) | 25 (4.6%) |
| 45 to 54 Years | 0 (0.0%) | 83 (16.0%) |
| 55 to 64 Years | 4 (0.7%) | 2 (0.3%) |
| 65 to 74 Years | 33 (5.7%) | 48 (6.9%) |
| 75 Years and over | 0 (0.0%) | 32 (7.9%) |
| Total | 129 (3.3%) | 334 (7.1%) |
Income Above Poverty by Sex and Age in Olmsted Falls
According to the poverty statistics in Olmsted Falls, males aged 12 to 14 years and females aged under 5 years are the age groups that are most secure financially, with 100.0% of males and 100.0% of females in these age groups living above the poverty line.
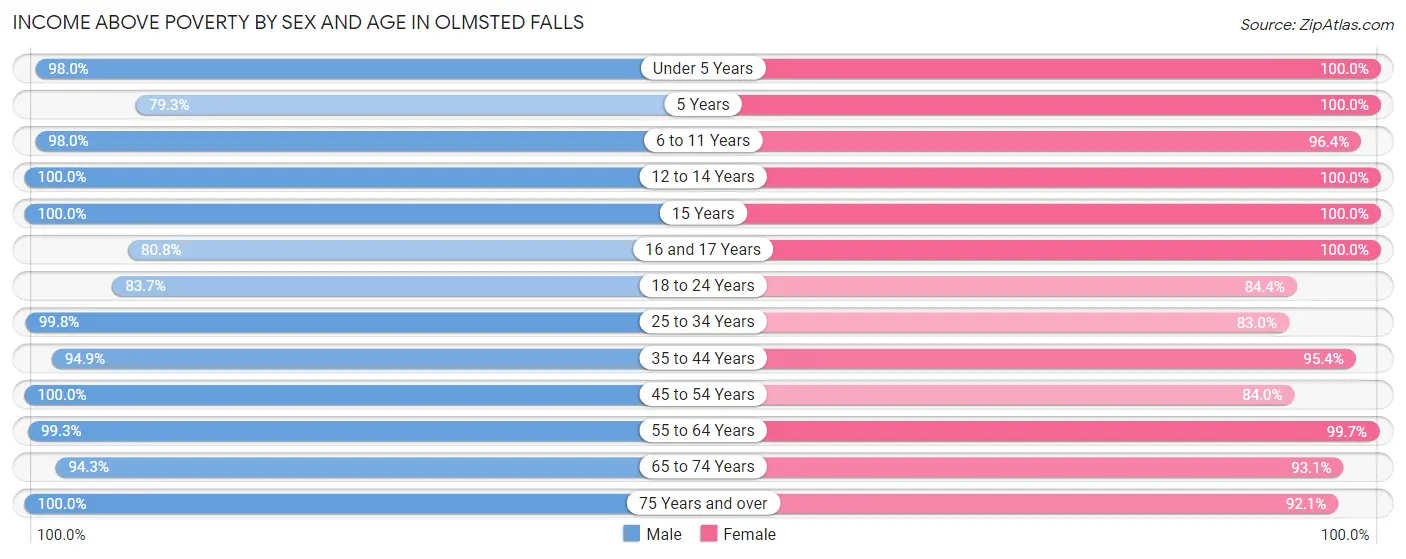
| Age Bracket | Male | Female |
| Under 5 Years | 293 (98.0%) | 210 (100.0%) |
| 5 Years | 23 (79.3%) | 18 (100.0%) |
| 6 to 11 Years | 246 (98.0%) | 346 (96.4%) |
| 12 to 14 Years | 124 (100.0%) | 222 (100.0%) |
| 15 Years | 34 (100.0%) | 157 (100.0%) |
| 16 and 17 Years | 63 (80.8%) | 174 (100.0%) |
| 18 to 24 Years | 180 (83.7%) | 190 (84.4%) |
| 25 to 34 Years | 402 (99.8%) | 467 (83.0%) |
| 35 to 44 Years | 449 (94.9%) | 515 (95.4%) |
| 45 to 54 Years | 602 (100.0%) | 435 (84.0%) |
| 55 to 64 Years | 596 (99.3%) | 610 (99.7%) |
| 65 to 74 Years | 542 (94.3%) | 648 (93.1%) |
| 75 Years and over | 191 (100.0%) | 374 (92.1%) |
| Total | 3,745 (96.7%) | 4,366 (92.9%) |
Income Below Poverty Among Married-Couple Families in Olmsted Falls
The poverty statistics for married-couple families in Olmsted Falls show that 0.3% or 5 of the total 1,851 families live below the poverty line. Families with 3 or 4 children have the highest poverty rate of 3.7%, comprising of 5 families. On the other hand, families with no children have the lowest poverty rate of 0.0%, which includes 0 families.
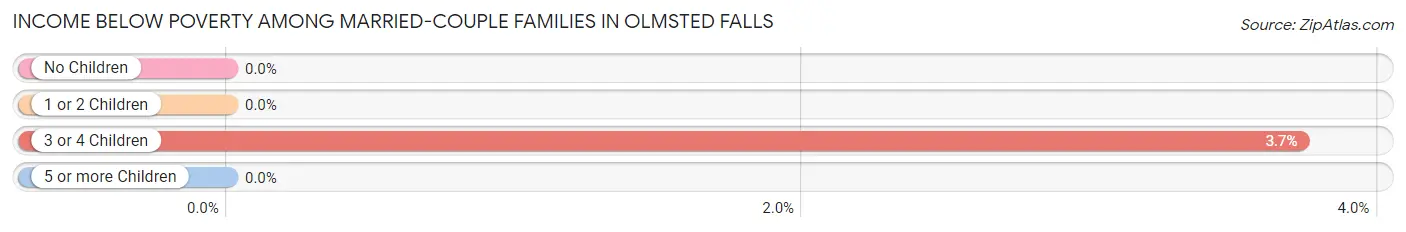
| Children | Above Poverty | Below Poverty |
| No Children | 1,222 (100.0%) | 0 (0.0%) |
| 1 or 2 Children | 438 (100.0%) | 0 (0.0%) |
| 3 or 4 Children | 129 (96.3%) | 5 (3.7%) |
| 5 or more Children | 57 (100.0%) | 0 (0.0%) |
| Total | 1,846 (99.7%) | 5 (0.3%) |
Income Below Poverty Among Single-Parent Households in Olmsted Falls
According to the poverty data in Olmsted Falls, 6.7% or 11 single-father households and 7.5% or 16 single-mother households are living below the poverty line. Among single-father households, those with 1 or 2 children have the highest poverty rate, with 11 households (7.8%) experiencing poverty. Likewise, among single-mother households, those with no children have the highest poverty rate, with 16 households (12.8%) falling below the poverty line.
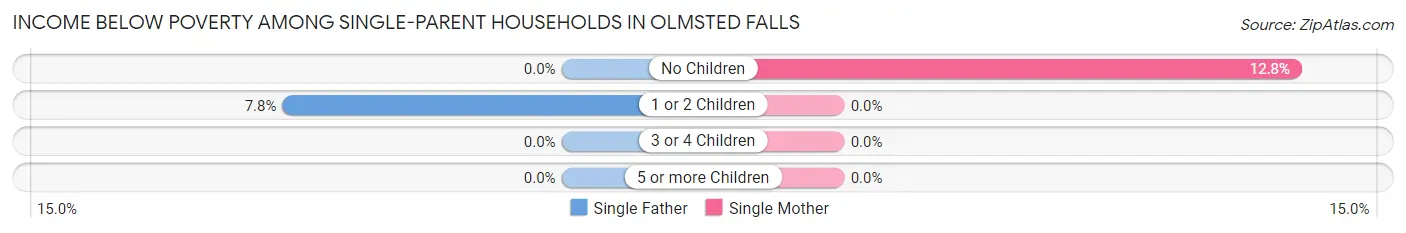
| Children | Single Father | Single Mother |
| No Children | 0 (0.0%) | 16 (12.8%) |
| 1 or 2 Children | 11 (7.8%) | 0 (0.0%) |
| 3 or 4 Children | 0 (0.0%) | 0 (0.0%) |
| 5 or more Children | 0 (0.0%) | 0 (0.0%) |
| Total | 11 (6.7%) | 16 (7.5%) |
Income Below Poverty Among Married-Couple vs Single-Parent Households in Olmsted Falls
The poverty data for Olmsted Falls shows that 5 of the married-couple family households (0.3%) and 27 of the single-parent households (7.2%) are living below the poverty level. Within the married-couple family households, those with 3 or 4 children have the highest poverty rate, with 5 households (3.7%) falling below the poverty line. Among the single-parent households, those with no children have the highest poverty rate, with 16 household (12.4%) living below poverty.
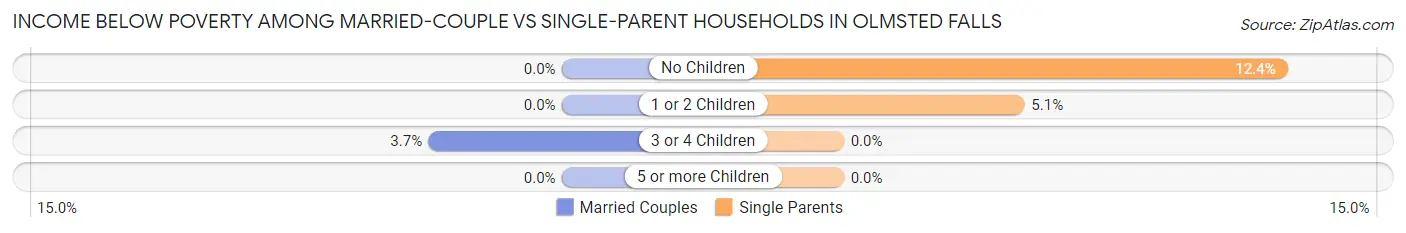
| Children | Married-Couple Families | Single-Parent Households |
| No Children | 0 (0.0%) | 16 (12.4%) |
| 1 or 2 Children | 0 (0.0%) | 11 (5.1%) |
| 3 or 4 Children | 5 (3.7%) | 0 (0.0%) |
| 5 or more Children | 0 (0.0%) | 0 (0.0%) |
| Total | 5 (0.3%) | 27 (7.2%) |
Race in Olmsted Falls
The most populous races in Olmsted Falls are White / Caucasian (7,681 | 88.6%), Two or more Races (596 | 6.9%), and Hispanic or Latino (474 | 5.5%).
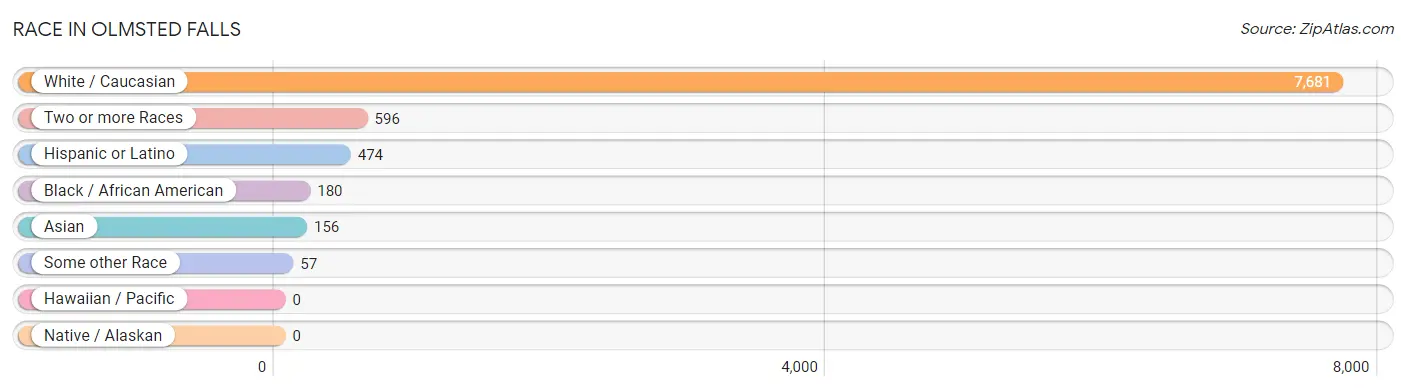
| Race | # Population | % Population |
| Asian | 156 | 1.8% |
| Black / African American | 180 | 2.1% |
| Hawaiian / Pacific | 0 | 0.0% |
| Hispanic or Latino | 474 | 5.5% |
| Native / Alaskan | 0 | 0.0% |
| White / Caucasian | 7,681 | 88.6% |
| Two or more Races | 596 | 6.9% |
| Some other Race | 57 | 0.7% |
| Total | 8,670 | 100.0% |
Ancestry in Olmsted Falls
The most populous ancestries reported in Olmsted Falls are German (2,309 | 26.6%), Irish (1,459 | 16.8%), Italian (1,374 | 15.9%), English (1,109 | 12.8%), and Polish (1,077 | 12.4%), together accounting for 84.5% of all Olmsted Falls residents.
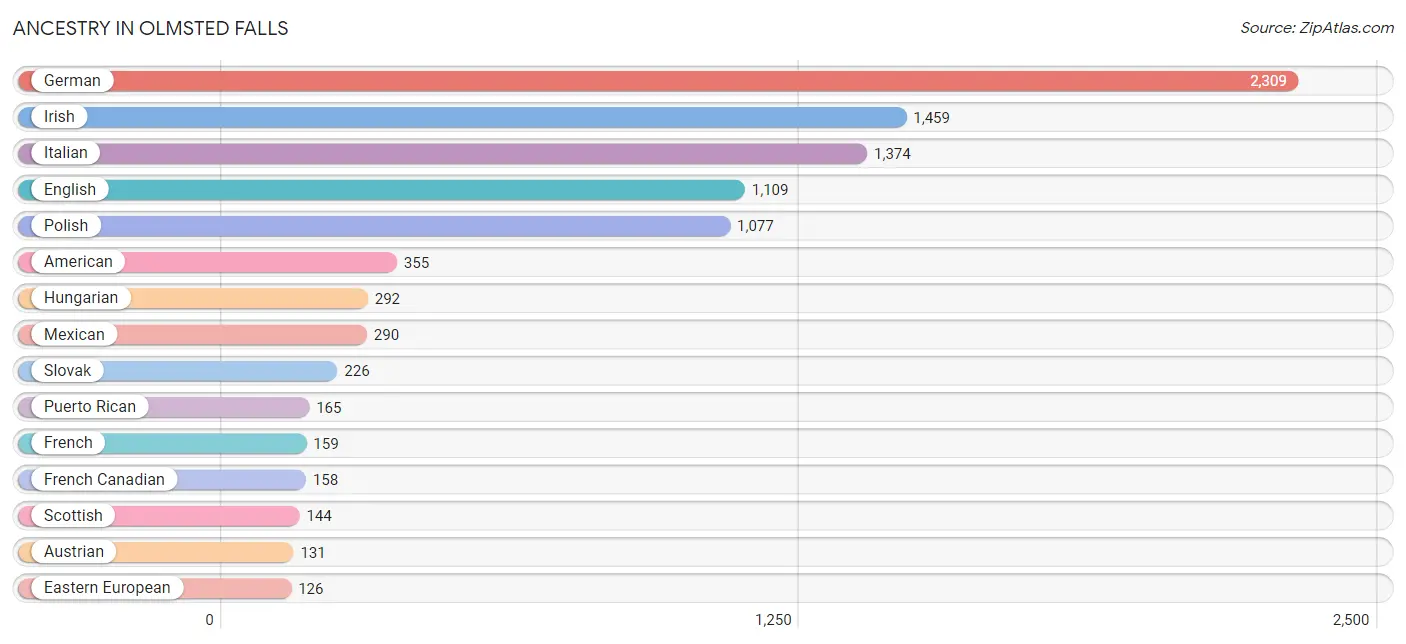
| Ancestry | # Population | % Population |
| African | 12 | 0.1% |
| Albanian | 18 | 0.2% |
| American | 355 | 4.1% |
| Arab | 69 | 0.8% |
| Armenian | 121 | 1.4% |
| Austrian | 131 | 1.5% |
| Belgian | 4 | 0.1% |
| British | 124 | 1.4% |
| Canadian | 10 | 0.1% |
| Central American | 8 | 0.1% |
| Croatian | 14 | 0.2% |
| Cuban | 3 | 0.0% |
| Czech | 65 | 0.7% |
| Czechoslovakian | 35 | 0.4% |
| Danish | 17 | 0.2% |
| Dutch | 98 | 1.1% |
| Eastern European | 126 | 1.5% |
| English | 1,109 | 12.8% |
| European | 86 | 1.0% |
| Finnish | 40 | 0.5% |
| French | 159 | 1.8% |
| French Canadian | 158 | 1.8% |
| German | 2,309 | 26.6% |
| Hungarian | 292 | 3.4% |
| Indian (Asian) | 77 | 0.9% |
| Irish | 1,459 | 16.8% |
| Italian | 1,374 | 15.9% |
| Korean | 13 | 0.2% |
| Maltese | 2 | 0.0% |
| Mexican | 290 | 3.3% |
| Norwegian | 45 | 0.5% |
| Palestinian | 69 | 0.8% |
| Pennsylvania German | 20 | 0.2% |
| Polish | 1,077 | 12.4% |
| Puerto Rican | 165 | 1.9% |
| Romanian | 52 | 0.6% |
| Russian | 12 | 0.1% |
| Salvadoran | 8 | 0.1% |
| Scandinavian | 33 | 0.4% |
| Scotch-Irish | 105 | 1.2% |
| Scottish | 144 | 1.7% |
| Serbian | 2 | 0.0% |
| Slovak | 226 | 2.6% |
| Slovene | 98 | 1.1% |
| Spanish | 3 | 0.0% |
| Subsaharan African | 12 | 0.1% |
| Swedish | 38 | 0.4% |
| Swiss | 85 | 1.0% |
| Thai | 67 | 0.8% |
| Ukrainian | 91 | 1.1% |
| Welsh | 77 | 0.9% |
| Yugoslavian | 5 | 0.1% | View All 52 Rows |
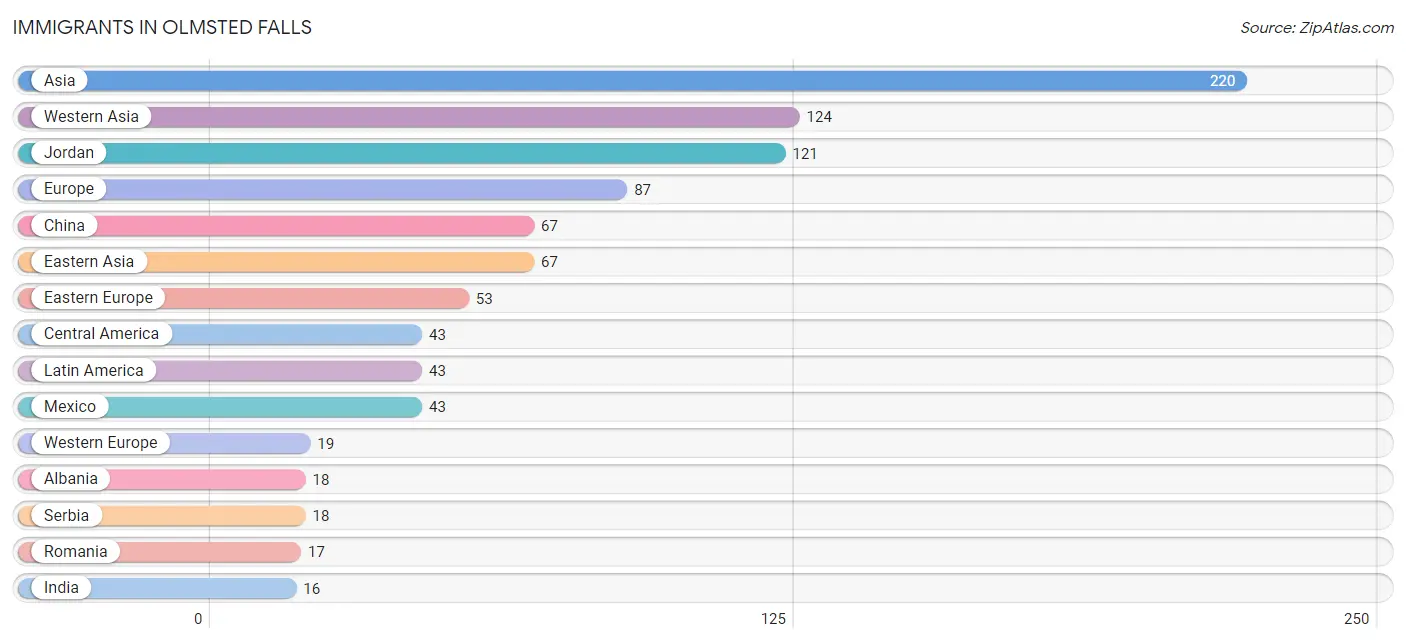
Immigrants in Olmsted Falls
The most numerous immigrant groups reported in Olmsted Falls came from Asia (220 | 2.5%), Western Asia (124 | 1.4%), Jordan (121 | 1.4%), Europe (87 | 1.0%), and China (67 | 0.8%), together accounting for 7.1% of all Olmsted Falls residents.
| Immigration Origin | # Population | % Population |
| Albania | 18 | 0.2% |
| Asia | 220 | 2.5% |
| Austria | 5 | 0.1% |
| Canada | 7 | 0.1% |
| Central America | 43 | 0.5% |
| China | 67 | 0.8% |
| Eastern Asia | 67 | 0.8% |
| Eastern Europe | 53 | 0.6% |
| England | 13 | 0.2% |
| Europe | 87 | 1.0% |
| Germany | 14 | 0.2% |
| India | 16 | 0.2% |
| Jordan | 121 | 1.4% |
| Latin America | 43 | 0.5% |
| Lebanon | 3 | 0.0% |
| Mexico | 43 | 0.5% |
| Northern Europe | 13 | 0.2% |
| Oceania | 6 | 0.1% |
| Philippines | 13 | 0.2% |
| Romania | 17 | 0.2% |
| Serbia | 18 | 0.2% |
| South Central Asia | 16 | 0.2% |
| South Eastern Asia | 13 | 0.2% |
| Southern Europe | 2 | 0.0% |
| Western Asia | 124 | 1.4% |
| Western Europe | 19 | 0.2% | View All 26 Rows |
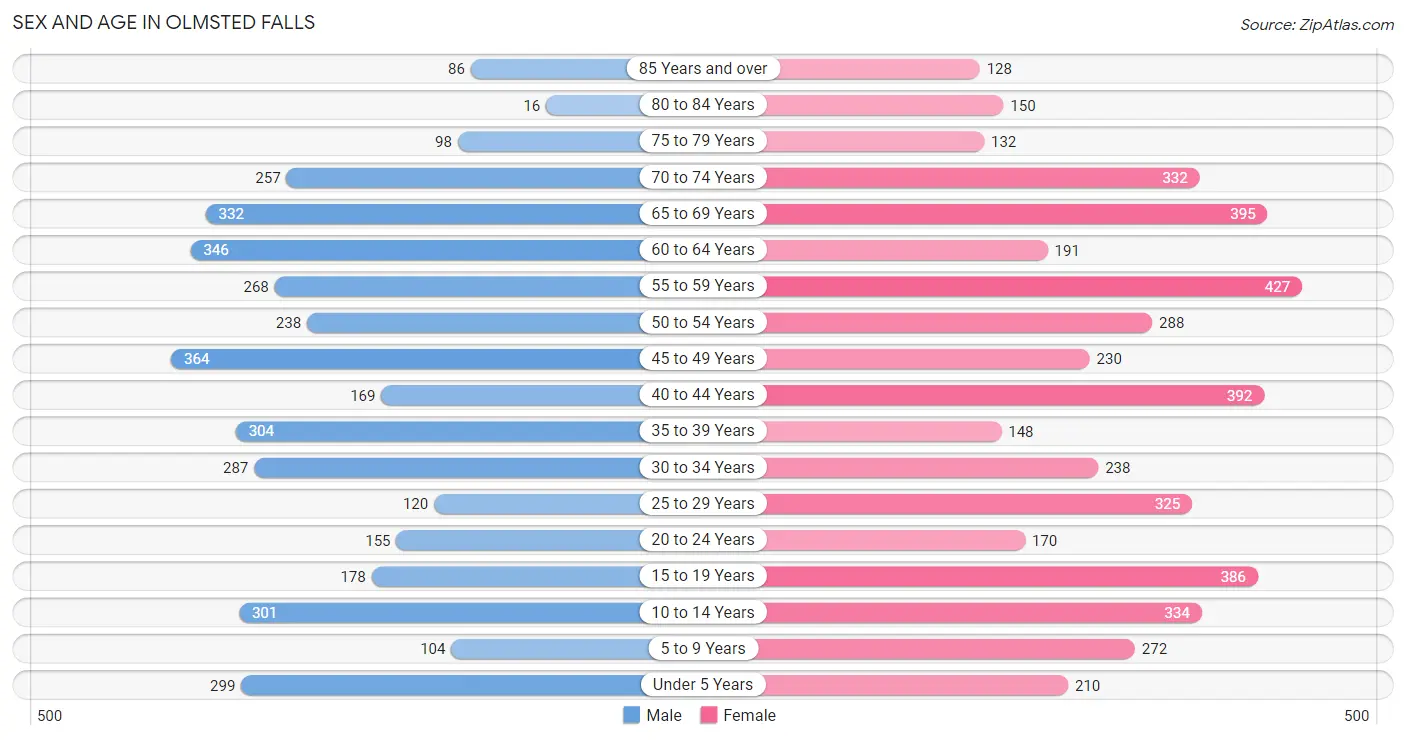
Sex and Age in Olmsted Falls
Sex and Age in Olmsted Falls
The most populous age groups in Olmsted Falls are 45 to 49 Years (364 | 9.3%) for men and 55 to 59 Years (427 | 9.0%) for women.
| Age Bracket | Male | Female |
| Under 5 Years | 299 (7.6%) | 210 (4.4%) |
| 5 to 9 Years | 104 (2.6%) | 272 (5.7%) |
| 10 to 14 Years | 301 (7.7%) | 334 (7.0%) |
| 15 to 19 Years | 178 (4.5%) | 386 (8.1%) |
| 20 to 24 Years | 155 (4.0%) | 170 (3.6%) |
| 25 to 29 Years | 120 (3.1%) | 325 (6.8%) |
| 30 to 34 Years | 287 (7.3%) | 238 (5.0%) |
| 35 to 39 Years | 304 (7.7%) | 148 (3.1%) |
| 40 to 44 Years | 169 (4.3%) | 392 (8.3%) |
| 45 to 49 Years | 364 (9.3%) | 230 (4.8%) |
| 50 to 54 Years | 238 (6.1%) | 288 (6.1%) |
| 55 to 59 Years | 268 (6.8%) | 427 (9.0%) |
| 60 to 64 Years | 346 (8.8%) | 191 (4.0%) |
| 65 to 69 Years | 332 (8.5%) | 395 (8.3%) |
| 70 to 74 Years | 257 (6.6%) | 332 (7.0%) |
| 75 to 79 Years | 98 (2.5%) | 132 (2.8%) |
| 80 to 84 Years | 16 (0.4%) | 150 (3.2%) |
| 85 Years and over | 86 (2.2%) | 128 (2.7%) |
| Total | 3,922 (100.0%) | 4,748 (100.0%) |
Families and Households in Olmsted Falls
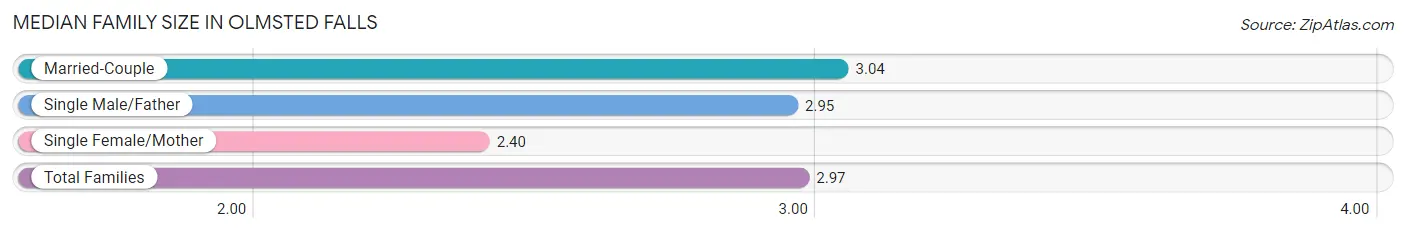
Median Family Size in Olmsted Falls
The median family size in Olmsted Falls is 2.97 persons per family, with married-couple families (1,851 | 83.1%) accounting for the largest median family size of 3.04 persons per family. On the other hand, single female/mother families (212 | 9.5%) represent the smallest median family size with 2.40 persons per family.
| Family Type | # Families | Family Size |
| Married-Couple | 1,851 (83.1%) | 3.04 |
| Single Male/Father | 165 (7.4%) | 2.95 |
| Single Female/Mother | 212 (9.5%) | 2.40 |
| Total Families | 2,228 (100.0%) | 2.97 |
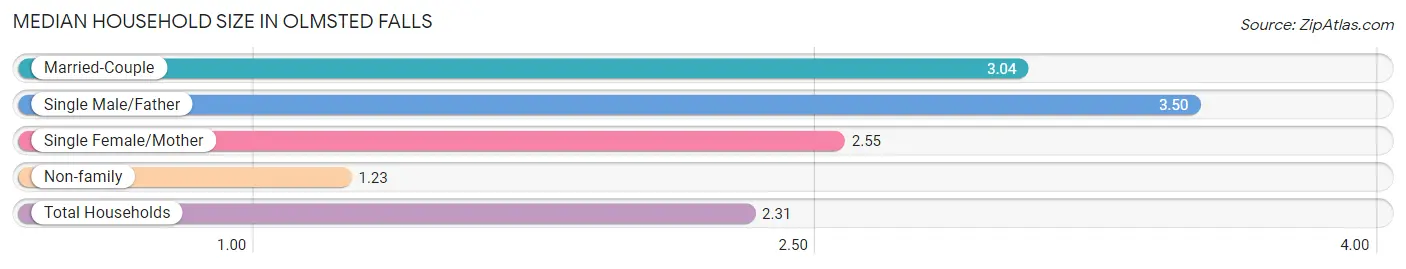
Median Household Size in Olmsted Falls
The median household size in Olmsted Falls is 2.31 persons per household, with single male/father households (165 | 4.4%) accounting for the largest median household size of 3.5 persons per household. non-family households (1,484 | 40.0%) represent the smallest median household size with 1.23 persons per household.
| Household Type | # Households | Household Size |
| Married-Couple | 1,851 (49.9%) | 3.04 |
| Single Male/Father | 165 (4.4%) | 3.50 |
| Single Female/Mother | 212 (5.7%) | 2.55 |
| Non-family | 1,484 (40.0%) | 1.23 |
| Total Households | 3,712 (100.0%) | 2.31 |
Household Size by Marriage Status in Olmsted Falls
Out of a total of 3,712 households in Olmsted Falls, 2,228 (60.0%) are family households, while 1,484 (40.0%) are nonfamily households. The most numerous type of family households are 2-person households, comprising 1,277, and the most common type of nonfamily households are 1-person households, comprising 1,219.
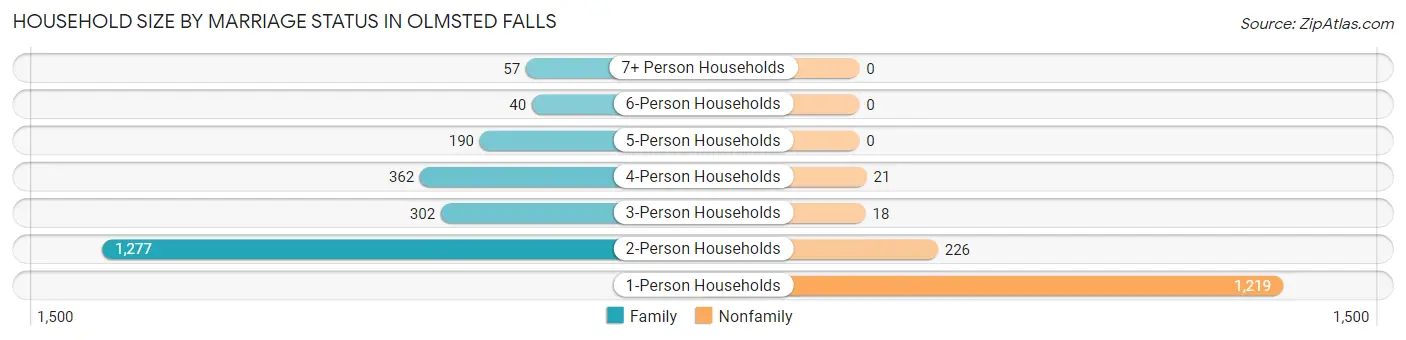
| Household Size | Family Households | Nonfamily Households |
| 1-Person Households | - | 1,219 (32.8%) |
| 2-Person Households | 1,277 (34.4%) | 226 (6.1%) |
| 3-Person Households | 302 (8.1%) | 18 (0.5%) |
| 4-Person Households | 362 (9.8%) | 21 (0.6%) |
| 5-Person Households | 190 (5.1%) | 0 (0.0%) |
| 6-Person Households | 40 (1.1%) | 0 (0.0%) |
| 7+ Person Households | 57 (1.5%) | 0 (0.0%) |
| Total | 2,228 (60.0%) | 1,484 (40.0%) |
Female Fertility in Olmsted Falls
Fertility by Age in Olmsted Falls
Average fertility rate in Olmsted Falls is 43.0 births per 1,000 women. Women in the age bracket of 20 to 34 years have the highest fertility rate with 113.0 births per 1,000 women. Women in the age bracket of 20 to 34 years acount for 100.0% of all women with births.

| Age Bracket | Women with Births | Births / 1,000 Women |
| 15 to 19 years | 0 (0.0%) | 0.0 |
| 20 to 34 years | 83 (100.0%) | 113.0 |
| 35 to 50 years | 0 (0.0%) | 0.0 |
| Total | 83 (100.0%) | 43.0 |
Fertility by Age by Marriage Status in Olmsted Falls
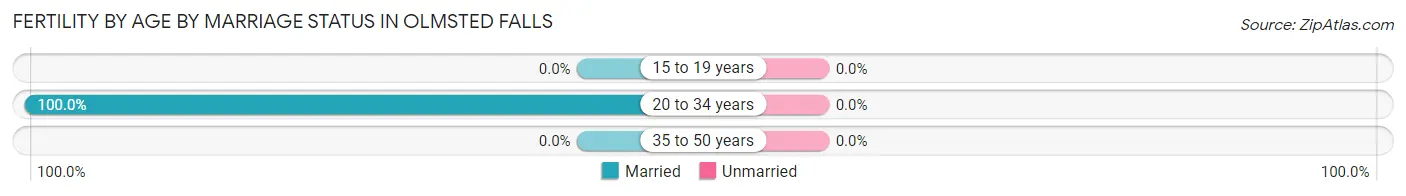
| Age Bracket | Married | Unmarried |
| 15 to 19 years | 0 (0.0%) | 0 (0.0%) |
| 20 to 34 years | 83 (100.0%) | 0 (0.0%) |
| 35 to 50 years | 0 (0.0%) | 0 (0.0%) |
| Total | 83 (100.0%) | 0 (0.0%) |
Fertility by Education in Olmsted Falls
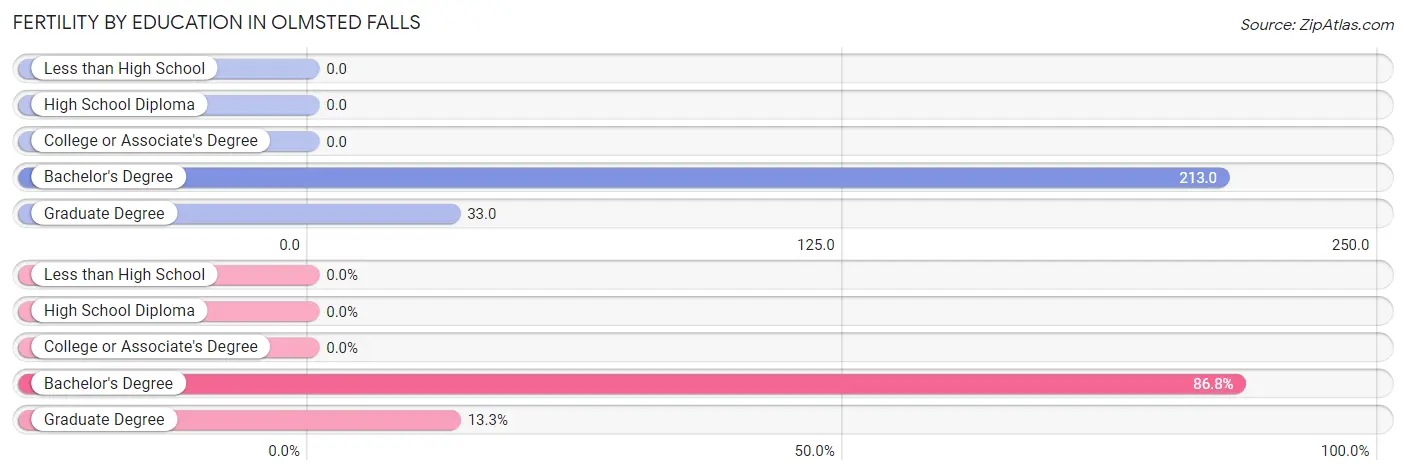
| Educational Attainment | Women with Births | Births / 1,000 Women |
| Less than High School | 0 (0.0%) | 0.0 |
| High School Diploma | 0 (0.0%) | 0.0 |
| College or Associate's Degree | 0 (0.0%) | 0.0 |
| Bachelor's Degree | 72 (86.8%) | 213.0 |
| Graduate Degree | 11 (13.3%) | 33.0 |
| Total | 83 (100.0%) | 43.0 |
Fertility by Education by Marriage Status in Olmsted Falls
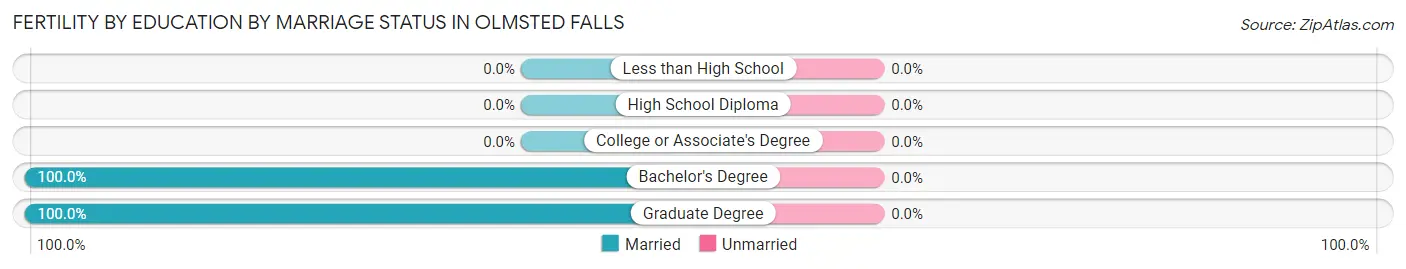
| Educational Attainment | Married | Unmarried |
| Less than High School | 0 (0.0%) | 0 (0.0%) |
| High School Diploma | 0 (0.0%) | 0 (0.0%) |
| College or Associate's Degree | 0 (0.0%) | 0 (0.0%) |
| Bachelor's Degree | 72 (100.0%) | 0 (0.0%) |
| Graduate Degree | 11 (100.0%) | 0 (0.0%) |
| Total | 83 (100.0%) | 0 (0.0%) |
Employment Characteristics in Olmsted Falls
Employment by Class of Employer in Olmsted Falls
Among the 4,398 employed individuals in Olmsted Falls, private company employees (3,002 | 68.3%), not-for-profit organizations (426 | 9.7%), and local government employees (276 | 6.3%) make up the most common classes of employment.
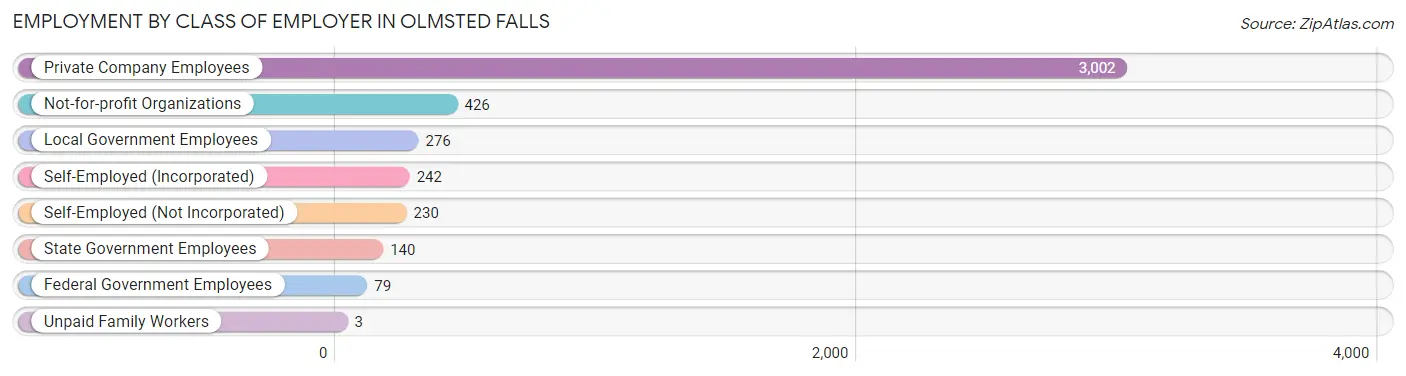
| Employer Class | # Employees | % Employees |
| Private Company Employees | 3,002 | 68.3% |
| Self-Employed (Incorporated) | 242 | 5.5% |
| Self-Employed (Not Incorporated) | 230 | 5.2% |
| Not-for-profit Organizations | 426 | 9.7% |
| Local Government Employees | 276 | 6.3% |
| State Government Employees | 140 | 3.2% |
| Federal Government Employees | 79 | 1.8% |
| Unpaid Family Workers | 3 | 0.1% |
| Total | 4,398 | 100.0% |
Employment Status by Age in Olmsted Falls
According to the labor force statistics for Olmsted Falls, out of the total population over 16 years of age (6,959), 66.3% or 4,614 individuals are in the labor force, with 3.1% or 143 of them unemployed. The age group with the highest labor force participation rate is 30 to 34 years, with 97.9% or 514 individuals in the labor force. Within the labor force, the 16 to 19 years age range has the highest percentage of unemployed individuals, with 17.2% or 35 of them being unemployed.
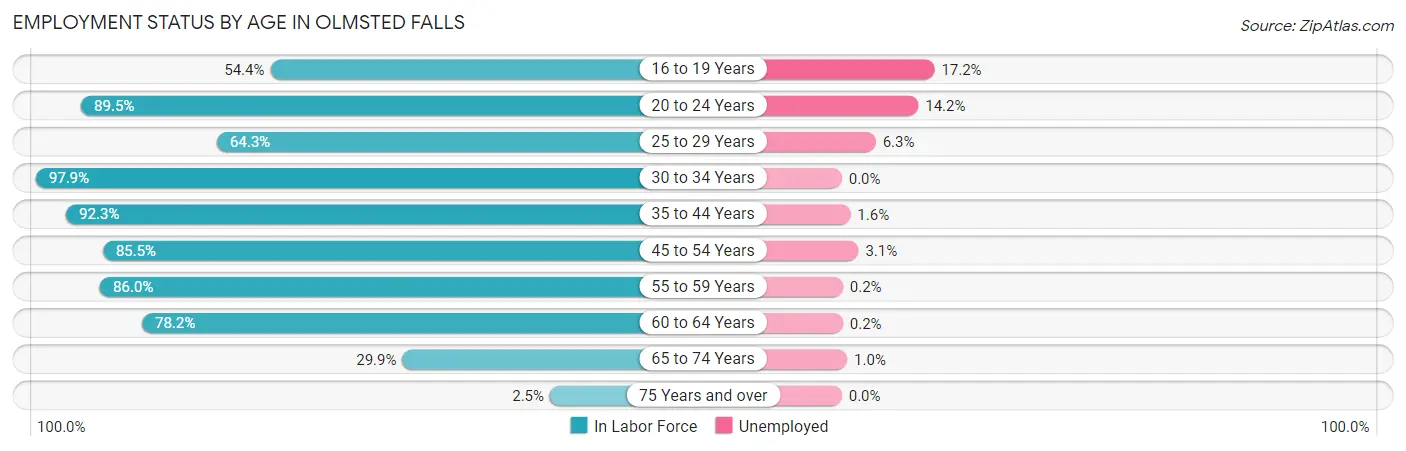
| Age Bracket | In Labor Force | Unemployed |
| 16 to 19 Years | 203 (54.4%) | 35 (17.2%) |
| 20 to 24 Years | 291 (89.5%) | 41 (14.2%) |
| 25 to 29 Years | 286 (64.3%) | 18 (6.3%) |
| 30 to 34 Years | 514 (97.9%) | 0 (0.0%) |
| 35 to 44 Years | 935 (92.3%) | 15 (1.6%) |
| 45 to 54 Years | 958 (85.5%) | 30 (3.1%) |
| 55 to 59 Years | 598 (86.0%) | 1 (0.2%) |
| 60 to 64 Years | 420 (78.2%) | 1 (0.2%) |
| 65 to 74 Years | 393 (29.9%) | 4 (1.0%) |
| 75 Years and over | 15 (2.5%) | 0 (0.0%) |
| Total | 4,614 (66.3%) | 143 (3.1%) |
Employment Status by Educational Attainment in Olmsted Falls
According to labor force statistics for Olmsted Falls, 85.6% of individuals (3,711) out of the total population between 25 and 64 years of age (4,335) are in the labor force, with 1.8% or 67 of them being unemployed. The group with the highest labor force participation rate are those with the educational attainment of less than high school, with 93.9% or 107 individuals in the labor force. Within the labor force, individuals with less than high school education have the highest percentage of unemployment, with 16.8% or 18 of them being unemployed.
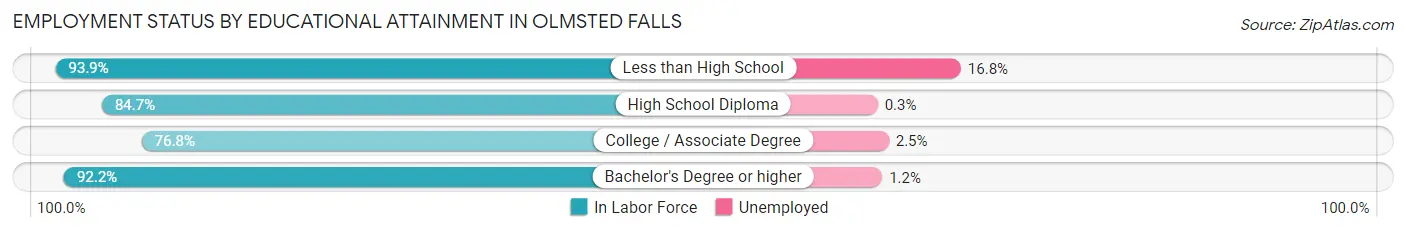
| Educational Attainment | In Labor Force | Unemployed |
| Less than High School | 107 (93.9%) | 19 (16.8%) |
| High School Diploma | 977 (84.7%) | 3 (0.3%) |
| College / Associate Degree | 1,005 (76.8%) | 33 (2.5%) |
| Bachelor's Degree or higher | 1,622 (92.2%) | 21 (1.2%) |
| Total | 3,711 (85.6%) | 78 (1.8%) |
Employment Occupations by Sex in Olmsted Falls
Management, Business, Science and Arts Occupations
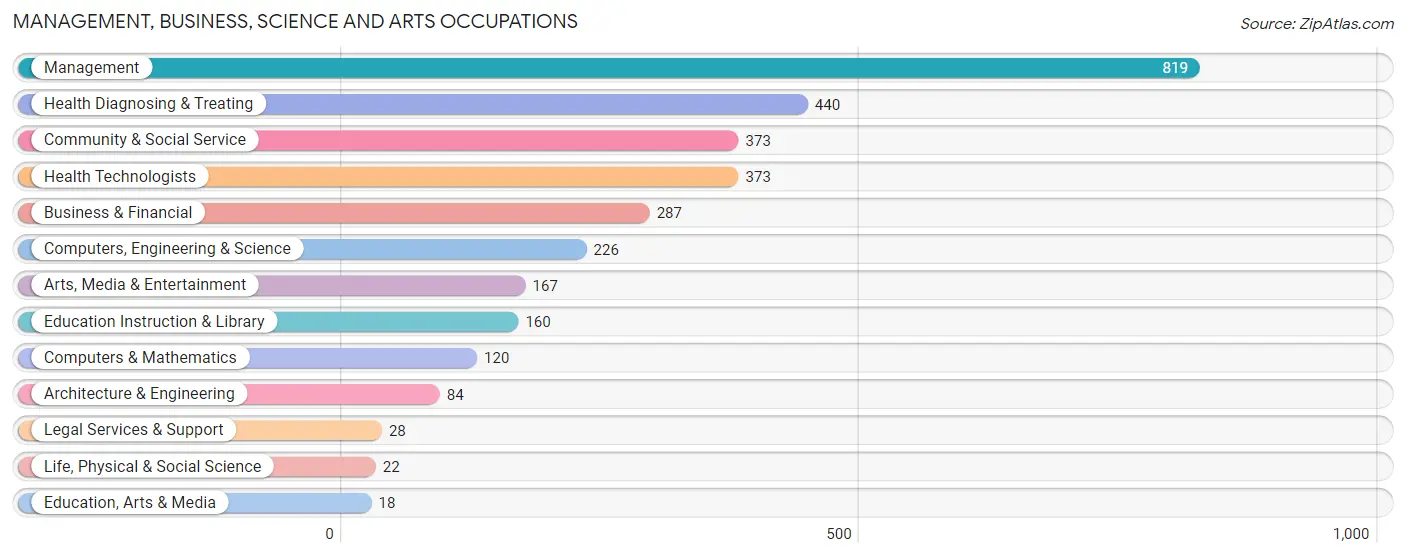
The most common Management, Business, Science and Arts occupations in Olmsted Falls are Management (819 | 18.4%), Health Diagnosing & Treating (440 | 9.9%), Community & Social Service (373 | 8.4%), Health Technologists (373 | 8.4%), and Business & Financial (287 | 6.4%).
Management, Business, Science and Arts Occupations by Sex
Within the Management, Business, Science and Arts occupations in Olmsted Falls, the most male-oriented occupations are Life, Physical & Social Science (100.0%), Architecture & Engineering (82.1%), and Computers, Engineering & Science (81.4%), while the most female-oriented occupations are Health Diagnosing & Treating (90.7%), Health Technologists (89.0%), and Education, Arts & Media (77.8%).
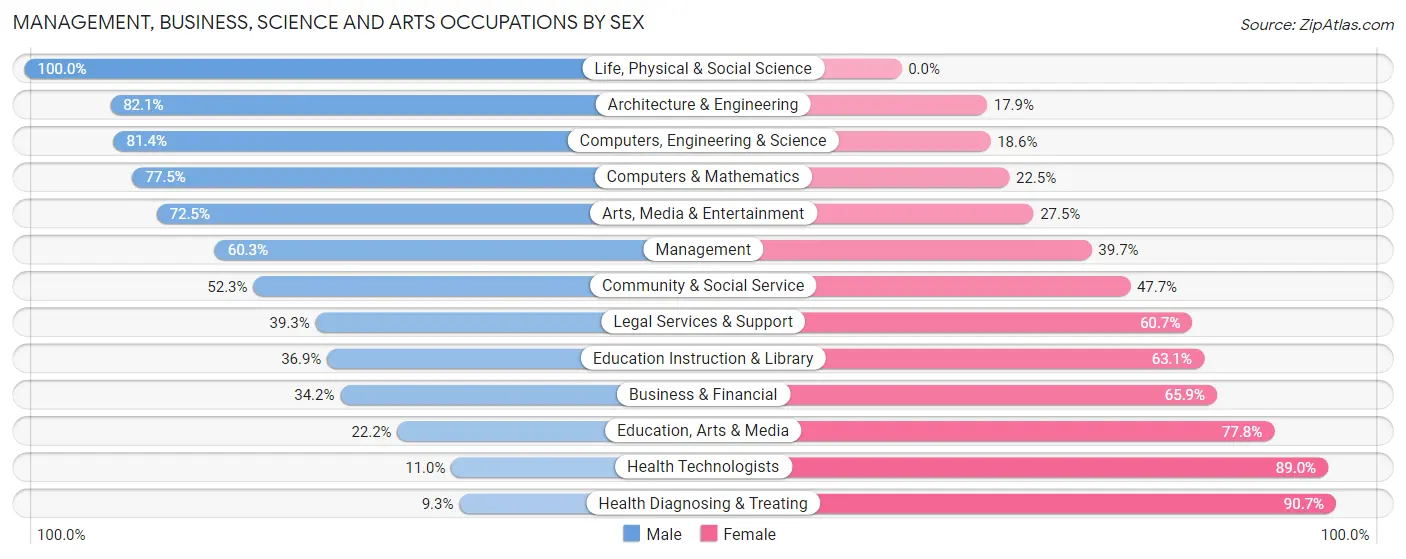
| Occupation | Male | Female |
| Management | 494 (60.3%) | 325 (39.7%) |
| Business & Financial | 98 (34.2%) | 189 (65.8%) |
| Computers, Engineering & Science | 184 (81.4%) | 42 (18.6%) |
| Computers & Mathematics | 93 (77.5%) | 27 (22.5%) |
| Architecture & Engineering | 69 (82.1%) | 15 (17.9%) |
| Life, Physical & Social Science | 22 (100.0%) | 0 (0.0%) |
| Community & Social Service | 195 (52.3%) | 178 (47.7%) |
| Education, Arts & Media | 4 (22.2%) | 14 (77.8%) |
| Legal Services & Support | 11 (39.3%) | 17 (60.7%) |
| Education Instruction & Library | 59 (36.9%) | 101 (63.1%) |
| Arts, Media & Entertainment | 121 (72.5%) | 46 (27.5%) |
| Health Diagnosing & Treating | 41 (9.3%) | 399 (90.7%) |
| Health Technologists | 41 (11.0%) | 332 (89.0%) |
| Total (Category) | 1,012 (47.2%) | 1,133 (52.8%) |
| Total (Overall) | 2,321 (52.1%) | 2,133 (47.9%) |
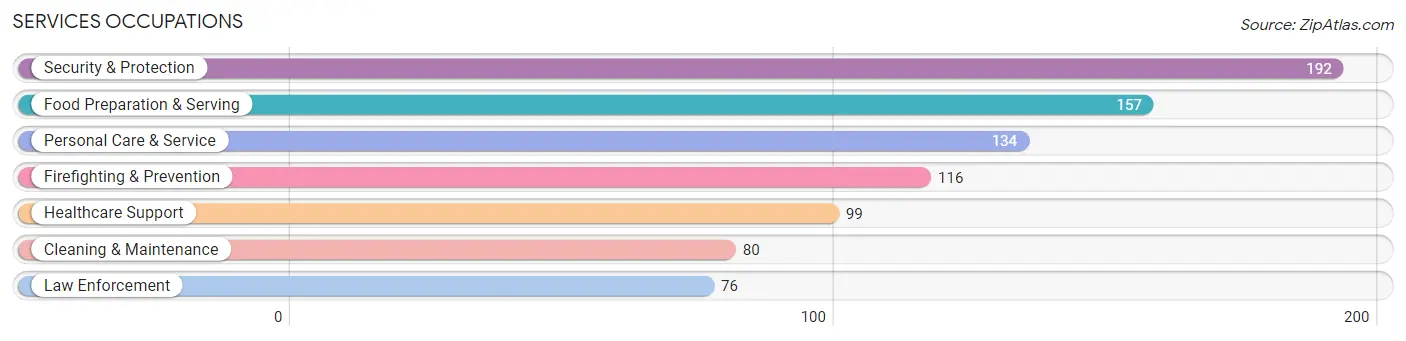
Services Occupations
The most common Services occupations in Olmsted Falls are Security & Protection (192 | 4.3%), Food Preparation & Serving (157 | 3.5%), Personal Care & Service (134 | 3.0%), Firefighting & Prevention (116 | 2.6%), and Healthcare Support (99 | 2.2%).
Services Occupations by Sex
Within the Services occupations in Olmsted Falls, the most male-oriented occupations are Law Enforcement (100.0%), Cleaning & Maintenance (98.8%), and Security & Protection (63.0%), while the most female-oriented occupations are Food Preparation & Serving (84.7%), Healthcare Support (80.8%), and Firefighting & Prevention (61.2%).
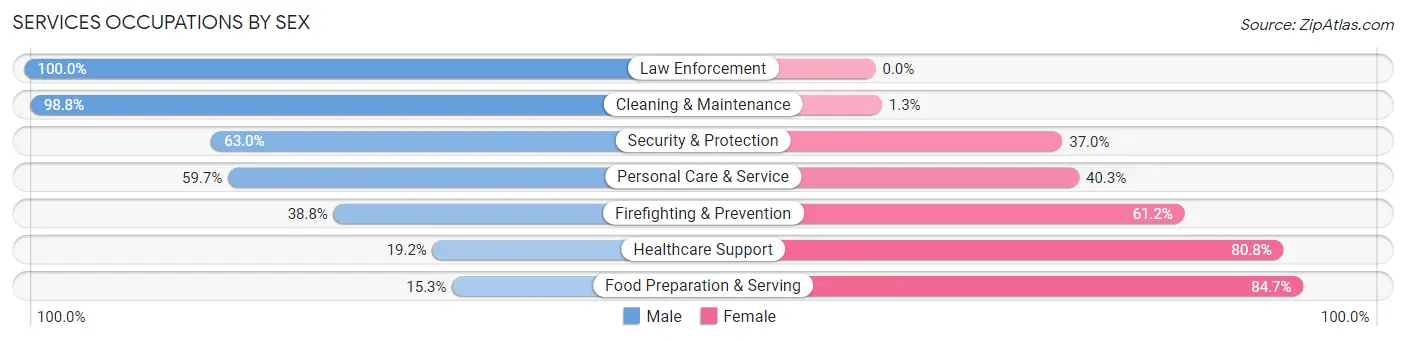
| Occupation | Male | Female |
| Healthcare Support | 19 (19.2%) | 80 (80.8%) |
| Security & Protection | 121 (63.0%) | 71 (37.0%) |
| Firefighting & Prevention | 45 (38.8%) | 71 (61.2%) |
| Law Enforcement | 76 (100.0%) | 0 (0.0%) |
| Food Preparation & Serving | 24 (15.3%) | 133 (84.7%) |
| Cleaning & Maintenance | 79 (98.8%) | 1 (1.3%) |
| Personal Care & Service | 80 (59.7%) | 54 (40.3%) |
| Total (Category) | 323 (48.8%) | 339 (51.2%) |
| Total (Overall) | 2,321 (52.1%) | 2,133 (47.9%) |
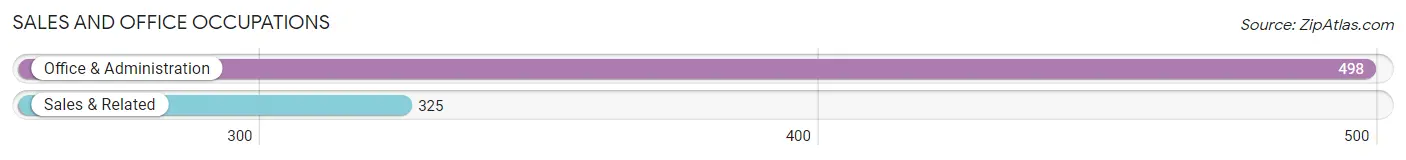
Sales and Office Occupations
The most common Sales and Office occupations in Olmsted Falls are Office & Administration (498 | 11.2%), and Sales & Related (325 | 7.3%).
Sales and Office Occupations by Sex
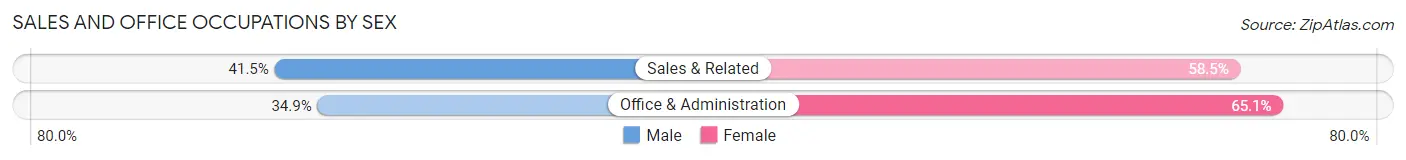
| Occupation | Male | Female |
| Sales & Related | 135 (41.5%) | 190 (58.5%) |
| Office & Administration | 174 (34.9%) | 324 (65.1%) |
| Total (Category) | 309 (37.6%) | 514 (62.5%) |
| Total (Overall) | 2,321 (52.1%) | 2,133 (47.9%) |
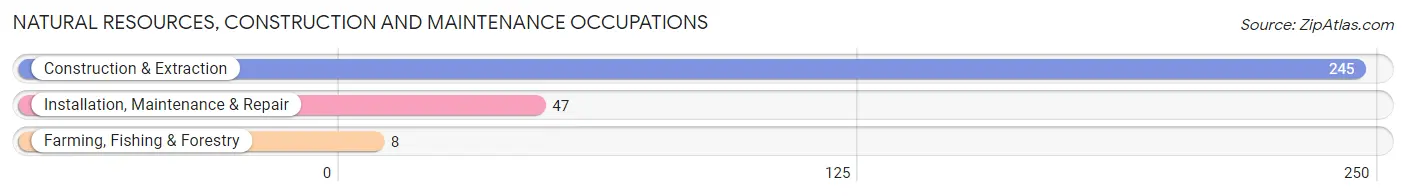
Natural Resources, Construction and Maintenance Occupations
The most common Natural Resources, Construction and Maintenance occupations in Olmsted Falls are Construction & Extraction (245 | 5.5%), Installation, Maintenance & Repair (47 | 1.1%), and Farming, Fishing & Forestry (8 | 0.2%).
Natural Resources, Construction and Maintenance Occupations by Sex
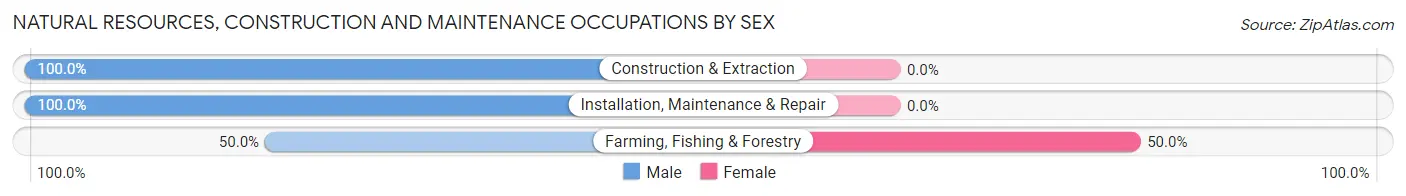
| Occupation | Male | Female |
| Farming, Fishing & Forestry | 4 (50.0%) | 4 (50.0%) |
| Construction & Extraction | 245 (100.0%) | 0 (0.0%) |
| Installation, Maintenance & Repair | 47 (100.0%) | 0 (0.0%) |
| Total (Category) | 296 (98.7%) | 4 (1.3%) |
| Total (Overall) | 2,321 (52.1%) | 2,133 (47.9%) |
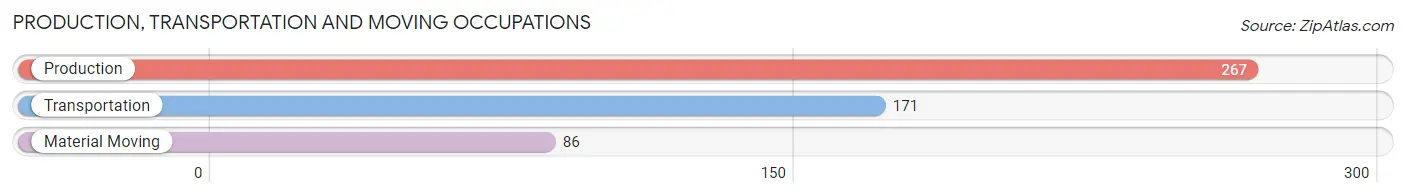
Production, Transportation and Moving Occupations
The most common Production, Transportation and Moving occupations in Olmsted Falls are Production (267 | 6.0%), Transportation (171 | 3.8%), and Material Moving (86 | 1.9%).
Production, Transportation and Moving Occupations by Sex
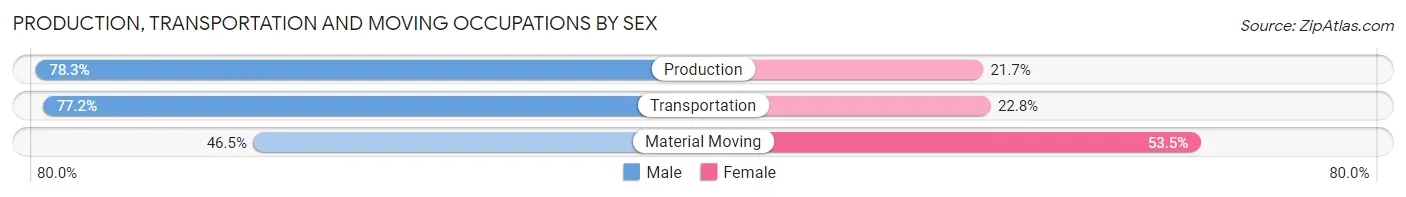
| Occupation | Male | Female |
| Production | 209 (78.3%) | 58 (21.7%) |
| Transportation | 132 (77.2%) | 39 (22.8%) |
| Material Moving | 40 (46.5%) | 46 (53.5%) |
| Total (Category) | 381 (72.7%) | 143 (27.3%) |
| Total (Overall) | 2,321 (52.1%) | 2,133 (47.9%) |
Employment Industries by Sex in Olmsted Falls
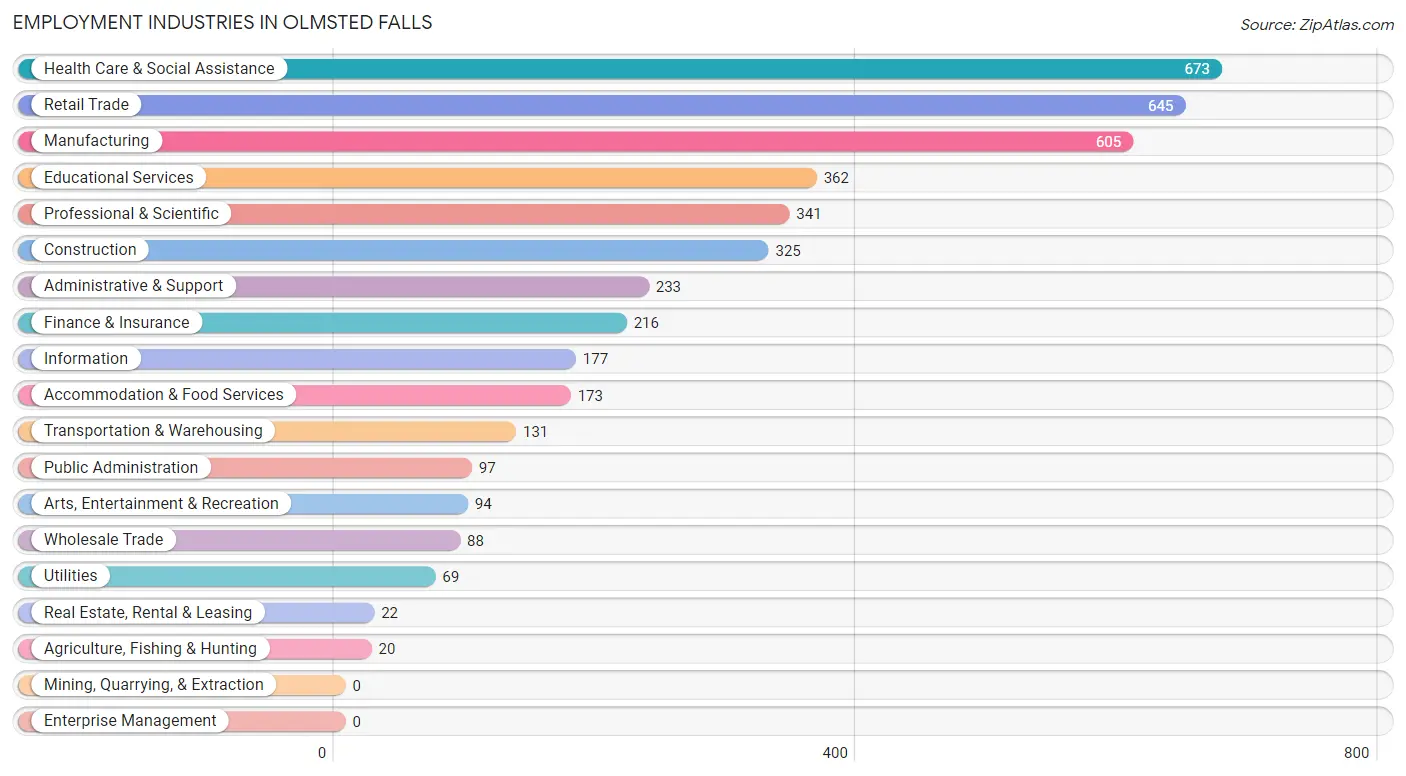
Employment Industries in Olmsted Falls
The major employment industries in Olmsted Falls include Health Care & Social Assistance (673 | 15.1%), Retail Trade (645 | 14.5%), Manufacturing (605 | 13.6%), Educational Services (362 | 8.1%), and Professional & Scientific (341 | 7.7%).
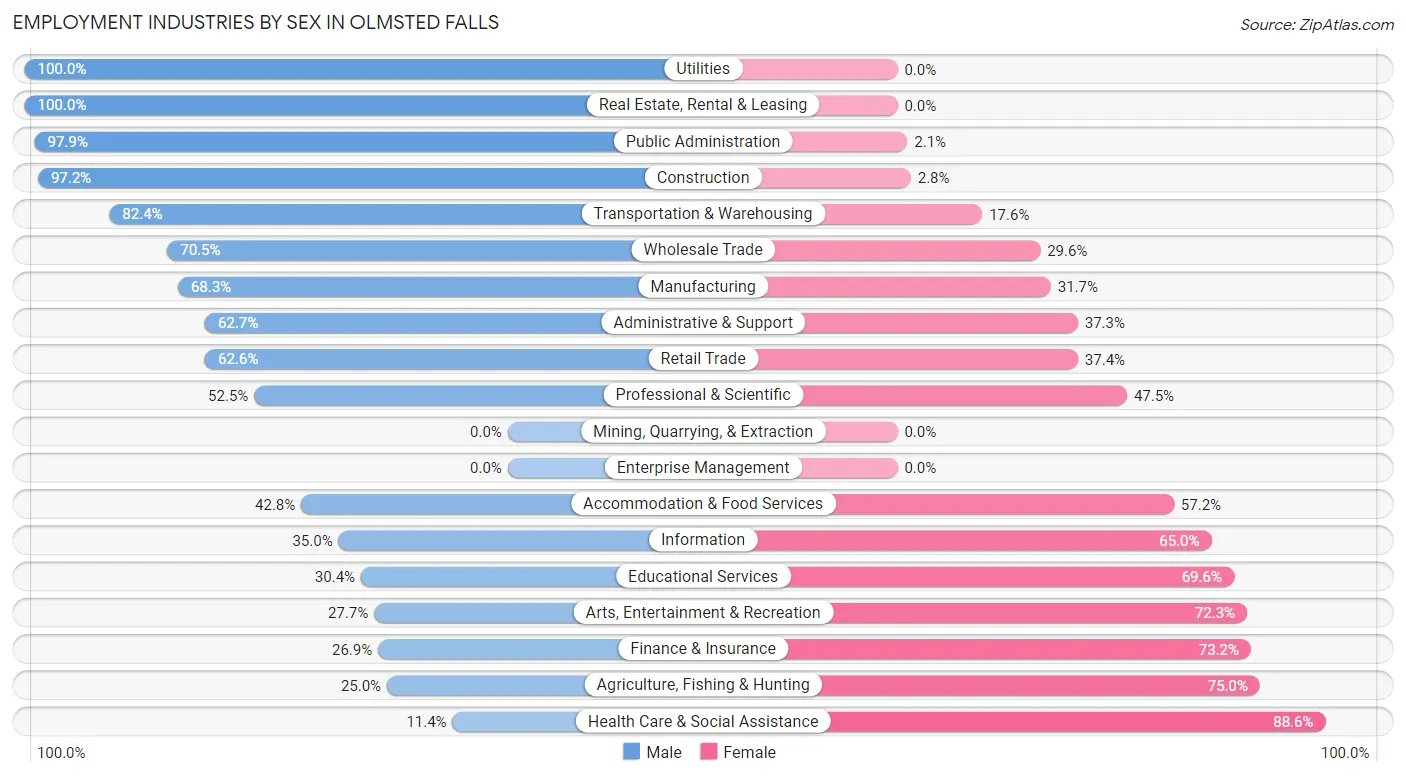
Employment Industries by Sex in Olmsted Falls
The Olmsted Falls industries that see more men than women are Utilities (100.0%), Real Estate, Rental & Leasing (100.0%), and Public Administration (97.9%), whereas the industries that tend to have a higher number of women are Health Care & Social Assistance (88.6%), Agriculture, Fishing & Hunting (75.0%), and Finance & Insurance (73.2%).
| Industry | Male | Female |
| Agriculture, Fishing & Hunting | 5 (25.0%) | 15 (75.0%) |
| Mining, Quarrying, & Extraction | 0 (0.0%) | 0 (0.0%) |
| Construction | 316 (97.2%) | 9 (2.8%) |
| Manufacturing | 413 (68.3%) | 192 (31.7%) |
| Wholesale Trade | 62 (70.5%) | 26 (29.5%) |
| Retail Trade | 404 (62.6%) | 241 (37.4%) |
| Transportation & Warehousing | 108 (82.4%) | 23 (17.6%) |
| Utilities | 69 (100.0%) | 0 (0.0%) |
| Information | 62 (35.0%) | 115 (65.0%) |
| Finance & Insurance | 58 (26.9%) | 158 (73.2%) |
| Real Estate, Rental & Leasing | 22 (100.0%) | 0 (0.0%) |
| Professional & Scientific | 179 (52.5%) | 162 (47.5%) |
| Enterprise Management | 0 (0.0%) | 0 (0.0%) |
| Administrative & Support | 146 (62.7%) | 87 (37.3%) |
| Educational Services | 110 (30.4%) | 252 (69.6%) |
| Health Care & Social Assistance | 77 (11.4%) | 596 (88.6%) |
| Arts, Entertainment & Recreation | 26 (27.7%) | 68 (72.3%) |
| Accommodation & Food Services | 74 (42.8%) | 99 (57.2%) |
| Public Administration | 95 (97.9%) | 2 (2.1%) |
| Total | 2,321 (52.1%) | 2,133 (47.9%) |
Education in Olmsted Falls
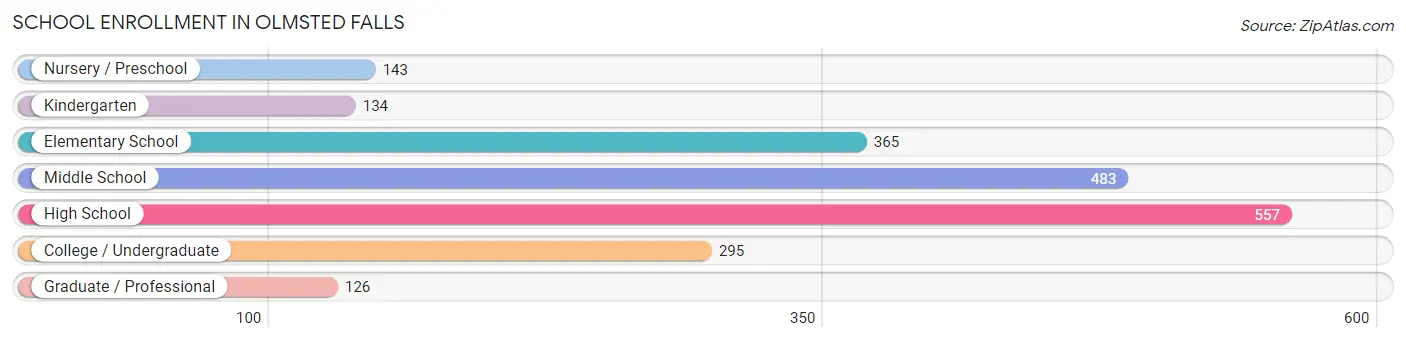
School Enrollment in Olmsted Falls
The most common levels of schooling among the 2,103 students in Olmsted Falls are high school (557 | 26.5%), middle school (483 | 23.0%), and elementary school (365 | 17.4%).
| School Level | # Students | % Students |
| Nursery / Preschool | 143 | 6.8% |
| Kindergarten | 134 | 6.4% |
| Elementary School | 365 | 17.4% |
| Middle School | 483 | 23.0% |
| High School | 557 | 26.5% |
| College / Undergraduate | 295 | 14.0% |
| Graduate / Professional | 126 | 6.0% |
| Total | 2,103 | 100.0% |
School Enrollment by Age by Funding Source in Olmsted Falls
Out of a total of 2,103 students who are enrolled in schools in Olmsted Falls, 217 (10.3%) attend a private institution, while the remaining 1,886 (89.7%) are enrolled in public schools. The age group of 35 years and over has the highest likelihood of being enrolled in private schools, with 86 (59.7% in the age bracket) enrolled. Conversely, the age group of 3 to 4 year olds has the lowest likelihood of being enrolled in a private school, with 143 (100.0% in the age bracket) attending a public institution.
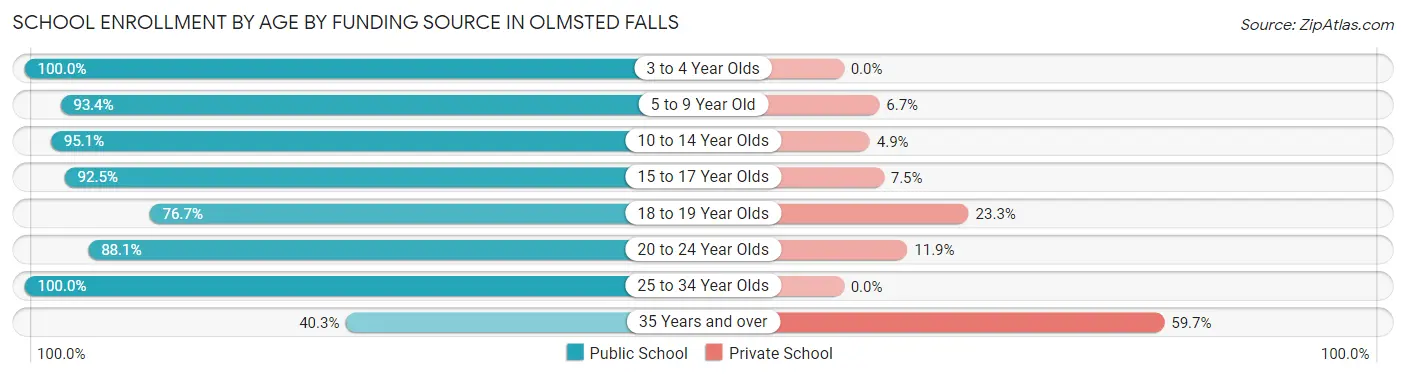
| Age Bracket | Public School | Private School |
| 3 to 4 Year Olds | 143 (100.0%) | 0 (0.0%) |
| 5 to 9 Year Old | 351 (93.3%) | 25 (6.7%) |
| 10 to 14 Year Olds | 604 (95.1%) | 31 (4.9%) |
| 15 to 17 Year Olds | 409 (92.5%) | 33 (7.5%) |
| 18 to 19 Year Olds | 89 (76.7%) | 27 (23.3%) |
| 20 to 24 Year Olds | 104 (88.1%) | 14 (11.9%) |
| 25 to 34 Year Olds | 129 (100.0%) | 0 (0.0%) |
| 35 Years and over | 58 (40.3%) | 86 (59.7%) |
| Total | 1,886 (89.7%) | 217 (10.3%) |
Educational Attainment by Field of Study in Olmsted Falls
Business (582 | 20.9%), education (506 | 18.2%), science & technology (344 | 12.4%), communications (218 | 7.8%), and arts & humanities (187 | 6.7%) are the most common fields of study among 2,784 individuals in Olmsted Falls who have obtained a bachelor's degree or higher.
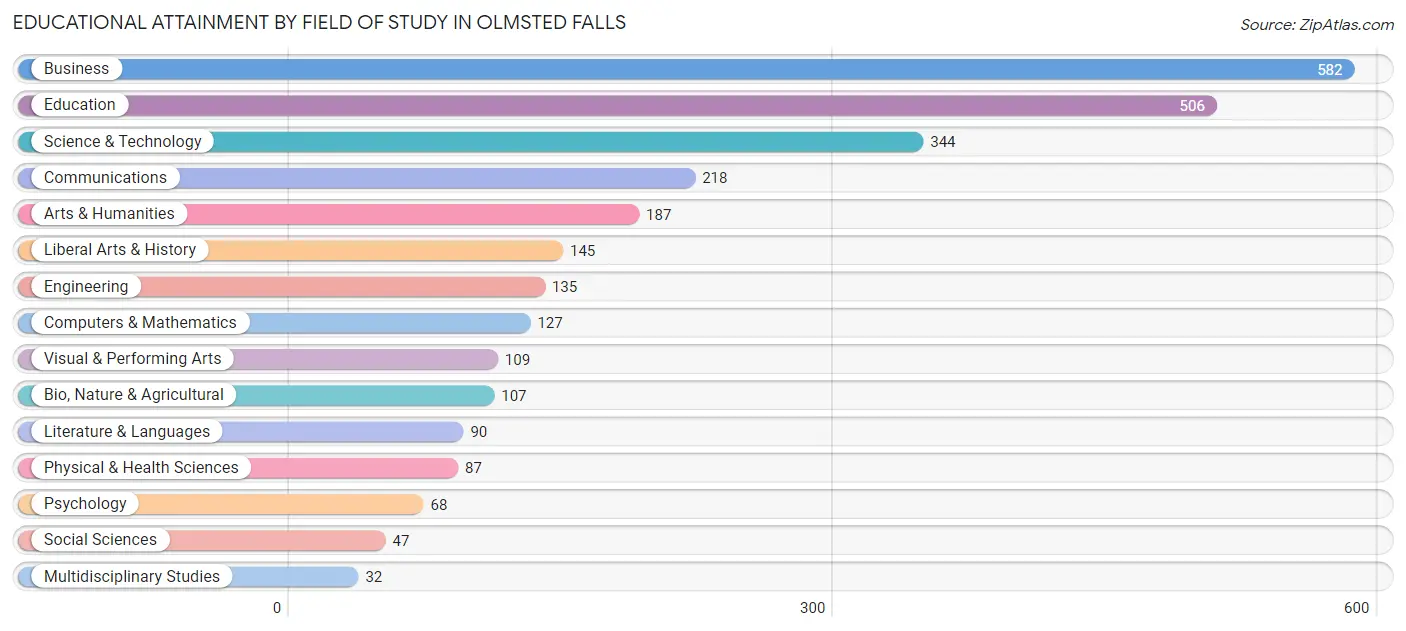
| Field of Study | # Graduates | % Graduates |
| Computers & Mathematics | 127 | 4.6% |
| Bio, Nature & Agricultural | 107 | 3.8% |
| Physical & Health Sciences | 87 | 3.1% |
| Psychology | 68 | 2.4% |
| Social Sciences | 47 | 1.7% |
| Engineering | 135 | 4.9% |
| Multidisciplinary Studies | 32 | 1.1% |
| Science & Technology | 344 | 12.4% |
| Business | 582 | 20.9% |
| Education | 506 | 18.2% |
| Literature & Languages | 90 | 3.2% |
| Liberal Arts & History | 145 | 5.2% |
| Visual & Performing Arts | 109 | 3.9% |
| Communications | 218 | 7.8% |
| Arts & Humanities | 187 | 6.7% |
| Total | 2,784 | 100.0% |
Transportation & Commute in Olmsted Falls
Vehicle Availability by Sex in Olmsted Falls
The most prevalent vehicle ownership categories in Olmsted Falls are males with 2 vehicles (1,178, accounting for 50.6%) and females with 2 vehicles (1,004, making up 57.0%).
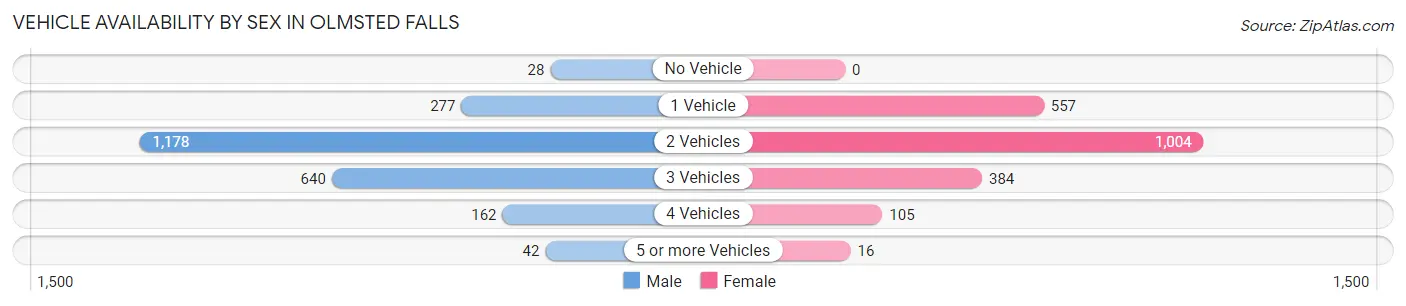
| Vehicles Available | Male | Female |
| No Vehicle | 28 (1.2%) | 0 (0.0%) |
| 1 Vehicle | 277 (11.9%) | 557 (27.0%) |
| 2 Vehicles | 1,178 (50.6%) | 1,004 (48.6%) |
| 3 Vehicles | 640 (27.5%) | 384 (18.6%) |
| 4 Vehicles | 162 (7.0%) | 105 (5.1%) |
| 5 or more Vehicles | 42 (1.8%) | 16 (0.8%) |
| Total | 2,327 (100.0%) | 2,066 (100.0%) |
Commute Time in Olmsted Falls
The most frequently occuring commute durations in Olmsted Falls are 25 to 29 minutes (576 commuters, 15.7%), 30 to 34 minutes (531 commuters, 14.5%), and 15 to 19 minutes (492 commuters, 13.5%).
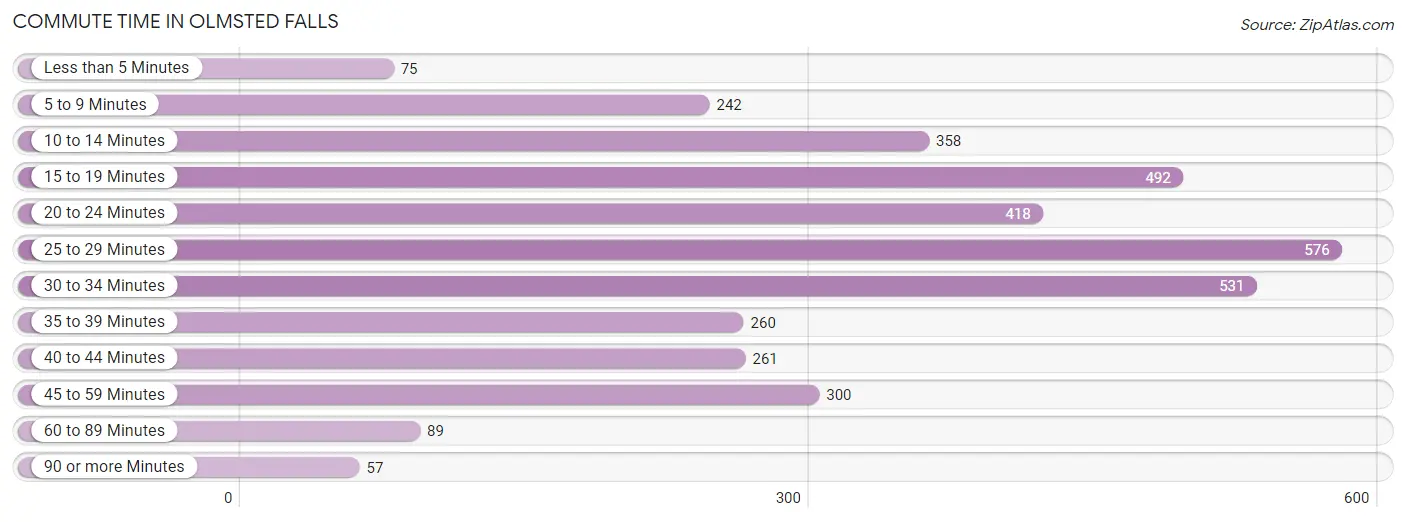
| Commute Time | # Commuters | % Commuters |
| Less than 5 Minutes | 75 | 2.1% |
| 5 to 9 Minutes | 242 | 6.6% |
| 10 to 14 Minutes | 358 | 9.8% |
| 15 to 19 Minutes | 492 | 13.5% |
| 20 to 24 Minutes | 418 | 11.4% |
| 25 to 29 Minutes | 576 | 15.7% |
| 30 to 34 Minutes | 531 | 14.5% |
| 35 to 39 Minutes | 260 | 7.1% |
| 40 to 44 Minutes | 261 | 7.1% |
| 45 to 59 Minutes | 300 | 8.2% |
| 60 to 89 Minutes | 89 | 2.4% |
| 90 or more Minutes | 57 | 1.6% |
Commute Time by Sex in Olmsted Falls
The most common commute times in Olmsted Falls are 25 to 29 minutes (369 commuters, 19.7%) for males and 15 to 19 minutes (272 commuters, 15.2%) for females.
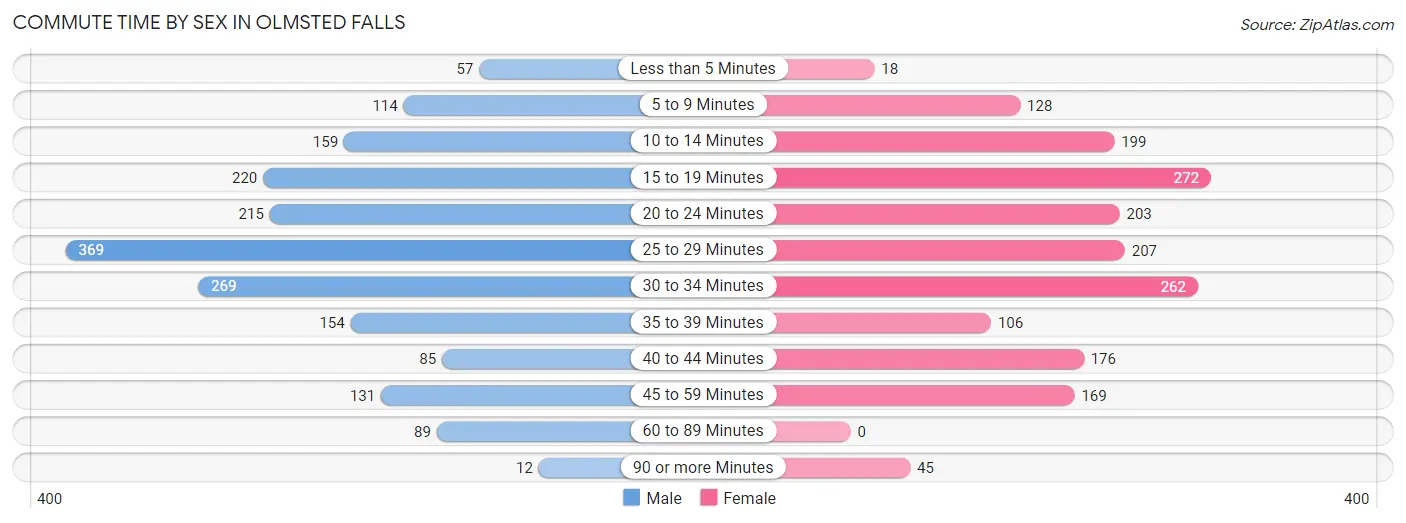
| Commute Time | Male | Female |
| Less than 5 Minutes | 57 (3.0%) | 18 (1.0%) |
| 5 to 9 Minutes | 114 (6.1%) | 128 (7.2%) |
| 10 to 14 Minutes | 159 (8.5%) | 199 (11.2%) |
| 15 to 19 Minutes | 220 (11.7%) | 272 (15.2%) |
| 20 to 24 Minutes | 215 (11.5%) | 203 (11.4%) |
| 25 to 29 Minutes | 369 (19.7%) | 207 (11.6%) |
| 30 to 34 Minutes | 269 (14.3%) | 262 (14.7%) |
| 35 to 39 Minutes | 154 (8.2%) | 106 (5.9%) |
| 40 to 44 Minutes | 85 (4.5%) | 176 (9.9%) |
| 45 to 59 Minutes | 131 (7.0%) | 169 (9.5%) |
| 60 to 89 Minutes | 89 (4.8%) | 0 (0.0%) |
| 90 or more Minutes | 12 (0.6%) | 45 (2.5%) |
Time of Departure to Work by Sex in Olmsted Falls
The most frequent times of departure to work in Olmsted Falls are 7:00 AM to 7:29 AM (248, 13.2%) for males and 7:00 AM to 7:29 AM (372, 20.8%) for females.
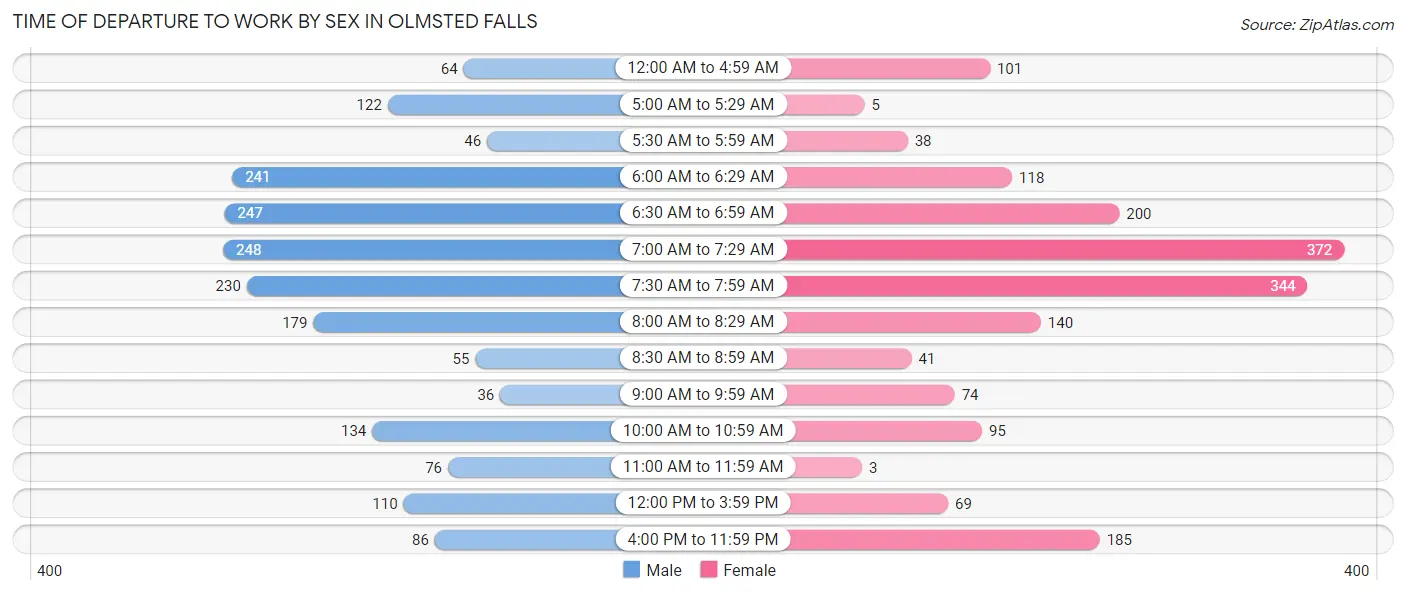
| Time of Departure | Male | Female |
| 12:00 AM to 4:59 AM | 64 (3.4%) | 101 (5.7%) |
| 5:00 AM to 5:29 AM | 122 (6.5%) | 5 (0.3%) |
| 5:30 AM to 5:59 AM | 46 (2.5%) | 38 (2.1%) |
| 6:00 AM to 6:29 AM | 241 (12.9%) | 118 (6.6%) |
| 6:30 AM to 6:59 AM | 247 (13.2%) | 200 (11.2%) |
| 7:00 AM to 7:29 AM | 248 (13.2%) | 372 (20.8%) |
| 7:30 AM to 7:59 AM | 230 (12.3%) | 344 (19.3%) |
| 8:00 AM to 8:29 AM | 179 (9.6%) | 140 (7.8%) |
| 8:30 AM to 8:59 AM | 55 (2.9%) | 41 (2.3%) |
| 9:00 AM to 9:59 AM | 36 (1.9%) | 74 (4.2%) |
| 10:00 AM to 10:59 AM | 134 (7.1%) | 95 (5.3%) |
| 11:00 AM to 11:59 AM | 76 (4.1%) | 3 (0.2%) |
| 12:00 PM to 3:59 PM | 110 (5.9%) | 69 (3.9%) |
| 4:00 PM to 11:59 PM | 86 (4.6%) | 185 (10.4%) |
| Total | 1,874 (100.0%) | 1,785 (100.0%) |
Housing Occupancy in Olmsted Falls
Occupancy by Ownership in Olmsted Falls
Of the total 3,712 dwellings in Olmsted Falls, owner-occupied units account for 3,150 (84.9%), while renter-occupied units make up 562 (15.1%).
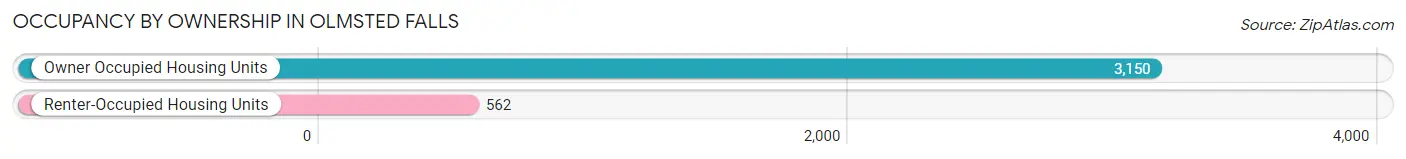
| Occupancy | # Housing Units | % Housing Units |
| Owner Occupied Housing Units | 3,150 | 84.9% |
| Renter-Occupied Housing Units | 562 | 15.1% |
| Total Occupied Housing Units | 3,712 | 100.0% |
Occupancy by Household Size in Olmsted Falls
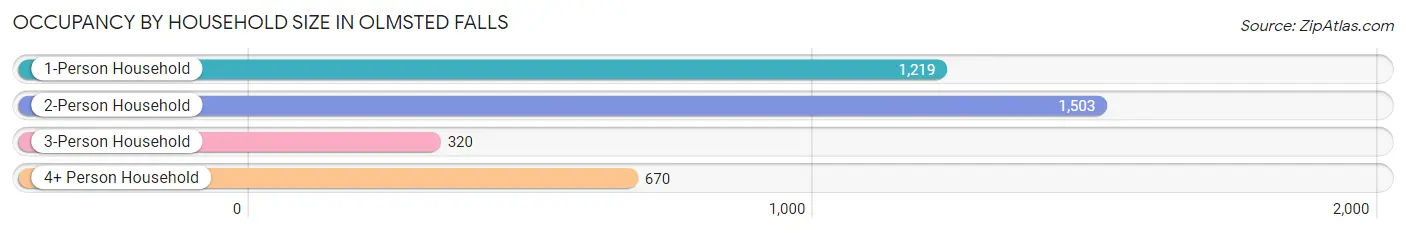
| Household Size | # Housing Units | % Housing Units |
| 1-Person Household | 1,219 | 32.8% |
| 2-Person Household | 1,503 | 40.5% |
| 3-Person Household | 320 | 8.6% |
| 4+ Person Household | 670 | 18.0% |
| Total Housing Units | 3,712 | 100.0% |
Occupancy by Ownership by Household Size in Olmsted Falls
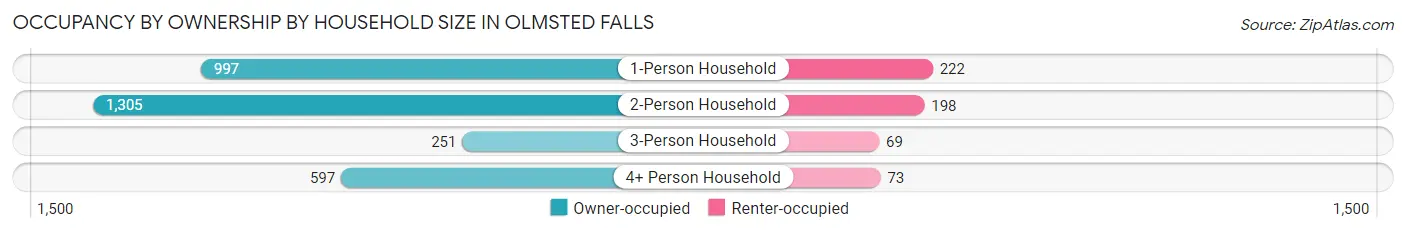
| Household Size | Owner-occupied | Renter-occupied |
| 1-Person Household | 997 (81.8%) | 222 (18.2%) |
| 2-Person Household | 1,305 (86.8%) | 198 (13.2%) |
| 3-Person Household | 251 (78.4%) | 69 (21.6%) |
| 4+ Person Household | 597 (89.1%) | 73 (10.9%) |
| Total Housing Units | 3,150 (84.9%) | 562 (15.1%) |
Occupancy by Educational Attainment in Olmsted Falls
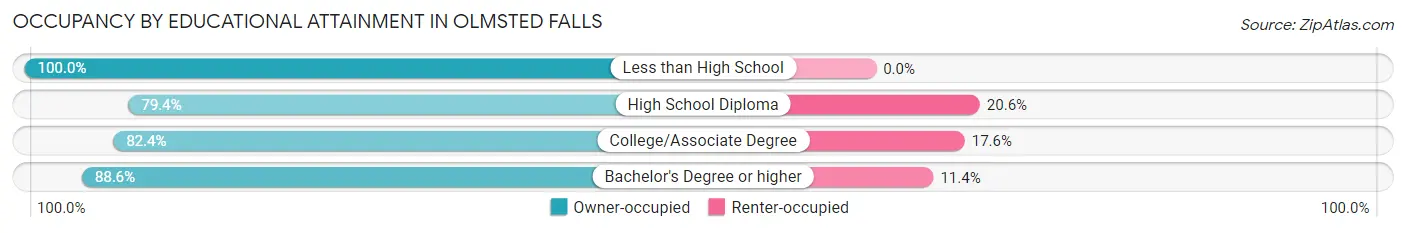
| Household Size | Owner-occupied | Renter-occupied |
| Less than High School | 107 (100.0%) | 0 (0.0%) |
| High School Diploma | 672 (79.4%) | 174 (20.6%) |
| College/Associate Degree | 990 (82.4%) | 211 (17.6%) |
| Bachelor's Degree or higher | 1,381 (88.6%) | 177 (11.4%) |
Occupancy by Age of Householder in Olmsted Falls
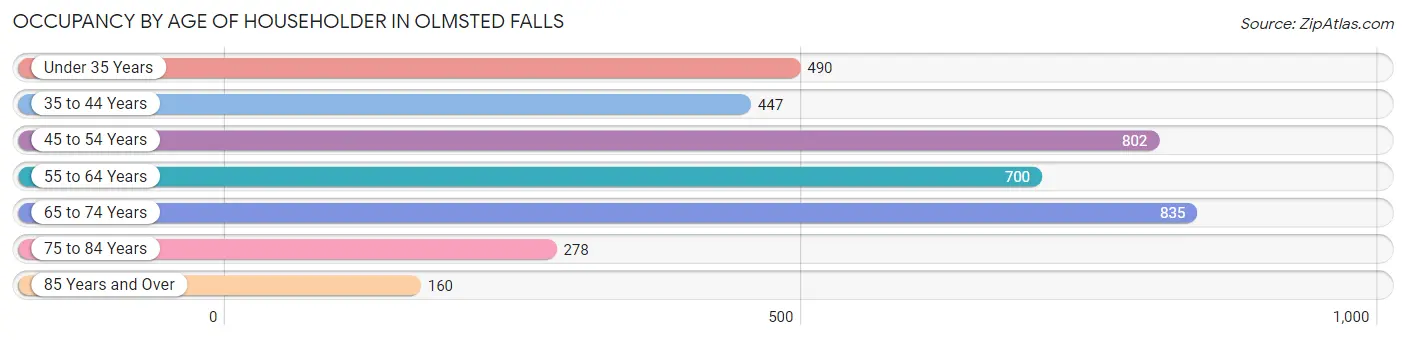
| Age Bracket | # Households | % Households |
| Under 35 Years | 490 | 13.2% |
| 35 to 44 Years | 447 | 12.0% |
| 45 to 54 Years | 802 | 21.6% |
| 55 to 64 Years | 700 | 18.9% |
| 65 to 74 Years | 835 | 22.5% |
| 75 to 84 Years | 278 | 7.5% |
| 85 Years and Over | 160 | 4.3% |
| Total | 3,712 | 100.0% |
Housing Finances in Olmsted Falls
Median Income by Occupancy in Olmsted Falls
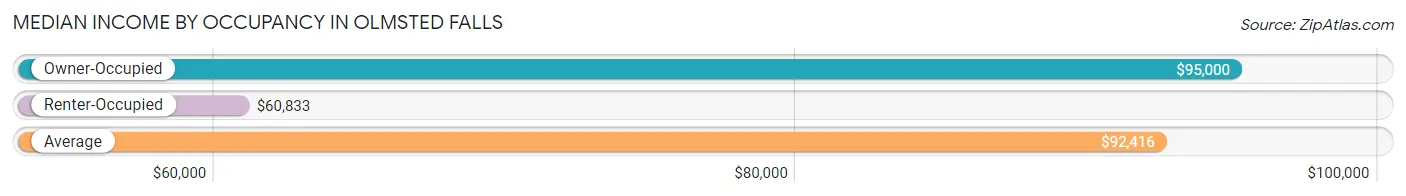
| Occupancy Type | # Households | Median Income |
| Owner-Occupied | 3,150 (84.9%) | $95,000 |
| Renter-Occupied | 562 (15.1%) | $60,833 |
| Average | 3,712 (100.0%) | $92,416 |
Occupancy by Householder Income Bracket in Olmsted Falls
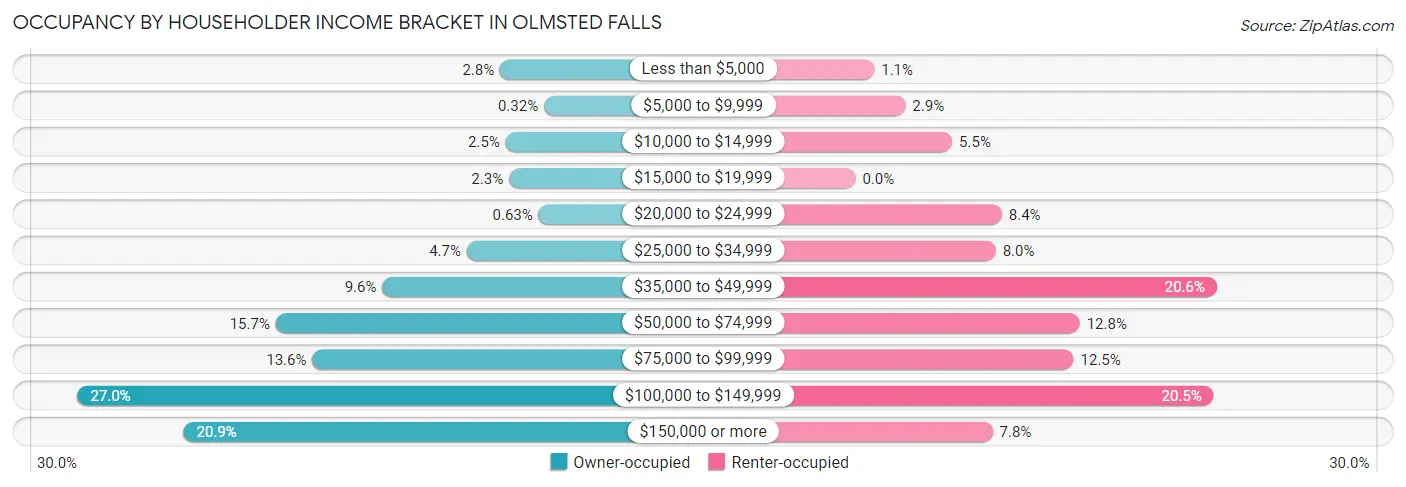
| Income Bracket | Owner-occupied | Renter-occupied |
| Less than $5,000 | 89 (2.8%) | 6 (1.1%) |
| $5,000 to $9,999 | 10 (0.3%) | 16 (2.9%) |
| $10,000 to $14,999 | 79 (2.5%) | 31 (5.5%) |
| $15,000 to $19,999 | 73 (2.3%) | 0 (0.0%) |
| $20,000 to $24,999 | 20 (0.6%) | 47 (8.4%) |
| $25,000 to $34,999 | 149 (4.7%) | 45 (8.0%) |
| $35,000 to $49,999 | 301 (9.6%) | 116 (20.6%) |
| $50,000 to $74,999 | 493 (15.7%) | 72 (12.8%) |
| $75,000 to $99,999 | 427 (13.6%) | 70 (12.5%) |
| $100,000 to $149,999 | 850 (27.0%) | 115 (20.5%) |
| $150,000 or more | 659 (20.9%) | 44 (7.8%) |
| Total | 3,150 (100.0%) | 562 (100.0%) |
Monthly Housing Cost Tiers in Olmsted Falls
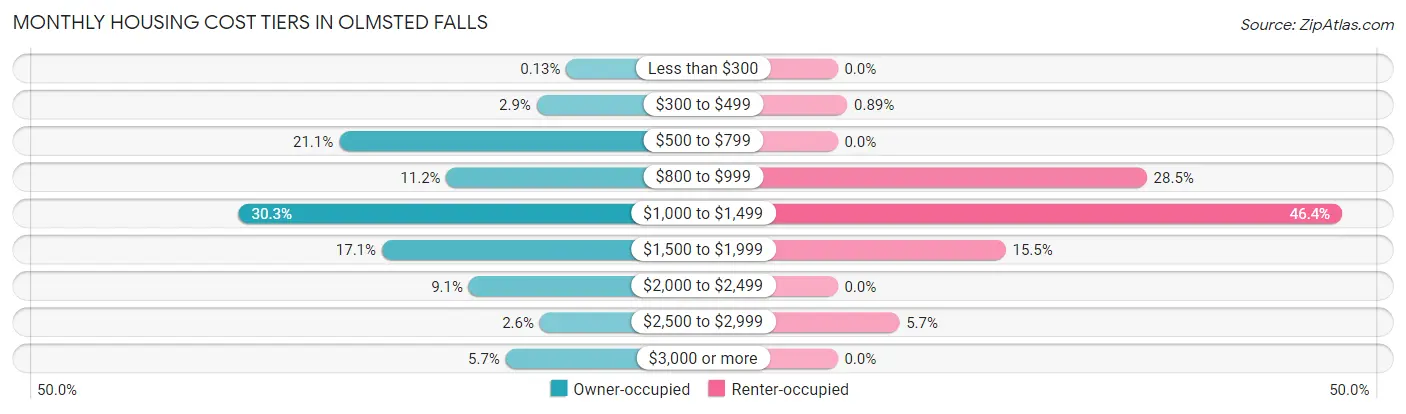
| Monthly Cost | Owner-occupied | Renter-occupied |
| Less than $300 | 4 (0.1%) | 0 (0.0%) |
| $300 to $499 | 90 (2.9%) | 5 (0.9%) |
| $500 to $799 | 663 (21.0%) | 0 (0.0%) |
| $800 to $999 | 352 (11.2%) | 160 (28.5%) |
| $1,000 to $1,499 | 954 (30.3%) | 261 (46.4%) |
| $1,500 to $1,999 | 539 (17.1%) | 87 (15.5%) |
| $2,000 to $2,499 | 287 (9.1%) | 0 (0.0%) |
| $2,500 to $2,999 | 81 (2.6%) | 32 (5.7%) |
| $3,000 or more | 180 (5.7%) | 0 (0.0%) |
| Total | 3,150 (100.0%) | 562 (100.0%) |
Physical Housing Characteristics in Olmsted Falls
Housing Structures in Olmsted Falls
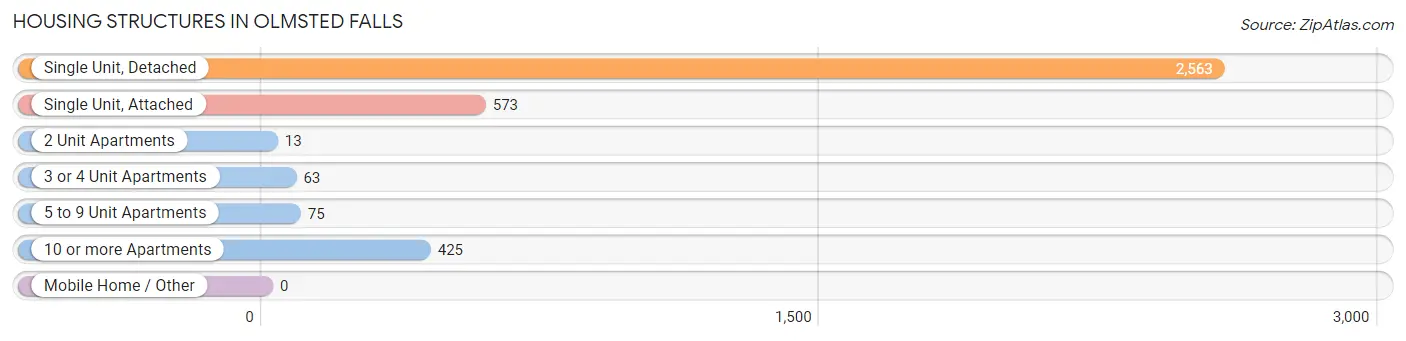
| Structure Type | # Housing Units | % Housing Units |
| Single Unit, Detached | 2,563 | 69.1% |
| Single Unit, Attached | 573 | 15.4% |
| 2 Unit Apartments | 13 | 0.4% |
| 3 or 4 Unit Apartments | 63 | 1.7% |
| 5 to 9 Unit Apartments | 75 | 2.0% |
| 10 or more Apartments | 425 | 11.5% |
| Mobile Home / Other | 0 | 0.0% |
| Total | 3,712 | 100.0% |
Housing Structures by Occupancy in Olmsted Falls
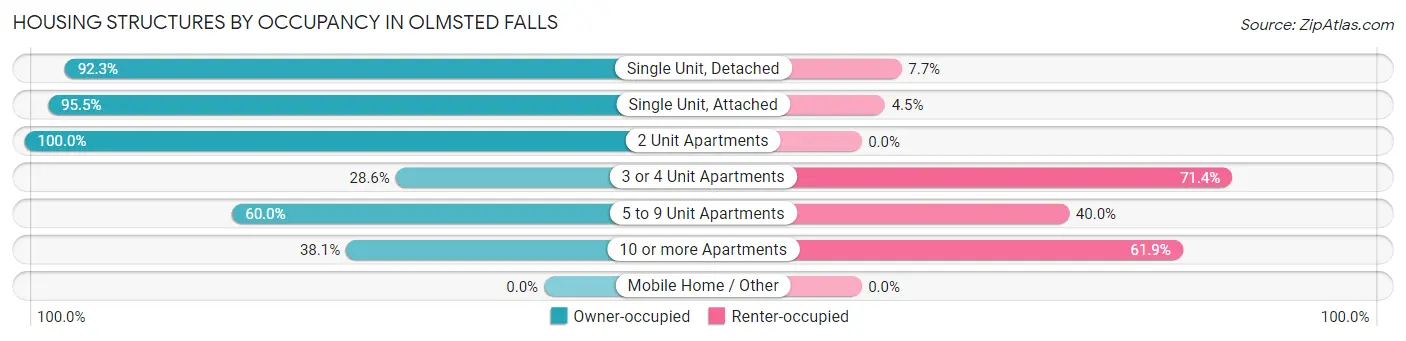
| Structure Type | Owner-occupied | Renter-occupied |
| Single Unit, Detached | 2,365 (92.3%) | 198 (7.7%) |
| Single Unit, Attached | 547 (95.5%) | 26 (4.5%) |
| 2 Unit Apartments | 13 (100.0%) | 0 (0.0%) |
| 3 or 4 Unit Apartments | 18 (28.6%) | 45 (71.4%) |
| 5 to 9 Unit Apartments | 45 (60.0%) | 30 (40.0%) |
| 10 or more Apartments | 162 (38.1%) | 263 (61.9%) |
| Mobile Home / Other | 0 (0.0%) | 0 (0.0%) |
| Total | 3,150 (84.9%) | 562 (15.1%) |
Housing Structures by Number of Rooms in Olmsted Falls
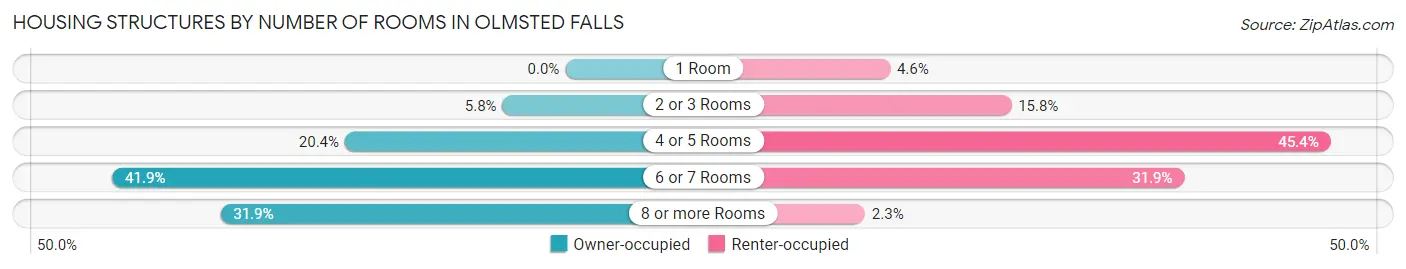
| Number of Rooms | Owner-occupied | Renter-occupied |
| 1 Room | 0 (0.0%) | 26 (4.6%) |
| 2 or 3 Rooms | 183 (5.8%) | 89 (15.8%) |
| 4 or 5 Rooms | 642 (20.4%) | 255 (45.4%) |
| 6 or 7 Rooms | 1,320 (41.9%) | 179 (31.9%) |
| 8 or more Rooms | 1,005 (31.9%) | 13 (2.3%) |
| Total | 3,150 (100.0%) | 562 (100.0%) |
Housing Structure by Heating Type in Olmsted Falls
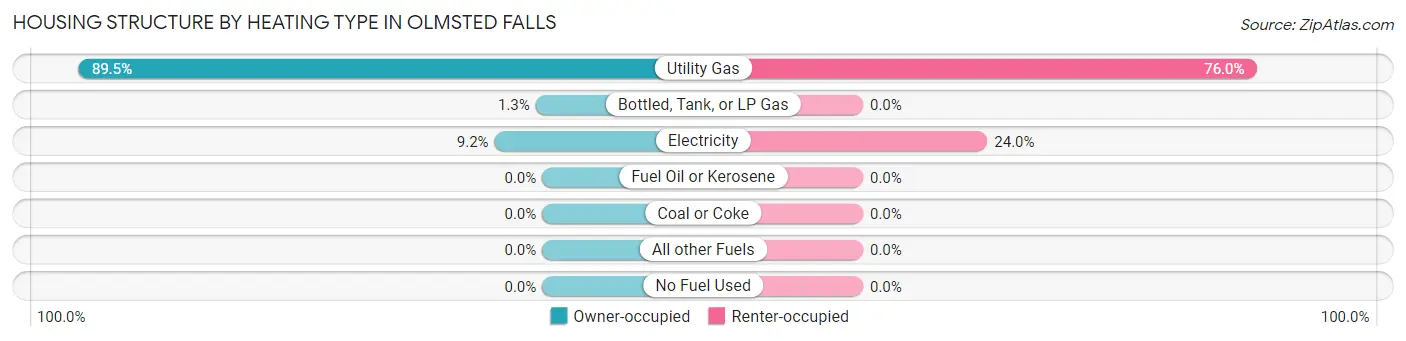
| Heating Type | Owner-occupied | Renter-occupied |
| Utility Gas | 2,820 (89.5%) | 427 (76.0%) |
| Bottled, Tank, or LP Gas | 40 (1.3%) | 0 (0.0%) |
| Electricity | 290 (9.2%) | 135 (24.0%) |
| Fuel Oil or Kerosene | 0 (0.0%) | 0 (0.0%) |
| Coal or Coke | 0 (0.0%) | 0 (0.0%) |
| All other Fuels | 0 (0.0%) | 0 (0.0%) |
| No Fuel Used | 0 (0.0%) | 0 (0.0%) |
| Total | 3,150 (100.0%) | 562 (100.0%) |
Household Vehicle Usage in Olmsted Falls
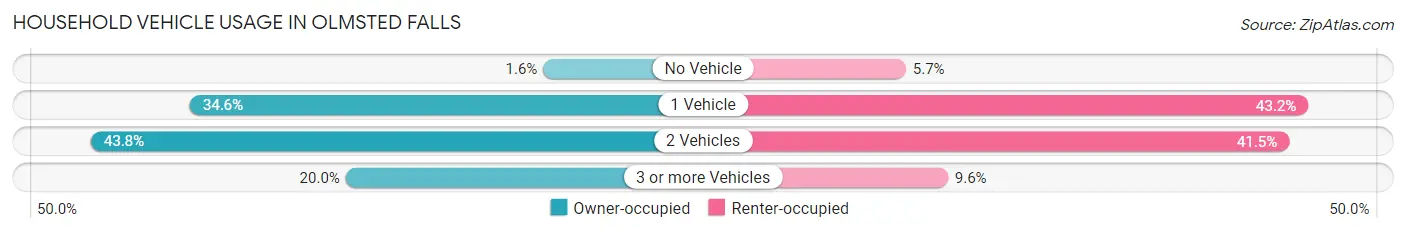
| Vehicles per Household | Owner-occupied | Renter-occupied |
| No Vehicle | 50 (1.6%) | 32 (5.7%) |
| 1 Vehicle | 1,089 (34.6%) | 243 (43.2%) |
| 2 Vehicles | 1,380 (43.8%) | 233 (41.5%) |
| 3 or more Vehicles | 631 (20.0%) | 54 (9.6%) |
| Total | 3,150 (100.0%) | 562 (100.0%) |
Real Estate & Mortgages in Olmsted Falls
Real Estate and Mortgage Overview in Olmsted Falls
| Characteristic | Without Mortgage | With Mortgage |
| Housing Units | 1,194 | 1,956 |
| Median Property Value | $213,700 | $191,700 |
| Median Household Income | $77,206 | $411 |
| Monthly Housing Costs | $785 | $180 |
| Real Estate Taxes | $5,415 | $48 |
Property Value by Mortgage Status in Olmsted Falls
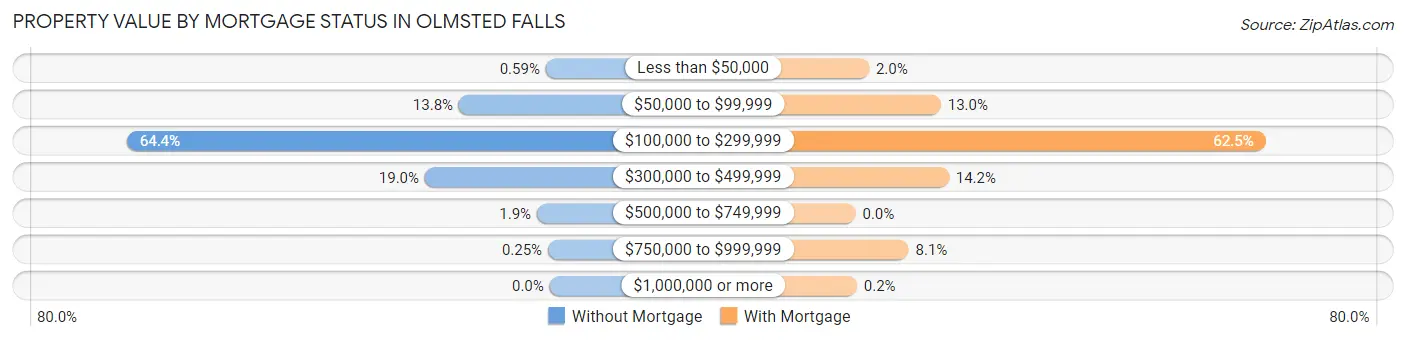
| Property Value | Without Mortgage | With Mortgage |
| Less than $50,000 | 7 (0.6%) | 40 (2.0%) |
| $50,000 to $99,999 | 165 (13.8%) | 254 (13.0%) |
| $100,000 to $299,999 | 769 (64.4%) | 1,222 (62.5%) |
| $300,000 to $499,999 | 227 (19.0%) | 278 (14.2%) |
| $500,000 to $749,999 | 23 (1.9%) | 0 (0.0%) |
| $750,000 to $999,999 | 3 (0.3%) | 158 (8.1%) |
| $1,000,000 or more | 0 (0.0%) | 4 (0.2%) |
| Total | 1,194 (100.0%) | 1,956 (100.0%) |
Household Income by Mortgage Status in Olmsted Falls
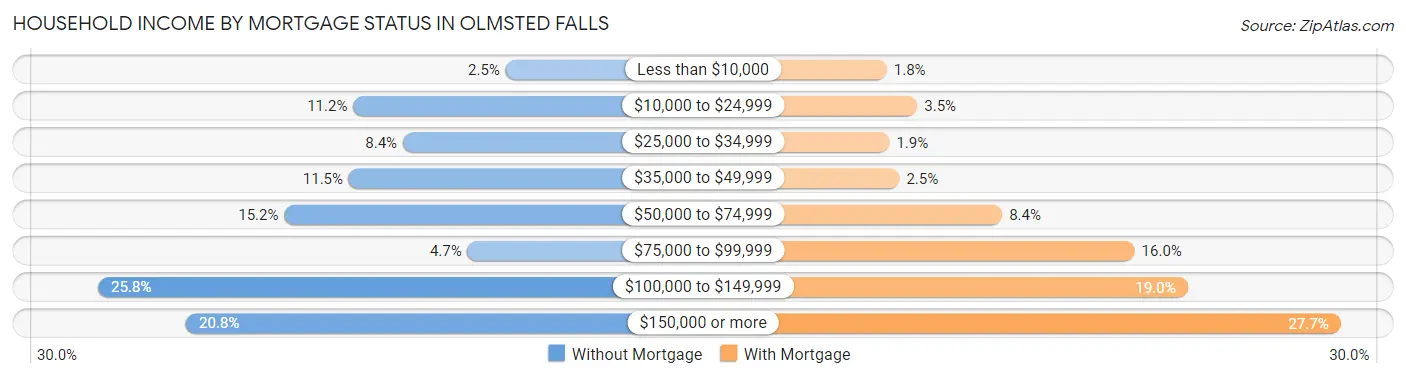
| Household Income | Without Mortgage | With Mortgage |
| Less than $10,000 | 30 (2.5%) | 35 (1.8%) |
| $10,000 to $24,999 | 134 (11.2%) | 69 (3.5%) |
| $25,000 to $34,999 | 100 (8.4%) | 38 (1.9%) |
| $35,000 to $49,999 | 137 (11.5%) | 49 (2.5%) |
| $50,000 to $74,999 | 181 (15.2%) | 164 (8.4%) |
| $75,000 to $99,999 | 56 (4.7%) | 312 (16.0%) |
| $100,000 to $149,999 | 308 (25.8%) | 371 (19.0%) |
| $150,000 or more | 248 (20.8%) | 542 (27.7%) |
| Total | 1,194 (100.0%) | 1,956 (100.0%) |
Property Value to Household Income Ratio in Olmsted Falls
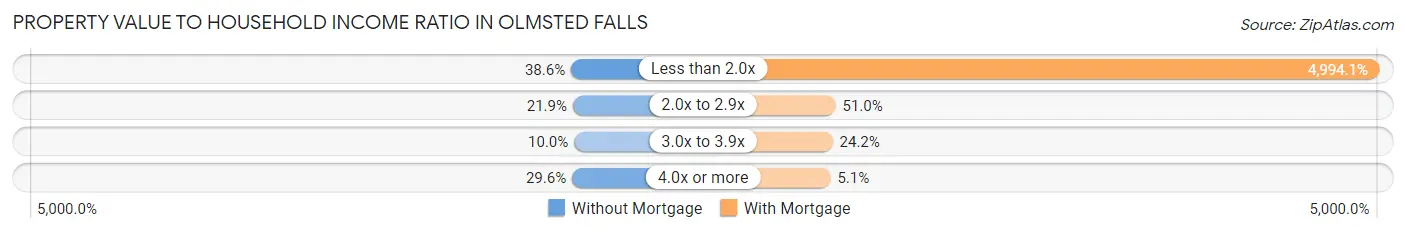
| Value-to-Income Ratio | Without Mortgage | With Mortgage |
| Less than 2.0x | 461 (38.6%) | 97,685 (4,994.1%) |
| 2.0x to 2.9x | 261 (21.9%) | 998 (51.0%) |
| 3.0x to 3.9x | 119 (10.0%) | 474 (24.2%) |
| 4.0x or more | 353 (29.6%) | 100 (5.1%) |
| Total | 1,194 (100.0%) | 1,956 (100.0%) |
Real Estate Taxes by Mortgage Status in Olmsted Falls
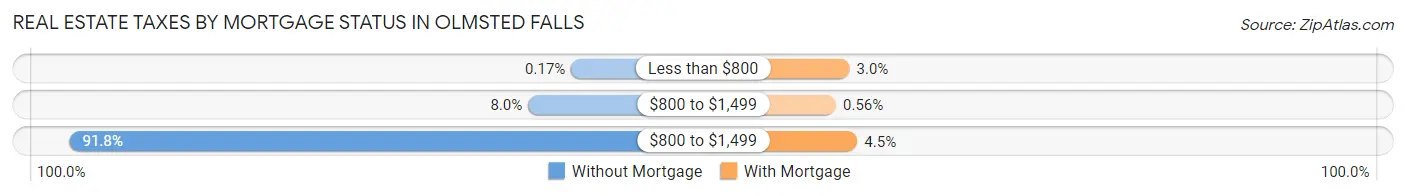
| Property Taxes | Without Mortgage | With Mortgage |
| Less than $800 | 2 (0.2%) | 59 (3.0%) |
| $800 to $1,499 | 96 (8.0%) | 11 (0.6%) |
| $800 to $1,499 | 1,096 (91.8%) | 87 (4.4%) |
| Total | 1,194 (100.0%) | 1,956 (100.0%) |
Health & Disability in Olmsted Falls
Health Insurance Coverage by Age in Olmsted Falls
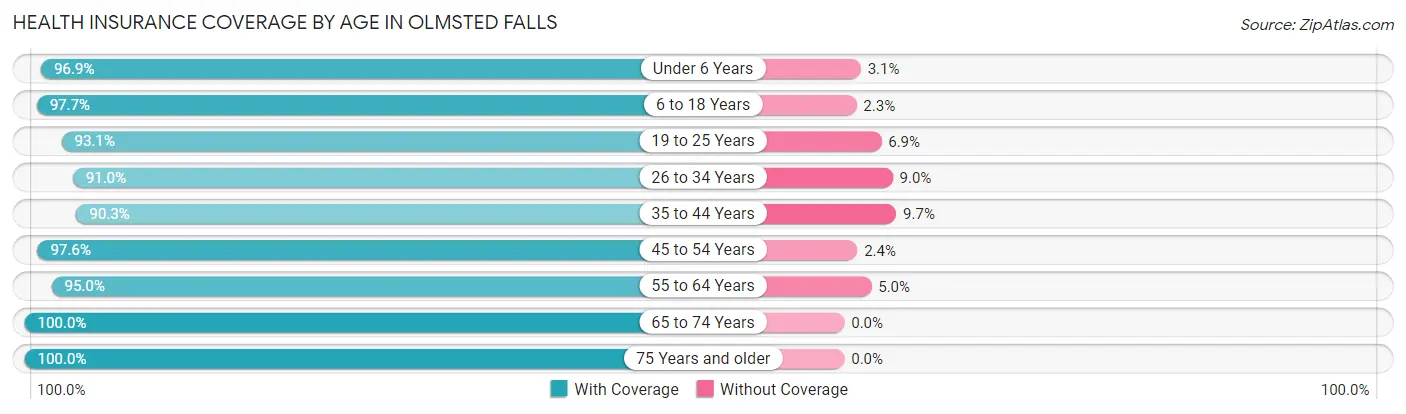
| Age Bracket | With Coverage | Without Coverage |
| Under 6 Years | 539 (96.9%) | 17 (3.1%) |
| 6 to 18 Years | 1,430 (97.7%) | 33 (2.3%) |
| 19 to 25 Years | 351 (93.1%) | 26 (6.9%) |
| 26 to 34 Years | 870 (91.0%) | 86 (9.0%) |
| 35 to 44 Years | 915 (90.3%) | 98 (9.7%) |
| 45 to 54 Years | 1,093 (97.6%) | 27 (2.4%) |
| 55 to 64 Years | 1,151 (95.0%) | 61 (5.0%) |
| 65 to 74 Years | 1,271 (100.0%) | 0 (0.0%) |
| 75 Years and older | 597 (100.0%) | 0 (0.0%) |
| Total | 8,217 (95.9%) | 348 (4.1%) |
Health Insurance Coverage by Citizenship Status in Olmsted Falls
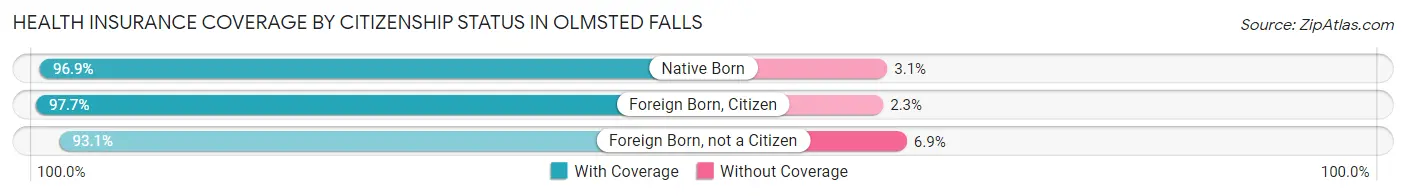
| Citizenship Status | With Coverage | Without Coverage |
| Native Born | 539 (96.9%) | 17 (3.1%) |
| Foreign Born, Citizen | 1,430 (97.7%) | 33 (2.3%) |
| Foreign Born, not a Citizen | 351 (93.1%) | 26 (6.9%) |
Health Insurance Coverage by Household Income in Olmsted Falls
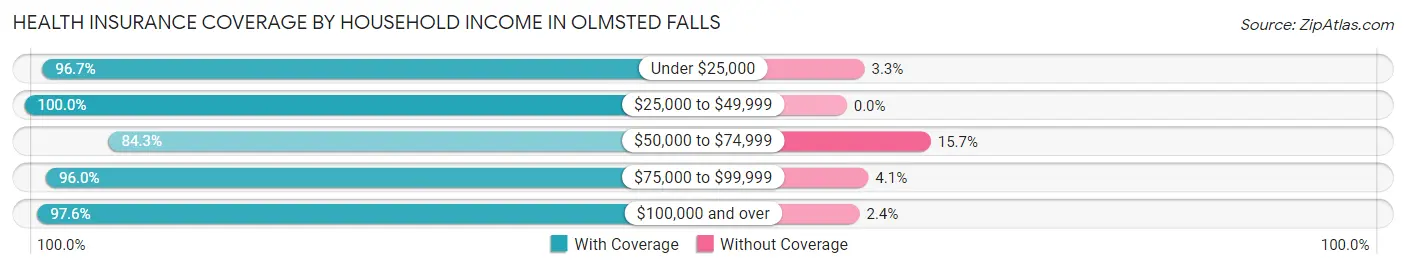
| Household Income | With Coverage | Without Coverage |
| Under $25,000 | 408 (96.7%) | 14 (3.3%) |
| $25,000 to $49,999 | 898 (100.0%) | 0 (0.0%) |
| $50,000 to $74,999 | 883 (84.3%) | 165 (15.7%) |
| $75,000 to $99,999 | 1,232 (96.0%) | 52 (4.1%) |
| $100,000 and over | 4,784 (97.6%) | 117 (2.4%) |
Public vs Private Health Insurance Coverage by Age in Olmsted Falls
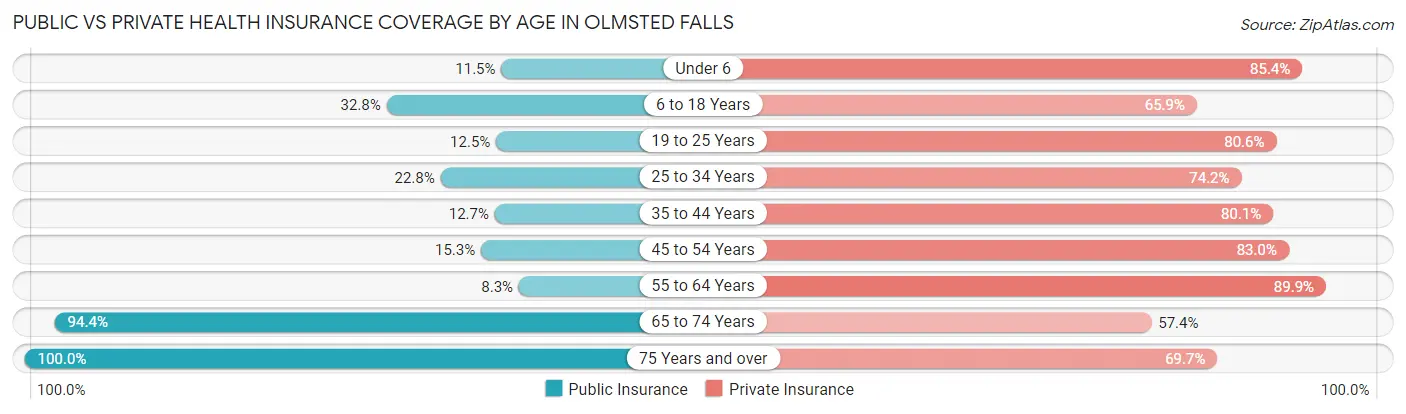
| Age Bracket | Public Insurance | Private Insurance |
| Under 6 | 64 (11.5%) | 475 (85.4%) |
| 6 to 18 Years | 480 (32.8%) | 964 (65.9%) |
| 19 to 25 Years | 47 (12.5%) | 304 (80.6%) |
| 25 to 34 Years | 218 (22.8%) | 709 (74.2%) |
| 35 to 44 Years | 129 (12.7%) | 811 (80.1%) |
| 45 to 54 Years | 171 (15.3%) | 929 (83.0%) |
| 55 to 64 Years | 100 (8.3%) | 1,089 (89.8%) |
| 65 to 74 Years | 1,200 (94.4%) | 730 (57.4%) |
| 75 Years and over | 597 (100.0%) | 416 (69.7%) |
| Total | 3,006 (35.1%) | 6,427 (75.0%) |
Disability Status by Sex by Age in Olmsted Falls
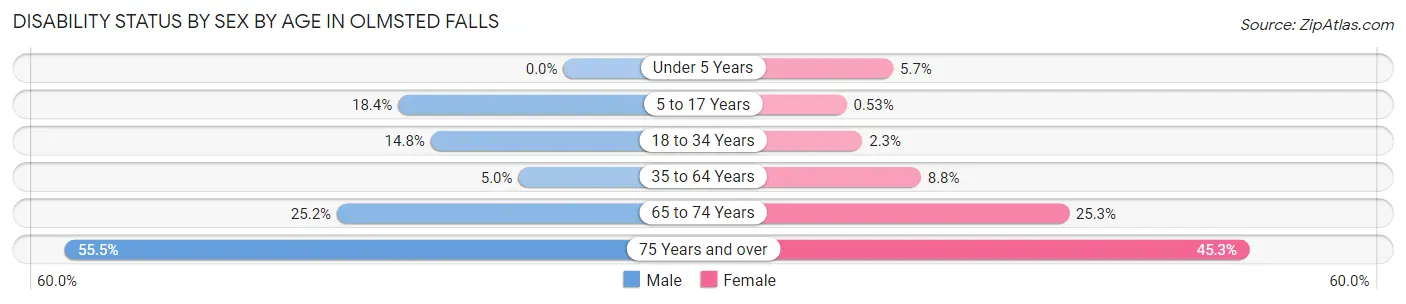
| Age Bracket | Male | Female |
| Under 5 Years | 0 (0.0%) | 12 (5.7%) |
| 5 to 17 Years | 95 (18.4%) | 5 (0.5%) |
| 18 to 34 Years | 89 (14.8%) | 18 (2.3%) |
| 35 to 64 Years | 84 (5.0%) | 147 (8.8%) |
| 65 to 74 Years | 145 (25.2%) | 176 (25.3%) |
| 75 Years and over | 106 (55.5%) | 184 (45.3%) |
Disability Class by Sex by Age in Olmsted Falls
Disability Class: Hearing Difficulty
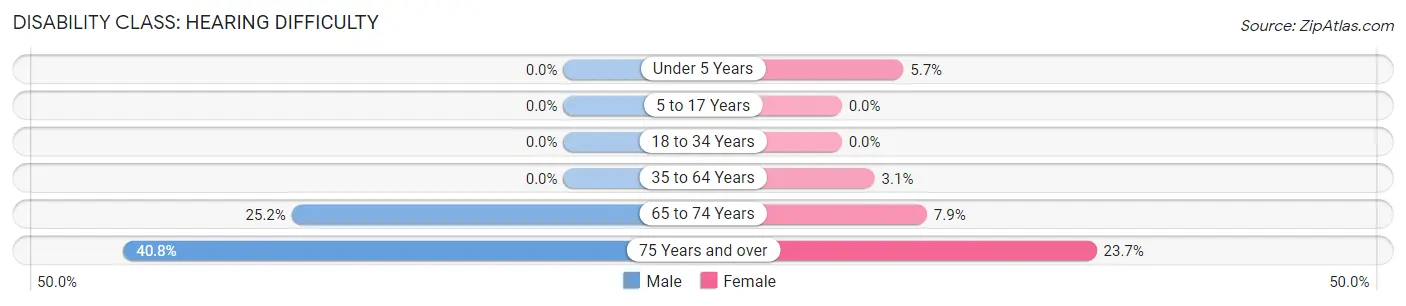
| Age Bracket | Male | Female |
| Under 5 Years | 0 (0.0%) | 12 (5.7%) |
| 5 to 17 Years | 0 (0.0%) | 0 (0.0%) |
| 18 to 34 Years | 0 (0.0%) | 0 (0.0%) |
| 35 to 64 Years | 0 (0.0%) | 51 (3.0%) |
| 65 to 74 Years | 145 (25.2%) | 55 (7.9%) |
| 75 Years and over | 78 (40.8%) | 96 (23.6%) |
Disability Class: Vision Difficulty
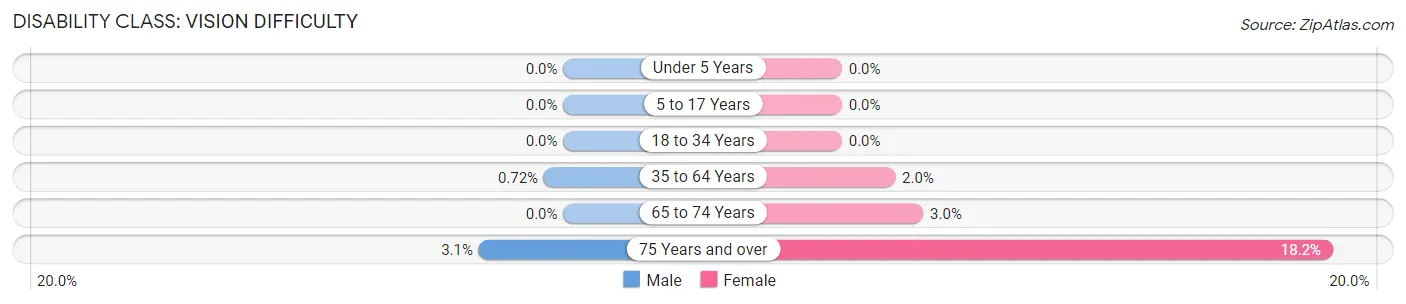
| Age Bracket | Male | Female |
| Under 5 Years | 0 (0.0%) | 0 (0.0%) |
| 5 to 17 Years | 0 (0.0%) | 0 (0.0%) |
| 18 to 34 Years | 0 (0.0%) | 0 (0.0%) |
| 35 to 64 Years | 12 (0.7%) | 33 (2.0%) |
| 65 to 74 Years | 0 (0.0%) | 21 (3.0%) |
| 75 Years and over | 6 (3.1%) | 74 (18.2%) |
Disability Class: Cognitive Difficulty
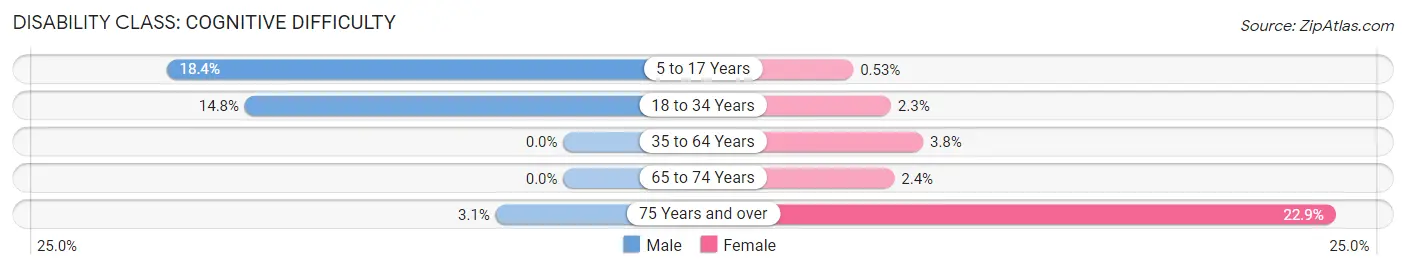
| Age Bracket | Male | Female |
| 5 to 17 Years | 95 (18.4%) | 5 (0.5%) |
| 18 to 34 Years | 89 (14.8%) | 18 (2.3%) |
| 35 to 64 Years | 0 (0.0%) | 63 (3.8%) |
| 65 to 74 Years | 0 (0.0%) | 17 (2.4%) |
| 75 Years and over | 6 (3.1%) | 93 (22.9%) |
Disability Class: Ambulatory Difficulty
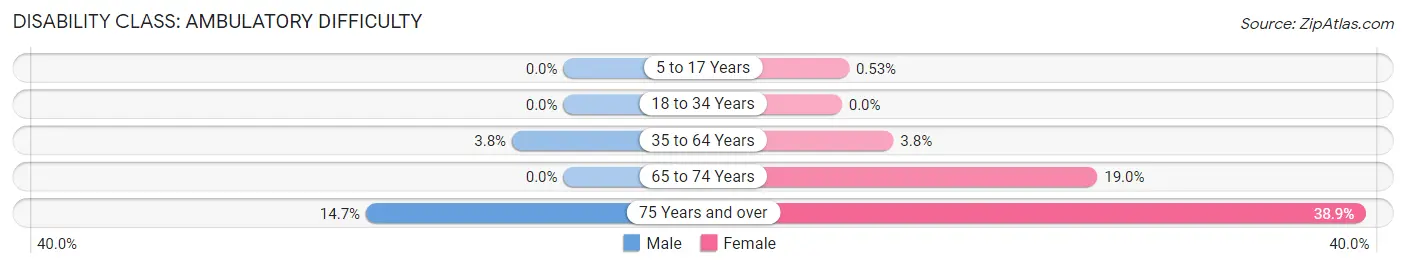
| Age Bracket | Male | Female |
| 5 to 17 Years | 0 (0.0%) | 5 (0.5%) |
| 18 to 34 Years | 0 (0.0%) | 0 (0.0%) |
| 35 to 64 Years | 64 (3.8%) | 64 (3.8%) |
| 65 to 74 Years | 0 (0.0%) | 132 (19.0%) |
| 75 Years and over | 28 (14.7%) | 158 (38.9%) |
Disability Class: Self-Care Difficulty
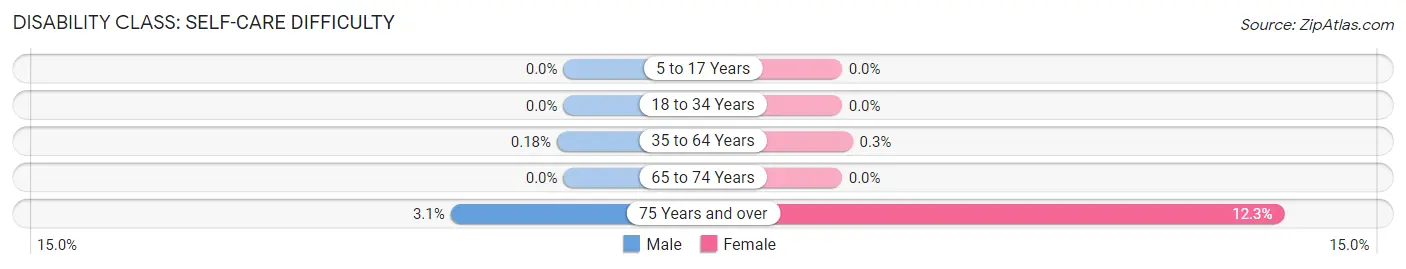
| Age Bracket | Male | Female |
| 5 to 17 Years | 0 (0.0%) | 0 (0.0%) |
| 18 to 34 Years | 0 (0.0%) | 0 (0.0%) |
| 35 to 64 Years | 3 (0.2%) | 5 (0.3%) |
| 65 to 74 Years | 0 (0.0%) | 0 (0.0%) |
| 75 Years and over | 6 (3.1%) | 50 (12.3%) |
Technology Access in Olmsted Falls
Computing Device Access in Olmsted Falls
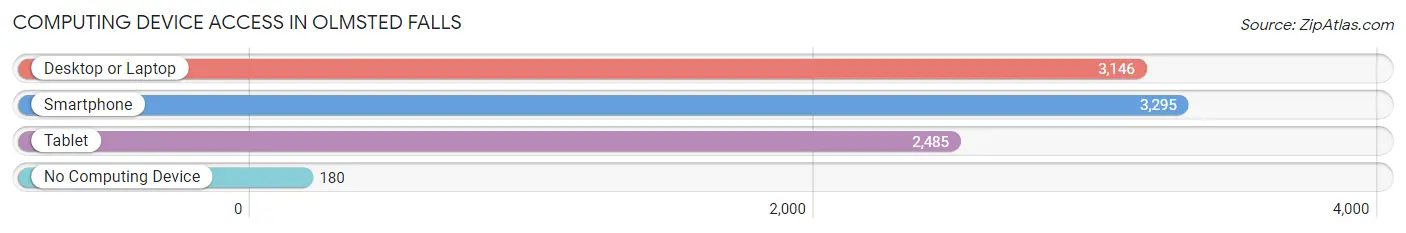
| Device Type | # Households | % Households |
| Desktop or Laptop | 3,146 | 84.8% |
| Smartphone | 3,295 | 88.8% |
| Tablet | 2,485 | 66.9% |
| No Computing Device | 180 | 4.9% |
| Total | 3,712 | 100.0% |
Internet Access in Olmsted Falls
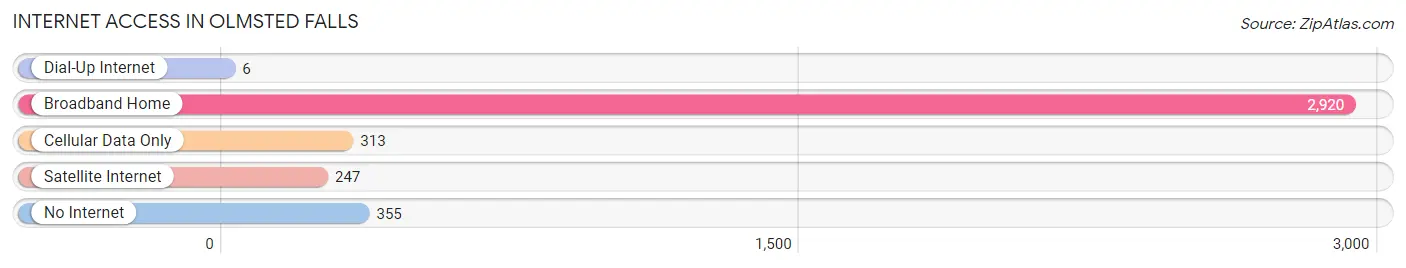
| Internet Type | # Households | % Households |
| Dial-Up Internet | 6 | 0.2% |
| Broadband Home | 2,920 | 78.7% |
| Cellular Data Only | 313 | 8.4% |
| Satellite Internet | 247 | 6.7% |
| No Internet | 355 | 9.6% |
| Total | 3,712 | 100.0% |
Olmsted Falls Summary
Olmsted Falls, Ohio is a small city located in Cuyahoga County, Ohio. It is part of the Greater Cleveland metropolitan area and is situated about 20 miles southwest of downtown Cleveland. The city is named after the original settler, David Olmsted, who arrived in the area in 1810. The city has a population of 8,621 as of the 2010 census.
History
The area that is now Olmsted Falls was originally inhabited by the Erie Indians. The first settler in the area was David Olmsted, who arrived in 1810. He purchased land from the Connecticut Land Company and built a log cabin. Olmsted named the area Olmsted Falls, after the falls of the Rocky River.
In 1826, the first post office was established in Olmsted Falls. The village was incorporated in 1845 and the first mayor was elected in 1846. The village was reincorporated as a city in 1960.
Geography
Olmsted Falls is located at 41°20'N 81°45'W (41.33, -81.75). The city has a total area of 4.2 square miles, all of which is land. The city is situated on the Rocky River, which flows through the city.
The city is bordered by Olmsted Township to the north, Columbia Township to the east, North Olmsted to the south, and Berea to the west.
Economy
The economy of Olmsted Falls is largely based on manufacturing and retail. The city is home to several manufacturing companies, including the Olmsted Falls Manufacturing Company, which produces industrial machinery and equipment. The city is also home to several retail stores, including a Walmart Supercenter and a Lowe's Home Improvement store.
The city is also home to several restaurants, including the Olmsted Falls Diner, which serves classic American diner fare.
Demographics
As of the 2010 census, the population of Olmsted Falls was 8,621. The racial makeup of the city was 94.2% White, 2.2% African American, 0.3% Native American, 0.9% Asian, 0.1% Pacific Islander, 0.7% from other races, and 1.6% from two or more races. Hispanic or Latino of any race were 2.2% of the population.
The median household income in Olmsted Falls was $60,945 in 2019. The median age of the city was 43.3 years. The city had a poverty rate of 6.2%.
Education
Olmsted Falls is served by the Olmsted Falls City School District. The district has one elementary school, one middle school, and one high school. The district also has a preschool and a community learning center.
The city is also home to the Olmsted Falls Branch of the Cuyahoga County Public Library
Conclusion
Olmsted Falls, Ohio is a small city located in Cuyahoga County, Ohio. It is part of the Greater Cleveland metropolitan area and is situated about 20 miles southwest of downtown Cleveland. The city is named after the original settler, David Olmsted, who arrived in the area in 1810. The city has a population of 8,621 as of the 2010 census. The economy of Olmsted Falls is largely based on manufacturing and retail. The city is served by the Olmsted Falls City School District and is home to the Olmsted Falls Branch of the Cuyahoga County Public Library.
Common Questions
What is Per Capita Income in Olmsted Falls?
Per Capita income in Olmsted Falls is $42,527.
What is the Median Family Income in Olmsted Falls?
Median Family Income in Olmsted Falls is $115,357.
What is the Median Household income in Olmsted Falls?
Median Household Income in Olmsted Falls is $92,416.
What is Income or Wage Gap in Olmsted Falls?
Income or Wage Gap in Olmsted Falls is 12.4%.
Women in Olmsted Falls earn 87.6 cents for every dollar earned by a man.
What is Inequality or Gini Index in Olmsted Falls?
Inequality or Gini Index in Olmsted Falls is 0.35.
What is the Total Population of Olmsted Falls?
Total Population of Olmsted Falls is 8,670.
What is the Total Male Population of Olmsted Falls?
Total Male Population of Olmsted Falls is 3,922.
What is the Total Female Population of Olmsted Falls?
Total Female Population of Olmsted Falls is 4,748.
What is the Ratio of Males per 100 Females in Olmsted Falls?
There are 82.60 Males per 100 Females in Olmsted Falls.
What is the Ratio of Females per 100 Males in Olmsted Falls?
There are 121.06 Females per 100 Males in Olmsted Falls.
What is the Median Population Age in Olmsted Falls?
Median Population Age in Olmsted Falls is 44.8 Years.
What is the Average Family Size in Olmsted Falls
Average Family Size in Olmsted Falls is 3.0 People.
What is the Average Household Size in Olmsted Falls
Average Household Size in Olmsted Falls is 2.3 People.
How Large is the Labor Force in Olmsted Falls?
There are 4,614 People in the Labor Forcein in Olmsted Falls.
What is the Percentage of People in the Labor Force in Olmsted Falls?
66.3% of People are in the Labor Force in Olmsted Falls.
What is the Unemployment Rate in Olmsted Falls?
Unemployment Rate in Olmsted Falls is 3.1%.