Piqua, OH Map & Demographics
Piqua Map
Piqua Overview
$28,368
PER CAPITA INCOME
$71,924
AVG FAMILY INCOME
$55,379
AVG HOUSEHOLD INCOME
28.6%
WAGE / INCOME GAP [ % ]
71.4¢/ $1
WAGE / INCOME GAP [ $ ]
$11,672
FAMILY INCOME DEFICIT
0.40
INEQUALITY / GINI INDEX
20,441
TOTAL POPULATION
10,703
MALE POPULATION
9,738
FEMALE POPULATION
109.91
MALES / 100 FEMALES
90.98
FEMALES / 100 MALES
37.9
MEDIAN AGE
3.1
AVG FAMILY SIZE
2.3
AVG HOUSEHOLD SIZE
10,532
LABOR FORCE [ PEOPLE ]
65.8%
PERCENT IN LABOR FORCE
3.8%
UNEMPLOYMENT RATE
Piqua Zip Codes
Piqua Area Codes
Income in Piqua
Income Overview in Piqua
Per Capita Income in Piqua is $28,368, while median incomes of families and households are $71,924 and $55,379 respectively.
| Characteristic | Number | Measure |
| Per Capita Income | 20,441 | $28,368 |
| Median Family Income | 4,846 | $71,924 |
| Mean Family Income | 4,846 | $81,648 |
| Median Household Income | 8,672 | $55,379 |
| Mean Household Income | 8,672 | $65,564 |
| Income Deficit | 4,846 | $11,672 |
| Wage / Income Gap (%) | 20,441 | 28.58% |
| Wage / Income Gap ($) | 20,441 | 71.42¢ per $1 |
| Gini / Inequality Index | 20,441 | 0.40 |
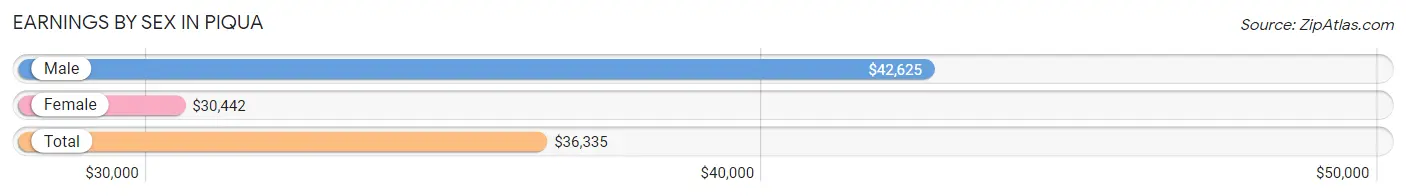
Earnings by Sex in Piqua
Average Earnings in Piqua are $36,335, $42,625 for men and $30,442 for women, a difference of 28.6%.
| Sex | Number | Average Earnings |
| Male | 6,132 (56.2%) | $42,625 |
| Female | 4,782 (43.8%) | $30,442 |
| Total | 10,914 (100.0%) | $36,335 |
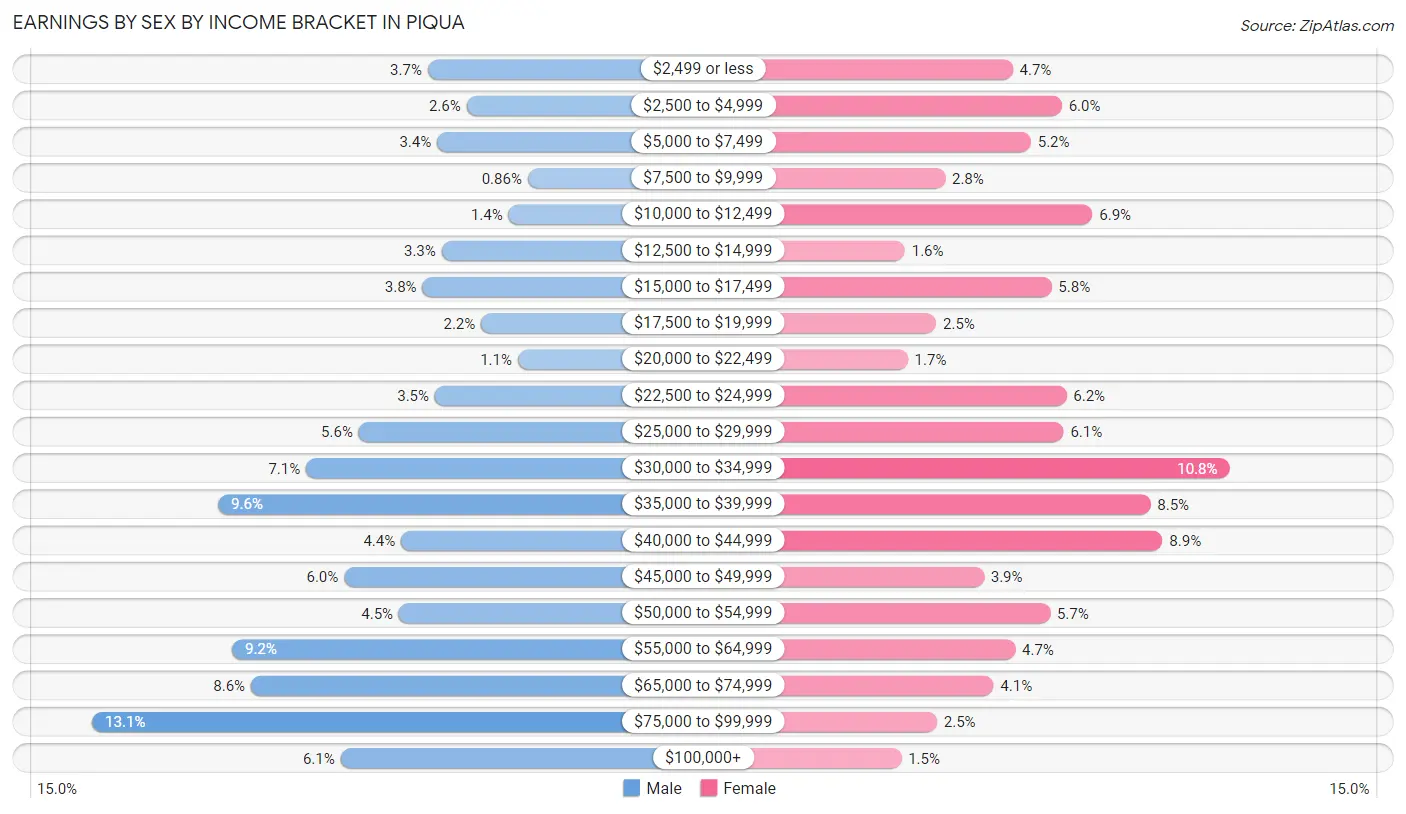
Earnings by Sex by Income Bracket in Piqua
The most common earnings brackets in Piqua are $75,000 to $99,999 for men (803 | 13.1%) and $30,000 to $34,999 for women (514 | 10.7%).
| Income | Male | Female |
| $2,499 or less | 225 (3.7%) | 223 (4.7%) |
| $2,500 to $4,999 | 158 (2.6%) | 289 (6.0%) |
| $5,000 to $7,499 | 209 (3.4%) | 247 (5.2%) |
| $7,500 to $9,999 | 53 (0.9%) | 132 (2.8%) |
| $10,000 to $12,499 | 86 (1.4%) | 330 (6.9%) |
| $12,500 to $14,999 | 201 (3.3%) | 78 (1.6%) |
| $15,000 to $17,499 | 234 (3.8%) | 275 (5.8%) |
| $17,500 to $19,999 | 133 (2.2%) | 120 (2.5%) |
| $20,000 to $22,499 | 70 (1.1%) | 82 (1.7%) |
| $22,500 to $24,999 | 213 (3.5%) | 295 (6.2%) |
| $25,000 to $29,999 | 344 (5.6%) | 291 (6.1%) |
| $30,000 to $34,999 | 435 (7.1%) | 514 (10.7%) |
| $35,000 to $39,999 | 586 (9.6%) | 408 (8.5%) |
| $40,000 to $44,999 | 271 (4.4%) | 424 (8.9%) |
| $45,000 to $49,999 | 369 (6.0%) | 184 (3.8%) |
| $50,000 to $54,999 | 275 (4.5%) | 273 (5.7%) |
| $55,000 to $64,999 | 562 (9.2%) | 226 (4.7%) |
| $65,000 to $74,999 | 530 (8.6%) | 197 (4.1%) |
| $75,000 to $99,999 | 803 (13.1%) | 121 (2.5%) |
| $100,000+ | 375 (6.1%) | 73 (1.5%) |
| Total | 6,132 (100.0%) | 4,782 (100.0%) |
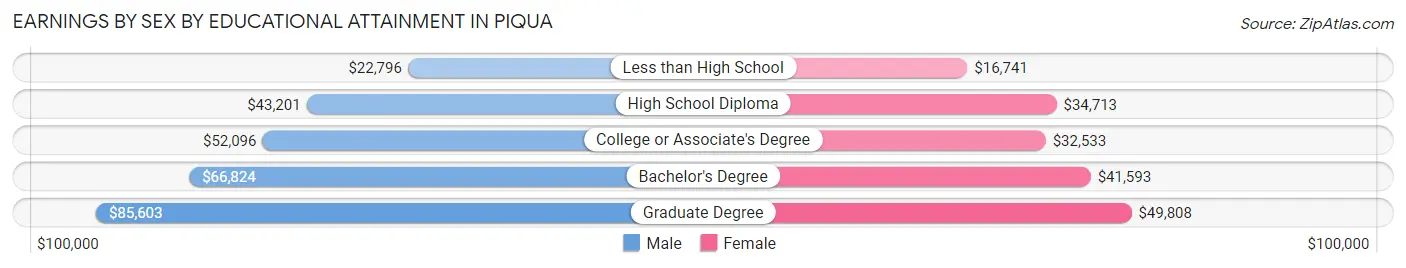
Earnings by Sex by Educational Attainment in Piqua
Average earnings in Piqua are $46,978 for men and $33,482 for women, a difference of 28.7%. Men with an educational attainment of graduate degree enjoy the highest average annual earnings of $85,603, while those with less than high school education earn the least with $22,796. Women with an educational attainment of graduate degree earn the most with the average annual earnings of $49,808, while those with less than high school education have the smallest earnings of $16,741.
| Educational Attainment | Male Income | Female Income |
| Less than High School | $22,796 | $16,741 |
| High School Diploma | $43,201 | $34,713 |
| College or Associate's Degree | $52,096 | $32,533 |
| Bachelor's Degree | $66,824 | $41,593 |
| Graduate Degree | $85,603 | $49,808 |
| Total | $46,978 | $33,482 |
Family Income in Piqua
Family Income Brackets in Piqua
According to the Piqua family income data, there are 1,042 families falling into the $100,000 to $149,999 income range, which is the most common income bracket and makes up 21.5% of all families. Conversely, the less than $10,000 income bracket is the least frequent group with only 82 families (1.7%) belonging to this category.
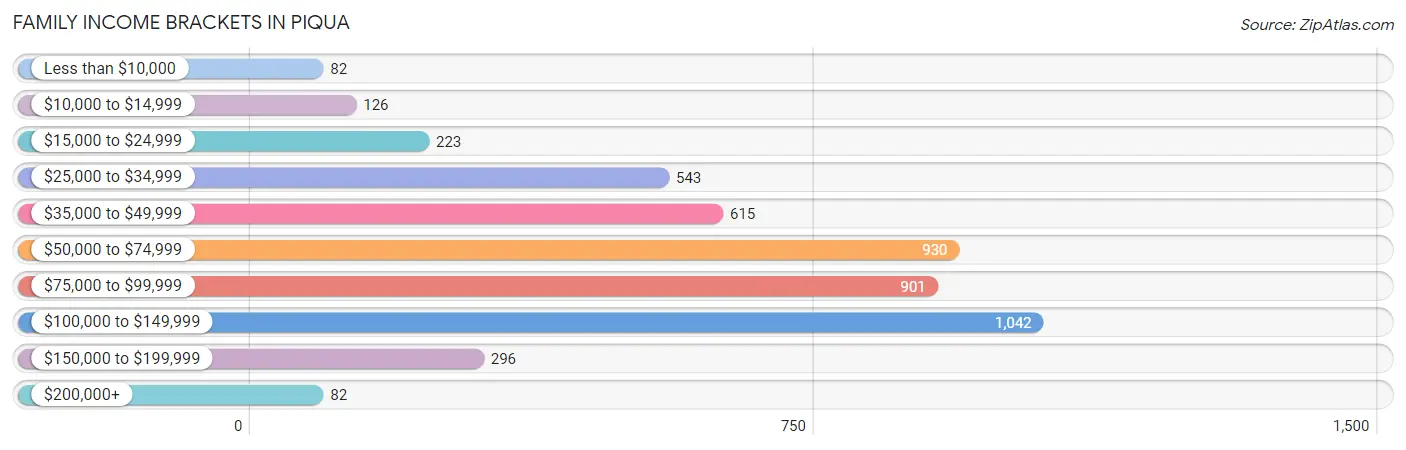
| Income Bracket | # Families | % Families |
| Less than $10,000 | 82 | 1.7% |
| $10,000 to $14,999 | 126 | 2.6% |
| $15,000 to $24,999 | 223 | 4.6% |
| $25,000 to $34,999 | 543 | 11.2% |
| $35,000 to $49,999 | 615 | 12.7% |
| $50,000 to $74,999 | 930 | 19.2% |
| $75,000 to $99,999 | 901 | 18.6% |
| $100,000 to $149,999 | 1,042 | 21.5% |
| $150,000 to $199,999 | 296 | 6.1% |
| $200,000+ | 82 | 1.7% |
Family Income by Famaliy Size in Piqua
4-person families (775 | 16.0%) account for the highest median family income in Piqua with $96,349 per family, while 2-person families (2,459 | 50.7%) have the highest median income of $30,478 per family member.
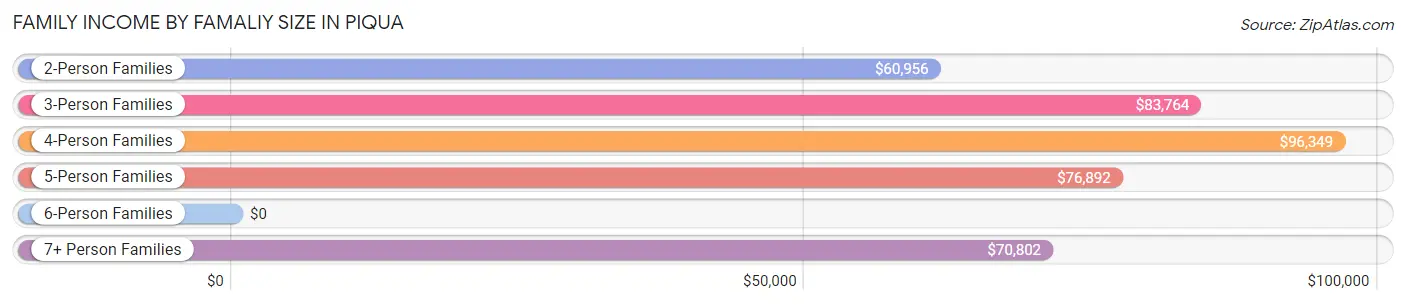
| Income Bracket | # Families | Median Income |
| 2-Person Families | 2,459 (50.7%) | $60,956 |
| 3-Person Families | 936 (19.3%) | $83,764 |
| 4-Person Families | 775 (16.0%) | $96,349 |
| 5-Person Families | 412 (8.5%) | $76,892 |
| 6-Person Families | 84 (1.7%) | $0 |
| 7+ Person Families | 180 (3.7%) | $70,802 |
| Total | 4,846 (100.0%) | $71,924 |
Family Income by Number of Earners in Piqua
The median family income in Piqua is $71,924, with families comprising 3+ earners (543) having the highest median family income of $129,606, while families with no earners (663) have the lowest median family income of $42,660, accounting for 11.2% and 13.7% of families, respectively.
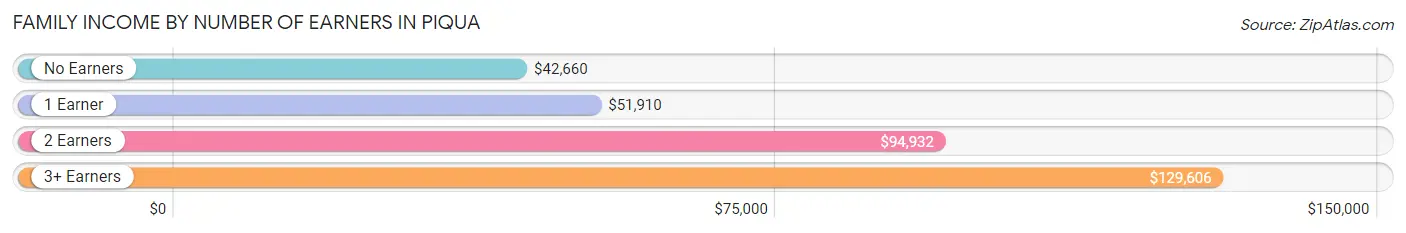
| Number of Earners | # Families | Median Income |
| No Earners | 663 (13.7%) | $42,660 |
| 1 Earner | 1,853 (38.2%) | $51,910 |
| 2 Earners | 1,787 (36.9%) | $94,932 |
| 3+ Earners | 543 (11.2%) | $129,606 |
| Total | 4,846 (100.0%) | $71,924 |
Household Income in Piqua
Household Income Brackets in Piqua
With 1,752 households falling in the category, the $50,000 to $74,999 income range is the most frequent in Piqua, accounting for 20.2% of all households. In contrast, only 95 households (1.1%) fall into the $200,000+ income bracket, making it the least populous group.
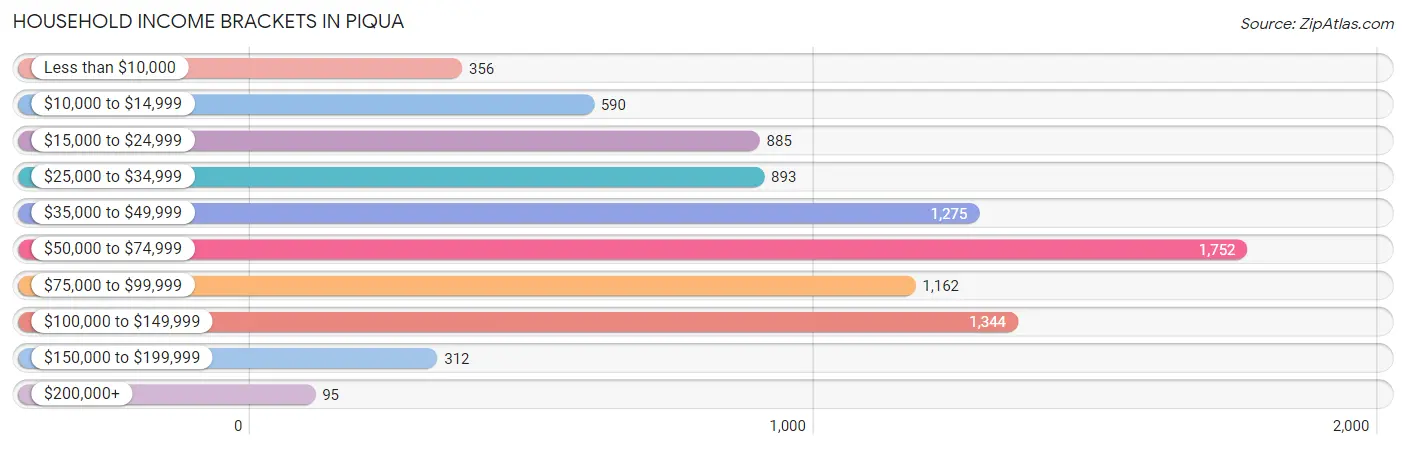
| Income Bracket | # Households | % Households |
| Less than $10,000 | 356 | 4.1% |
| $10,000 to $14,999 | 590 | 6.8% |
| $15,000 to $24,999 | 885 | 10.2% |
| $25,000 to $34,999 | 893 | 10.3% |
| $35,000 to $49,999 | 1,275 | 14.7% |
| $50,000 to $74,999 | 1,752 | 20.2% |
| $75,000 to $99,999 | 1,162 | 13.4% |
| $100,000 to $149,999 | 1,344 | 15.5% |
| $150,000 to $199,999 | 312 | 3.6% |
| $200,000+ | 95 | 1.1% |
Household Income by Householder Age in Piqua
The median household income in Piqua is $55,379, with the highest median household income of $67,709 found in the 45 to 64 years age bracket for the primary householder. A total of 3,285 households (37.9%) fall into this category. Meanwhile, the 65+ years age bracket for the primary householder has the lowest median household income of $31,777, with 2,145 households (24.7%) in this group.
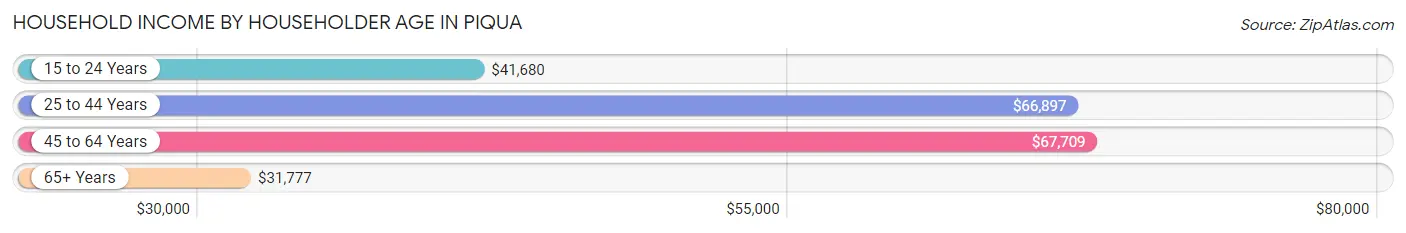
| Income Bracket | # Households | Median Income |
| 15 to 24 Years | 510 (5.9%) | $41,680 |
| 25 to 44 Years | 2,732 (31.5%) | $66,897 |
| 45 to 64 Years | 3,285 (37.9%) | $67,709 |
| 65+ Years | 2,145 (24.7%) | $31,777 |
| Total | 8,672 (100.0%) | $55,379 |
Poverty in Piqua
Income Below Poverty by Sex and Age in Piqua
With 14.3% poverty level for males and 13.7% for females among the residents of Piqua, 6 to 11 year old males and 5 year old females are the most vulnerable to poverty, with 284 males (29.0%) and 36 females (48.0%) in their respective age groups living below the poverty level.
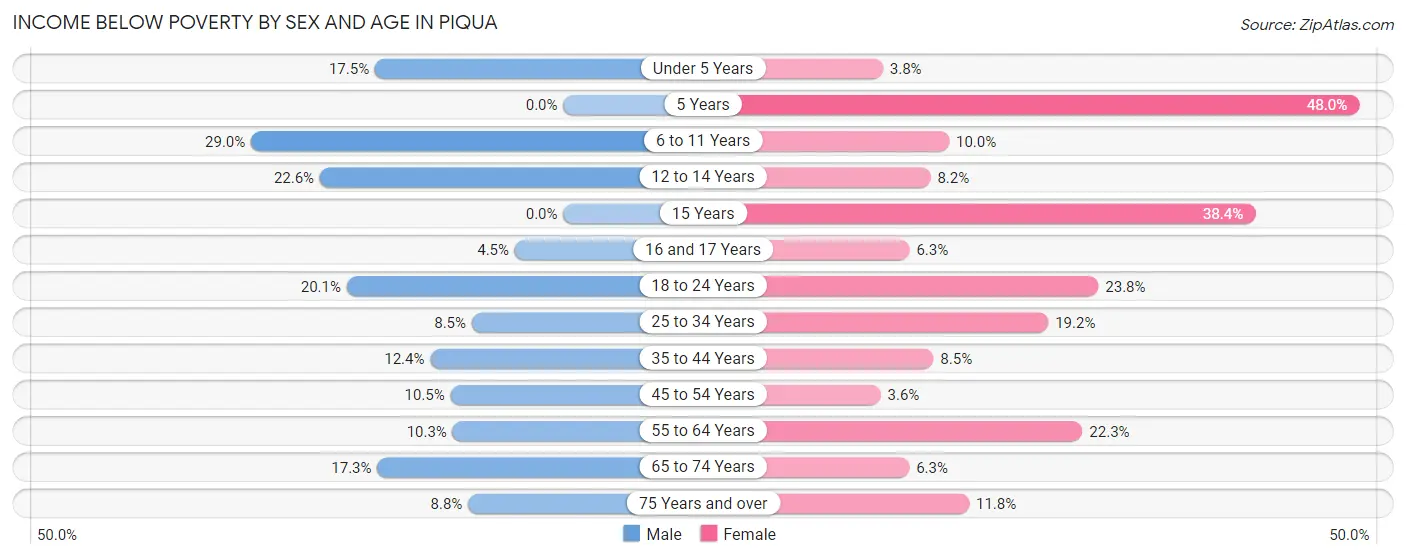
| Age Bracket | Male | Female |
| Under 5 Years | 118 (17.5%) | 25 (3.8%) |
| 5 Years | 0 (0.0%) | 36 (48.0%) |
| 6 to 11 Years | 284 (29.0%) | 58 (10.0%) |
| 12 to 14 Years | 138 (22.6%) | 40 (8.2%) |
| 15 Years | 0 (0.0%) | 51 (38.4%) |
| 16 and 17 Years | 17 (4.5%) | 12 (6.3%) |
| 18 to 24 Years | 159 (20.1%) | 236 (23.8%) |
| 25 to 34 Years | 129 (8.5%) | 247 (19.2%) |
| 35 to 44 Years | 164 (12.3%) | 96 (8.5%) |
| 45 to 54 Years | 119 (10.5%) | 32 (3.6%) |
| 55 to 64 Years | 162 (10.3%) | 332 (22.3%) |
| 65 to 74 Years | 183 (17.3%) | 59 (6.3%) |
| 75 Years and over | 34 (8.8%) | 81 (11.8%) |
| Total | 1,507 (14.3%) | 1,305 (13.7%) |
Income Above Poverty by Sex and Age in Piqua
According to the poverty statistics in Piqua, males aged 5 years and females aged 45 to 54 years are the age groups that are most secure financially, with 100.0% of males and 96.4% of females in these age groups living above the poverty line.
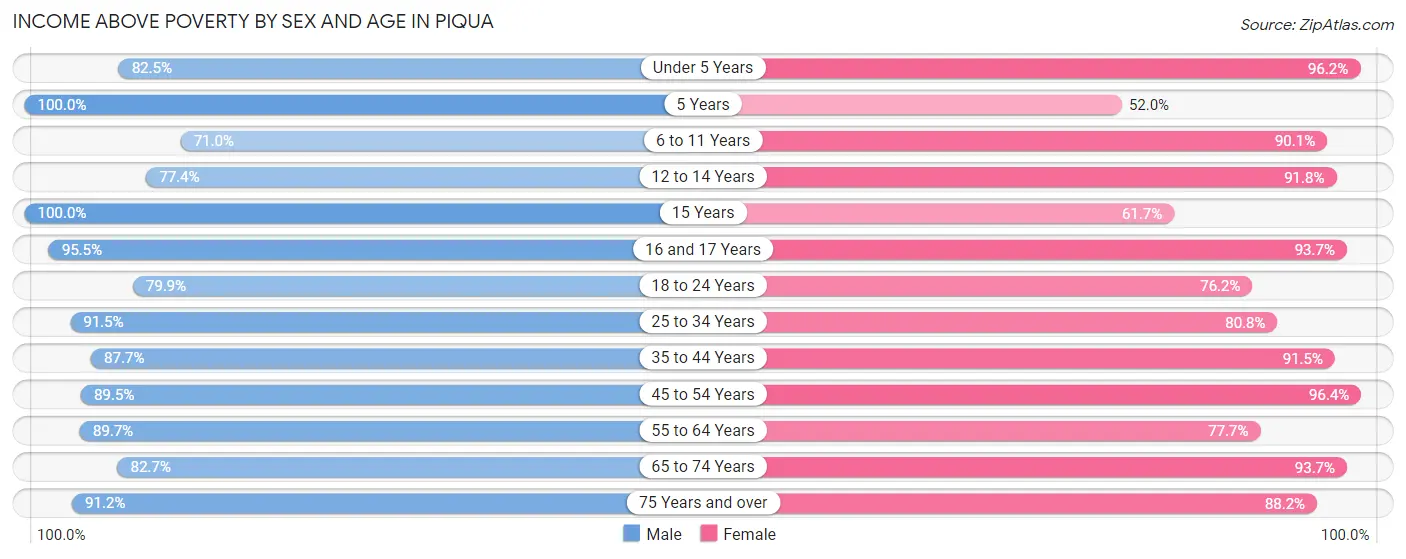
| Age Bracket | Male | Female |
| Under 5 Years | 557 (82.5%) | 632 (96.2%) |
| 5 Years | 85 (100.0%) | 39 (52.0%) |
| 6 to 11 Years | 696 (71.0%) | 525 (90.0%) |
| 12 to 14 Years | 473 (77.4%) | 446 (91.8%) |
| 15 Years | 30 (100.0%) | 82 (61.7%) |
| 16 and 17 Years | 361 (95.5%) | 179 (93.7%) |
| 18 to 24 Years | 632 (79.9%) | 755 (76.2%) |
| 25 to 34 Years | 1,391 (91.5%) | 1,042 (80.8%) |
| 35 to 44 Years | 1,164 (87.6%) | 1,033 (91.5%) |
| 45 to 54 Years | 1,018 (89.5%) | 858 (96.4%) |
| 55 to 64 Years | 1,416 (89.7%) | 1,155 (77.7%) |
| 65 to 74 Years | 877 (82.7%) | 883 (93.7%) |
| 75 Years and over | 351 (91.2%) | 605 (88.2%) |
| Total | 9,051 (85.7%) | 8,234 (86.3%) |
Income Below Poverty Among Married-Couple Families in Piqua
The poverty statistics for married-couple families in Piqua show that 1.0% or 35 of the total 3,418 families live below the poverty line. Families with no children have the highest poverty rate of 1.4%, comprising of 28 families. On the other hand, families with 3 or 4 children have the lowest poverty rate of 0.0%, which includes 0 families.
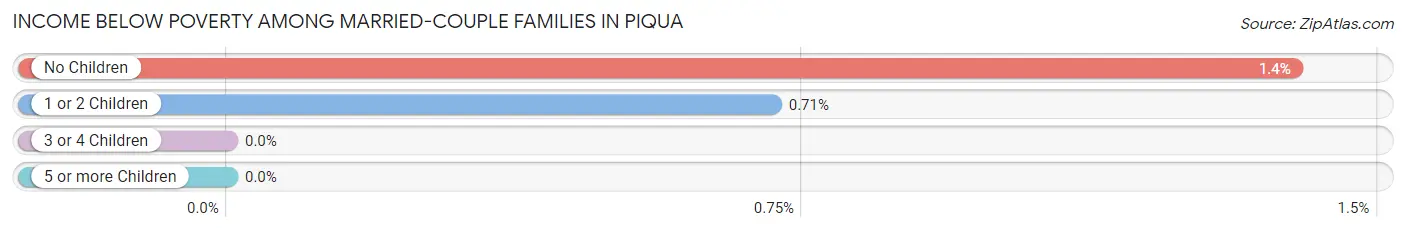
| Children | Above Poverty | Below Poverty |
| No Children | 1,986 (98.6%) | 28 (1.4%) |
| 1 or 2 Children | 973 (99.3%) | 7 (0.7%) |
| 3 or 4 Children | 343 (100.0%) | 0 (0.0%) |
| 5 or more Children | 81 (100.0%) | 0 (0.0%) |
| Total | 3,383 (99.0%) | 35 (1.0%) |
Income Below Poverty Among Single-Parent Households in Piqua
According to the poverty data in Piqua, 16.1% or 87 single-father households and 30.4% or 270 single-mother households are living below the poverty line. Among single-father households, those with no children have the highest poverty rate, with 78 households (35.4%) experiencing poverty. Likewise, among single-mother households, those with 5 or more children have the highest poverty rate, with 91 households (100.0%) falling below the poverty line.
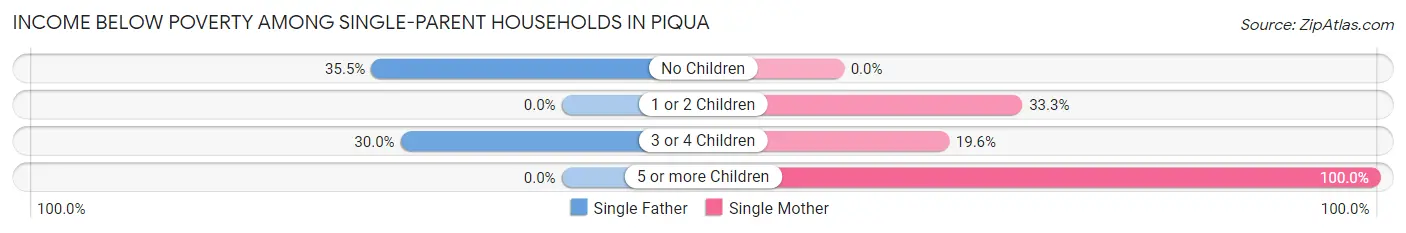
| Children | Single Father | Single Mother |
| No Children | 78 (35.4%) | 0 (0.0%) |
| 1 or 2 Children | 0 (0.0%) | 160 (33.3%) |
| 3 or 4 Children | 9 (30.0%) | 19 (19.6%) |
| 5 or more Children | 0 (0.0%) | 91 (100.0%) |
| Total | 87 (16.1%) | 270 (30.4%) |
Income Below Poverty Among Married-Couple vs Single-Parent Households in Piqua
The poverty data for Piqua shows that 35 of the married-couple family households (1.0%) and 357 of the single-parent households (25.0%) are living below the poverty level. Within the married-couple family households, those with no children have the highest poverty rate, with 28 households (1.4%) falling below the poverty line. Among the single-parent households, those with 5 or more children have the highest poverty rate, with 91 household (100.0%) living below poverty.
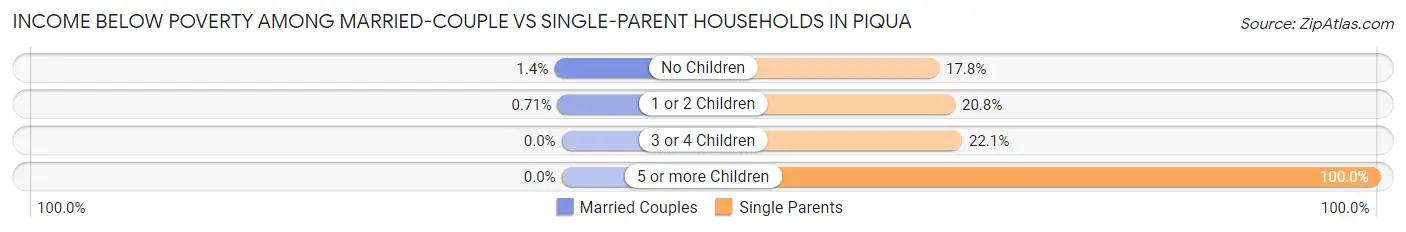
| Children | Married-Couple Families | Single-Parent Households |
| No Children | 28 (1.4%) | 78 (17.8%) |
| 1 or 2 Children | 7 (0.7%) | 160 (20.7%) |
| 3 or 4 Children | 0 (0.0%) | 28 (22.1%) |
| 5 or more Children | 0 (0.0%) | 91 (100.0%) |
| Total | 35 (1.0%) | 357 (25.0%) |
Race in Piqua
The most populous races in Piqua are White / Caucasian (19,033 | 93.1%), Two or more Races (810 | 4.0%), and Black / African American (359 | 1.8%).
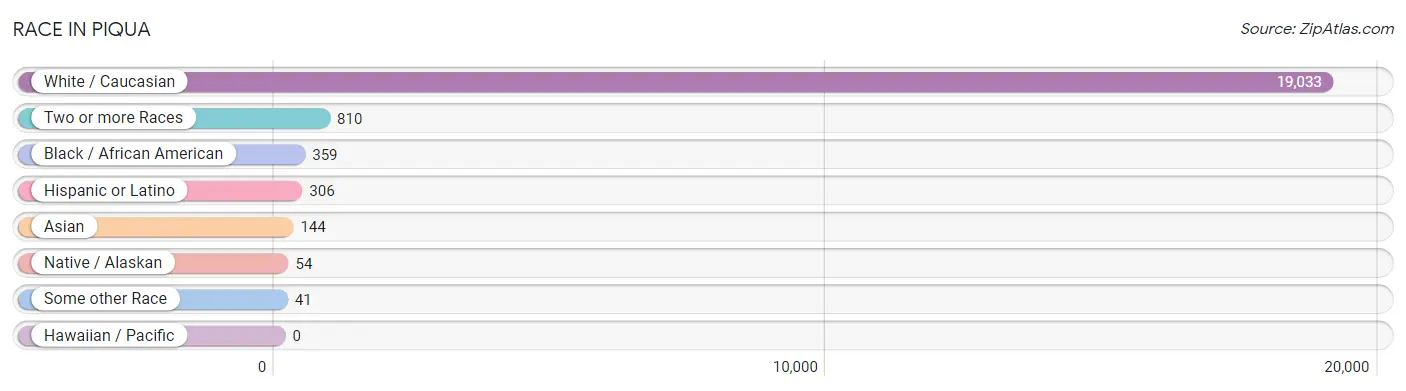
| Race | # Population | % Population |
| Asian | 144 | 0.7% |
| Black / African American | 359 | 1.8% |
| Hawaiian / Pacific | 0 | 0.0% |
| Hispanic or Latino | 306 | 1.5% |
| Native / Alaskan | 54 | 0.3% |
| White / Caucasian | 19,033 | 93.1% |
| Two or more Races | 810 | 4.0% |
| Some other Race | 41 | 0.2% |
| Total | 20,441 | 100.0% |
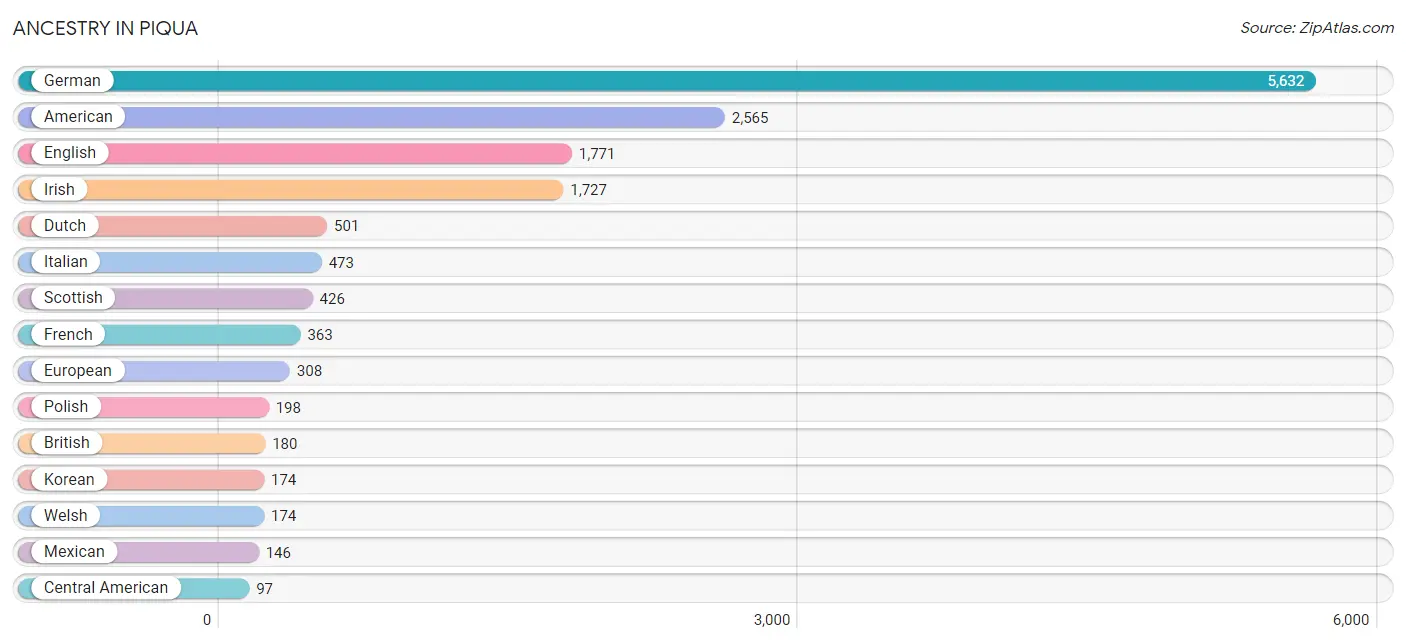
Ancestry in Piqua
The most populous ancestries reported in Piqua are German (5,632 | 27.6%), American (2,565 | 12.6%), English (1,771 | 8.7%), Irish (1,727 | 8.5%), and Dutch (501 | 2.5%), together accounting for 59.7% of all Piqua residents.
| Ancestry | # Population | % Population |
| African | 9 | 0.0% |
| American | 2,565 | 12.6% |
| Apache | 13 | 0.1% |
| Arab | 15 | 0.1% |
| Austrian | 11 | 0.1% |
| British | 180 | 0.9% |
| Burmese | 24 | 0.1% |
| Central American | 97 | 0.5% |
| Cherokee | 95 | 0.5% |
| Croatian | 8 | 0.0% |
| Dominican | 53 | 0.3% |
| Dutch | 501 | 2.5% |
| English | 1,771 | 8.7% |
| European | 308 | 1.5% |
| Fijian | 47 | 0.2% |
| French | 363 | 1.8% |
| French Canadian | 10 | 0.1% |
| German | 5,632 | 27.6% |
| Greek | 18 | 0.1% |
| Honduran | 97 | 0.5% |
| Hungarian | 74 | 0.4% |
| Indian (Asian) | 23 | 0.1% |
| Irish | 1,727 | 8.5% |
| Italian | 473 | 2.3% |
| Korean | 174 | 0.9% |
| Lebanese | 15 | 0.1% |
| Macedonian | 40 | 0.2% |
| Mexican | 146 | 0.7% |
| Northern European | 17 | 0.1% |
| Pennsylvania German | 29 | 0.1% |
| Polish | 198 | 1.0% |
| Portuguese | 74 | 0.4% |
| Romanian | 6 | 0.0% |
| Scandinavian | 12 | 0.1% |
| Scotch-Irish | 81 | 0.4% |
| Scottish | 426 | 2.1% |
| Subsaharan African | 9 | 0.0% |
| Swedish | 78 | 0.4% |
| Swiss | 52 | 0.3% |
| Welsh | 174 | 0.9% | View All 40 Rows |
Immigrants in Piqua
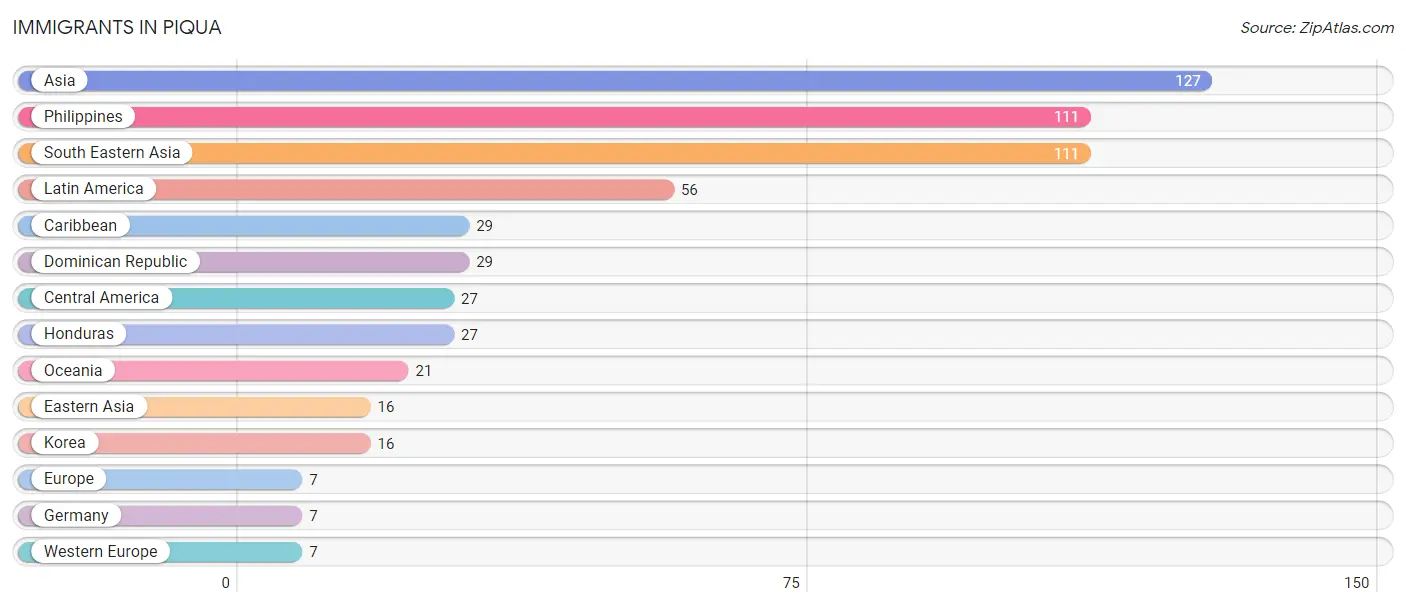
The most numerous immigrant groups reported in Piqua came from Asia (127 | 0.6%), Philippines (111 | 0.5%), South Eastern Asia (111 | 0.5%), Latin America (56 | 0.3%), and Caribbean (29 | 0.1%), together accounting for 2.1% of all Piqua residents.
| Immigration Origin | # Population | % Population |
| Asia | 127 | 0.6% |
| Caribbean | 29 | 0.1% |
| Central America | 27 | 0.1% |
| Dominican Republic | 29 | 0.1% |
| Eastern Asia | 16 | 0.1% |
| Europe | 7 | 0.0% |
| Germany | 7 | 0.0% |
| Honduras | 27 | 0.1% |
| Korea | 16 | 0.1% |
| Latin America | 56 | 0.3% |
| Oceania | 21 | 0.1% |
| Philippines | 111 | 0.5% |
| South Eastern Asia | 111 | 0.5% |
| Western Europe | 7 | 0.0% | View All 14 Rows |
Sex and Age in Piqua
Sex and Age in Piqua
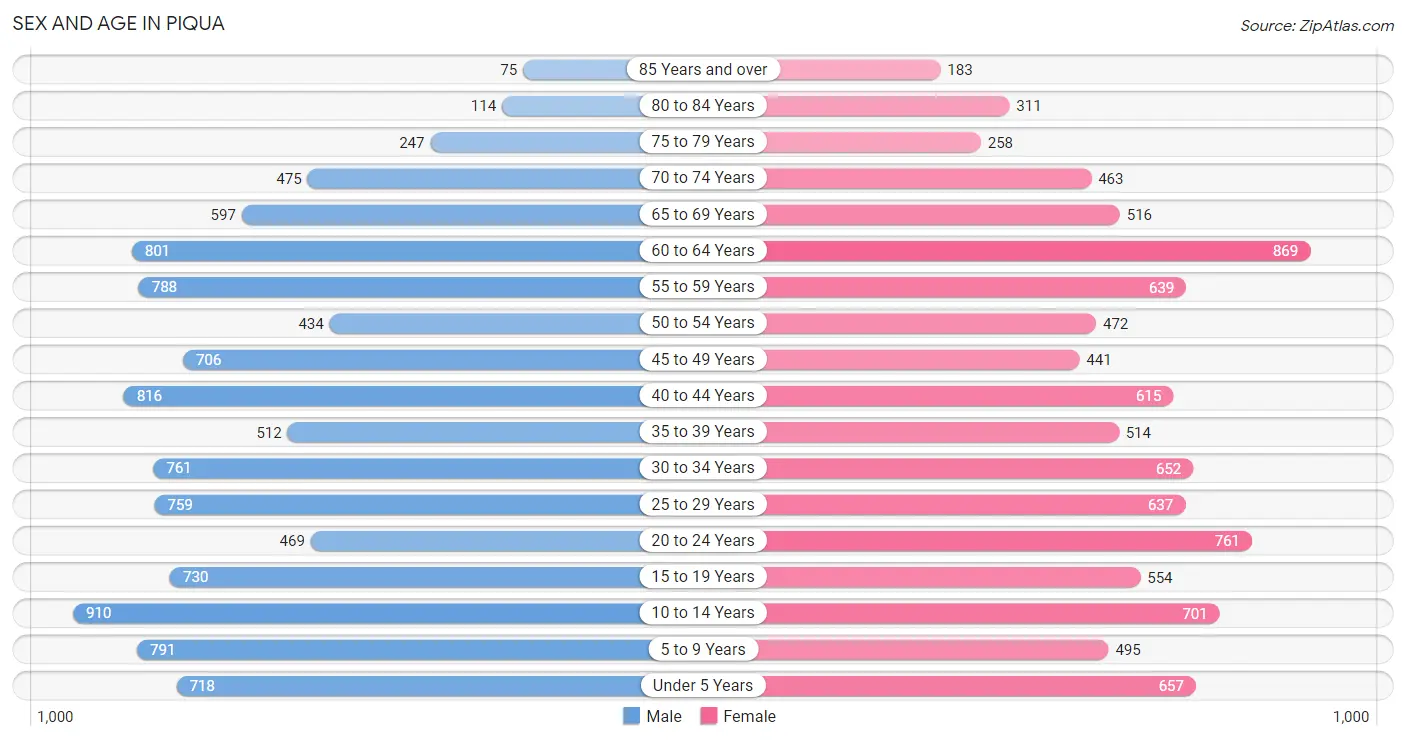
The most populous age groups in Piqua are 10 to 14 Years (910 | 8.5%) for men and 60 to 64 Years (869 | 8.9%) for women.
| Age Bracket | Male | Female |
| Under 5 Years | 718 (6.7%) | 657 (6.8%) |
| 5 to 9 Years | 791 (7.4%) | 495 (5.1%) |
| 10 to 14 Years | 910 (8.5%) | 701 (7.2%) |
| 15 to 19 Years | 730 (6.8%) | 554 (5.7%) |
| 20 to 24 Years | 469 (4.4%) | 761 (7.8%) |
| 25 to 29 Years | 759 (7.1%) | 637 (6.5%) |
| 30 to 34 Years | 761 (7.1%) | 652 (6.7%) |
| 35 to 39 Years | 512 (4.8%) | 514 (5.3%) |
| 40 to 44 Years | 816 (7.6%) | 615 (6.3%) |
| 45 to 49 Years | 706 (6.6%) | 441 (4.5%) |
| 50 to 54 Years | 434 (4.1%) | 472 (4.9%) |
| 55 to 59 Years | 788 (7.4%) | 639 (6.6%) |
| 60 to 64 Years | 801 (7.5%) | 869 (8.9%) |
| 65 to 69 Years | 597 (5.6%) | 516 (5.3%) |
| 70 to 74 Years | 475 (4.4%) | 463 (4.8%) |
| 75 to 79 Years | 247 (2.3%) | 258 (2.6%) |
| 80 to 84 Years | 114 (1.1%) | 311 (3.2%) |
| 85 Years and over | 75 (0.7%) | 183 (1.9%) |
| Total | 10,703 (100.0%) | 9,738 (100.0%) |
Families and Households in Piqua
Median Family Size in Piqua
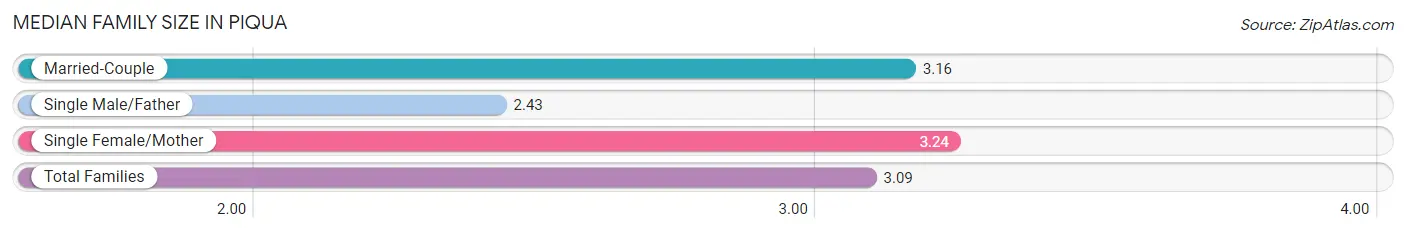
The median family size in Piqua is 3.09 persons per family, with single female/mother families (888 | 18.3%) accounting for the largest median family size of 3.24 persons per family. On the other hand, single male/father families (540 | 11.1%) represent the smallest median family size with 2.43 persons per family.
| Family Type | # Families | Family Size |
| Married-Couple | 3,418 (70.5%) | 3.16 |
| Single Male/Father | 540 (11.1%) | 2.43 |
| Single Female/Mother | 888 (18.3%) | 3.24 |
| Total Families | 4,846 (100.0%) | 3.09 |
Median Household Size in Piqua
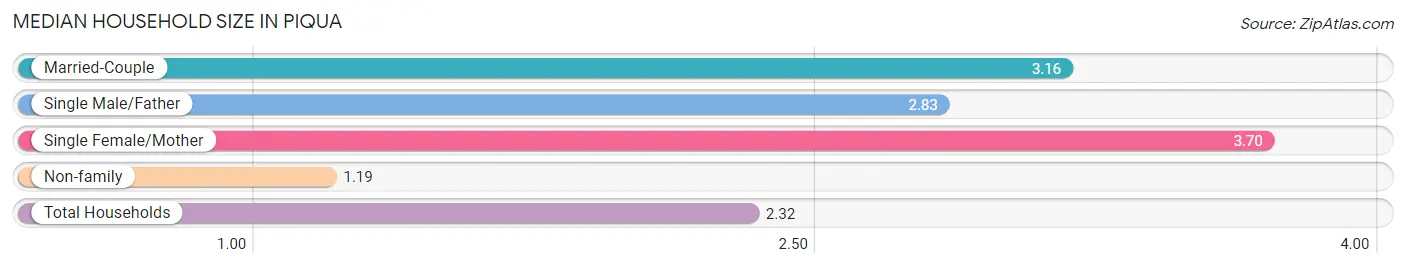
The median household size in Piqua is 2.32 persons per household, with single female/mother households (888 | 10.2%) accounting for the largest median household size of 3.7 persons per household. non-family households (3,826 | 44.1%) represent the smallest median household size with 1.19 persons per household.
| Household Type | # Households | Household Size |
| Married-Couple | 3,418 (39.4%) | 3.16 |
| Single Male/Father | 540 (6.2%) | 2.83 |
| Single Female/Mother | 888 (10.2%) | 3.70 |
| Non-family | 3,826 (44.1%) | 1.19 |
| Total Households | 8,672 (100.0%) | 2.32 |
Household Size by Marriage Status in Piqua
Out of a total of 8,672 households in Piqua, 4,846 (55.9%) are family households, while 3,826 (44.1%) are nonfamily households. The most numerous type of family households are 2-person households, comprising 2,264, and the most common type of nonfamily households are 1-person households, comprising 3,283.
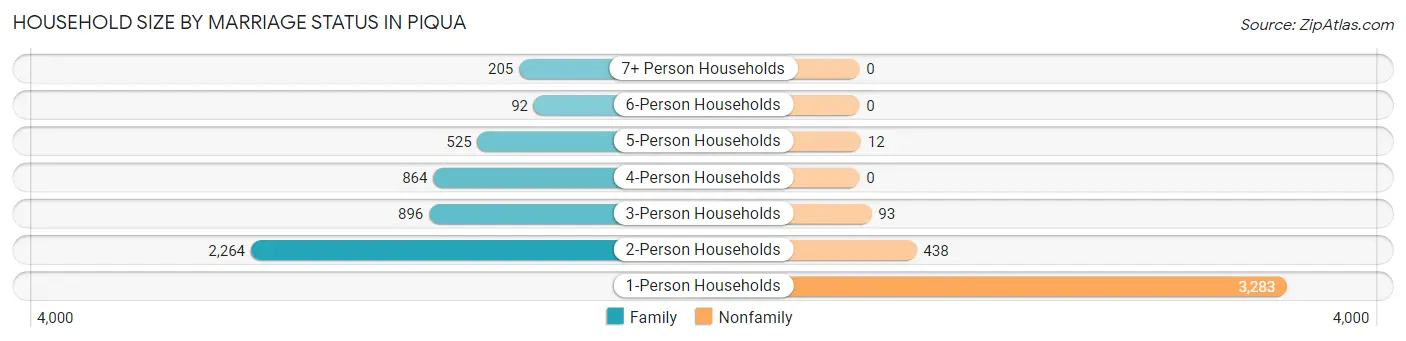
| Household Size | Family Households | Nonfamily Households |
| 1-Person Households | - | 3,283 (37.9%) |
| 2-Person Households | 2,264 (26.1%) | 438 (5.1%) |
| 3-Person Households | 896 (10.3%) | 93 (1.1%) |
| 4-Person Households | 864 (10.0%) | 0 (0.0%) |
| 5-Person Households | 525 (6.0%) | 12 (0.1%) |
| 6-Person Households | 92 (1.1%) | 0 (0.0%) |
| 7+ Person Households | 205 (2.4%) | 0 (0.0%) |
| Total | 4,846 (55.9%) | 3,826 (44.1%) |
Female Fertility in Piqua
Fertility by Age in Piqua
Average fertility rate in Piqua is 85.0 births per 1,000 women. Women in the age bracket of 20 to 34 years have the highest fertility rate with 149.0 births per 1,000 women. Women in the age bracket of 20 to 34 years acount for 83.2% of all women with births.
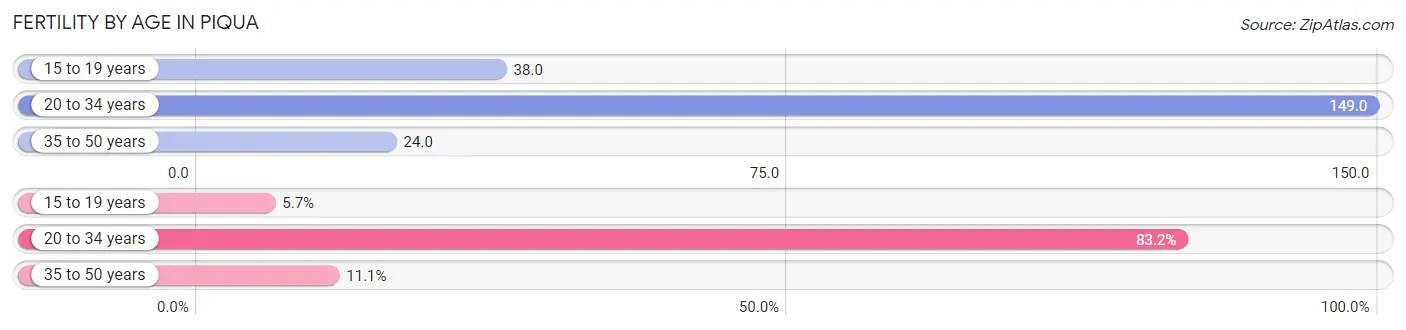
| Age Bracket | Women with Births | Births / 1,000 Women |
| 15 to 19 years | 21 (5.7%) | 38.0 |
| 20 to 34 years | 306 (83.2%) | 149.0 |
| 35 to 50 years | 41 (11.1%) | 24.0 |
| Total | 368 (100.0%) | 85.0 |
Fertility by Age by Marriage Status in Piqua
42.4% of women with births (368) in Piqua are married. The highest percentage of unmarried women with births falls into 15 to 19 years age bracket with 100.0% of them unmarried at the time of birth, while the lowest percentage of unmarried women with births belong to 20 to 34 years age bracket with 54.6% of them unmarried.
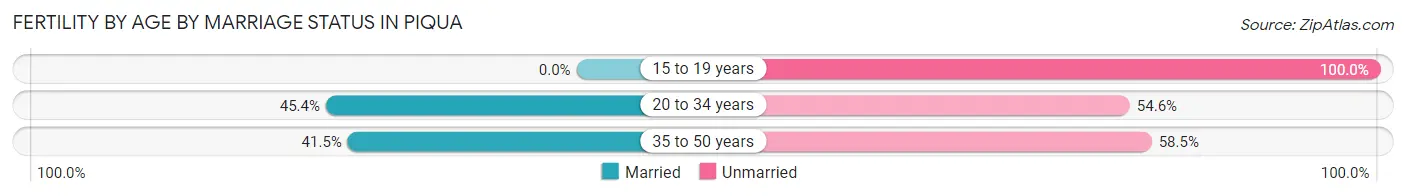
| Age Bracket | Married | Unmarried |
| 15 to 19 years | 0 (0.0%) | 21 (100.0%) |
| 20 to 34 years | 139 (45.4%) | 167 (54.6%) |
| 35 to 50 years | 17 (41.5%) | 24 (58.5%) |
| Total | 156 (42.4%) | 212 (57.6%) |
Fertility by Education in Piqua
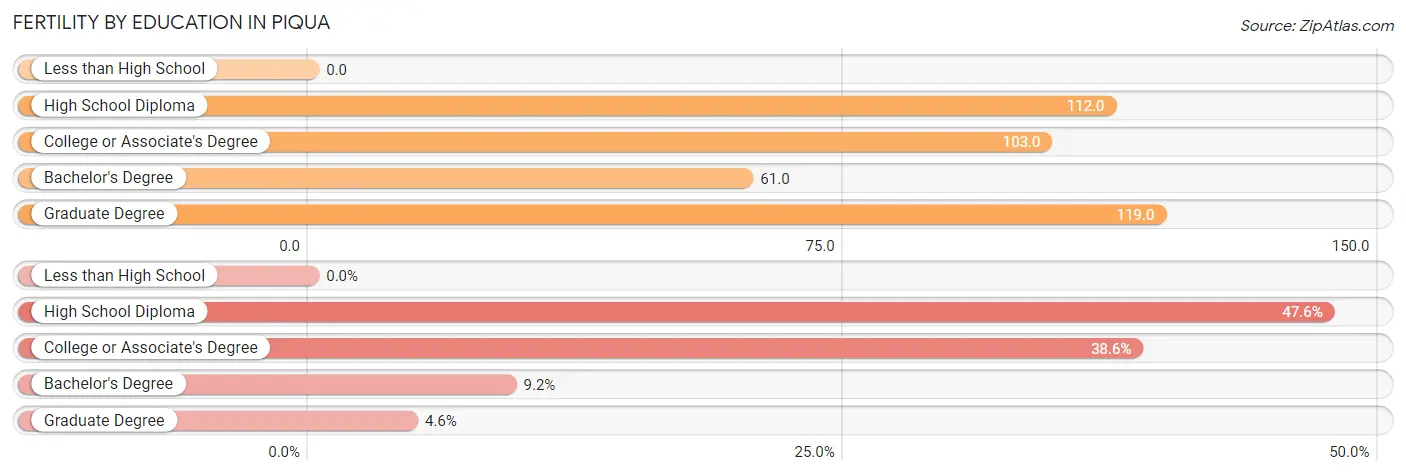
| Educational Attainment | Women with Births | Births / 1,000 Women |
| Less than High School | 0 (0.0%) | 0.0 |
| High School Diploma | 175 (47.5%) | 112.0 |
| College or Associate's Degree | 142 (38.6%) | 103.0 |
| Bachelor's Degree | 34 (9.2%) | 61.0 |
| Graduate Degree | 17 (4.6%) | 119.0 |
| Total | 368 (100.0%) | 85.0 |
Fertility by Education by Marriage Status in Piqua
57.6% of women with births in Piqua are unmarried. Women with the educational attainment of graduate degree are most likely to be married with 100.0% of them married at childbirth, while women with the educational attainment of bachelor's degree are least likely to be married with 70.6% of them unmarried at childbirth.
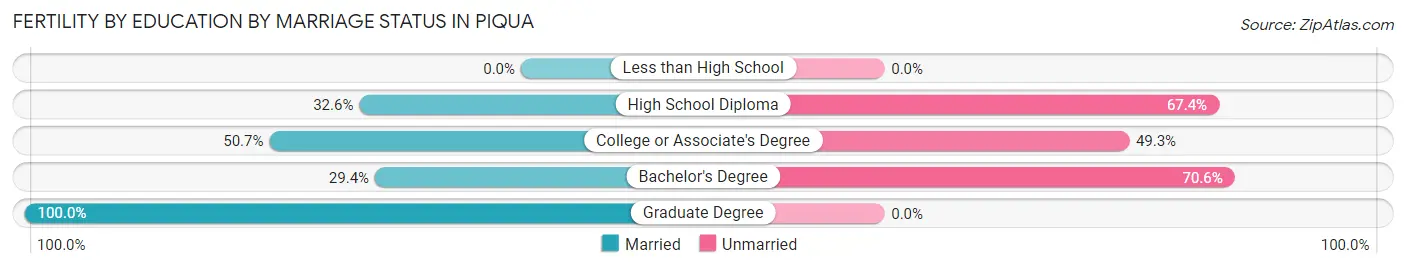
| Educational Attainment | Married | Unmarried |
| Less than High School | 0 (0.0%) | 0 (0.0%) |
| High School Diploma | 57 (32.6%) | 118 (67.4%) |
| College or Associate's Degree | 72 (50.7%) | 70 (49.3%) |
| Bachelor's Degree | 10 (29.4%) | 24 (70.6%) |
| Graduate Degree | 17 (100.0%) | 0 (0.0%) |
| Total | 156 (42.4%) | 212 (57.6%) |
Employment Characteristics in Piqua
Employment by Class of Employer in Piqua
Among the 9,982 employed individuals in Piqua, private company employees (7,846 | 78.6%), not-for-profit organizations (733 | 7.3%), and local government employees (605 | 6.1%) make up the most common classes of employment.
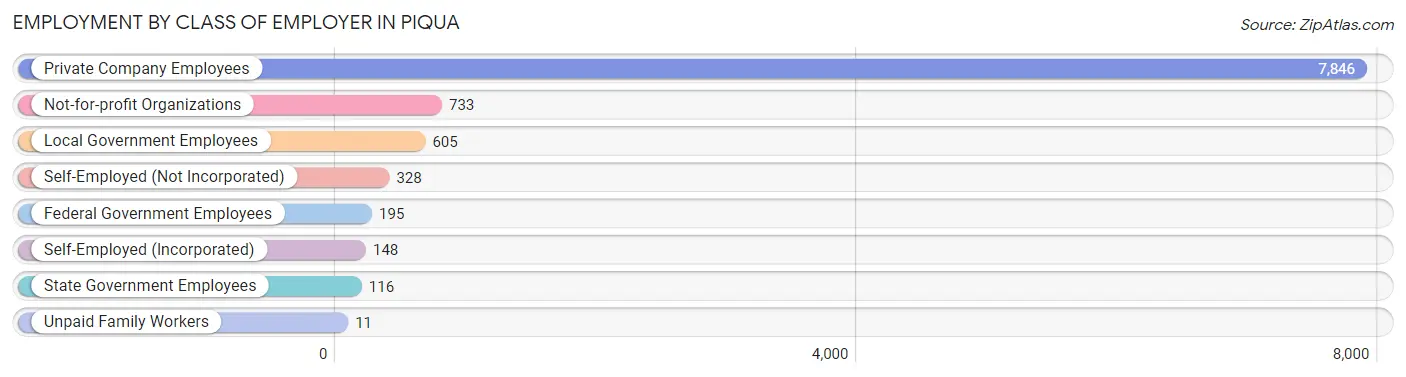
| Employer Class | # Employees | % Employees |
| Private Company Employees | 7,846 | 78.6% |
| Self-Employed (Incorporated) | 148 | 1.5% |
| Self-Employed (Not Incorporated) | 328 | 3.3% |
| Not-for-profit Organizations | 733 | 7.3% |
| Local Government Employees | 605 | 6.1% |
| State Government Employees | 116 | 1.2% |
| Federal Government Employees | 195 | 1.9% |
| Unpaid Family Workers | 11 | 0.1% |
| Total | 9,982 | 100.0% |
Employment Status by Age in Piqua
According to the labor force statistics for Piqua, out of the total population over 16 years of age (16,006), 65.8% or 10,532 individuals are in the labor force, with 3.8% or 400 of them unemployed. The age group with the highest labor force participation rate is 35 to 44 years, with 89.0% or 2,187 individuals in the labor force. Within the labor force, the 20 to 24 years age range has the highest percentage of unemployed individuals, with 12.8% or 124 of them being unemployed.
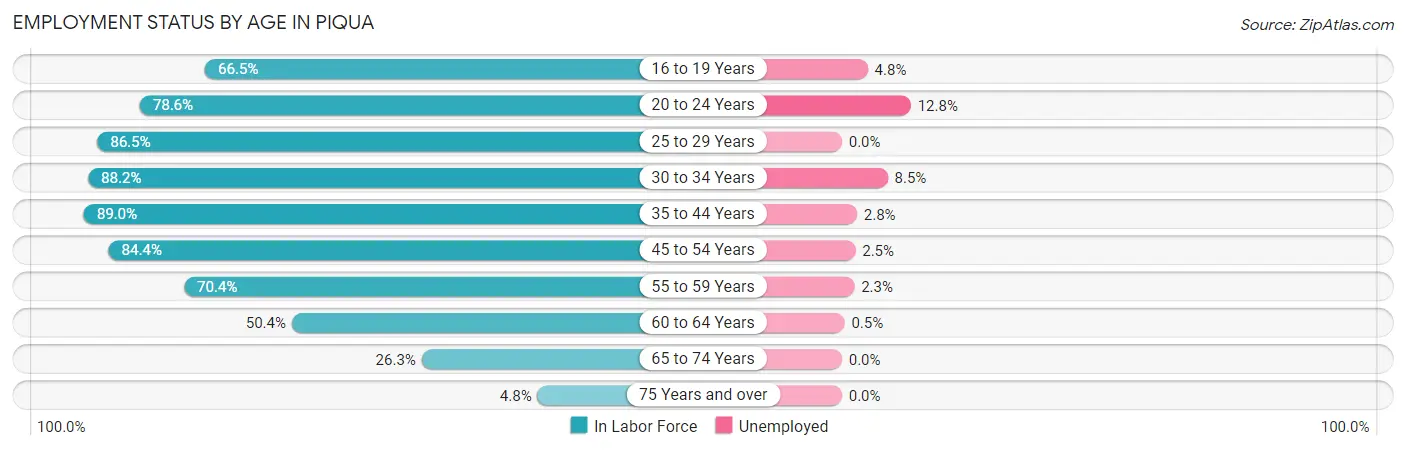
| Age Bracket | In Labor Force | Unemployed |
| 16 to 19 Years | 745 (66.5%) | 36 (4.8%) |
| 20 to 24 Years | 967 (78.6%) | 124 (12.8%) |
| 25 to 29 Years | 1,208 (86.5%) | 0 (0.0%) |
| 30 to 34 Years | 1,246 (88.2%) | 106 (8.5%) |
| 35 to 44 Years | 2,187 (89.0%) | 61 (2.8%) |
| 45 to 54 Years | 1,733 (84.4%) | 43 (2.5%) |
| 55 to 59 Years | 1,005 (70.4%) | 23 (2.3%) |
| 60 to 64 Years | 842 (50.4%) | 4 (0.5%) |
| 65 to 74 Years | 539 (26.3%) | 0 (0.0%) |
| 75 Years and over | 57 (4.8%) | 0 (0.0%) |
| Total | 10,532 (65.8%) | 400 (3.8%) |
Employment Status by Educational Attainment in Piqua
According to labor force statistics for Piqua, 78.9% of individuals (8,218) out of the total population between 25 and 64 years of age (10,416) are in the labor force, with 2.9% or 238 of them being unemployed. The group with the highest labor force participation rate are those with the educational attainment of bachelor's degree or higher, with 88.8% or 1,221 individuals in the labor force. Within the labor force, individuals with high school diploma education have the highest percentage of unemployment, with 4.8% or 162 of them being unemployed.
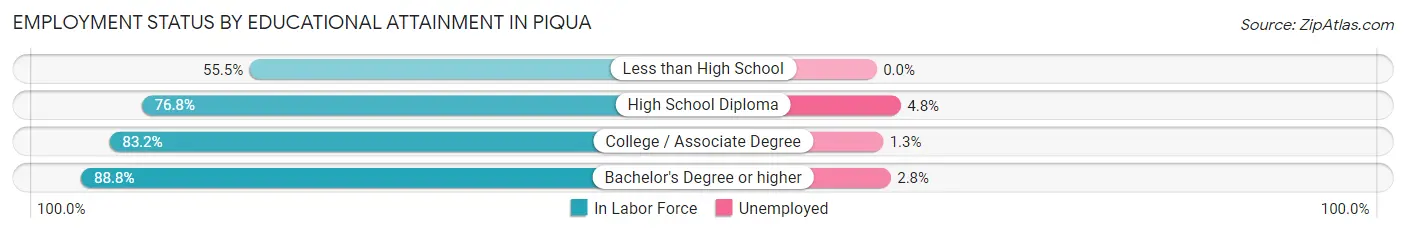
| Educational Attainment | In Labor Force | Unemployed |
| Less than High School | 483 (55.5%) | 0 (0.0%) |
| High School Diploma | 3,376 (76.8%) | 211 (4.8%) |
| College / Associate Degree | 3,141 (83.2%) | 49 (1.3%) |
| Bachelor's Degree or higher | 1,221 (88.8%) | 38 (2.8%) |
| Total | 8,218 (78.9%) | 302 (2.9%) |
Employment Occupations by Sex in Piqua
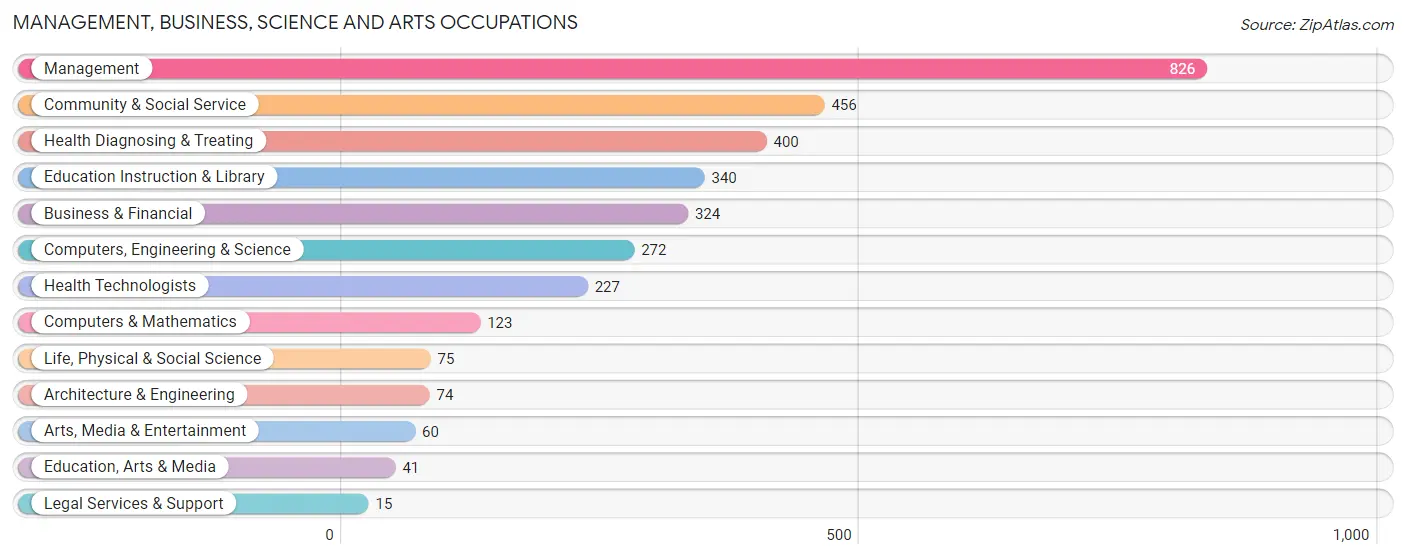
Management, Business, Science and Arts Occupations
The most common Management, Business, Science and Arts occupations in Piqua are Management (826 | 8.2%), Community & Social Service (456 | 4.5%), Health Diagnosing & Treating (400 | 4.0%), Education Instruction & Library (340 | 3.4%), and Business & Financial (324 | 3.2%).
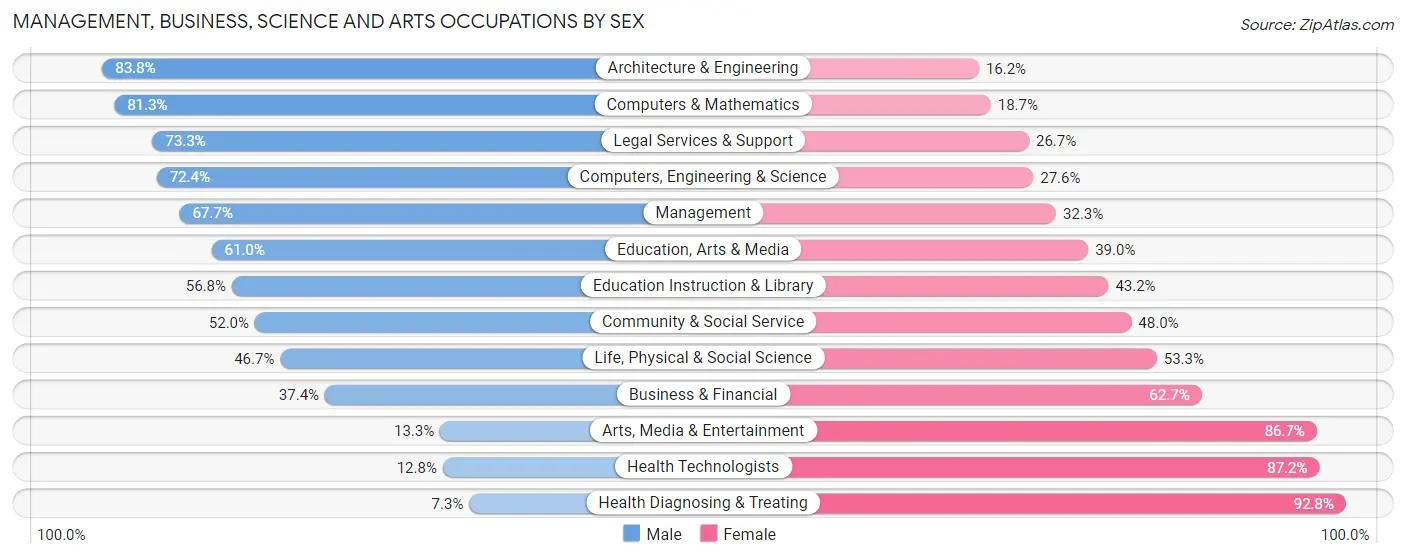
Management, Business, Science and Arts Occupations by Sex
Within the Management, Business, Science and Arts occupations in Piqua, the most male-oriented occupations are Architecture & Engineering (83.8%), Computers & Mathematics (81.3%), and Legal Services & Support (73.3%), while the most female-oriented occupations are Health Diagnosing & Treating (92.7%), Health Technologists (87.2%), and Arts, Media & Entertainment (86.7%).
| Occupation | Male | Female |
| Management | 559 (67.7%) | 267 (32.3%) |
| Business & Financial | 121 (37.3%) | 203 (62.6%) |
| Computers, Engineering & Science | 197 (72.4%) | 75 (27.6%) |
| Computers & Mathematics | 100 (81.3%) | 23 (18.7%) |
| Architecture & Engineering | 62 (83.8%) | 12 (16.2%) |
| Life, Physical & Social Science | 35 (46.7%) | 40 (53.3%) |
| Community & Social Service | 237 (52.0%) | 219 (48.0%) |
| Education, Arts & Media | 25 (61.0%) | 16 (39.0%) |
| Legal Services & Support | 11 (73.3%) | 4 (26.7%) |
| Education Instruction & Library | 193 (56.8%) | 147 (43.2%) |
| Arts, Media & Entertainment | 8 (13.3%) | 52 (86.7%) |
| Health Diagnosing & Treating | 29 (7.2%) | 371 (92.7%) |
| Health Technologists | 29 (12.8%) | 198 (87.2%) |
| Total (Category) | 1,143 (50.2%) | 1,135 (49.8%) |
| Total (Overall) | 5,836 (57.6%) | 4,295 (42.4%) |
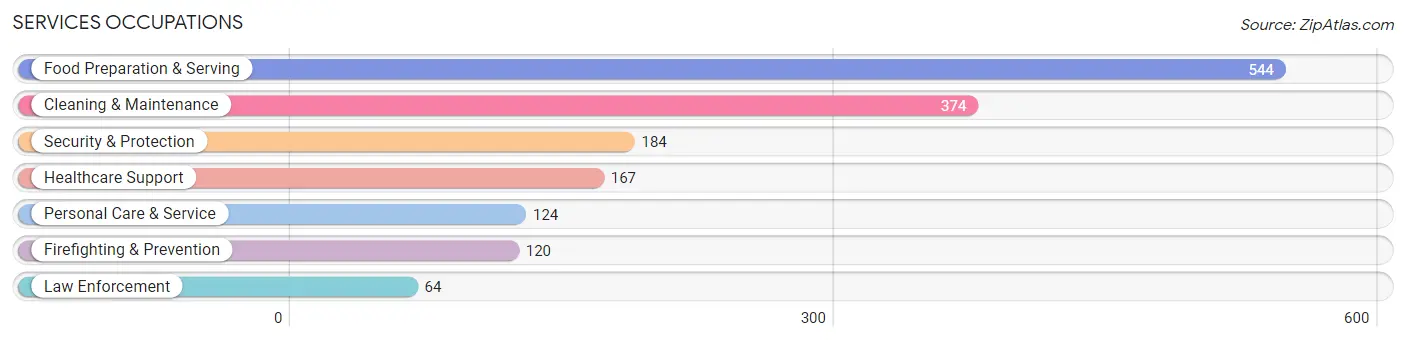
Services Occupations
The most common Services occupations in Piqua are Food Preparation & Serving (544 | 5.4%), Cleaning & Maintenance (374 | 3.7%), Security & Protection (184 | 1.8%), Healthcare Support (167 | 1.7%), and Personal Care & Service (124 | 1.2%).
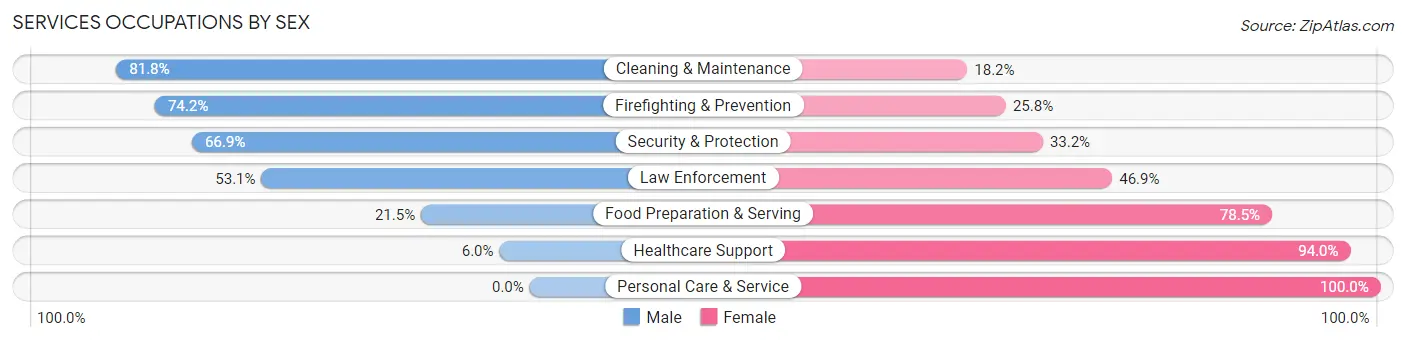
Services Occupations by Sex
Within the Services occupations in Piqua, the most male-oriented occupations are Cleaning & Maintenance (81.8%), Firefighting & Prevention (74.2%), and Security & Protection (66.8%), while the most female-oriented occupations are Personal Care & Service (100.0%), Healthcare Support (94.0%), and Food Preparation & Serving (78.5%).
| Occupation | Male | Female |
| Healthcare Support | 10 (6.0%) | 157 (94.0%) |
| Security & Protection | 123 (66.8%) | 61 (33.2%) |
| Firefighting & Prevention | 89 (74.2%) | 31 (25.8%) |
| Law Enforcement | 34 (53.1%) | 30 (46.9%) |
| Food Preparation & Serving | 117 (21.5%) | 427 (78.5%) |
| Cleaning & Maintenance | 306 (81.8%) | 68 (18.2%) |
| Personal Care & Service | 0 (0.0%) | 124 (100.0%) |
| Total (Category) | 556 (39.9%) | 837 (60.1%) |
| Total (Overall) | 5,836 (57.6%) | 4,295 (42.4%) |
Sales and Office Occupations
The most common Sales and Office occupations in Piqua are Sales & Related (1,064 | 10.5%), and Office & Administration (1,032 | 10.2%).

Sales and Office Occupations by Sex
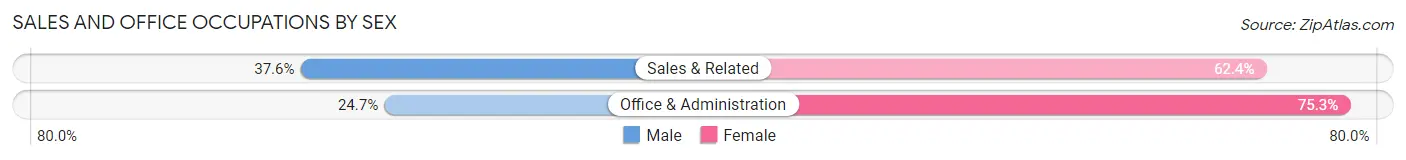
| Occupation | Male | Female |
| Sales & Related | 400 (37.6%) | 664 (62.4%) |
| Office & Administration | 255 (24.7%) | 777 (75.3%) |
| Total (Category) | 655 (31.2%) | 1,441 (68.8%) |
| Total (Overall) | 5,836 (57.6%) | 4,295 (42.4%) |
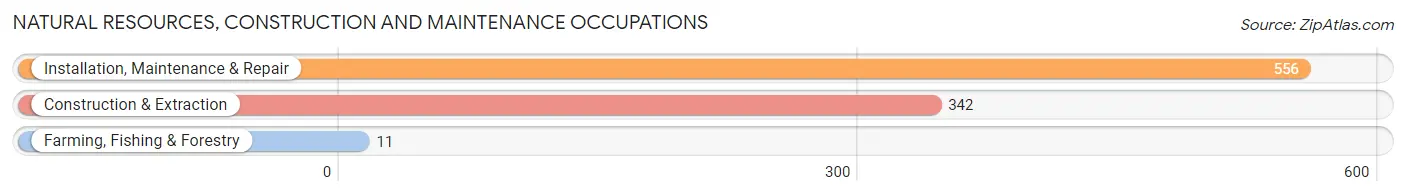
Natural Resources, Construction and Maintenance Occupations
The most common Natural Resources, Construction and Maintenance occupations in Piqua are Installation, Maintenance & Repair (556 | 5.5%), Construction & Extraction (342 | 3.4%), and Farming, Fishing & Forestry (11 | 0.1%).
Natural Resources, Construction and Maintenance Occupations by Sex
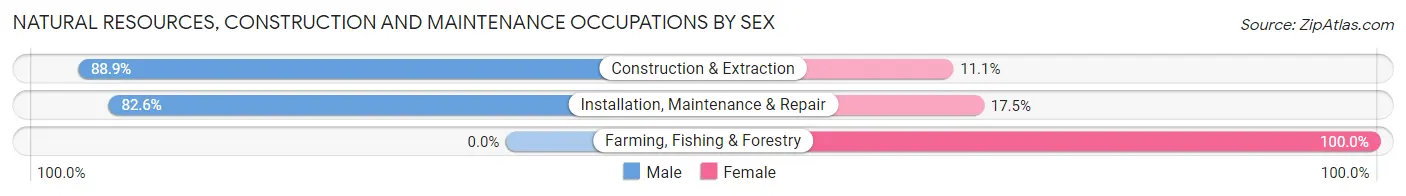
| Occupation | Male | Female |
| Farming, Fishing & Forestry | 0 (0.0%) | 11 (100.0%) |
| Construction & Extraction | 304 (88.9%) | 38 (11.1%) |
| Installation, Maintenance & Repair | 459 (82.6%) | 97 (17.4%) |
| Total (Category) | 763 (83.9%) | 146 (16.1%) |
| Total (Overall) | 5,836 (57.6%) | 4,295 (42.4%) |
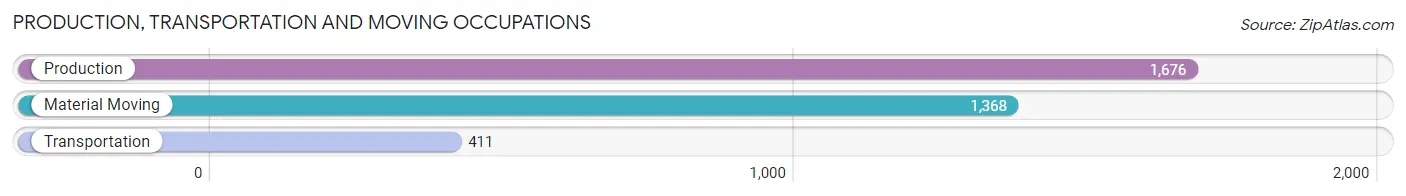
Production, Transportation and Moving Occupations
The most common Production, Transportation and Moving occupations in Piqua are Production (1,676 | 16.5%), Material Moving (1,368 | 13.5%), and Transportation (411 | 4.1%).
Production, Transportation and Moving Occupations by Sex
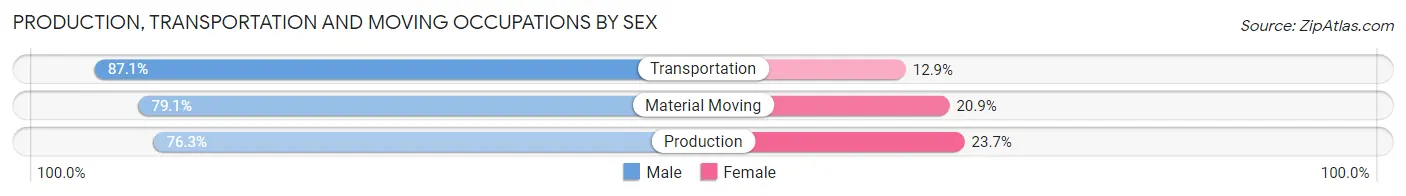
| Occupation | Male | Female |
| Production | 1,279 (76.3%) | 397 (23.7%) |
| Transportation | 358 (87.1%) | 53 (12.9%) |
| Material Moving | 1,082 (79.1%) | 286 (20.9%) |
| Total (Category) | 2,719 (78.7%) | 736 (21.3%) |
| Total (Overall) | 5,836 (57.6%) | 4,295 (42.4%) |
Employment Industries by Sex in Piqua
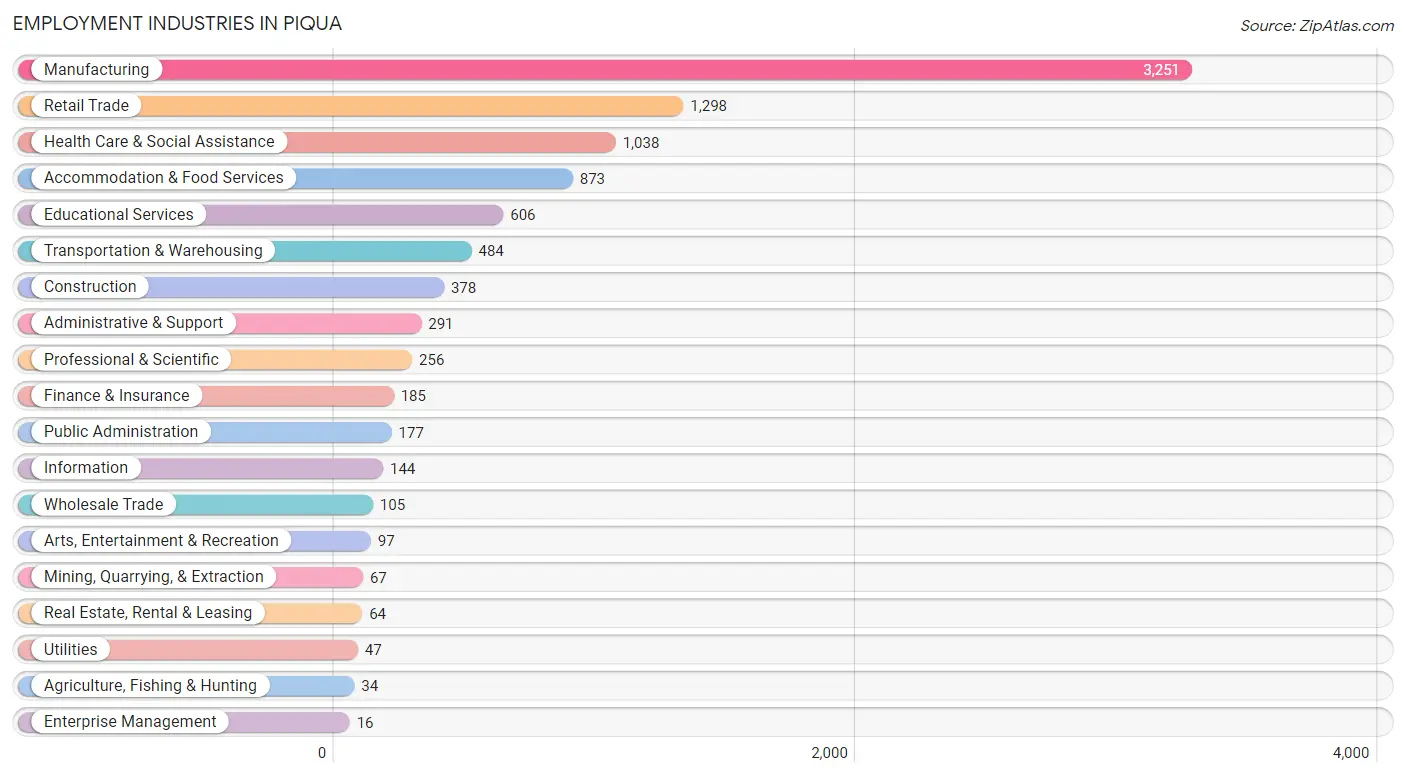
Employment Industries in Piqua
The major employment industries in Piqua include Manufacturing (3,251 | 32.1%), Retail Trade (1,298 | 12.8%), Health Care & Social Assistance (1,038 | 10.2%), Accommodation & Food Services (873 | 8.6%), and Educational Services (606 | 6.0%).
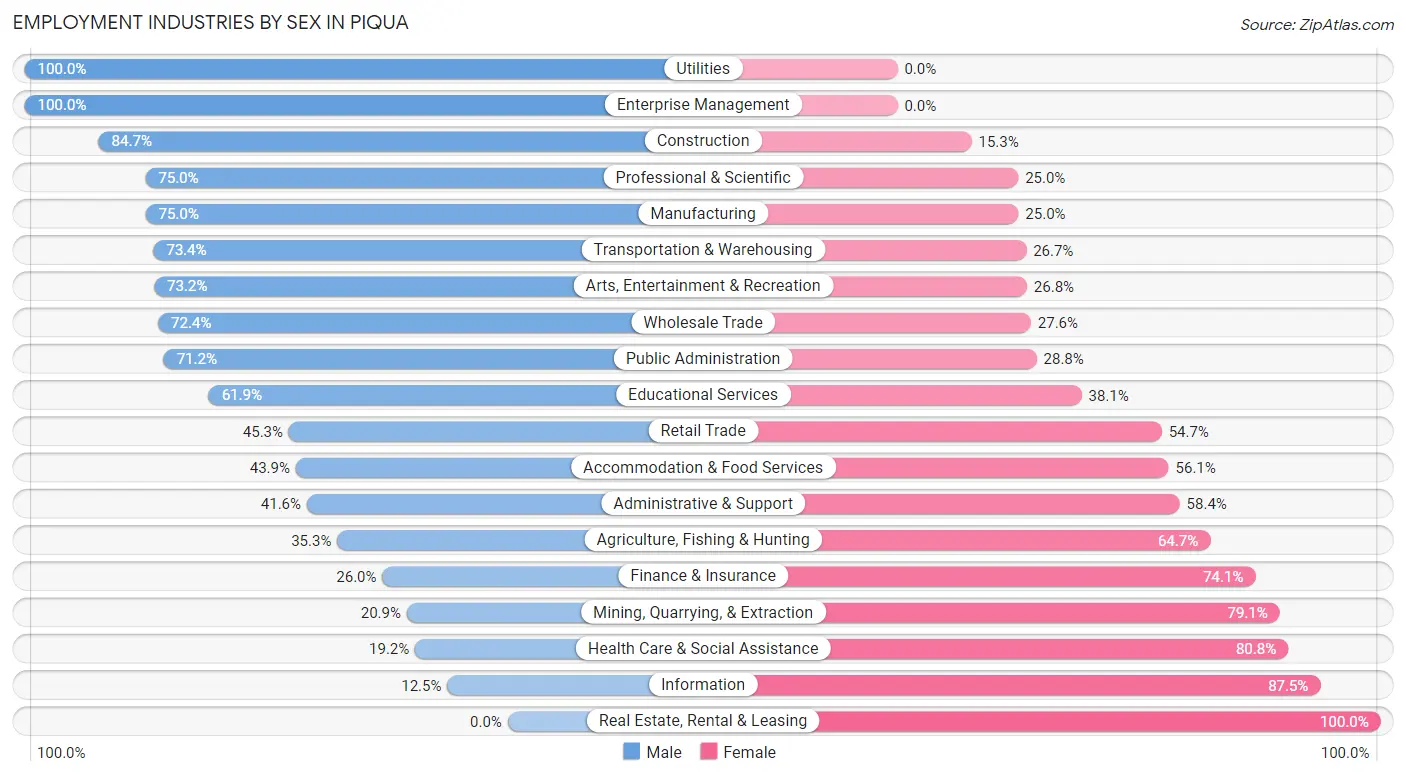
Employment Industries by Sex in Piqua
The Piqua industries that see more men than women are Utilities (100.0%), Enterprise Management (100.0%), and Construction (84.7%), whereas the industries that tend to have a higher number of women are Real Estate, Rental & Leasing (100.0%), Information (87.5%), and Health Care & Social Assistance (80.8%).
| Industry | Male | Female |
| Agriculture, Fishing & Hunting | 12 (35.3%) | 22 (64.7%) |
| Mining, Quarrying, & Extraction | 14 (20.9%) | 53 (79.1%) |
| Construction | 320 (84.7%) | 58 (15.3%) |
| Manufacturing | 2,437 (75.0%) | 814 (25.0%) |
| Wholesale Trade | 76 (72.4%) | 29 (27.6%) |
| Retail Trade | 588 (45.3%) | 710 (54.7%) |
| Transportation & Warehousing | 355 (73.4%) | 129 (26.7%) |
| Utilities | 47 (100.0%) | 0 (0.0%) |
| Information | 18 (12.5%) | 126 (87.5%) |
| Finance & Insurance | 48 (26.0%) | 137 (74.1%) |
| Real Estate, Rental & Leasing | 0 (0.0%) | 64 (100.0%) |
| Professional & Scientific | 192 (75.0%) | 64 (25.0%) |
| Enterprise Management | 16 (100.0%) | 0 (0.0%) |
| Administrative & Support | 121 (41.6%) | 170 (58.4%) |
| Educational Services | 375 (61.9%) | 231 (38.1%) |
| Health Care & Social Assistance | 199 (19.2%) | 839 (80.8%) |
| Arts, Entertainment & Recreation | 71 (73.2%) | 26 (26.8%) |
| Accommodation & Food Services | 383 (43.9%) | 490 (56.1%) |
| Public Administration | 126 (71.2%) | 51 (28.8%) |
| Total | 5,836 (57.6%) | 4,295 (42.4%) |
Education in Piqua
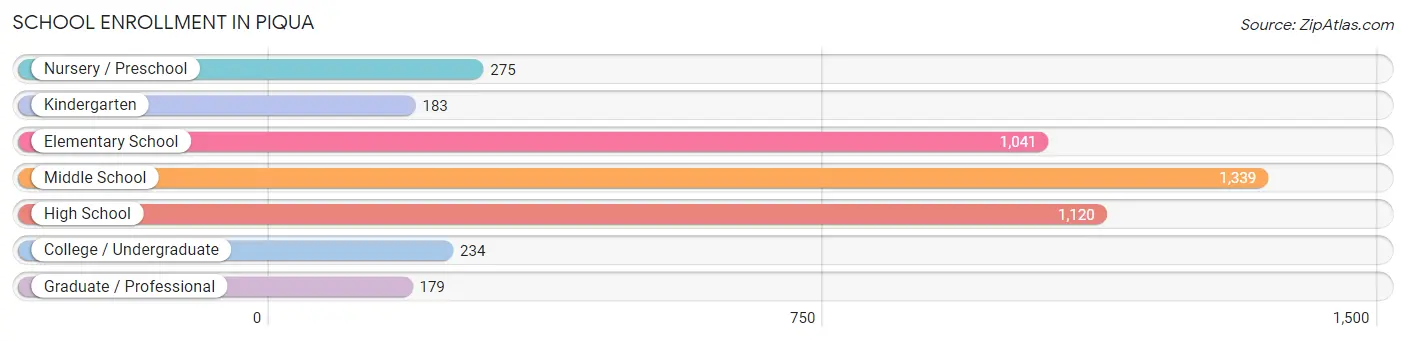
School Enrollment in Piqua
The most common levels of schooling among the 4,371 students in Piqua are middle school (1,339 | 30.6%), high school (1,120 | 25.6%), and elementary school (1,041 | 23.8%).
| School Level | # Students | % Students |
| Nursery / Preschool | 275 | 6.3% |
| Kindergarten | 183 | 4.2% |
| Elementary School | 1,041 | 23.8% |
| Middle School | 1,339 | 30.6% |
| High School | 1,120 | 25.6% |
| College / Undergraduate | 234 | 5.3% |
| Graduate / Professional | 179 | 4.1% |
| Total | 4,371 | 100.0% |
School Enrollment by Age by Funding Source in Piqua
Out of a total of 4,371 students who are enrolled in schools in Piqua, 332 (7.6%) attend a private institution, while the remaining 4,039 (92.4%) are enrolled in public schools. The age group of 3 to 4 year olds has the highest likelihood of being enrolled in private schools, with 70 (40.2% in the age bracket) enrolled. Conversely, the age group of 20 to 24 year olds has the lowest likelihood of being enrolled in a private school, with 167 (100.0% in the age bracket) attending a public institution.
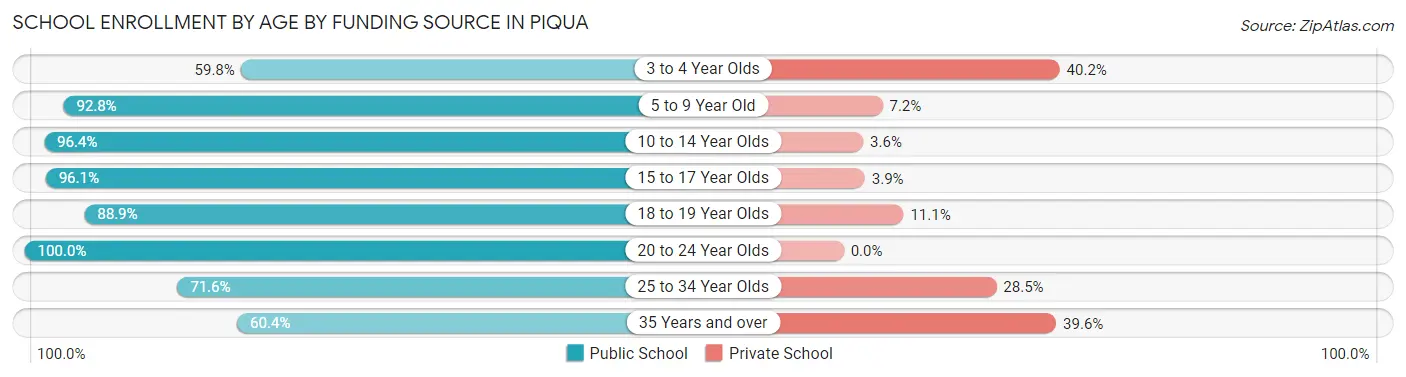
| Age Bracket | Public School | Private School |
| 3 to 4 Year Olds | 104 (59.8%) | 70 (40.2%) |
| 5 to 9 Year Old | 1,127 (92.8%) | 88 (7.2%) |
| 10 to 14 Year Olds | 1,541 (96.4%) | 58 (3.6%) |
| 15 to 17 Year Olds | 683 (96.1%) | 28 (3.9%) |
| 18 to 19 Year Olds | 303 (88.9%) | 38 (11.1%) |
| 20 to 24 Year Olds | 167 (100.0%) | 0 (0.0%) |
| 25 to 34 Year Olds | 83 (71.6%) | 33 (28.4%) |
| 35 Years and over | 29 (60.4%) | 19 (39.6%) |
| Total | 4,039 (92.4%) | 332 (7.6%) |
Educational Attainment by Field of Study in Piqua
Business (432 | 23.1%), education (424 | 22.6%), arts & humanities (288 | 15.4%), science & technology (211 | 11.3%), and visual & performing arts (76 | 4.1%) are the most common fields of study among 1,874 individuals in Piqua who have obtained a bachelor's degree or higher.
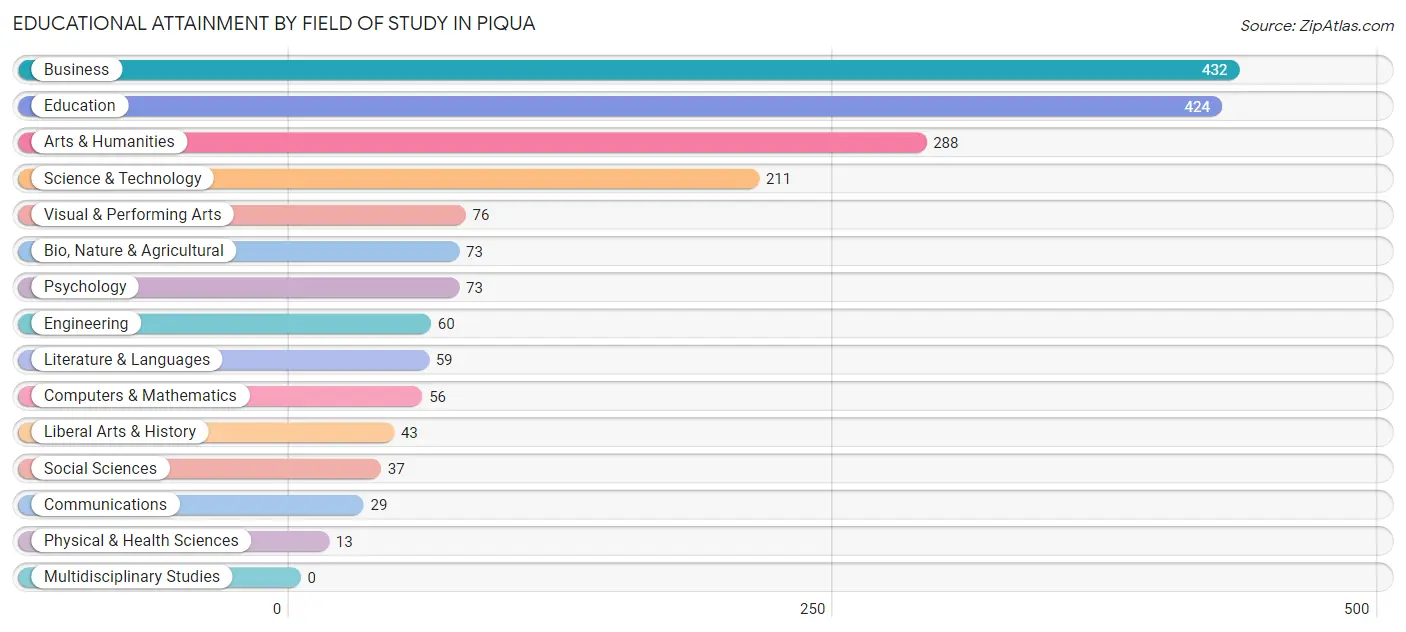
| Field of Study | # Graduates | % Graduates |
| Computers & Mathematics | 56 | 3.0% |
| Bio, Nature & Agricultural | 73 | 3.9% |
| Physical & Health Sciences | 13 | 0.7% |
| Psychology | 73 | 3.9% |
| Social Sciences | 37 | 2.0% |
| Engineering | 60 | 3.2% |
| Multidisciplinary Studies | 0 | 0.0% |
| Science & Technology | 211 | 11.3% |
| Business | 432 | 23.1% |
| Education | 424 | 22.6% |
| Literature & Languages | 59 | 3.2% |
| Liberal Arts & History | 43 | 2.3% |
| Visual & Performing Arts | 76 | 4.1% |
| Communications | 29 | 1.5% |
| Arts & Humanities | 288 | 15.4% |
| Total | 1,874 | 100.0% |
Transportation & Commute in Piqua
Vehicle Availability by Sex in Piqua
The most prevalent vehicle ownership categories in Piqua are males with 2 vehicles (2,769, accounting for 48.0%) and females with 2 vehicles (1,689, making up 65.8%).
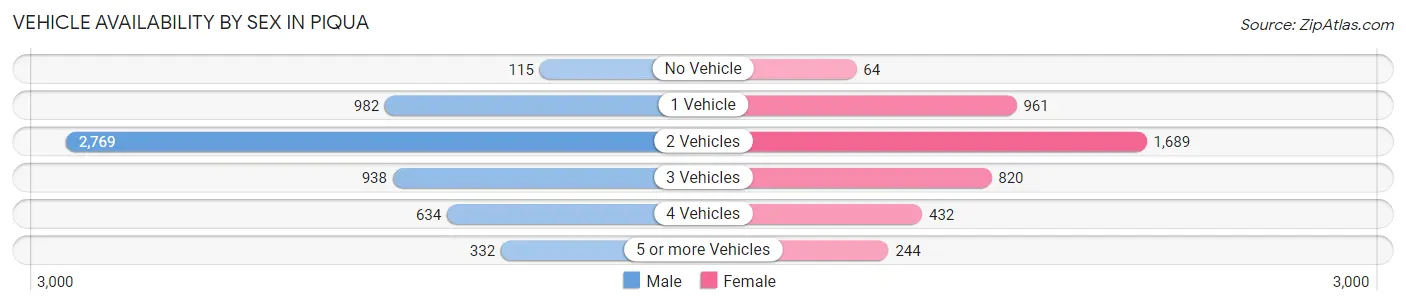
| Vehicles Available | Male | Female |
| No Vehicle | 115 (2.0%) | 64 (1.5%) |
| 1 Vehicle | 982 (17.0%) | 961 (22.8%) |
| 2 Vehicles | 2,769 (48.0%) | 1,689 (40.1%) |
| 3 Vehicles | 938 (16.3%) | 820 (19.5%) |
| 4 Vehicles | 634 (11.0%) | 432 (10.3%) |
| 5 or more Vehicles | 332 (5.8%) | 244 (5.8%) |
| Total | 5,770 (100.0%) | 4,210 (100.0%) |
Commute Time in Piqua
The most frequently occuring commute durations in Piqua are 5 to 9 minutes (1,980 commuters, 20.6%), 10 to 14 minutes (1,960 commuters, 20.4%), and 15 to 19 minutes (1,517 commuters, 15.8%).
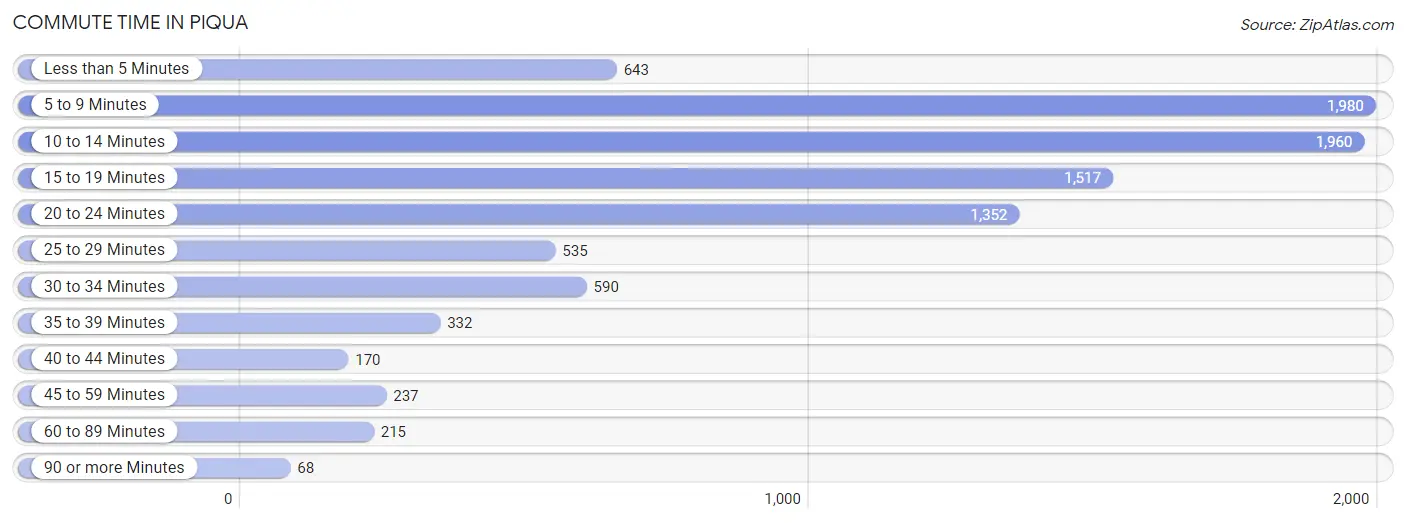
| Commute Time | # Commuters | % Commuters |
| Less than 5 Minutes | 643 | 6.7% |
| 5 to 9 Minutes | 1,980 | 20.6% |
| 10 to 14 Minutes | 1,960 | 20.4% |
| 15 to 19 Minutes | 1,517 | 15.8% |
| 20 to 24 Minutes | 1,352 | 14.1% |
| 25 to 29 Minutes | 535 | 5.6% |
| 30 to 34 Minutes | 590 | 6.1% |
| 35 to 39 Minutes | 332 | 3.5% |
| 40 to 44 Minutes | 170 | 1.8% |
| 45 to 59 Minutes | 237 | 2.5% |
| 60 to 89 Minutes | 215 | 2.2% |
| 90 or more Minutes | 68 | 0.7% |
Commute Time by Sex in Piqua
The most common commute times in Piqua are 10 to 14 minutes (1,045 commuters, 18.6%) for males and 5 to 9 minutes (942 commuters, 23.7%) for females.
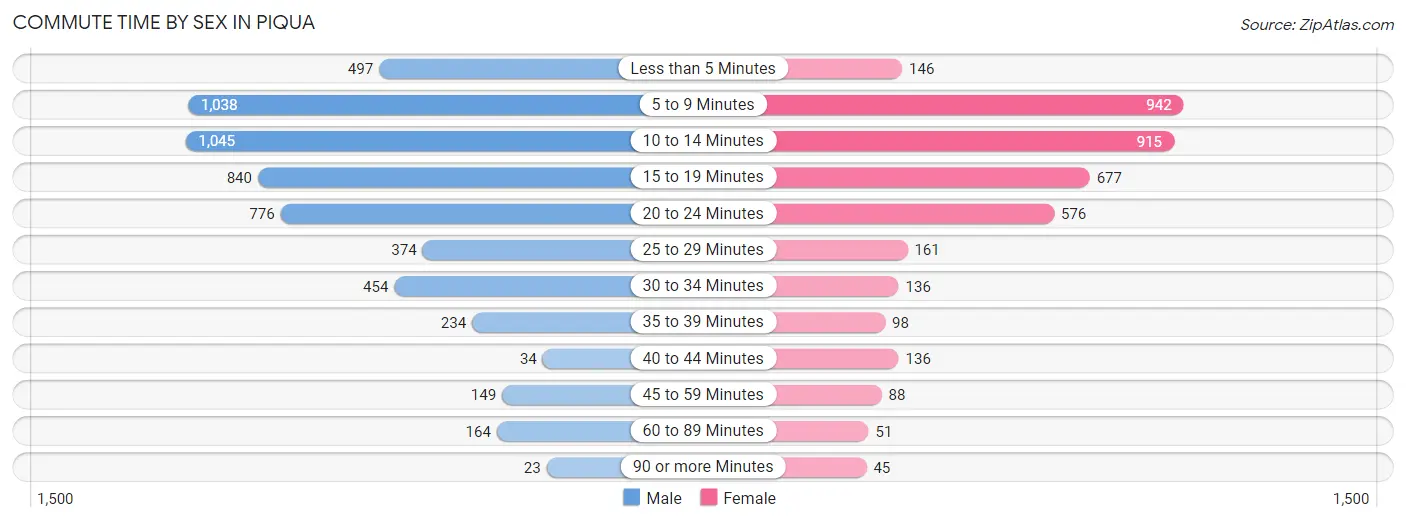
| Commute Time | Male | Female |
| Less than 5 Minutes | 497 (8.8%) | 146 (3.7%) |
| 5 to 9 Minutes | 1,038 (18.4%) | 942 (23.7%) |
| 10 to 14 Minutes | 1,045 (18.6%) | 915 (23.0%) |
| 15 to 19 Minutes | 840 (14.9%) | 677 (17.1%) |
| 20 to 24 Minutes | 776 (13.8%) | 576 (14.5%) |
| 25 to 29 Minutes | 374 (6.7%) | 161 (4.1%) |
| 30 to 34 Minutes | 454 (8.1%) | 136 (3.4%) |
| 35 to 39 Minutes | 234 (4.2%) | 98 (2.5%) |
| 40 to 44 Minutes | 34 (0.6%) | 136 (3.4%) |
| 45 to 59 Minutes | 149 (2.6%) | 88 (2.2%) |
| 60 to 89 Minutes | 164 (2.9%) | 51 (1.3%) |
| 90 or more Minutes | 23 (0.4%) | 45 (1.1%) |
Time of Departure to Work by Sex in Piqua
The most frequent times of departure to work in Piqua are 12:00 PM to 3:59 PM (927, 16.5%) for males and 6:30 AM to 6:59 AM (596, 15.0%) for females.
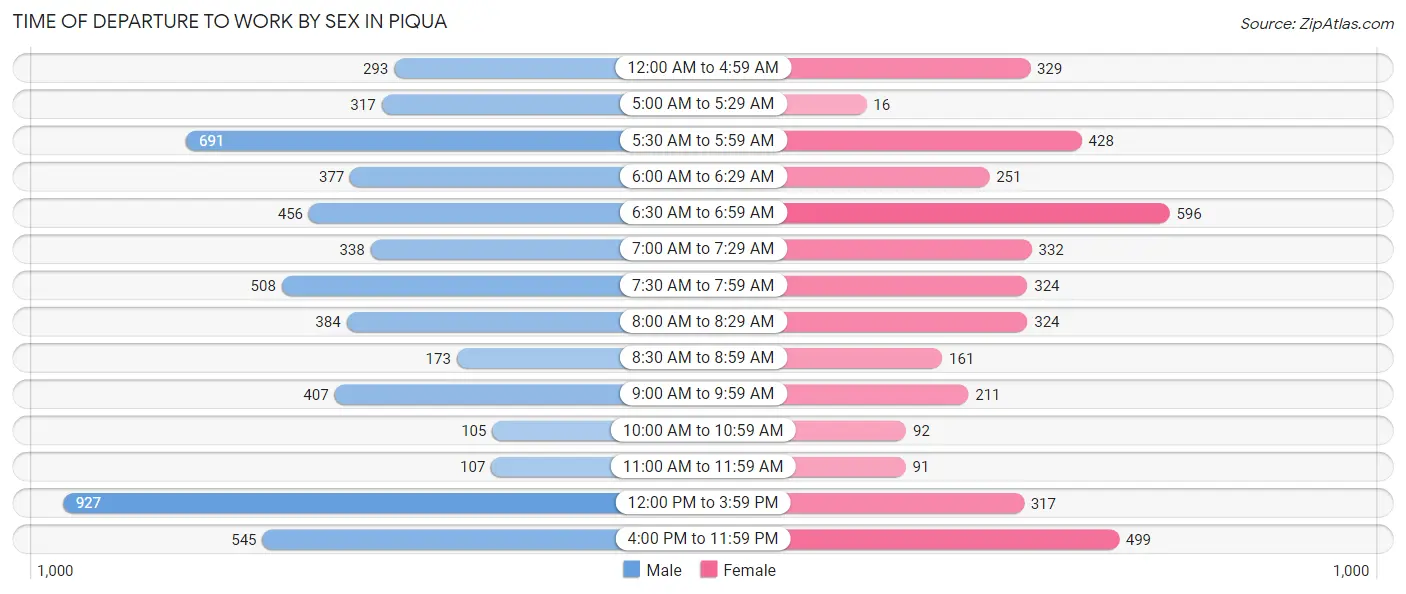
| Time of Departure | Male | Female |
| 12:00 AM to 4:59 AM | 293 (5.2%) | 329 (8.3%) |
| 5:00 AM to 5:29 AM | 317 (5.6%) | 16 (0.4%) |
| 5:30 AM to 5:59 AM | 691 (12.3%) | 428 (10.8%) |
| 6:00 AM to 6:29 AM | 377 (6.7%) | 251 (6.3%) |
| 6:30 AM to 6:59 AM | 456 (8.1%) | 596 (15.0%) |
| 7:00 AM to 7:29 AM | 338 (6.0%) | 332 (8.4%) |
| 7:30 AM to 7:59 AM | 508 (9.0%) | 324 (8.2%) |
| 8:00 AM to 8:29 AM | 384 (6.8%) | 324 (8.2%) |
| 8:30 AM to 8:59 AM | 173 (3.1%) | 161 (4.1%) |
| 9:00 AM to 9:59 AM | 407 (7.2%) | 211 (5.3%) |
| 10:00 AM to 10:59 AM | 105 (1.9%) | 92 (2.3%) |
| 11:00 AM to 11:59 AM | 107 (1.9%) | 91 (2.3%) |
| 12:00 PM to 3:59 PM | 927 (16.5%) | 317 (8.0%) |
| 4:00 PM to 11:59 PM | 545 (9.7%) | 499 (12.6%) |
| Total | 5,628 (100.0%) | 3,971 (100.0%) |
Housing Occupancy in Piqua
Occupancy by Ownership in Piqua
Of the total 8,672 dwellings in Piqua, owner-occupied units account for 5,500 (63.4%), while renter-occupied units make up 3,172 (36.6%).
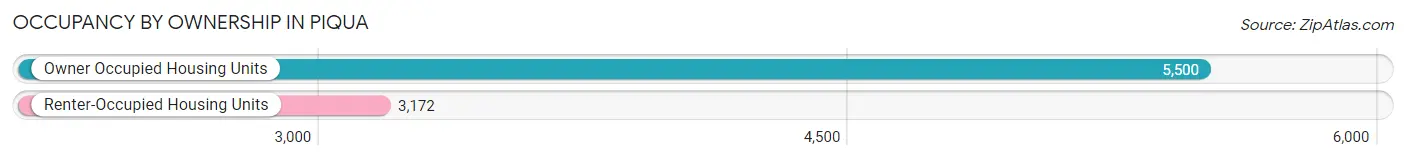
| Occupancy | # Housing Units | % Housing Units |
| Owner Occupied Housing Units | 5,500 | 63.4% |
| Renter-Occupied Housing Units | 3,172 | 36.6% |
| Total Occupied Housing Units | 8,672 | 100.0% |
Occupancy by Household Size in Piqua
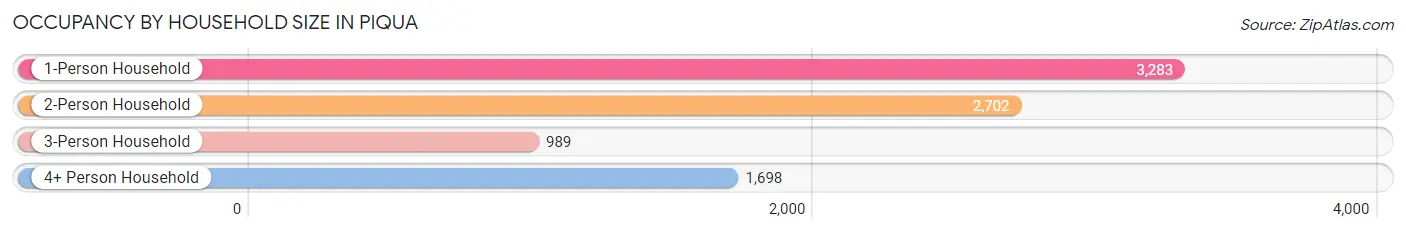
| Household Size | # Housing Units | % Housing Units |
| 1-Person Household | 3,283 | 37.9% |
| 2-Person Household | 2,702 | 31.2% |
| 3-Person Household | 989 | 11.4% |
| 4+ Person Household | 1,698 | 19.6% |
| Total Housing Units | 8,672 | 100.0% |
Occupancy by Ownership by Household Size in Piqua
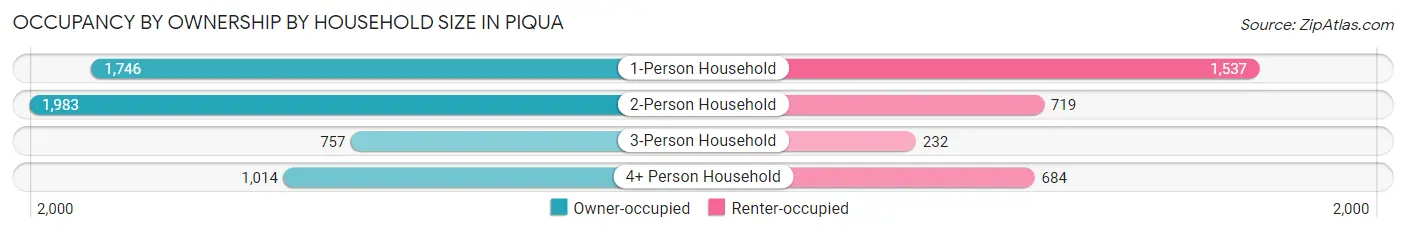
| Household Size | Owner-occupied | Renter-occupied |
| 1-Person Household | 1,746 (53.2%) | 1,537 (46.8%) |
| 2-Person Household | 1,983 (73.4%) | 719 (26.6%) |
| 3-Person Household | 757 (76.5%) | 232 (23.5%) |
| 4+ Person Household | 1,014 (59.7%) | 684 (40.3%) |
| Total Housing Units | 5,500 (63.4%) | 3,172 (36.6%) |
Occupancy by Educational Attainment in Piqua
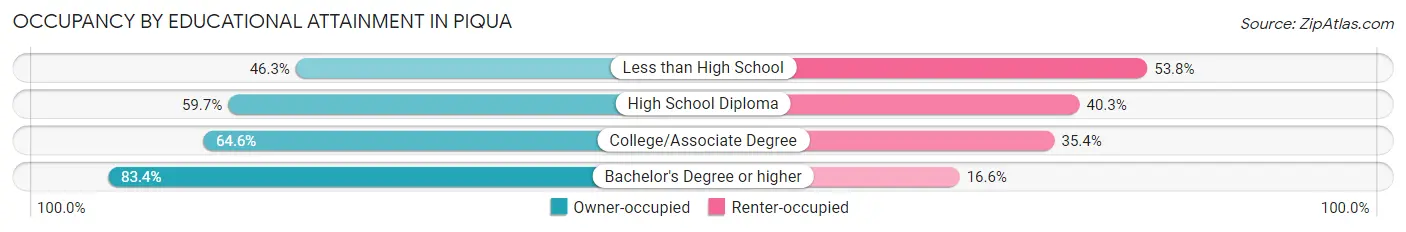
| Household Size | Owner-occupied | Renter-occupied |
| Less than High School | 389 (46.3%) | 452 (53.7%) |
| High School Diploma | 2,137 (59.7%) | 1,444 (40.3%) |
| College/Associate Degree | 1,966 (64.6%) | 1,076 (35.4%) |
| Bachelor's Degree or higher | 1,008 (83.4%) | 200 (16.6%) |
Occupancy by Age of Householder in Piqua
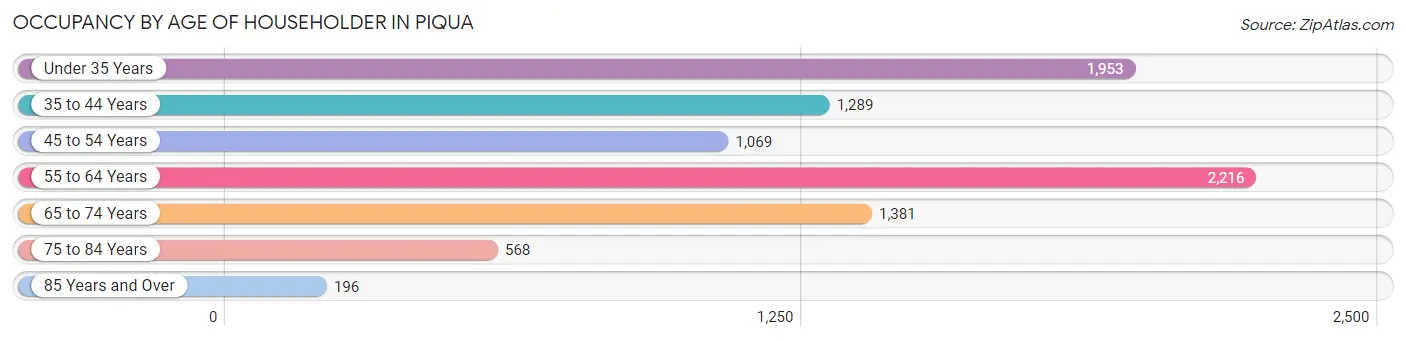
| Age Bracket | # Households | % Households |
| Under 35 Years | 1,953 | 22.5% |
| 35 to 44 Years | 1,289 | 14.9% |
| 45 to 54 Years | 1,069 | 12.3% |
| 55 to 64 Years | 2,216 | 25.6% |
| 65 to 74 Years | 1,381 | 15.9% |
| 75 to 84 Years | 568 | 6.6% |
| 85 Years and Over | 196 | 2.3% |
| Total | 8,672 | 100.0% |
Housing Finances in Piqua
Median Income by Occupancy in Piqua
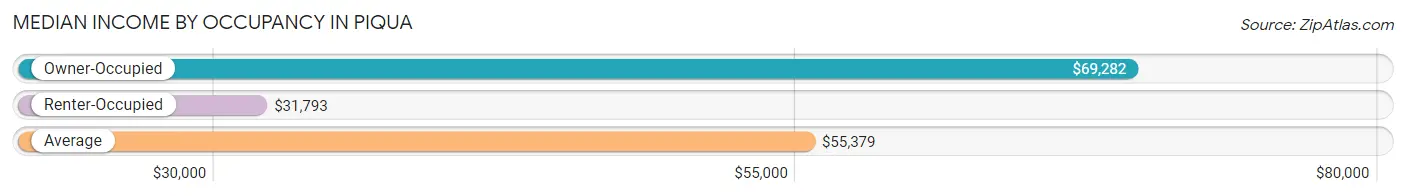
| Occupancy Type | # Households | Median Income |
| Owner-Occupied | 5,500 (63.4%) | $69,282 |
| Renter-Occupied | 3,172 (36.6%) | $31,793 |
| Average | 8,672 (100.0%) | $55,379 |
Occupancy by Householder Income Bracket in Piqua
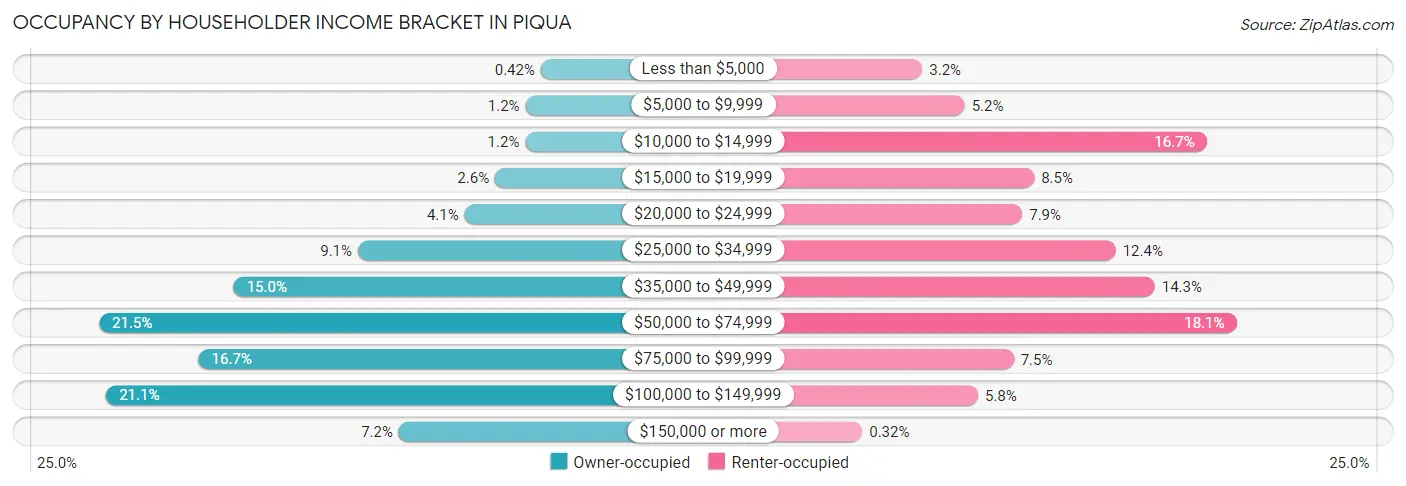
| Income Bracket | Owner-occupied | Renter-occupied |
| Less than $5,000 | 23 (0.4%) | 101 (3.2%) |
| $5,000 to $9,999 | 63 (1.1%) | 165 (5.2%) |
| $10,000 to $14,999 | 64 (1.2%) | 530 (16.7%) |
| $15,000 to $19,999 | 143 (2.6%) | 270 (8.5%) |
| $20,000 to $24,999 | 223 (4.1%) | 252 (7.9%) |
| $25,000 to $34,999 | 502 (9.1%) | 393 (12.4%) |
| $35,000 to $49,999 | 827 (15.0%) | 452 (14.2%) |
| $50,000 to $74,999 | 1,180 (21.4%) | 575 (18.1%) |
| $75,000 to $99,999 | 919 (16.7%) | 239 (7.5%) |
| $100,000 to $149,999 | 1,161 (21.1%) | 185 (5.8%) |
| $150,000 or more | 395 (7.2%) | 10 (0.3%) |
| Total | 5,500 (100.0%) | 3,172 (100.0%) |
Monthly Housing Cost Tiers in Piqua
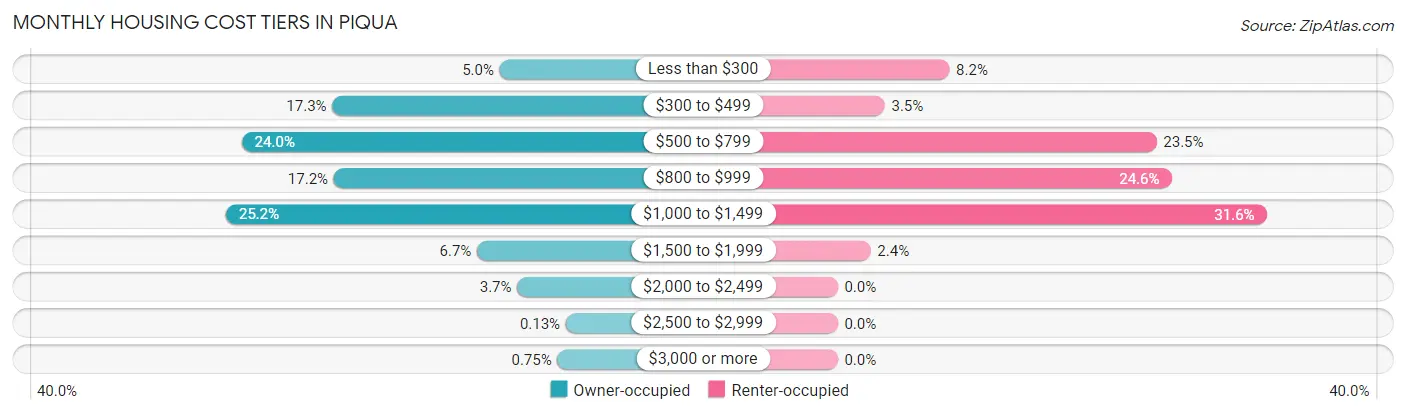
| Monthly Cost | Owner-occupied | Renter-occupied |
| Less than $300 | 275 (5.0%) | 261 (8.2%) |
| $300 to $499 | 953 (17.3%) | 110 (3.5%) |
| $500 to $799 | 1,321 (24.0%) | 745 (23.5%) |
| $800 to $999 | 947 (17.2%) | 780 (24.6%) |
| $1,000 to $1,499 | 1,385 (25.2%) | 1,002 (31.6%) |
| $1,500 to $1,999 | 367 (6.7%) | 77 (2.4%) |
| $2,000 to $2,499 | 204 (3.7%) | 0 (0.0%) |
| $2,500 to $2,999 | 7 (0.1%) | 0 (0.0%) |
| $3,000 or more | 41 (0.7%) | 0 (0.0%) |
| Total | 5,500 (100.0%) | 3,172 (100.0%) |
Physical Housing Characteristics in Piqua
Housing Structures in Piqua
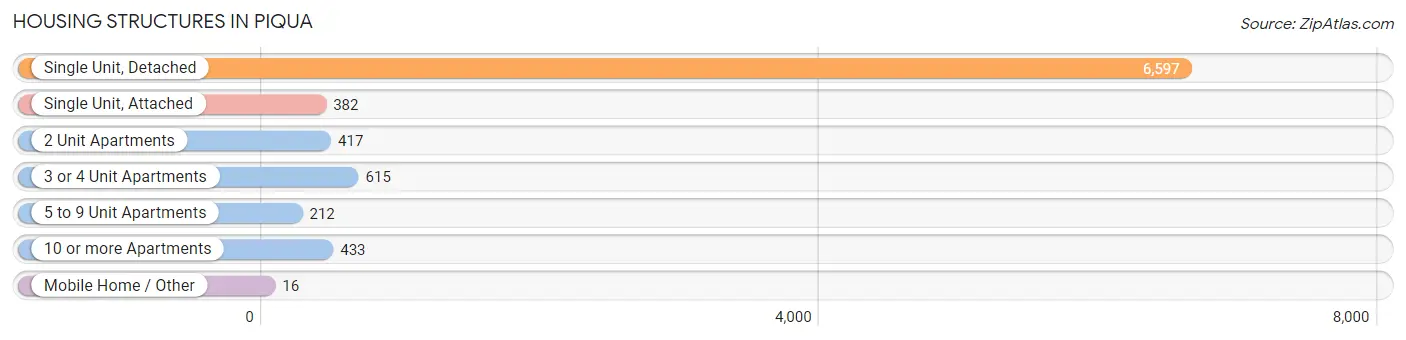
| Structure Type | # Housing Units | % Housing Units |
| Single Unit, Detached | 6,597 | 76.1% |
| Single Unit, Attached | 382 | 4.4% |
| 2 Unit Apartments | 417 | 4.8% |
| 3 or 4 Unit Apartments | 615 | 7.1% |
| 5 to 9 Unit Apartments | 212 | 2.4% |
| 10 or more Apartments | 433 | 5.0% |
| Mobile Home / Other | 16 | 0.2% |
| Total | 8,672 | 100.0% |
Housing Structures by Occupancy in Piqua
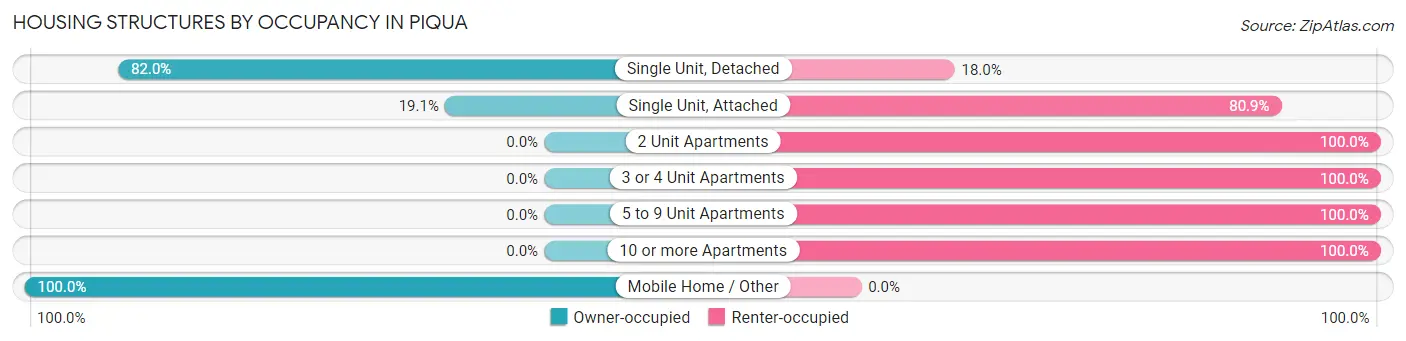
| Structure Type | Owner-occupied | Renter-occupied |
| Single Unit, Detached | 5,411 (82.0%) | 1,186 (18.0%) |
| Single Unit, Attached | 73 (19.1%) | 309 (80.9%) |
| 2 Unit Apartments | 0 (0.0%) | 417 (100.0%) |
| 3 or 4 Unit Apartments | 0 (0.0%) | 615 (100.0%) |
| 5 to 9 Unit Apartments | 0 (0.0%) | 212 (100.0%) |
| 10 or more Apartments | 0 (0.0%) | 433 (100.0%) |
| Mobile Home / Other | 16 (100.0%) | 0 (0.0%) |
| Total | 5,500 (63.4%) | 3,172 (36.6%) |
Housing Structures by Number of Rooms in Piqua
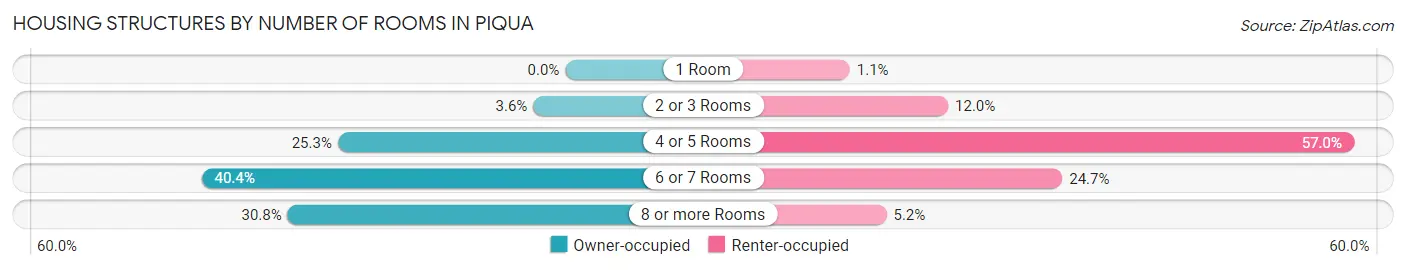
| Number of Rooms | Owner-occupied | Renter-occupied |
| 1 Room | 0 (0.0%) | 35 (1.1%) |
| 2 or 3 Rooms | 196 (3.6%) | 381 (12.0%) |
| 4 or 5 Rooms | 1,389 (25.3%) | 1,809 (57.0%) |
| 6 or 7 Rooms | 2,220 (40.4%) | 783 (24.7%) |
| 8 or more Rooms | 1,695 (30.8%) | 164 (5.2%) |
| Total | 5,500 (100.0%) | 3,172 (100.0%) |
Housing Structure by Heating Type in Piqua
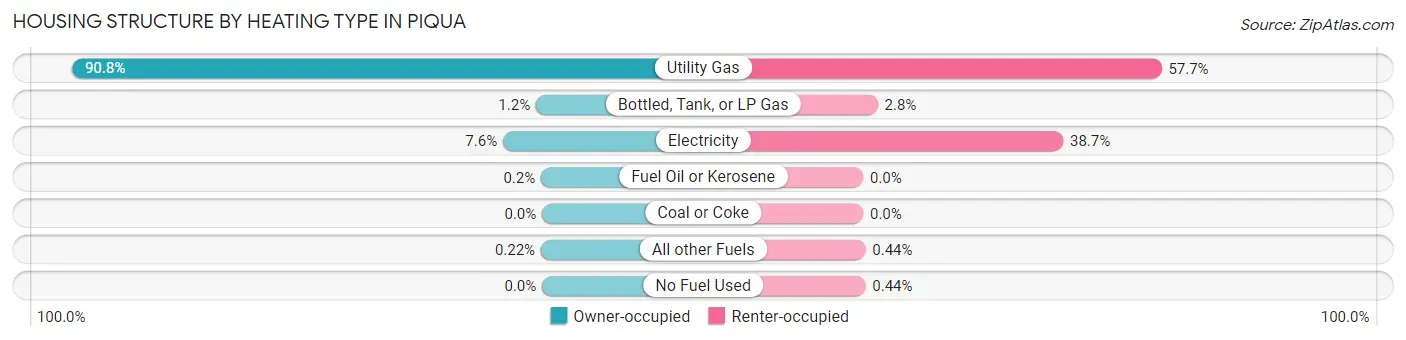
| Heating Type | Owner-occupied | Renter-occupied |
| Utility Gas | 4,996 (90.8%) | 1,829 (57.7%) |
| Bottled, Tank, or LP Gas | 65 (1.2%) | 89 (2.8%) |
| Electricity | 416 (7.6%) | 1,226 (38.7%) |
| Fuel Oil or Kerosene | 11 (0.2%) | 0 (0.0%) |
| Coal or Coke | 0 (0.0%) | 0 (0.0%) |
| All other Fuels | 12 (0.2%) | 14 (0.4%) |
| No Fuel Used | 0 (0.0%) | 14 (0.4%) |
| Total | 5,500 (100.0%) | 3,172 (100.0%) |
Household Vehicle Usage in Piqua
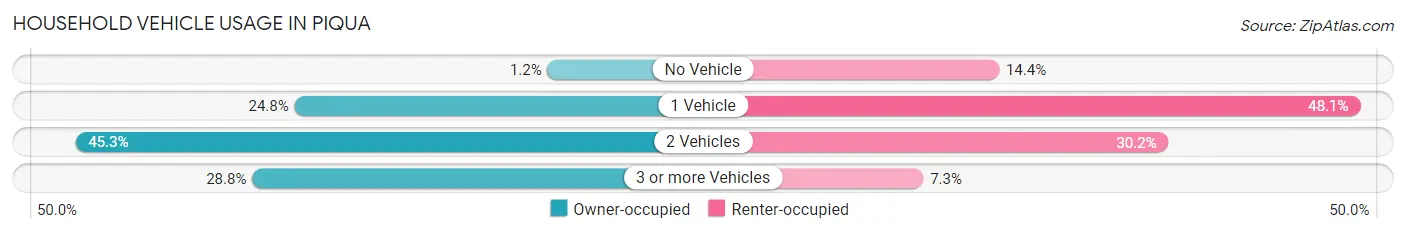
| Vehicles per Household | Owner-occupied | Renter-occupied |
| No Vehicle | 65 (1.2%) | 456 (14.4%) |
| 1 Vehicle | 1,364 (24.8%) | 1,526 (48.1%) |
| 2 Vehicles | 2,490 (45.3%) | 958 (30.2%) |
| 3 or more Vehicles | 1,581 (28.7%) | 232 (7.3%) |
| Total | 5,500 (100.0%) | 3,172 (100.0%) |
Real Estate & Mortgages in Piqua
Real Estate and Mortgage Overview in Piqua
| Characteristic | Without Mortgage | With Mortgage |
| Housing Units | 1,728 | 3,772 |
| Median Property Value | $128,300 | $105,700 |
| Median Household Income | $64,921 | $282 |
| Monthly Housing Costs | $462 | $41 |
| Real Estate Taxes | $1,336 | $18 |
Property Value by Mortgage Status in Piqua
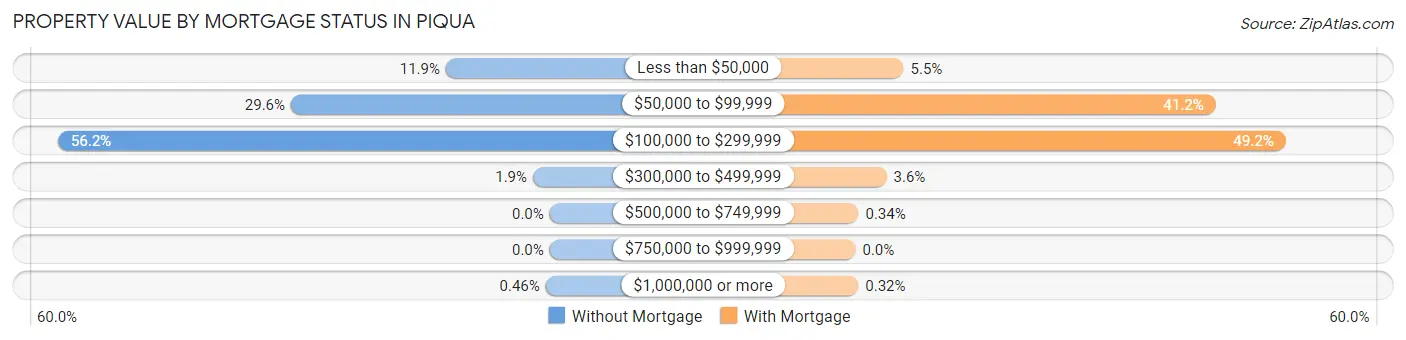
| Property Value | Without Mortgage | With Mortgage |
| Less than $50,000 | 205 (11.9%) | 207 (5.5%) |
| $50,000 to $99,999 | 511 (29.6%) | 1,552 (41.1%) |
| $100,000 to $299,999 | 971 (56.2%) | 1,854 (49.1%) |
| $300,000 to $499,999 | 33 (1.9%) | 134 (3.5%) |
| $500,000 to $749,999 | 0 (0.0%) | 13 (0.3%) |
| $750,000 to $999,999 | 0 (0.0%) | 0 (0.0%) |
| $1,000,000 or more | 8 (0.5%) | 12 (0.3%) |
| Total | 1,728 (100.0%) | 3,772 (100.0%) |
Household Income by Mortgage Status in Piqua
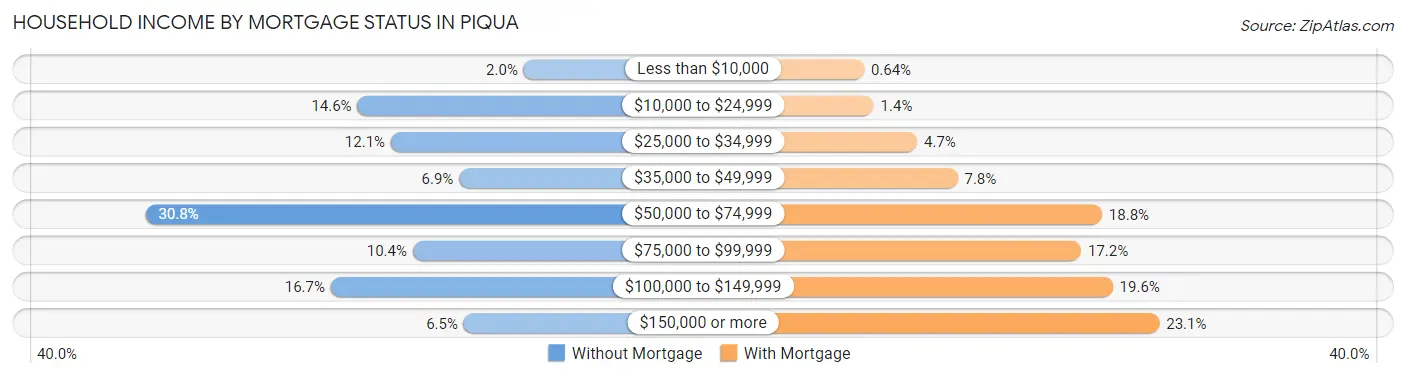
| Household Income | Without Mortgage | With Mortgage |
| Less than $10,000 | 34 (2.0%) | 24 (0.6%) |
| $10,000 to $24,999 | 253 (14.6%) | 52 (1.4%) |
| $25,000 to $34,999 | 209 (12.1%) | 177 (4.7%) |
| $35,000 to $49,999 | 119 (6.9%) | 293 (7.8%) |
| $50,000 to $74,999 | 532 (30.8%) | 708 (18.8%) |
| $75,000 to $99,999 | 180 (10.4%) | 648 (17.2%) |
| $100,000 to $149,999 | 288 (16.7%) | 739 (19.6%) |
| $150,000 or more | 113 (6.5%) | 873 (23.1%) |
| Total | 1,728 (100.0%) | 3,772 (100.0%) |
Property Value to Household Income Ratio in Piqua
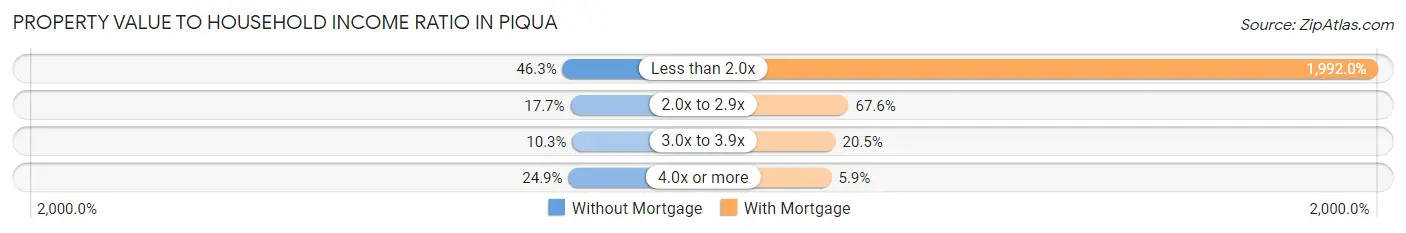
| Value-to-Income Ratio | Without Mortgage | With Mortgage |
| Less than 2.0x | 800 (46.3%) | 75,138 (1,992.0%) |
| 2.0x to 2.9x | 306 (17.7%) | 2,550 (67.6%) |
| 3.0x to 3.9x | 178 (10.3%) | 773 (20.5%) |
| 4.0x or more | 431 (24.9%) | 222 (5.9%) |
| Total | 1,728 (100.0%) | 3,772 (100.0%) |
Real Estate Taxes by Mortgage Status in Piqua
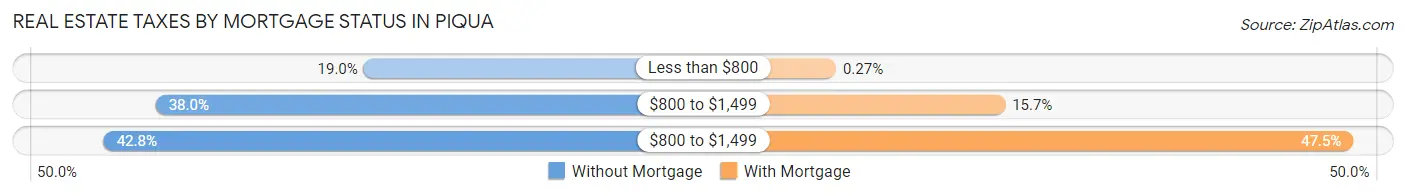
| Property Taxes | Without Mortgage | With Mortgage |
| Less than $800 | 329 (19.0%) | 10 (0.3%) |
| $800 to $1,499 | 657 (38.0%) | 593 (15.7%) |
| $800 to $1,499 | 739 (42.8%) | 1,792 (47.5%) |
| Total | 1,728 (100.0%) | 3,772 (100.0%) |
Health & Disability in Piqua
Health Insurance Coverage by Age in Piqua
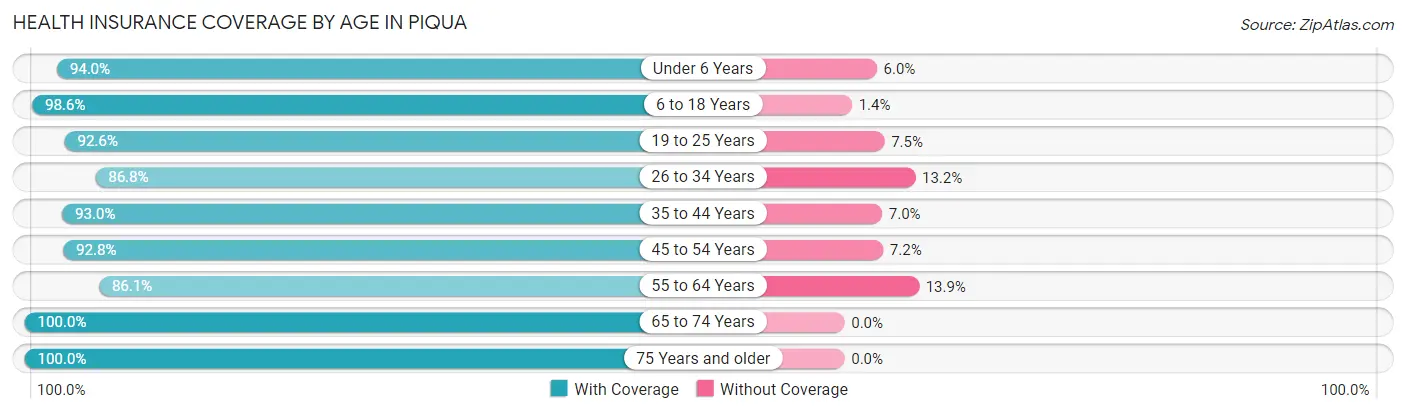
| Age Bracket | With Coverage | Without Coverage |
| Under 6 Years | 1,453 (94.0%) | 93 (6.0%) |
| 6 to 18 Years | 3,765 (98.6%) | 53 (1.4%) |
| 19 to 25 Years | 1,516 (92.5%) | 122 (7.4%) |
| 26 to 34 Years | 2,251 (86.8%) | 342 (13.2%) |
| 35 to 44 Years | 2,285 (93.0%) | 172 (7.0%) |
| 45 to 54 Years | 1,881 (92.8%) | 146 (7.2%) |
| 55 to 64 Years | 2,640 (86.1%) | 425 (13.9%) |
| 65 to 74 Years | 2,002 (100.0%) | 0 (0.0%) |
| 75 Years and older | 1,071 (100.0%) | 0 (0.0%) |
| Total | 18,864 (93.3%) | 1,353 (6.7%) |
Health Insurance Coverage by Citizenship Status in Piqua
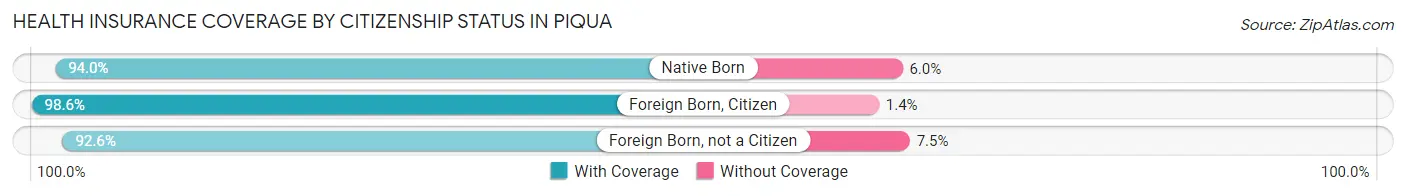
| Citizenship Status | With Coverage | Without Coverage |
| Native Born | 1,453 (94.0%) | 93 (6.0%) |
| Foreign Born, Citizen | 3,765 (98.6%) | 53 (1.4%) |
| Foreign Born, not a Citizen | 1,516 (92.5%) | 122 (7.4%) |
Health Insurance Coverage by Household Income in Piqua
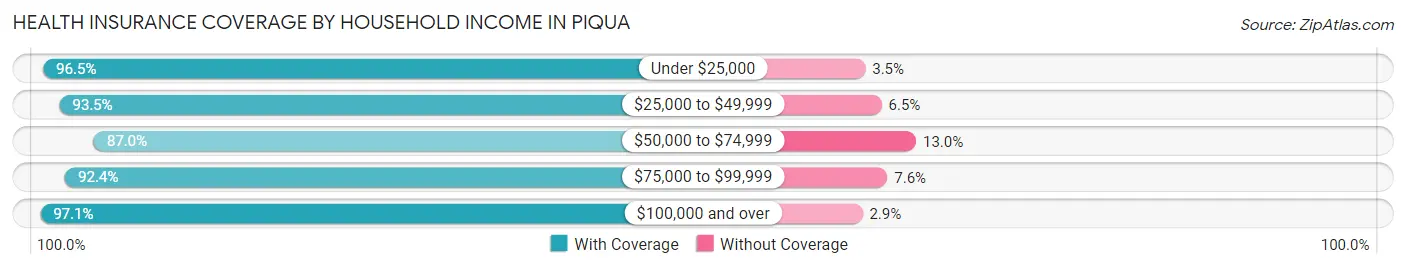
| Household Income | With Coverage | Without Coverage |
| Under $25,000 | 2,484 (96.5%) | 89 (3.5%) |
| $25,000 to $49,999 | 4,142 (93.5%) | 289 (6.5%) |
| $50,000 to $74,999 | 3,873 (87.0%) | 577 (13.0%) |
| $75,000 to $99,999 | 2,834 (92.4%) | 233 (7.6%) |
| $100,000 and over | 5,469 (97.1%) | 165 (2.9%) |
Public vs Private Health Insurance Coverage by Age in Piqua
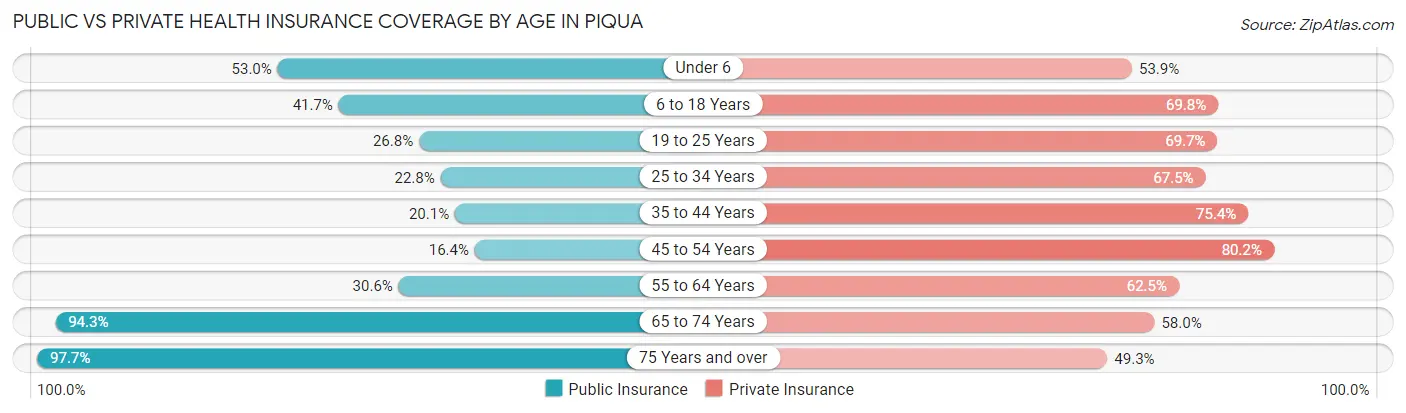
| Age Bracket | Public Insurance | Private Insurance |
| Under 6 | 820 (53.0%) | 833 (53.9%) |
| 6 to 18 Years | 1,592 (41.7%) | 2,666 (69.8%) |
| 19 to 25 Years | 439 (26.8%) | 1,142 (69.7%) |
| 25 to 34 Years | 591 (22.8%) | 1,750 (67.5%) |
| 35 to 44 Years | 494 (20.1%) | 1,853 (75.4%) |
| 45 to 54 Years | 333 (16.4%) | 1,625 (80.2%) |
| 55 to 64 Years | 937 (30.6%) | 1,917 (62.5%) |
| 65 to 74 Years | 1,888 (94.3%) | 1,162 (58.0%) |
| 75 Years and over | 1,046 (97.7%) | 528 (49.3%) |
| Total | 8,140 (40.3%) | 13,476 (66.7%) |
Disability Status by Sex by Age in Piqua
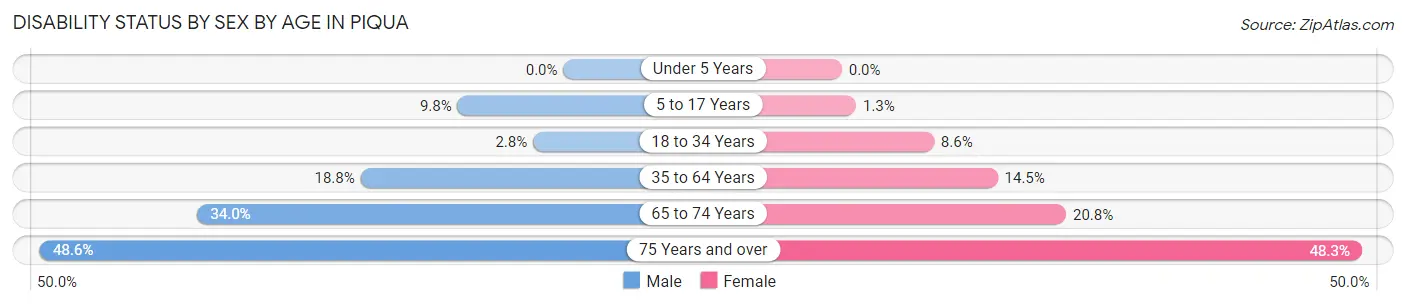
| Age Bracket | Male | Female |
| Under 5 Years | 0 (0.0%) | 0 (0.0%) |
| 5 to 17 Years | 207 (9.8%) | 20 (1.3%) |
| 18 to 34 Years | 65 (2.8%) | 195 (8.6%) |
| 35 to 64 Years | 761 (18.8%) | 507 (14.5%) |
| 65 to 74 Years | 360 (34.0%) | 196 (20.8%) |
| 75 Years and over | 187 (48.6%) | 331 (48.2%) |
Disability Class by Sex by Age in Piqua
Disability Class: Hearing Difficulty
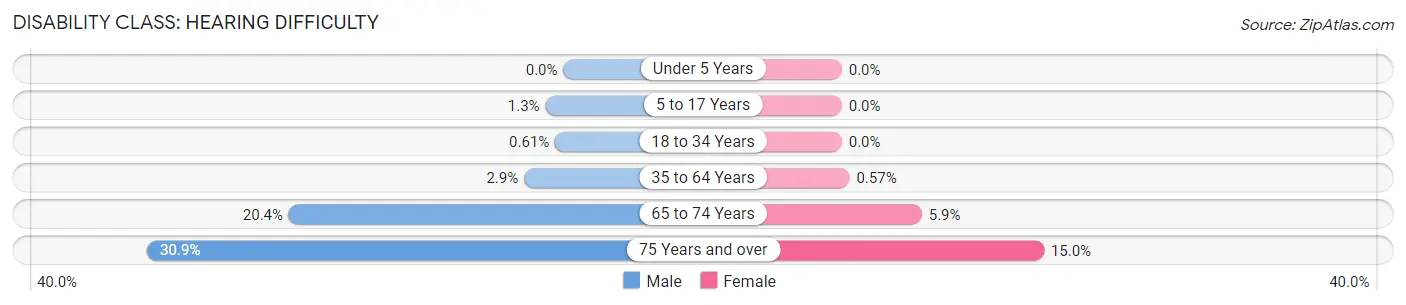
| Age Bracket | Male | Female |
| Under 5 Years | 0 (0.0%) | 0 (0.0%) |
| 5 to 17 Years | 28 (1.3%) | 0 (0.0%) |
| 18 to 34 Years | 14 (0.6%) | 0 (0.0%) |
| 35 to 64 Years | 118 (2.9%) | 20 (0.6%) |
| 65 to 74 Years | 216 (20.4%) | 56 (5.9%) |
| 75 Years and over | 119 (30.9%) | 103 (15.0%) |
Disability Class: Vision Difficulty
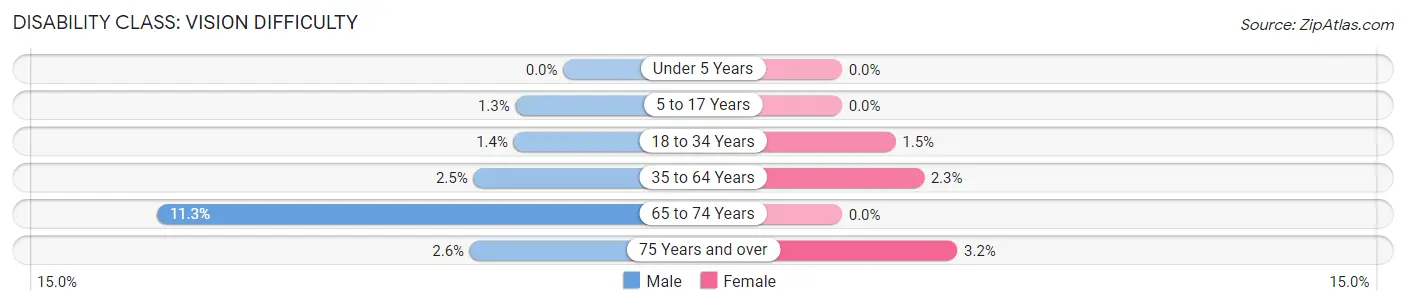
| Age Bracket | Male | Female |
| Under 5 Years | 0 (0.0%) | 0 (0.0%) |
| 5 to 17 Years | 28 (1.3%) | 0 (0.0%) |
| 18 to 34 Years | 32 (1.4%) | 34 (1.5%) |
| 35 to 64 Years | 101 (2.5%) | 80 (2.3%) |
| 65 to 74 Years | 120 (11.3%) | 0 (0.0%) |
| 75 Years and over | 10 (2.6%) | 22 (3.2%) |
Disability Class: Cognitive Difficulty
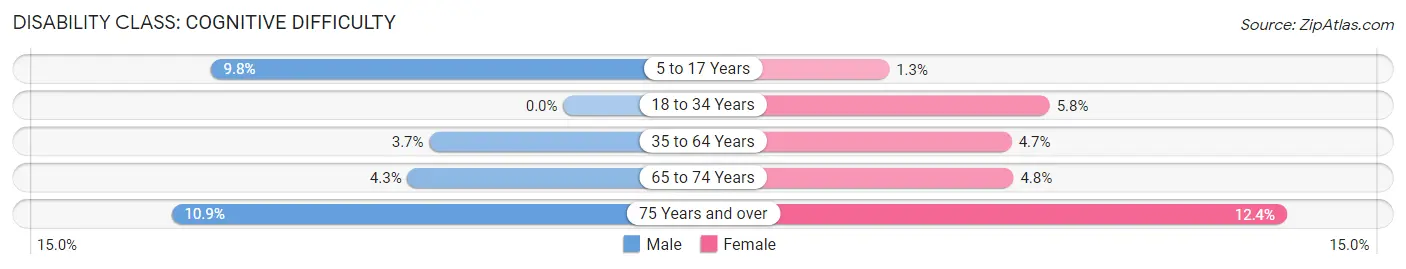
| Age Bracket | Male | Female |
| 5 to 17 Years | 207 (9.8%) | 20 (1.3%) |
| 18 to 34 Years | 0 (0.0%) | 132 (5.8%) |
| 35 to 64 Years | 151 (3.7%) | 166 (4.7%) |
| 65 to 74 Years | 46 (4.3%) | 45 (4.8%) |
| 75 Years and over | 42 (10.9%) | 85 (12.4%) |
Disability Class: Ambulatory Difficulty
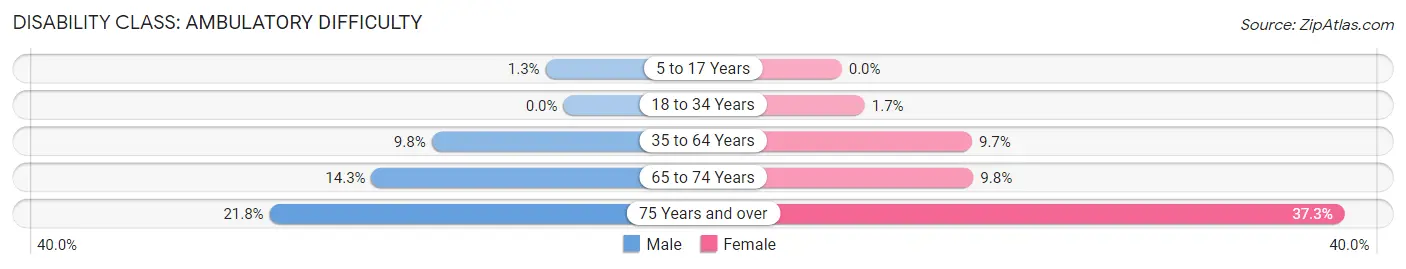
| Age Bracket | Male | Female |
| 5 to 17 Years | 28 (1.3%) | 0 (0.0%) |
| 18 to 34 Years | 0 (0.0%) | 39 (1.7%) |
| 35 to 64 Years | 396 (9.8%) | 339 (9.7%) |
| 65 to 74 Years | 151 (14.2%) | 92 (9.8%) |
| 75 Years and over | 84 (21.8%) | 256 (37.3%) |
Disability Class: Self-Care Difficulty
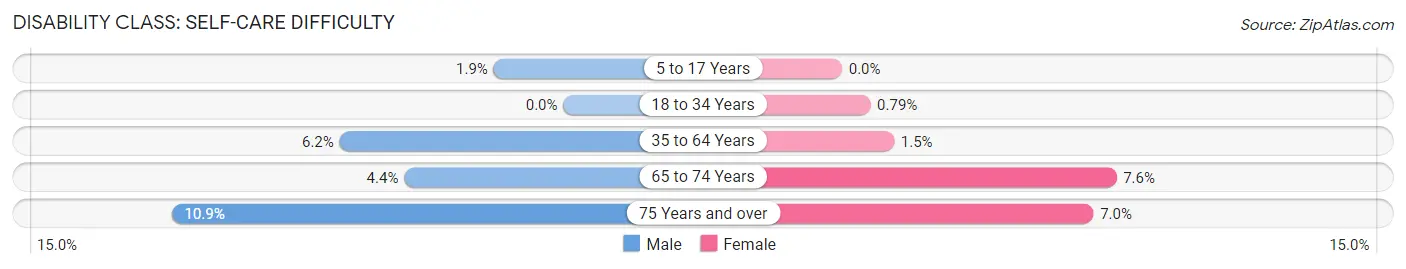
| Age Bracket | Male | Female |
| 5 to 17 Years | 41 (1.9%) | 0 (0.0%) |
| 18 to 34 Years | 0 (0.0%) | 18 (0.8%) |
| 35 to 64 Years | 252 (6.2%) | 51 (1.5%) |
| 65 to 74 Years | 47 (4.4%) | 72 (7.6%) |
| 75 Years and over | 42 (10.9%) | 48 (7.0%) |
Technology Access in Piqua
Computing Device Access in Piqua
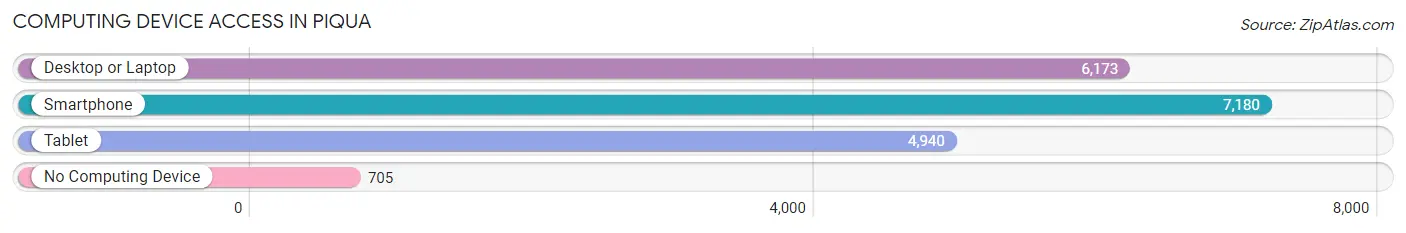
| Device Type | # Households | % Households |
| Desktop or Laptop | 6,173 | 71.2% |
| Smartphone | 7,180 | 82.8% |
| Tablet | 4,940 | 57.0% |
| No Computing Device | 705 | 8.1% |
| Total | 8,672 | 100.0% |
Internet Access in Piqua
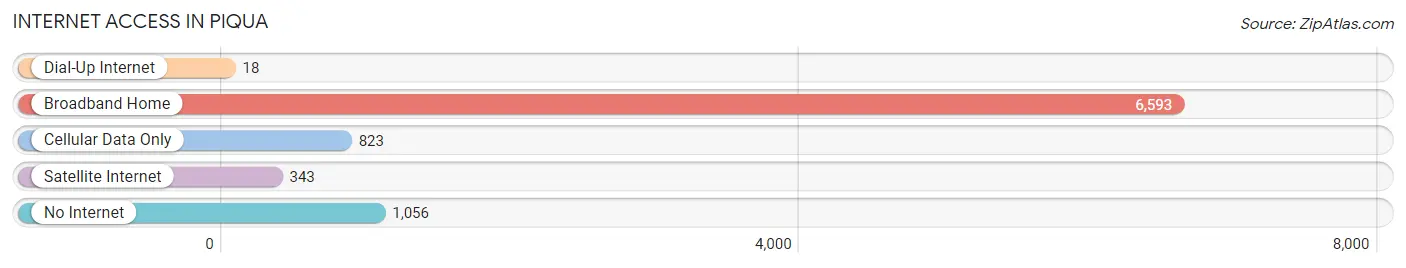
| Internet Type | # Households | % Households |
| Dial-Up Internet | 18 | 0.2% |
| Broadband Home | 6,593 | 76.0% |
| Cellular Data Only | 823 | 9.5% |
| Satellite Internet | 343 | 4.0% |
| No Internet | 1,056 | 12.2% |
| Total | 8,672 | 100.0% |
Piqua Summary
Piqua, Ohio is a city located in Miami County, Ohio, United States. It is part of the Dayton Metropolitan Statistical Area. The population was 20,522 at the 2010 census. It is the county seat of Miami County.
History
Piqua was founded in 1780 by French settlers who were part of the Miami tribe. The name Piqua is derived from the Miami word for "ashes," referring to the burning of the town by the British during the Revolutionary War. The town was incorporated in 1807 and became the county seat of Miami County in 1809.
In the 19th century, Piqua was a major center for the production of stoneware and pottery. The city was also home to several manufacturing companies, including the Piqua Iron Works, which produced iron products for the railroad industry.
Geography
Piqua is located at 40°9′25″N 84°13′17″W (40.156944, -84.221389). According to the United States Census Bureau, the city has a total area of 8.2 square miles (21.2 km2), of which 8.1 square miles (21.0 km2) is land and 0.1 square miles (0.2 km2) is water.
Economy
Piqua is home to several major employers, including Hartzell Propeller, Inc., a manufacturer of aircraft propellers; Piqua Foundry, a manufacturer of castings; and Piqua Plastics, a manufacturer of plastic products. The city is also home to several smaller businesses, including restaurants, retail stores, and service providers.
Demographics
As of the census of 2010, there were 20,522 people, 8,093 households, and 5,072 families residing in the city. The population density was 2,521.3 people per square mile (973.2/km2). There were 8,837 housing units at an average density of 1,092.3 per square mile (422.2/km2). The racial makeup of the city was 90.2% White, 4.3% African American, 0.3% Native American, 0.9% Asian, 0.1% Pacific Islander, 1.7% from other races, and 2.5% from two or more races. Hispanic or Latino of any race were 4.2% of the population.
There were 8,093 households, out of which 30.2% had children under the age of 18 living with them, 43.2% were married couples living together, 14.7% had a female householder with no husband present, and 37.2% were non-families. 32.2% of all households were made up of individuals, and 13.2% had someone living alone who was 65 years of age or older. The average household size was 2.41 and the average family size was 3.03.
In the city, the population was spread out, with 25.2% under the age of 18, 8.7% from 18 to 24, 28.2% from 25 to 44, 22.2% from 45 to 64, and 15.7% who were 65 years of age or older. The median age was 36 years. For every 100 females, there were 91.2 males. For every 100 females age 18 and over, there were 87.2 males.
The median income for a household in the city was $35,945, and the median income for a family was $45,845. Males had a median income of $35,945 versus $25,945 for females. The per capita income for the city was $19,845. About 8.7% of families and 11.2% of the population were below the poverty line, including 15.2% of those under age 18 and 8.2% of those age 65 or over.
Common Questions
What is Per Capita Income in Piqua?
Per Capita income in Piqua is $28,368.
What is the Median Family Income in Piqua?
Median Family Income in Piqua is $71,924.
What is the Median Household income in Piqua?
Median Household Income in Piqua is $55,379.
What is Income or Wage Gap in Piqua?
Income or Wage Gap in Piqua is 28.6%.
Women in Piqua earn 71.4 cents for every dollar earned by a man.
What is Family Income Deficit in Piqua?
Family Income Deficit in Piqua is $11,672.
Families that are below poverty line in Piqua earn $11,672 less on average than the poverty threshold level.
What is Inequality or Gini Index in Piqua?
Inequality or Gini Index in Piqua is 0.40.
What is the Total Population of Piqua?
Total Population of Piqua is 20,441.
What is the Total Male Population of Piqua?
Total Male Population of Piqua is 10,703.
What is the Total Female Population of Piqua?
Total Female Population of Piqua is 9,738.
What is the Ratio of Males per 100 Females in Piqua?
There are 109.91 Males per 100 Females in Piqua.
What is the Ratio of Females per 100 Males in Piqua?
There are 90.98 Females per 100 Males in Piqua.
What is the Median Population Age in Piqua?
Median Population Age in Piqua is 37.9 Years.
What is the Average Family Size in Piqua
Average Family Size in Piqua is 3.1 People.
What is the Average Household Size in Piqua
Average Household Size in Piqua is 2.3 People.
How Large is the Labor Force in Piqua?
There are 10,532 People in the Labor Forcein in Piqua.
What is the Percentage of People in the Labor Force in Piqua?
65.8% of People are in the Labor Force in Piqua.
What is the Unemployment Rate in Piqua?
Unemployment Rate in Piqua is 3.8%.