Pine Plains, NY Map & Demographics
Pine Plains Map
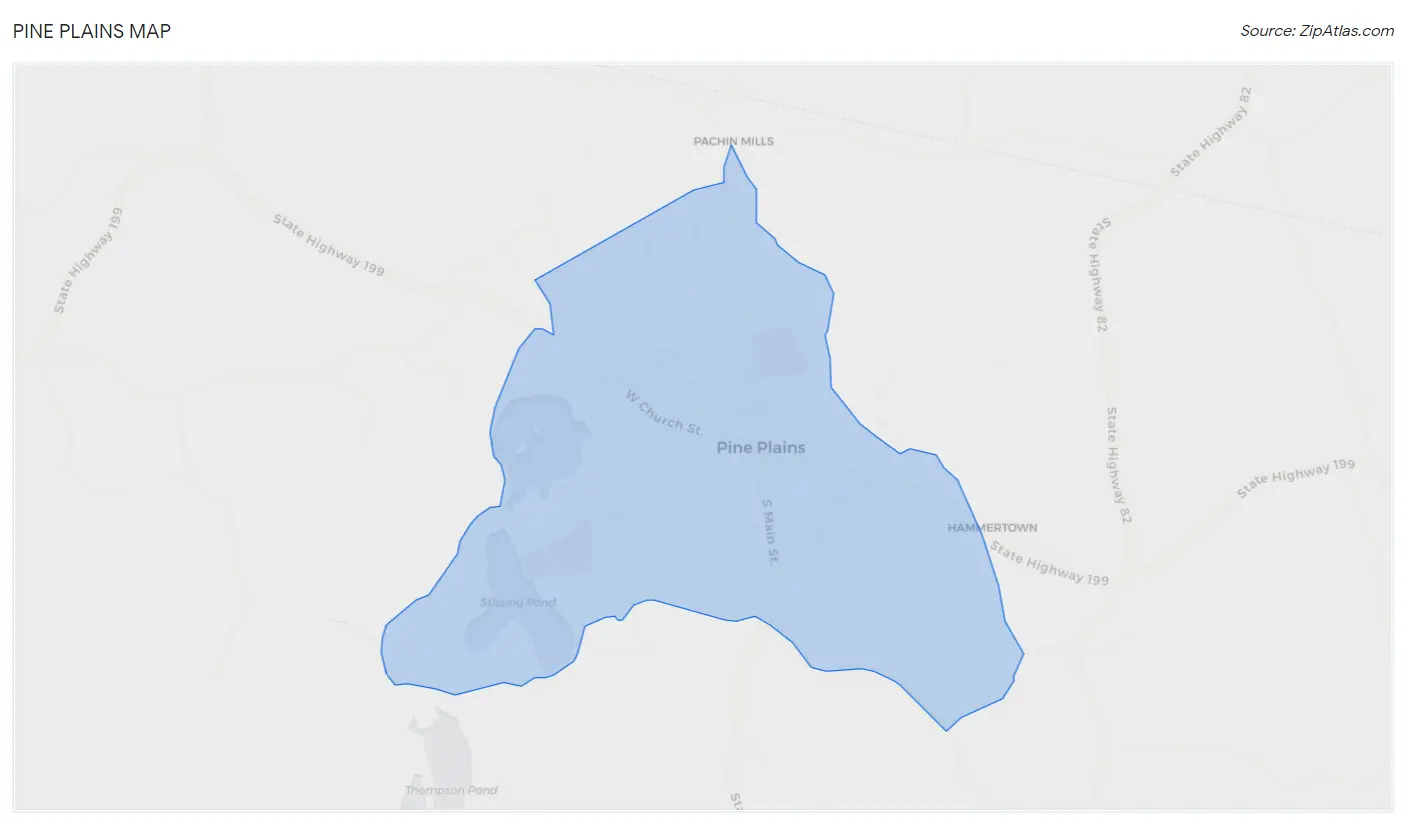
Pine Plains Overview
$38,254
PER CAPITA INCOME
$73,897
AVG FAMILY INCOME
$69,321
AVG HOUSEHOLD INCOME
7.7%
WAGE / INCOME GAP [ % ]
92.3¢/ $1
WAGE / INCOME GAP [ $ ]
0.44
INEQUALITY / GINI INDEX
994
TOTAL POPULATION
489
MALE POPULATION
505
FEMALE POPULATION
96.83
MALES / 100 FEMALES
103.27
FEMALES / 100 MALES
42.7
MEDIAN AGE
2.8
AVG FAMILY SIZE
2.4
AVG HOUSEHOLD SIZE
514
LABOR FORCE [ PEOPLE ]
61.8%
PERCENT IN LABOR FORCE
0.8%
UNEMPLOYMENT RATE
Pine Plains Zip Codes
Pine Plains Area Codes
Income in Pine Plains
Income Overview in Pine Plains
Per Capita Income in Pine Plains is $38,254, while median incomes of families and households are $73,897 and $69,321 respectively.
| Characteristic | Number | Measure |
| Per Capita Income | 994 | $38,254 |
| Median Family Income | 285 | $73,897 |
| Mean Family Income | 285 | $106,964 |
| Median Household Income | 417 | $69,321 |
| Mean Household Income | 417 | $90,083 |
| Income Deficit | 285 | $0 |
| Wage / Income Gap (%) | 994 | 7.68% |
| Wage / Income Gap ($) | 994 | 92.32¢ per $1 |
| Gini / Inequality Index | 994 | 0.44 |
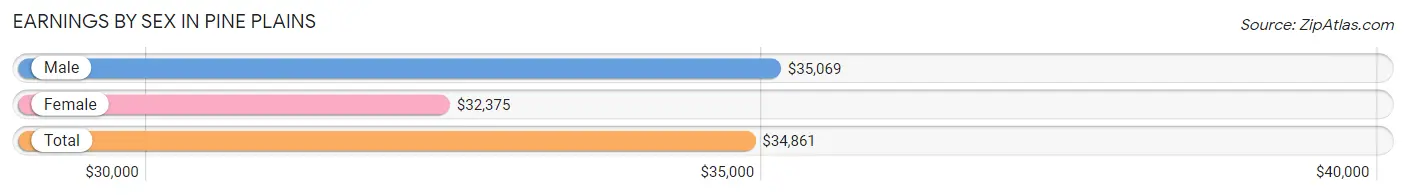
Earnings by Sex in Pine Plains
Average Earnings in Pine Plains are $34,861, $35,069 for men and $32,375 for women, a difference of 7.7%.
| Sex | Number | Average Earnings |
| Male | 351 (60.2%) | $35,069 |
| Female | 232 (39.8%) | $32,375 |
| Total | 583 (100.0%) | $34,861 |
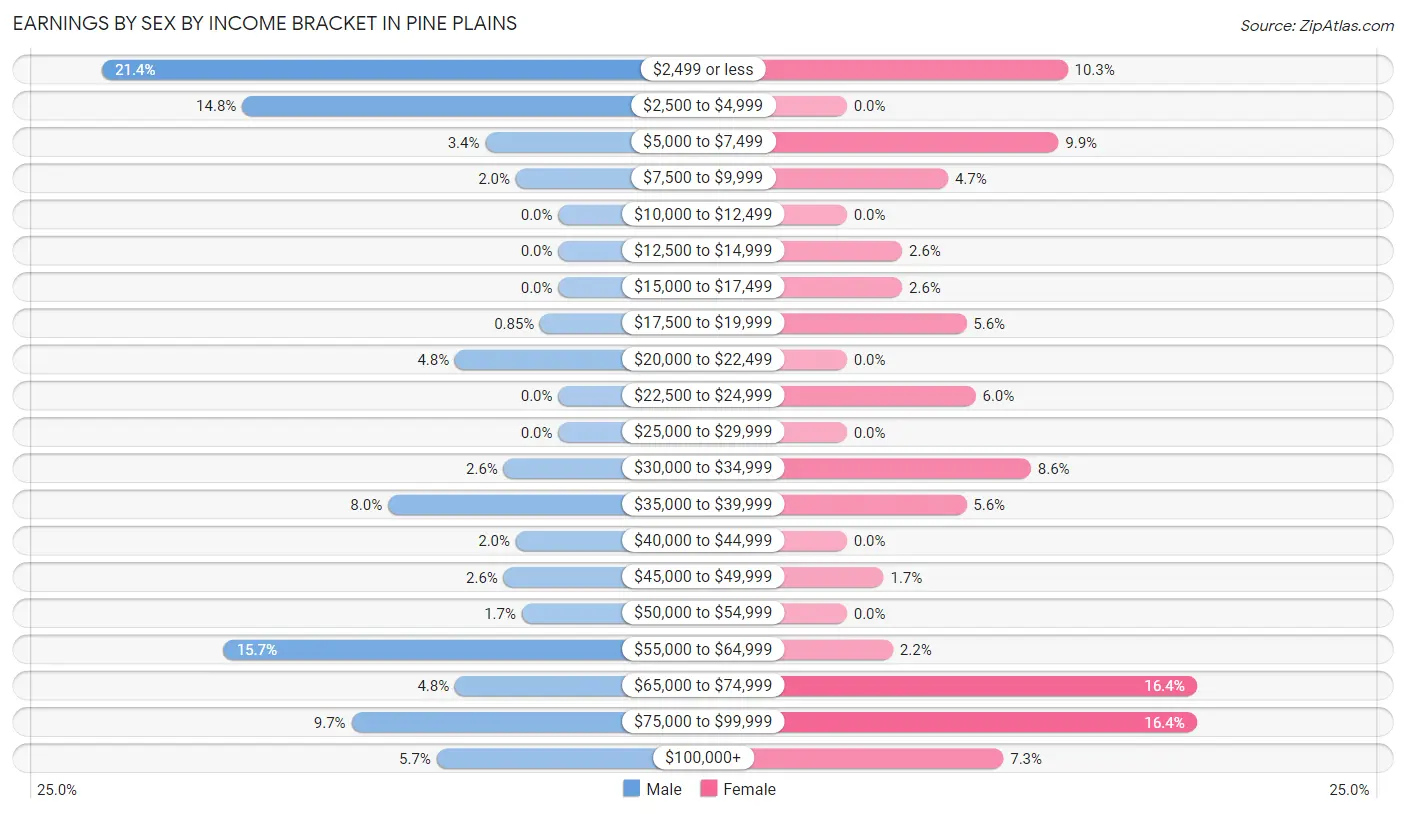
Earnings by Sex by Income Bracket in Pine Plains
The most common earnings brackets in Pine Plains are $2,499 or less for men (75 | 21.4%) and $65,000 to $74,999 for women (38 | 16.4%).
| Income | Male | Female |
| $2,499 or less | 75 (21.4%) | 24 (10.3%) |
| $2,500 to $4,999 | 52 (14.8%) | 0 (0.0%) |
| $5,000 to $7,499 | 12 (3.4%) | 23 (9.9%) |
| $7,500 to $9,999 | 7 (2.0%) | 11 (4.7%) |
| $10,000 to $12,499 | 0 (0.0%) | 0 (0.0%) |
| $12,500 to $14,999 | 0 (0.0%) | 6 (2.6%) |
| $15,000 to $17,499 | 0 (0.0%) | 6 (2.6%) |
| $17,500 to $19,999 | 3 (0.9%) | 13 (5.6%) |
| $20,000 to $22,499 | 17 (4.8%) | 0 (0.0%) |
| $22,500 to $24,999 | 0 (0.0%) | 14 (6.0%) |
| $25,000 to $29,999 | 0 (0.0%) | 0 (0.0%) |
| $30,000 to $34,999 | 9 (2.6%) | 20 (8.6%) |
| $35,000 to $39,999 | 28 (8.0%) | 13 (5.6%) |
| $40,000 to $44,999 | 7 (2.0%) | 0 (0.0%) |
| $45,000 to $49,999 | 9 (2.6%) | 4 (1.7%) |
| $50,000 to $54,999 | 6 (1.7%) | 0 (0.0%) |
| $55,000 to $64,999 | 55 (15.7%) | 5 (2.2%) |
| $65,000 to $74,999 | 17 (4.8%) | 38 (16.4%) |
| $75,000 to $99,999 | 34 (9.7%) | 38 (16.4%) |
| $100,000+ | 20 (5.7%) | 17 (7.3%) |
| Total | 351 (100.0%) | 232 (100.0%) |
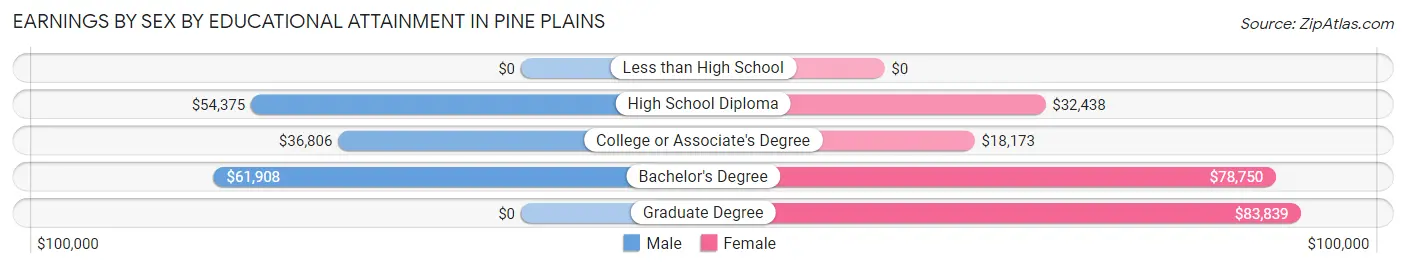
Earnings by Sex by Educational Attainment in Pine Plains
| Educational Attainment | Male Income | Female Income |
| Less than High School | - | - |
| High School Diploma | $54,375 | $32,438 |
| College or Associate's Degree | $36,806 | $18,173 |
| Bachelor's Degree | $61,908 | $78,750 |
| Graduate Degree | - | - |
| Total | $55,208 | $0 |
Family Income in Pine Plains
Family Income Brackets in Pine Plains
According to the Pine Plains family income data, there are 83 families falling into the $50,000 to $74,999 income range, which is the most common income bracket and makes up 29.1% of all families.
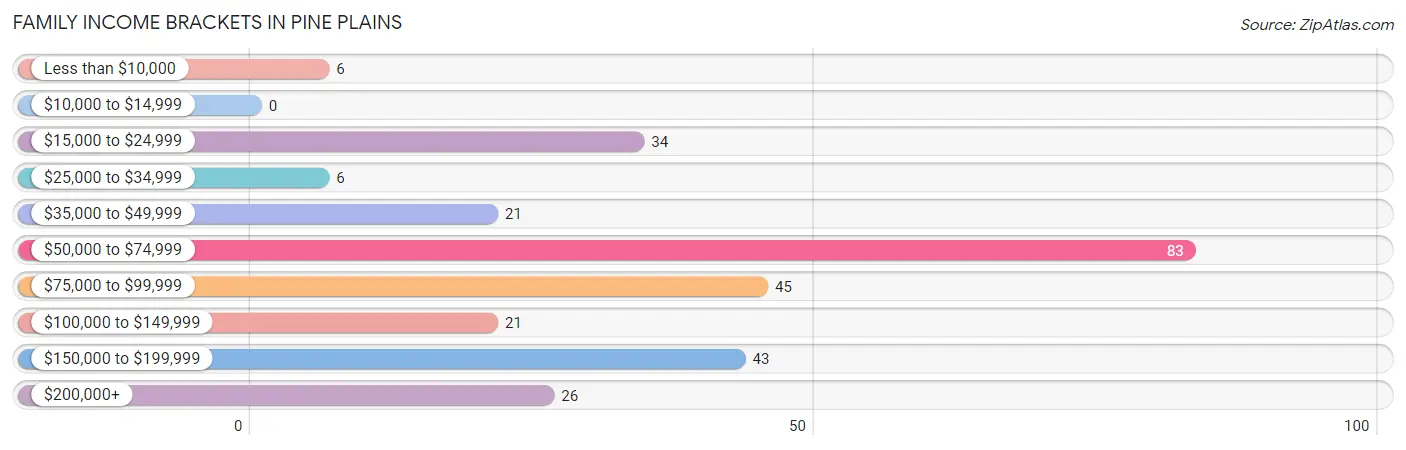
| Income Bracket | # Families | % Families |
| Less than $10,000 | 6 | 2.1% |
| $10,000 to $14,999 | 0 | 0.0% |
| $15,000 to $24,999 | 34 | 11.9% |
| $25,000 to $34,999 | 6 | 2.1% |
| $35,000 to $49,999 | 21 | 7.4% |
| $50,000 to $74,999 | 83 | 29.1% |
| $75,000 to $99,999 | 45 | 15.8% |
| $100,000 to $149,999 | 21 | 7.4% |
| $150,000 to $199,999 | 43 | 15.1% |
| $200,000+ | 26 | 9.1% |
Family Income by Famaliy Size in Pine Plains
4-person families (52 | 18.2%) account for the highest median family income in Pine Plains with $98,375 per family, while 2-person families (158 | 55.4%) have the highest median income of $32,500 per family member.
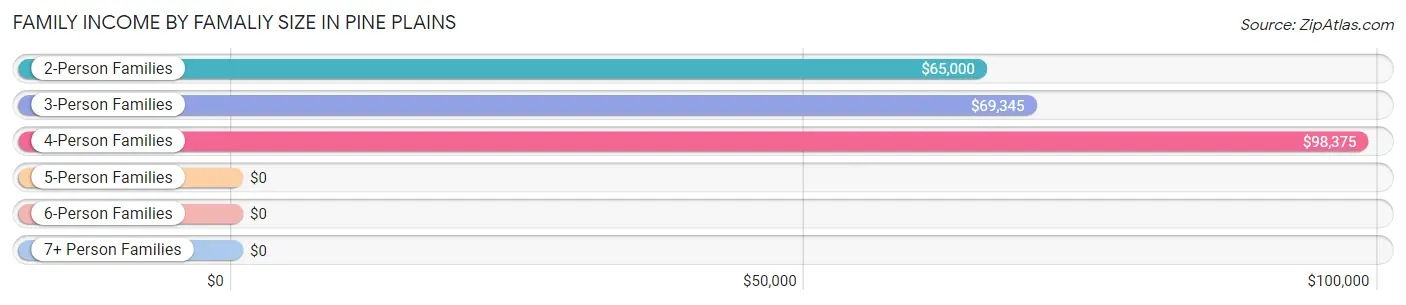
| Income Bracket | # Families | Median Income |
| 2-Person Families | 158 (55.4%) | $65,000 |
| 3-Person Families | 61 (21.4%) | $69,345 |
| 4-Person Families | 52 (18.2%) | $98,375 |
| 5-Person Families | 14 (4.9%) | $0 |
| 6-Person Families | 0 (0.0%) | $0 |
| 7+ Person Families | 0 (0.0%) | $0 |
| Total | 285 (100.0%) | $73,897 |
Family Income by Number of Earners in Pine Plains
The median family income in Pine Plains is $73,897, with families comprising 3+ earners (29) having the highest median family income of $177,656, while families with 2 earners (113) have the lowest median family income of $68,274, accounting for 10.2% and 39.7% of families, respectively.
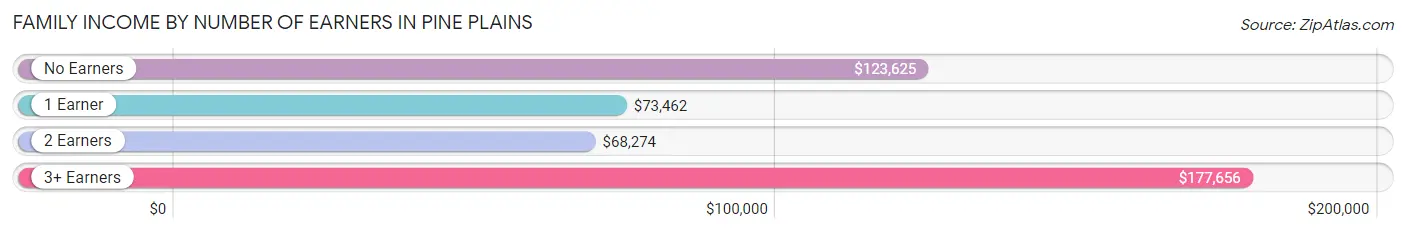
| Number of Earners | # Families | Median Income |
| No Earners | 31 (10.9%) | $123,625 |
| 1 Earner | 112 (39.3%) | $73,462 |
| 2 Earners | 113 (39.7%) | $68,274 |
| 3+ Earners | 29 (10.2%) | $177,656 |
| Total | 285 (100.0%) | $73,897 |
Household Income in Pine Plains
Household Income Brackets in Pine Plains
With 121 households falling in the category, the $50,000 to $74,999 income range is the most frequent in Pine Plains, accounting for 29.0% of all households.
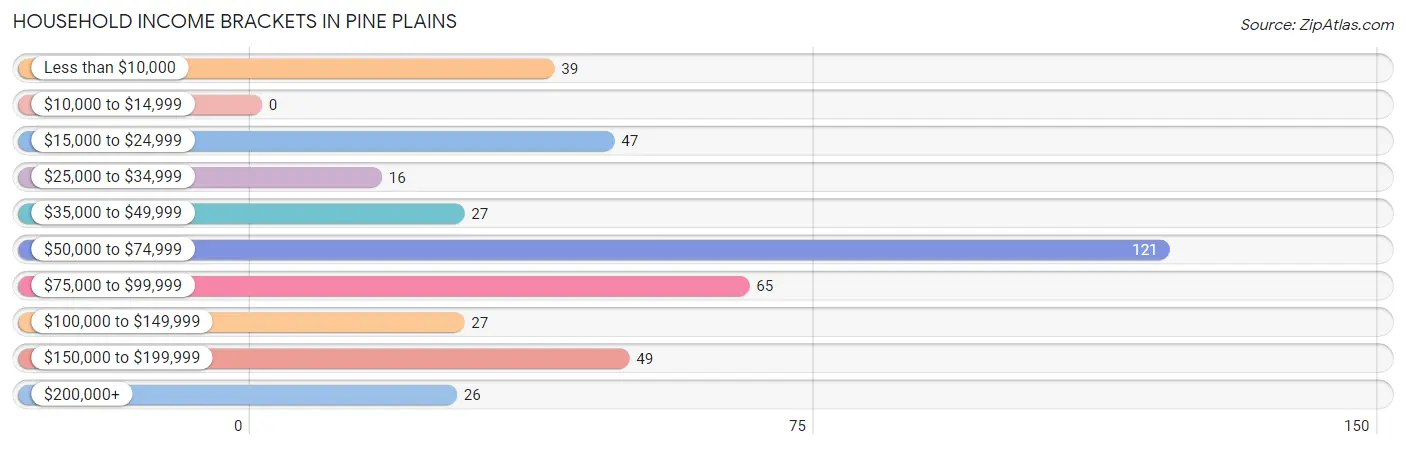
| Income Bracket | # Households | % Households |
| Less than $10,000 | 39 | 9.4% |
| $10,000 to $14,999 | 0 | 0.0% |
| $15,000 to $24,999 | 47 | 11.3% |
| $25,000 to $34,999 | 16 | 3.8% |
| $35,000 to $49,999 | 27 | 6.5% |
| $50,000 to $74,999 | 121 | 29.0% |
| $75,000 to $99,999 | 65 | 15.6% |
| $100,000 to $149,999 | 27 | 6.5% |
| $150,000 to $199,999 | 49 | 11.8% |
| $200,000+ | 26 | 6.2% |
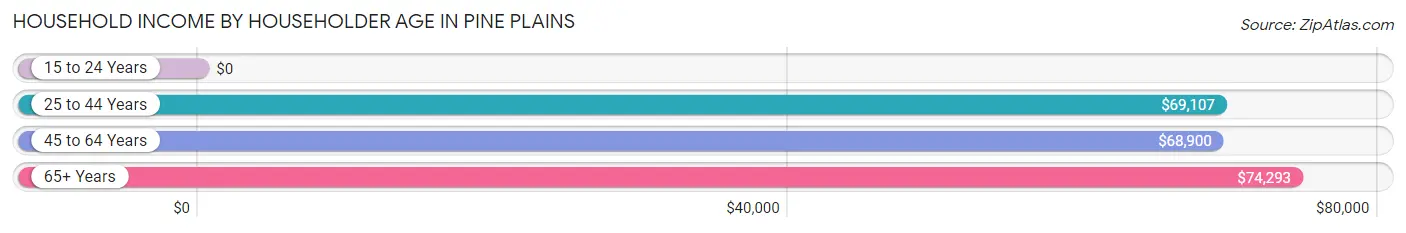
Household Income by Householder Age in Pine Plains
The median household income in Pine Plains is $69,321, with the highest median household income of $74,293 found in the 65+ years age bracket for the primary householder. A total of 109 households (26.1%) fall into this category. Meanwhile, the 15 to 24 years age bracket for the primary householder has the lowest median household income of $0, with 21 households (5.0%) in this group.
| Income Bracket | # Households | Median Income |
| 15 to 24 Years | 21 (5.0%) | $0 |
| 25 to 44 Years | 99 (23.7%) | $69,107 |
| 45 to 64 Years | 188 (45.1%) | $68,900 |
| 65+ Years | 109 (26.1%) | $74,293 |
| Total | 417 (100.0%) | $69,321 |
Poverty in Pine Plains
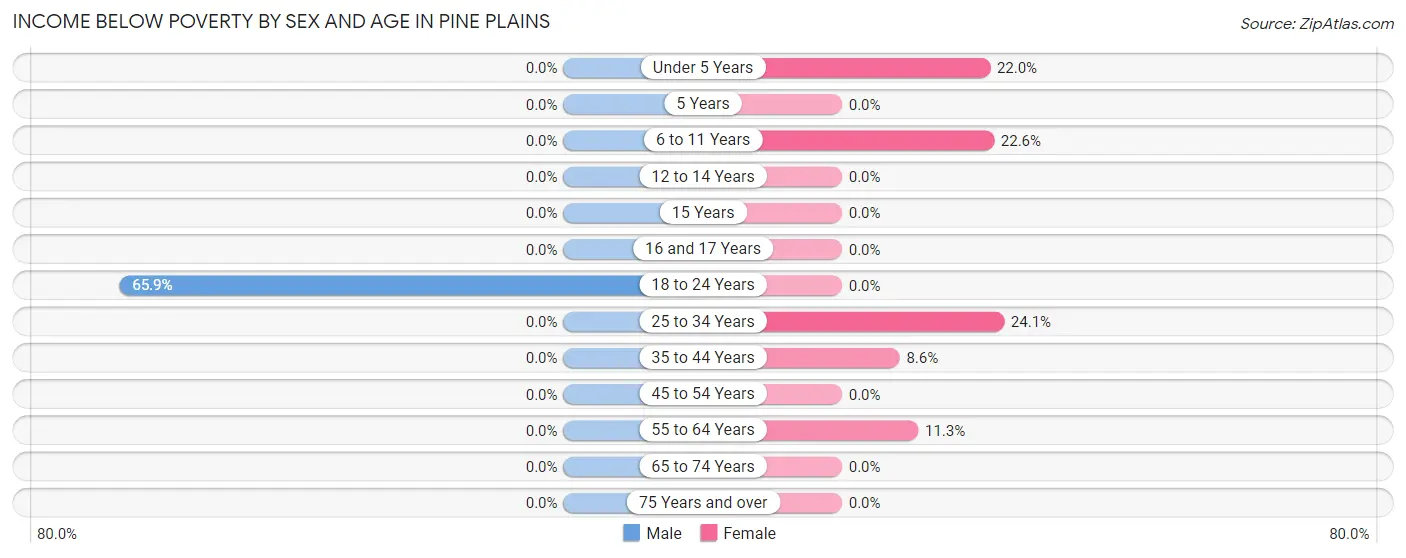
Income Below Poverty by Sex and Age in Pine Plains
With 12.3% poverty level for males and 9.7% for females among the residents of Pine Plains, 18 to 24 year old males and 25 to 34 year old females are the most vulnerable to poverty, with 60 males (65.9%) and 13 females (24.1%) in their respective age groups living below the poverty level.
| Age Bracket | Male | Female |
| Under 5 Years | 0 (0.0%) | 11 (22.0%) |
| 5 Years | 0 (0.0%) | 0 (0.0%) |
| 6 to 11 Years | 0 (0.0%) | 7 (22.6%) |
| 12 to 14 Years | 0 (0.0%) | 0 (0.0%) |
| 15 Years | 0 (0.0%) | 0 (0.0%) |
| 16 and 17 Years | 0 (0.0%) | 0 (0.0%) |
| 18 to 24 Years | 60 (65.9%) | 0 (0.0%) |
| 25 to 34 Years | 0 (0.0%) | 13 (24.1%) |
| 35 to 44 Years | 0 (0.0%) | 6 (8.6%) |
| 45 to 54 Years | 0 (0.0%) | 0 (0.0%) |
| 55 to 64 Years | 0 (0.0%) | 12 (11.3%) |
| 65 to 74 Years | 0 (0.0%) | 0 (0.0%) |
| 75 Years and over | 0 (0.0%) | 0 (0.0%) |
| Total | 60 (12.3%) | 49 (9.7%) |
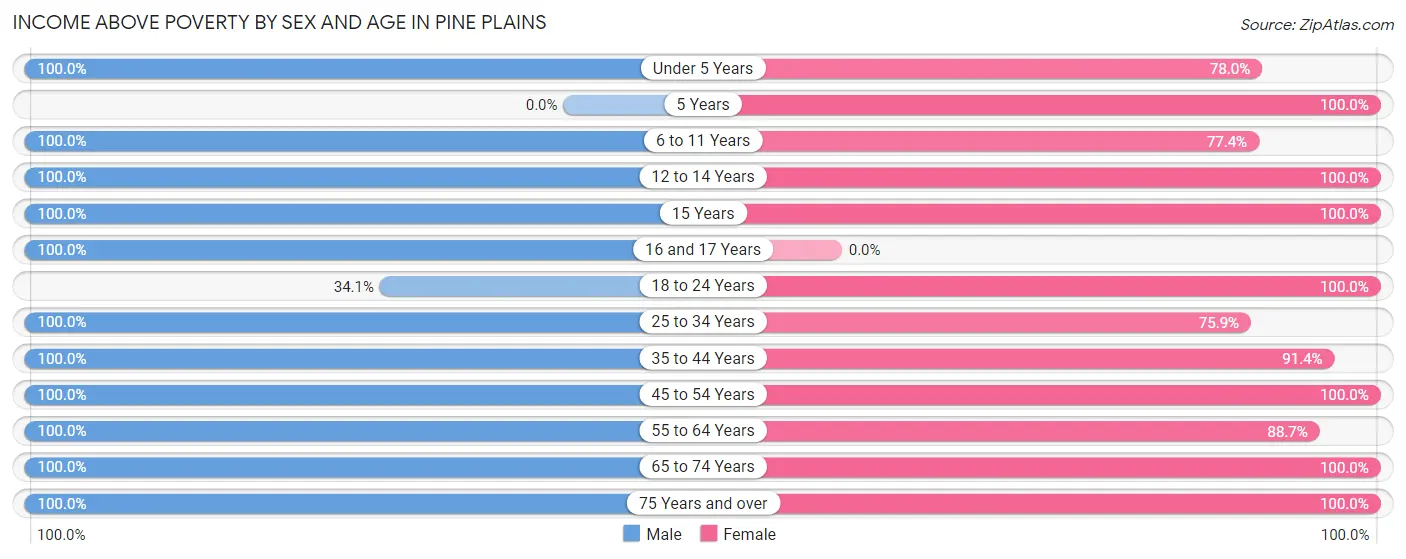
Income Above Poverty by Sex and Age in Pine Plains
According to the poverty statistics in Pine Plains, males aged under 5 years and females aged 5 years are the age groups that are most secure financially, with 100.0% of males and 100.0% of females in these age groups living above the poverty line.
| Age Bracket | Male | Female |
| Under 5 Years | 13 (100.0%) | 39 (78.0%) |
| 5 Years | 0 (0.0%) | 6 (100.0%) |
| 6 to 11 Years | 19 (100.0%) | 24 (77.4%) |
| 12 to 14 Years | 6 (100.0%) | 15 (100.0%) |
| 15 Years | 4 (100.0%) | 18 (100.0%) |
| 16 and 17 Years | 38 (100.0%) | 0 (0.0%) |
| 18 to 24 Years | 31 (34.1%) | 29 (100.0%) |
| 25 to 34 Years | 35 (100.0%) | 41 (75.9%) |
| 35 to 44 Years | 81 (100.0%) | 64 (91.4%) |
| 45 to 54 Years | 58 (100.0%) | 30 (100.0%) |
| 55 to 64 Years | 65 (100.0%) | 94 (88.7%) |
| 65 to 74 Years | 53 (100.0%) | 70 (100.0%) |
| 75 Years and over | 26 (100.0%) | 26 (100.0%) |
| Total | 429 (87.7%) | 456 (90.3%) |
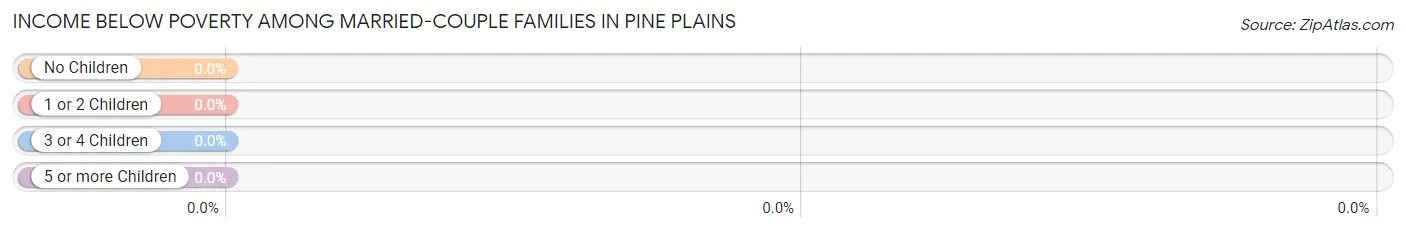
Income Below Poverty Among Married-Couple Families in Pine Plains
| Children | Above Poverty | Below Poverty |
| No Children | 104 (100.0%) | 0 (0.0%) |
| 1 or 2 Children | 48 (100.0%) | 0 (0.0%) |
| 3 or 4 Children | 14 (100.0%) | 0 (0.0%) |
| 5 or more Children | 0 (0.0%) | 0 (0.0%) |
| Total | 166 (100.0%) | 0 (0.0%) |
Income Below Poverty Among Single-Parent Households in Pine Plains
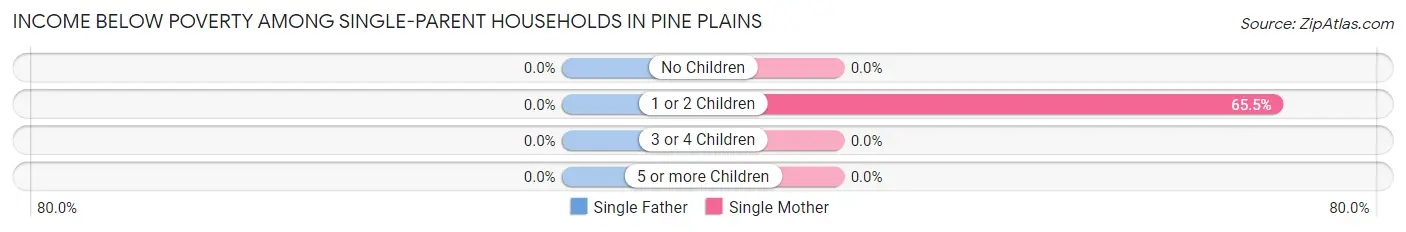
| Children | Single Father | Single Mother |
| No Children | 0 (0.0%) | 0 (0.0%) |
| 1 or 2 Children | 0 (0.0%) | 19 (65.5%) |
| 3 or 4 Children | 0 (0.0%) | 0 (0.0%) |
| 5 or more Children | 0 (0.0%) | 0 (0.0%) |
| Total | 0 (0.0%) | 19 (24.7%) |
Income Below Poverty Among Married-Couple vs Single-Parent Households in Pine Plains
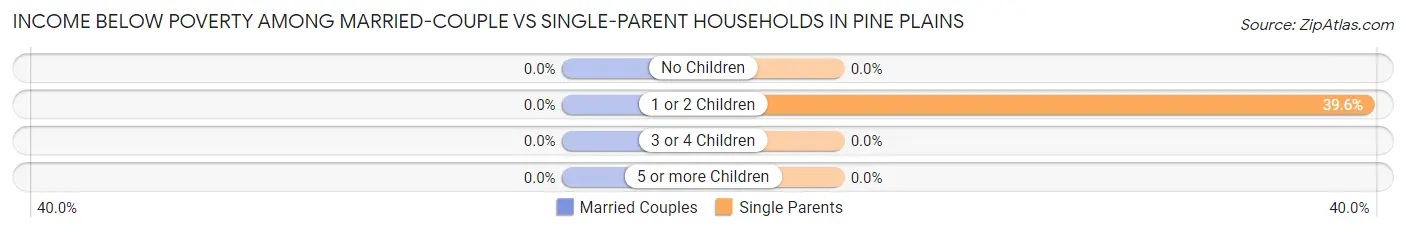
| Children | Married-Couple Families | Single-Parent Households |
| No Children | 0 (0.0%) | 0 (0.0%) |
| 1 or 2 Children | 0 (0.0%) | 19 (39.6%) |
| 3 or 4 Children | 0 (0.0%) | 0 (0.0%) |
| 5 or more Children | 0 (0.0%) | 0 (0.0%) |
| Total | 0 (0.0%) | 19 (16.0%) |
Race in Pine Plains
The most populous races in Pine Plains are White / Caucasian (821 | 82.6%), Hispanic or Latino (133 | 13.4%), and Two or more Races (110 | 11.1%).
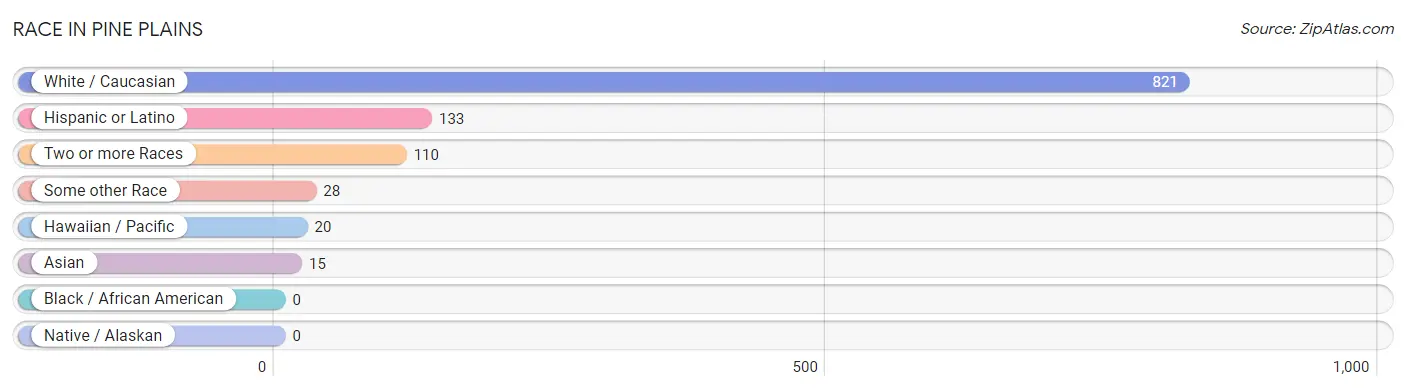
| Race | # Population | % Population |
| Asian | 15 | 1.5% |
| Black / African American | 0 | 0.0% |
| Hawaiian / Pacific | 20 | 2.0% |
| Hispanic or Latino | 133 | 13.4% |
| Native / Alaskan | 0 | 0.0% |
| White / Caucasian | 821 | 82.6% |
| Two or more Races | 110 | 11.1% |
| Some other Race | 28 | 2.8% |
| Total | 994 | 100.0% |
Ancestry in Pine Plains
The most populous ancestries reported in Pine Plains are Irish (267 | 26.9%), German (192 | 19.3%), American (96 | 9.7%), English (95 | 9.6%), and Italian (87 | 8.7%), together accounting for 74.2% of all Pine Plains residents.
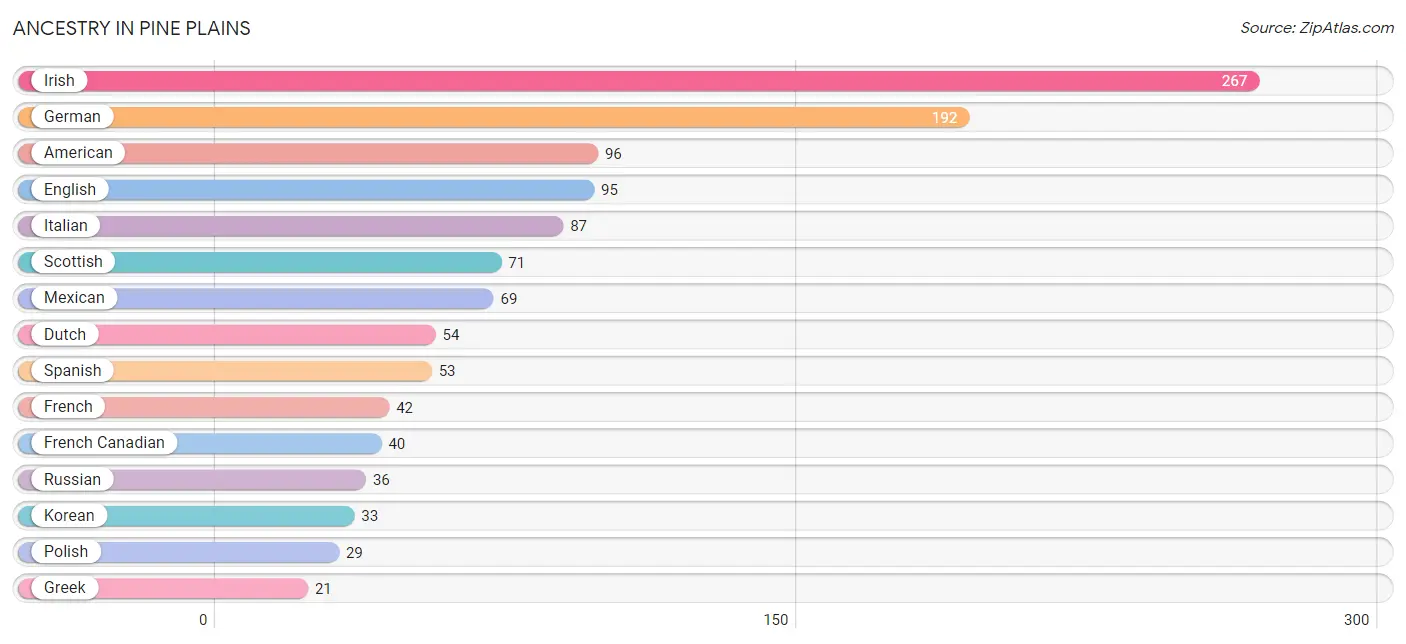
| Ancestry | # Population | % Population |
| American | 96 | 9.7% |
| Austrian | 4 | 0.4% |
| British | 12 | 1.2% |
| Central American Indian | 6 | 0.6% |
| Dutch | 54 | 5.4% |
| Eastern European | 5 | 0.5% |
| English | 95 | 9.6% |
| European | 11 | 1.1% |
| French | 42 | 4.2% |
| French Canadian | 40 | 4.0% |
| German | 192 | 19.3% |
| Greek | 21 | 2.1% |
| Hungarian | 4 | 0.4% |
| Irish | 267 | 26.9% |
| Iroquois | 4 | 0.4% |
| Italian | 87 | 8.7% |
| Korean | 33 | 3.3% |
| Mexican | 69 | 6.9% |
| Norwegian | 5 | 0.5% |
| Polish | 29 | 2.9% |
| Puerto Rican | 11 | 1.1% |
| Russian | 36 | 3.6% |
| Scottish | 71 | 7.1% |
| Spanish | 53 | 5.3% |
| Swedish | 4 | 0.4% |
| Swiss | 4 | 0.4% |
| Tongan | 20 | 2.0% |
| Welsh | 4 | 0.4% | View All 28 Rows |
Immigrants in Pine Plains
The most numerous immigrant groups reported in Pine Plains came from Central America (19 | 1.9%), Latin America (19 | 1.9%), Mexico (19 | 1.9%), Asia (15 | 1.5%), and Philippines (15 | 1.5%), together accounting for 8.7% of all Pine Plains residents.
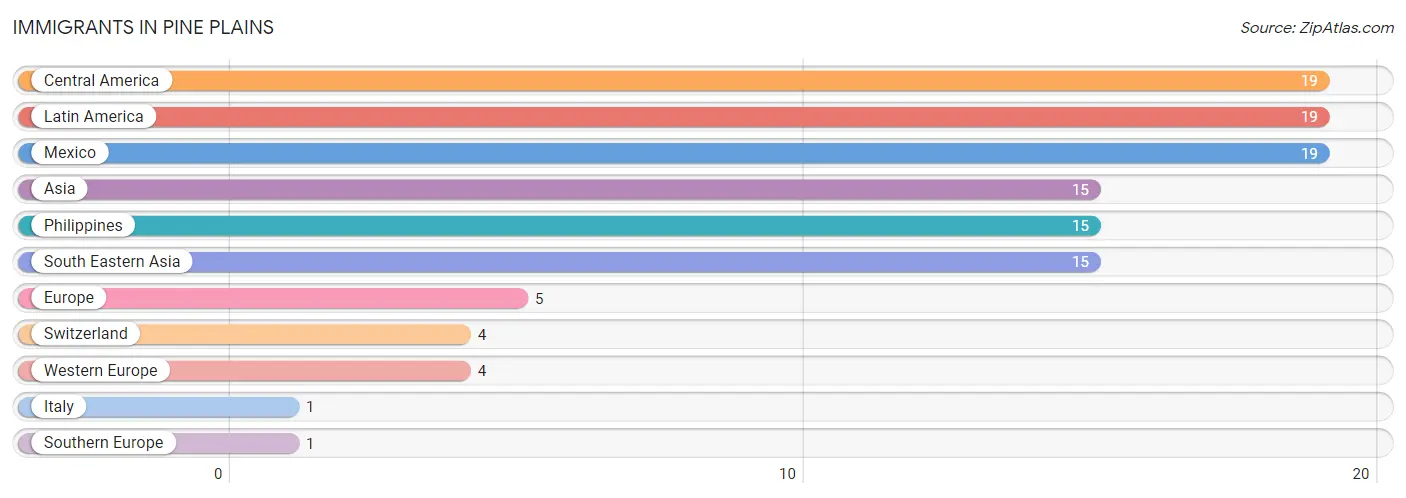
| Immigration Origin | # Population | % Population |
| Asia | 15 | 1.5% |
| Central America | 19 | 1.9% |
| Europe | 5 | 0.5% |
| Italy | 1 | 0.1% |
| Latin America | 19 | 1.9% |
| Mexico | 19 | 1.9% |
| Philippines | 15 | 1.5% |
| South Eastern Asia | 15 | 1.5% |
| Southern Europe | 1 | 0.1% |
| Switzerland | 4 | 0.4% |
| Western Europe | 4 | 0.4% | View All 11 Rows |
Sex and Age in Pine Plains
Sex and Age in Pine Plains
The most populous age groups in Pine Plains are 15 to 19 Years (110 | 22.5%) for men and 60 to 64 Years (61 | 12.1%) for women.
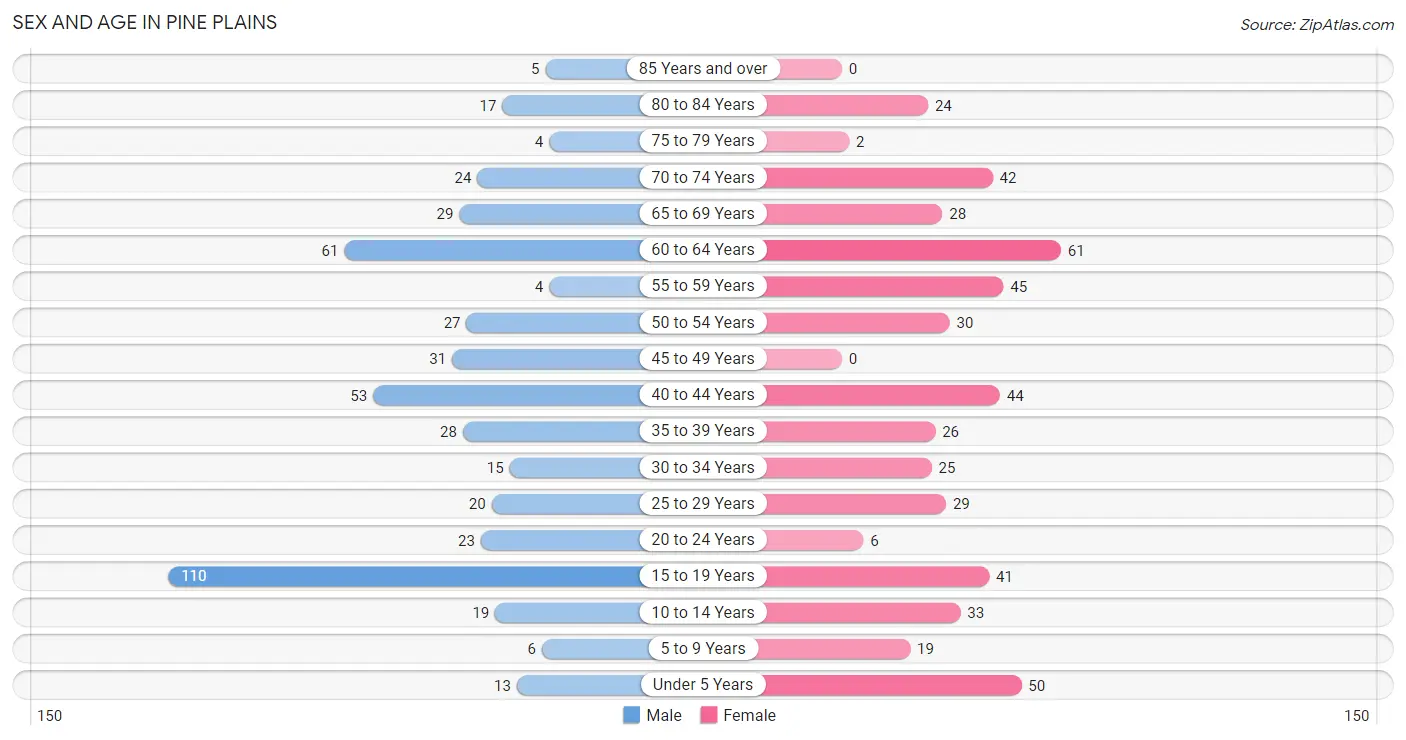
| Age Bracket | Male | Female |
| Under 5 Years | 13 (2.7%) | 50 (9.9%) |
| 5 to 9 Years | 6 (1.2%) | 19 (3.8%) |
| 10 to 14 Years | 19 (3.9%) | 33 (6.5%) |
| 15 to 19 Years | 110 (22.5%) | 41 (8.1%) |
| 20 to 24 Years | 23 (4.7%) | 6 (1.2%) |
| 25 to 29 Years | 20 (4.1%) | 29 (5.7%) |
| 30 to 34 Years | 15 (3.1%) | 25 (5.0%) |
| 35 to 39 Years | 28 (5.7%) | 26 (5.1%) |
| 40 to 44 Years | 53 (10.8%) | 44 (8.7%) |
| 45 to 49 Years | 31 (6.3%) | 0 (0.0%) |
| 50 to 54 Years | 27 (5.5%) | 30 (5.9%) |
| 55 to 59 Years | 4 (0.8%) | 45 (8.9%) |
| 60 to 64 Years | 61 (12.5%) | 61 (12.1%) |
| 65 to 69 Years | 29 (5.9%) | 28 (5.5%) |
| 70 to 74 Years | 24 (4.9%) | 42 (8.3%) |
| 75 to 79 Years | 4 (0.8%) | 2 (0.4%) |
| 80 to 84 Years | 17 (3.5%) | 24 (4.8%) |
| 85 Years and over | 5 (1.0%) | 0 (0.0%) |
| Total | 489 (100.0%) | 505 (100.0%) |
Families and Households in Pine Plains
Median Family Size in Pine Plains
The median family size in Pine Plains is 2.83 persons per family, with single female/mother families (77 | 27.0%) accounting for the largest median family size of 3.01 persons per family. On the other hand, single male/father families (42 | 14.7%) represent the smallest median family size with 1.93 persons per family.
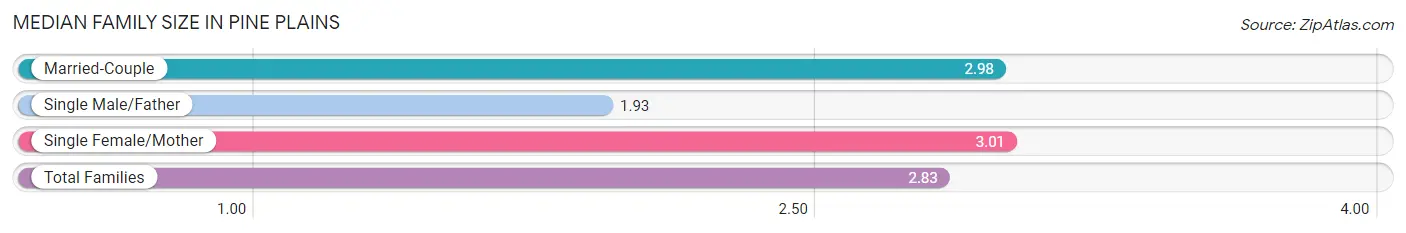
| Family Type | # Families | Family Size |
| Married-Couple | 166 (58.3%) | 2.98 |
| Single Male/Father | 42 (14.7%) | 1.93 |
| Single Female/Mother | 77 (27.0%) | 3.01 |
| Total Families | 285 (100.0%) | 2.83 |
Median Household Size in Pine Plains
The median household size in Pine Plains is 2.38 persons per household, with single female/mother households (77 | 18.5%) accounting for the largest median household size of 3.09 persons per household. non-family households (132 | 31.7%) represent the smallest median household size with 1.30 persons per household.
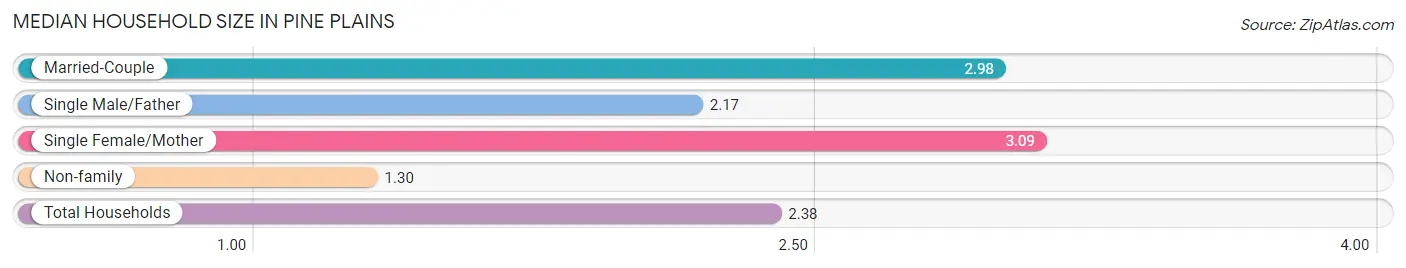
| Household Type | # Households | Household Size |
| Married-Couple | 166 (39.8%) | 2.98 |
| Single Male/Father | 42 (10.1%) | 2.17 |
| Single Female/Mother | 77 (18.5%) | 3.09 |
| Non-family | 132 (31.7%) | 1.30 |
| Total Households | 417 (100.0%) | 2.38 |
Household Size by Marriage Status in Pine Plains
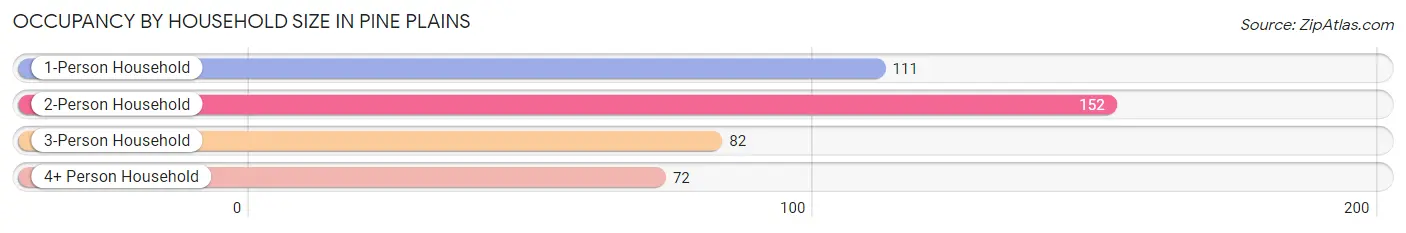
Out of a total of 417 households in Pine Plains, 285 (68.3%) are family households, while 132 (31.7%) are nonfamily households. The most numerous type of family households are 2-person households, comprising 152, and the most common type of nonfamily households are 1-person households, comprising 111.
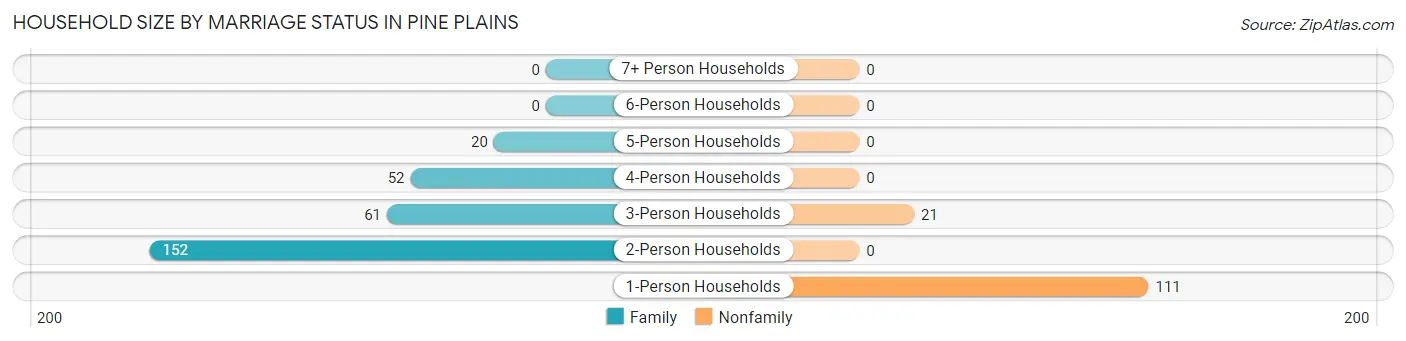
| Household Size | Family Households | Nonfamily Households |
| 1-Person Households | - | 111 (26.6%) |
| 2-Person Households | 152 (36.4%) | 0 (0.0%) |
| 3-Person Households | 61 (14.6%) | 21 (5.0%) |
| 4-Person Households | 52 (12.5%) | 0 (0.0%) |
| 5-Person Households | 20 (4.8%) | 0 (0.0%) |
| 6-Person Households | 0 (0.0%) | 0 (0.0%) |
| 7+ Person Households | 0 (0.0%) | 0 (0.0%) |
| Total | 285 (68.3%) | 132 (31.7%) |
Female Fertility in Pine Plains
Fertility by Age in Pine Plains
Average fertility rate in Pine Plains is 155.0 births per 1,000 women. Women in the age bracket of 20 to 34 years have the highest fertility rate with 217.0 births per 1,000 women. Women in the age bracket of 35 to 50 years acount for 53.6% of all women with births.
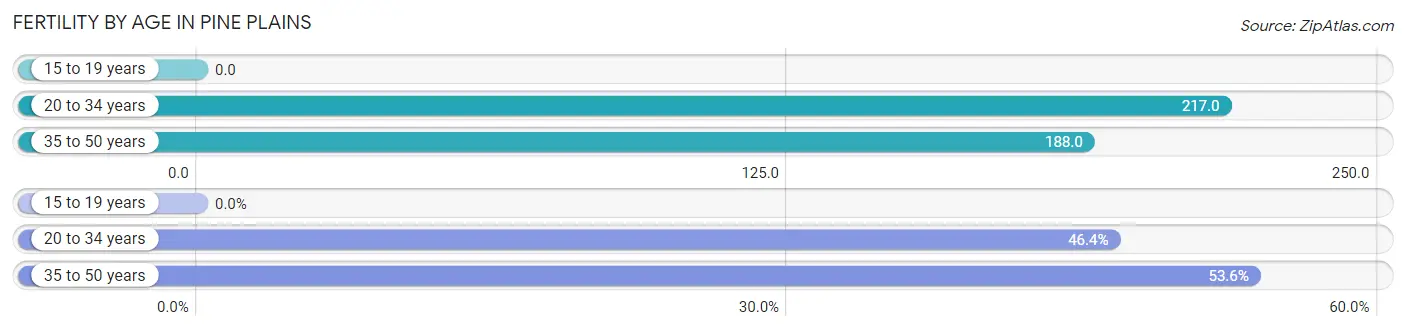
| Age Bracket | Women with Births | Births / 1,000 Women |
| 15 to 19 years | 0 (0.0%) | 0.0 |
| 20 to 34 years | 13 (46.4%) | 217.0 |
| 35 to 50 years | 15 (53.6%) | 188.0 |
| Total | 28 (100.0%) | 155.0 |
Fertility by Age by Marriage Status in Pine Plains
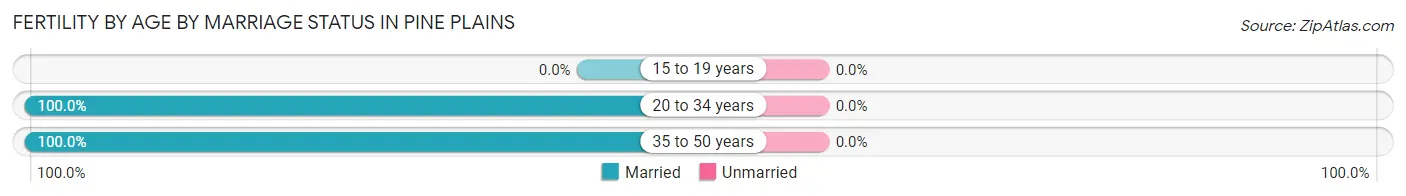
| Age Bracket | Married | Unmarried |
| 15 to 19 years | 0 (0.0%) | 0 (0.0%) |
| 20 to 34 years | 13 (100.0%) | 0 (0.0%) |
| 35 to 50 years | 15 (100.0%) | 0 (0.0%) |
| Total | 28 (100.0%) | 0 (0.0%) |
Fertility by Education in Pine Plains
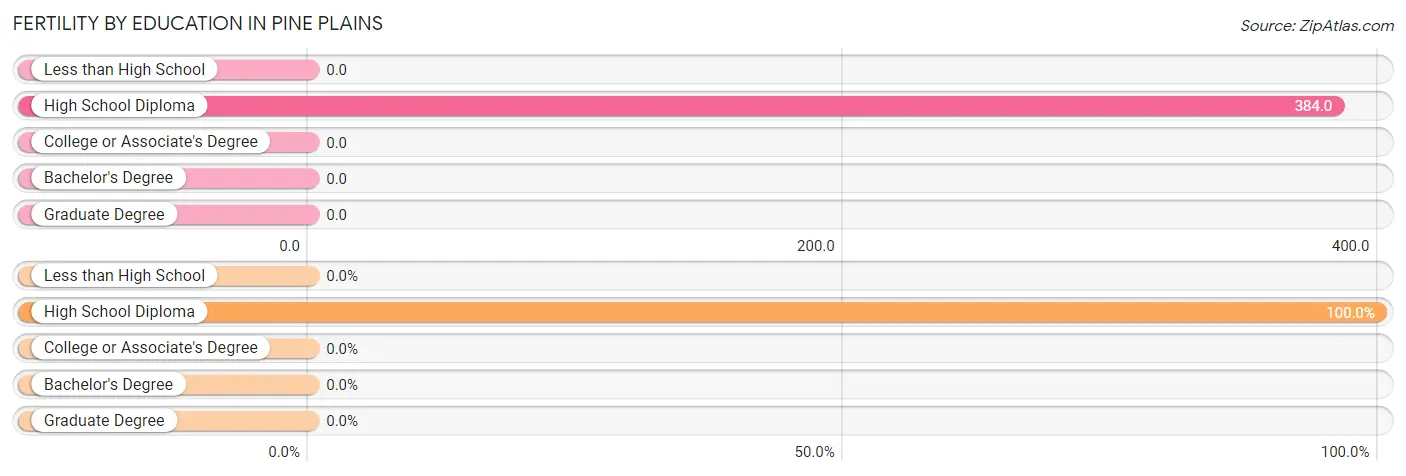
| Educational Attainment | Women with Births | Births / 1,000 Women |
| Less than High School | 0 (0.0%) | 0.0 |
| High School Diploma | 28 (100.0%) | 384.0 |
| College or Associate's Degree | 0 (0.0%) | 0.0 |
| Bachelor's Degree | 0 (0.0%) | 0.0 |
| Graduate Degree | 0 (0.0%) | 0.0 |
| Total | 28 (100.0%) | 155.0 |
Fertility by Education by Marriage Status in Pine Plains
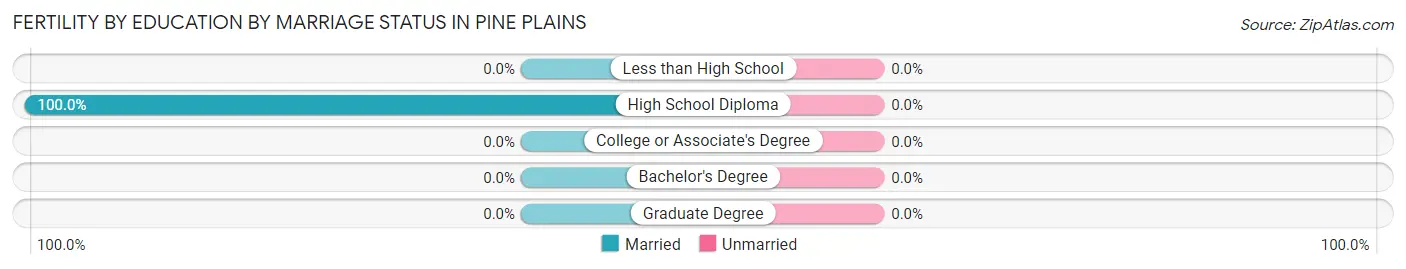
| Educational Attainment | Married | Unmarried |
| Less than High School | 0 (0.0%) | 0 (0.0%) |
| High School Diploma | 28 (100.0%) | 0 (0.0%) |
| College or Associate's Degree | 0 (0.0%) | 0 (0.0%) |
| Bachelor's Degree | 0 (0.0%) | 0 (0.0%) |
| Graduate Degree | 0 (0.0%) | 0 (0.0%) |
| Total | 28 (100.0%) | 0 (0.0%) |
Employment Characteristics in Pine Plains
Employment by Class of Employer in Pine Plains
Among the 487 employed individuals in Pine Plains, private company employees (289 | 59.3%), local government employees (63 | 12.9%), and not-for-profit organizations (45 | 9.2%) make up the most common classes of employment.
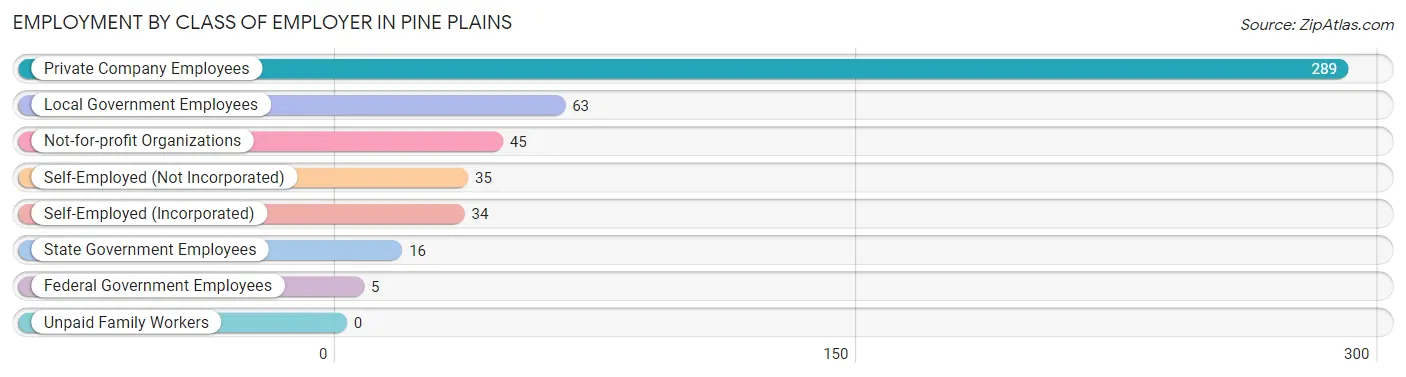
| Employer Class | # Employees | % Employees |
| Private Company Employees | 289 | 59.3% |
| Self-Employed (Incorporated) | 34 | 7.0% |
| Self-Employed (Not Incorporated) | 35 | 7.2% |
| Not-for-profit Organizations | 45 | 9.2% |
| Local Government Employees | 63 | 12.9% |
| State Government Employees | 16 | 3.3% |
| Federal Government Employees | 5 | 1.0% |
| Unpaid Family Workers | 0 | 0.0% |
| Total | 487 | 100.0% |
Employment Status by Age in Pine Plains
According to the labor force statistics for Pine Plains, out of the total population over 16 years of age (832), 61.8% or 514 individuals are in the labor force, with 0.8% or 4 of them unemployed. The age group with the highest labor force participation rate is 30 to 34 years, with 100.0% or 40 individuals in the labor force. Within the labor force, the 75 years and over age range has the highest percentage of unemployed individuals, with 100.0% or 4 of them being unemployed.
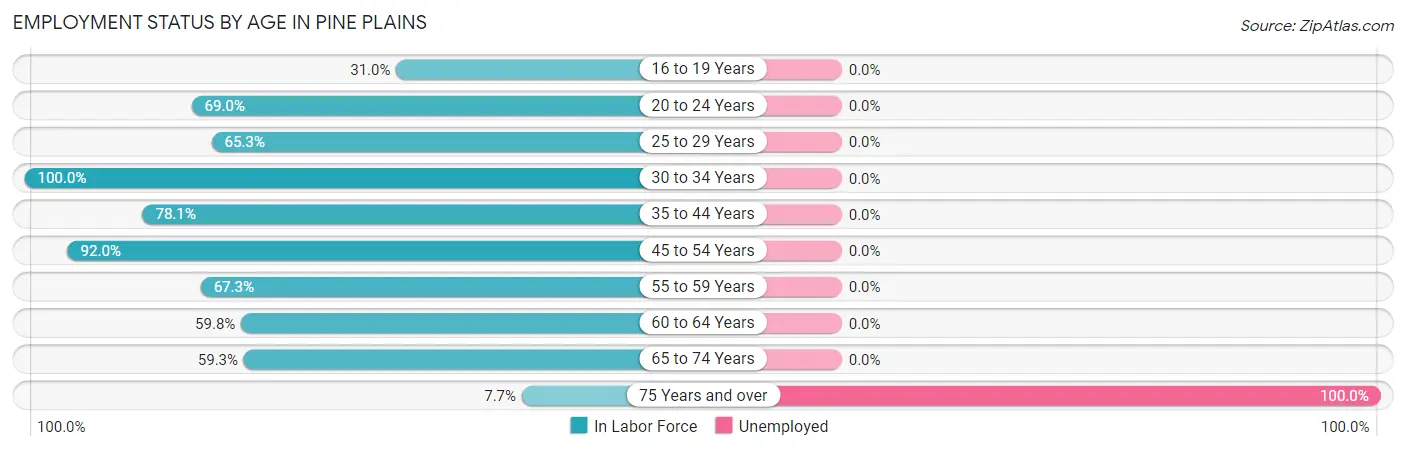
| Age Bracket | In Labor Force | Unemployed |
| 16 to 19 Years | 40 (31.0%) | 0 (0.0%) |
| 20 to 24 Years | 20 (69.0%) | 0 (0.0%) |
| 25 to 29 Years | 32 (65.3%) | 0 (0.0%) |
| 30 to 34 Years | 40 (100.0%) | 0 (0.0%) |
| 35 to 44 Years | 118 (78.1%) | 0 (0.0%) |
| 45 to 54 Years | 81 (92.0%) | 0 (0.0%) |
| 55 to 59 Years | 33 (67.3%) | 0 (0.0%) |
| 60 to 64 Years | 73 (59.8%) | 0 (0.0%) |
| 65 to 74 Years | 73 (59.3%) | 0 (0.0%) |
| 75 Years and over | 4 (7.7%) | 4 (100.0%) |
| Total | 514 (61.8%) | 4 (0.8%) |
Employment Status by Educational Attainment in Pine Plains
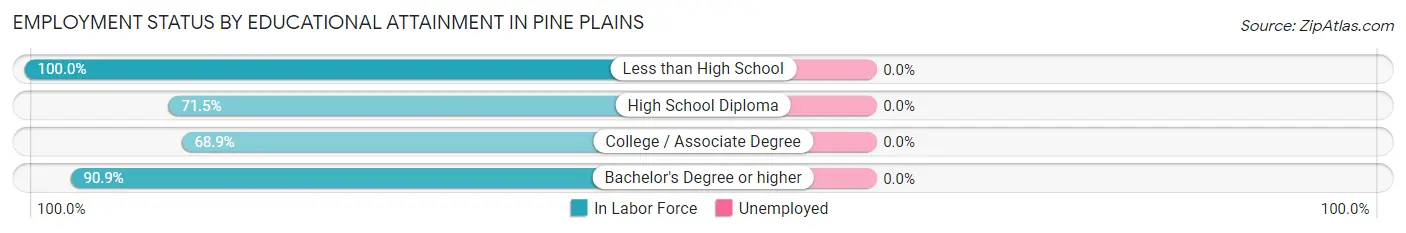
| Educational Attainment | In Labor Force | Unemployed |
| Less than High School | 10 (100.0%) | 0 (0.0%) |
| High School Diploma | 163 (71.5%) | 0 (0.0%) |
| College / Associate Degree | 104 (68.9%) | 0 (0.0%) |
| Bachelor's Degree or higher | 100 (90.9%) | 0 (0.0%) |
| Total | 377 (75.6%) | 0 (0.0%) |
Employment Occupations by Sex in Pine Plains
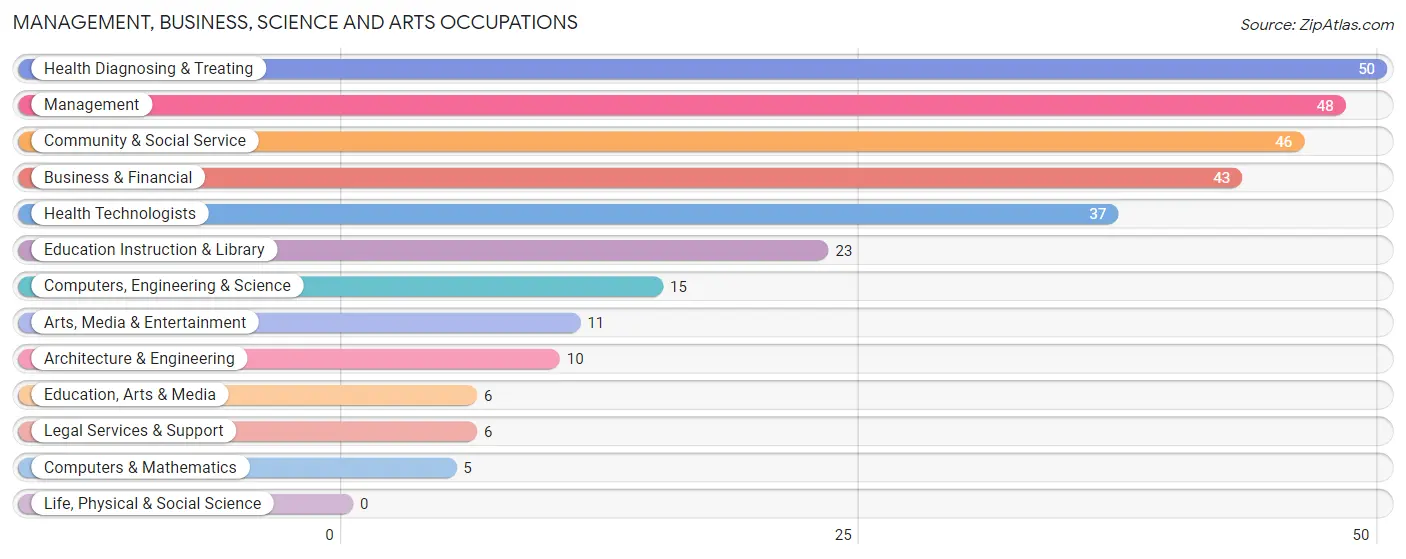
Management, Business, Science and Arts Occupations
The most common Management, Business, Science and Arts occupations in Pine Plains are Health Diagnosing & Treating (50 | 9.8%), Management (48 | 9.4%), Community & Social Service (46 | 9.0%), Business & Financial (43 | 8.4%), and Health Technologists (37 | 7.2%).
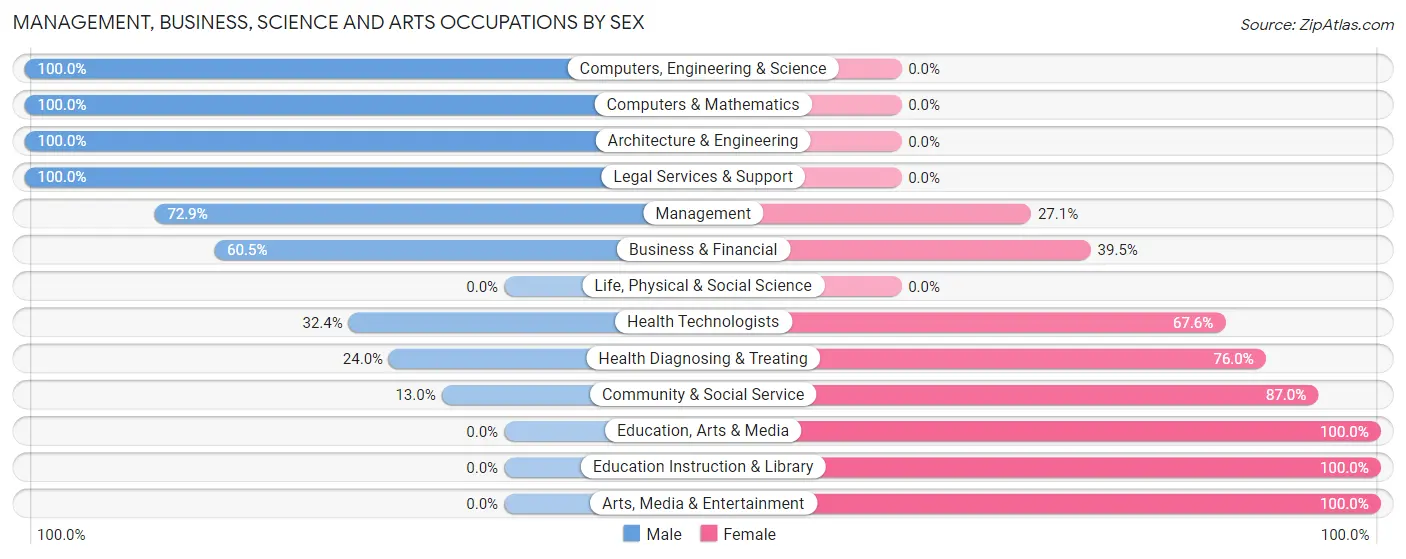
Management, Business, Science and Arts Occupations by Sex
Within the Management, Business, Science and Arts occupations in Pine Plains, the most male-oriented occupations are Computers, Engineering & Science (100.0%), Computers & Mathematics (100.0%), and Architecture & Engineering (100.0%), while the most female-oriented occupations are Education, Arts & Media (100.0%), Education Instruction & Library (100.0%), and Arts, Media & Entertainment (100.0%).
| Occupation | Male | Female |
| Management | 35 (72.9%) | 13 (27.1%) |
| Business & Financial | 26 (60.5%) | 17 (39.5%) |
| Computers, Engineering & Science | 15 (100.0%) | 0 (0.0%) |
| Computers & Mathematics | 5 (100.0%) | 0 (0.0%) |
| Architecture & Engineering | 10 (100.0%) | 0 (0.0%) |
| Life, Physical & Social Science | 0 (0.0%) | 0 (0.0%) |
| Community & Social Service | 6 (13.0%) | 40 (87.0%) |
| Education, Arts & Media | 0 (0.0%) | 6 (100.0%) |
| Legal Services & Support | 6 (100.0%) | 0 (0.0%) |
| Education Instruction & Library | 0 (0.0%) | 23 (100.0%) |
| Arts, Media & Entertainment | 0 (0.0%) | 11 (100.0%) |
| Health Diagnosing & Treating | 12 (24.0%) | 38 (76.0%) |
| Health Technologists | 12 (32.4%) | 25 (67.6%) |
| Total (Category) | 94 (46.5%) | 108 (53.5%) |
| Total (Overall) | 288 (56.5%) | 222 (43.5%) |
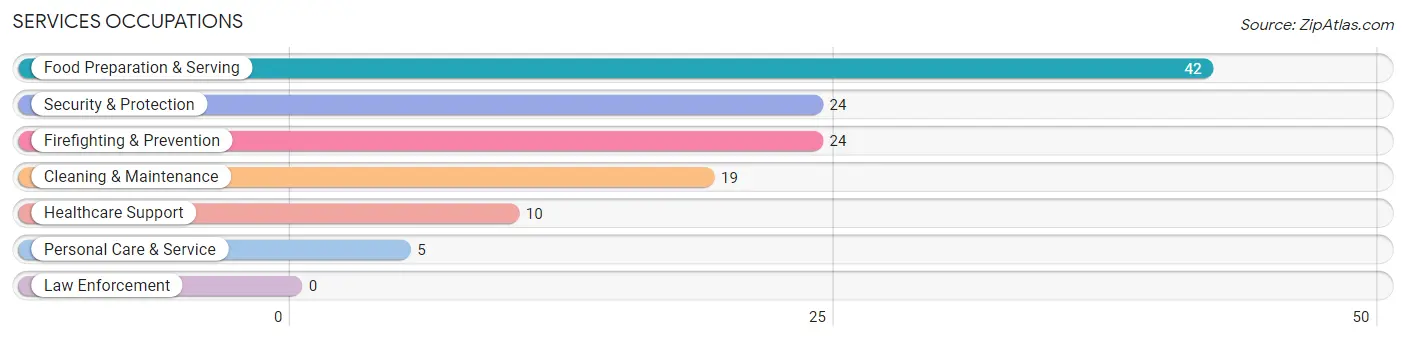
Services Occupations
The most common Services occupations in Pine Plains are Food Preparation & Serving (42 | 8.2%), Security & Protection (24 | 4.7%), Firefighting & Prevention (24 | 4.7%), Cleaning & Maintenance (19 | 3.7%), and Healthcare Support (10 | 2.0%).
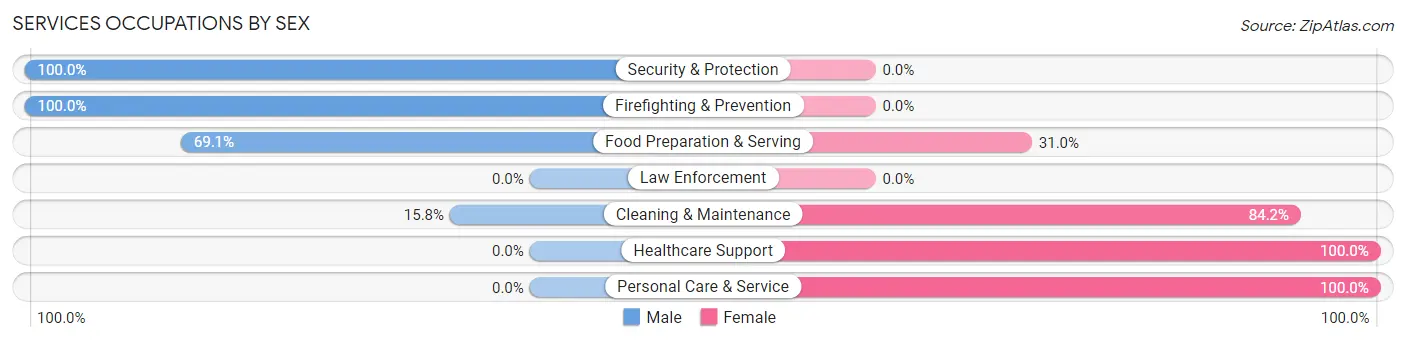
Services Occupations by Sex
Within the Services occupations in Pine Plains, the most male-oriented occupations are Security & Protection (100.0%), Firefighting & Prevention (100.0%), and Food Preparation & Serving (69.1%), while the most female-oriented occupations are Healthcare Support (100.0%), Personal Care & Service (100.0%), and Cleaning & Maintenance (84.2%).
| Occupation | Male | Female |
| Healthcare Support | 0 (0.0%) | 10 (100.0%) |
| Security & Protection | 24 (100.0%) | 0 (0.0%) |
| Firefighting & Prevention | 24 (100.0%) | 0 (0.0%) |
| Law Enforcement | 0 (0.0%) | 0 (0.0%) |
| Food Preparation & Serving | 29 (69.1%) | 13 (30.9%) |
| Cleaning & Maintenance | 3 (15.8%) | 16 (84.2%) |
| Personal Care & Service | 0 (0.0%) | 5 (100.0%) |
| Total (Category) | 56 (56.0%) | 44 (44.0%) |
| Total (Overall) | 288 (56.5%) | 222 (43.5%) |
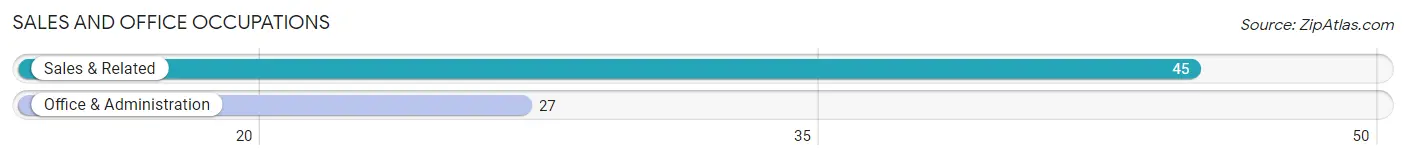
Sales and Office Occupations
The most common Sales and Office occupations in Pine Plains are Sales & Related (45 | 8.8%), and Office & Administration (27 | 5.3%).
Sales and Office Occupations by Sex
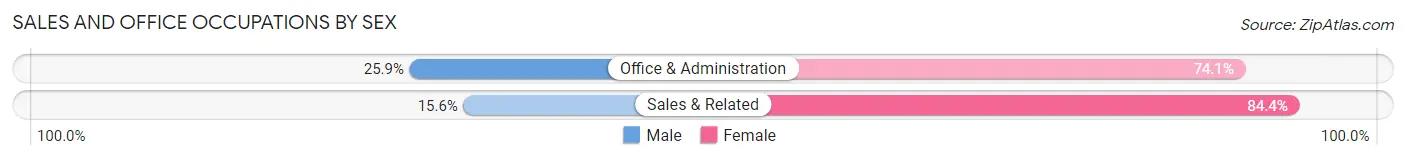
| Occupation | Male | Female |
| Sales & Related | 7 (15.6%) | 38 (84.4%) |
| Office & Administration | 7 (25.9%) | 20 (74.1%) |
| Total (Category) | 14 (19.4%) | 58 (80.6%) |
| Total (Overall) | 288 (56.5%) | 222 (43.5%) |
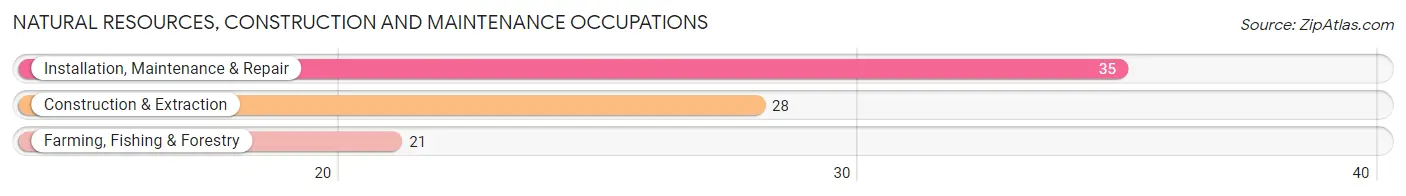
Natural Resources, Construction and Maintenance Occupations
The most common Natural Resources, Construction and Maintenance occupations in Pine Plains are Installation, Maintenance & Repair (35 | 6.9%), Construction & Extraction (28 | 5.5%), and Farming, Fishing & Forestry (21 | 4.1%).
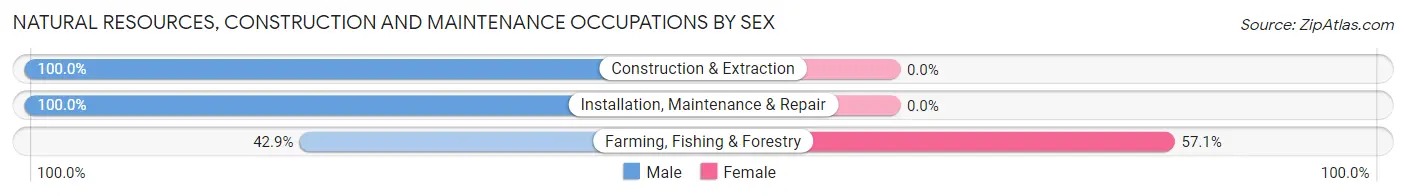
Natural Resources, Construction and Maintenance Occupations by Sex
| Occupation | Male | Female |
| Farming, Fishing & Forestry | 9 (42.9%) | 12 (57.1%) |
| Construction & Extraction | 28 (100.0%) | 0 (0.0%) |
| Installation, Maintenance & Repair | 35 (100.0%) | 0 (0.0%) |
| Total (Category) | 72 (85.7%) | 12 (14.3%) |
| Total (Overall) | 288 (56.5%) | 222 (43.5%) |
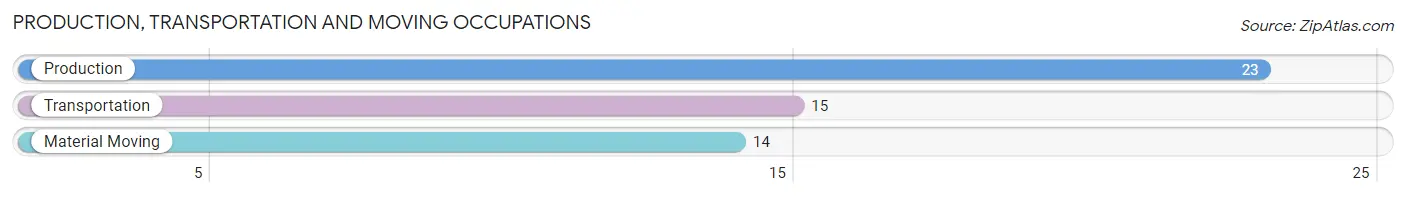
Production, Transportation and Moving Occupations
The most common Production, Transportation and Moving occupations in Pine Plains are Production (23 | 4.5%), Transportation (15 | 2.9%), and Material Moving (14 | 2.8%).
Production, Transportation and Moving Occupations by Sex
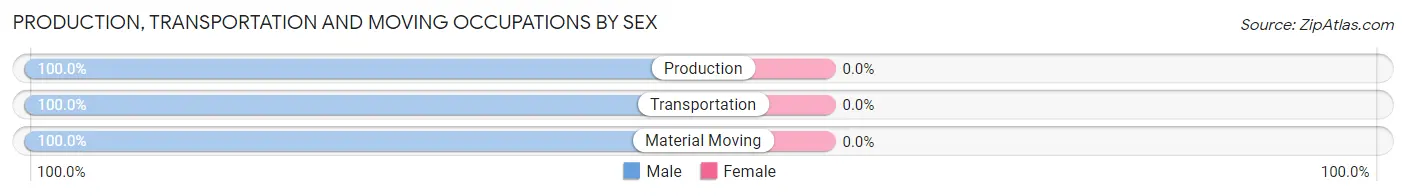
| Occupation | Male | Female |
| Production | 23 (100.0%) | 0 (0.0%) |
| Transportation | 15 (100.0%) | 0 (0.0%) |
| Material Moving | 14 (100.0%) | 0 (0.0%) |
| Total (Category) | 52 (100.0%) | 0 (0.0%) |
| Total (Overall) | 288 (56.5%) | 222 (43.5%) |
Employment Industries by Sex in Pine Plains
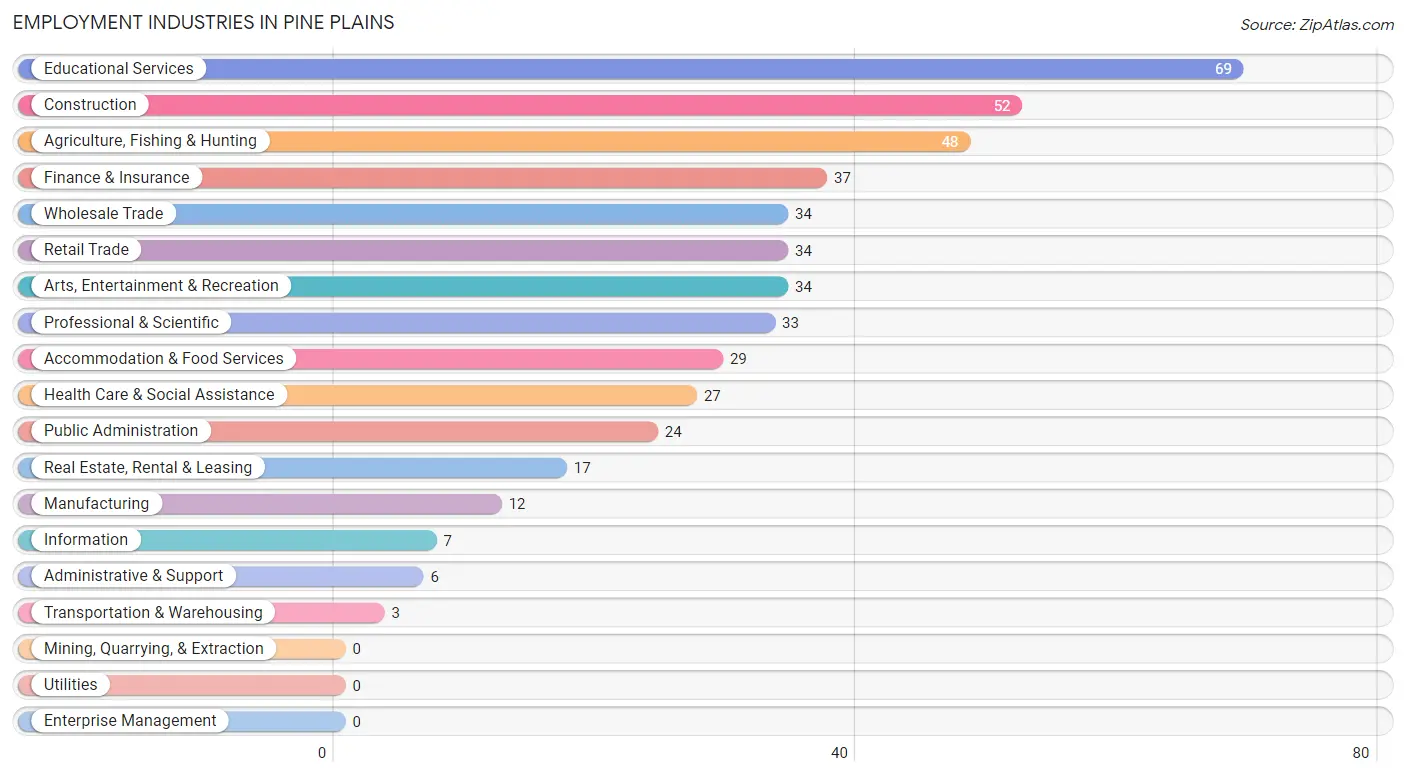
Employment Industries in Pine Plains
The major employment industries in Pine Plains include Educational Services (69 | 13.5%), Construction (52 | 10.2%), Agriculture, Fishing & Hunting (48 | 9.4%), Finance & Insurance (37 | 7.2%), and Wholesale Trade (34 | 6.7%).
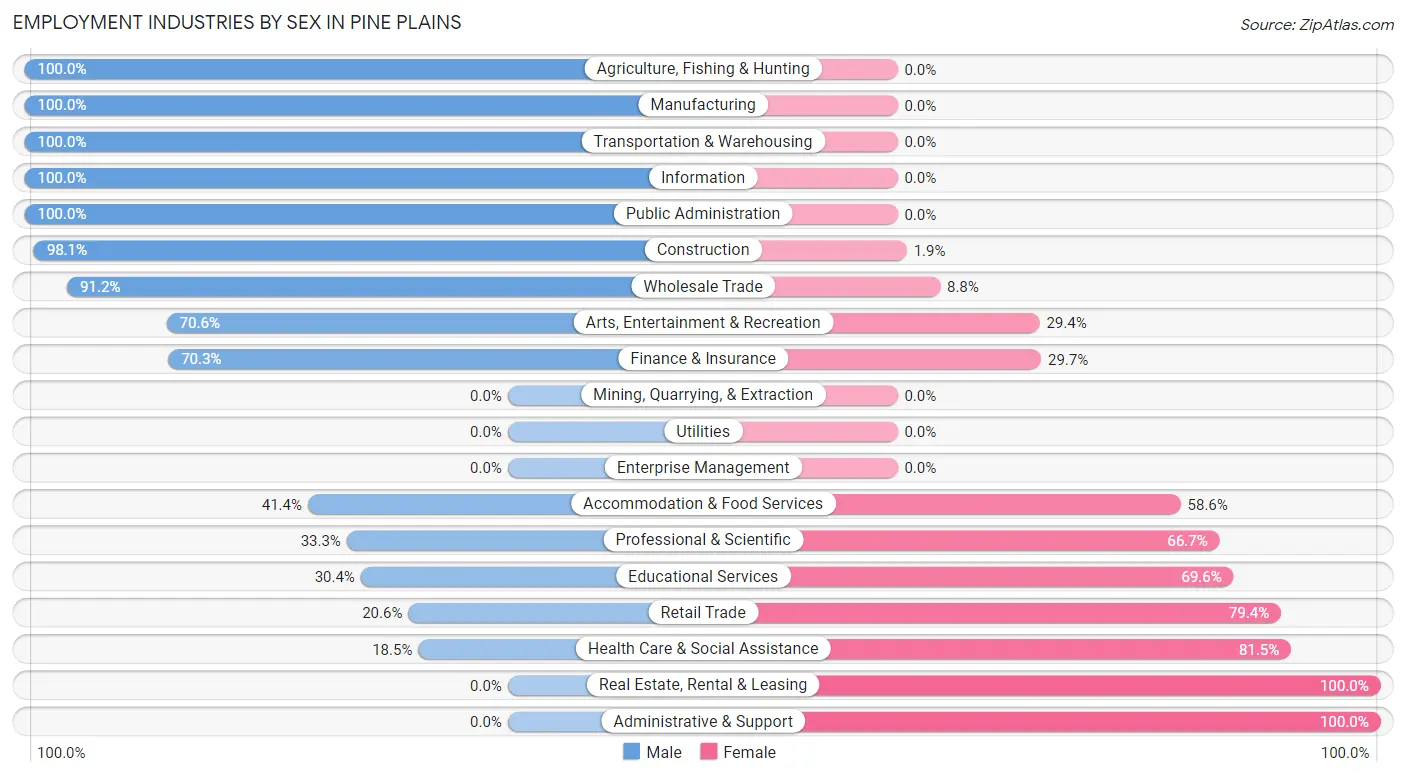
Employment Industries by Sex in Pine Plains
The Pine Plains industries that see more men than women are Agriculture, Fishing & Hunting (100.0%), Manufacturing (100.0%), and Transportation & Warehousing (100.0%), whereas the industries that tend to have a higher number of women are Real Estate, Rental & Leasing (100.0%), Administrative & Support (100.0%), and Health Care & Social Assistance (81.5%).
| Industry | Male | Female |
| Agriculture, Fishing & Hunting | 48 (100.0%) | 0 (0.0%) |
| Mining, Quarrying, & Extraction | 0 (0.0%) | 0 (0.0%) |
| Construction | 51 (98.1%) | 1 (1.9%) |
| Manufacturing | 12 (100.0%) | 0 (0.0%) |
| Wholesale Trade | 31 (91.2%) | 3 (8.8%) |
| Retail Trade | 7 (20.6%) | 27 (79.4%) |
| Transportation & Warehousing | 3 (100.0%) | 0 (0.0%) |
| Utilities | 0 (0.0%) | 0 (0.0%) |
| Information | 7 (100.0%) | 0 (0.0%) |
| Finance & Insurance | 26 (70.3%) | 11 (29.7%) |
| Real Estate, Rental & Leasing | 0 (0.0%) | 17 (100.0%) |
| Professional & Scientific | 11 (33.3%) | 22 (66.7%) |
| Enterprise Management | 0 (0.0%) | 0 (0.0%) |
| Administrative & Support | 0 (0.0%) | 6 (100.0%) |
| Educational Services | 21 (30.4%) | 48 (69.6%) |
| Health Care & Social Assistance | 5 (18.5%) | 22 (81.5%) |
| Arts, Entertainment & Recreation | 24 (70.6%) | 10 (29.4%) |
| Accommodation & Food Services | 12 (41.4%) | 17 (58.6%) |
| Public Administration | 24 (100.0%) | 0 (0.0%) |
| Total | 288 (56.5%) | 222 (43.5%) |
Education in Pine Plains
School Enrollment in Pine Plains
The most common levels of schooling among the 204 students in Pine Plains are high school (60 | 29.4%), college / undergraduate (54 | 26.5%), and middle school (40 | 19.6%).
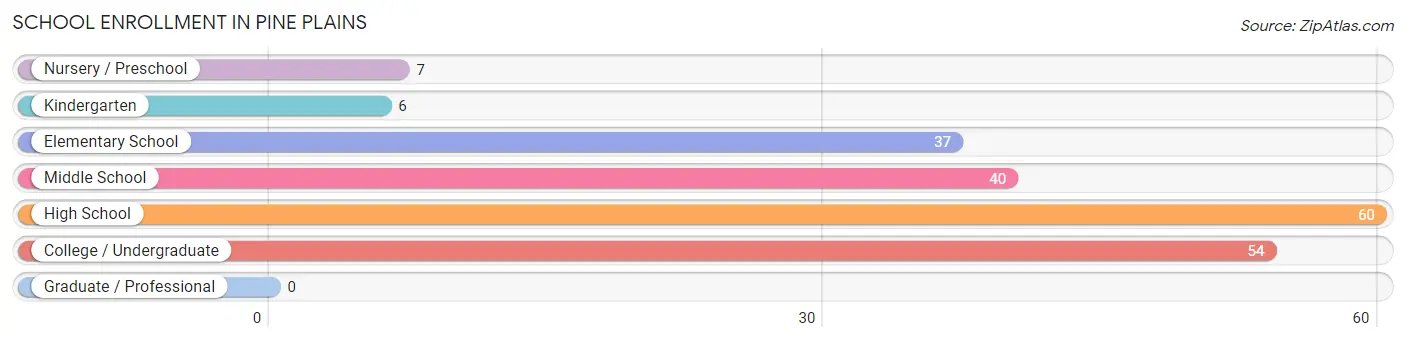
| School Level | # Students | % Students |
| Nursery / Preschool | 7 | 3.4% |
| Kindergarten | 6 | 2.9% |
| Elementary School | 37 | 18.1% |
| Middle School | 40 | 19.6% |
| High School | 60 | 29.4% |
| College / Undergraduate | 54 | 26.5% |
| Graduate / Professional | 0 | 0.0% |
| Total | 204 | 100.0% |
School Enrollment by Age by Funding Source in Pine Plains
Out of a total of 204 students who are enrolled in schools in Pine Plains, 47 (23.0%) attend a private institution, while the remaining 157 (77.0%) are enrolled in public schools. The age group of 3 to 4 year olds has the highest likelihood of being enrolled in private schools, with 7 (100.0% in the age bracket) enrolled. Conversely, the age group of 5 to 9 year old has the lowest likelihood of being enrolled in a private school, with 25 (100.0% in the age bracket) attending a public institution.
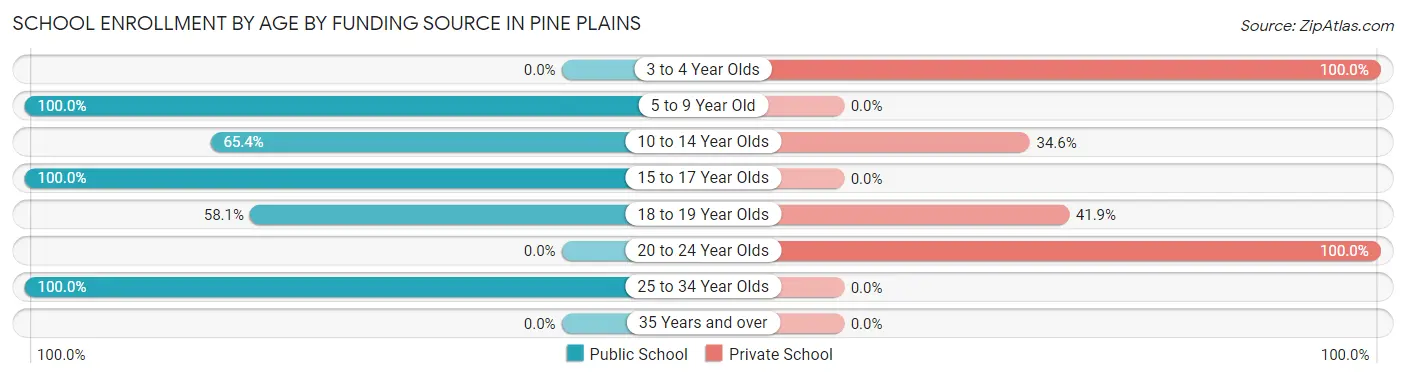
| Age Bracket | Public School | Private School |
| 3 to 4 Year Olds | 0 (0.0%) | 7 (100.0%) |
| 5 to 9 Year Old | 25 (100.0%) | 0 (0.0%) |
| 10 to 14 Year Olds | 34 (65.4%) | 18 (34.6%) |
| 15 to 17 Year Olds | 60 (100.0%) | 0 (0.0%) |
| 18 to 19 Year Olds | 18 (58.1%) | 13 (41.9%) |
| 20 to 24 Year Olds | 0 (0.0%) | 9 (100.0%) |
| 25 to 34 Year Olds | 20 (100.0%) | 0 (0.0%) |
| 35 Years and over | 0 (0.0%) | 0 (0.0%) |
| Total | 157 (77.0%) | 47 (23.0%) |
Educational Attainment by Field of Study in Pine Plains
Liberal arts & history (45 | 23.6%), business (30 | 15.7%), literature & languages (24 | 12.6%), science & technology (23 | 12.0%), and bio, nature & agricultural (18 | 9.4%) are the most common fields of study among 191 individuals in Pine Plains who have obtained a bachelor's degree or higher.
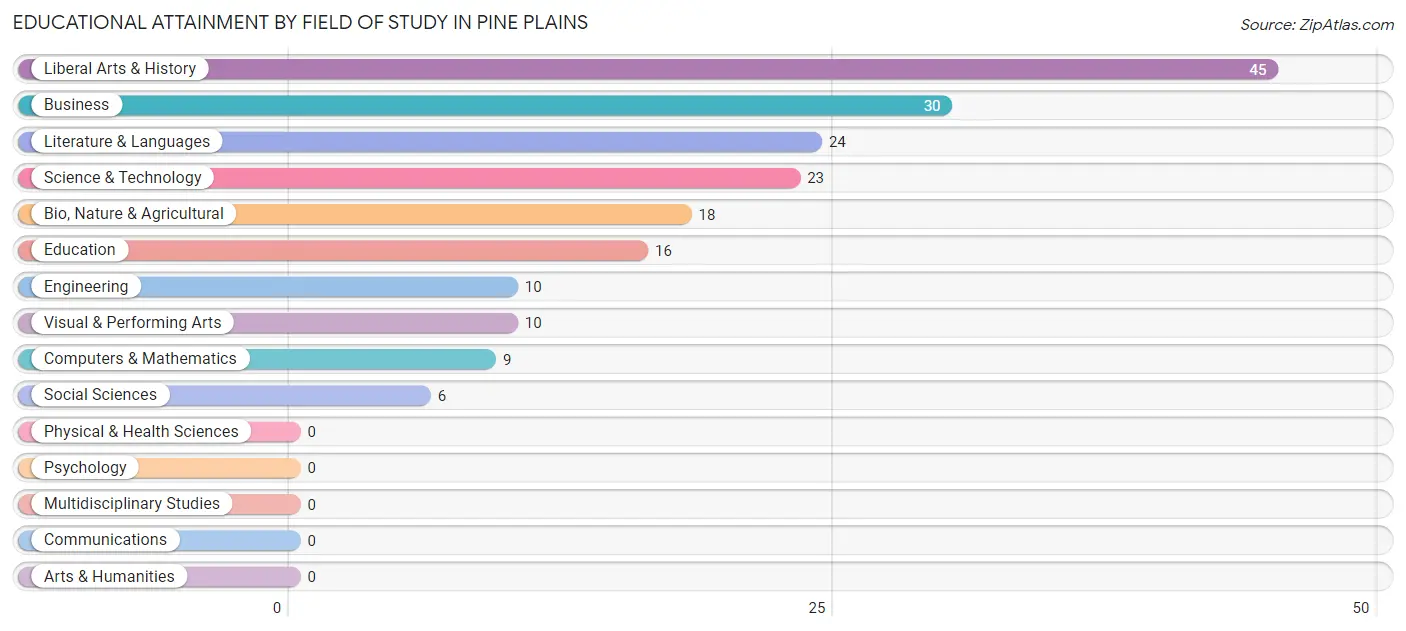
| Field of Study | # Graduates | % Graduates |
| Computers & Mathematics | 9 | 4.7% |
| Bio, Nature & Agricultural | 18 | 9.4% |
| Physical & Health Sciences | 0 | 0.0% |
| Psychology | 0 | 0.0% |
| Social Sciences | 6 | 3.1% |
| Engineering | 10 | 5.2% |
| Multidisciplinary Studies | 0 | 0.0% |
| Science & Technology | 23 | 12.0% |
| Business | 30 | 15.7% |
| Education | 16 | 8.4% |
| Literature & Languages | 24 | 12.6% |
| Liberal Arts & History | 45 | 23.6% |
| Visual & Performing Arts | 10 | 5.2% |
| Communications | 0 | 0.0% |
| Arts & Humanities | 0 | 0.0% |
| Total | 191 | 100.0% |
Transportation & Commute in Pine Plains
Vehicle Availability by Sex in Pine Plains
The most prevalent vehicle ownership categories in Pine Plains are males with 2 vehicles (95, accounting for 35.1%) and females with 2 vehicles (80, making up 44.0%).
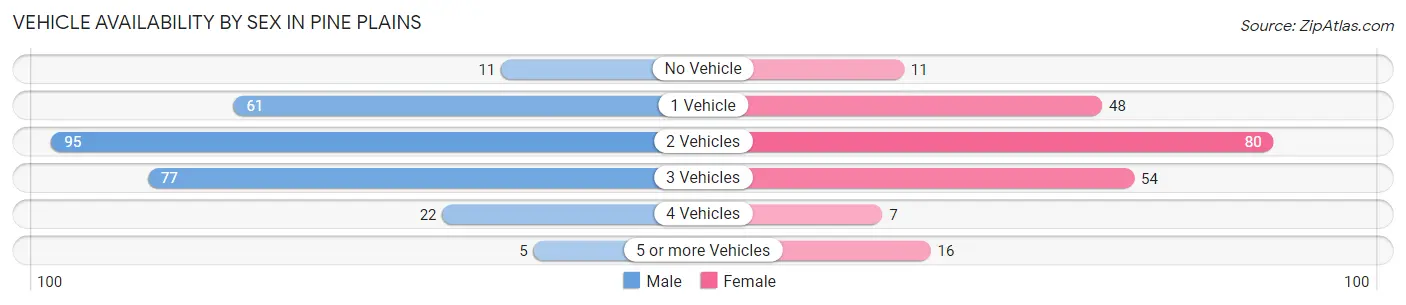
| Vehicles Available | Male | Female |
| No Vehicle | 11 (4.1%) | 11 (5.1%) |
| 1 Vehicle | 61 (22.5%) | 48 (22.2%) |
| 2 Vehicles | 95 (35.1%) | 80 (37.0%) |
| 3 Vehicles | 77 (28.4%) | 54 (25.0%) |
| 4 Vehicles | 22 (8.1%) | 7 (3.2%) |
| 5 or more Vehicles | 5 (1.8%) | 16 (7.4%) |
| Total | 271 (100.0%) | 216 (100.0%) |
Commute Time in Pine Plains
The most frequently occuring commute durations in Pine Plains are 5 to 9 minutes (85 commuters, 18.9%), 20 to 24 minutes (80 commuters, 17.8%), and 45 to 59 minutes (54 commuters, 12.0%).
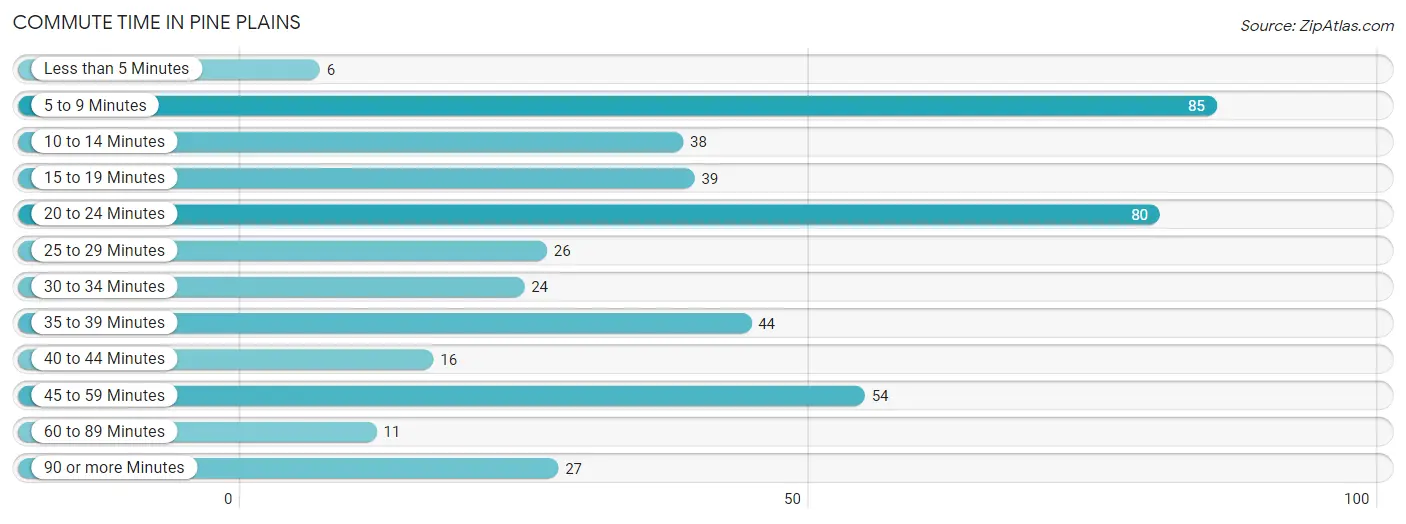
| Commute Time | # Commuters | % Commuters |
| Less than 5 Minutes | 6 | 1.3% |
| 5 to 9 Minutes | 85 | 18.9% |
| 10 to 14 Minutes | 38 | 8.4% |
| 15 to 19 Minutes | 39 | 8.7% |
| 20 to 24 Minutes | 80 | 17.8% |
| 25 to 29 Minutes | 26 | 5.8% |
| 30 to 34 Minutes | 24 | 5.3% |
| 35 to 39 Minutes | 44 | 9.8% |
| 40 to 44 Minutes | 16 | 3.6% |
| 45 to 59 Minutes | 54 | 12.0% |
| 60 to 89 Minutes | 11 | 2.4% |
| 90 or more Minutes | 27 | 6.0% |
Commute Time by Sex in Pine Plains
The most common commute times in Pine Plains are 5 to 9 minutes (70 commuters, 25.8%) for males and 20 to 24 minutes (47 commuters, 26.3%) for females.
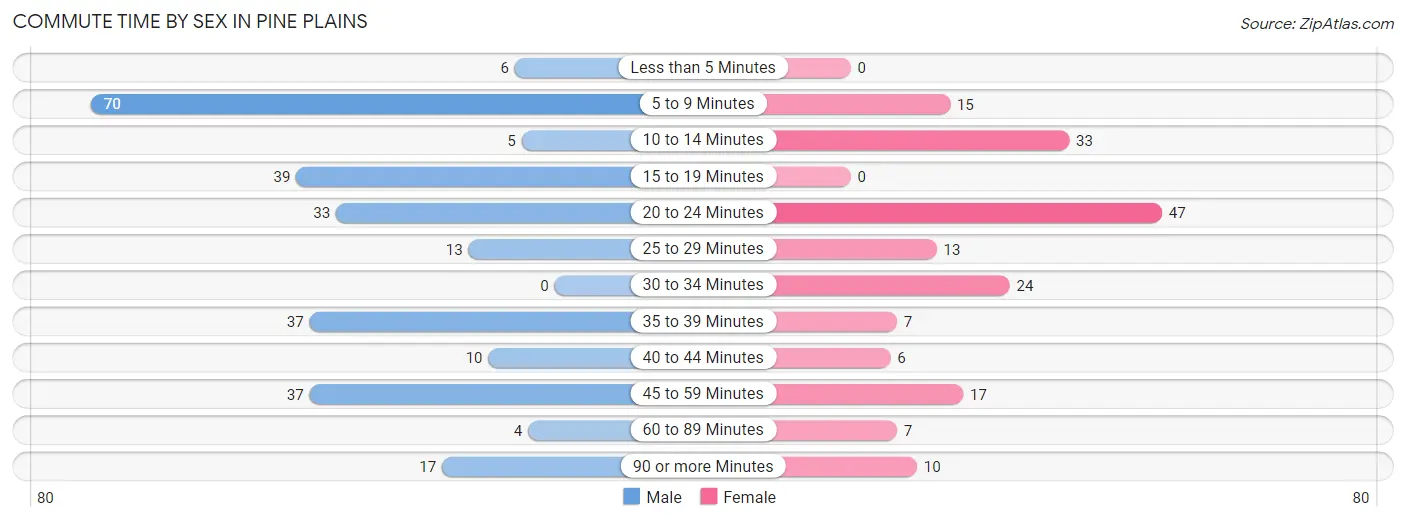
| Commute Time | Male | Female |
| Less than 5 Minutes | 6 (2.2%) | 0 (0.0%) |
| 5 to 9 Minutes | 70 (25.8%) | 15 (8.4%) |
| 10 to 14 Minutes | 5 (1.8%) | 33 (18.4%) |
| 15 to 19 Minutes | 39 (14.4%) | 0 (0.0%) |
| 20 to 24 Minutes | 33 (12.2%) | 47 (26.3%) |
| 25 to 29 Minutes | 13 (4.8%) | 13 (7.3%) |
| 30 to 34 Minutes | 0 (0.0%) | 24 (13.4%) |
| 35 to 39 Minutes | 37 (13.7%) | 7 (3.9%) |
| 40 to 44 Minutes | 10 (3.7%) | 6 (3.4%) |
| 45 to 59 Minutes | 37 (13.7%) | 17 (9.5%) |
| 60 to 89 Minutes | 4 (1.5%) | 7 (3.9%) |
| 90 or more Minutes | 17 (6.3%) | 10 (5.6%) |
Time of Departure to Work by Sex in Pine Plains
The most frequent times of departure to work in Pine Plains are 6:30 AM to 6:59 AM (61, 22.5%) for males and 7:00 AM to 7:29 AM (30, 16.8%) for females.
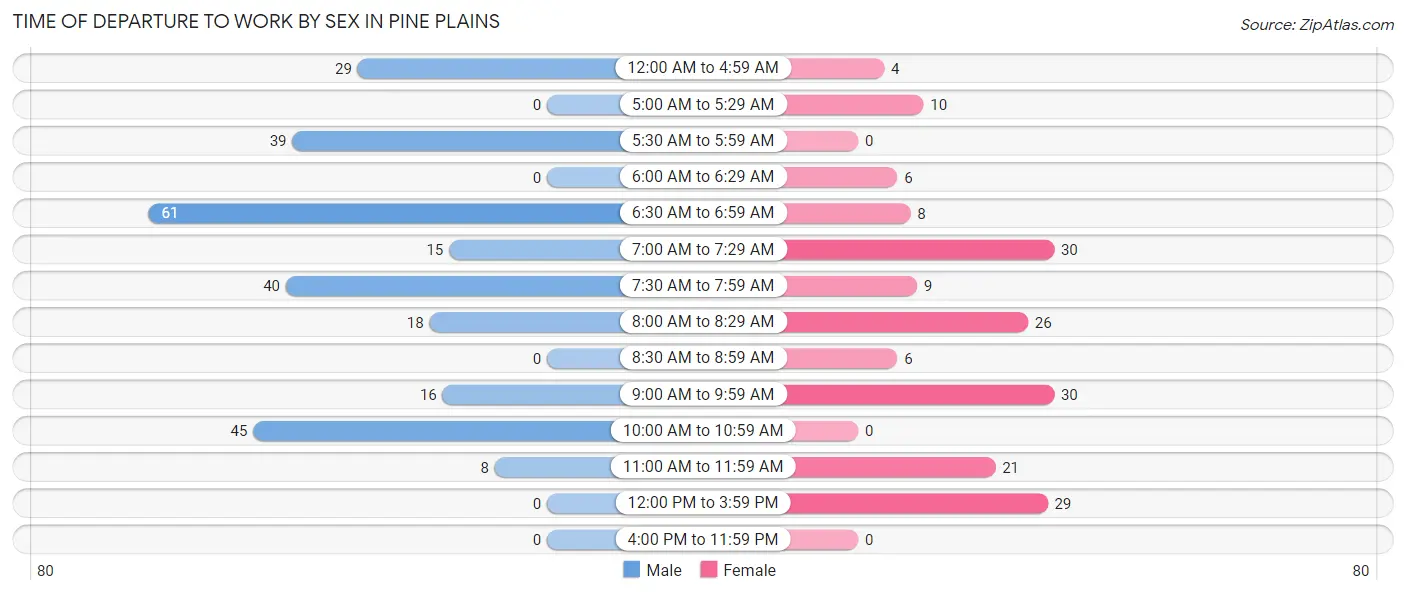
| Time of Departure | Male | Female |
| 12:00 AM to 4:59 AM | 29 (10.7%) | 4 (2.2%) |
| 5:00 AM to 5:29 AM | 0 (0.0%) | 10 (5.6%) |
| 5:30 AM to 5:59 AM | 39 (14.4%) | 0 (0.0%) |
| 6:00 AM to 6:29 AM | 0 (0.0%) | 6 (3.4%) |
| 6:30 AM to 6:59 AM | 61 (22.5%) | 8 (4.5%) |
| 7:00 AM to 7:29 AM | 15 (5.5%) | 30 (16.8%) |
| 7:30 AM to 7:59 AM | 40 (14.8%) | 9 (5.0%) |
| 8:00 AM to 8:29 AM | 18 (6.6%) | 26 (14.5%) |
| 8:30 AM to 8:59 AM | 0 (0.0%) | 6 (3.4%) |
| 9:00 AM to 9:59 AM | 16 (5.9%) | 30 (16.8%) |
| 10:00 AM to 10:59 AM | 45 (16.6%) | 0 (0.0%) |
| 11:00 AM to 11:59 AM | 8 (2.9%) | 21 (11.7%) |
| 12:00 PM to 3:59 PM | 0 (0.0%) | 29 (16.2%) |
| 4:00 PM to 11:59 PM | 0 (0.0%) | 0 (0.0%) |
| Total | 271 (100.0%) | 179 (100.0%) |
Housing Occupancy in Pine Plains
Occupancy by Ownership in Pine Plains
Of the total 417 dwellings in Pine Plains, owner-occupied units account for 308 (73.9%), while renter-occupied units make up 109 (26.1%).
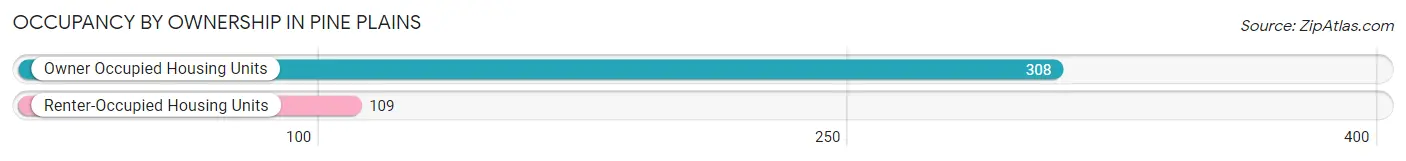
| Occupancy | # Housing Units | % Housing Units |
| Owner Occupied Housing Units | 308 | 73.9% |
| Renter-Occupied Housing Units | 109 | 26.1% |
| Total Occupied Housing Units | 417 | 100.0% |
Occupancy by Household Size in Pine Plains
| Household Size | # Housing Units | % Housing Units |
| 1-Person Household | 111 | 26.6% |
| 2-Person Household | 152 | 36.4% |
| 3-Person Household | 82 | 19.7% |
| 4+ Person Household | 72 | 17.3% |
| Total Housing Units | 417 | 100.0% |
Occupancy by Ownership by Household Size in Pine Plains
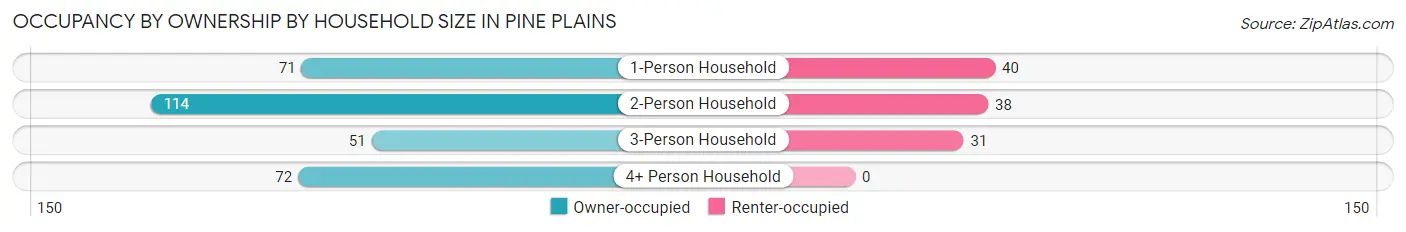
| Household Size | Owner-occupied | Renter-occupied |
| 1-Person Household | 71 (64.0%) | 40 (36.0%) |
| 2-Person Household | 114 (75.0%) | 38 (25.0%) |
| 3-Person Household | 51 (62.2%) | 31 (37.8%) |
| 4+ Person Household | 72 (100.0%) | 0 (0.0%) |
| Total Housing Units | 308 (73.9%) | 109 (26.1%) |
Occupancy by Educational Attainment in Pine Plains
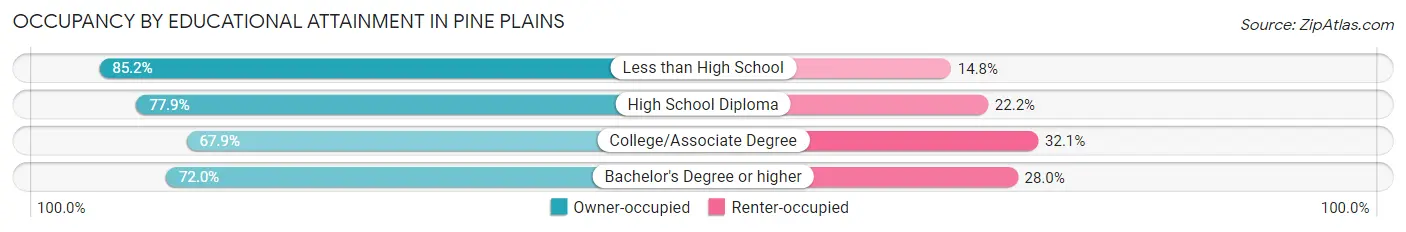
| Household Size | Owner-occupied | Renter-occupied |
| Less than High School | 23 (85.2%) | 4 (14.8%) |
| High School Diploma | 116 (77.8%) | 33 (22.2%) |
| College/Associate Degree | 74 (67.9%) | 35 (32.1%) |
| Bachelor's Degree or higher | 95 (72.0%) | 37 (28.0%) |
Occupancy by Age of Householder in Pine Plains
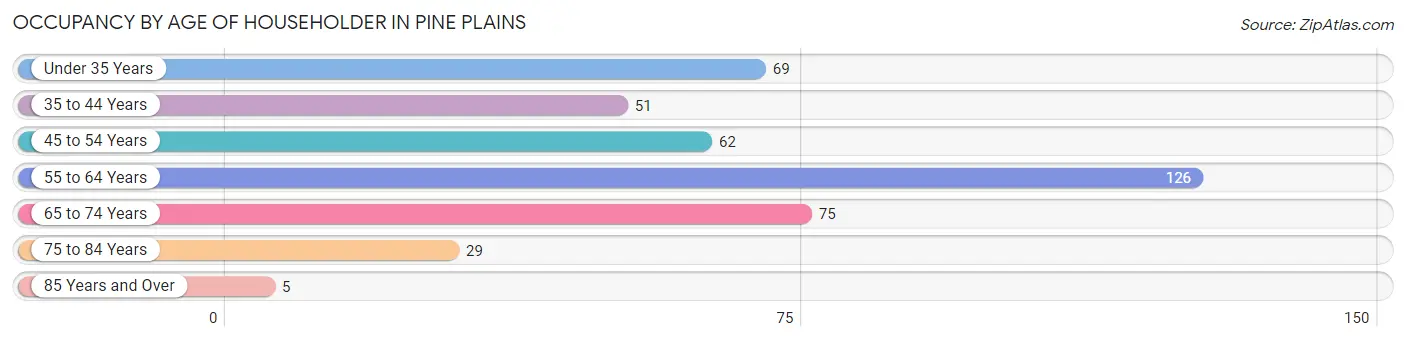
| Age Bracket | # Households | % Households |
| Under 35 Years | 69 | 16.6% |
| 35 to 44 Years | 51 | 12.2% |
| 45 to 54 Years | 62 | 14.9% |
| 55 to 64 Years | 126 | 30.2% |
| 65 to 74 Years | 75 | 18.0% |
| 75 to 84 Years | 29 | 7.0% |
| 85 Years and Over | 5 | 1.2% |
| Total | 417 | 100.0% |
Housing Finances in Pine Plains
Median Income by Occupancy in Pine Plains
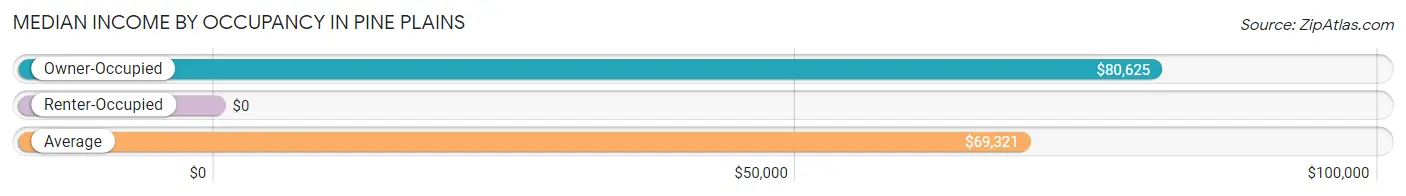
| Occupancy Type | # Households | Median Income |
| Owner-Occupied | 308 (73.9%) | $80,625 |
| Renter-Occupied | 109 (26.1%) | $0 |
| Average | 417 (100.0%) | $69,321 |
Occupancy by Householder Income Bracket in Pine Plains
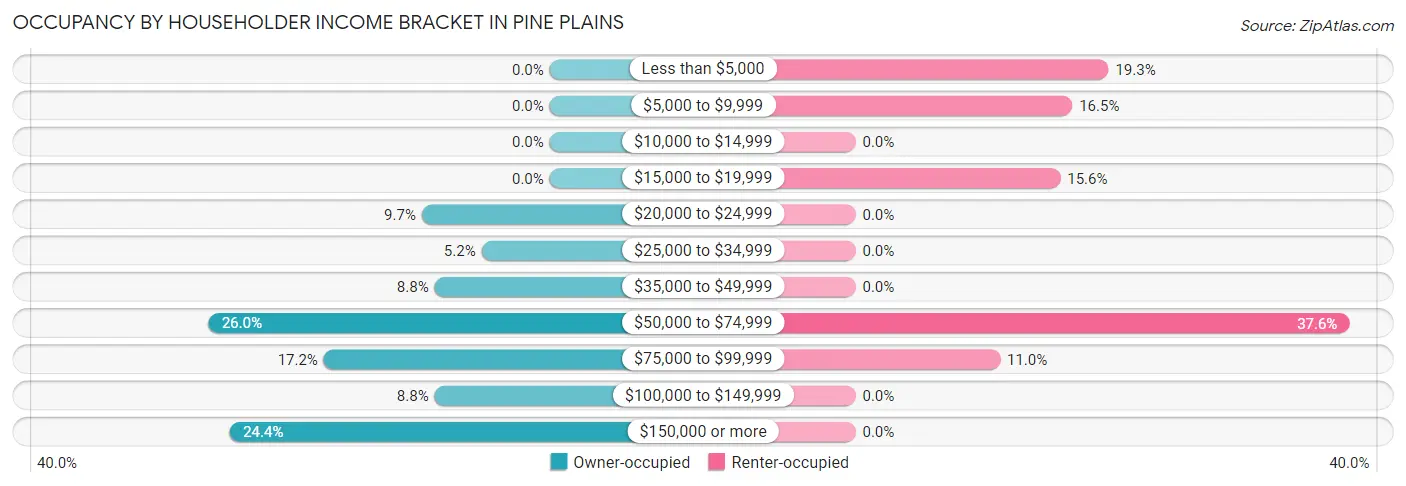
| Income Bracket | Owner-occupied | Renter-occupied |
| Less than $5,000 | 0 (0.0%) | 21 (19.3%) |
| $5,000 to $9,999 | 0 (0.0%) | 18 (16.5%) |
| $10,000 to $14,999 | 0 (0.0%) | 0 (0.0%) |
| $15,000 to $19,999 | 0 (0.0%) | 17 (15.6%) |
| $20,000 to $24,999 | 30 (9.7%) | 0 (0.0%) |
| $25,000 to $34,999 | 16 (5.2%) | 0 (0.0%) |
| $35,000 to $49,999 | 27 (8.8%) | 0 (0.0%) |
| $50,000 to $74,999 | 80 (26.0%) | 41 (37.6%) |
| $75,000 to $99,999 | 53 (17.2%) | 12 (11.0%) |
| $100,000 to $149,999 | 27 (8.8%) | 0 (0.0%) |
| $150,000 or more | 75 (24.3%) | 0 (0.0%) |
| Total | 308 (100.0%) | 109 (100.0%) |
Monthly Housing Cost Tiers in Pine Plains
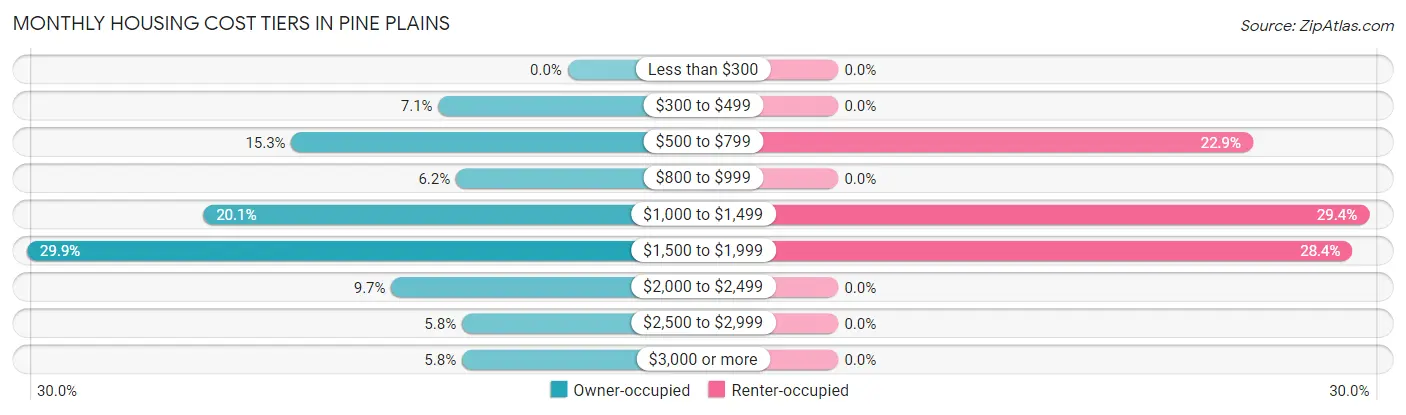
| Monthly Cost | Owner-occupied | Renter-occupied |
| Less than $300 | 0 (0.0%) | 0 (0.0%) |
| $300 to $499 | 22 (7.1%) | 0 (0.0%) |
| $500 to $799 | 47 (15.3%) | 25 (22.9%) |
| $800 to $999 | 19 (6.2%) | 0 (0.0%) |
| $1,000 to $1,499 | 62 (20.1%) | 32 (29.4%) |
| $1,500 to $1,999 | 92 (29.9%) | 31 (28.4%) |
| $2,000 to $2,499 | 30 (9.7%) | 0 (0.0%) |
| $2,500 to $2,999 | 18 (5.8%) | 0 (0.0%) |
| $3,000 or more | 18 (5.8%) | 0 (0.0%) |
| Total | 308 (100.0%) | 109 (100.0%) |
Physical Housing Characteristics in Pine Plains
Housing Structures in Pine Plains
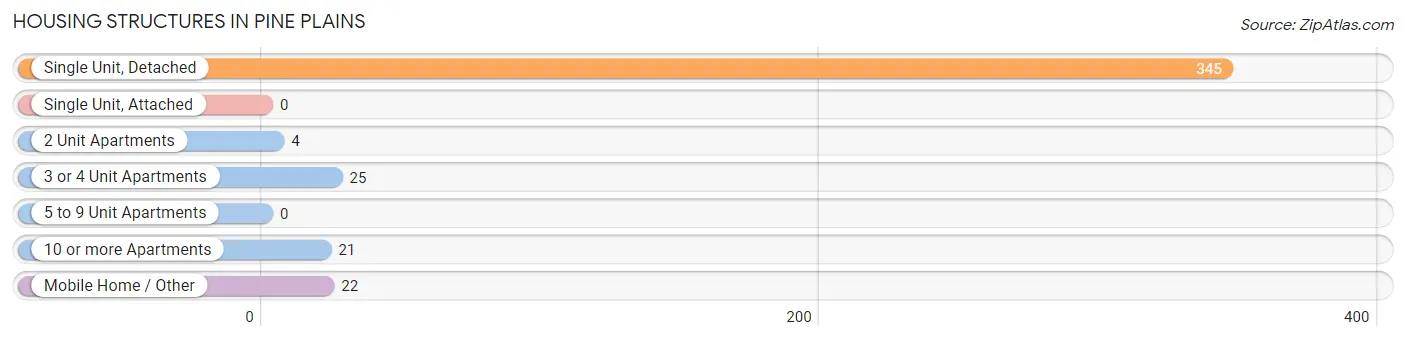
| Structure Type | # Housing Units | % Housing Units |
| Single Unit, Detached | 345 | 82.7% |
| Single Unit, Attached | 0 | 0.0% |
| 2 Unit Apartments | 4 | 1.0% |
| 3 or 4 Unit Apartments | 25 | 6.0% |
| 5 to 9 Unit Apartments | 0 | 0.0% |
| 10 or more Apartments | 21 | 5.0% |
| Mobile Home / Other | 22 | 5.3% |
| Total | 417 | 100.0% |
Housing Structures by Occupancy in Pine Plains
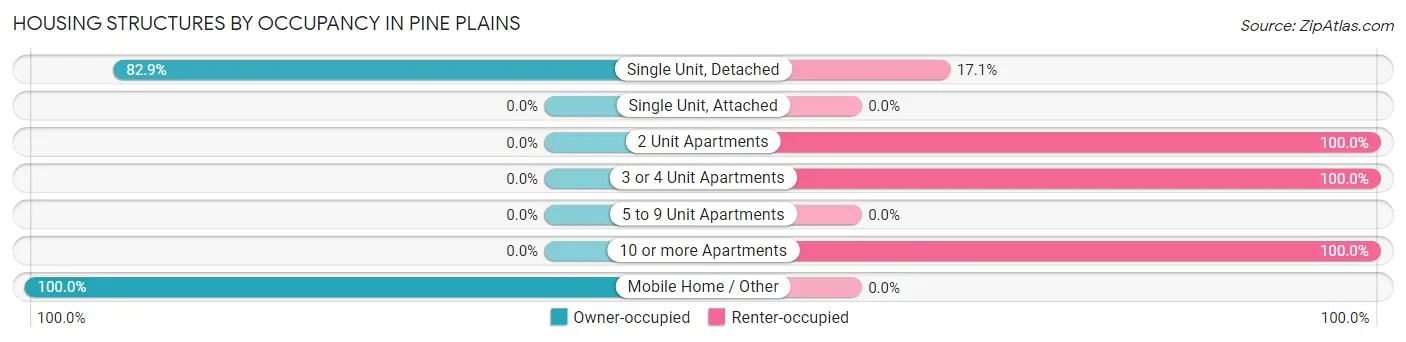
| Structure Type | Owner-occupied | Renter-occupied |
| Single Unit, Detached | 286 (82.9%) | 59 (17.1%) |
| Single Unit, Attached | 0 (0.0%) | 0 (0.0%) |
| 2 Unit Apartments | 0 (0.0%) | 4 (100.0%) |
| 3 or 4 Unit Apartments | 0 (0.0%) | 25 (100.0%) |
| 5 to 9 Unit Apartments | 0 (0.0%) | 0 (0.0%) |
| 10 or more Apartments | 0 (0.0%) | 21 (100.0%) |
| Mobile Home / Other | 22 (100.0%) | 0 (0.0%) |
| Total | 308 (73.9%) | 109 (26.1%) |
Housing Structures by Number of Rooms in Pine Plains
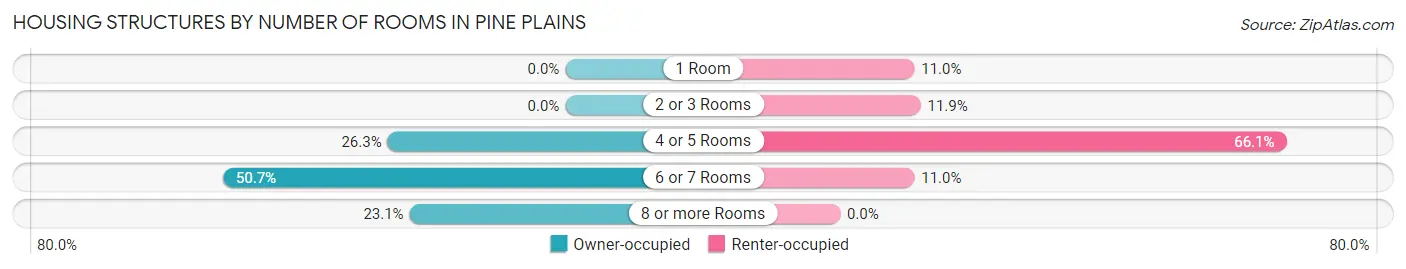
| Number of Rooms | Owner-occupied | Renter-occupied |
| 1 Room | 0 (0.0%) | 12 (11.0%) |
| 2 or 3 Rooms | 0 (0.0%) | 13 (11.9%) |
| 4 or 5 Rooms | 81 (26.3%) | 72 (66.1%) |
| 6 or 7 Rooms | 156 (50.6%) | 12 (11.0%) |
| 8 or more Rooms | 71 (23.1%) | 0 (0.0%) |
| Total | 308 (100.0%) | 109 (100.0%) |
Housing Structure by Heating Type in Pine Plains
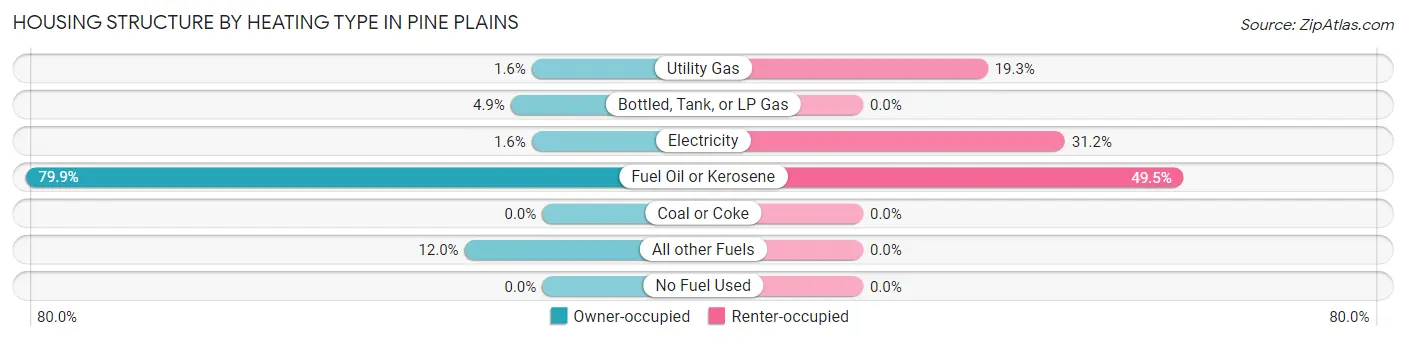
| Heating Type | Owner-occupied | Renter-occupied |
| Utility Gas | 5 (1.6%) | 21 (19.3%) |
| Bottled, Tank, or LP Gas | 15 (4.9%) | 0 (0.0%) |
| Electricity | 5 (1.6%) | 34 (31.2%) |
| Fuel Oil or Kerosene | 246 (79.9%) | 54 (49.5%) |
| Coal or Coke | 0 (0.0%) | 0 (0.0%) |
| All other Fuels | 37 (12.0%) | 0 (0.0%) |
| No Fuel Used | 0 (0.0%) | 0 (0.0%) |
| Total | 308 (100.0%) | 109 (100.0%) |
Household Vehicle Usage in Pine Plains
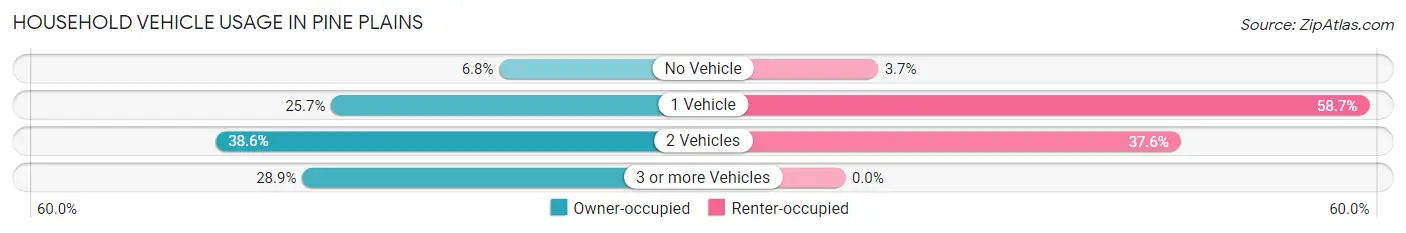
| Vehicles per Household | Owner-occupied | Renter-occupied |
| No Vehicle | 21 (6.8%) | 4 (3.7%) |
| 1 Vehicle | 79 (25.7%) | 64 (58.7%) |
| 2 Vehicles | 119 (38.6%) | 41 (37.6%) |
| 3 or more Vehicles | 89 (28.9%) | 0 (0.0%) |
| Total | 308 (100.0%) | 109 (100.0%) |
Real Estate & Mortgages in Pine Plains
Real Estate and Mortgage Overview in Pine Plains
| Characteristic | Without Mortgage | With Mortgage |
| Housing Units | 91 | 217 |
| Median Property Value | $227,600 | $270,300 |
| Median Household Income | $83,304 | $55 |
| Monthly Housing Costs | $648 | $18 |
| Real Estate Taxes | $3,300 | $0 |
Property Value by Mortgage Status in Pine Plains
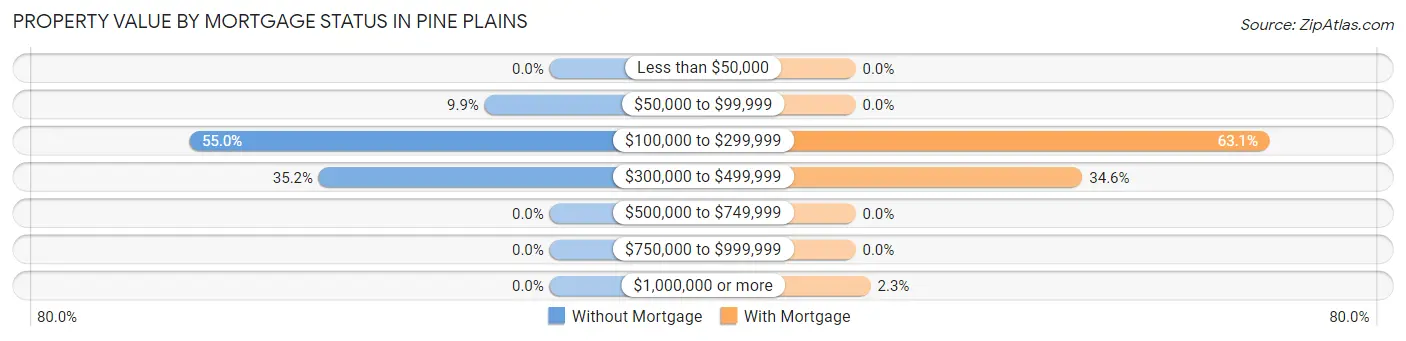
| Property Value | Without Mortgage | With Mortgage |
| Less than $50,000 | 0 (0.0%) | 0 (0.0%) |
| $50,000 to $99,999 | 9 (9.9%) | 0 (0.0%) |
| $100,000 to $299,999 | 50 (54.9%) | 137 (63.1%) |
| $300,000 to $499,999 | 32 (35.2%) | 75 (34.6%) |
| $500,000 to $749,999 | 0 (0.0%) | 0 (0.0%) |
| $750,000 to $999,999 | 0 (0.0%) | 0 (0.0%) |
| $1,000,000 or more | 0 (0.0%) | 5 (2.3%) |
| Total | 91 (100.0%) | 217 (100.0%) |
Household Income by Mortgage Status in Pine Plains
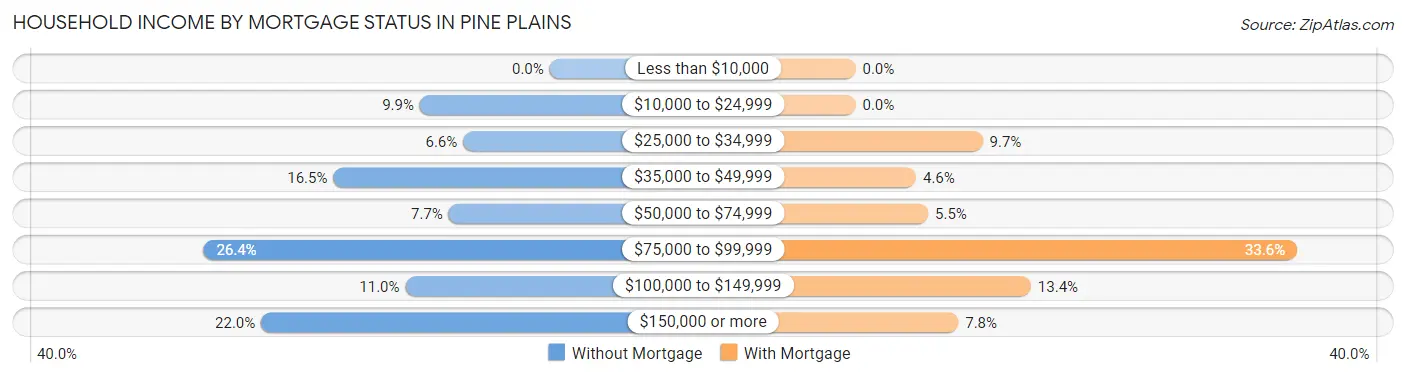
| Household Income | Without Mortgage | With Mortgage |
| Less than $10,000 | 0 (0.0%) | 0 (0.0%) |
| $10,000 to $24,999 | 9 (9.9%) | 0 (0.0%) |
| $25,000 to $34,999 | 6 (6.6%) | 21 (9.7%) |
| $35,000 to $49,999 | 15 (16.5%) | 10 (4.6%) |
| $50,000 to $74,999 | 7 (7.7%) | 12 (5.5%) |
| $75,000 to $99,999 | 24 (26.4%) | 73 (33.6%) |
| $100,000 to $149,999 | 10 (11.0%) | 29 (13.4%) |
| $150,000 or more | 20 (22.0%) | 17 (7.8%) |
| Total | 91 (100.0%) | 217 (100.0%) |
Property Value to Household Income Ratio in Pine Plains
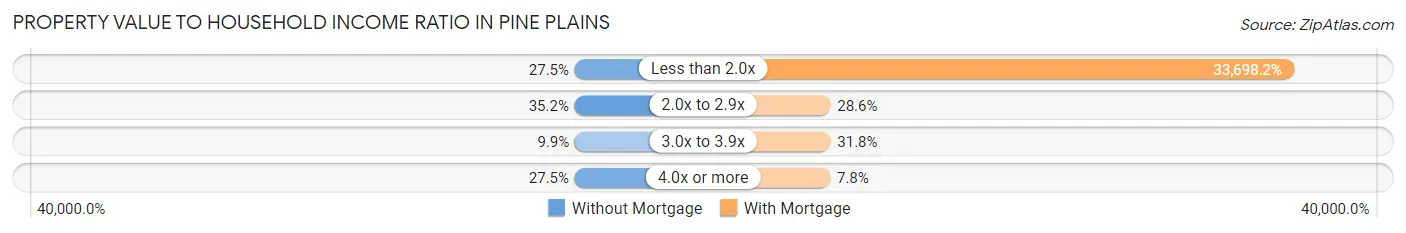
| Value-to-Income Ratio | Without Mortgage | With Mortgage |
| Less than 2.0x | 25 (27.5%) | 73,125 (33,698.2%) |
| 2.0x to 2.9x | 32 (35.2%) | 62 (28.6%) |
| 3.0x to 3.9x | 9 (9.9%) | 69 (31.8%) |
| 4.0x or more | 25 (27.5%) | 17 (7.8%) |
| Total | 91 (100.0%) | 217 (100.0%) |
Real Estate Taxes by Mortgage Status in Pine Plains
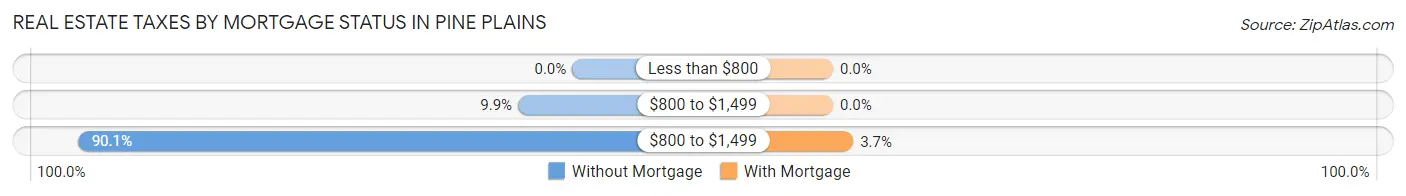
| Property Taxes | Without Mortgage | With Mortgage |
| Less than $800 | 0 (0.0%) | 0 (0.0%) |
| $800 to $1,499 | 9 (9.9%) | 0 (0.0%) |
| $800 to $1,499 | 82 (90.1%) | 8 (3.7%) |
| Total | 91 (100.0%) | 217 (100.0%) |
Health & Disability in Pine Plains
Health Insurance Coverage by Age in Pine Plains
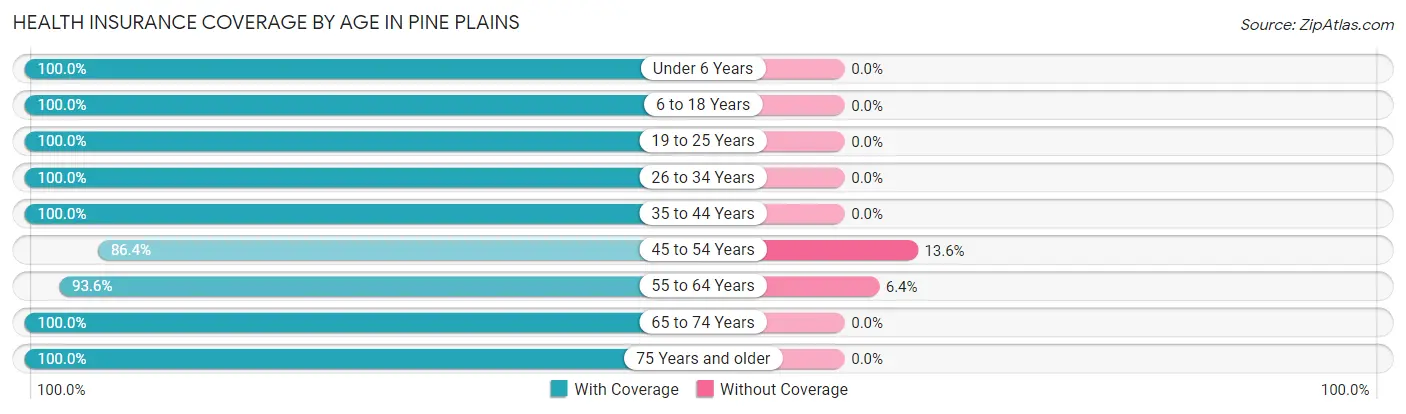
| Age Bracket | With Coverage | Without Coverage |
| Under 6 Years | 69 (100.0%) | 0 (0.0%) |
| 6 to 18 Years | 189 (100.0%) | 0 (0.0%) |
| 19 to 25 Years | 74 (100.0%) | 0 (0.0%) |
| 26 to 34 Years | 77 (100.0%) | 0 (0.0%) |
| 35 to 44 Years | 151 (100.0%) | 0 (0.0%) |
| 45 to 54 Years | 76 (86.4%) | 12 (13.6%) |
| 55 to 64 Years | 160 (93.6%) | 11 (6.4%) |
| 65 to 74 Years | 123 (100.0%) | 0 (0.0%) |
| 75 Years and older | 52 (100.0%) | 0 (0.0%) |
| Total | 971 (97.7%) | 23 (2.3%) |
Health Insurance Coverage by Citizenship Status in Pine Plains
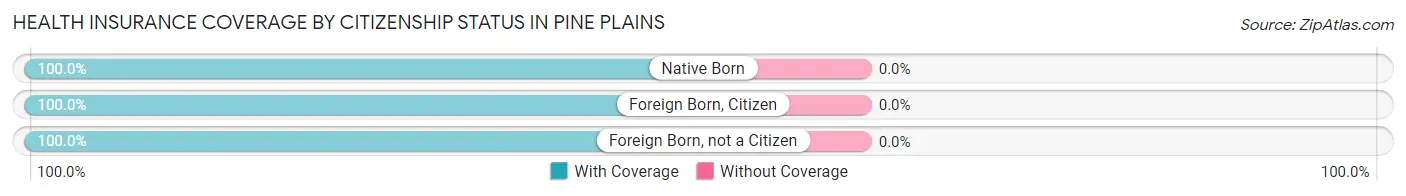
| Citizenship Status | With Coverage | Without Coverage |
| Native Born | 69 (100.0%) | 0 (0.0%) |
| Foreign Born, Citizen | 189 (100.0%) | 0 (0.0%) |
| Foreign Born, not a Citizen | 74 (100.0%) | 0 (0.0%) |
Health Insurance Coverage by Household Income in Pine Plains
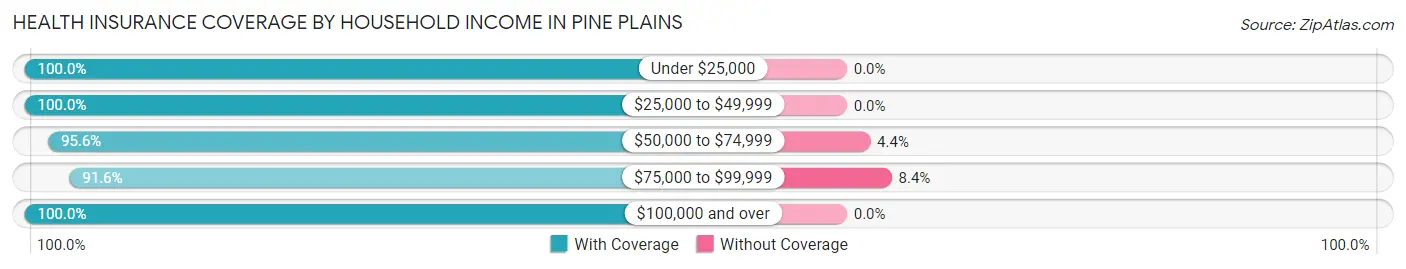
| Household Income | With Coverage | Without Coverage |
| Under $25,000 | 163 (100.0%) | 0 (0.0%) |
| $25,000 to $49,999 | 88 (100.0%) | 0 (0.0%) |
| $50,000 to $74,999 | 240 (95.6%) | 11 (4.4%) |
| $75,000 to $99,999 | 131 (91.6%) | 12 (8.4%) |
| $100,000 and over | 349 (100.0%) | 0 (0.0%) |
Public vs Private Health Insurance Coverage by Age in Pine Plains
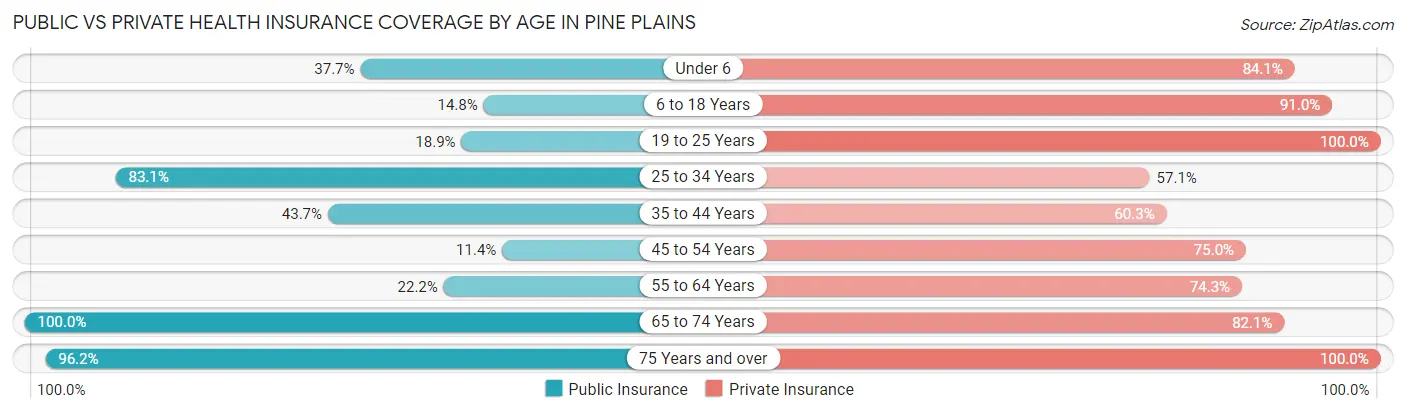
| Age Bracket | Public Insurance | Private Insurance |
| Under 6 | 26 (37.7%) | 58 (84.1%) |
| 6 to 18 Years | 28 (14.8%) | 172 (91.0%) |
| 19 to 25 Years | 14 (18.9%) | 74 (100.0%) |
| 25 to 34 Years | 64 (83.1%) | 44 (57.1%) |
| 35 to 44 Years | 66 (43.7%) | 91 (60.3%) |
| 45 to 54 Years | 10 (11.4%) | 66 (75.0%) |
| 55 to 64 Years | 38 (22.2%) | 127 (74.3%) |
| 65 to 74 Years | 123 (100.0%) | 101 (82.1%) |
| 75 Years and over | 50 (96.2%) | 52 (100.0%) |
| Total | 419 (42.1%) | 785 (79.0%) |
Disability Status by Sex by Age in Pine Plains
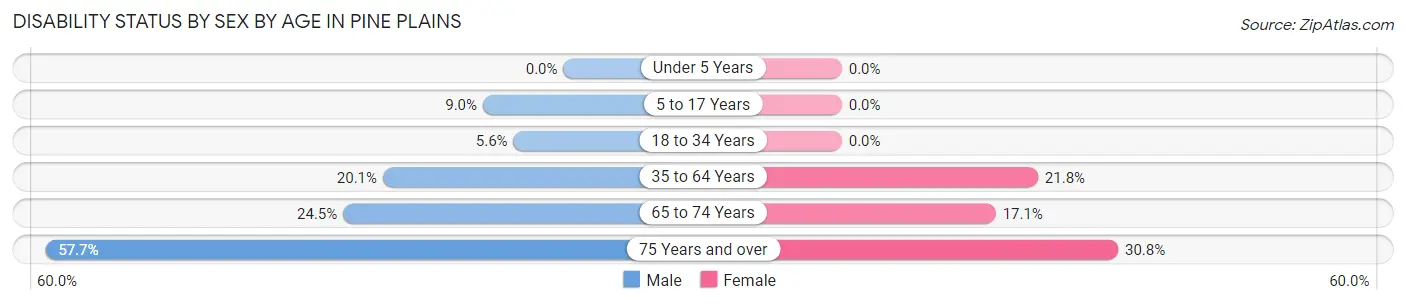
| Age Bracket | Male | Female |
| Under 5 Years | 0 (0.0%) | 0 (0.0%) |
| 5 to 17 Years | 6 (9.0%) | 0 (0.0%) |
| 18 to 34 Years | 7 (5.6%) | 0 (0.0%) |
| 35 to 64 Years | 41 (20.1%) | 45 (21.8%) |
| 65 to 74 Years | 13 (24.5%) | 12 (17.1%) |
| 75 Years and over | 15 (57.7%) | 8 (30.8%) |
Disability Class by Sex by Age in Pine Plains
Disability Class: Hearing Difficulty
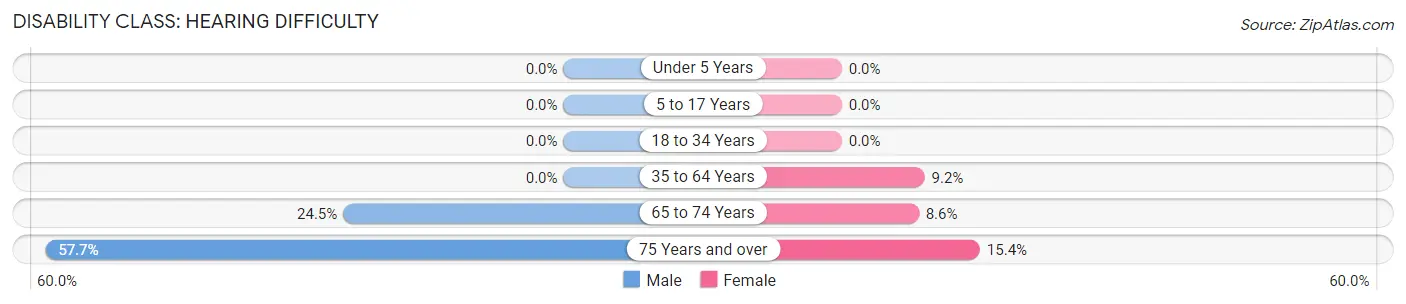
| Age Bracket | Male | Female |
| Under 5 Years | 0 (0.0%) | 0 (0.0%) |
| 5 to 17 Years | 0 (0.0%) | 0 (0.0%) |
| 18 to 34 Years | 0 (0.0%) | 0 (0.0%) |
| 35 to 64 Years | 0 (0.0%) | 19 (9.2%) |
| 65 to 74 Years | 13 (24.5%) | 6 (8.6%) |
| 75 Years and over | 15 (57.7%) | 4 (15.4%) |
Disability Class: Vision Difficulty
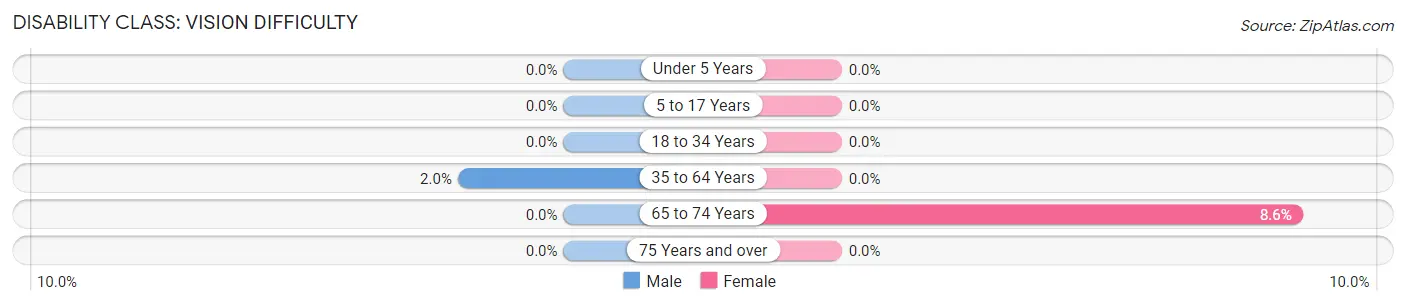
| Age Bracket | Male | Female |
| Under 5 Years | 0 (0.0%) | 0 (0.0%) |
| 5 to 17 Years | 0 (0.0%) | 0 (0.0%) |
| 18 to 34 Years | 0 (0.0%) | 0 (0.0%) |
| 35 to 64 Years | 4 (2.0%) | 0 (0.0%) |
| 65 to 74 Years | 0 (0.0%) | 6 (8.6%) |
| 75 Years and over | 0 (0.0%) | 0 (0.0%) |
Disability Class: Cognitive Difficulty
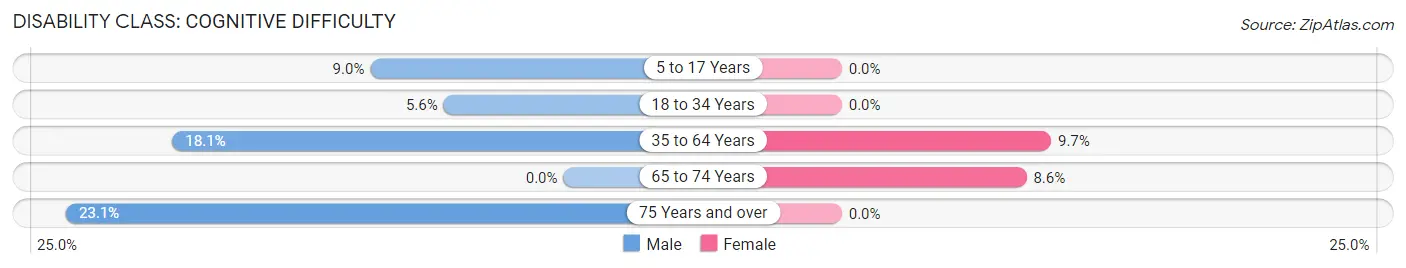
| Age Bracket | Male | Female |
| 5 to 17 Years | 6 (9.0%) | 0 (0.0%) |
| 18 to 34 Years | 7 (5.6%) | 0 (0.0%) |
| 35 to 64 Years | 37 (18.1%) | 20 (9.7%) |
| 65 to 74 Years | 0 (0.0%) | 6 (8.6%) |
| 75 Years and over | 6 (23.1%) | 0 (0.0%) |
Disability Class: Ambulatory Difficulty
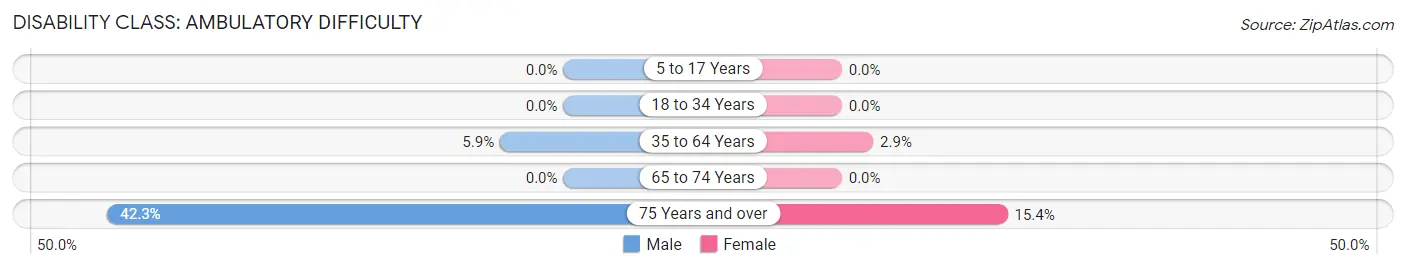
| Age Bracket | Male | Female |
| 5 to 17 Years | 0 (0.0%) | 0 (0.0%) |
| 18 to 34 Years | 0 (0.0%) | 0 (0.0%) |
| 35 to 64 Years | 12 (5.9%) | 6 (2.9%) |
| 65 to 74 Years | 0 (0.0%) | 0 (0.0%) |
| 75 Years and over | 11 (42.3%) | 4 (15.4%) |
Disability Class: Self-Care Difficulty
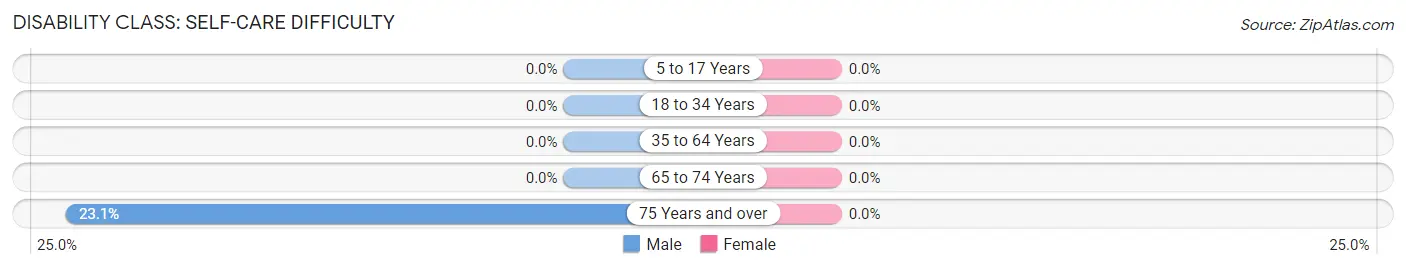
| Age Bracket | Male | Female |
| 5 to 17 Years | 0 (0.0%) | 0 (0.0%) |
| 18 to 34 Years | 0 (0.0%) | 0 (0.0%) |
| 35 to 64 Years | 0 (0.0%) | 0 (0.0%) |
| 65 to 74 Years | 0 (0.0%) | 0 (0.0%) |
| 75 Years and over | 6 (23.1%) | 0 (0.0%) |
Technology Access in Pine Plains
Computing Device Access in Pine Plains
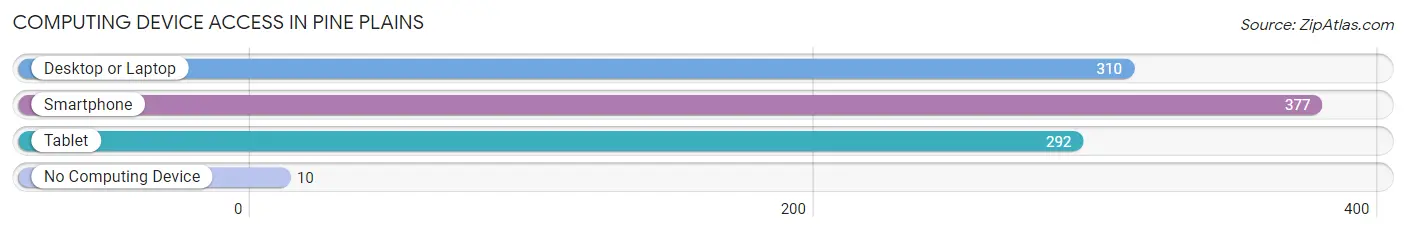
| Device Type | # Households | % Households |
| Desktop or Laptop | 310 | 74.3% |
| Smartphone | 377 | 90.4% |
| Tablet | 292 | 70.0% |
| No Computing Device | 10 | 2.4% |
| Total | 417 | 100.0% |
Internet Access in Pine Plains
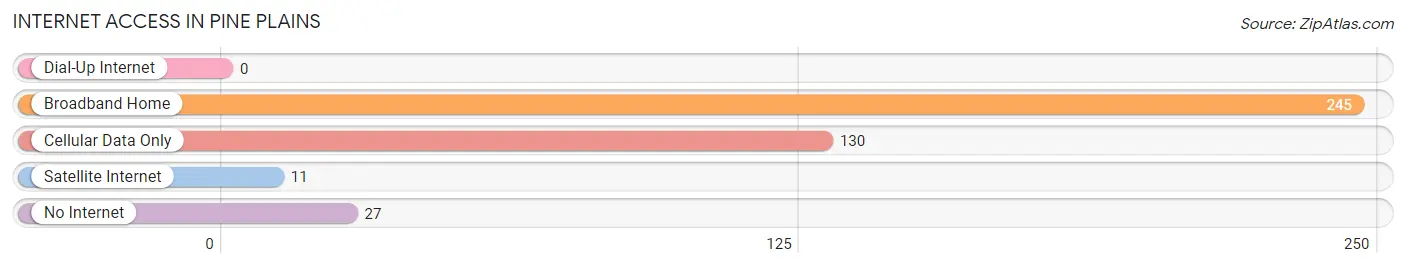
| Internet Type | # Households | % Households |
| Dial-Up Internet | 0 | 0.0% |
| Broadband Home | 245 | 58.8% |
| Cellular Data Only | 130 | 31.2% |
| Satellite Internet | 11 | 2.6% |
| No Internet | 27 | 6.5% |
| Total | 417 | 100.0% |
Pine Plains Summary
Pine Plains is a small town located in Dutchess County, New York, United States. It is situated in the Hudson Valley region, approximately 90 miles north of New York City. The town is bordered by the towns of Milan, North East, Amenia, and Stanford. The population of Pine Plains was 1,743 at the 2010 census.
History
The area that is now Pine Plains was originally inhabited by the Wappinger Indians. The first European settlers arrived in the area in the late 17th century. The town was established in 1788 and was originally part of the town of North East. In 1823, the town of Pine Plains was officially established.
The town was named after the abundance of pine trees in the area. The town was an agricultural community and was known for its dairy farms. In the late 19th century, the town was home to several factories, including a paper mill, a sawmill, and a gristmill.
Geography
Pine Plains is located in the Hudson Valley region of New York. The town is situated in the Taconic Mountains and is bordered by the towns of Milan, North East, Amenia, and Stanford. The town has a total area of 33.2 square miles, of which 33.1 square miles is land and 0.1 square miles is water.
The town is located in the Hudson River watershed and is home to several creeks and streams, including the Wappinger Creek, the Ten Mile River, and the Roeliff Jansen Kill. The highest point in the town is 1,890 feet above sea level.
Economy
The economy of Pine Plains is largely based on agriculture. The town is home to several dairy farms and is known for its production of milk, cheese, and other dairy products. The town is also home to several wineries and vineyards.
The town is also home to several small businesses, including restaurants, retail stores, and professional services. The town is also home to several small manufacturing companies.
Demographics
As of the 2010 census, the population of Pine Plains was 1,743. The racial makeup of the town was 94.3% White, 2.2% African American, 0.3% Native American, 0.7% Asian, 0.1% Pacific Islander, 0.7% from other races, and 1.7% from two or more races. Hispanic or Latino of any race were 3.2% of the population.
The median household income in the town was $50,938 and the median family income was $60,000. The per capita income in the town was $25,945. About 8.3% of the population was below the poverty line.
The town is served by the Pine Plains Central School District. The district consists of two elementary schools, one middle school, and one high school. The town is also home to several private schools, including Stissing Mountain High School and St. Joseph's Catholic School.
Common Questions
What is Per Capita Income in Pine Plains?
Per Capita income in Pine Plains is $38,254.
What is the Median Family Income in Pine Plains?
Median Family Income in Pine Plains is $73,897.
What is the Median Household income in Pine Plains?
Median Household Income in Pine Plains is $69,321.
What is Income or Wage Gap in Pine Plains?
Income or Wage Gap in Pine Plains is 7.7%.
Women in Pine Plains earn 92.3 cents for every dollar earned by a man.
What is Inequality or Gini Index in Pine Plains?
Inequality or Gini Index in Pine Plains is 0.44.
What is the Total Population of Pine Plains?
Total Population of Pine Plains is 994.
What is the Total Male Population of Pine Plains?
Total Male Population of Pine Plains is 489.
What is the Total Female Population of Pine Plains?
Total Female Population of Pine Plains is 505.
What is the Ratio of Males per 100 Females in Pine Plains?
There are 96.83 Males per 100 Females in Pine Plains.
What is the Ratio of Females per 100 Males in Pine Plains?
There are 103.27 Females per 100 Males in Pine Plains.
What is the Median Population Age in Pine Plains?
Median Population Age in Pine Plains is 42.7 Years.
What is the Average Family Size in Pine Plains
Average Family Size in Pine Plains is 2.8 People.
What is the Average Household Size in Pine Plains
Average Household Size in Pine Plains is 2.4 People.
How Large is the Labor Force in Pine Plains?
There are 514 People in the Labor Forcein in Pine Plains.
What is the Percentage of People in the Labor Force in Pine Plains?
61.8% of People are in the Labor Force in Pine Plains.
What is the Unemployment Rate in Pine Plains?
Unemployment Rate in Pine Plains is 0.8%.