Spencerport, NY Map & Demographics
Spencerport Map
Spencerport Overview
$40,619
PER CAPITA INCOME
$97,153
AVG FAMILY INCOME
$77,500
AVG HOUSEHOLD INCOME
17.3%
WAGE / INCOME GAP [ % ]
82.7¢/ $1
WAGE / INCOME GAP [ $ ]
0.40
INEQUALITY / GINI INDEX
3,670
TOTAL POPULATION
1,849
MALE POPULATION
1,821
FEMALE POPULATION
101.54
MALES / 100 FEMALES
98.49
FEMALES / 100 MALES
46.3
MEDIAN AGE
2.8
AVG FAMILY SIZE
2.3
AVG HOUSEHOLD SIZE
2,237
LABOR FORCE [ PEOPLE ]
70.8%
PERCENT IN LABOR FORCE
3.4%
UNEMPLOYMENT RATE
Spencerport Zip Codes
Spencerport Area Codes
Income in Spencerport
Income Overview in Spencerport
Per Capita Income in Spencerport is $40,619, while median incomes of families and households are $97,153 and $77,500 respectively.
| Characteristic | Number | Measure |
| Per Capita Income | 3,670 | $40,619 |
| Median Family Income | 1,079 | $97,153 |
| Mean Family Income | 1,079 | $101,834 |
| Median Household Income | 1,574 | $77,500 |
| Mean Household Income | 1,574 | $92,974 |
| Income Deficit | 1,079 | $0 |
| Wage / Income Gap (%) | 3,670 | 17.32% |
| Wage / Income Gap ($) | 3,670 | 82.68¢ per $1 |
| Gini / Inequality Index | 3,670 | 0.40 |
Earnings by Sex in Spencerport
Average Earnings in Spencerport are $50,099, $53,669 for men and $44,375 for women, a difference of 17.3%.
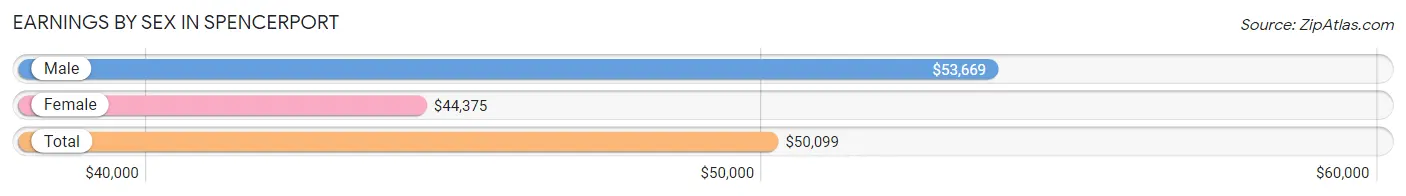
| Sex | Number | Average Earnings |
| Male | 1,155 (50.0%) | $53,669 |
| Female | 1,155 (50.0%) | $44,375 |
| Total | 2,310 (100.0%) | $50,099 |
Earnings by Sex by Income Bracket in Spencerport
The most common earnings brackets in Spencerport are $100,000+ for men (232 | 20.1%) and $50,000 to $54,999 for women (207 | 17.9%).
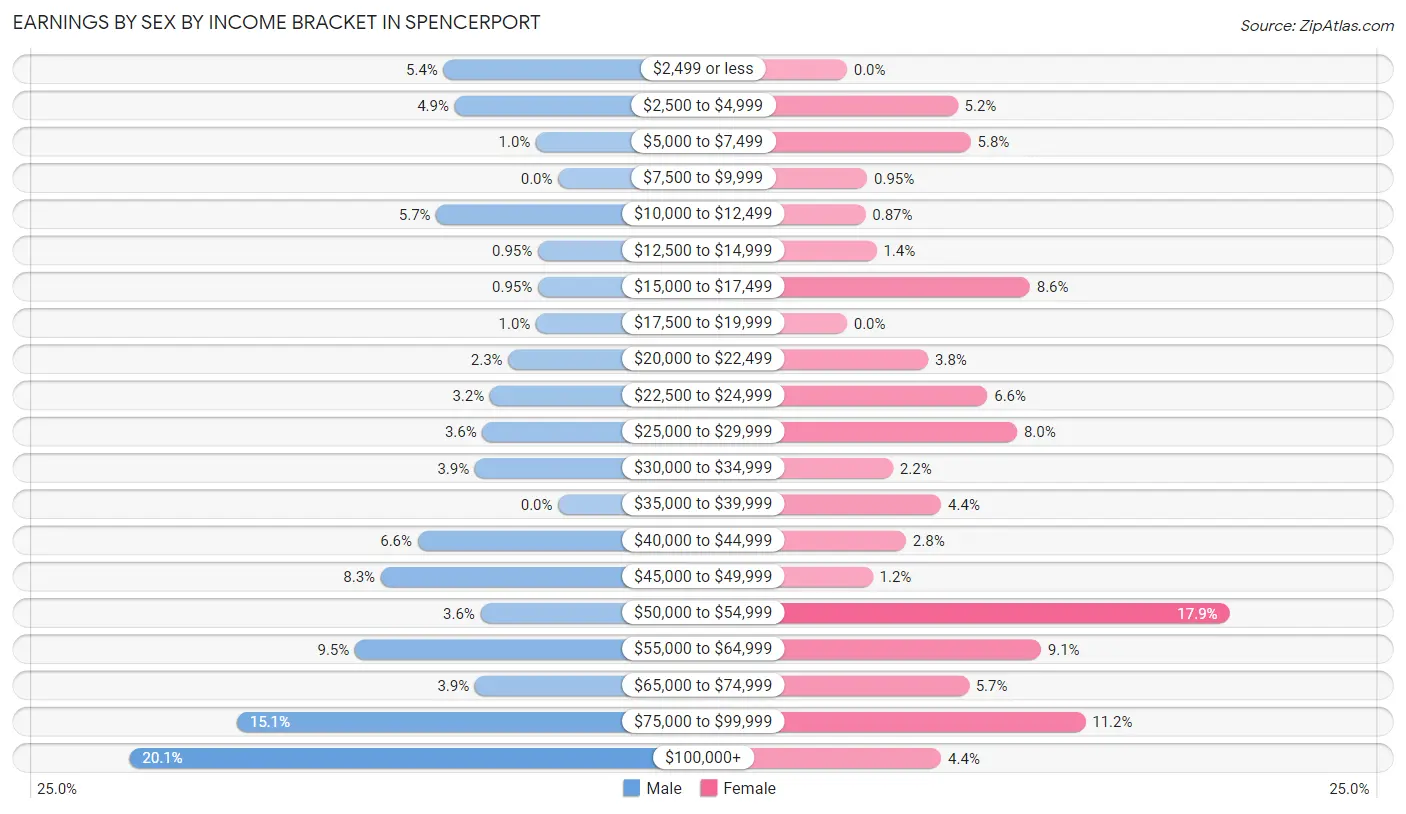
| Income | Male | Female |
| $2,499 or less | 62 (5.4%) | 0 (0.0%) |
| $2,500 to $4,999 | 56 (4.9%) | 60 (5.2%) |
| $5,000 to $7,499 | 12 (1.0%) | 67 (5.8%) |
| $7,500 to $9,999 | 0 (0.0%) | 11 (0.9%) |
| $10,000 to $12,499 | 66 (5.7%) | 10 (0.9%) |
| $12,500 to $14,999 | 11 (0.9%) | 16 (1.4%) |
| $15,000 to $17,499 | 11 (0.9%) | 99 (8.6%) |
| $17,500 to $19,999 | 12 (1.0%) | 0 (0.0%) |
| $20,000 to $22,499 | 27 (2.3%) | 44 (3.8%) |
| $22,500 to $24,999 | 37 (3.2%) | 76 (6.6%) |
| $25,000 to $29,999 | 41 (3.5%) | 92 (8.0%) |
| $30,000 to $34,999 | 45 (3.9%) | 25 (2.2%) |
| $35,000 to $39,999 | 0 (0.0%) | 51 (4.4%) |
| $40,000 to $44,999 | 76 (6.6%) | 32 (2.8%) |
| $45,000 to $49,999 | 96 (8.3%) | 14 (1.2%) |
| $50,000 to $54,999 | 42 (3.6%) | 207 (17.9%) |
| $55,000 to $64,999 | 110 (9.5%) | 105 (9.1%) |
| $65,000 to $74,999 | 45 (3.9%) | 66 (5.7%) |
| $75,000 to $99,999 | 174 (15.1%) | 129 (11.2%) |
| $100,000+ | 232 (20.1%) | 51 (4.4%) |
| Total | 1,155 (100.0%) | 1,155 (100.0%) |
Earnings by Sex by Educational Attainment in Spencerport
Average earnings in Spencerport are $62,791 for men and $51,471 for women, a difference of 18.0%. Men with an educational attainment of bachelor's degree enjoy the highest average annual earnings of $102,885, while those with high school diploma education earn the least with $42,738. Women with an educational attainment of graduate degree earn the most with the average annual earnings of $55,550, while those with college or associate's degree education have the smallest earnings of $43,077.
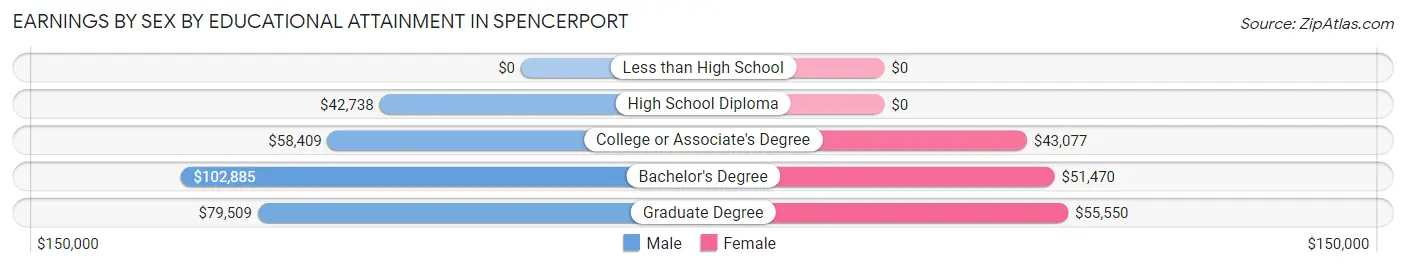
| Educational Attainment | Male Income | Female Income |
| Less than High School | - | - |
| High School Diploma | $42,738 | $0 |
| College or Associate's Degree | $58,409 | $43,077 |
| Bachelor's Degree | $102,885 | $51,470 |
| Graduate Degree | $79,509 | $55,550 |
| Total | $62,791 | $51,471 |
Family Income in Spencerport
Family Income Brackets in Spencerport
According to the Spencerport family income data, there are 338 families falling into the $100,000 to $149,999 income range, which is the most common income bracket and makes up 31.3% of all families.
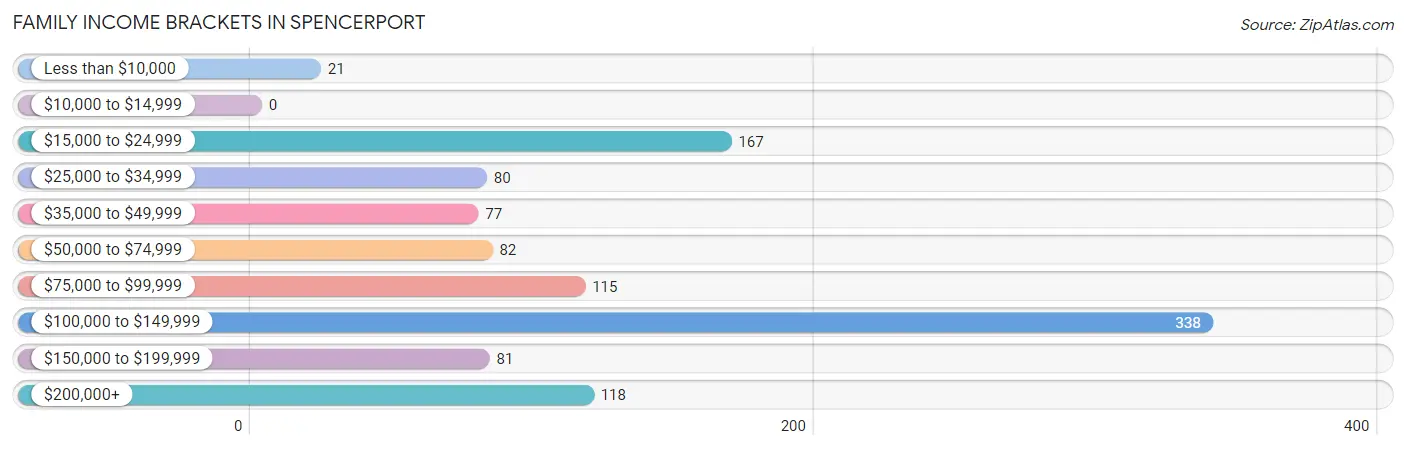
| Income Bracket | # Families | % Families |
| Less than $10,000 | 21 | 1.9% |
| $10,000 to $14,999 | 0 | 0.0% |
| $15,000 to $24,999 | 167 | 15.5% |
| $25,000 to $34,999 | 80 | 7.4% |
| $35,000 to $49,999 | 77 | 7.1% |
| $50,000 to $74,999 | 82 | 7.6% |
| $75,000 to $99,999 | 115 | 10.7% |
| $100,000 to $149,999 | 338 | 31.3% |
| $150,000 to $199,999 | 81 | 7.5% |
| $200,000+ | 118 | 10.9% |
Family Income by Famaliy Size in Spencerport
5-person families (81 | 7.5%) account for the highest median family income in Spencerport with $250,001 per family, while 5-person families (81 | 7.5%) have the highest median income of $50,000 per family member.
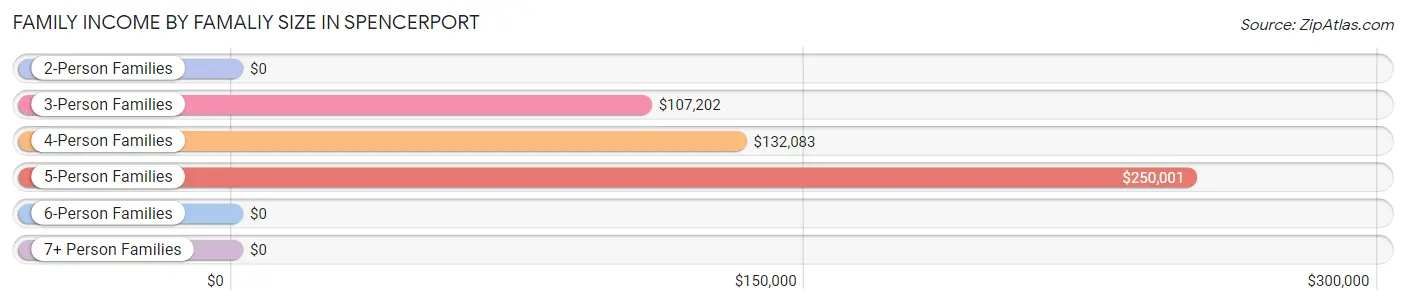
| Income Bracket | # Families | Median Income |
| 2-Person Families | 631 (58.5%) | $0 |
| 3-Person Families | 241 (22.3%) | $107,202 |
| 4-Person Families | 114 (10.6%) | $132,083 |
| 5-Person Families | 81 (7.5%) | $250,001 |
| 6-Person Families | 12 (1.1%) | $0 |
| 7+ Person Families | 0 (0.0%) | $0 |
| Total | 1,079 (100.0%) | $97,153 |
Family Income by Number of Earners in Spencerport
The median family income in Spencerport is $97,153, with families comprising 3+ earners (161) having the highest median family income of $159,712, while families with no earners (199) have the lowest median family income of $24,107, accounting for 14.9% and 18.4% of families, respectively.
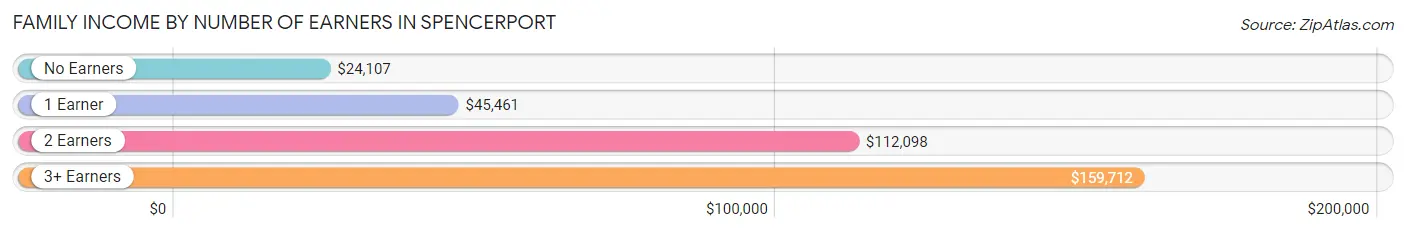
| Number of Earners | # Families | Median Income |
| No Earners | 199 (18.4%) | $24,107 |
| 1 Earner | 258 (23.9%) | $45,461 |
| 2 Earners | 461 (42.7%) | $112,098 |
| 3+ Earners | 161 (14.9%) | $159,712 |
| Total | 1,079 (100.0%) | $97,153 |
Household Income in Spencerport
Household Income Brackets in Spencerport
With 411 households falling in the category, the $100,000 to $149,999 income range is the most frequent in Spencerport, accounting for 26.1% of all households. In contrast, only 14 households (0.9%) fall into the $10,000 to $14,999 income bracket, making it the least populous group.
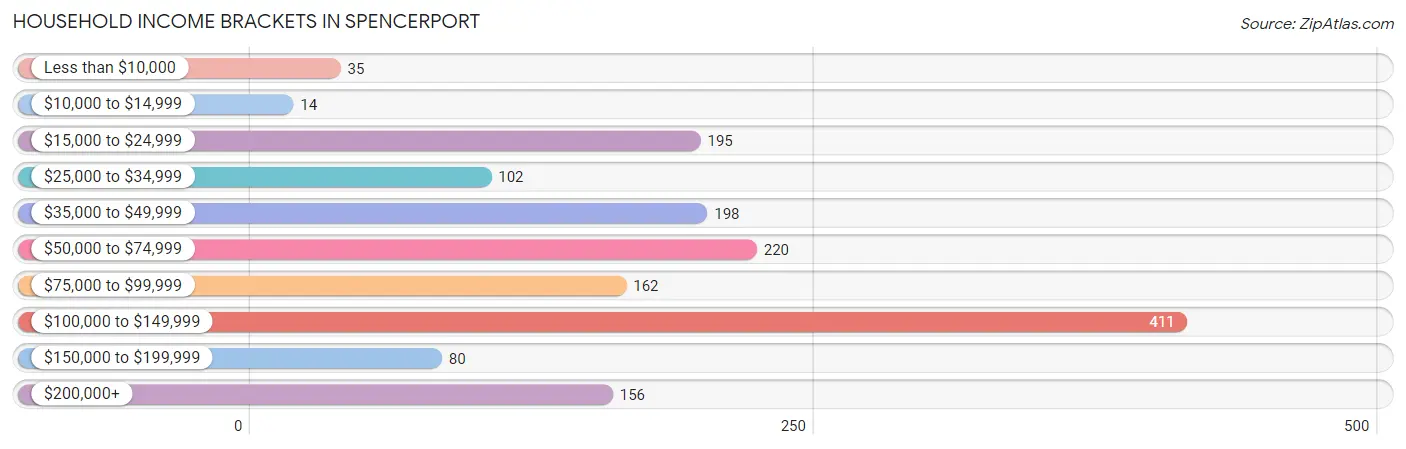
| Income Bracket | # Households | % Households |
| Less than $10,000 | 35 | 2.2% |
| $10,000 to $14,999 | 14 | 0.9% |
| $15,000 to $24,999 | 195 | 12.4% |
| $25,000 to $34,999 | 102 | 6.5% |
| $35,000 to $49,999 | 198 | 12.6% |
| $50,000 to $74,999 | 220 | 14.0% |
| $75,000 to $99,999 | 162 | 10.3% |
| $100,000 to $149,999 | 411 | 26.1% |
| $150,000 to $199,999 | 80 | 5.1% |
| $200,000+ | 156 | 9.9% |
Household Income by Householder Age in Spencerport
The median household income in Spencerport is $77,500, with the highest median household income of $110,446 found in the 45 to 64 years age bracket for the primary householder. A total of 628 households (39.9%) fall into this category.
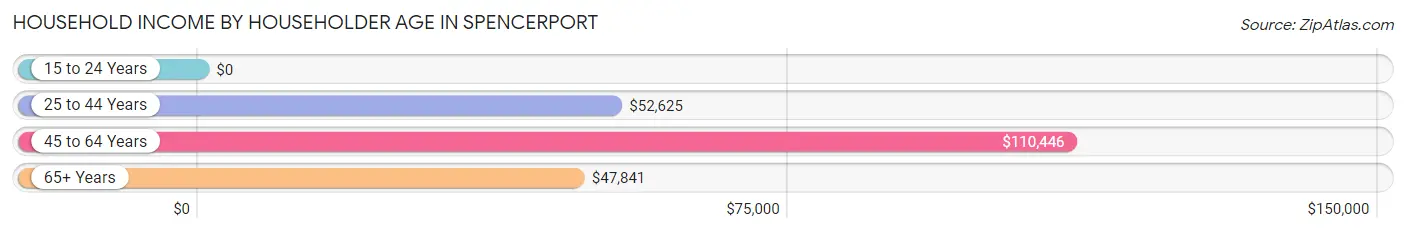
| Income Bracket | # Households | Median Income |
| 15 to 24 Years | 0 (0.0%) | $0 |
| 25 to 44 Years | 521 (33.1%) | $52,625 |
| 45 to 64 Years | 628 (39.9%) | $110,446 |
| 65+ Years | 425 (27.0%) | $47,841 |
| Total | 1,574 (100.0%) | $77,500 |
Poverty in Spencerport
Income Below Poverty by Sex and Age in Spencerport
With 5.7% poverty level for males and 5.1% for females among the residents of Spencerport, 15 year old males and 25 to 34 year old females are the most vulnerable to poverty, with 10 males (100.0%) and 44 females (18.0%) in their respective age groups living below the poverty level.
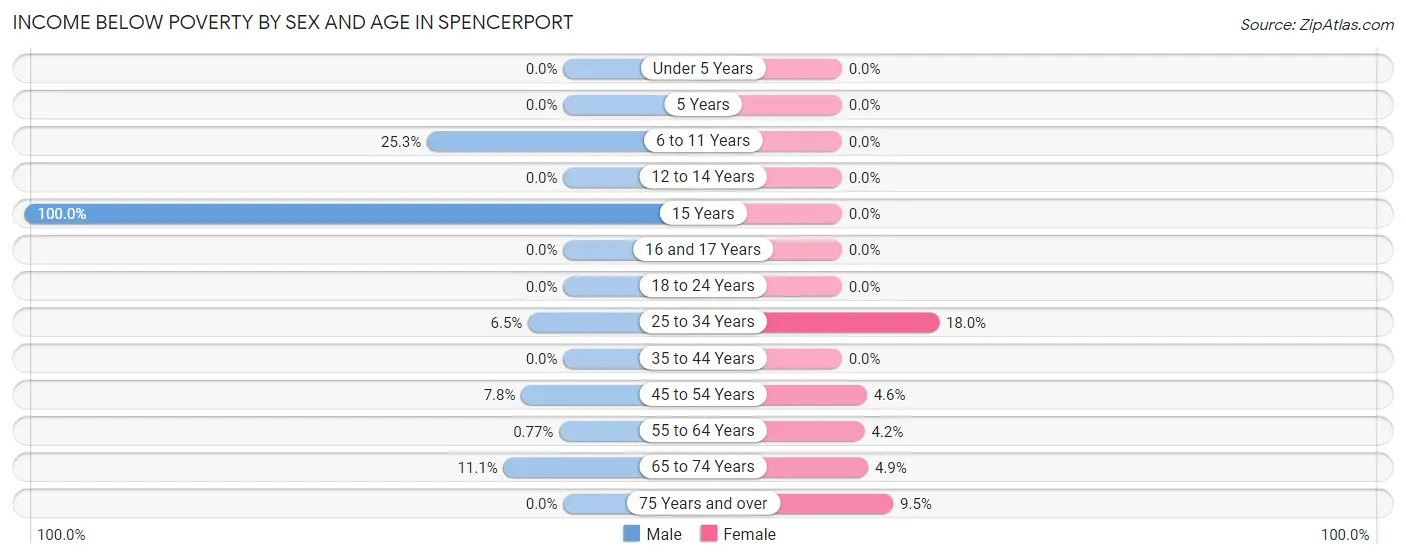
| Age Bracket | Male | Female |
| Under 5 Years | 0 (0.0%) | 0 (0.0%) |
| 5 Years | 0 (0.0%) | 0 (0.0%) |
| 6 to 11 Years | 42 (25.3%) | 0 (0.0%) |
| 12 to 14 Years | 0 (0.0%) | 0 (0.0%) |
| 15 Years | 10 (100.0%) | 0 (0.0%) |
| 16 and 17 Years | 0 (0.0%) | 0 (0.0%) |
| 18 to 24 Years | 0 (0.0%) | 0 (0.0%) |
| 25 to 34 Years | 13 (6.5%) | 44 (18.0%) |
| 35 to 44 Years | 0 (0.0%) | 0 (0.0%) |
| 45 to 54 Years | 16 (7.8%) | 11 (4.6%) |
| 55 to 64 Years | 3 (0.8%) | 13 (4.2%) |
| 65 to 74 Years | 21 (11.1%) | 9 (4.9%) |
| 75 Years and over | 0 (0.0%) | 16 (9.5%) |
| Total | 105 (5.7%) | 93 (5.1%) |
Income Above Poverty by Sex and Age in Spencerport
According to the poverty statistics in Spencerport, males aged under 5 years and females aged under 5 years are the age groups that are most secure financially, with 100.0% of males and 100.0% of females in these age groups living above the poverty line.
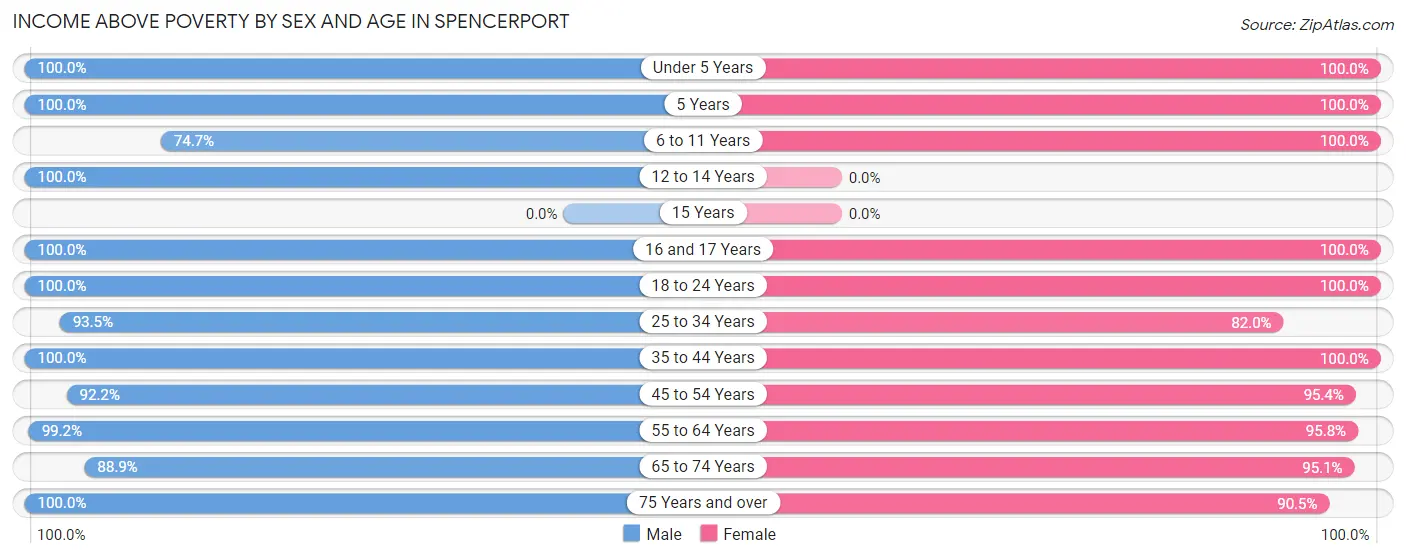
| Age Bracket | Male | Female |
| Under 5 Years | 59 (100.0%) | 84 (100.0%) |
| 5 Years | 10 (100.0%) | 20 (100.0%) |
| 6 to 11 Years | 124 (74.7%) | 103 (100.0%) |
| 12 to 14 Years | 58 (100.0%) | 0 (0.0%) |
| 15 Years | 0 (0.0%) | 0 (0.0%) |
| 16 and 17 Years | 108 (100.0%) | 46 (100.0%) |
| 18 to 24 Years | 115 (100.0%) | 176 (100.0%) |
| 25 to 34 Years | 186 (93.5%) | 200 (82.0%) |
| 35 to 44 Years | 155 (100.0%) | 238 (100.0%) |
| 45 to 54 Years | 189 (92.2%) | 227 (95.4%) |
| 55 to 64 Years | 389 (99.2%) | 296 (95.8%) |
| 65 to 74 Years | 168 (88.9%) | 176 (95.1%) |
| 75 Years and over | 178 (100.0%) | 152 (90.5%) |
| Total | 1,739 (94.3%) | 1,718 (94.9%) |
Income Below Poverty Among Married-Couple Families in Spencerport
The poverty statistics for married-couple families in Spencerport show that 2.4% or 21 of the total 879 families live below the poverty line. Families with 1 or 2 children have the highest poverty rate of 3.9%, comprising of 9 families. On the other hand, families with 3 or 4 children have the lowest poverty rate of 0.0%, which includes 0 families.
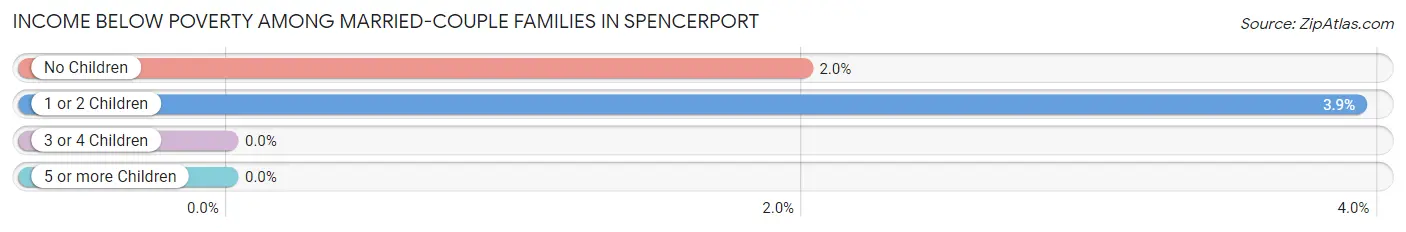
| Children | Above Poverty | Below Poverty |
| No Children | 587 (98.0%) | 12 (2.0%) |
| 1 or 2 Children | 220 (96.1%) | 9 (3.9%) |
| 3 or 4 Children | 51 (100.0%) | 0 (0.0%) |
| 5 or more Children | 0 (0.0%) | 0 (0.0%) |
| Total | 858 (97.6%) | 21 (2.4%) |
Income Below Poverty Among Single-Parent Households in Spencerport
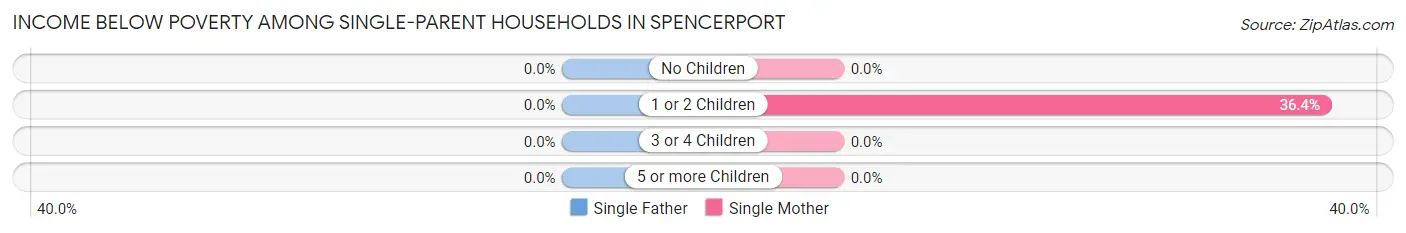
| Children | Single Father | Single Mother |
| No Children | 0 (0.0%) | 0 (0.0%) |
| 1 or 2 Children | 0 (0.0%) | 44 (36.4%) |
| 3 or 4 Children | 0 (0.0%) | 0 (0.0%) |
| 5 or more Children | 0 (0.0%) | 0 (0.0%) |
| Total | 0 (0.0%) | 44 (24.0%) |
Income Below Poverty Among Married-Couple vs Single-Parent Households in Spencerport
The poverty data for Spencerport shows that 21 of the married-couple family households (2.4%) and 44 of the single-parent households (22.0%) are living below the poverty level. Within the married-couple family households, those with 1 or 2 children have the highest poverty rate, with 9 households (3.9%) falling below the poverty line. Among the single-parent households, those with 1 or 2 children have the highest poverty rate, with 44 household (31.9%) living below poverty.
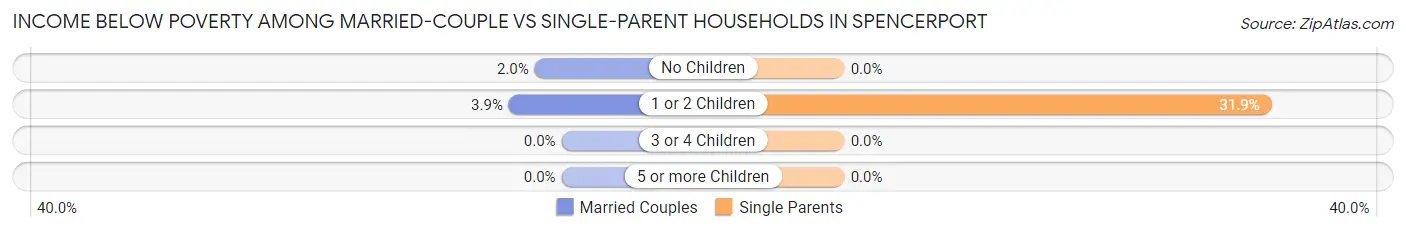
| Children | Married-Couple Families | Single-Parent Households |
| No Children | 12 (2.0%) | 0 (0.0%) |
| 1 or 2 Children | 9 (3.9%) | 44 (31.9%) |
| 3 or 4 Children | 0 (0.0%) | 0 (0.0%) |
| 5 or more Children | 0 (0.0%) | 0 (0.0%) |
| Total | 21 (2.4%) | 44 (22.0%) |
Race in Spencerport
The most populous races in Spencerport are White / Caucasian (3,299 | 89.9%), Two or more Races (232 | 6.3%), and Black / African American (87 | 2.4%).
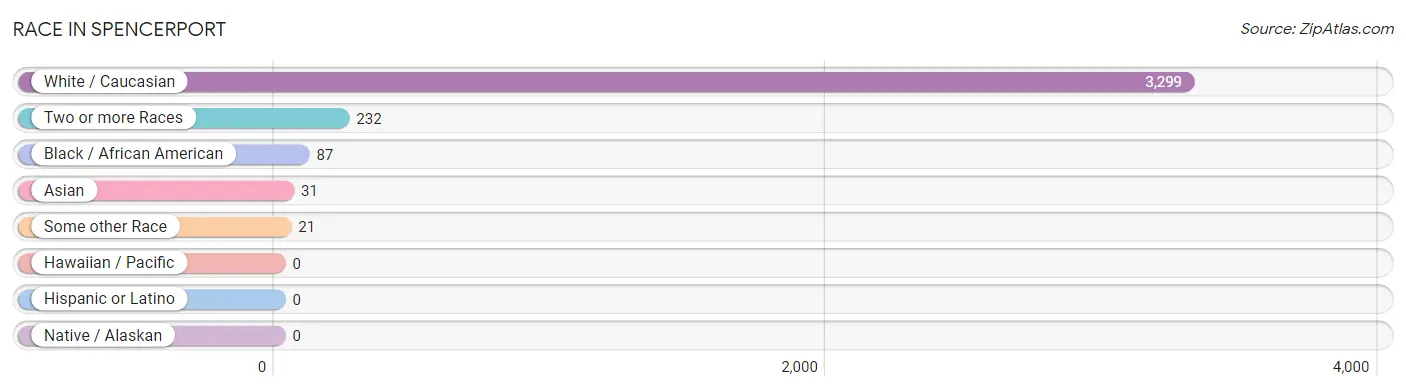
| Race | # Population | % Population |
| Asian | 31 | 0.8% |
| Black / African American | 87 | 2.4% |
| Hawaiian / Pacific | 0 | 0.0% |
| Hispanic or Latino | 0 | 0.0% |
| Native / Alaskan | 0 | 0.0% |
| White / Caucasian | 3,299 | 89.9% |
| Two or more Races | 232 | 6.3% |
| Some other Race | 21 | 0.6% |
| Total | 3,670 | 100.0% |
Ancestry in Spencerport
The most populous ancestries reported in Spencerport are German (850 | 23.2%), English (836 | 22.8%), Irish (712 | 19.4%), Italian (675 | 18.4%), and American (191 | 5.2%), together accounting for 88.9% of all Spencerport residents.
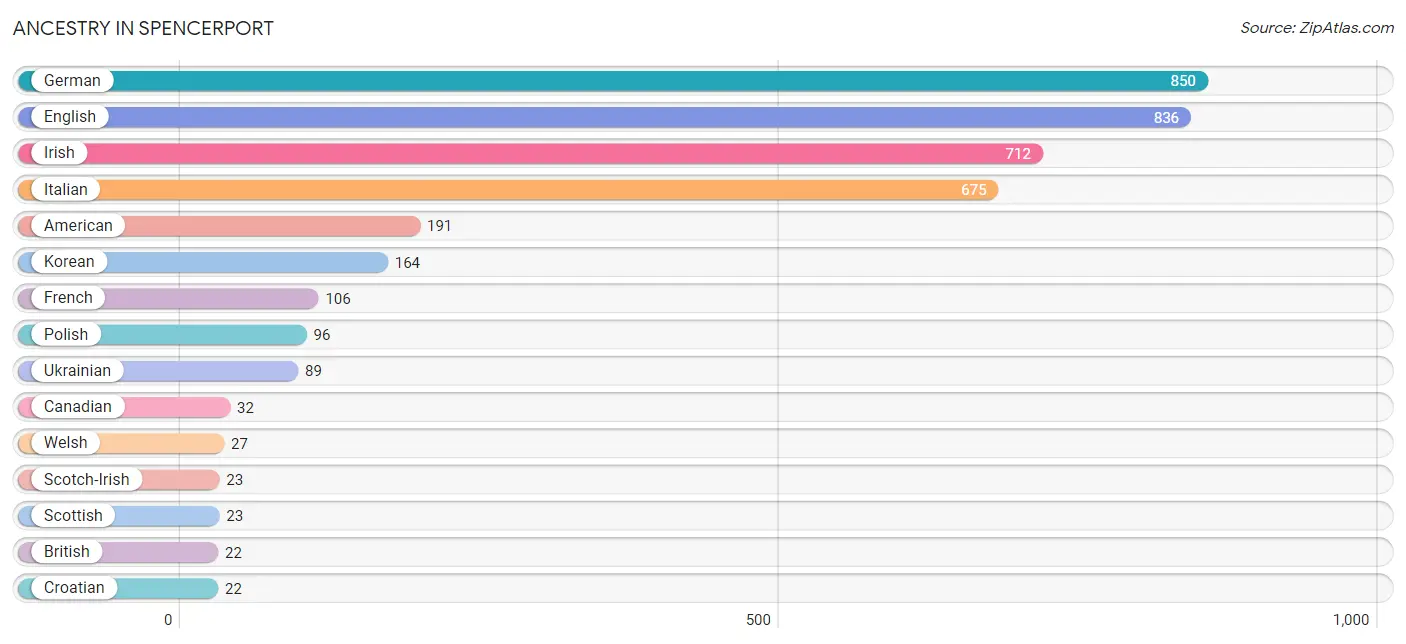
| Ancestry | # Population | % Population |
| Albanian | 17 | 0.5% |
| American | 191 | 5.2% |
| British | 22 | 0.6% |
| Canadian | 32 | 0.9% |
| Croatian | 22 | 0.6% |
| Dutch | 19 | 0.5% |
| Eastern European | 15 | 0.4% |
| English | 836 | 22.8% |
| French | 106 | 2.9% |
| French Canadian | 21 | 0.6% |
| German | 850 | 23.2% |
| Greek | 16 | 0.4% |
| Hungarian | 11 | 0.3% |
| Indian (Asian) | 21 | 0.6% |
| Irish | 712 | 19.4% |
| Italian | 675 | 18.4% |
| Korean | 164 | 4.5% |
| Malaysian | 10 | 0.3% |
| Nigerian | 1 | 0.0% |
| Norwegian | 21 | 0.6% |
| Polish | 96 | 2.6% |
| Scotch-Irish | 23 | 0.6% |
| Scottish | 23 | 0.6% |
| Subsaharan African | 1 | 0.0% |
| Swedish | 10 | 0.3% |
| Ukrainian | 89 | 2.4% |
| Welsh | 27 | 0.7% | View All 27 Rows |
Immigrants in Spencerport
The most numerous immigrant groups reported in Spencerport came from Asia (31 | 0.8%), China (21 | 0.6%), Eastern Asia (21 | 0.6%), Canada (17 | 0.5%), and Europe (16 | 0.4%), together accounting for 2.9% of all Spencerport residents.
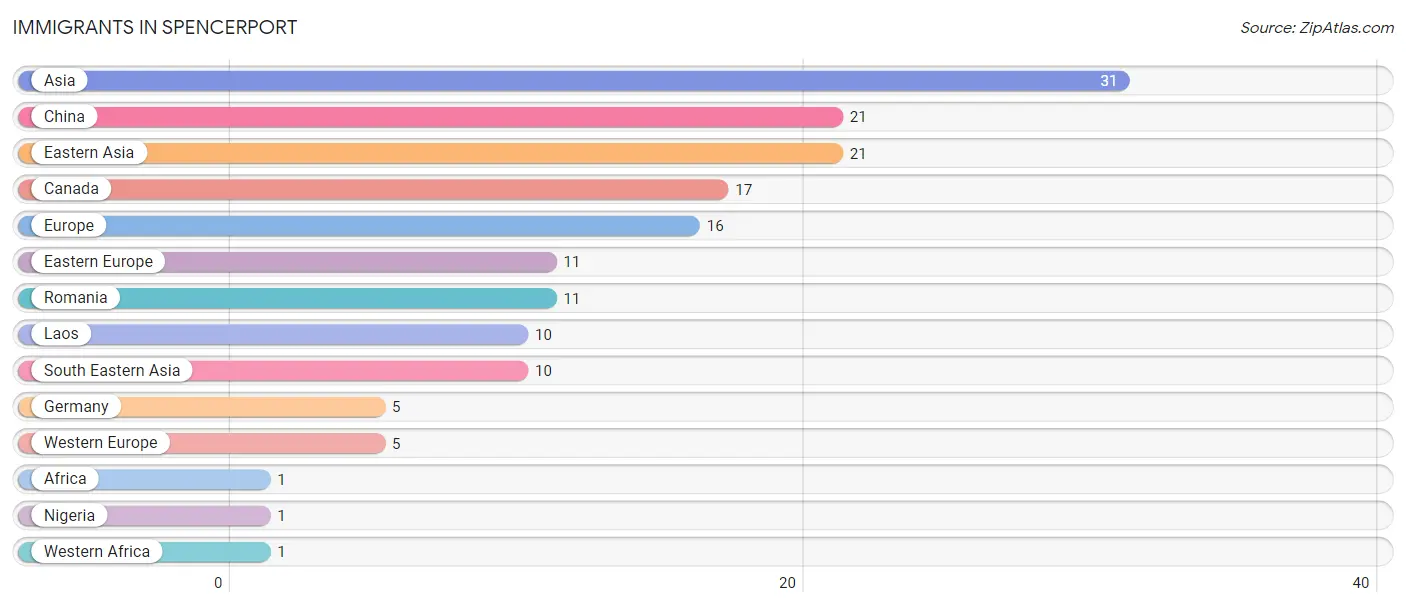
| Immigration Origin | # Population | % Population |
| Africa | 1 | 0.0% |
| Asia | 31 | 0.8% |
| Canada | 17 | 0.5% |
| China | 21 | 0.6% |
| Eastern Asia | 21 | 0.6% |
| Eastern Europe | 11 | 0.3% |
| Europe | 16 | 0.4% |
| Germany | 5 | 0.1% |
| Laos | 10 | 0.3% |
| Nigeria | 1 | 0.0% |
| Romania | 11 | 0.3% |
| South Eastern Asia | 10 | 0.3% |
| Western Africa | 1 | 0.0% |
| Western Europe | 5 | 0.1% | View All 14 Rows |
Sex and Age in Spencerport
Sex and Age in Spencerport
The most populous age groups in Spencerport are 55 to 59 Years (219 | 11.8%) for men and 50 to 54 Years (193 | 10.6%) for women.
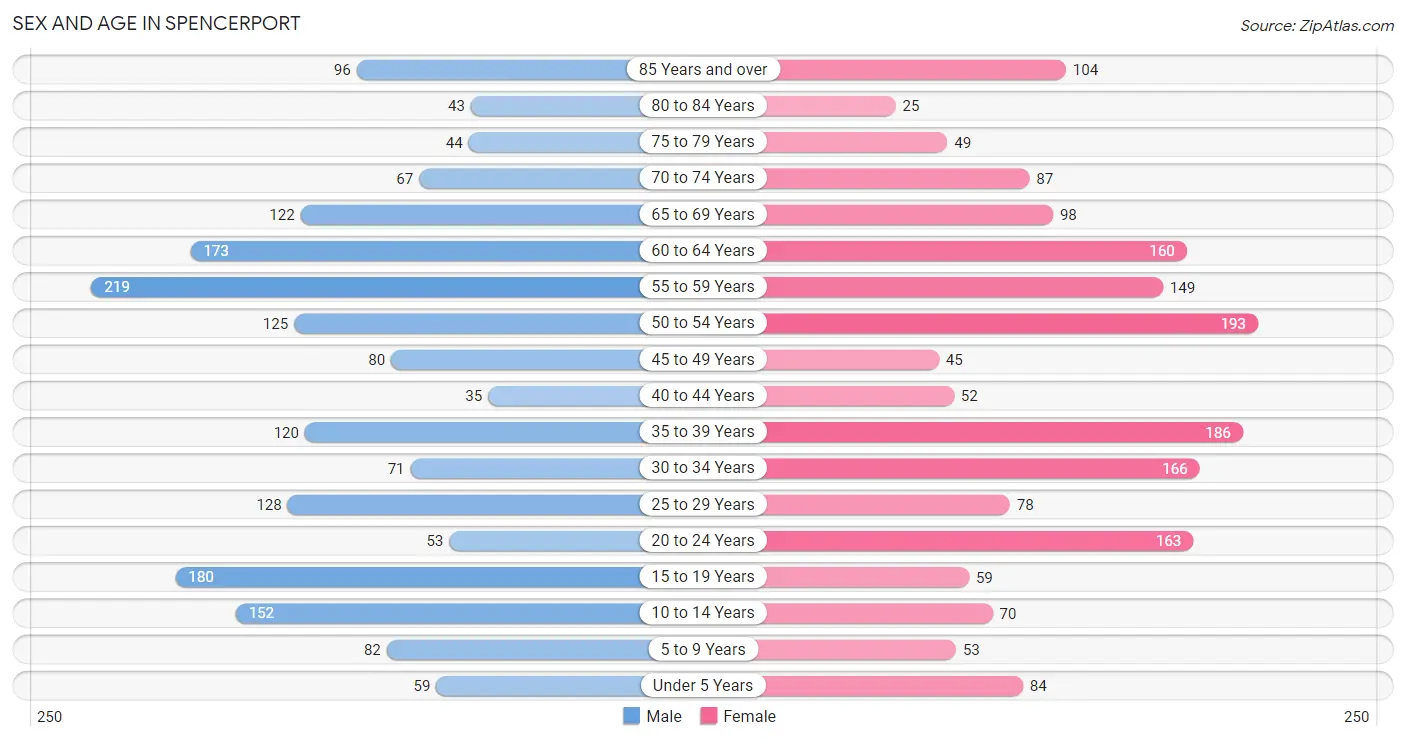
| Age Bracket | Male | Female |
| Under 5 Years | 59 (3.2%) | 84 (4.6%) |
| 5 to 9 Years | 82 (4.4%) | 53 (2.9%) |
| 10 to 14 Years | 152 (8.2%) | 70 (3.8%) |
| 15 to 19 Years | 180 (9.7%) | 59 (3.2%) |
| 20 to 24 Years | 53 (2.9%) | 163 (8.9%) |
| 25 to 29 Years | 128 (6.9%) | 78 (4.3%) |
| 30 to 34 Years | 71 (3.8%) | 166 (9.1%) |
| 35 to 39 Years | 120 (6.5%) | 186 (10.2%) |
| 40 to 44 Years | 35 (1.9%) | 52 (2.9%) |
| 45 to 49 Years | 80 (4.3%) | 45 (2.5%) |
| 50 to 54 Years | 125 (6.8%) | 193 (10.6%) |
| 55 to 59 Years | 219 (11.8%) | 149 (8.2%) |
| 60 to 64 Years | 173 (9.4%) | 160 (8.8%) |
| 65 to 69 Years | 122 (6.6%) | 98 (5.4%) |
| 70 to 74 Years | 67 (3.6%) | 87 (4.8%) |
| 75 to 79 Years | 44 (2.4%) | 49 (2.7%) |
| 80 to 84 Years | 43 (2.3%) | 25 (1.4%) |
| 85 Years and over | 96 (5.2%) | 104 (5.7%) |
| Total | 1,849 (100.0%) | 1,821 (100.0%) |
Families and Households in Spencerport
Median Family Size in Spencerport
The median family size in Spencerport is 2.75 persons per family, with single male/father families (17 | 1.6%) accounting for the largest median family size of 3.53 persons per family. On the other hand, single female/mother families (183 | 17.0%) represent the smallest median family size with 2.39 persons per family.
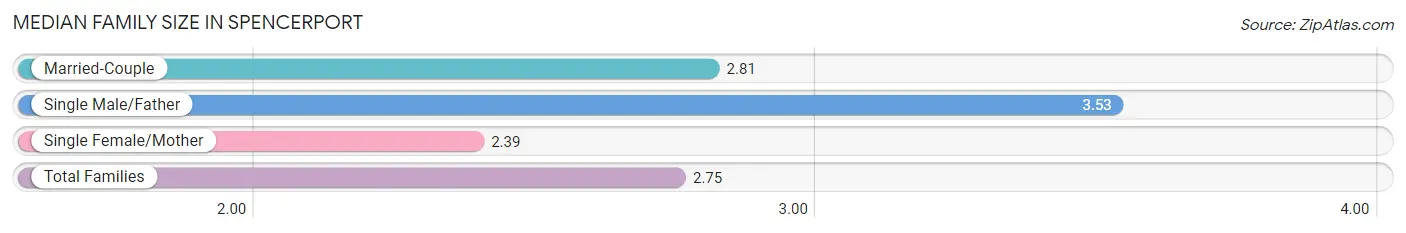
| Family Type | # Families | Family Size |
| Married-Couple | 879 (81.5%) | 2.81 |
| Single Male/Father | 17 (1.6%) | 3.53 |
| Single Female/Mother | 183 (17.0%) | 2.39 |
| Total Families | 1,079 (100.0%) | 2.75 |
Median Household Size in Spencerport
The median household size in Spencerport is 2.31 persons per household, with single male/father households (17 | 1.1%) accounting for the largest median household size of 3.53 persons per household. non-family households (495 | 31.5%) represent the smallest median household size with 1.31 persons per household.
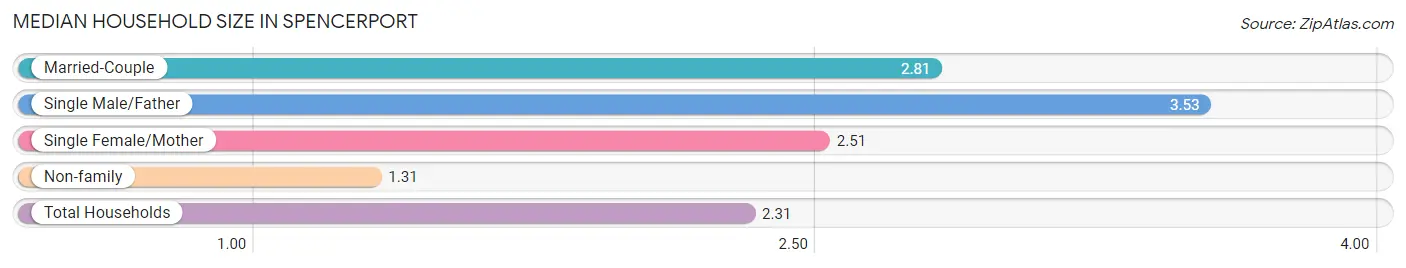
| Household Type | # Households | Household Size |
| Married-Couple | 879 (55.8%) | 2.81 |
| Single Male/Father | 17 (1.1%) | 3.53 |
| Single Female/Mother | 183 (11.6%) | 2.51 |
| Non-family | 495 (31.5%) | 1.31 |
| Total Households | 1,574 (100.0%) | 2.31 |
Household Size by Marriage Status in Spencerport
Out of a total of 1,574 households in Spencerport, 1,079 (68.5%) are family households, while 495 (31.5%) are nonfamily households. The most numerous type of family households are 2-person households, comprising 631, and the most common type of nonfamily households are 1-person households, comprising 397.
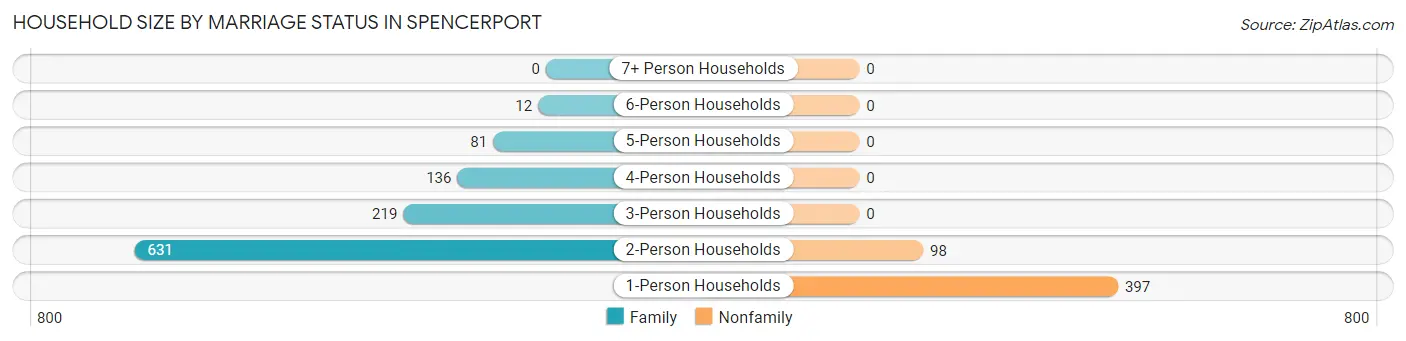
| Household Size | Family Households | Nonfamily Households |
| 1-Person Households | - | 397 (25.2%) |
| 2-Person Households | 631 (40.1%) | 98 (6.2%) |
| 3-Person Households | 219 (13.9%) | 0 (0.0%) |
| 4-Person Households | 136 (8.6%) | 0 (0.0%) |
| 5-Person Households | 81 (5.1%) | 0 (0.0%) |
| 6-Person Households | 12 (0.8%) | 0 (0.0%) |
| 7+ Person Households | 0 (0.0%) | 0 (0.0%) |
| Total | 1,079 (68.5%) | 495 (31.5%) |
Female Fertility in Spencerport
Fertility by Age in Spencerport
| Age Bracket | Women with Births | Births / 1,000 Women |
| 15 to 19 years | 0 (0.0%) | 0.0 |
| 20 to 34 years | 0 (0.0%) | 0.0 |
| 35 to 50 years | 0 (0.0%) | 0.0 |
| Total | 0 (0.0%) | 0.0 |
Fertility by Age by Marriage Status in Spencerport
| Age Bracket | Married | Unmarried |
| 15 to 19 years | 0 (0.0%) | 0 (0.0%) |
| 20 to 34 years | 0 (0.0%) | 0 (0.0%) |
| 35 to 50 years | 0 (0.0%) | 0 (0.0%) |
| Total | 0 (0.0%) | 0 (0.0%) |
Fertility by Education in Spencerport
| Educational Attainment | Women with Births | Births / 1,000 Women |
| Less than High School | 0 (0.0%) | 0.0 |
| High School Diploma | 0 (0.0%) | 0.0 |
| College or Associate's Degree | 0 (0.0%) | 0.0 |
| Bachelor's Degree | 0 (0.0%) | 0.0 |
| Graduate Degree | 0 (0.0%) | 0.0 |
| Total | 0 (0.0%) | 0.0 |
Fertility by Education by Marriage Status in Spencerport
| Educational Attainment | Married | Unmarried |
| Less than High School | 0 (0.0%) | 0 (0.0%) |
| High School Diploma | 0 (0.0%) | 0 (0.0%) |
| College or Associate's Degree | 0 (0.0%) | 0 (0.0%) |
| Bachelor's Degree | 0 (0.0%) | 0 (0.0%) |
| Graduate Degree | 0 (0.0%) | 0 (0.0%) |
| Total | 0 (0.0%) | 0 (0.0%) |
Employment Characteristics in Spencerport
Employment by Class of Employer in Spencerport
Among the 2,138 employed individuals in Spencerport, private company employees (1,259 | 58.9%), not-for-profit organizations (347 | 16.2%), and local government employees (242 | 11.3%) make up the most common classes of employment.
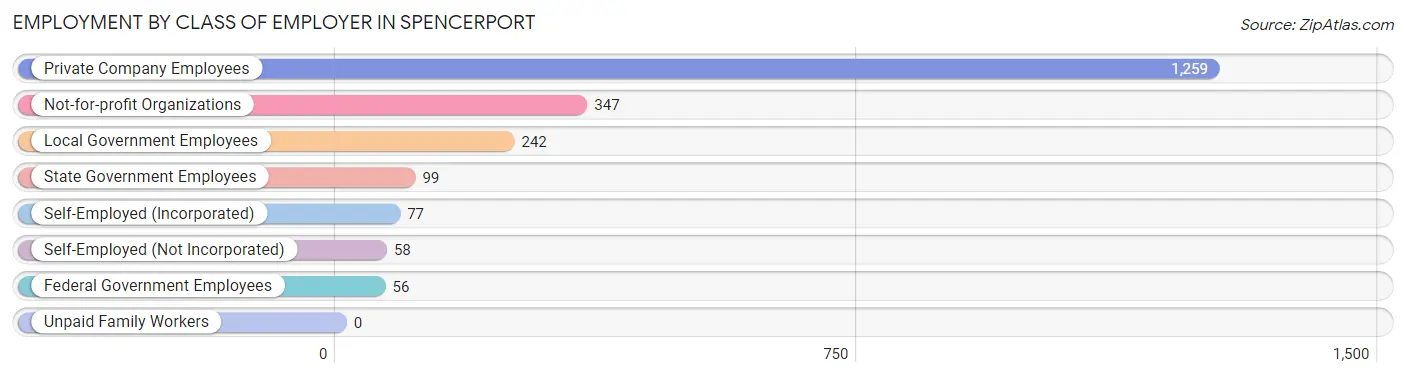
| Employer Class | # Employees | % Employees |
| Private Company Employees | 1,259 | 58.9% |
| Self-Employed (Incorporated) | 77 | 3.6% |
| Self-Employed (Not Incorporated) | 58 | 2.7% |
| Not-for-profit Organizations | 347 | 16.2% |
| Local Government Employees | 242 | 11.3% |
| State Government Employees | 99 | 4.6% |
| Federal Government Employees | 56 | 2.6% |
| Unpaid Family Workers | 0 | 0.0% |
| Total | 2,138 | 100.0% |
Employment Status by Age in Spencerport
According to the labor force statistics for Spencerport, out of the total population over 16 years of age (3,160), 70.8% or 2,237 individuals are in the labor force, with 3.4% or 76 of them unemployed. The age group with the highest labor force participation rate is 20 to 24 years, with 100.0% or 216 individuals in the labor force. Within the labor force, the 20 to 24 years age range has the highest percentage of unemployed individuals, with 15.3% or 33 of them being unemployed.
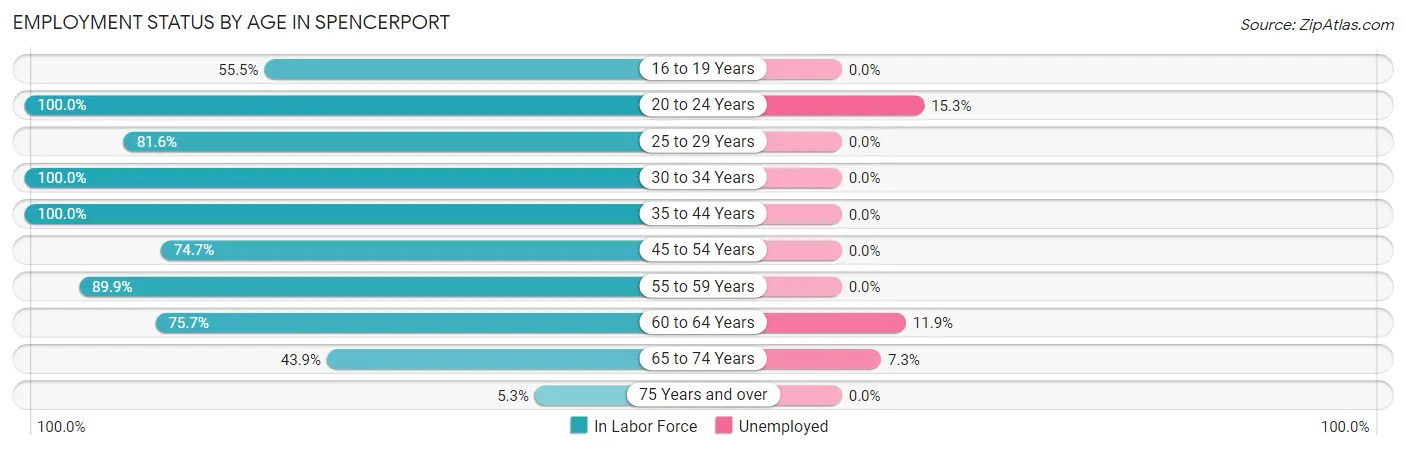
| Age Bracket | In Labor Force | Unemployed |
| 16 to 19 Years | 127 (55.5%) | 0 (0.0%) |
| 20 to 24 Years | 216 (100.0%) | 33 (15.3%) |
| 25 to 29 Years | 168 (81.6%) | 0 (0.0%) |
| 30 to 34 Years | 237 (100.0%) | 0 (0.0%) |
| 35 to 44 Years | 393 (100.0%) | 0 (0.0%) |
| 45 to 54 Years | 331 (74.7%) | 0 (0.0%) |
| 55 to 59 Years | 331 (89.9%) | 0 (0.0%) |
| 60 to 64 Years | 252 (75.7%) | 30 (11.9%) |
| 65 to 74 Years | 164 (43.9%) | 12 (7.3%) |
| 75 Years and over | 19 (5.3%) | 0 (0.0%) |
| Total | 2,237 (70.8%) | 76 (3.4%) |
Employment Status by Educational Attainment in Spencerport
According to labor force statistics for Spencerport, 86.5% of individuals (1,713) out of the total population between 25 and 64 years of age (1,980) are in the labor force, with 1.8% or 31 of them being unemployed. The group with the highest labor force participation rate are those with the educational attainment of bachelor's degree or higher, with 100.0% or 874 individuals in the labor force. Within the labor force, individuals with bachelor's degree or higher education have the highest percentage of unemployment, with 3.4% or 30 of them being unemployed.
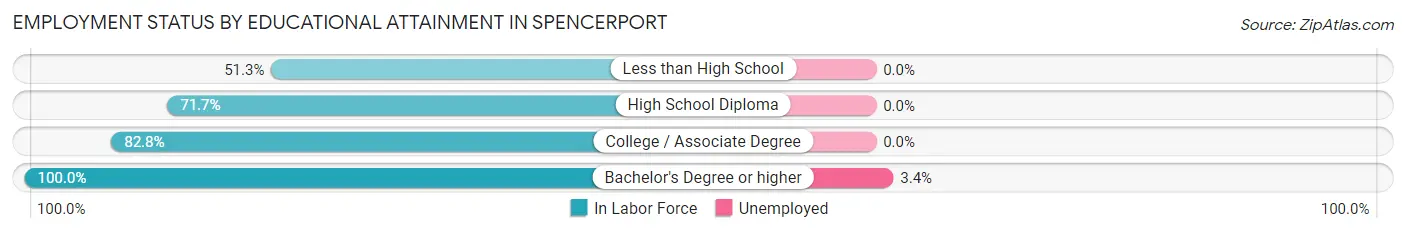
| Educational Attainment | In Labor Force | Unemployed |
| Less than High School | 41 (51.3%) | 0 (0.0%) |
| High School Diploma | 339 (71.7%) | 0 (0.0%) |
| College / Associate Degree | 458 (82.8%) | 0 (0.0%) |
| Bachelor's Degree or higher | 874 (100.0%) | 30 (3.4%) |
| Total | 1,713 (86.5%) | 36 (1.8%) |
Employment Occupations by Sex in Spencerport
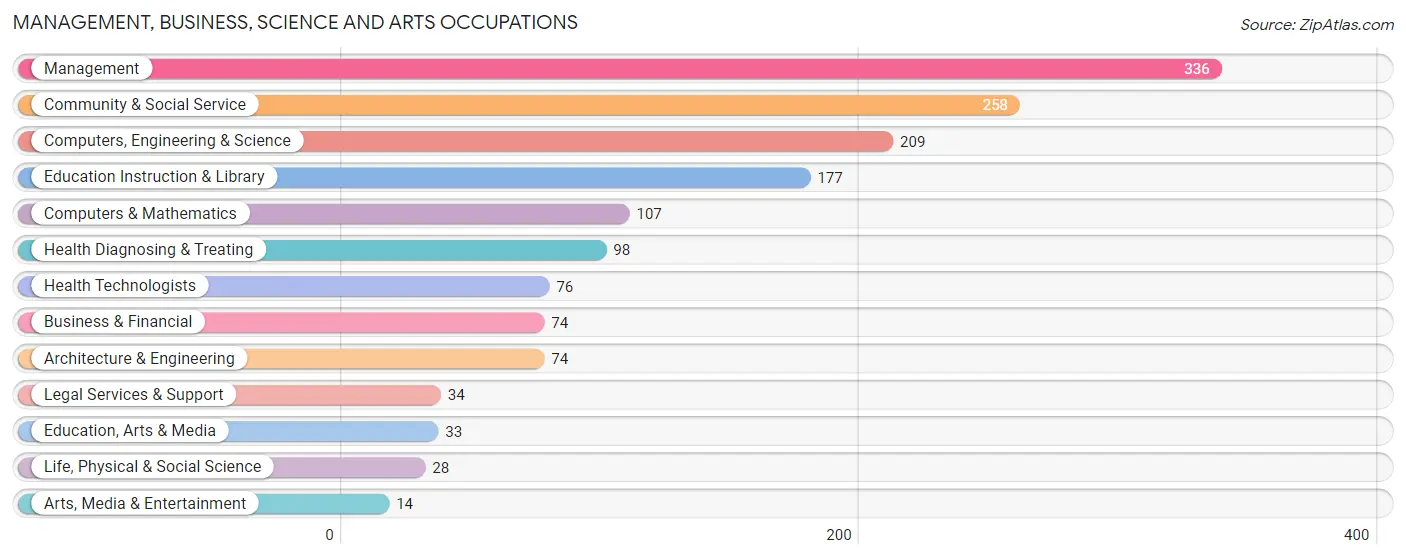
Management, Business, Science and Arts Occupations
The most common Management, Business, Science and Arts occupations in Spencerport are Management (336 | 15.5%), Community & Social Service (258 | 11.9%), Computers, Engineering & Science (209 | 9.7%), Education Instruction & Library (177 | 8.2%), and Computers & Mathematics (107 | 5.0%).
Management, Business, Science and Arts Occupations by Sex
Within the Management, Business, Science and Arts occupations in Spencerport, the most male-oriented occupations are Architecture & Engineering (100.0%), Computers & Mathematics (90.6%), and Computers, Engineering & Science (81.8%), while the most female-oriented occupations are Life, Physical & Social Science (100.0%), Legal Services & Support (100.0%), and Education Instruction & Library (100.0%).
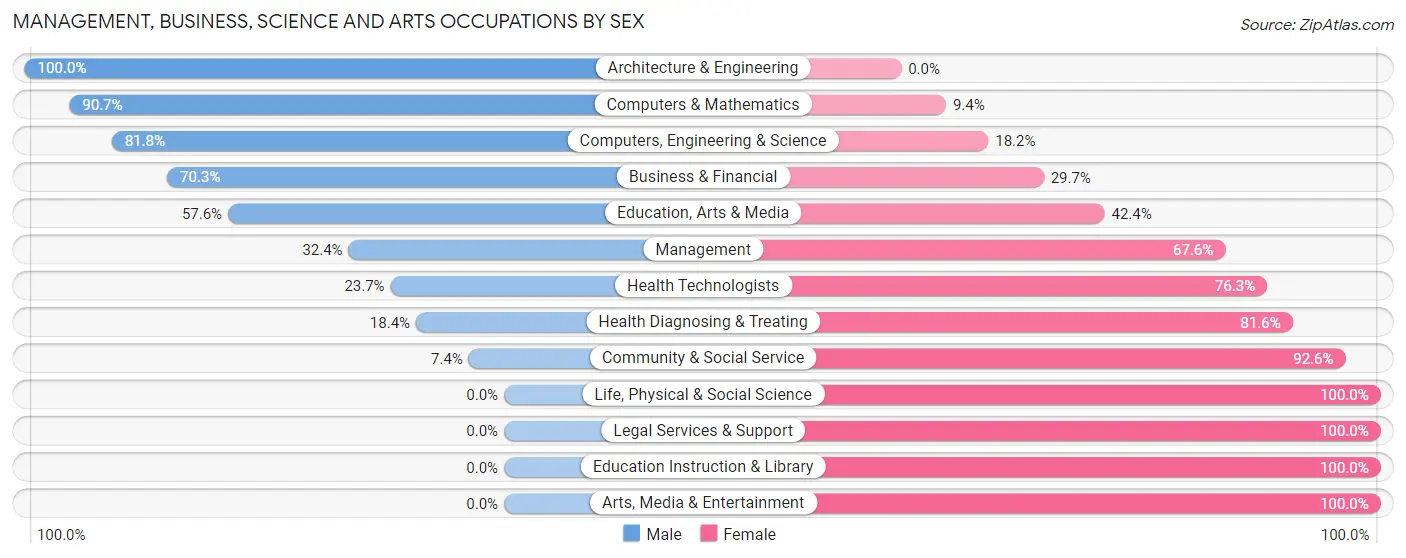
| Occupation | Male | Female |
| Management | 109 (32.4%) | 227 (67.6%) |
| Business & Financial | 52 (70.3%) | 22 (29.7%) |
| Computers, Engineering & Science | 171 (81.8%) | 38 (18.2%) |
| Computers & Mathematics | 97 (90.6%) | 10 (9.3%) |
| Architecture & Engineering | 74 (100.0%) | 0 (0.0%) |
| Life, Physical & Social Science | 0 (0.0%) | 28 (100.0%) |
| Community & Social Service | 19 (7.4%) | 239 (92.6%) |
| Education, Arts & Media | 19 (57.6%) | 14 (42.4%) |
| Legal Services & Support | 0 (0.0%) | 34 (100.0%) |
| Education Instruction & Library | 0 (0.0%) | 177 (100.0%) |
| Arts, Media & Entertainment | 0 (0.0%) | 14 (100.0%) |
| Health Diagnosing & Treating | 18 (18.4%) | 80 (81.6%) |
| Health Technologists | 18 (23.7%) | 58 (76.3%) |
| Total (Category) | 369 (37.9%) | 606 (62.2%) |
| Total (Overall) | 1,075 (49.7%) | 1,088 (50.3%) |
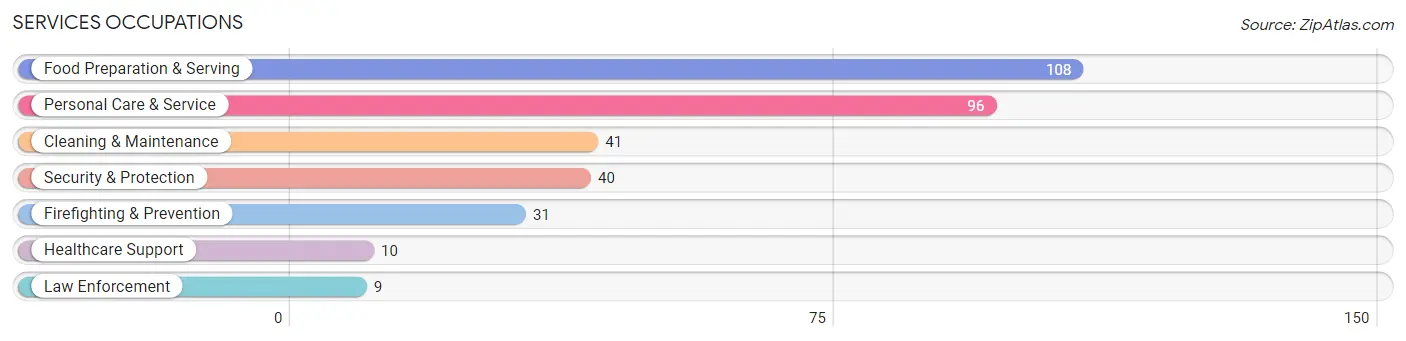
Services Occupations
The most common Services occupations in Spencerport are Food Preparation & Serving (108 | 5.0%), Personal Care & Service (96 | 4.4%), Cleaning & Maintenance (41 | 1.9%), Security & Protection (40 | 1.8%), and Firefighting & Prevention (31 | 1.4%).
Services Occupations by Sex
Within the Services occupations in Spencerport, the most male-oriented occupations are Security & Protection (100.0%), Firefighting & Prevention (100.0%), and Law Enforcement (100.0%), while the most female-oriented occupations are Healthcare Support (100.0%), Personal Care & Service (84.4%), and Food Preparation & Serving (24.1%).
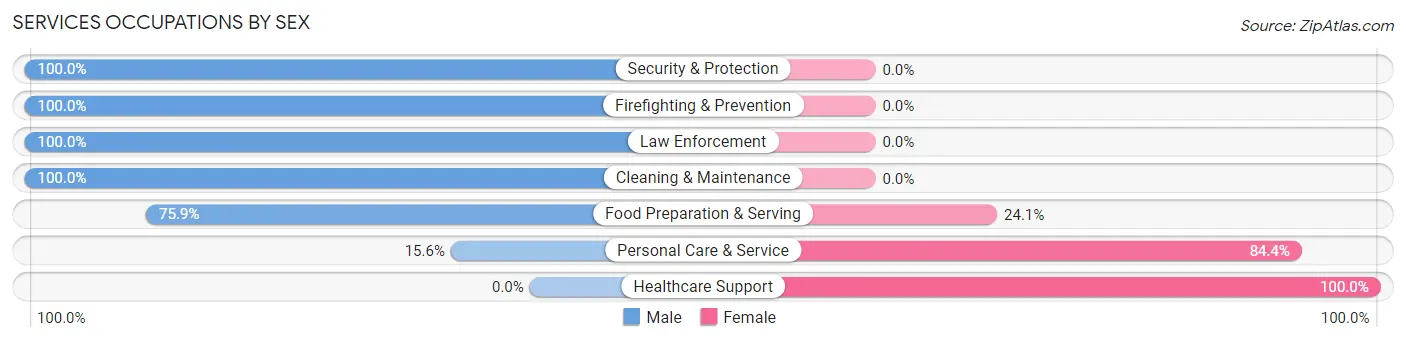
| Occupation | Male | Female |
| Healthcare Support | 0 (0.0%) | 10 (100.0%) |
| Security & Protection | 40 (100.0%) | 0 (0.0%) |
| Firefighting & Prevention | 31 (100.0%) | 0 (0.0%) |
| Law Enforcement | 9 (100.0%) | 0 (0.0%) |
| Food Preparation & Serving | 82 (75.9%) | 26 (24.1%) |
| Cleaning & Maintenance | 41 (100.0%) | 0 (0.0%) |
| Personal Care & Service | 15 (15.6%) | 81 (84.4%) |
| Total (Category) | 178 (60.3%) | 117 (39.7%) |
| Total (Overall) | 1,075 (49.7%) | 1,088 (50.3%) |
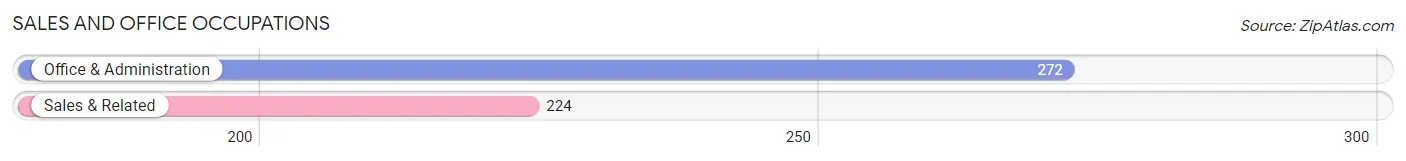
Sales and Office Occupations
The most common Sales and Office occupations in Spencerport are Office & Administration (272 | 12.6%), and Sales & Related (224 | 10.4%).
Sales and Office Occupations by Sex
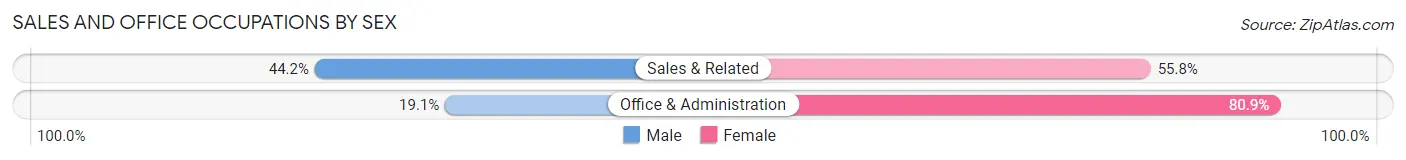
| Occupation | Male | Female |
| Sales & Related | 99 (44.2%) | 125 (55.8%) |
| Office & Administration | 52 (19.1%) | 220 (80.9%) |
| Total (Category) | 151 (30.4%) | 345 (69.6%) |
| Total (Overall) | 1,075 (49.7%) | 1,088 (50.3%) |
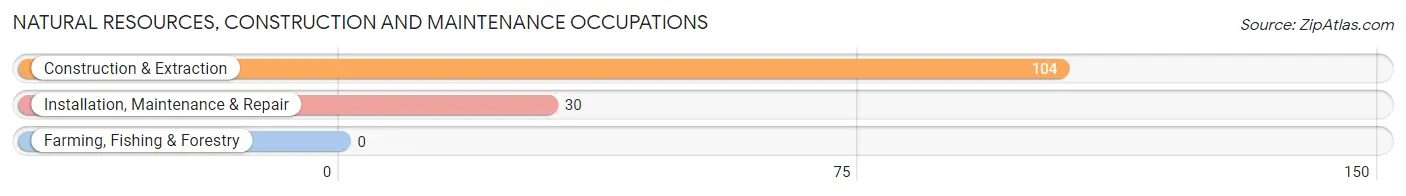
Natural Resources, Construction and Maintenance Occupations
The most common Natural Resources, Construction and Maintenance occupations in Spencerport are Construction & Extraction (104 | 4.8%), and Installation, Maintenance & Repair (30 | 1.4%).
Natural Resources, Construction and Maintenance Occupations by Sex
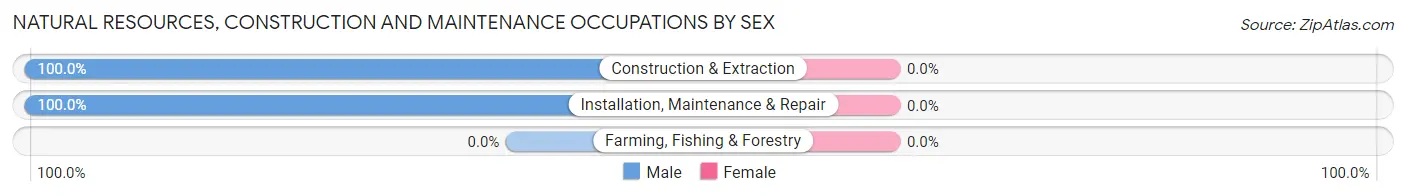
| Occupation | Male | Female |
| Farming, Fishing & Forestry | 0 (0.0%) | 0 (0.0%) |
| Construction & Extraction | 104 (100.0%) | 0 (0.0%) |
| Installation, Maintenance & Repair | 30 (100.0%) | 0 (0.0%) |
| Total (Category) | 134 (100.0%) | 0 (0.0%) |
| Total (Overall) | 1,075 (49.7%) | 1,088 (50.3%) |
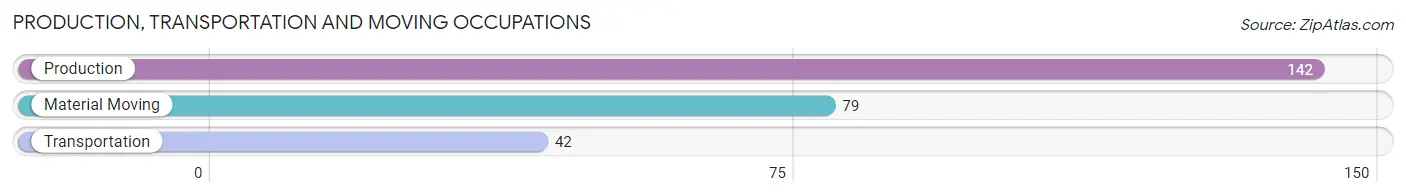
Production, Transportation and Moving Occupations
The most common Production, Transportation and Moving occupations in Spencerport are Production (142 | 6.6%), Material Moving (79 | 3.6%), and Transportation (42 | 1.9%).
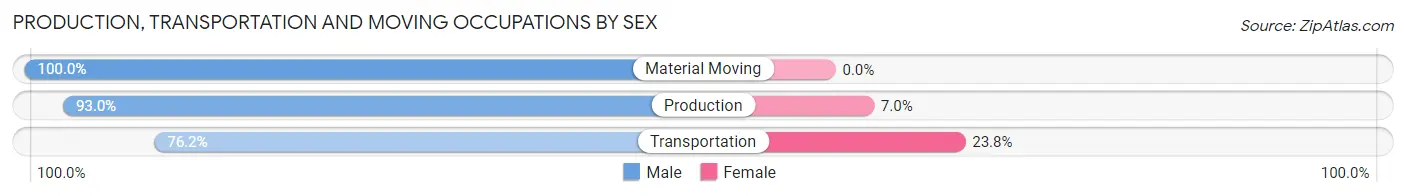
Production, Transportation and Moving Occupations by Sex
| Occupation | Male | Female |
| Production | 132 (93.0%) | 10 (7.0%) |
| Transportation | 32 (76.2%) | 10 (23.8%) |
| Material Moving | 79 (100.0%) | 0 (0.0%) |
| Total (Category) | 243 (92.4%) | 20 (7.6%) |
| Total (Overall) | 1,075 (49.7%) | 1,088 (50.3%) |
Employment Industries by Sex in Spencerport
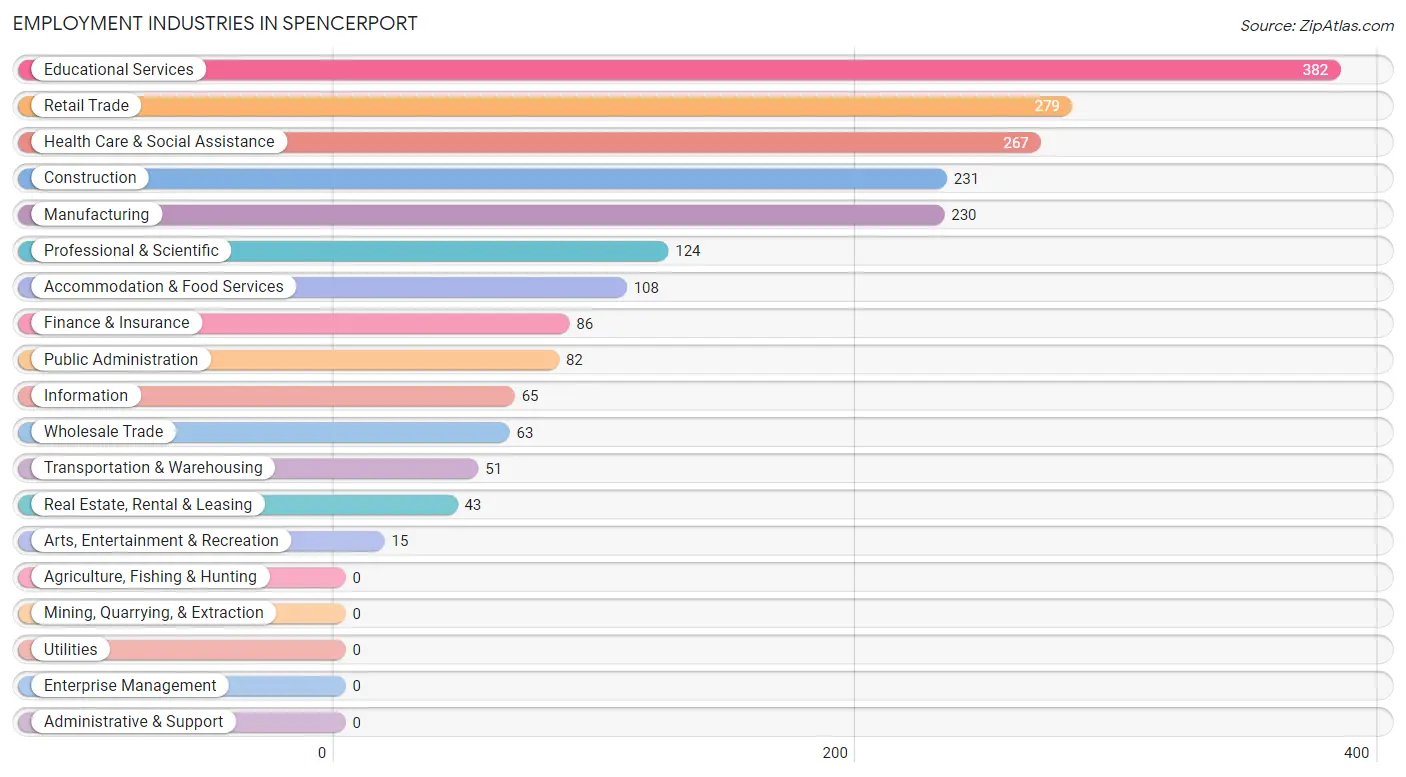
Employment Industries in Spencerport
The major employment industries in Spencerport include Educational Services (382 | 17.7%), Retail Trade (279 | 12.9%), Health Care & Social Assistance (267 | 12.3%), Construction (231 | 10.7%), and Manufacturing (230 | 10.6%).
Employment Industries by Sex in Spencerport
The Spencerport industries that see more men than women are Wholesale Trade (100.0%), Transportation & Warehousing (100.0%), and Arts, Entertainment & Recreation (100.0%), whereas the industries that tend to have a higher number of women are Health Care & Social Assistance (80.5%), Educational Services (79.6%), and Retail Trade (52.7%).
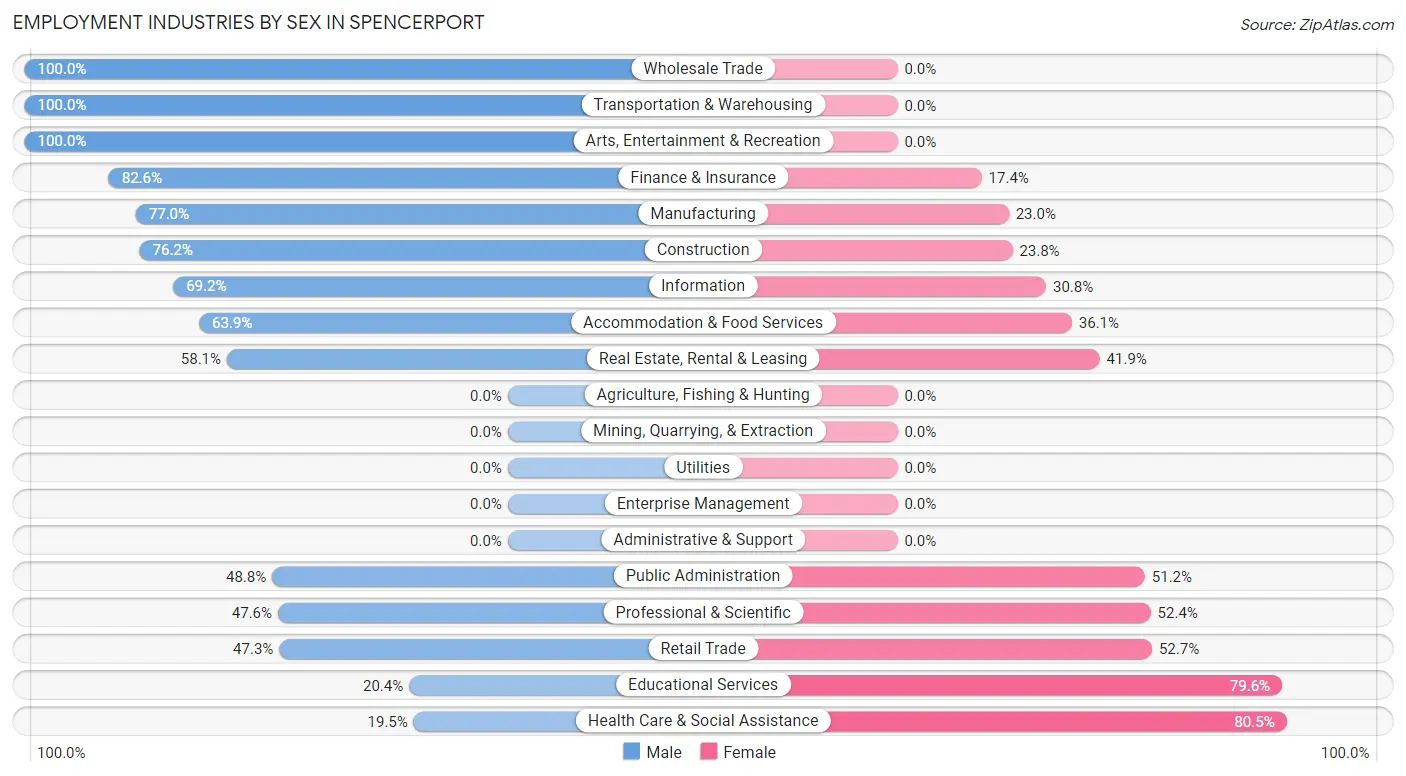
| Industry | Male | Female |
| Agriculture, Fishing & Hunting | 0 (0.0%) | 0 (0.0%) |
| Mining, Quarrying, & Extraction | 0 (0.0%) | 0 (0.0%) |
| Construction | 176 (76.2%) | 55 (23.8%) |
| Manufacturing | 177 (77.0%) | 53 (23.0%) |
| Wholesale Trade | 63 (100.0%) | 0 (0.0%) |
| Retail Trade | 132 (47.3%) | 147 (52.7%) |
| Transportation & Warehousing | 51 (100.0%) | 0 (0.0%) |
| Utilities | 0 (0.0%) | 0 (0.0%) |
| Information | 45 (69.2%) | 20 (30.8%) |
| Finance & Insurance | 71 (82.6%) | 15 (17.4%) |
| Real Estate, Rental & Leasing | 25 (58.1%) | 18 (41.9%) |
| Professional & Scientific | 59 (47.6%) | 65 (52.4%) |
| Enterprise Management | 0 (0.0%) | 0 (0.0%) |
| Administrative & Support | 0 (0.0%) | 0 (0.0%) |
| Educational Services | 78 (20.4%) | 304 (79.6%) |
| Health Care & Social Assistance | 52 (19.5%) | 215 (80.5%) |
| Arts, Entertainment & Recreation | 15 (100.0%) | 0 (0.0%) |
| Accommodation & Food Services | 69 (63.9%) | 39 (36.1%) |
| Public Administration | 40 (48.8%) | 42 (51.2%) |
| Total | 1,075 (49.7%) | 1,088 (50.3%) |
Education in Spencerport
School Enrollment in Spencerport
The most common levels of schooling among the 837 students in Spencerport are college / undergraduate (191 | 22.8%), middle school (180 | 21.5%), and high school (179 | 21.4%).
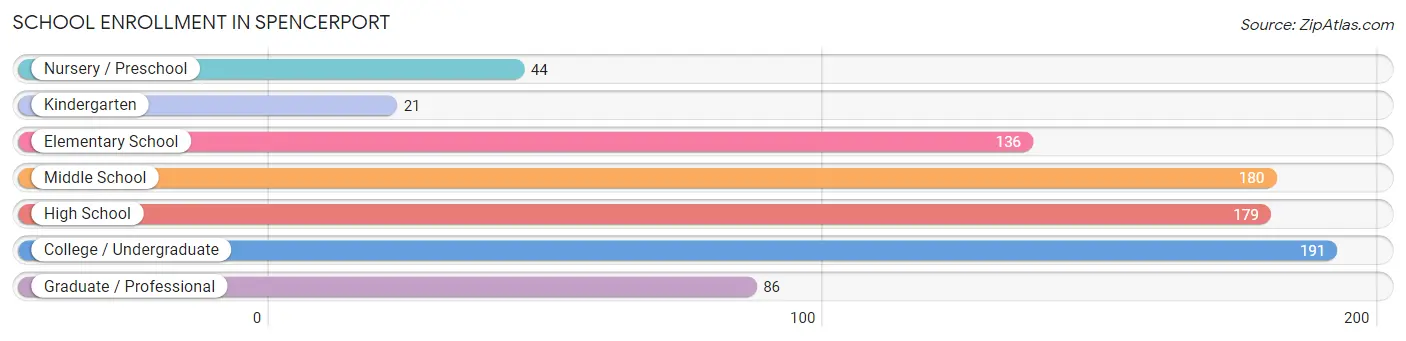
| School Level | # Students | % Students |
| Nursery / Preschool | 44 | 5.3% |
| Kindergarten | 21 | 2.5% |
| Elementary School | 136 | 16.3% |
| Middle School | 180 | 21.5% |
| High School | 179 | 21.4% |
| College / Undergraduate | 191 | 22.8% |
| Graduate / Professional | 86 | 10.3% |
| Total | 837 | 100.0% |
School Enrollment by Age by Funding Source in Spencerport
Out of a total of 837 students who are enrolled in schools in Spencerport, 134 (16.0%) attend a private institution, while the remaining 703 (84.0%) are enrolled in public schools. The age group of 3 to 4 year olds has the highest likelihood of being enrolled in private schools, with 23 (52.3% in the age bracket) enrolled. Conversely, the age group of 5 to 9 year old has the lowest likelihood of being enrolled in a private school, with 115 (100.0% in the age bracket) attending a public institution.
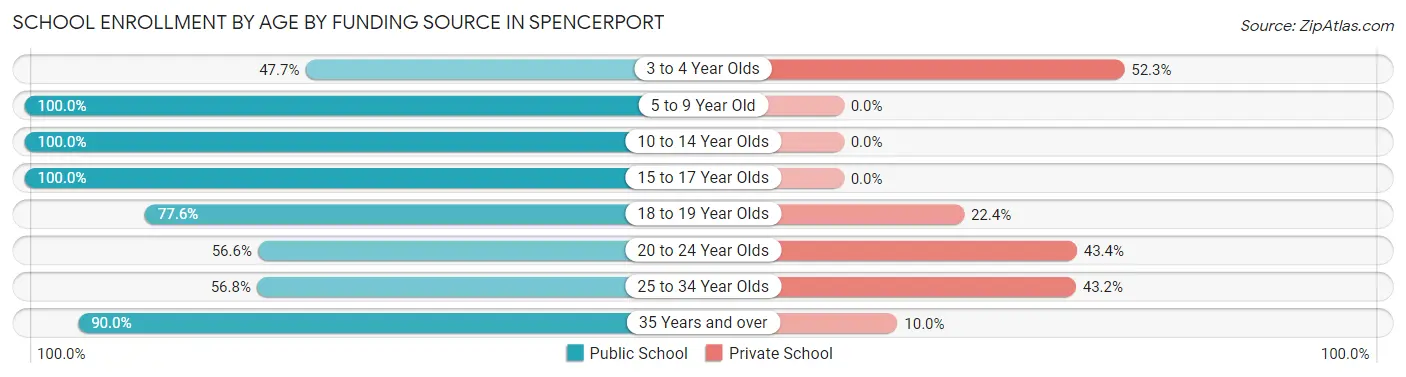
| Age Bracket | Public School | Private School |
| 3 to 4 Year Olds | 21 (47.7%) | 23 (52.3%) |
| 5 to 9 Year Old | 115 (100.0%) | 0 (0.0%) |
| 10 to 14 Year Olds | 222 (100.0%) | 0 (0.0%) |
| 15 to 17 Year Olds | 164 (100.0%) | 0 (0.0%) |
| 18 to 19 Year Olds | 45 (77.6%) | 13 (22.4%) |
| 20 to 24 Year Olds | 43 (56.6%) | 33 (43.4%) |
| 25 to 34 Year Olds | 84 (56.8%) | 64 (43.2%) |
| 35 Years and over | 9 (90.0%) | 1 (10.0%) |
| Total | 703 (84.0%) | 134 (16.0%) |
Educational Attainment by Field of Study in Spencerport
Business (251 | 21.4%), psychology (175 | 14.9%), science & technology (165 | 14.0%), education (149 | 12.7%), and social sciences (71 | 6.0%) are the most common fields of study among 1,175 individuals in Spencerport who have obtained a bachelor's degree or higher.
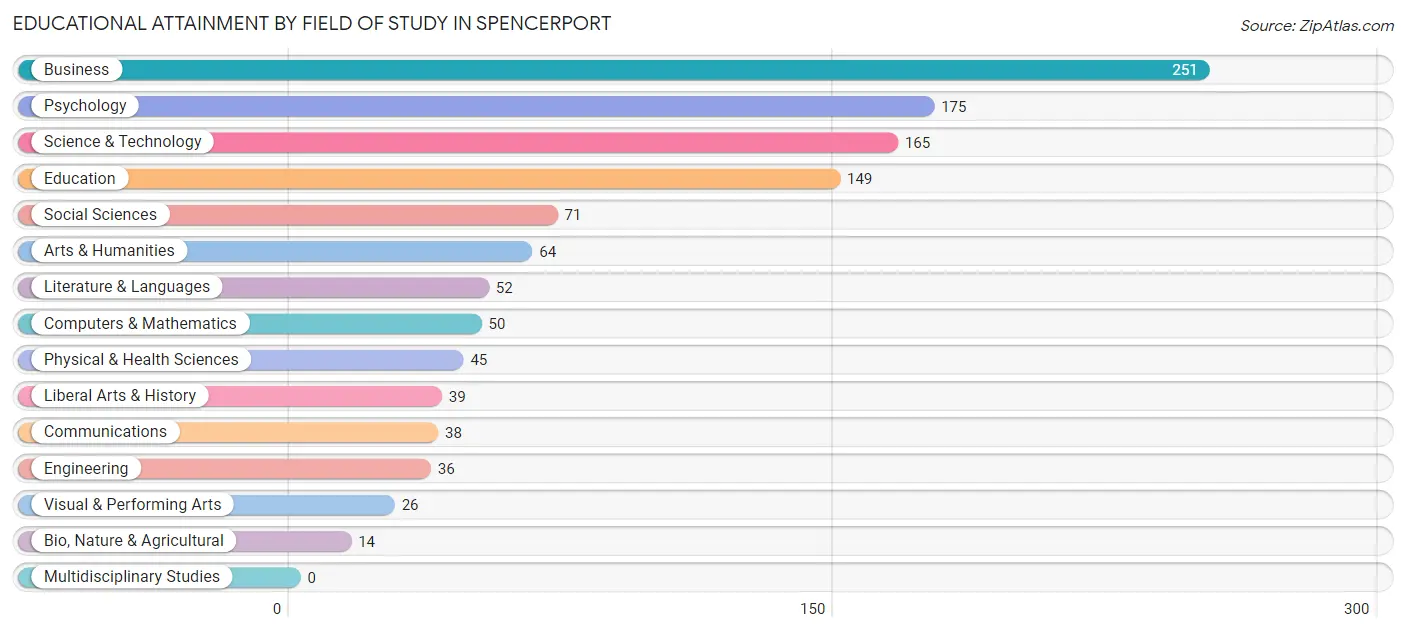
| Field of Study | # Graduates | % Graduates |
| Computers & Mathematics | 50 | 4.3% |
| Bio, Nature & Agricultural | 14 | 1.2% |
| Physical & Health Sciences | 45 | 3.8% |
| Psychology | 175 | 14.9% |
| Social Sciences | 71 | 6.0% |
| Engineering | 36 | 3.1% |
| Multidisciplinary Studies | 0 | 0.0% |
| Science & Technology | 165 | 14.0% |
| Business | 251 | 21.4% |
| Education | 149 | 12.7% |
| Literature & Languages | 52 | 4.4% |
| Liberal Arts & History | 39 | 3.3% |
| Visual & Performing Arts | 26 | 2.2% |
| Communications | 38 | 3.2% |
| Arts & Humanities | 64 | 5.4% |
| Total | 1,175 | 100.0% |
Transportation & Commute in Spencerport
Vehicle Availability by Sex in Spencerport
The most prevalent vehicle ownership categories in Spencerport are males with 2 vehicles (619, accounting for 58.2%) and females with 2 vehicles (484, making up 57.6%).
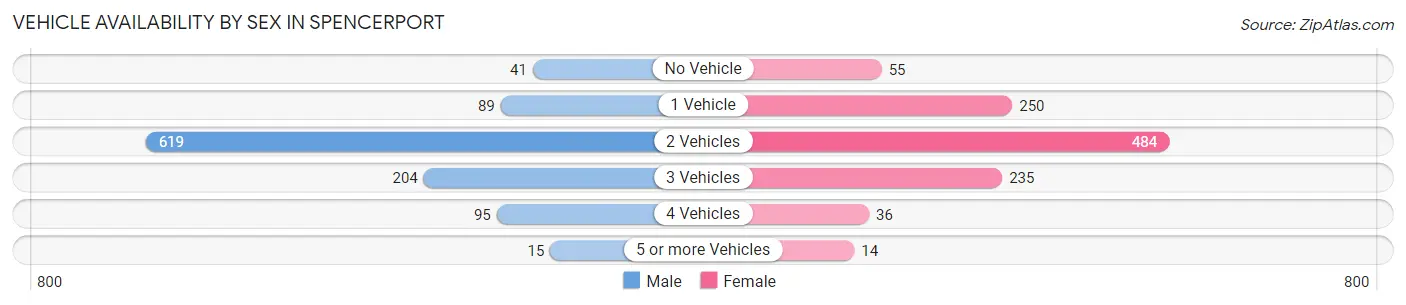
| Vehicles Available | Male | Female |
| No Vehicle | 41 (3.9%) | 55 (5.1%) |
| 1 Vehicle | 89 (8.4%) | 250 (23.3%) |
| 2 Vehicles | 619 (58.2%) | 484 (45.1%) |
| 3 Vehicles | 204 (19.2%) | 235 (21.9%) |
| 4 Vehicles | 95 (8.9%) | 36 (3.4%) |
| 5 or more Vehicles | 15 (1.4%) | 14 (1.3%) |
| Total | 1,063 (100.0%) | 1,074 (100.0%) |
Commute Time in Spencerport
The most frequently occuring commute durations in Spencerport are 15 to 19 minutes (548 commuters, 29.6%), 20 to 24 minutes (269 commuters, 14.5%), and 5 to 9 minutes (264 commuters, 14.3%).
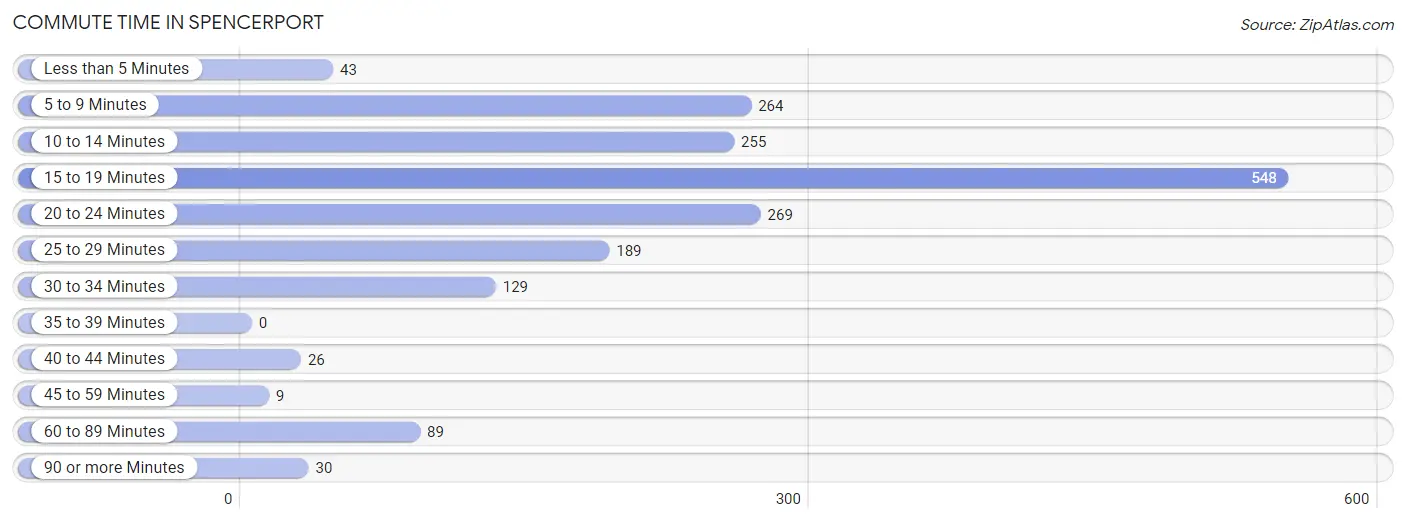
| Commute Time | # Commuters | % Commuters |
| Less than 5 Minutes | 43 | 2.3% |
| 5 to 9 Minutes | 264 | 14.3% |
| 10 to 14 Minutes | 255 | 13.8% |
| 15 to 19 Minutes | 548 | 29.6% |
| 20 to 24 Minutes | 269 | 14.5% |
| 25 to 29 Minutes | 189 | 10.2% |
| 30 to 34 Minutes | 129 | 7.0% |
| 35 to 39 Minutes | 0 | 0.0% |
| 40 to 44 Minutes | 26 | 1.4% |
| 45 to 59 Minutes | 9 | 0.5% |
| 60 to 89 Minutes | 89 | 4.8% |
| 90 or more Minutes | 30 | 1.6% |
Commute Time by Sex in Spencerport
The most common commute times in Spencerport are 15 to 19 minutes (183 commuters, 21.2%) for males and 15 to 19 minutes (365 commuters, 36.9%) for females.
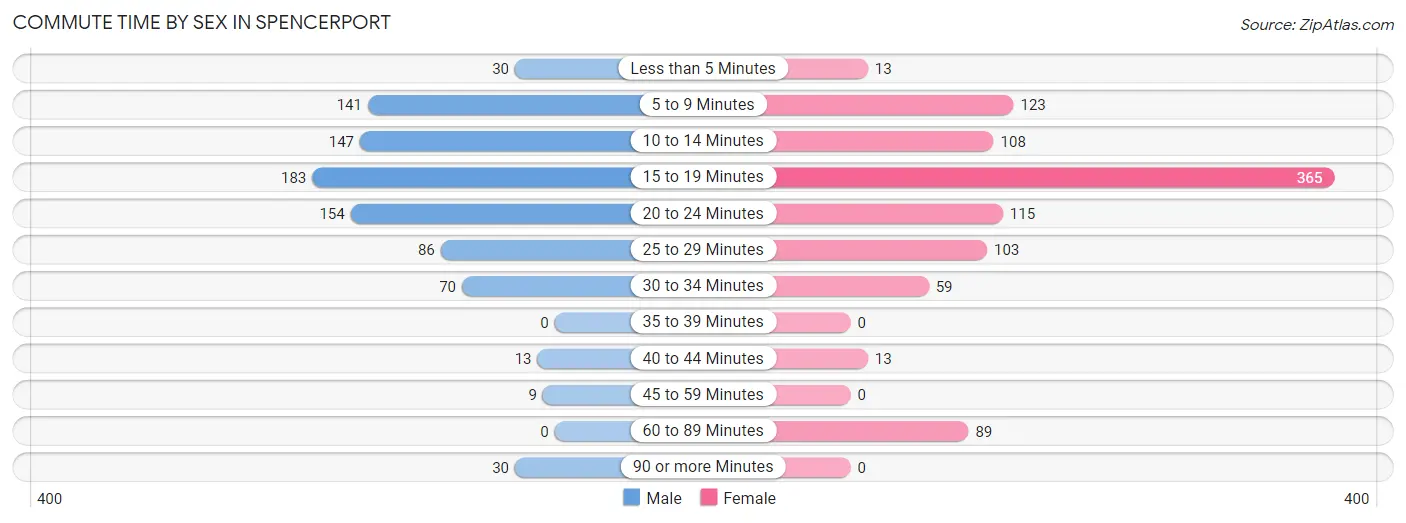
| Commute Time | Male | Female |
| Less than 5 Minutes | 30 (3.5%) | 13 (1.3%) |
| 5 to 9 Minutes | 141 (16.3%) | 123 (12.4%) |
| 10 to 14 Minutes | 147 (17.0%) | 108 (10.9%) |
| 15 to 19 Minutes | 183 (21.2%) | 365 (36.9%) |
| 20 to 24 Minutes | 154 (17.8%) | 115 (11.6%) |
| 25 to 29 Minutes | 86 (10.0%) | 103 (10.4%) |
| 30 to 34 Minutes | 70 (8.1%) | 59 (6.0%) |
| 35 to 39 Minutes | 0 (0.0%) | 0 (0.0%) |
| 40 to 44 Minutes | 13 (1.5%) | 13 (1.3%) |
| 45 to 59 Minutes | 9 (1.0%) | 0 (0.0%) |
| 60 to 89 Minutes | 0 (0.0%) | 89 (9.0%) |
| 90 or more Minutes | 30 (3.5%) | 0 (0.0%) |
Time of Departure to Work by Sex in Spencerport
The most frequent times of departure to work in Spencerport are 7:00 AM to 7:29 AM (149, 17.3%) for males and 8:00 AM to 8:29 AM (255, 25.8%) for females.
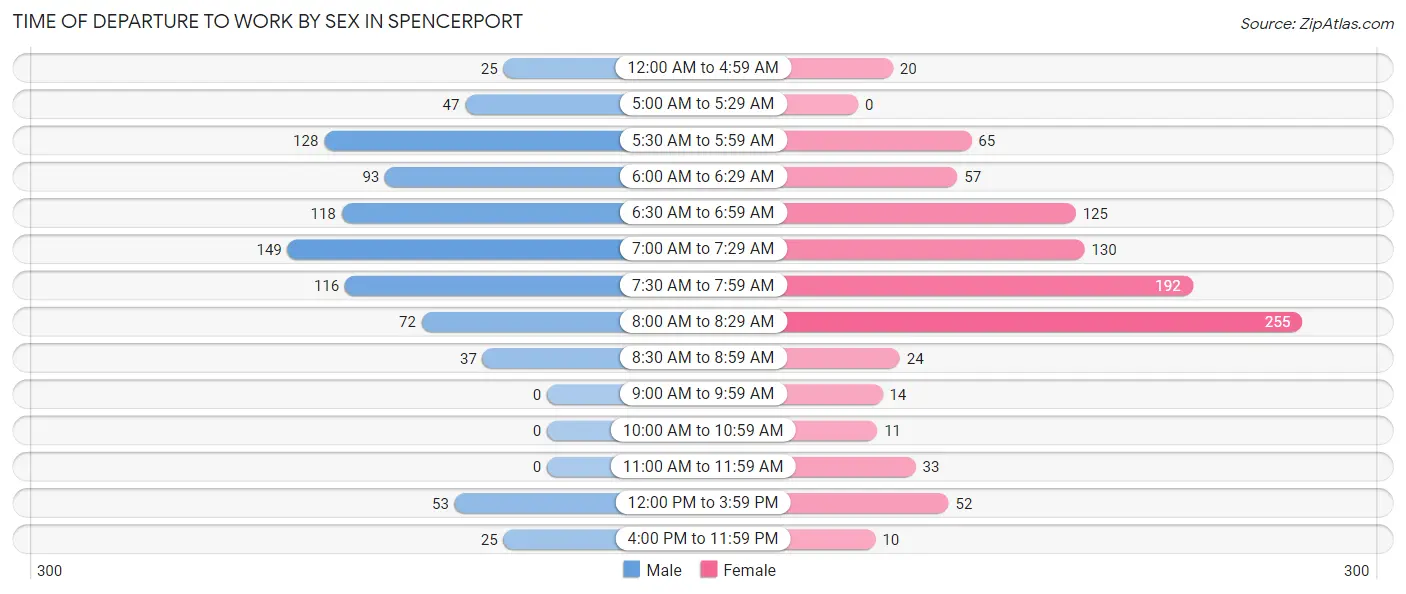
| Time of Departure | Male | Female |
| 12:00 AM to 4:59 AM | 25 (2.9%) | 20 (2.0%) |
| 5:00 AM to 5:29 AM | 47 (5.4%) | 0 (0.0%) |
| 5:30 AM to 5:59 AM | 128 (14.8%) | 65 (6.6%) |
| 6:00 AM to 6:29 AM | 93 (10.8%) | 57 (5.8%) |
| 6:30 AM to 6:59 AM | 118 (13.7%) | 125 (12.7%) |
| 7:00 AM to 7:29 AM | 149 (17.3%) | 130 (13.2%) |
| 7:30 AM to 7:59 AM | 116 (13.4%) | 192 (19.4%) |
| 8:00 AM to 8:29 AM | 72 (8.3%) | 255 (25.8%) |
| 8:30 AM to 8:59 AM | 37 (4.3%) | 24 (2.4%) |
| 9:00 AM to 9:59 AM | 0 (0.0%) | 14 (1.4%) |
| 10:00 AM to 10:59 AM | 0 (0.0%) | 11 (1.1%) |
| 11:00 AM to 11:59 AM | 0 (0.0%) | 33 (3.3%) |
| 12:00 PM to 3:59 PM | 53 (6.1%) | 52 (5.3%) |
| 4:00 PM to 11:59 PM | 25 (2.9%) | 10 (1.0%) |
| Total | 863 (100.0%) | 988 (100.0%) |
Housing Occupancy in Spencerport
Occupancy by Ownership in Spencerport
Of the total 1,574 dwellings in Spencerport, owner-occupied units account for 1,050 (66.7%), while renter-occupied units make up 524 (33.3%).
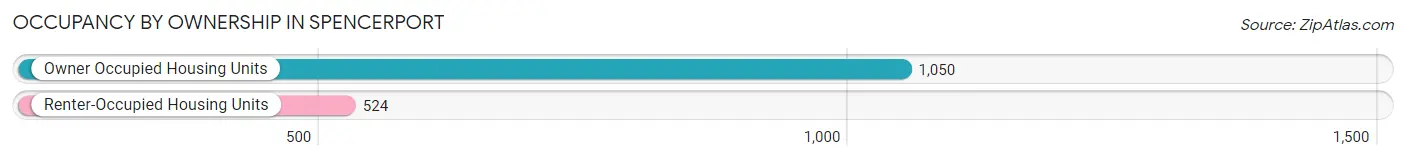
| Occupancy | # Housing Units | % Housing Units |
| Owner Occupied Housing Units | 1,050 | 66.7% |
| Renter-Occupied Housing Units | 524 | 33.3% |
| Total Occupied Housing Units | 1,574 | 100.0% |
Occupancy by Household Size in Spencerport
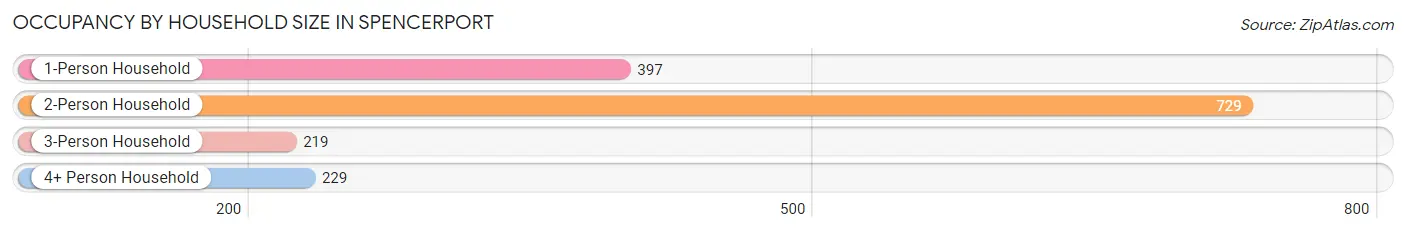
| Household Size | # Housing Units | % Housing Units |
| 1-Person Household | 397 | 25.2% |
| 2-Person Household | 729 | 46.3% |
| 3-Person Household | 219 | 13.9% |
| 4+ Person Household | 229 | 14.5% |
| Total Housing Units | 1,574 | 100.0% |
Occupancy by Ownership by Household Size in Spencerport
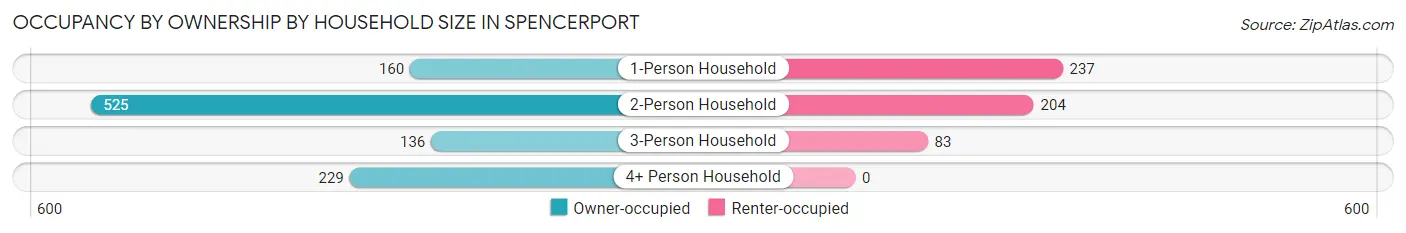
| Household Size | Owner-occupied | Renter-occupied |
| 1-Person Household | 160 (40.3%) | 237 (59.7%) |
| 2-Person Household | 525 (72.0%) | 204 (28.0%) |
| 3-Person Household | 136 (62.1%) | 83 (37.9%) |
| 4+ Person Household | 229 (100.0%) | 0 (0.0%) |
| Total Housing Units | 1,050 (66.7%) | 524 (33.3%) |
Occupancy by Educational Attainment in Spencerport
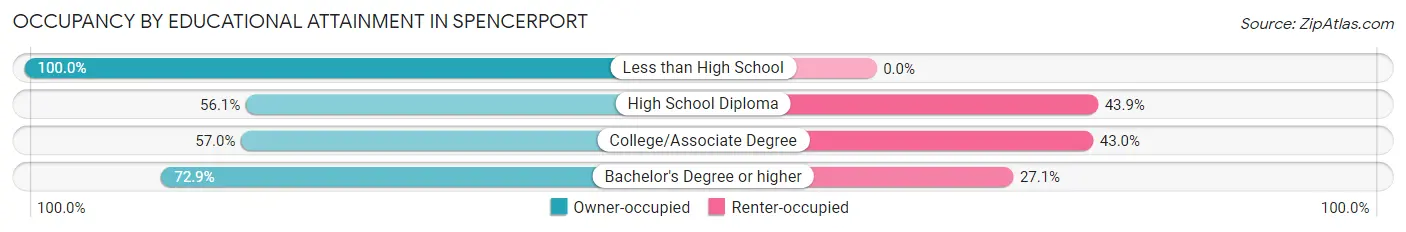
| Household Size | Owner-occupied | Renter-occupied |
| Less than High School | 115 (100.0%) | 0 (0.0%) |
| High School Diploma | 203 (56.1%) | 159 (43.9%) |
| College/Associate Degree | 243 (57.0%) | 183 (43.0%) |
| Bachelor's Degree or higher | 489 (72.9%) | 182 (27.1%) |
Occupancy by Age of Householder in Spencerport
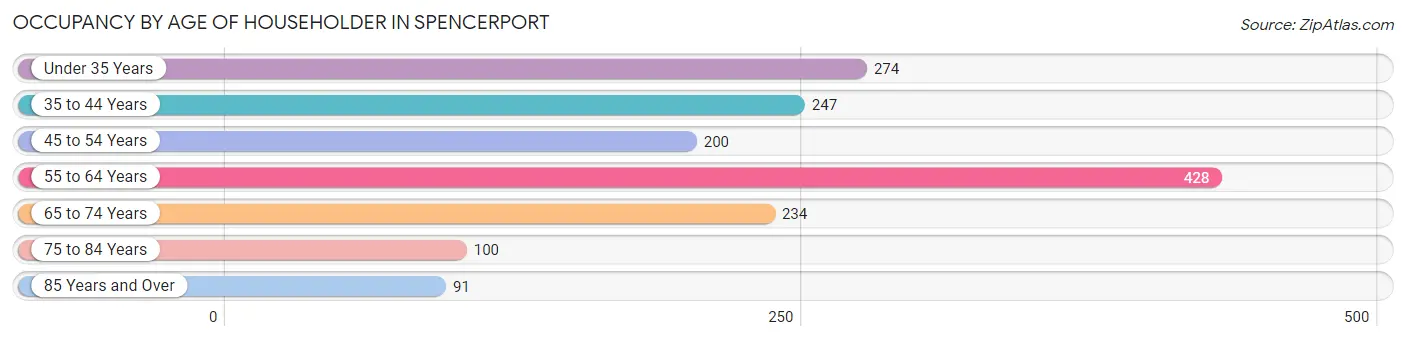
| Age Bracket | # Households | % Households |
| Under 35 Years | 274 | 17.4% |
| 35 to 44 Years | 247 | 15.7% |
| 45 to 54 Years | 200 | 12.7% |
| 55 to 64 Years | 428 | 27.2% |
| 65 to 74 Years | 234 | 14.9% |
| 75 to 84 Years | 100 | 6.4% |
| 85 Years and Over | 91 | 5.8% |
| Total | 1,574 | 100.0% |
Housing Finances in Spencerport
Median Income by Occupancy in Spencerport
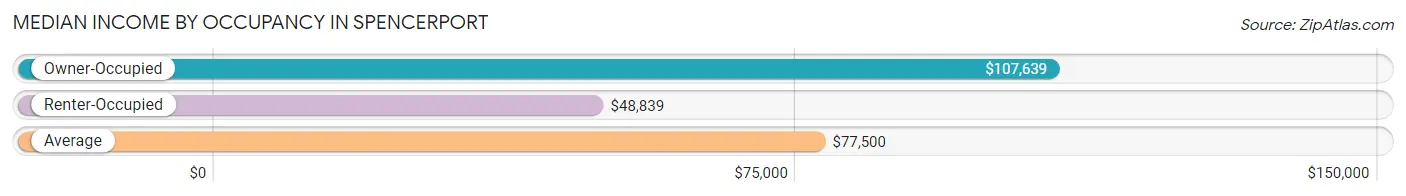
| Occupancy Type | # Households | Median Income |
| Owner-Occupied | 1,050 (66.7%) | $107,639 |
| Renter-Occupied | 524 (33.3%) | $48,839 |
| Average | 1,574 (100.0%) | $77,500 |
Occupancy by Householder Income Bracket in Spencerport
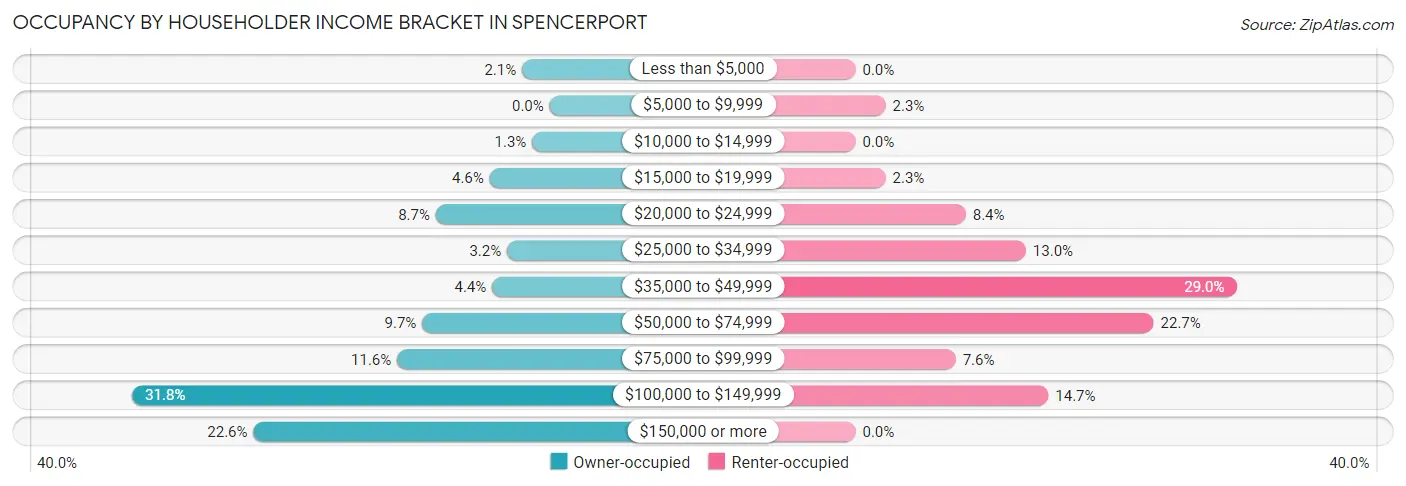
| Income Bracket | Owner-occupied | Renter-occupied |
| Less than $5,000 | 22 (2.1%) | 0 (0.0%) |
| $5,000 to $9,999 | 0 (0.0%) | 12 (2.3%) |
| $10,000 to $14,999 | 14 (1.3%) | 0 (0.0%) |
| $15,000 to $19,999 | 48 (4.6%) | 12 (2.3%) |
| $20,000 to $24,999 | 91 (8.7%) | 44 (8.4%) |
| $25,000 to $34,999 | 34 (3.2%) | 68 (13.0%) |
| $35,000 to $49,999 | 46 (4.4%) | 152 (29.0%) |
| $50,000 to $74,999 | 102 (9.7%) | 119 (22.7%) |
| $75,000 to $99,999 | 122 (11.6%) | 40 (7.6%) |
| $100,000 to $149,999 | 334 (31.8%) | 77 (14.7%) |
| $150,000 or more | 237 (22.6%) | 0 (0.0%) |
| Total | 1,050 (100.0%) | 524 (100.0%) |
Monthly Housing Cost Tiers in Spencerport
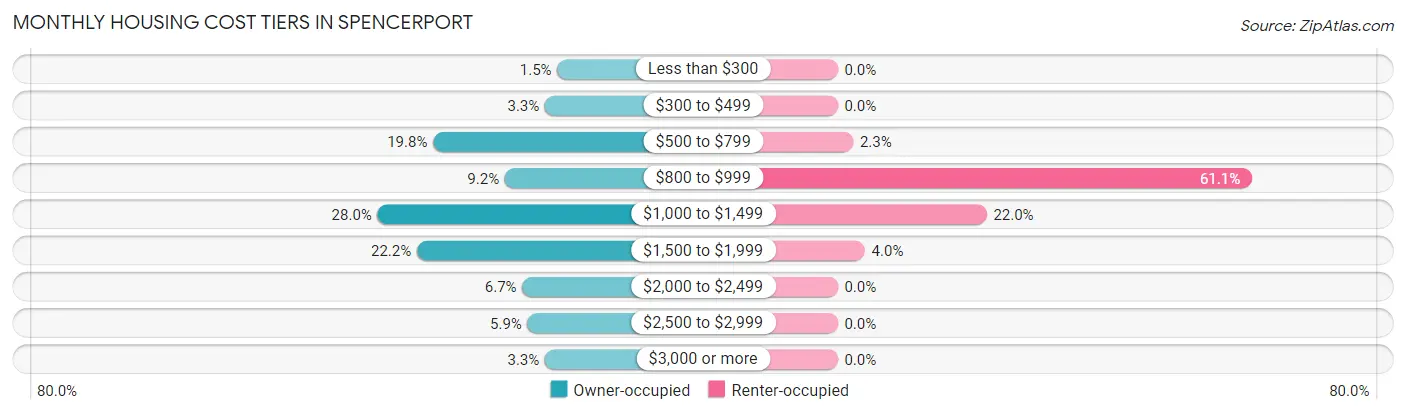
| Monthly Cost | Owner-occupied | Renter-occupied |
| Less than $300 | 16 (1.5%) | 0 (0.0%) |
| $300 to $499 | 35 (3.3%) | 0 (0.0%) |
| $500 to $799 | 208 (19.8%) | 12 (2.3%) |
| $800 to $999 | 97 (9.2%) | 320 (61.1%) |
| $1,000 to $1,499 | 294 (28.0%) | 115 (22.0%) |
| $1,500 to $1,999 | 233 (22.2%) | 21 (4.0%) |
| $2,000 to $2,499 | 70 (6.7%) | 0 (0.0%) |
| $2,500 to $2,999 | 62 (5.9%) | 0 (0.0%) |
| $3,000 or more | 35 (3.3%) | 0 (0.0%) |
| Total | 1,050 (100.0%) | 524 (100.0%) |
Physical Housing Characteristics in Spencerport
Housing Structures in Spencerport
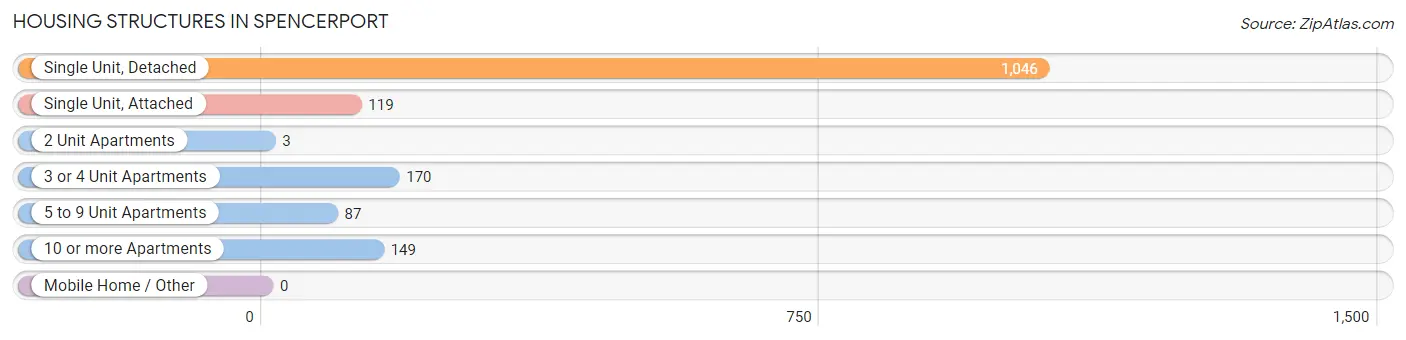
| Structure Type | # Housing Units | % Housing Units |
| Single Unit, Detached | 1,046 | 66.4% |
| Single Unit, Attached | 119 | 7.6% |
| 2 Unit Apartments | 3 | 0.2% |
| 3 or 4 Unit Apartments | 170 | 10.8% |
| 5 to 9 Unit Apartments | 87 | 5.5% |
| 10 or more Apartments | 149 | 9.5% |
| Mobile Home / Other | 0 | 0.0% |
| Total | 1,574 | 100.0% |
Housing Structures by Occupancy in Spencerport
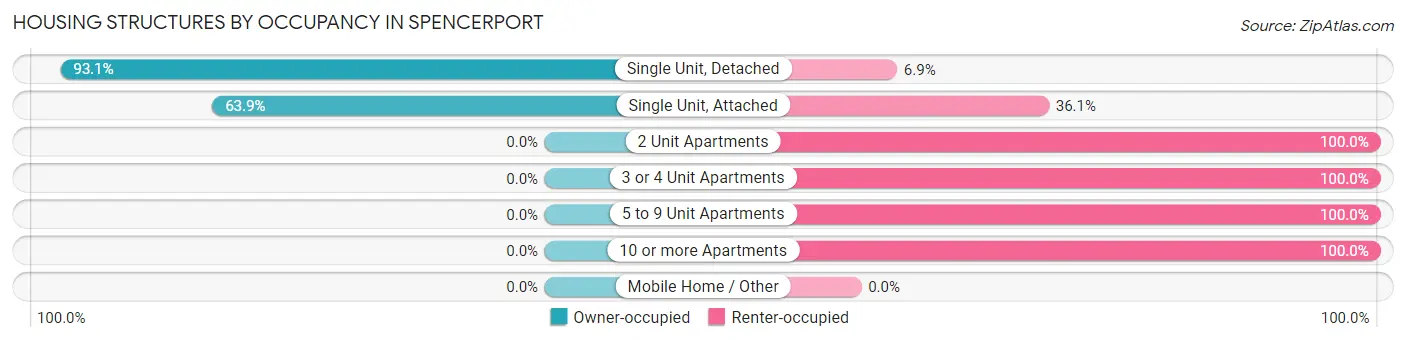
| Structure Type | Owner-occupied | Renter-occupied |
| Single Unit, Detached | 974 (93.1%) | 72 (6.9%) |
| Single Unit, Attached | 76 (63.9%) | 43 (36.1%) |
| 2 Unit Apartments | 0 (0.0%) | 3 (100.0%) |
| 3 or 4 Unit Apartments | 0 (0.0%) | 170 (100.0%) |
| 5 to 9 Unit Apartments | 0 (0.0%) | 87 (100.0%) |
| 10 or more Apartments | 0 (0.0%) | 149 (100.0%) |
| Mobile Home / Other | 0 (0.0%) | 0 (0.0%) |
| Total | 1,050 (66.7%) | 524 (33.3%) |
Housing Structures by Number of Rooms in Spencerport
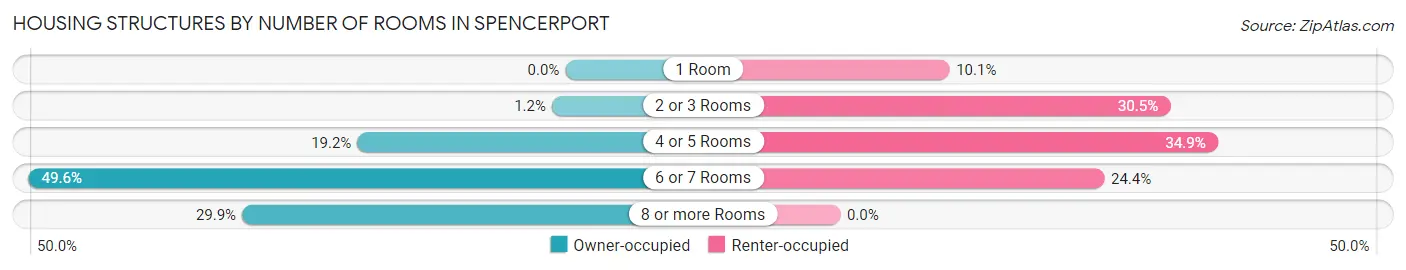
| Number of Rooms | Owner-occupied | Renter-occupied |
| 1 Room | 0 (0.0%) | 53 (10.1%) |
| 2 or 3 Rooms | 13 (1.2%) | 160 (30.5%) |
| 4 or 5 Rooms | 202 (19.2%) | 183 (34.9%) |
| 6 or 7 Rooms | 521 (49.6%) | 128 (24.4%) |
| 8 or more Rooms | 314 (29.9%) | 0 (0.0%) |
| Total | 1,050 (100.0%) | 524 (100.0%) |
Housing Structure by Heating Type in Spencerport
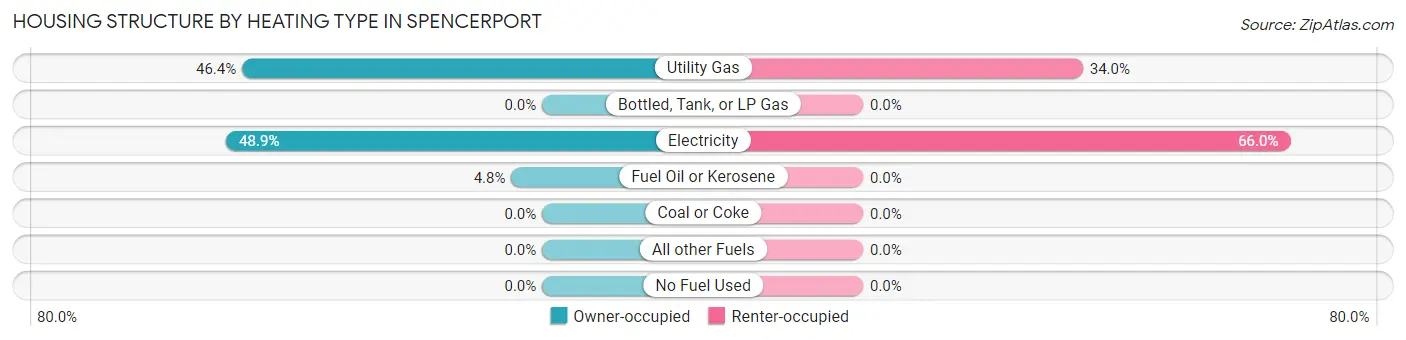
| Heating Type | Owner-occupied | Renter-occupied |
| Utility Gas | 487 (46.4%) | 178 (34.0%) |
| Bottled, Tank, or LP Gas | 0 (0.0%) | 0 (0.0%) |
| Electricity | 513 (48.9%) | 346 (66.0%) |
| Fuel Oil or Kerosene | 50 (4.8%) | 0 (0.0%) |
| Coal or Coke | 0 (0.0%) | 0 (0.0%) |
| All other Fuels | 0 (0.0%) | 0 (0.0%) |
| No Fuel Used | 0 (0.0%) | 0 (0.0%) |
| Total | 1,050 (100.0%) | 524 (100.0%) |
Household Vehicle Usage in Spencerport
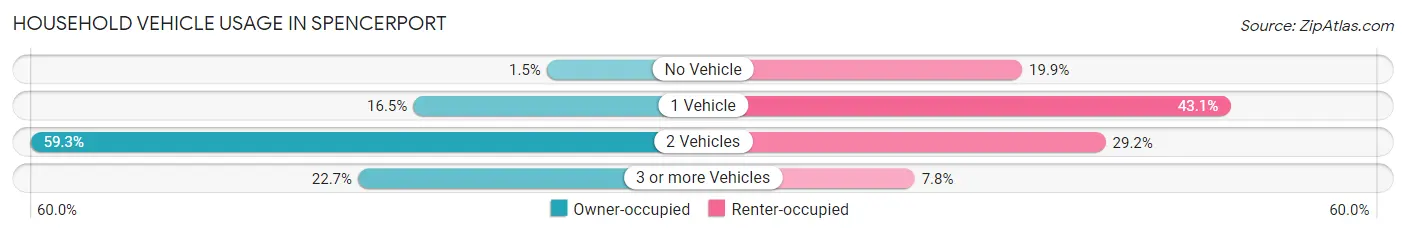
| Vehicles per Household | Owner-occupied | Renter-occupied |
| No Vehicle | 16 (1.5%) | 104 (19.9%) |
| 1 Vehicle | 173 (16.5%) | 226 (43.1%) |
| 2 Vehicles | 623 (59.3%) | 153 (29.2%) |
| 3 or more Vehicles | 238 (22.7%) | 41 (7.8%) |
| Total | 1,050 (100.0%) | 524 (100.0%) |
Real Estate & Mortgages in Spencerport
Real Estate and Mortgage Overview in Spencerport
| Characteristic | Without Mortgage | With Mortgage |
| Housing Units | 323 | 727 |
| Median Property Value | $144,800 | $172,900 |
| Median Household Income | $54,801 | $215 |
| Monthly Housing Costs | $579 | $35 |
| Real Estate Taxes | $6,042 | $11 |
Property Value by Mortgage Status in Spencerport
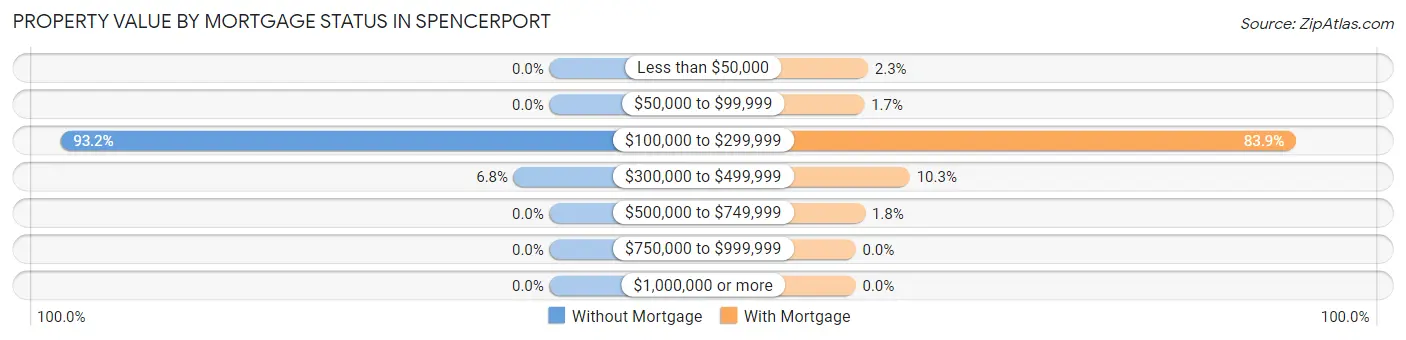
| Property Value | Without Mortgage | With Mortgage |
| Less than $50,000 | 0 (0.0%) | 17 (2.3%) |
| $50,000 to $99,999 | 0 (0.0%) | 12 (1.7%) |
| $100,000 to $299,999 | 301 (93.2%) | 610 (83.9%) |
| $300,000 to $499,999 | 22 (6.8%) | 75 (10.3%) |
| $500,000 to $749,999 | 0 (0.0%) | 13 (1.8%) |
| $750,000 to $999,999 | 0 (0.0%) | 0 (0.0%) |
| $1,000,000 or more | 0 (0.0%) | 0 (0.0%) |
| Total | 323 (100.0%) | 727 (100.0%) |
Household Income by Mortgage Status in Spencerport
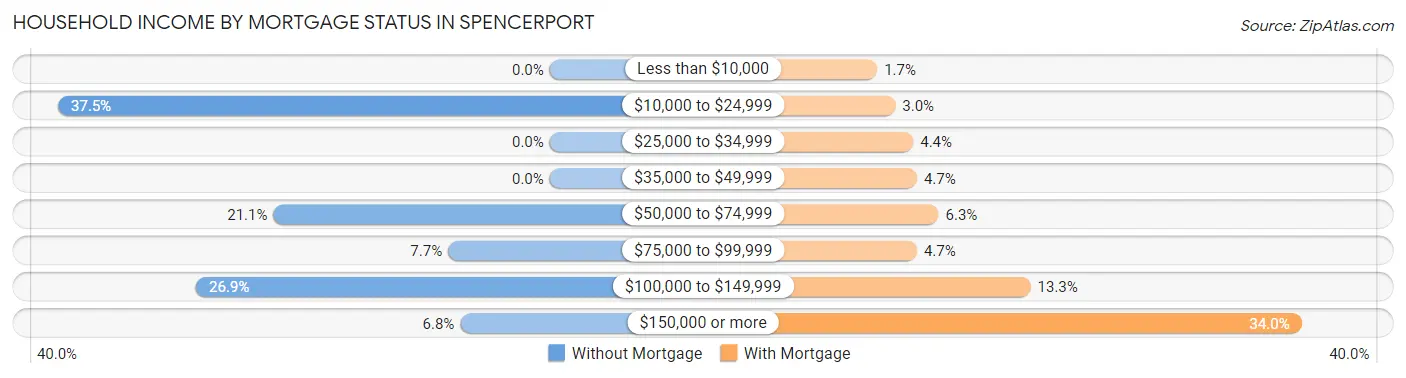
| Household Income | Without Mortgage | With Mortgage |
| Less than $10,000 | 0 (0.0%) | 12 (1.7%) |
| $10,000 to $24,999 | 121 (37.5%) | 22 (3.0%) |
| $25,000 to $34,999 | 0 (0.0%) | 32 (4.4%) |
| $35,000 to $49,999 | 0 (0.0%) | 34 (4.7%) |
| $50,000 to $74,999 | 68 (21.0%) | 46 (6.3%) |
| $75,000 to $99,999 | 25 (7.7%) | 34 (4.7%) |
| $100,000 to $149,999 | 87 (26.9%) | 97 (13.3%) |
| $150,000 or more | 22 (6.8%) | 247 (34.0%) |
| Total | 323 (100.0%) | 727 (100.0%) |
Property Value to Household Income Ratio in Spencerport
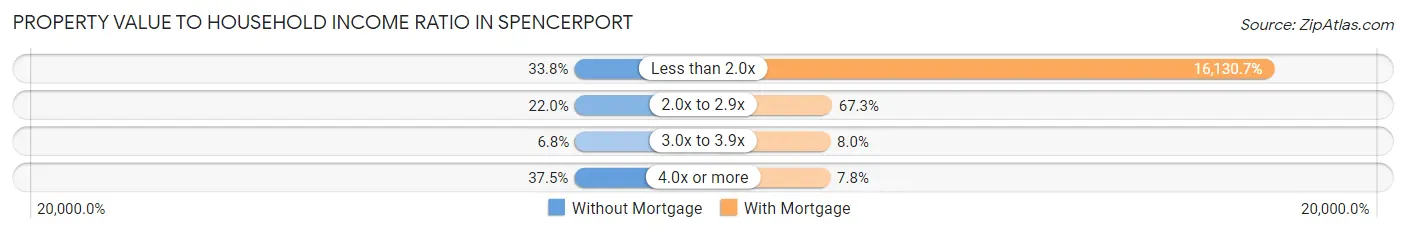
| Value-to-Income Ratio | Without Mortgage | With Mortgage |
| Less than 2.0x | 109 (33.8%) | 117,270 (16,130.7%) |
| 2.0x to 2.9x | 71 (22.0%) | 489 (67.3%) |
| 3.0x to 3.9x | 22 (6.8%) | 58 (8.0%) |
| 4.0x or more | 121 (37.5%) | 57 (7.8%) |
| Total | 323 (100.0%) | 727 (100.0%) |
Real Estate Taxes by Mortgage Status in Spencerport
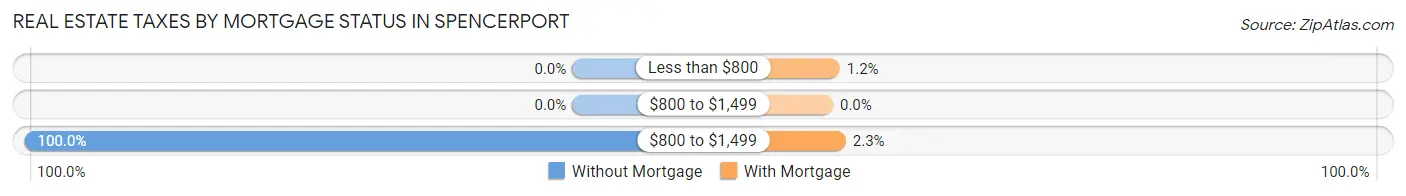
| Property Taxes | Without Mortgage | With Mortgage |
| Less than $800 | 0 (0.0%) | 9 (1.2%) |
| $800 to $1,499 | 0 (0.0%) | 0 (0.0%) |
| $800 to $1,499 | 323 (100.0%) | 17 (2.3%) |
| Total | 323 (100.0%) | 727 (100.0%) |
Health & Disability in Spencerport
Health Insurance Coverage by Age in Spencerport
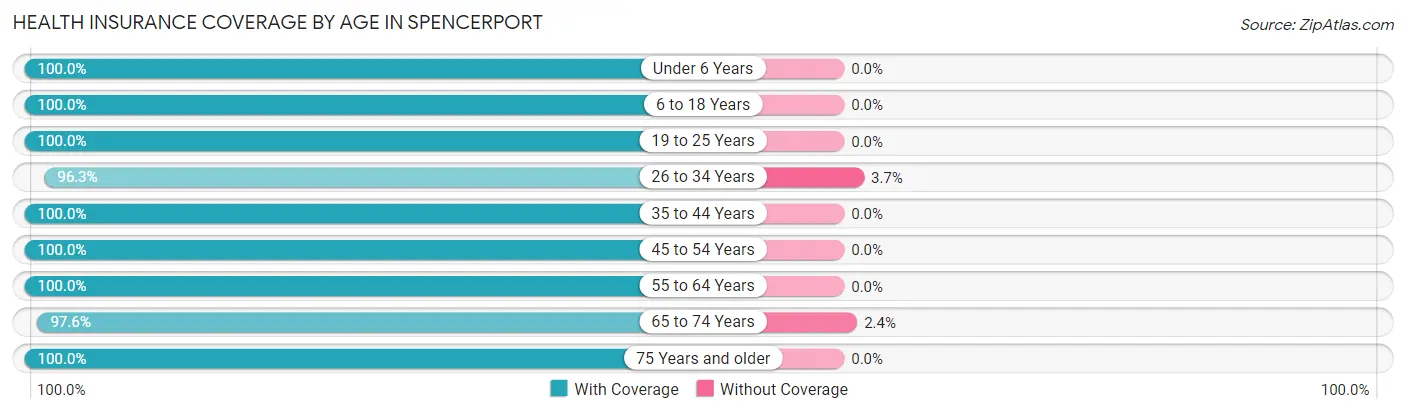
| Age Bracket | With Coverage | Without Coverage |
| Under 6 Years | 173 (100.0%) | 0 (0.0%) |
| 6 to 18 Years | 519 (100.0%) | 0 (0.0%) |
| 19 to 25 Years | 354 (100.0%) | 0 (0.0%) |
| 26 to 34 Years | 339 (96.3%) | 13 (3.7%) |
| 35 to 44 Years | 393 (100.0%) | 0 (0.0%) |
| 45 to 54 Years | 443 (100.0%) | 0 (0.0%) |
| 55 to 64 Years | 701 (100.0%) | 0 (0.0%) |
| 65 to 74 Years | 365 (97.6%) | 9 (2.4%) |
| 75 Years and older | 346 (100.0%) | 0 (0.0%) |
| Total | 3,633 (99.4%) | 22 (0.6%) |
Health Insurance Coverage by Citizenship Status in Spencerport
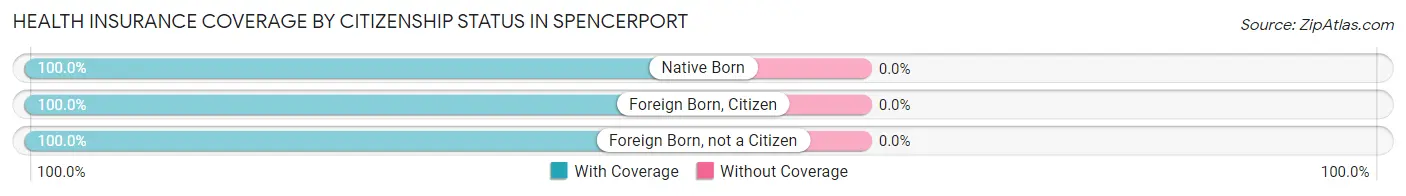
| Citizenship Status | With Coverage | Without Coverage |
| Native Born | 173 (100.0%) | 0 (0.0%) |
| Foreign Born, Citizen | 519 (100.0%) | 0 (0.0%) |
| Foreign Born, not a Citizen | 354 (100.0%) | 0 (0.0%) |
Health Insurance Coverage by Household Income in Spencerport
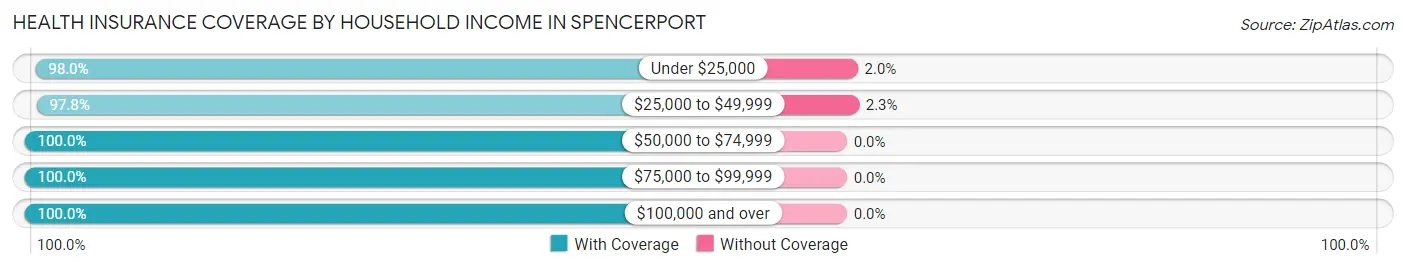
| Household Income | With Coverage | Without Coverage |
| Under $25,000 | 436 (98.0%) | 9 (2.0%) |
| $25,000 to $49,999 | 565 (97.8%) | 13 (2.2%) |
| $50,000 to $74,999 | 338 (100.0%) | 0 (0.0%) |
| $75,000 to $99,999 | 439 (100.0%) | 0 (0.0%) |
| $100,000 and over | 1,835 (100.0%) | 0 (0.0%) |
Public vs Private Health Insurance Coverage by Age in Spencerport
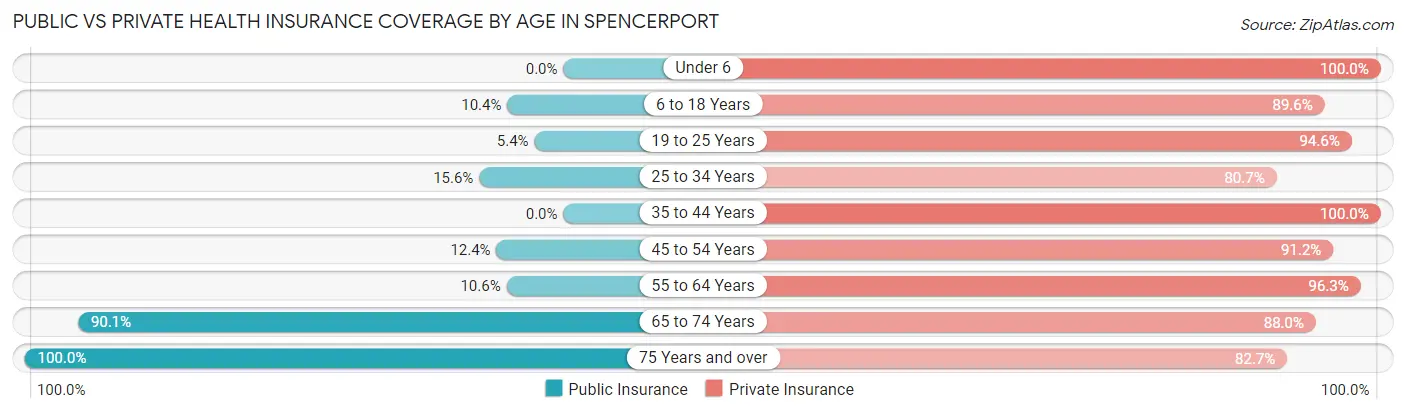
| Age Bracket | Public Insurance | Private Insurance |
| Under 6 | 0 (0.0%) | 173 (100.0%) |
| 6 to 18 Years | 54 (10.4%) | 465 (89.6%) |
| 19 to 25 Years | 19 (5.4%) | 335 (94.6%) |
| 25 to 34 Years | 55 (15.6%) | 284 (80.7%) |
| 35 to 44 Years | 0 (0.0%) | 393 (100.0%) |
| 45 to 54 Years | 55 (12.4%) | 404 (91.2%) |
| 55 to 64 Years | 74 (10.6%) | 675 (96.3%) |
| 65 to 74 Years | 337 (90.1%) | 329 (88.0%) |
| 75 Years and over | 346 (100.0%) | 286 (82.7%) |
| Total | 940 (25.7%) | 3,344 (91.5%) |
Disability Status by Sex by Age in Spencerport
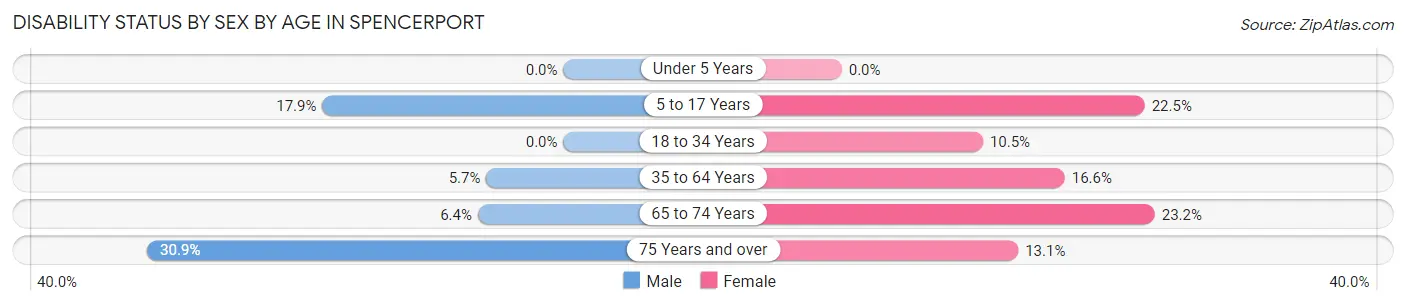
| Age Bracket | Male | Female |
| Under 5 Years | 0 (0.0%) | 0 (0.0%) |
| 5 to 17 Years | 63 (17.9%) | 38 (22.5%) |
| 18 to 34 Years | 0 (0.0%) | 44 (10.5%) |
| 35 to 64 Years | 43 (5.7%) | 130 (16.6%) |
| 65 to 74 Years | 12 (6.4%) | 43 (23.2%) |
| 75 Years and over | 55 (30.9%) | 22 (13.1%) |
Disability Class by Sex by Age in Spencerport
Disability Class: Hearing Difficulty
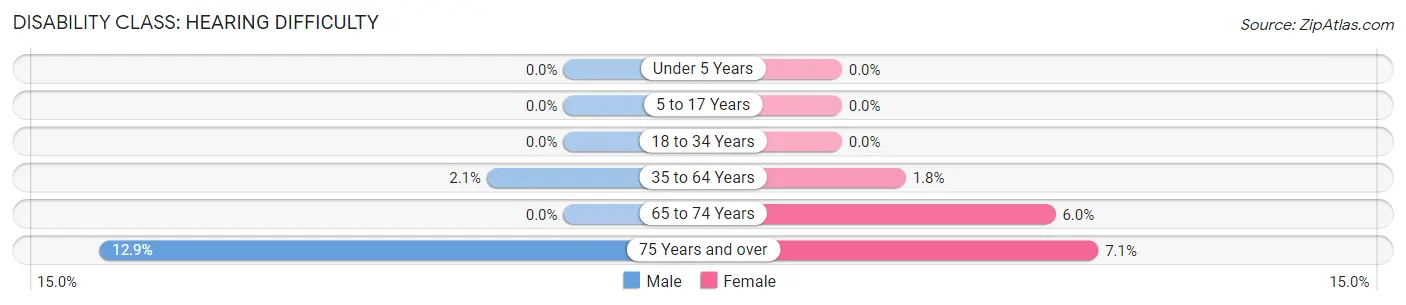
| Age Bracket | Male | Female |
| Under 5 Years | 0 (0.0%) | 0 (0.0%) |
| 5 to 17 Years | 0 (0.0%) | 0 (0.0%) |
| 18 to 34 Years | 0 (0.0%) | 0 (0.0%) |
| 35 to 64 Years | 16 (2.1%) | 14 (1.8%) |
| 65 to 74 Years | 0 (0.0%) | 11 (5.9%) |
| 75 Years and over | 23 (12.9%) | 12 (7.1%) |
Disability Class: Vision Difficulty
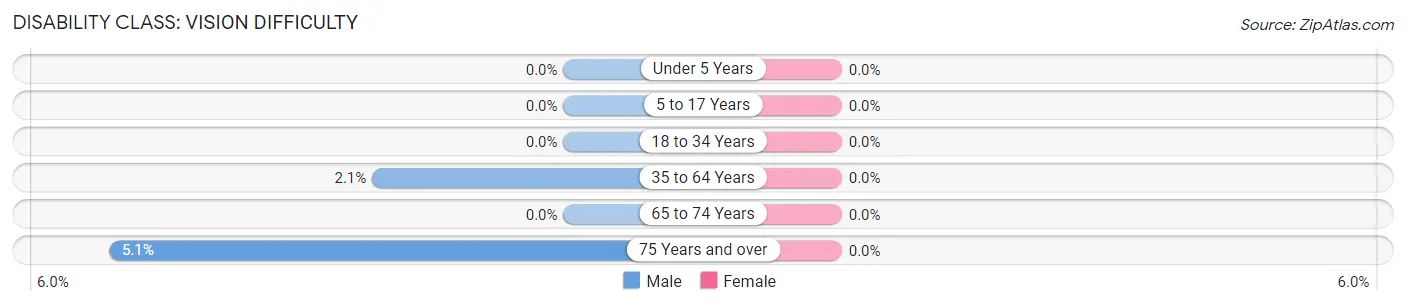
| Age Bracket | Male | Female |
| Under 5 Years | 0 (0.0%) | 0 (0.0%) |
| 5 to 17 Years | 0 (0.0%) | 0 (0.0%) |
| 18 to 34 Years | 0 (0.0%) | 0 (0.0%) |
| 35 to 64 Years | 16 (2.1%) | 0 (0.0%) |
| 65 to 74 Years | 0 (0.0%) | 0 (0.0%) |
| 75 Years and over | 9 (5.1%) | 0 (0.0%) |
Disability Class: Cognitive Difficulty
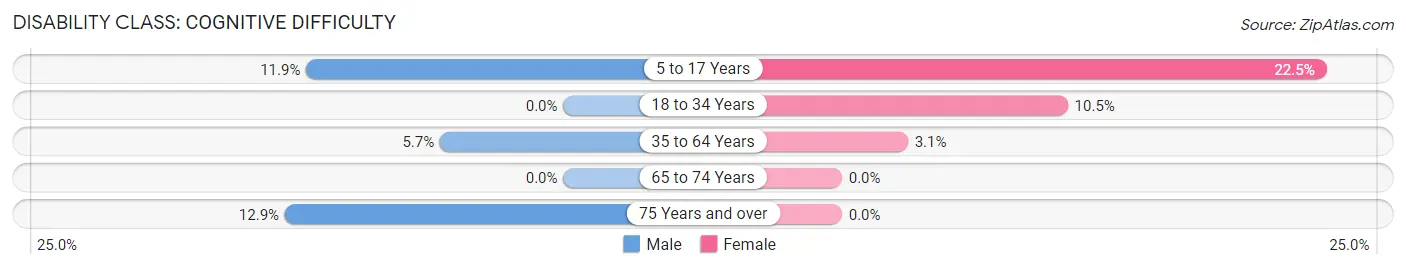
| Age Bracket | Male | Female |
| 5 to 17 Years | 42 (11.9%) | 38 (22.5%) |
| 18 to 34 Years | 0 (0.0%) | 44 (10.5%) |
| 35 to 64 Years | 43 (5.7%) | 24 (3.1%) |
| 65 to 74 Years | 0 (0.0%) | 0 (0.0%) |
| 75 Years and over | 23 (12.9%) | 0 (0.0%) |
Disability Class: Ambulatory Difficulty
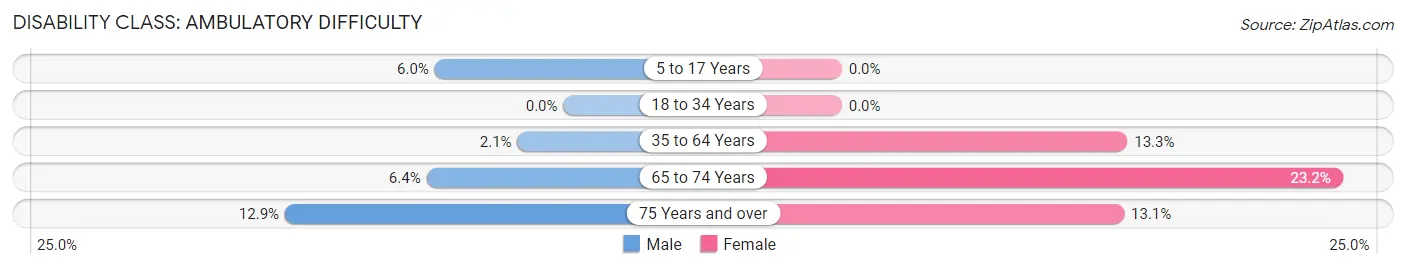
| Age Bracket | Male | Female |
| 5 to 17 Years | 21 (6.0%) | 0 (0.0%) |
| 18 to 34 Years | 0 (0.0%) | 0 (0.0%) |
| 35 to 64 Years | 16 (2.1%) | 104 (13.3%) |
| 65 to 74 Years | 12 (6.4%) | 43 (23.2%) |
| 75 Years and over | 23 (12.9%) | 22 (13.1%) |
Disability Class: Self-Care Difficulty
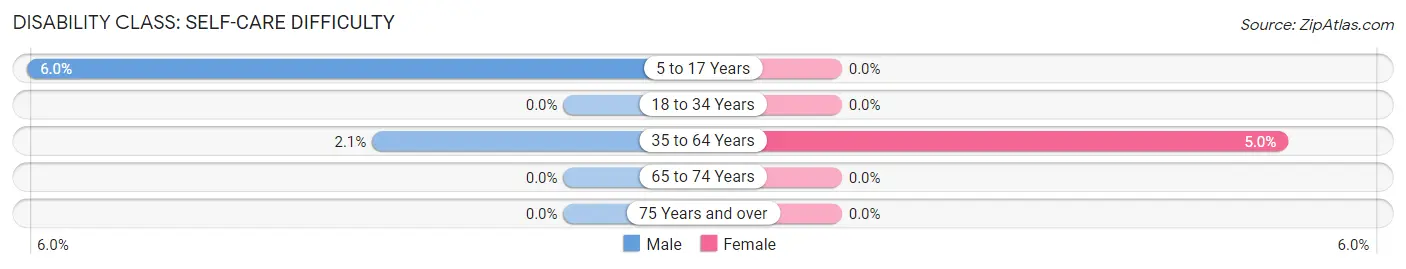
| Age Bracket | Male | Female |
| 5 to 17 Years | 21 (6.0%) | 0 (0.0%) |
| 18 to 34 Years | 0 (0.0%) | 0 (0.0%) |
| 35 to 64 Years | 16 (2.1%) | 39 (5.0%) |
| 65 to 74 Years | 0 (0.0%) | 0 (0.0%) |
| 75 Years and over | 0 (0.0%) | 0 (0.0%) |
Technology Access in Spencerport
Computing Device Access in Spencerport
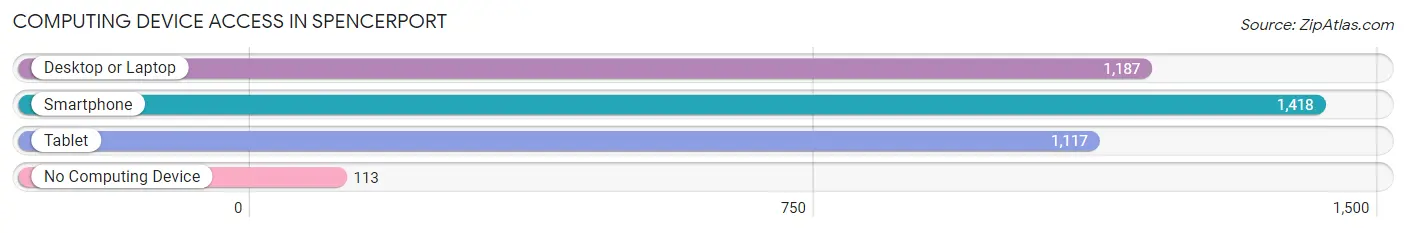
| Device Type | # Households | % Households |
| Desktop or Laptop | 1,187 | 75.4% |
| Smartphone | 1,418 | 90.1% |
| Tablet | 1,117 | 71.0% |
| No Computing Device | 113 | 7.2% |
| Total | 1,574 | 100.0% |
Internet Access in Spencerport
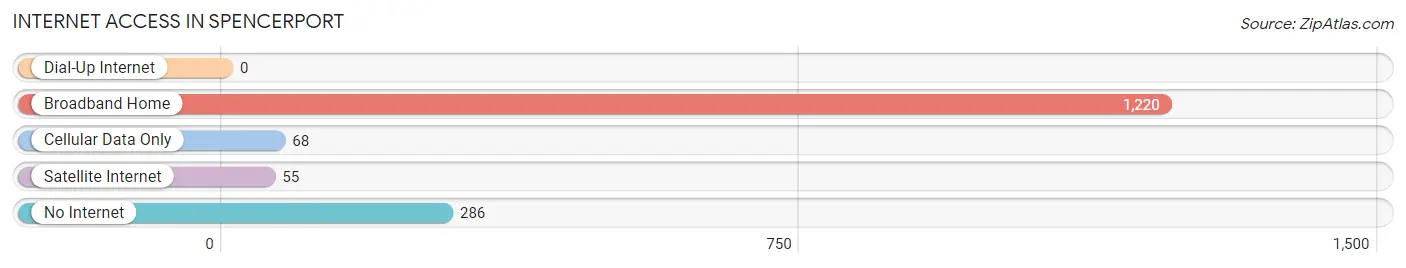
| Internet Type | # Households | % Households |
| Dial-Up Internet | 0 | 0.0% |
| Broadband Home | 1,220 | 77.5% |
| Cellular Data Only | 68 | 4.3% |
| Satellite Internet | 55 | 3.5% |
| No Internet | 286 | 18.2% |
| Total | 1,574 | 100.0% |
Spencerport Summary
Spencerport is a village located in the town of Ogden in Monroe County, New York. It is situated on the Erie Canal and is part of the Rochester metropolitan area. The village has a population of approximately 4,000 people and is located about 15 miles northwest of the city of Rochester.
History
The area that is now Spencerport was first settled in the early 1800s by a group of settlers from Connecticut. The village was originally known as “Spencer’s Port” after the first settler, John Spencer. The village was officially incorporated in 1827 and was named after Spencer.
The village grew rapidly in the mid-1800s due to its location on the Erie Canal. The canal provided a convenient transportation route for goods and people, and the village became a hub for trade and commerce. The village also became a popular destination for tourists, who were drawn to the area’s natural beauty and recreational opportunities.
In the late 1800s, the village began to experience a decline in population as people moved away to larger cities. However, the village experienced a resurgence in the early 1900s when the Rochester and Eastern Rapid Railway was built, connecting Spencerport to Rochester. This allowed for increased trade and commerce, and the village began to grow again.
Geography
Spencerport is located in the town of Ogden in Monroe County, New York. It is situated on the Erie Canal and is part of the Rochester metropolitan area. The village is located about 15 miles northwest of the city of Rochester.
The village is located in a rural area and is surrounded by farmland. The terrain is mostly flat, with some rolling hills in the area. The village is located on the banks of the Genesee River, which flows through the village.
Economy
Spencerport’s economy is largely based on agriculture and tourism. The village is home to several farms, which produce a variety of crops, including corn, soybeans, and wheat. The village is also home to several wineries, which produce a variety of wines.
The village is also a popular tourist destination. The village is home to several parks, including the Genesee Valley Greenway, which is a popular destination for hikers and bikers. The village is also home to several historic sites, including the Spencerport Depot Museum, which is a popular destination for history buffs.
Demographics
As of the 2010 census, the population of Spencerport was 4,077. The population is predominantly white (94.3%), with small percentages of African American (2.2%), Asian (1.2%), and Hispanic (1.2%) residents. The median household income is $50,945, and the median age is 41.
Conclusion
Spencerport is a village located in the town of Ogden in Monroe County, New York. It is situated on the Erie Canal and is part of the Rochester metropolitan area. The village has a population of approximately 4,000 people and is located about 15 miles northwest of the city of Rochester. The village’s economy is largely based on agriculture and tourism, and the population is predominantly white. Spencerport is a popular destination for tourists, who are drawn to the area’s natural beauty and recreational opportunities.
Common Questions
What is Per Capita Income in Spencerport?
Per Capita income in Spencerport is $40,619.
What is the Median Family Income in Spencerport?
Median Family Income in Spencerport is $97,153.
What is the Median Household income in Spencerport?
Median Household Income in Spencerport is $77,500.
What is Income or Wage Gap in Spencerport?
Income or Wage Gap in Spencerport is 17.3%.
Women in Spencerport earn 82.7 cents for every dollar earned by a man.
What is Inequality or Gini Index in Spencerport?
Inequality or Gini Index in Spencerport is 0.40.
What is the Total Population of Spencerport?
Total Population of Spencerport is 3,670.
What is the Total Male Population of Spencerport?
Total Male Population of Spencerport is 1,849.
What is the Total Female Population of Spencerport?
Total Female Population of Spencerport is 1,821.
What is the Ratio of Males per 100 Females in Spencerport?
There are 101.54 Males per 100 Females in Spencerport.
What is the Ratio of Females per 100 Males in Spencerport?
There are 98.49 Females per 100 Males in Spencerport.
What is the Median Population Age in Spencerport?
Median Population Age in Spencerport is 46.3 Years.
What is the Average Family Size in Spencerport
Average Family Size in Spencerport is 2.8 People.
What is the Average Household Size in Spencerport
Average Household Size in Spencerport is 2.3 People.
How Large is the Labor Force in Spencerport?
There are 2,237 People in the Labor Forcein in Spencerport.
What is the Percentage of People in the Labor Force in Spencerport?
70.8% of People are in the Labor Force in Spencerport.
What is the Unemployment Rate in Spencerport?
Unemployment Rate in Spencerport is 3.4%.