Gates, NY Map & Demographics
Gates Map
Gates Overview
$31,966
PER CAPITA INCOME
$59,848
AVG FAMILY INCOME
$53,362
AVG HOUSEHOLD INCOME
38.6%
WAGE / INCOME GAP [ % ]
61.4¢/ $1
WAGE / INCOME GAP [ $ ]
0.38
INEQUALITY / GINI INDEX
4,716
TOTAL POPULATION
2,150
MALE POPULATION
2,566
FEMALE POPULATION
83.79
MALES / 100 FEMALES
119.35
FEMALES / 100 MALES
45.3
MEDIAN AGE
3.0
AVG FAMILY SIZE
2.4
AVG HOUSEHOLD SIZE
2,482
LABOR FORCE [ PEOPLE ]
63.0%
PERCENT IN LABOR FORCE
5.2%
UNEMPLOYMENT RATE
Gates Area Codes
Income in Gates
Income Overview in Gates
Per Capita Income in Gates is $31,966, while median incomes of families and households are $59,848 and $53,362 respectively.
| Characteristic | Number | Measure |
| Per Capita Income | 4,716 | $31,966 |
| Median Family Income | 1,182 | $59,848 |
| Mean Family Income | 1,182 | $80,107 |
| Median Household Income | 2,010 | $53,362 |
| Mean Household Income | 2,010 | $73,922 |
| Income Deficit | 1,182 | $0 |
| Wage / Income Gap (%) | 4,716 | 38.61% |
| Wage / Income Gap ($) | 4,716 | 61.39¢ per $1 |
| Gini / Inequality Index | 4,716 | 0.38 |
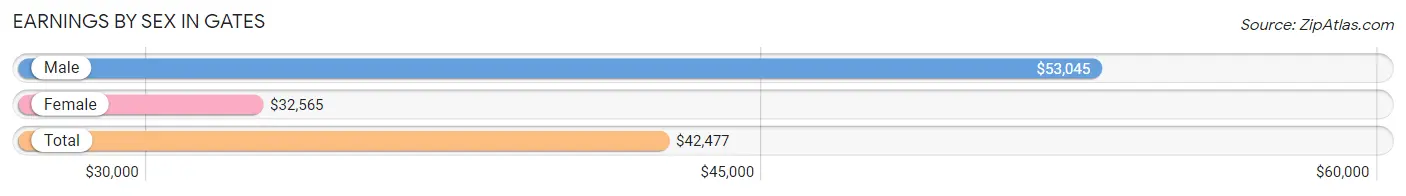
Earnings by Sex in Gates
Average Earnings in Gates are $42,477, $53,045 for men and $32,565 for women, a difference of 38.6%.
| Sex | Number | Average Earnings |
| Male | 1,208 (48.9%) | $53,045 |
| Female | 1,260 (51.0%) | $32,565 |
| Total | 2,468 (100.0%) | $42,477 |
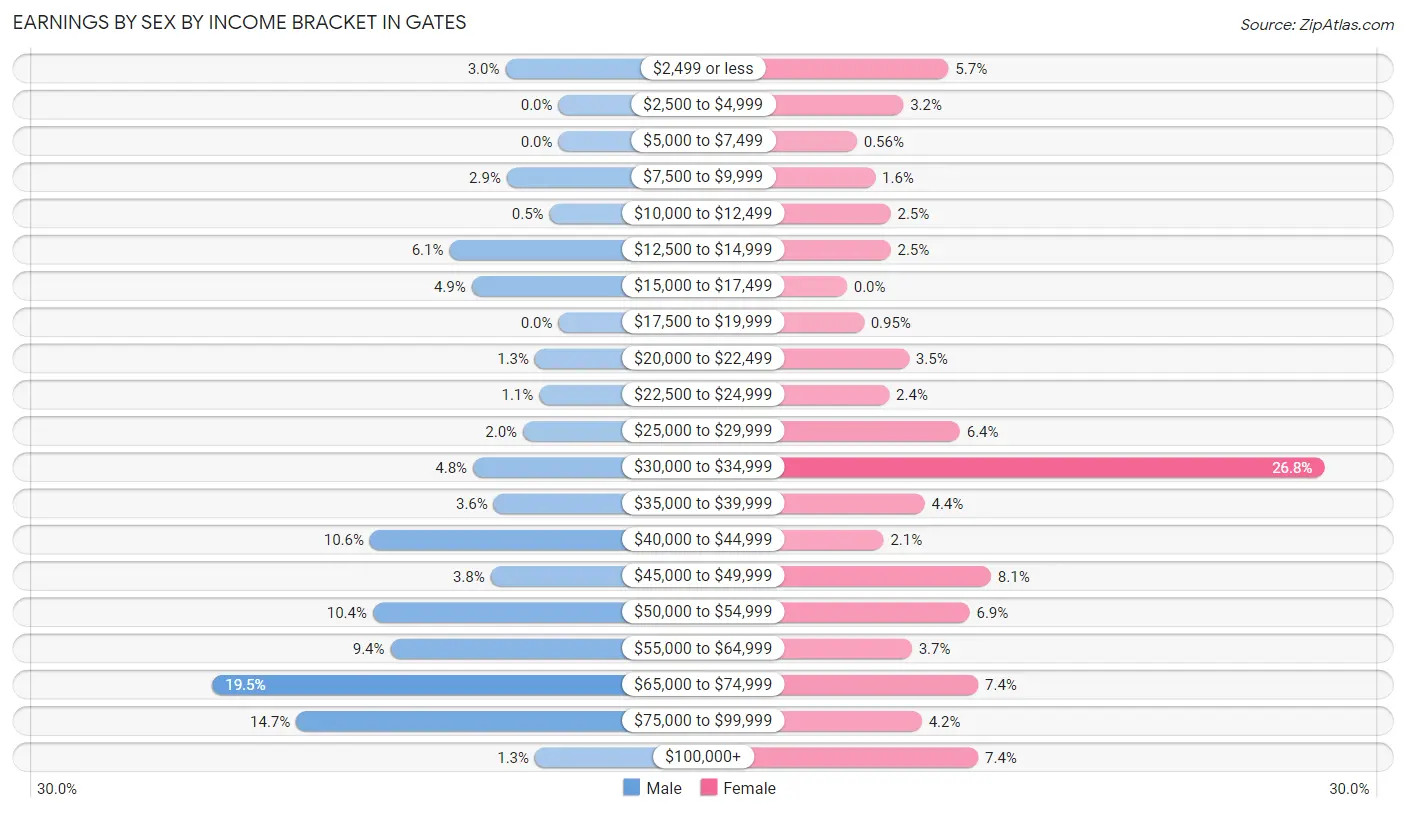
Earnings by Sex by Income Bracket in Gates
The most common earnings brackets in Gates are $65,000 to $74,999 for men (235 | 19.5%) and $30,000 to $34,999 for women (338 | 26.8%).
| Income | Male | Female |
| $2,499 or less | 36 (3.0%) | 72 (5.7%) |
| $2,500 to $4,999 | 0 (0.0%) | 40 (3.2%) |
| $5,000 to $7,499 | 0 (0.0%) | 7 (0.6%) |
| $7,500 to $9,999 | 35 (2.9%) | 20 (1.6%) |
| $10,000 to $12,499 | 6 (0.5%) | 31 (2.5%) |
| $12,500 to $14,999 | 74 (6.1%) | 31 (2.5%) |
| $15,000 to $17,499 | 59 (4.9%) | 0 (0.0%) |
| $17,500 to $19,999 | 0 (0.0%) | 12 (0.9%) |
| $20,000 to $22,499 | 16 (1.3%) | 44 (3.5%) |
| $22,500 to $24,999 | 13 (1.1%) | 30 (2.4%) |
| $25,000 to $29,999 | 24 (2.0%) | 80 (6.4%) |
| $30,000 to $34,999 | 58 (4.8%) | 338 (26.8%) |
| $35,000 to $39,999 | 44 (3.6%) | 55 (4.4%) |
| $40,000 to $44,999 | 128 (10.6%) | 26 (2.1%) |
| $45,000 to $49,999 | 46 (3.8%) | 102 (8.1%) |
| $50,000 to $54,999 | 126 (10.4%) | 87 (6.9%) |
| $55,000 to $64,999 | 114 (9.4%) | 46 (3.6%) |
| $65,000 to $74,999 | 235 (19.5%) | 93 (7.4%) |
| $75,000 to $99,999 | 178 (14.7%) | 53 (4.2%) |
| $100,000+ | 16 (1.3%) | 93 (7.4%) |
| Total | 1,208 (100.0%) | 1,260 (100.0%) |
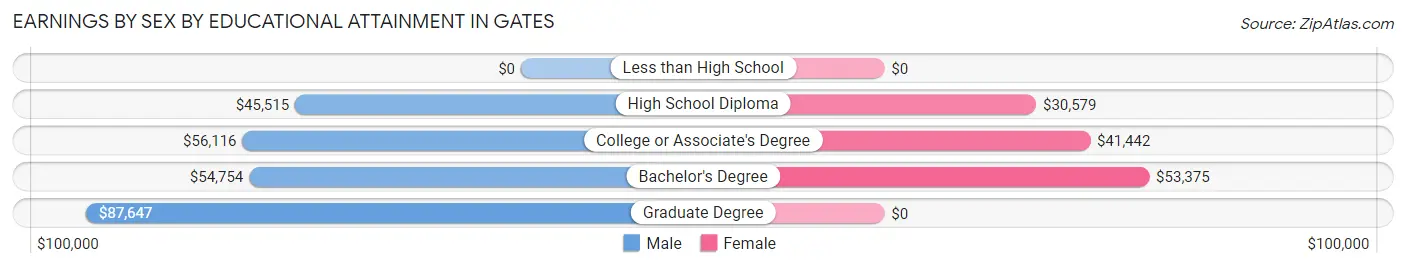
Earnings by Sex by Educational Attainment in Gates
Average earnings in Gates are $53,109 for men and $37,974 for women, a difference of 28.5%. Men with an educational attainment of graduate degree enjoy the highest average annual earnings of $87,647, while those with high school diploma education earn the least with $45,515. Women with an educational attainment of bachelor's degree earn the most with the average annual earnings of $53,375, while those with high school diploma education have the smallest earnings of $30,579.
| Educational Attainment | Male Income | Female Income |
| Less than High School | - | - |
| High School Diploma | $45,515 | $30,579 |
| College or Associate's Degree | $56,116 | $41,442 |
| Bachelor's Degree | $54,754 | $53,375 |
| Graduate Degree | $87,647 | $0 |
| Total | $53,109 | $37,974 |
Family Income in Gates
Family Income Brackets in Gates
According to the Gates family income data, there are 287 families falling into the $100,000 to $149,999 income range, which is the most common income bracket and makes up 24.3% of all families.
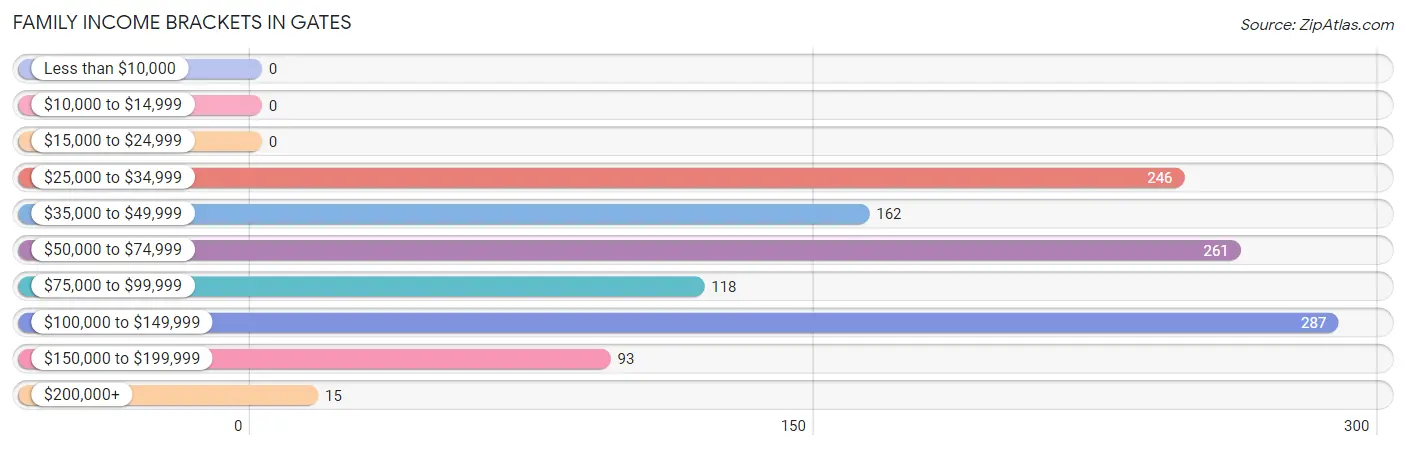
| Income Bracket | # Families | % Families |
| Less than $10,000 | 0 | 0.0% |
| $10,000 to $14,999 | 0 | 0.0% |
| $15,000 to $24,999 | 0 | 0.0% |
| $25,000 to $34,999 | 246 | 20.8% |
| $35,000 to $49,999 | 162 | 13.7% |
| $50,000 to $74,999 | 261 | 22.1% |
| $75,000 to $99,999 | 118 | 10.0% |
| $100,000 to $149,999 | 287 | 24.3% |
| $150,000 to $199,999 | 93 | 7.9% |
| $200,000+ | 15 | 1.3% |
Family Income by Famaliy Size in Gates
3-person families (381 | 32.2%) account for the highest median family income in Gates with $107,641 per family, while 3-person families (381 | 32.2%) have the highest median income of $35,880 per family member.
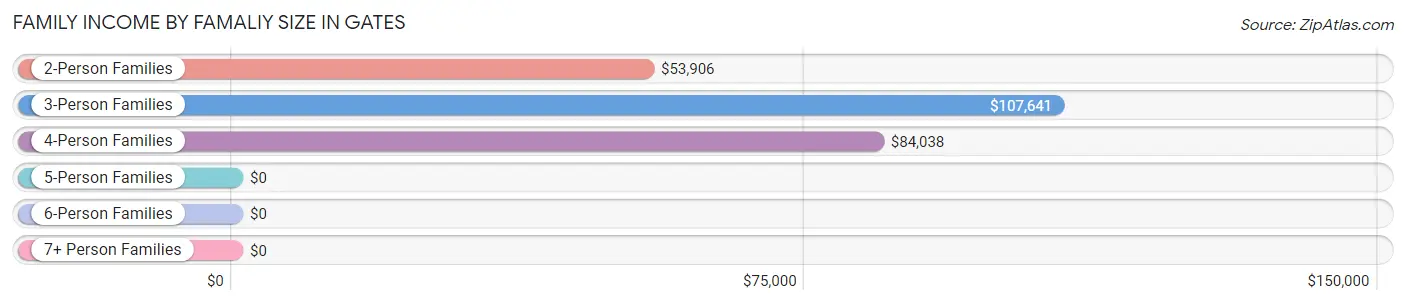
| Income Bracket | # Families | Median Income |
| 2-Person Families | 521 (44.1%) | $53,906 |
| 3-Person Families | 381 (32.2%) | $107,641 |
| 4-Person Families | 108 (9.1%) | $84,038 |
| 5-Person Families | 138 (11.7%) | $0 |
| 6-Person Families | 0 (0.0%) | $0 |
| 7+ Person Families | 34 (2.9%) | $0 |
| Total | 1,182 (100.0%) | $59,848 |
Family Income by Number of Earners in Gates
The median family income in Gates is $59,848, with families comprising 3+ earners (186) having the highest median family income of $135,625, while families with no earners (210) have the lowest median family income of $43,676, accounting for 15.7% and 17.8% of families, respectively.
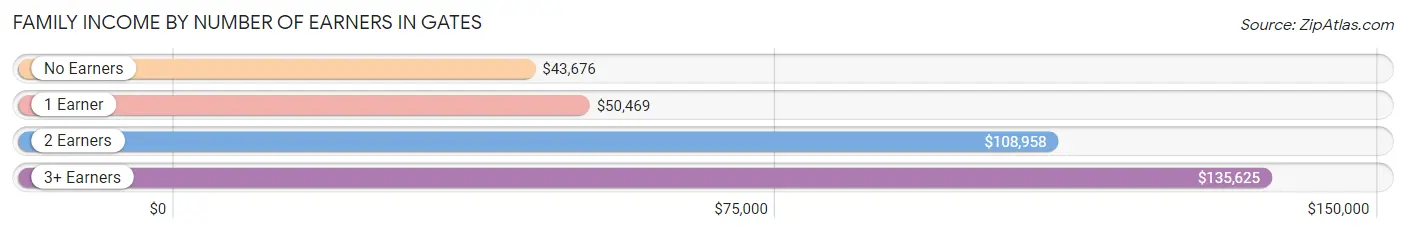
| Number of Earners | # Families | Median Income |
| No Earners | 210 (17.8%) | $43,676 |
| 1 Earner | 475 (40.2%) | $50,469 |
| 2 Earners | 311 (26.3%) | $108,958 |
| 3+ Earners | 186 (15.7%) | $135,625 |
| Total | 1,182 (100.0%) | $59,848 |
Household Income in Gates
Household Income Brackets in Gates
With 406 households falling in the category, the $100,000 to $149,999 income range is the most frequent in Gates, accounting for 20.2% of all households. In contrast, only 6 households (0.3%) fall into the $10,000 to $14,999 income bracket, making it the least populous group.
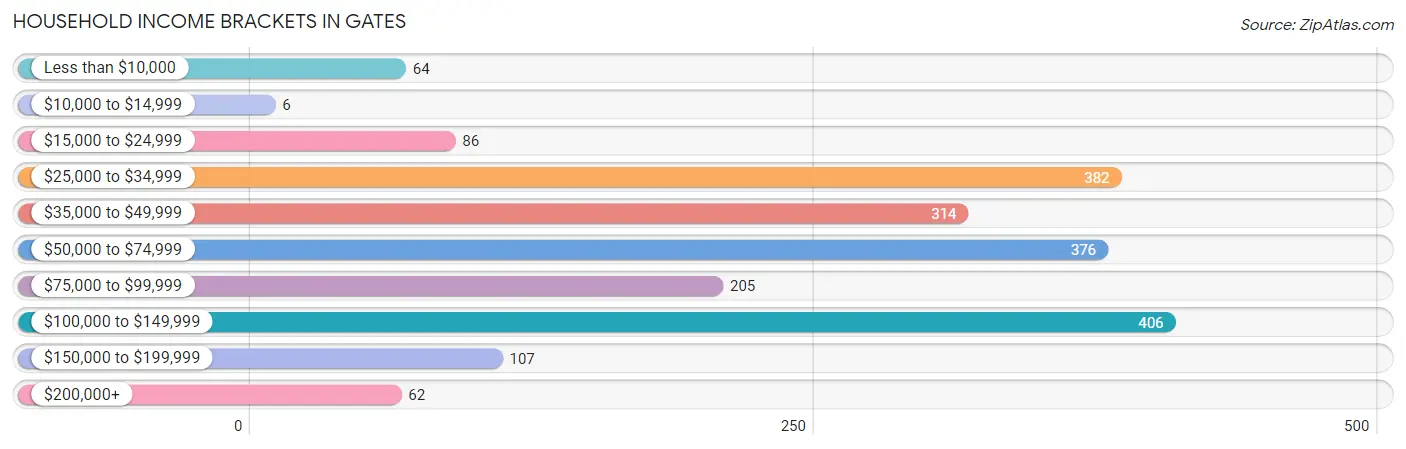
| Income Bracket | # Households | % Households |
| Less than $10,000 | 64 | 3.2% |
| $10,000 to $14,999 | 6 | 0.3% |
| $15,000 to $24,999 | 86 | 4.3% |
| $25,000 to $34,999 | 382 | 19.0% |
| $35,000 to $49,999 | 314 | 15.6% |
| $50,000 to $74,999 | 376 | 18.7% |
| $75,000 to $99,999 | 205 | 10.2% |
| $100,000 to $149,999 | 406 | 20.2% |
| $150,000 to $199,999 | 107 | 5.3% |
| $200,000+ | 62 | 3.1% |
Household Income by Householder Age in Gates
The median household income in Gates is $53,362, with the highest median household income of $89,688 found in the 45 to 64 years age bracket for the primary householder. A total of 723 households (36.0%) fall into this category. Meanwhile, the 15 to 24 years age bracket for the primary householder has the lowest median household income of $0, with 61 households (3.0%) in this group.
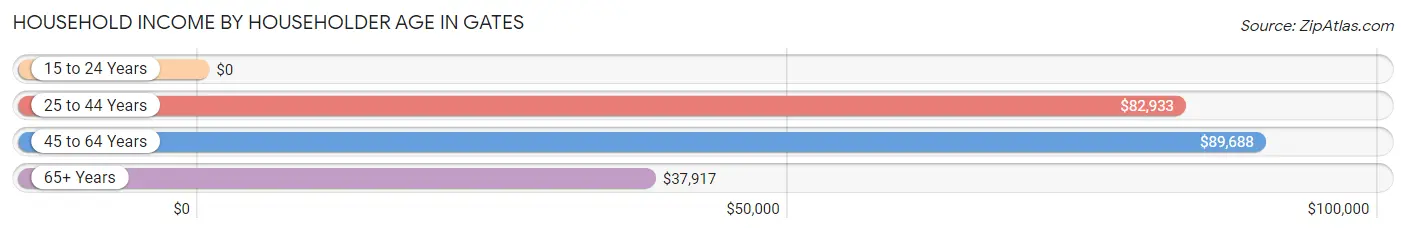
| Income Bracket | # Households | Median Income |
| 15 to 24 Years | 61 (3.0%) | $0 |
| 25 to 44 Years | 525 (26.1%) | $82,933 |
| 45 to 64 Years | 723 (36.0%) | $89,688 |
| 65+ Years | 701 (34.9%) | $37,917 |
| Total | 2,010 (100.0%) | $53,362 |
Poverty in Gates
Income Below Poverty by Sex and Age in Gates
With 8.8% poverty level for males and 13.0% for females among the residents of Gates, 6 to 11 year old males and 16 and 17 year old females are the most vulnerable to poverty, with 46 males (37.7%) and 45 females (53.6%) in their respective age groups living below the poverty level.
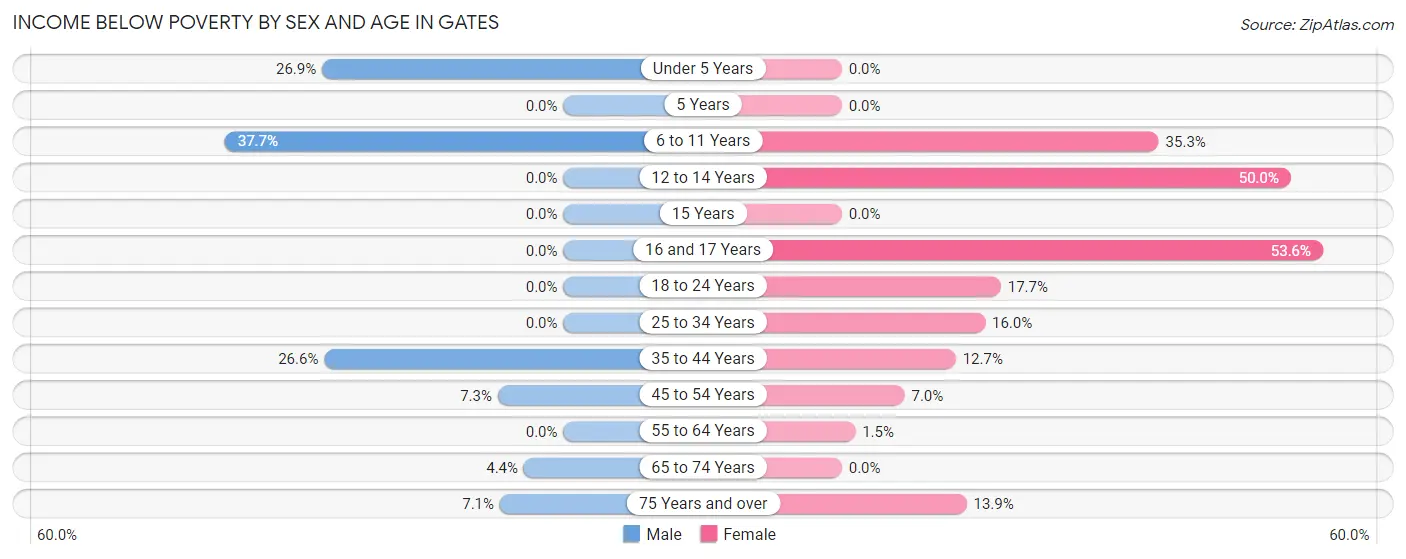
| Age Bracket | Male | Female |
| Under 5 Years | 61 (26.9%) | 0 (0.0%) |
| 5 Years | 0 (0.0%) | 0 (0.0%) |
| 6 to 11 Years | 46 (37.7%) | 72 (35.3%) |
| 12 to 14 Years | 0 (0.0%) | 23 (50.0%) |
| 15 Years | 0 (0.0%) | 0 (0.0%) |
| 16 and 17 Years | 0 (0.0%) | 45 (53.6%) |
| 18 to 24 Years | 0 (0.0%) | 34 (17.7%) |
| 25 to 34 Years | 0 (0.0%) | 59 (16.0%) |
| 35 to 44 Years | 45 (26.6%) | 25 (12.7%) |
| 45 to 54 Years | 20 (7.3%) | 19 (7.0%) |
| 55 to 64 Years | 0 (0.0%) | 7 (1.5%) |
| 65 to 74 Years | 8 (4.4%) | 0 (0.0%) |
| 75 Years and over | 7 (7.1%) | 50 (13.9%) |
| Total | 187 (8.8%) | 334 (13.0%) |
Income Above Poverty by Sex and Age in Gates
According to the poverty statistics in Gates, males aged 5 years and females aged under 5 years are the age groups that are most secure financially, with 100.0% of males and 100.0% of females in these age groups living above the poverty line.
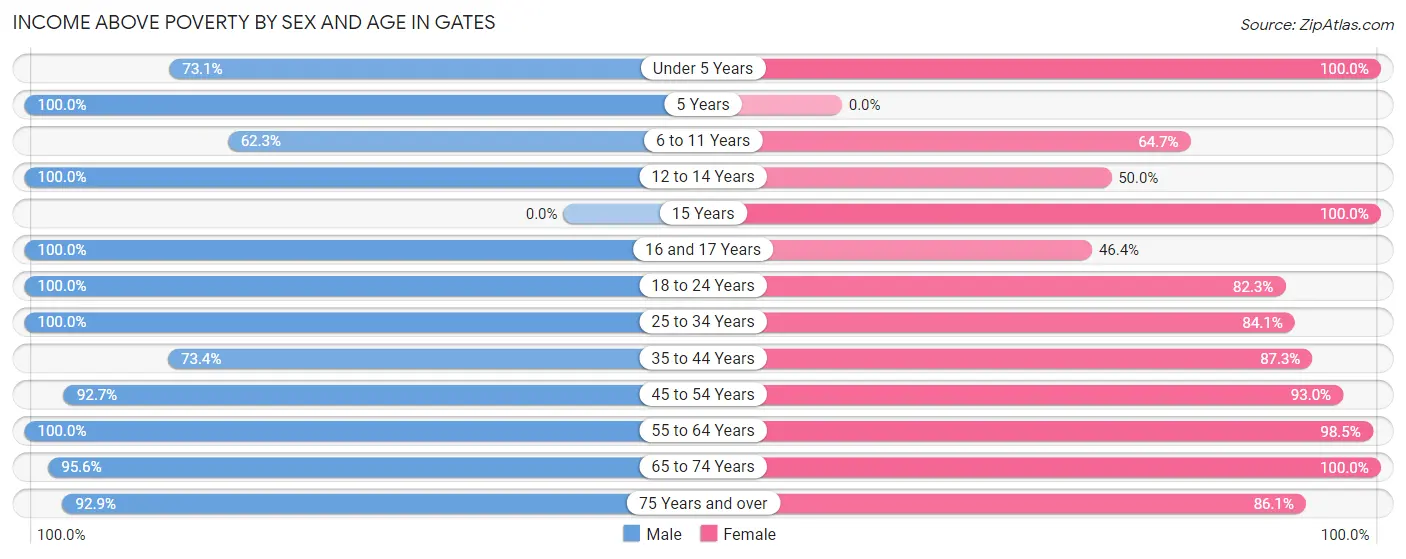
| Age Bracket | Male | Female |
| Under 5 Years | 166 (73.1%) | 58 (100.0%) |
| 5 Years | 35 (100.0%) | 0 (0.0%) |
| 6 to 11 Years | 76 (62.3%) | 132 (64.7%) |
| 12 to 14 Years | 44 (100.0%) | 23 (50.0%) |
| 15 Years | 0 (0.0%) | 22 (100.0%) |
| 16 and 17 Years | 15 (100.0%) | 39 (46.4%) |
| 18 to 24 Years | 121 (100.0%) | 158 (82.3%) |
| 25 to 34 Years | 409 (100.0%) | 311 (84.1%) |
| 35 to 44 Years | 124 (73.4%) | 172 (87.3%) |
| 45 to 54 Years | 254 (92.7%) | 253 (93.0%) |
| 55 to 64 Years | 434 (100.0%) | 464 (98.5%) |
| 65 to 74 Years | 174 (95.6%) | 290 (100.0%) |
| 75 Years and over | 92 (92.9%) | 310 (86.1%) |
| Total | 1,944 (91.2%) | 2,232 (87.0%) |
Income Below Poverty Among Married-Couple Families in Gates
The poverty statistics for married-couple families in Gates show that 3.8% or 28 of the total 736 families live below the poverty line. Families with 1 or 2 children have the highest poverty rate of 14.7%, comprising of 28 families. On the other hand, families with no children have the lowest poverty rate of 0.0%, which includes 0 families.
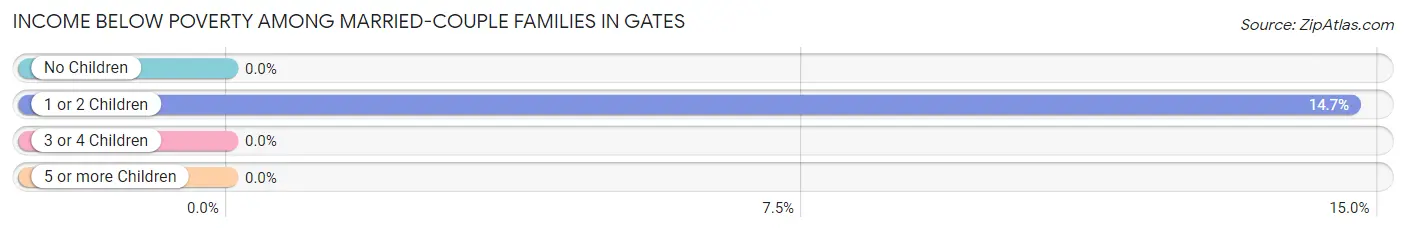
| Children | Above Poverty | Below Poverty |
| No Children | 545 (100.0%) | 0 (0.0%) |
| 1 or 2 Children | 163 (85.3%) | 28 (14.7%) |
| 3 or 4 Children | 0 (0.0%) | 0 (0.0%) |
| 5 or more Children | 0 (0.0%) | 0 (0.0%) |
| Total | 708 (96.2%) | 28 (3.8%) |
Income Below Poverty Among Single-Parent Households in Gates
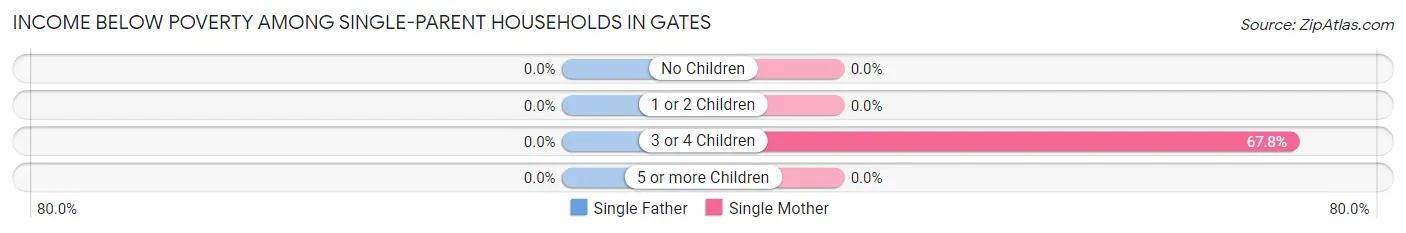
| Children | Single Father | Single Mother |
| No Children | 0 (0.0%) | 0 (0.0%) |
| 1 or 2 Children | 0 (0.0%) | 0 (0.0%) |
| 3 or 4 Children | 0 (0.0%) | 59 (67.8%) |
| 5 or more Children | 0 (0.0%) | 0 (0.0%) |
| Total | 0 (0.0%) | 59 (16.0%) |
Income Below Poverty Among Married-Couple vs Single-Parent Households in Gates
The poverty data for Gates shows that 28 of the married-couple family households (3.8%) and 59 of the single-parent households (13.2%) are living below the poverty level. Within the married-couple family households, those with 1 or 2 children have the highest poverty rate, with 28 households (14.7%) falling below the poverty line. Among the single-parent households, those with 3 or 4 children have the highest poverty rate, with 59 household (67.8%) living below poverty.
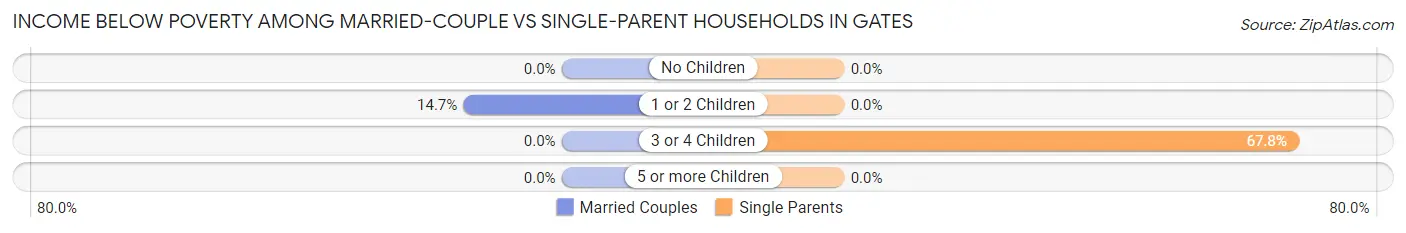
| Children | Married-Couple Families | Single-Parent Households |
| No Children | 0 (0.0%) | 0 (0.0%) |
| 1 or 2 Children | 28 (14.7%) | 0 (0.0%) |
| 3 or 4 Children | 0 (0.0%) | 59 (67.8%) |
| 5 or more Children | 0 (0.0%) | 0 (0.0%) |
| Total | 28 (3.8%) | 59 (13.2%) |
Race in Gates
The most populous races in Gates are White / Caucasian (3,987 | 84.5%), Hispanic or Latino (436 | 9.2%), and Two or more Races (375 | 8.0%).
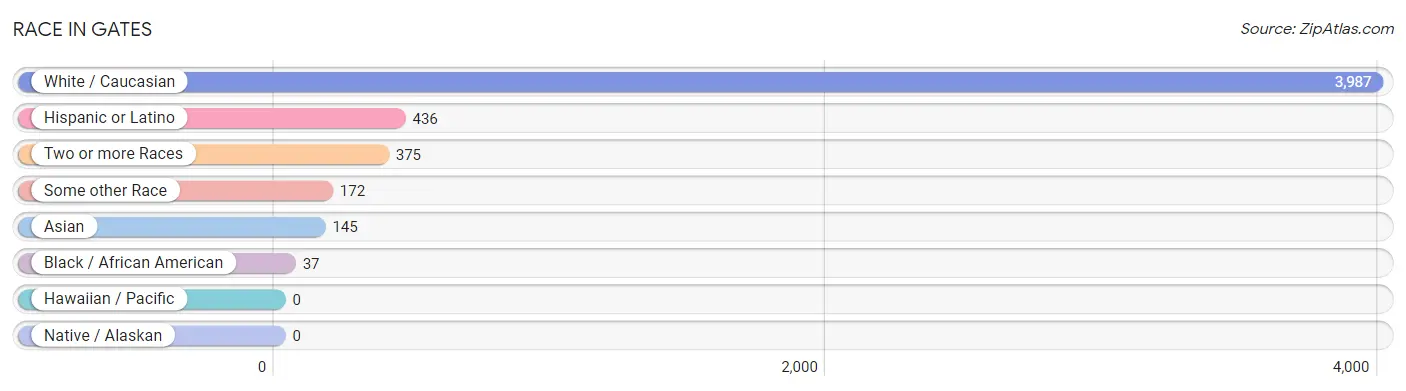
| Race | # Population | % Population |
| Asian | 145 | 3.1% |
| Black / African American | 37 | 0.8% |
| Hawaiian / Pacific | 0 | 0.0% |
| Hispanic or Latino | 436 | 9.2% |
| Native / Alaskan | 0 | 0.0% |
| White / Caucasian | 3,987 | 84.5% |
| Two or more Races | 375 | 8.0% |
| Some other Race | 172 | 3.6% |
| Total | 4,716 | 100.0% |
Ancestry in Gates
The most populous ancestries reported in Gates are Italian (1,217 | 25.8%), German (1,113 | 23.6%), Irish (944 | 20.0%), English (302 | 6.4%), and Puerto Rican (280 | 5.9%), together accounting for 81.8% of all Gates residents.
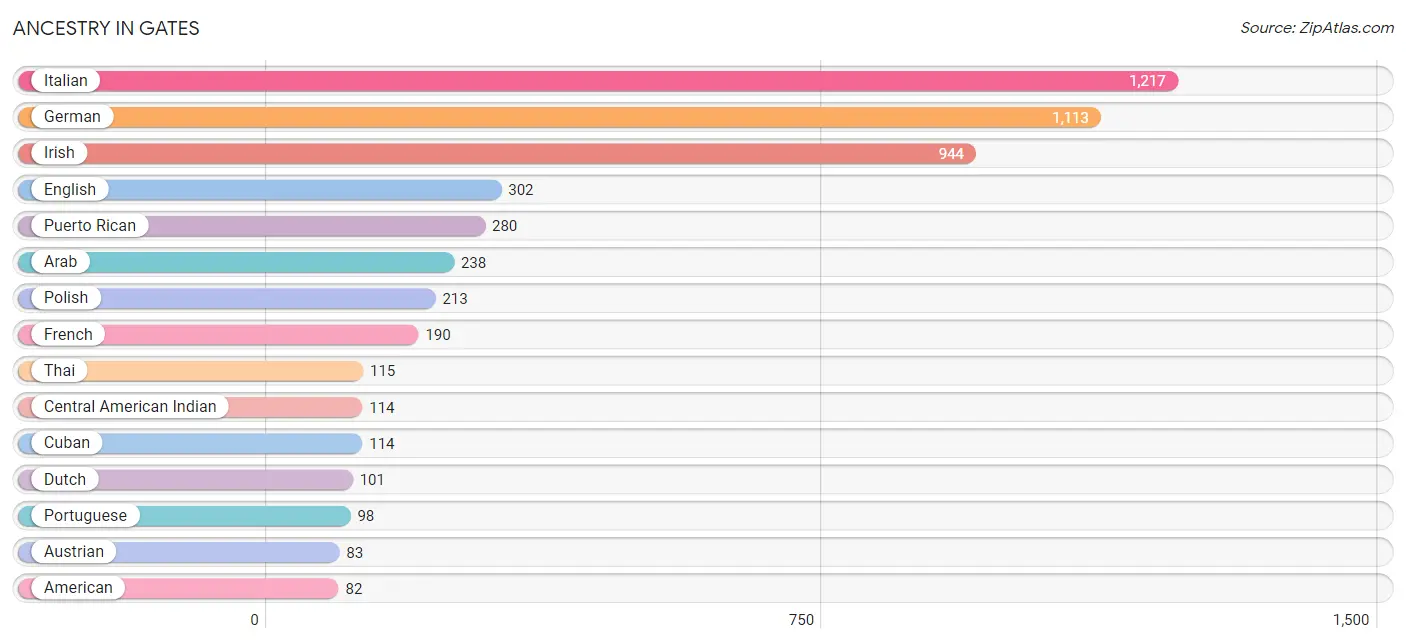
| Ancestry | # Population | % Population |
| African | 23 | 0.5% |
| American | 82 | 1.7% |
| Arab | 238 | 5.1% |
| Austrian | 83 | 1.8% |
| Belgian | 21 | 0.4% |
| Bhutanese | 6 | 0.1% |
| British | 14 | 0.3% |
| Canadian | 25 | 0.5% |
| Central American Indian | 114 | 2.4% |
| Colombian | 4 | 0.1% |
| Cuban | 114 | 2.4% |
| Czech | 9 | 0.2% |
| Danish | 9 | 0.2% |
| Dominican | 25 | 0.5% |
| Dutch | 101 | 2.1% |
| English | 302 | 6.4% |
| European | 26 | 0.5% |
| French | 190 | 4.0% |
| French Canadian | 76 | 1.6% |
| German | 1,113 | 23.6% |
| Indian (Asian) | 30 | 0.6% |
| Irish | 944 | 20.0% |
| Iroquois | 5 | 0.1% |
| Italian | 1,217 | 25.8% |
| Korean | 13 | 0.3% |
| Mexican | 13 | 0.3% |
| Polish | 213 | 4.5% |
| Portuguese | 98 | 2.1% |
| Puerto Rican | 280 | 5.9% |
| Scotch-Irish | 25 | 0.5% |
| Scottish | 37 | 0.8% |
| Slovene | 17 | 0.4% |
| South American | 4 | 0.1% |
| Sri Lankan | 7 | 0.2% |
| Subsaharan African | 23 | 0.5% |
| Swiss | 48 | 1.0% |
| Thai | 115 | 2.4% |
| Welsh | 12 | 0.3% | View All 38 Rows |
Immigrants in Gates
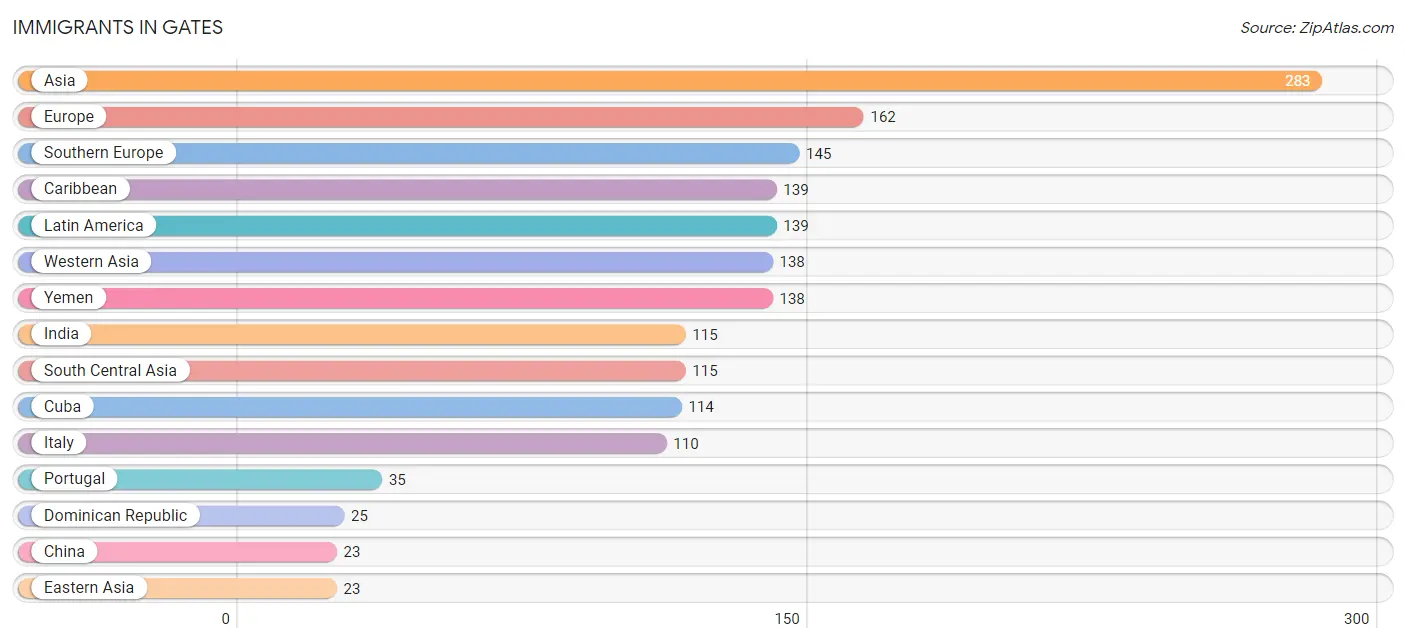
The most numerous immigrant groups reported in Gates came from Asia (283 | 6.0%), Europe (162 | 3.4%), Southern Europe (145 | 3.1%), Caribbean (139 | 2.9%), and Latin America (139 | 2.9%), together accounting for 18.4% of all Gates residents.
| Immigration Origin | # Population | % Population |
| Asia | 283 | 6.0% |
| Caribbean | 139 | 2.9% |
| China | 23 | 0.5% |
| Cuba | 114 | 2.4% |
| Denmark | 9 | 0.2% |
| Dominican Republic | 25 | 0.5% |
| Eastern Asia | 23 | 0.5% |
| Europe | 162 | 3.4% |
| Germany | 8 | 0.2% |
| India | 115 | 2.4% |
| Italy | 110 | 2.3% |
| Latin America | 139 | 2.9% |
| Northern Europe | 9 | 0.2% |
| Portugal | 35 | 0.7% |
| South Central Asia | 115 | 2.4% |
| South Eastern Asia | 7 | 0.2% |
| Southern Europe | 145 | 3.1% |
| Vietnam | 7 | 0.2% |
| Western Asia | 138 | 2.9% |
| Western Europe | 8 | 0.2% |
| Yemen | 138 | 2.9% | View All 21 Rows |
Sex and Age in Gates
Sex and Age in Gates
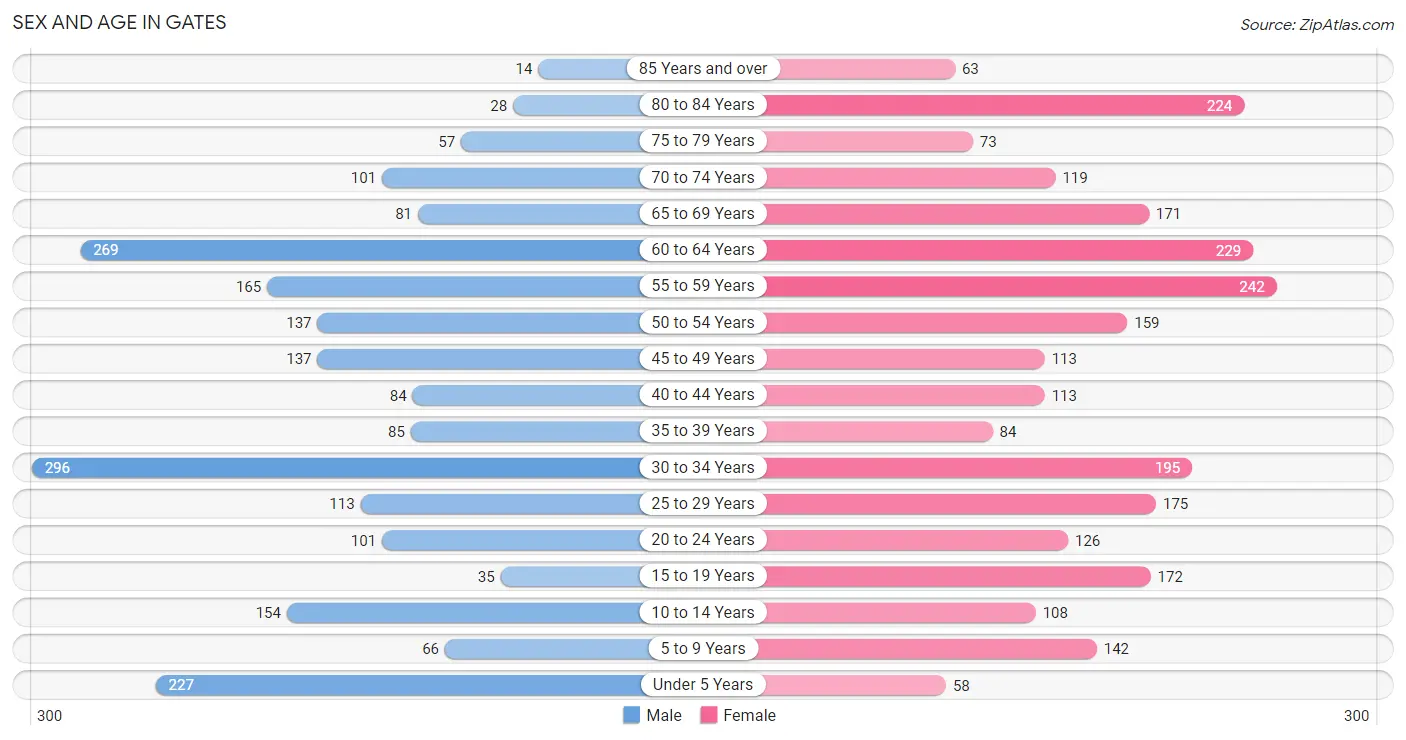
The most populous age groups in Gates are 30 to 34 Years (296 | 13.8%) for men and 55 to 59 Years (242 | 9.4%) for women.
| Age Bracket | Male | Female |
| Under 5 Years | 227 (10.6%) | 58 (2.3%) |
| 5 to 9 Years | 66 (3.1%) | 142 (5.5%) |
| 10 to 14 Years | 154 (7.2%) | 108 (4.2%) |
| 15 to 19 Years | 35 (1.6%) | 172 (6.7%) |
| 20 to 24 Years | 101 (4.7%) | 126 (4.9%) |
| 25 to 29 Years | 113 (5.3%) | 175 (6.8%) |
| 30 to 34 Years | 296 (13.8%) | 195 (7.6%) |
| 35 to 39 Years | 85 (4.0%) | 84 (3.3%) |
| 40 to 44 Years | 84 (3.9%) | 113 (4.4%) |
| 45 to 49 Years | 137 (6.4%) | 113 (4.4%) |
| 50 to 54 Years | 137 (6.4%) | 159 (6.2%) |
| 55 to 59 Years | 165 (7.7%) | 242 (9.4%) |
| 60 to 64 Years | 269 (12.5%) | 229 (8.9%) |
| 65 to 69 Years | 81 (3.8%) | 171 (6.7%) |
| 70 to 74 Years | 101 (4.7%) | 119 (4.6%) |
| 75 to 79 Years | 57 (2.6%) | 73 (2.8%) |
| 80 to 84 Years | 28 (1.3%) | 224 (8.7%) |
| 85 Years and over | 14 (0.6%) | 63 (2.5%) |
| Total | 2,150 (100.0%) | 2,566 (100.0%) |
Families and Households in Gates
Median Family Size in Gates
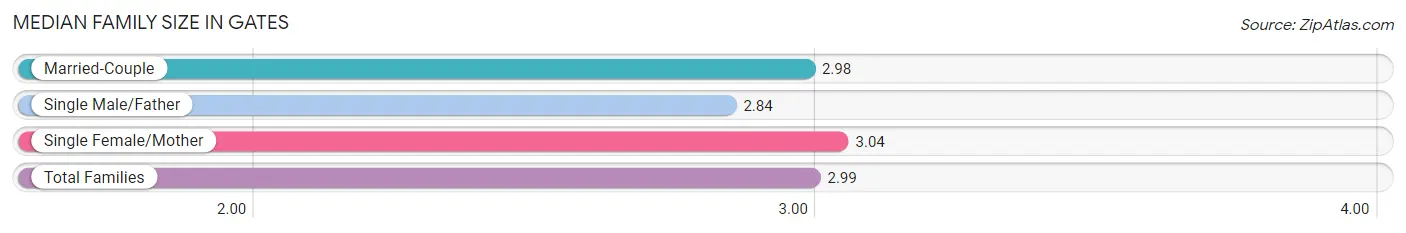
The median family size in Gates is 2.99 persons per family, with single female/mother families (369 | 31.2%) accounting for the largest median family size of 3.04 persons per family. On the other hand, single male/father families (77 | 6.5%) represent the smallest median family size with 2.84 persons per family.
| Family Type | # Families | Family Size |
| Married-Couple | 736 (62.3%) | 2.98 |
| Single Male/Father | 77 (6.5%) | 2.84 |
| Single Female/Mother | 369 (31.2%) | 3.04 |
| Total Families | 1,182 (100.0%) | 2.99 |
Median Household Size in Gates
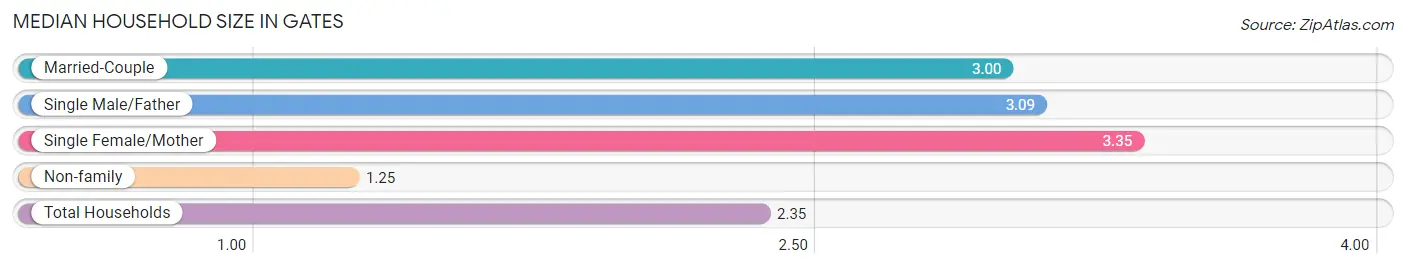
The median household size in Gates is 2.35 persons per household, with single female/mother households (369 | 18.4%) accounting for the largest median household size of 3.35 persons per household. non-family households (828 | 41.2%) represent the smallest median household size with 1.25 persons per household.
| Household Type | # Households | Household Size |
| Married-Couple | 736 (36.6%) | 3.00 |
| Single Male/Father | 77 (3.8%) | 3.09 |
| Single Female/Mother | 369 (18.4%) | 3.35 |
| Non-family | 828 (41.2%) | 1.25 |
| Total Households | 2,010 (100.0%) | 2.35 |
Household Size by Marriage Status in Gates
Out of a total of 2,010 households in Gates, 1,182 (58.8%) are family households, while 828 (41.2%) are nonfamily households. The most numerous type of family households are 2-person households, comprising 521, and the most common type of nonfamily households are 1-person households, comprising 643.
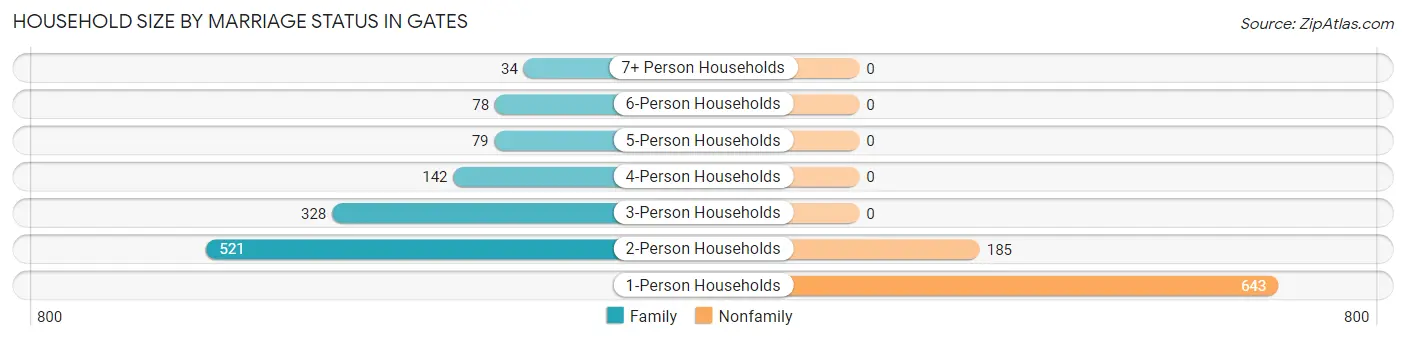
| Household Size | Family Households | Nonfamily Households |
| 1-Person Households | - | 643 (32.0%) |
| 2-Person Households | 521 (25.9%) | 185 (9.2%) |
| 3-Person Households | 328 (16.3%) | 0 (0.0%) |
| 4-Person Households | 142 (7.1%) | 0 (0.0%) |
| 5-Person Households | 79 (3.9%) | 0 (0.0%) |
| 6-Person Households | 78 (3.9%) | 0 (0.0%) |
| 7+ Person Households | 34 (1.7%) | 0 (0.0%) |
| Total | 1,182 (58.8%) | 828 (41.2%) |
Female Fertility in Gates
Fertility by Age in Gates
Average fertility rate in Gates is 11.0 births per 1,000 women. Women in the age bracket of 20 to 34 years have the highest fertility rate with 22.0 births per 1,000 women. Women in the age bracket of 20 to 34 years acount for 100.0% of all women with births.
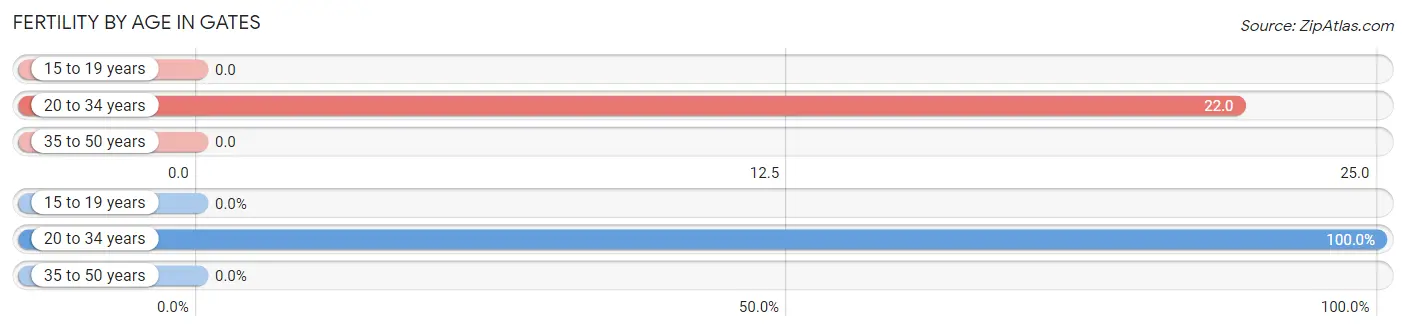
| Age Bracket | Women with Births | Births / 1,000 Women |
| 15 to 19 years | 0 (0.0%) | 0.0 |
| 20 to 34 years | 11 (100.0%) | 22.0 |
| 35 to 50 years | 0 (0.0%) | 0.0 |
| Total | 11 (100.0%) | 11.0 |
Fertility by Age by Marriage Status in Gates
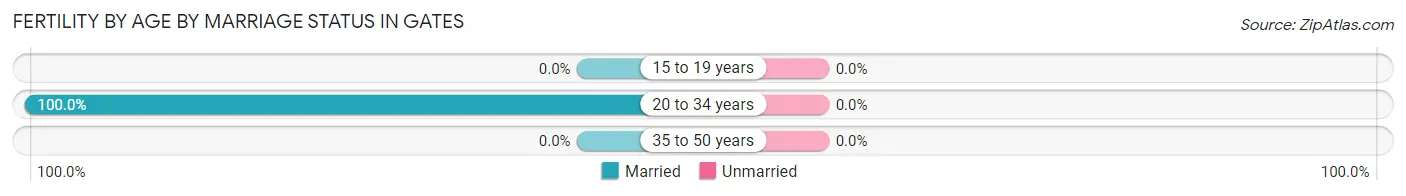
| Age Bracket | Married | Unmarried |
| 15 to 19 years | 0 (0.0%) | 0 (0.0%) |
| 20 to 34 years | 11 (100.0%) | 0 (0.0%) |
| 35 to 50 years | 0 (0.0%) | 0 (0.0%) |
| Total | 11 (100.0%) | 0 (0.0%) |
Fertility by Education in Gates
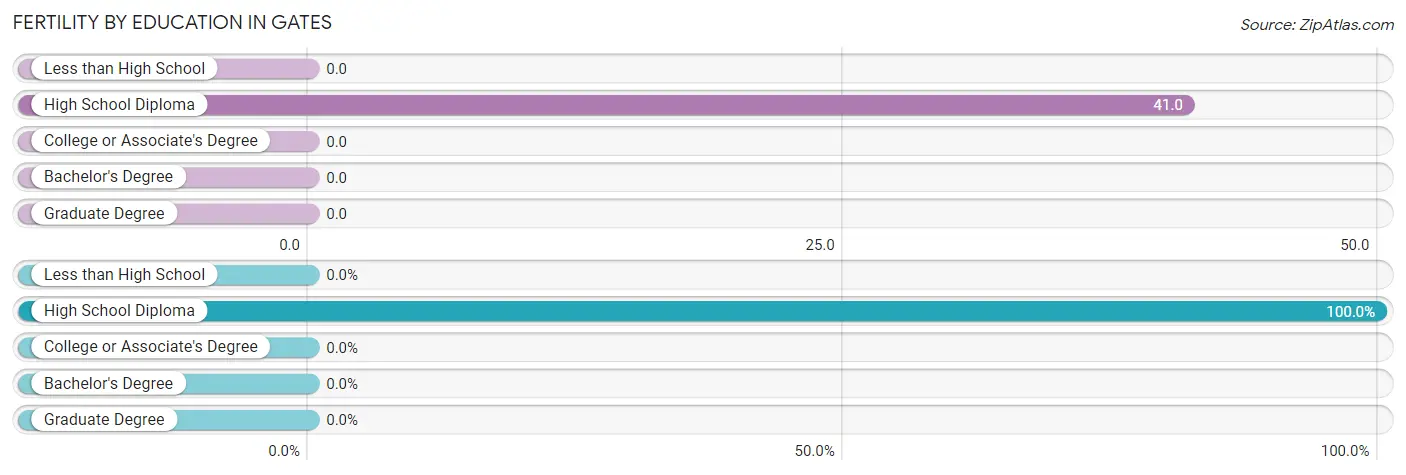
| Educational Attainment | Women with Births | Births / 1,000 Women |
| Less than High School | 0 (0.0%) | 0.0 |
| High School Diploma | 11 (100.0%) | 41.0 |
| College or Associate's Degree | 0 (0.0%) | 0.0 |
| Bachelor's Degree | 0 (0.0%) | 0.0 |
| Graduate Degree | 0 (0.0%) | 0.0 |
| Total | 11 (100.0%) | 11.0 |
Fertility by Education by Marriage Status in Gates
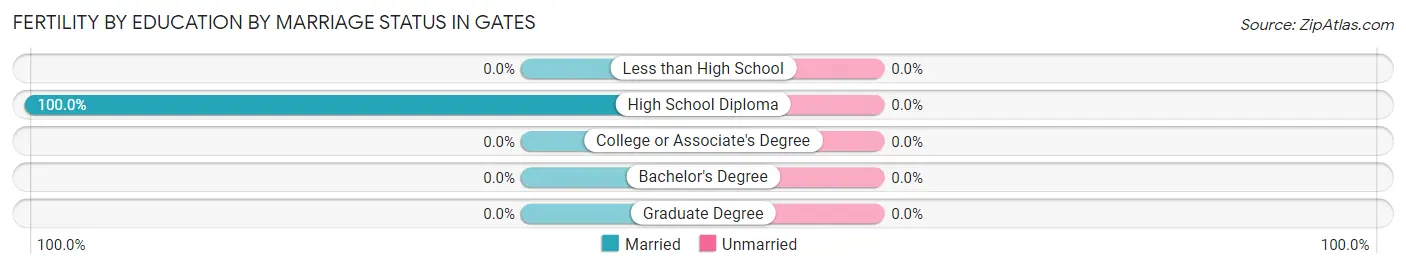
| Educational Attainment | Married | Unmarried |
| Less than High School | 0 (0.0%) | 0 (0.0%) |
| High School Diploma | 11 (100.0%) | 0 (0.0%) |
| College or Associate's Degree | 0 (0.0%) | 0 (0.0%) |
| Bachelor's Degree | 0 (0.0%) | 0 (0.0%) |
| Graduate Degree | 0 (0.0%) | 0 (0.0%) |
| Total | 11 (100.0%) | 0 (0.0%) |
Employment Characteristics in Gates
Employment by Class of Employer in Gates
Among the 2,316 employed individuals in Gates, private company employees (1,506 | 65.0%), not-for-profit organizations (256 | 11.1%), and self-employed (not incorporated) (199 | 8.6%) make up the most common classes of employment.
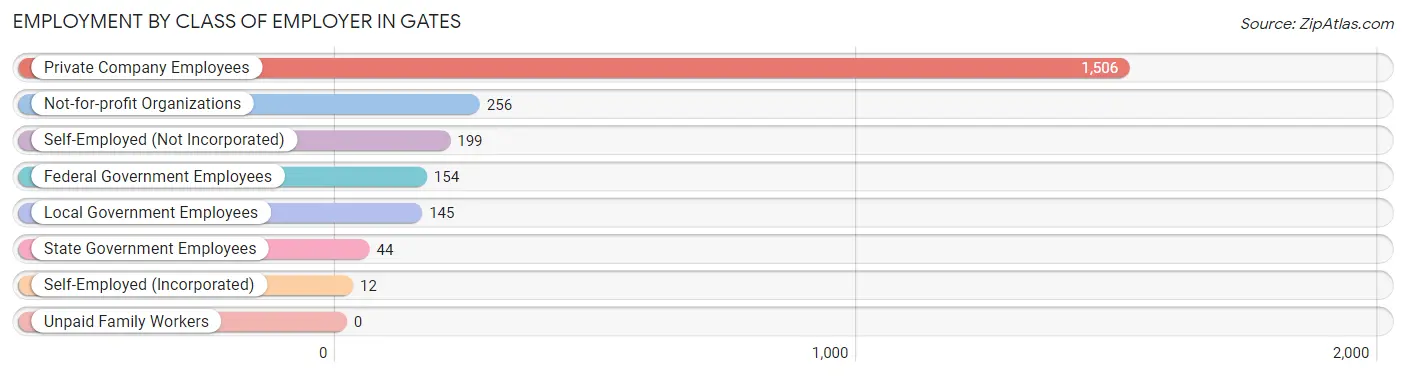
| Employer Class | # Employees | % Employees |
| Private Company Employees | 1,506 | 65.0% |
| Self-Employed (Incorporated) | 12 | 0.5% |
| Self-Employed (Not Incorporated) | 199 | 8.6% |
| Not-for-profit Organizations | 256 | 11.1% |
| Local Government Employees | 145 | 6.3% |
| State Government Employees | 44 | 1.9% |
| Federal Government Employees | 154 | 6.7% |
| Unpaid Family Workers | 0 | 0.0% |
| Total | 2,316 | 100.0% |
Employment Status by Age in Gates
According to the labor force statistics for Gates, out of the total population over 16 years of age (3,939), 63.0% or 2,482 individuals are in the labor force, with 5.2% or 129 of them unemployed. The age group with the highest labor force participation rate is 30 to 34 years, with 97.8% or 480 individuals in the labor force. Within the labor force, the 75 years and over age range has the highest percentage of unemployed individuals, with 55.7% or 39 of them being unemployed.
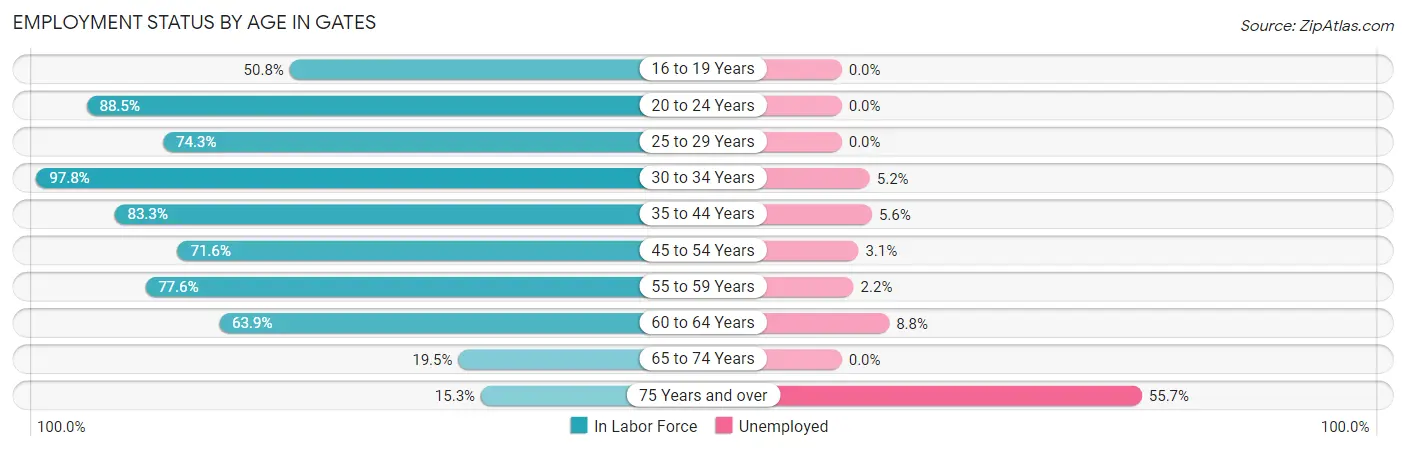
| Age Bracket | In Labor Force | Unemployed |
| 16 to 19 Years | 94 (50.8%) | 0 (0.0%) |
| 20 to 24 Years | 201 (88.5%) | 0 (0.0%) |
| 25 to 29 Years | 214 (74.3%) | 0 (0.0%) |
| 30 to 34 Years | 480 (97.8%) | 25 (5.2%) |
| 35 to 44 Years | 305 (83.3%) | 17 (5.6%) |
| 45 to 54 Years | 391 (71.6%) | 12 (3.1%) |
| 55 to 59 Years | 316 (77.6%) | 7 (2.2%) |
| 60 to 64 Years | 318 (63.9%) | 28 (8.8%) |
| 65 to 74 Years | 92 (19.5%) | 0 (0.0%) |
| 75 Years and over | 70 (15.3%) | 39 (55.7%) |
| Total | 2,482 (63.0%) | 129 (5.2%) |
Employment Status by Educational Attainment in Gates
According to labor force statistics for Gates, 78.0% of individuals (2,025) out of the total population between 25 and 64 years of age (2,596) are in the labor force, with 4.4% or 89 of them being unemployed. The group with the highest labor force participation rate are those with the educational attainment of bachelor's degree or higher, with 82.7% or 669 individuals in the labor force. Within the labor force, individuals with less than high school education have the highest percentage of unemployment, with 19.4% or 7 of them being unemployed.
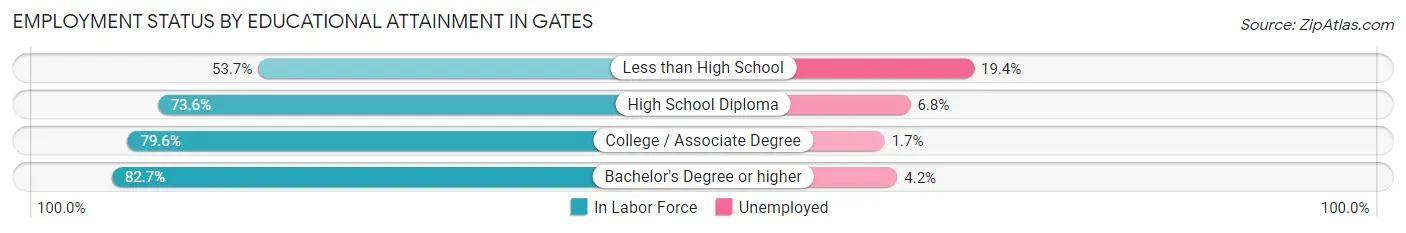
| Educational Attainment | In Labor Force | Unemployed |
| Less than High School | 36 (53.7%) | 13 (19.4%) |
| High School Diploma | 615 (73.6%) | 57 (6.8%) |
| College / Associate Degree | 704 (79.6%) | 15 (1.7%) |
| Bachelor's Degree or higher | 669 (82.7%) | 34 (4.2%) |
| Total | 2,025 (78.0%) | 114 (4.4%) |
Employment Occupations by Sex in Gates
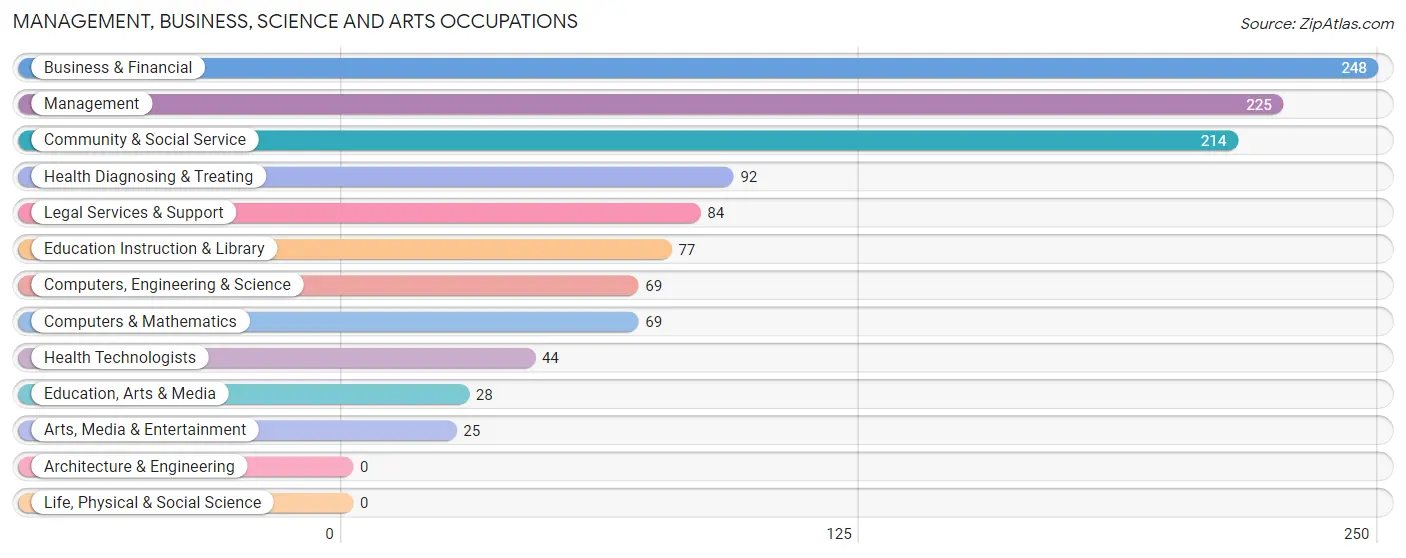
Management, Business, Science and Arts Occupations
The most common Management, Business, Science and Arts occupations in Gates are Business & Financial (248 | 10.5%), Management (225 | 9.6%), Community & Social Service (214 | 9.1%), Health Diagnosing & Treating (92 | 3.9%), and Legal Services & Support (84 | 3.6%).
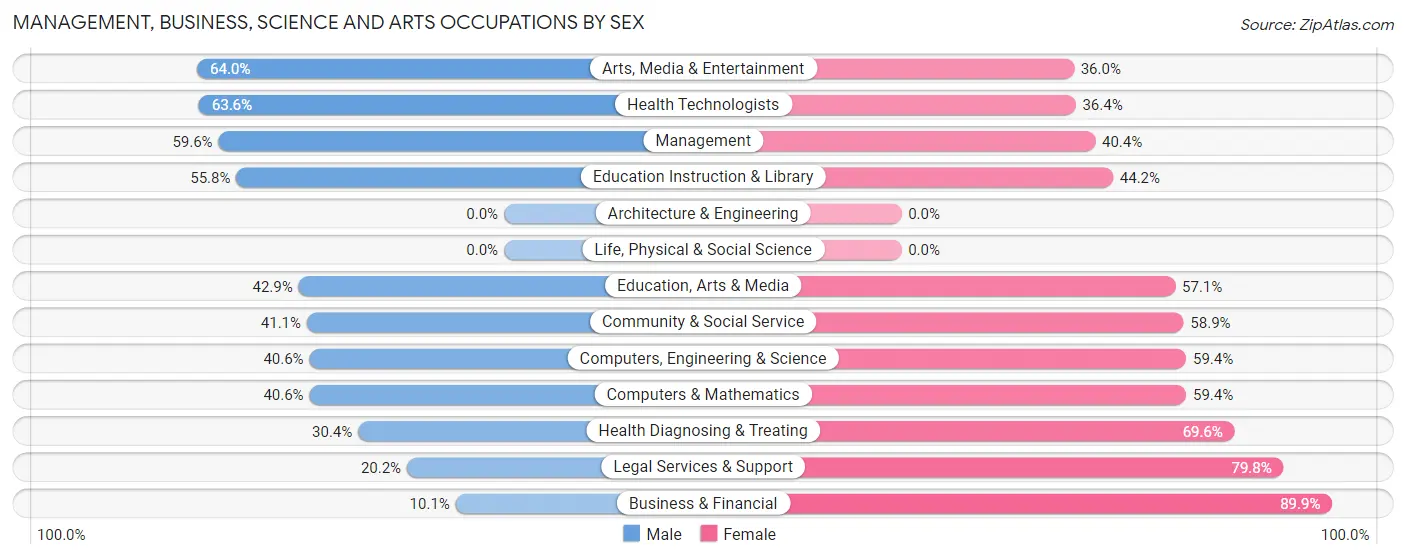
Management, Business, Science and Arts Occupations by Sex
Within the Management, Business, Science and Arts occupations in Gates, the most male-oriented occupations are Arts, Media & Entertainment (64.0%), Health Technologists (63.6%), and Management (59.6%), while the most female-oriented occupations are Business & Financial (89.9%), Legal Services & Support (79.8%), and Health Diagnosing & Treating (69.6%).
| Occupation | Male | Female |
| Management | 134 (59.6%) | 91 (40.4%) |
| Business & Financial | 25 (10.1%) | 223 (89.9%) |
| Computers, Engineering & Science | 28 (40.6%) | 41 (59.4%) |
| Computers & Mathematics | 28 (40.6%) | 41 (59.4%) |
| Architecture & Engineering | 0 (0.0%) | 0 (0.0%) |
| Life, Physical & Social Science | 0 (0.0%) | 0 (0.0%) |
| Community & Social Service | 88 (41.1%) | 126 (58.9%) |
| Education, Arts & Media | 12 (42.9%) | 16 (57.1%) |
| Legal Services & Support | 17 (20.2%) | 67 (79.8%) |
| Education Instruction & Library | 43 (55.8%) | 34 (44.2%) |
| Arts, Media & Entertainment | 16 (64.0%) | 9 (36.0%) |
| Health Diagnosing & Treating | 28 (30.4%) | 64 (69.6%) |
| Health Technologists | 28 (63.6%) | 16 (36.4%) |
| Total (Category) | 303 (35.7%) | 545 (64.3%) |
| Total (Overall) | 1,154 (49.0%) | 1,199 (51.0%) |
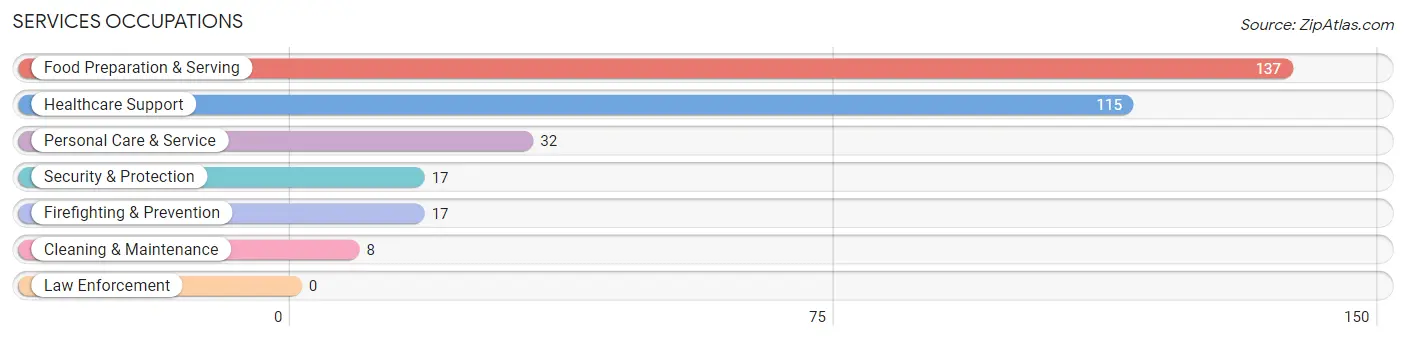
Services Occupations
The most common Services occupations in Gates are Food Preparation & Serving (137 | 5.8%), Healthcare Support (115 | 4.9%), Personal Care & Service (32 | 1.4%), Security & Protection (17 | 0.7%), and Firefighting & Prevention (17 | 0.7%).
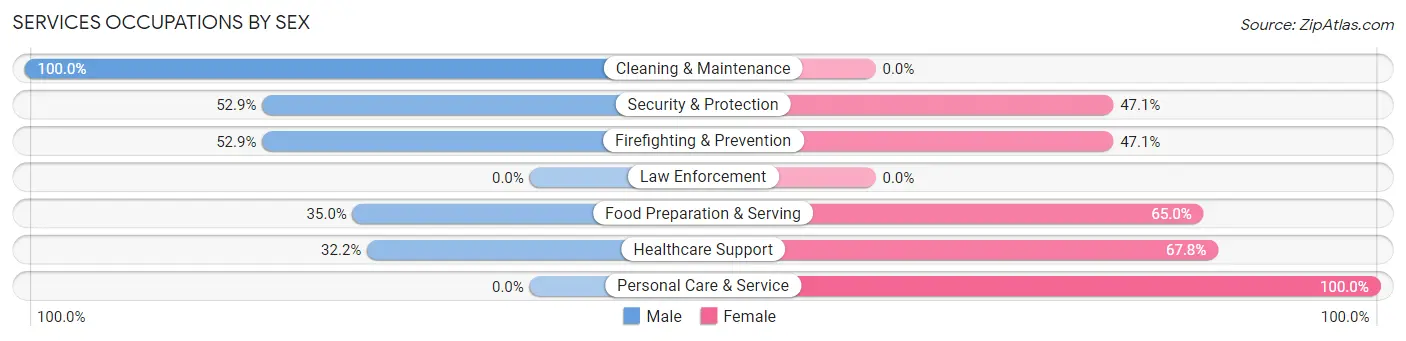
Services Occupations by Sex
Within the Services occupations in Gates, the most male-oriented occupations are Cleaning & Maintenance (100.0%), Security & Protection (52.9%), and Firefighting & Prevention (52.9%), while the most female-oriented occupations are Personal Care & Service (100.0%), Healthcare Support (67.8%), and Food Preparation & Serving (65.0%).
| Occupation | Male | Female |
| Healthcare Support | 37 (32.2%) | 78 (67.8%) |
| Security & Protection | 9 (52.9%) | 8 (47.1%) |
| Firefighting & Prevention | 9 (52.9%) | 8 (47.1%) |
| Law Enforcement | 0 (0.0%) | 0 (0.0%) |
| Food Preparation & Serving | 48 (35.0%) | 89 (65.0%) |
| Cleaning & Maintenance | 8 (100.0%) | 0 (0.0%) |
| Personal Care & Service | 0 (0.0%) | 32 (100.0%) |
| Total (Category) | 102 (33.0%) | 207 (67.0%) |
| Total (Overall) | 1,154 (49.0%) | 1,199 (51.0%) |
Sales and Office Occupations
The most common Sales and Office occupations in Gates are Office & Administration (386 | 16.4%), and Sales & Related (150 | 6.4%).
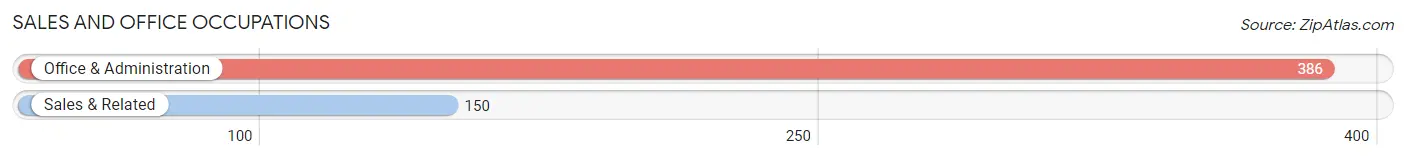
Sales and Office Occupations by Sex
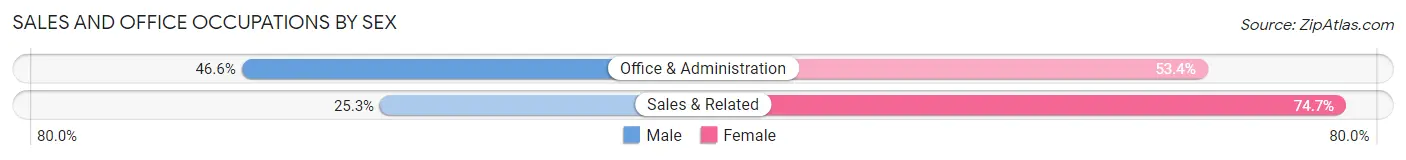
| Occupation | Male | Female |
| Sales & Related | 38 (25.3%) | 112 (74.7%) |
| Office & Administration | 180 (46.6%) | 206 (53.4%) |
| Total (Category) | 218 (40.7%) | 318 (59.3%) |
| Total (Overall) | 1,154 (49.0%) | 1,199 (51.0%) |
Natural Resources, Construction and Maintenance Occupations
The most common Natural Resources, Construction and Maintenance occupations in Gates are Construction & Extraction (121 | 5.1%), and Installation, Maintenance & Repair (102 | 4.3%).
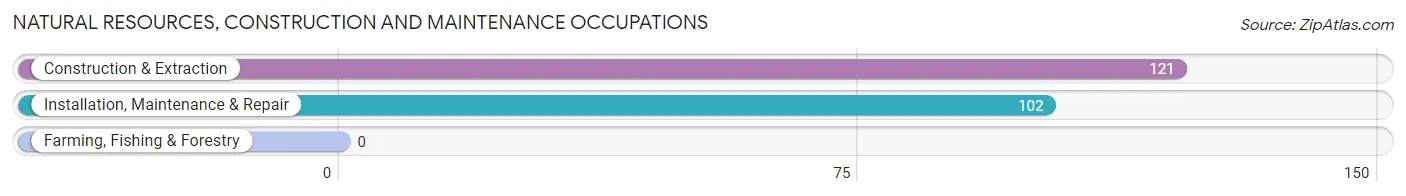
Natural Resources, Construction and Maintenance Occupations by Sex
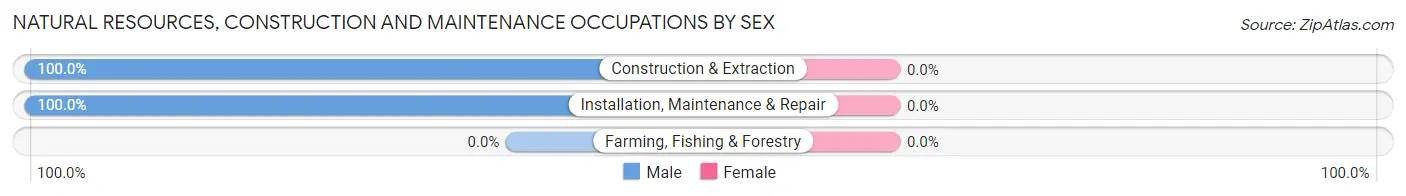
| Occupation | Male | Female |
| Farming, Fishing & Forestry | 0 (0.0%) | 0 (0.0%) |
| Construction & Extraction | 121 (100.0%) | 0 (0.0%) |
| Installation, Maintenance & Repair | 102 (100.0%) | 0 (0.0%) |
| Total (Category) | 223 (100.0%) | 0 (0.0%) |
| Total (Overall) | 1,154 (49.0%) | 1,199 (51.0%) |
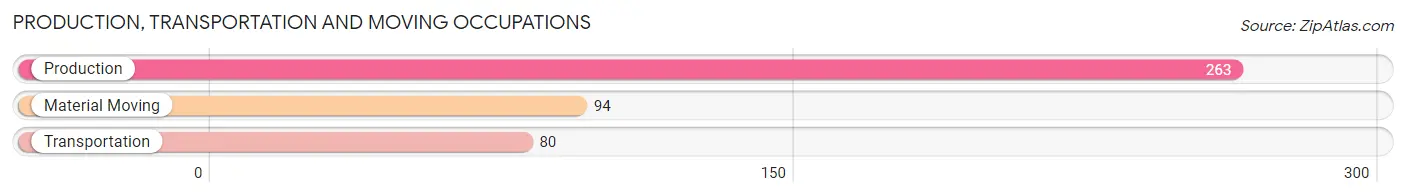
Production, Transportation and Moving Occupations
The most common Production, Transportation and Moving occupations in Gates are Production (263 | 11.2%), Material Moving (94 | 4.0%), and Transportation (80 | 3.4%).
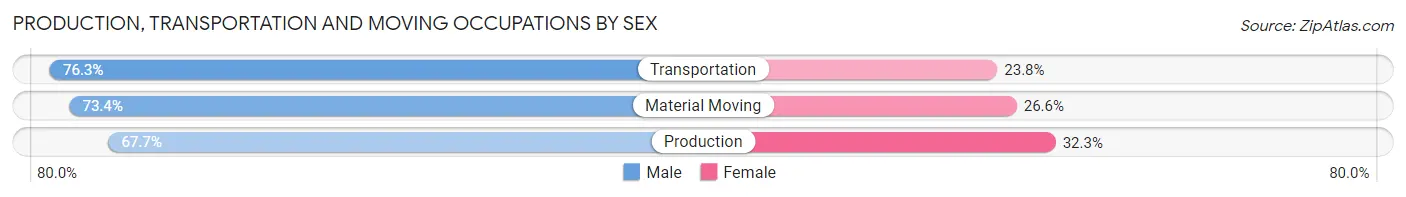
Production, Transportation and Moving Occupations by Sex
| Occupation | Male | Female |
| Production | 178 (67.7%) | 85 (32.3%) |
| Transportation | 61 (76.2%) | 19 (23.7%) |
| Material Moving | 69 (73.4%) | 25 (26.6%) |
| Total (Category) | 308 (70.5%) | 129 (29.5%) |
| Total (Overall) | 1,154 (49.0%) | 1,199 (51.0%) |
Employment Industries by Sex in Gates
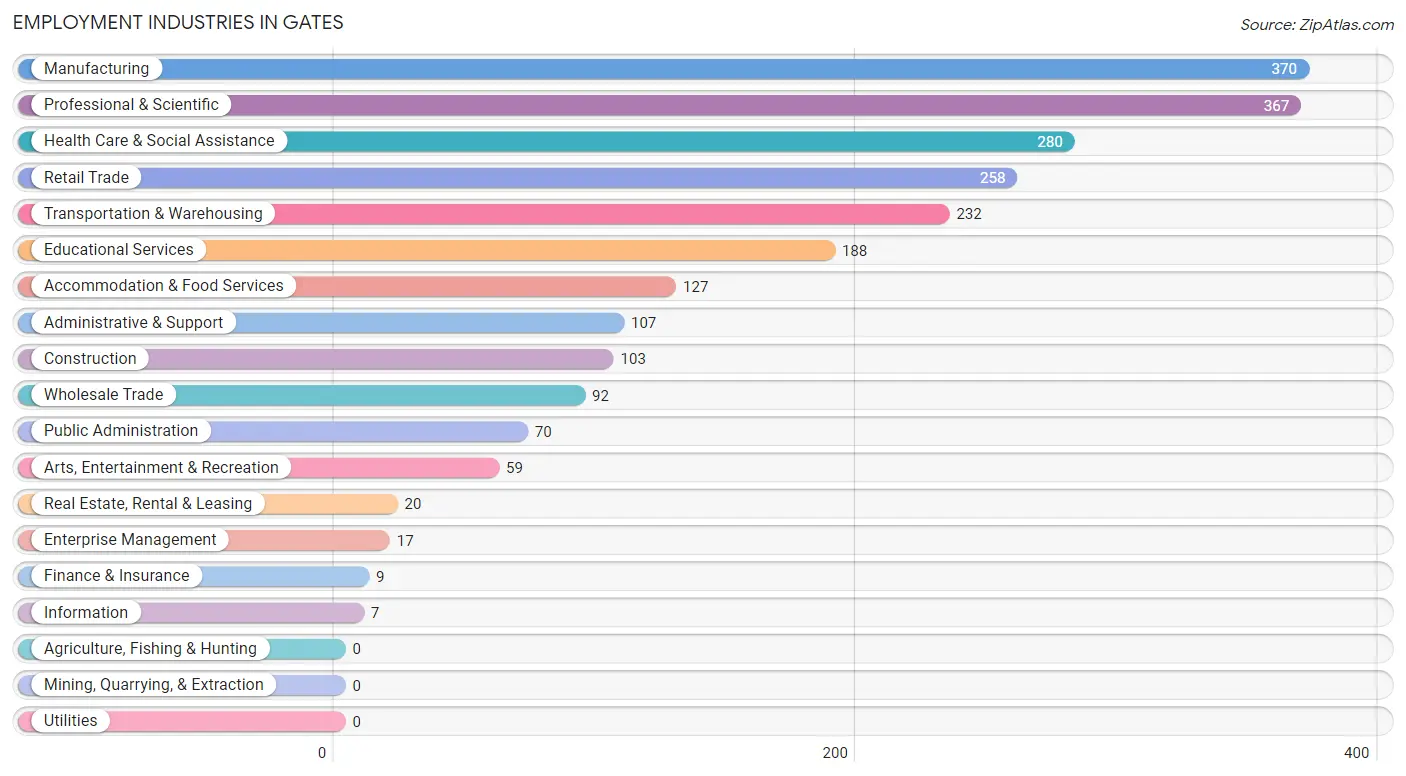
Employment Industries in Gates
The major employment industries in Gates include Manufacturing (370 | 15.7%), Professional & Scientific (367 | 15.6%), Health Care & Social Assistance (280 | 11.9%), Retail Trade (258 | 11.0%), and Transportation & Warehousing (232 | 9.9%).
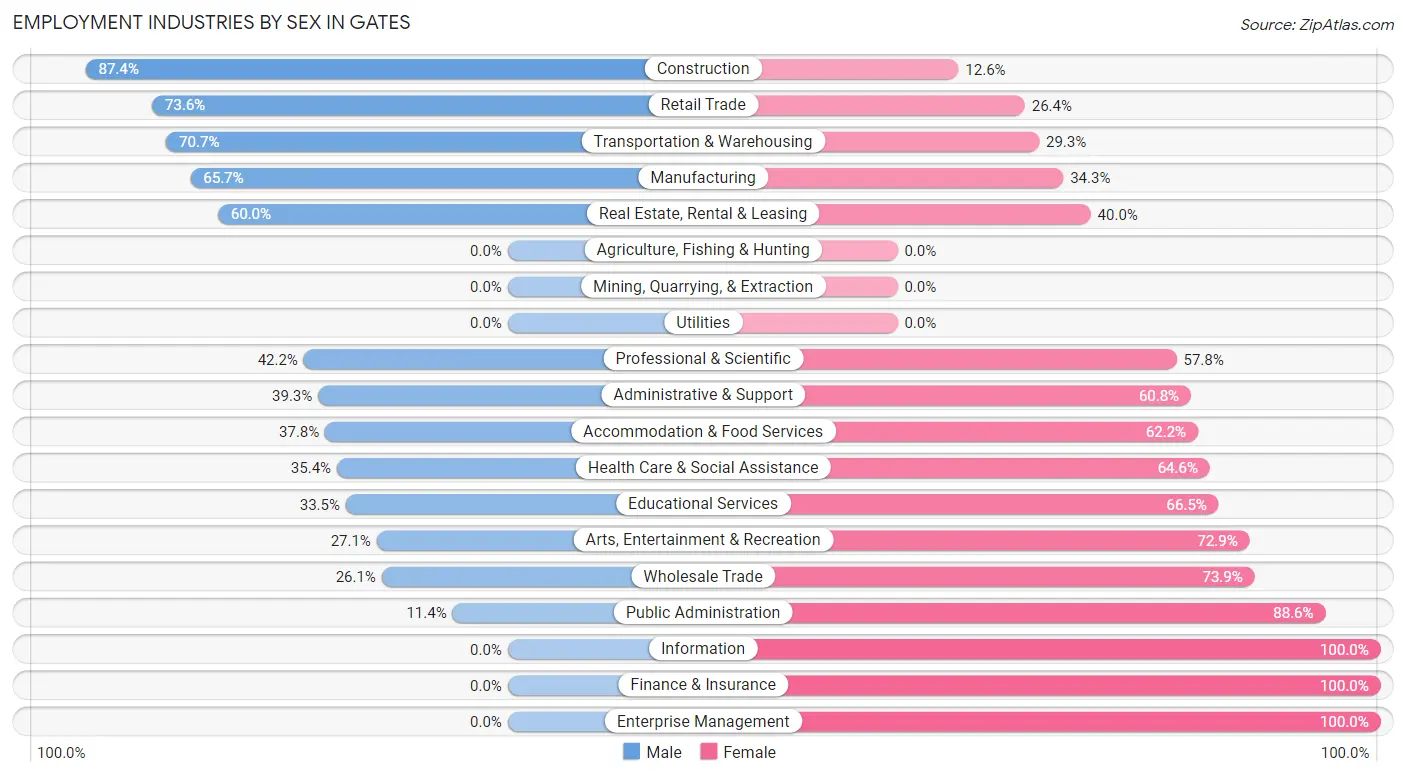
Employment Industries by Sex in Gates
The Gates industries that see more men than women are Construction (87.4%), Retail Trade (73.6%), and Transportation & Warehousing (70.7%), whereas the industries that tend to have a higher number of women are Information (100.0%), Finance & Insurance (100.0%), and Enterprise Management (100.0%).
| Industry | Male | Female |
| Agriculture, Fishing & Hunting | 0 (0.0%) | 0 (0.0%) |
| Mining, Quarrying, & Extraction | 0 (0.0%) | 0 (0.0%) |
| Construction | 90 (87.4%) | 13 (12.6%) |
| Manufacturing | 243 (65.7%) | 127 (34.3%) |
| Wholesale Trade | 24 (26.1%) | 68 (73.9%) |
| Retail Trade | 190 (73.6%) | 68 (26.4%) |
| Transportation & Warehousing | 164 (70.7%) | 68 (29.3%) |
| Utilities | 0 (0.0%) | 0 (0.0%) |
| Information | 0 (0.0%) | 7 (100.0%) |
| Finance & Insurance | 0 (0.0%) | 9 (100.0%) |
| Real Estate, Rental & Leasing | 12 (60.0%) | 8 (40.0%) |
| Professional & Scientific | 155 (42.2%) | 212 (57.8%) |
| Enterprise Management | 0 (0.0%) | 17 (100.0%) |
| Administrative & Support | 42 (39.3%) | 65 (60.8%) |
| Educational Services | 63 (33.5%) | 125 (66.5%) |
| Health Care & Social Assistance | 99 (35.4%) | 181 (64.6%) |
| Arts, Entertainment & Recreation | 16 (27.1%) | 43 (72.9%) |
| Accommodation & Food Services | 48 (37.8%) | 79 (62.2%) |
| Public Administration | 8 (11.4%) | 62 (88.6%) |
| Total | 1,154 (49.0%) | 1,199 (51.0%) |
Education in Gates
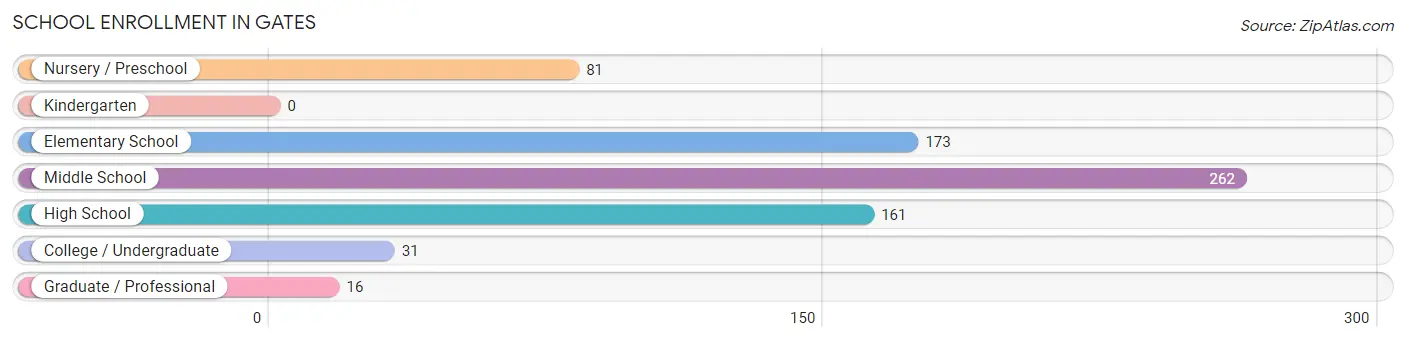
School Enrollment in Gates
The most common levels of schooling among the 724 students in Gates are middle school (262 | 36.2%), elementary school (173 | 23.9%), and high school (161 | 22.2%).
| School Level | # Students | % Students |
| Nursery / Preschool | 81 | 11.2% |
| Kindergarten | 0 | 0.0% |
| Elementary School | 173 | 23.9% |
| Middle School | 262 | 36.2% |
| High School | 161 | 22.2% |
| College / Undergraduate | 31 | 4.3% |
| Graduate / Professional | 16 | 2.2% |
| Total | 724 | 100.0% |
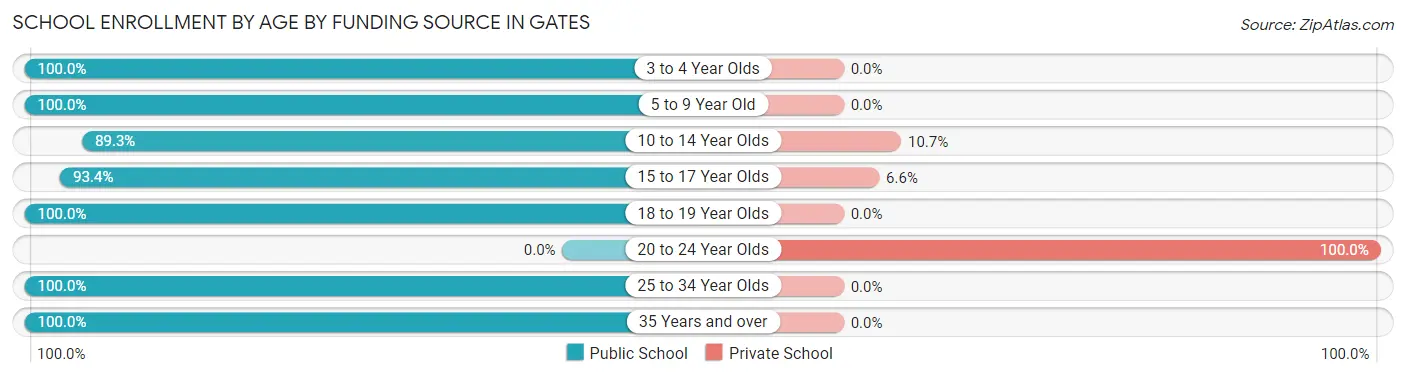
School Enrollment by Age by Funding Source in Gates
Out of a total of 724 students who are enrolled in schools in Gates, 44 (6.1%) attend a private institution, while the remaining 680 (93.9%) are enrolled in public schools. The age group of 20 to 24 year olds has the highest likelihood of being enrolled in private schools, with 8 (100.0% in the age bracket) enrolled. Conversely, the age group of 3 to 4 year olds has the lowest likelihood of being enrolled in a private school, with 81 (100.0% in the age bracket) attending a public institution.
| Age Bracket | Public School | Private School |
| 3 to 4 Year Olds | 81 (100.0%) | 0 (0.0%) |
| 5 to 9 Year Old | 173 (100.0%) | 0 (0.0%) |
| 10 to 14 Year Olds | 234 (89.3%) | 28 (10.7%) |
| 15 to 17 Year Olds | 113 (93.4%) | 8 (6.6%) |
| 18 to 19 Year Olds | 48 (100.0%) | 0 (0.0%) |
| 20 to 24 Year Olds | 0 (0.0%) | 8 (100.0%) |
| 25 to 34 Year Olds | 16 (100.0%) | 0 (0.0%) |
| 35 Years and over | 15 (100.0%) | 0 (0.0%) |
| Total | 680 (93.9%) | 44 (6.1%) |
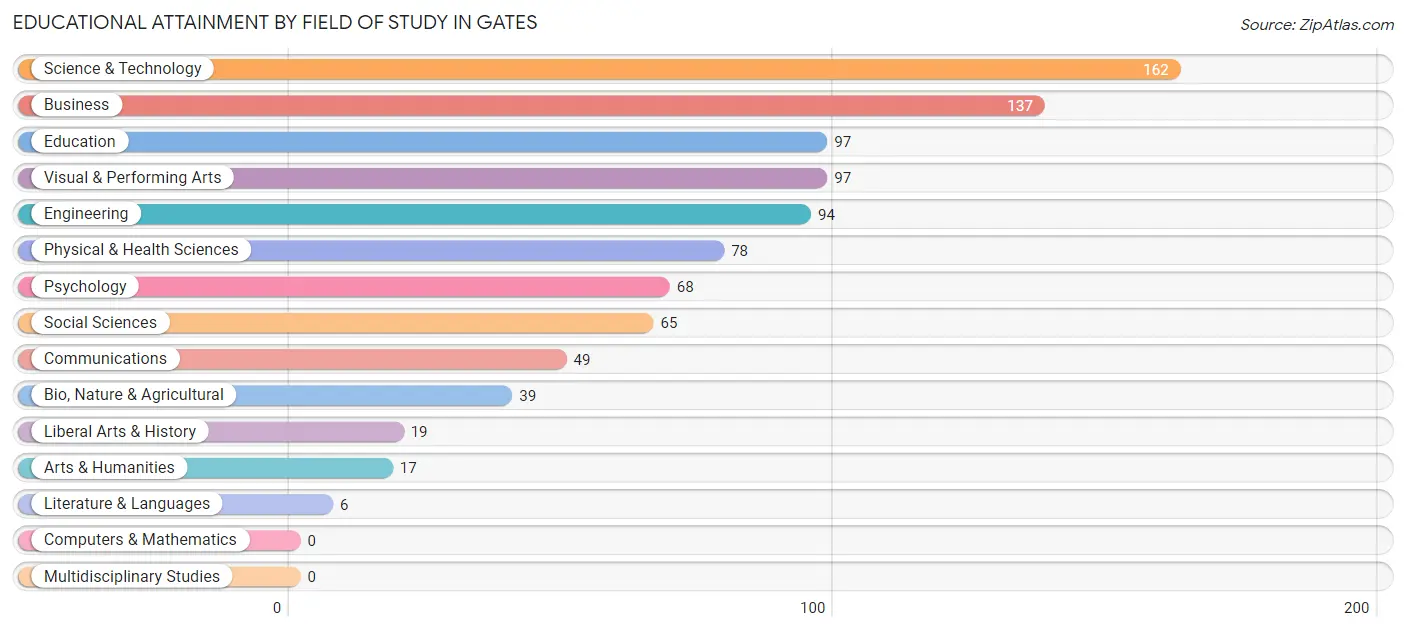
Educational Attainment by Field of Study in Gates
Science & technology (162 | 17.5%), business (137 | 14.8%), education (97 | 10.4%), visual & performing arts (97 | 10.4%), and engineering (94 | 10.1%) are the most common fields of study among 928 individuals in Gates who have obtained a bachelor's degree or higher.
| Field of Study | # Graduates | % Graduates |
| Computers & Mathematics | 0 | 0.0% |
| Bio, Nature & Agricultural | 39 | 4.2% |
| Physical & Health Sciences | 78 | 8.4% |
| Psychology | 68 | 7.3% |
| Social Sciences | 65 | 7.0% |
| Engineering | 94 | 10.1% |
| Multidisciplinary Studies | 0 | 0.0% |
| Science & Technology | 162 | 17.5% |
| Business | 137 | 14.8% |
| Education | 97 | 10.4% |
| Literature & Languages | 6 | 0.6% |
| Liberal Arts & History | 19 | 2.1% |
| Visual & Performing Arts | 97 | 10.4% |
| Communications | 49 | 5.3% |
| Arts & Humanities | 17 | 1.8% |
| Total | 928 | 100.0% |
Transportation & Commute in Gates
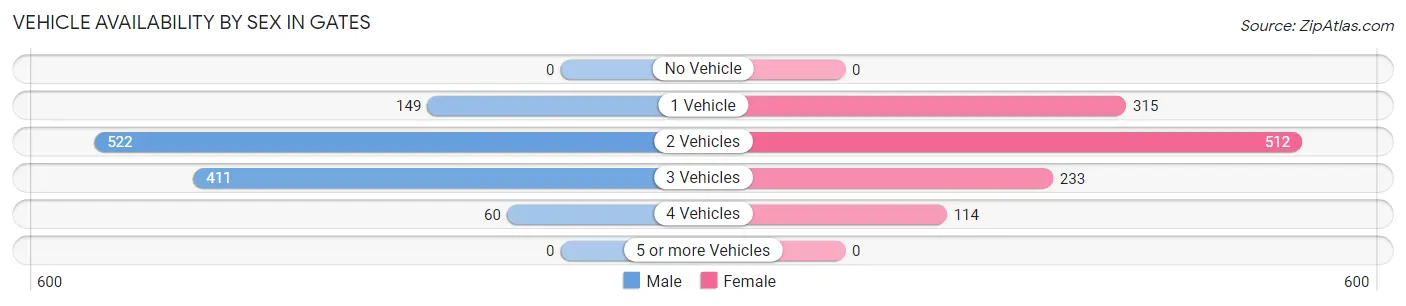
Vehicle Availability by Sex in Gates
The most prevalent vehicle ownership categories in Gates are males with 2 vehicles (522, accounting for 45.7%) and females with 2 vehicles (512, making up 44.5%).
| Vehicles Available | Male | Female |
| No Vehicle | 0 (0.0%) | 0 (0.0%) |
| 1 Vehicle | 149 (13.1%) | 315 (26.8%) |
| 2 Vehicles | 522 (45.7%) | 512 (43.6%) |
| 3 Vehicles | 411 (36.0%) | 233 (19.9%) |
| 4 Vehicles | 60 (5.2%) | 114 (9.7%) |
| 5 or more Vehicles | 0 (0.0%) | 0 (0.0%) |
| Total | 1,142 (100.0%) | 1,174 (100.0%) |
Commute Time in Gates
The most frequently occuring commute durations in Gates are 10 to 14 minutes (552 commuters, 27.0%), 5 to 9 minutes (418 commuters, 20.4%), and 15 to 19 minutes (314 commuters, 15.3%).
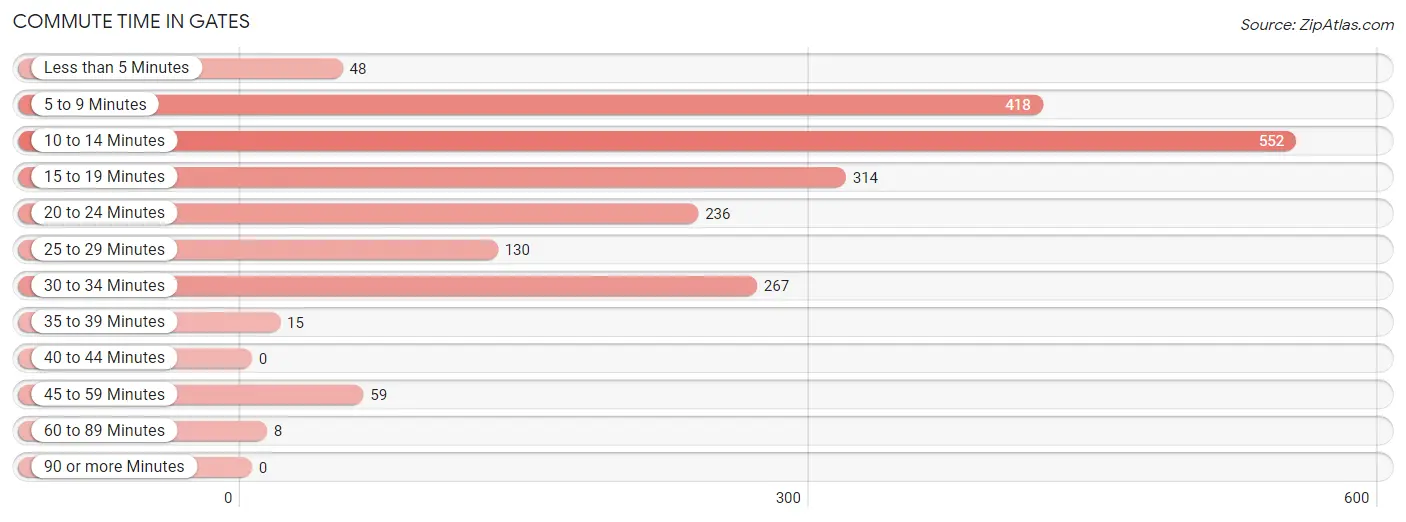
| Commute Time | # Commuters | % Commuters |
| Less than 5 Minutes | 48 | 2.3% |
| 5 to 9 Minutes | 418 | 20.4% |
| 10 to 14 Minutes | 552 | 27.0% |
| 15 to 19 Minutes | 314 | 15.3% |
| 20 to 24 Minutes | 236 | 11.5% |
| 25 to 29 Minutes | 130 | 6.4% |
| 30 to 34 Minutes | 267 | 13.0% |
| 35 to 39 Minutes | 15 | 0.7% |
| 40 to 44 Minutes | 0 | 0.0% |
| 45 to 59 Minutes | 59 | 2.9% |
| 60 to 89 Minutes | 8 | 0.4% |
| 90 or more Minutes | 0 | 0.0% |
Commute Time by Sex in Gates
The most common commute times in Gates are 5 to 9 minutes (289 commuters, 28.0%) for males and 10 to 14 minutes (265 commuters, 26.2%) for females.
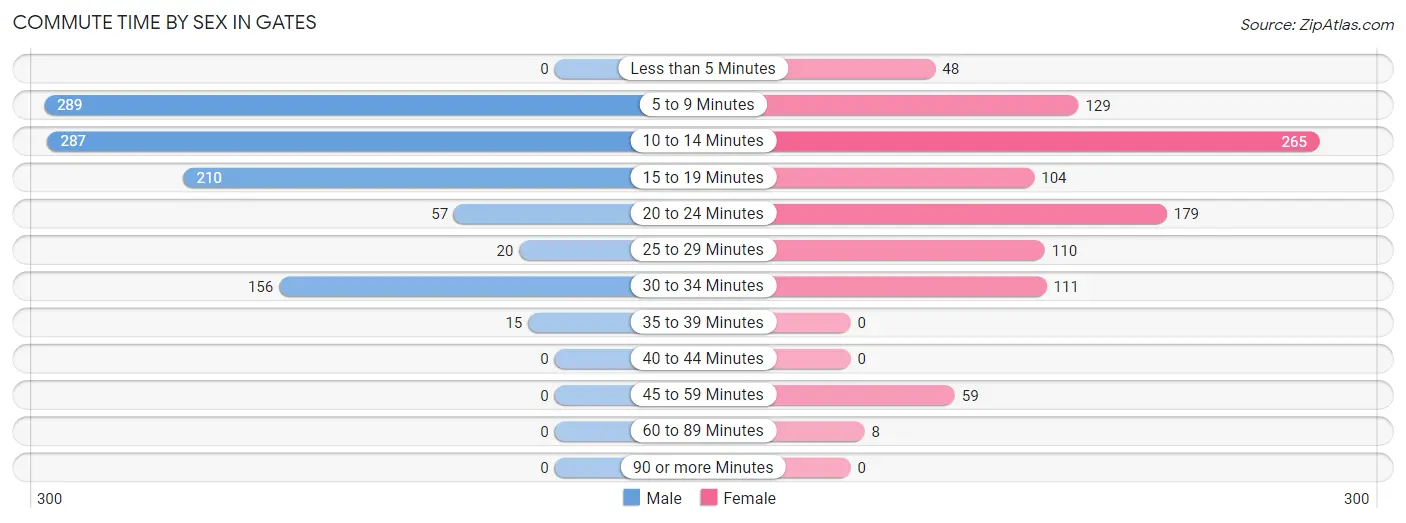
| Commute Time | Male | Female |
| Less than 5 Minutes | 0 (0.0%) | 48 (4.7%) |
| 5 to 9 Minutes | 289 (28.0%) | 129 (12.7%) |
| 10 to 14 Minutes | 287 (27.8%) | 265 (26.2%) |
| 15 to 19 Minutes | 210 (20.3%) | 104 (10.3%) |
| 20 to 24 Minutes | 57 (5.5%) | 179 (17.7%) |
| 25 to 29 Minutes | 20 (1.9%) | 110 (10.9%) |
| 30 to 34 Minutes | 156 (15.1%) | 111 (11.0%) |
| 35 to 39 Minutes | 15 (1.5%) | 0 (0.0%) |
| 40 to 44 Minutes | 0 (0.0%) | 0 (0.0%) |
| 45 to 59 Minutes | 0 (0.0%) | 59 (5.8%) |
| 60 to 89 Minutes | 0 (0.0%) | 8 (0.8%) |
| 90 or more Minutes | 0 (0.0%) | 0 (0.0%) |
Time of Departure to Work by Sex in Gates
The most frequent times of departure to work in Gates are 8:00 AM to 8:29 AM (172, 16.6%) for males and 7:30 AM to 7:59 AM (233, 23.0%) for females.
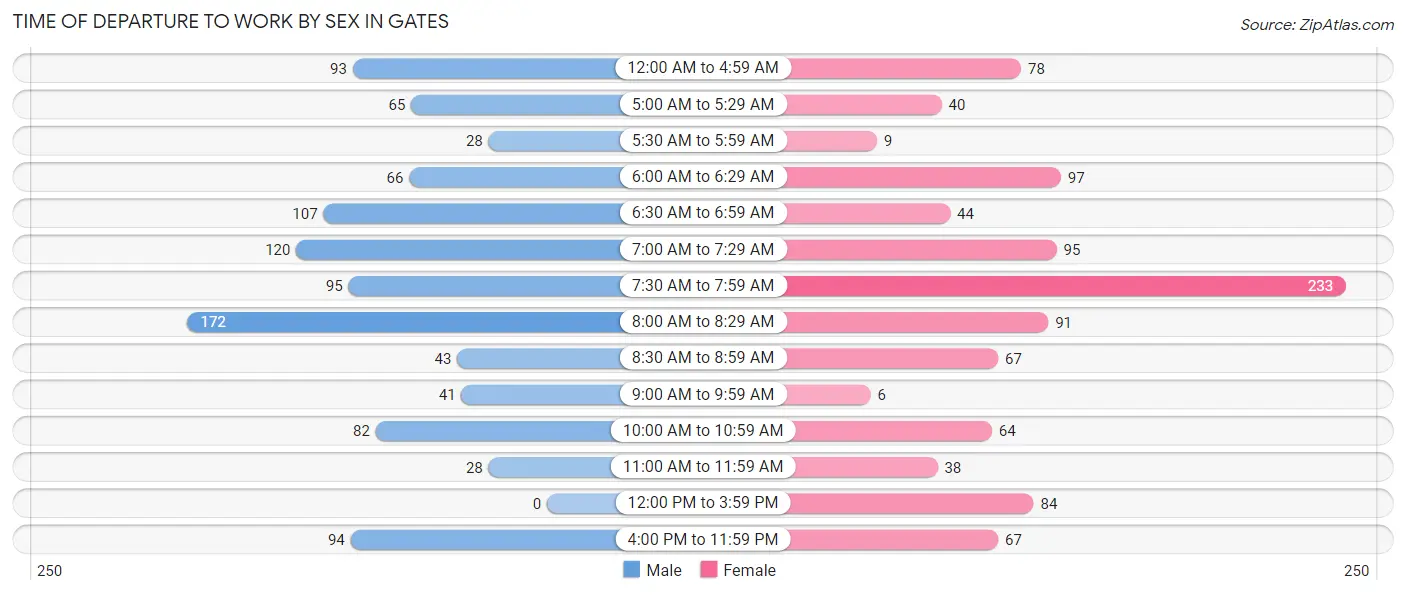
| Time of Departure | Male | Female |
| 12:00 AM to 4:59 AM | 93 (9.0%) | 78 (7.7%) |
| 5:00 AM to 5:29 AM | 65 (6.3%) | 40 (4.0%) |
| 5:30 AM to 5:59 AM | 28 (2.7%) | 9 (0.9%) |
| 6:00 AM to 6:29 AM | 66 (6.4%) | 97 (9.6%) |
| 6:30 AM to 6:59 AM | 107 (10.3%) | 44 (4.3%) |
| 7:00 AM to 7:29 AM | 120 (11.6%) | 95 (9.4%) |
| 7:30 AM to 7:59 AM | 95 (9.2%) | 233 (23.0%) |
| 8:00 AM to 8:29 AM | 172 (16.6%) | 91 (9.0%) |
| 8:30 AM to 8:59 AM | 43 (4.2%) | 67 (6.6%) |
| 9:00 AM to 9:59 AM | 41 (4.0%) | 6 (0.6%) |
| 10:00 AM to 10:59 AM | 82 (7.9%) | 64 (6.3%) |
| 11:00 AM to 11:59 AM | 28 (2.7%) | 38 (3.7%) |
| 12:00 PM to 3:59 PM | 0 (0.0%) | 84 (8.3%) |
| 4:00 PM to 11:59 PM | 94 (9.1%) | 67 (6.6%) |
| Total | 1,034 (100.0%) | 1,013 (100.0%) |
Housing Occupancy in Gates
Occupancy by Ownership in Gates
Of the total 2,010 dwellings in Gates, owner-occupied units account for 1,859 (92.5%), while renter-occupied units make up 151 (7.5%).
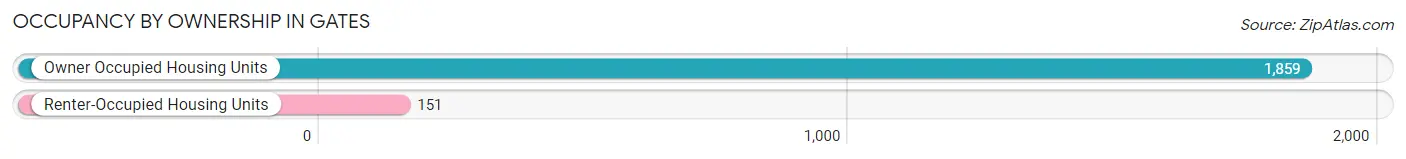
| Occupancy | # Housing Units | % Housing Units |
| Owner Occupied Housing Units | 1,859 | 92.5% |
| Renter-Occupied Housing Units | 151 | 7.5% |
| Total Occupied Housing Units | 2,010 | 100.0% |
Occupancy by Household Size in Gates
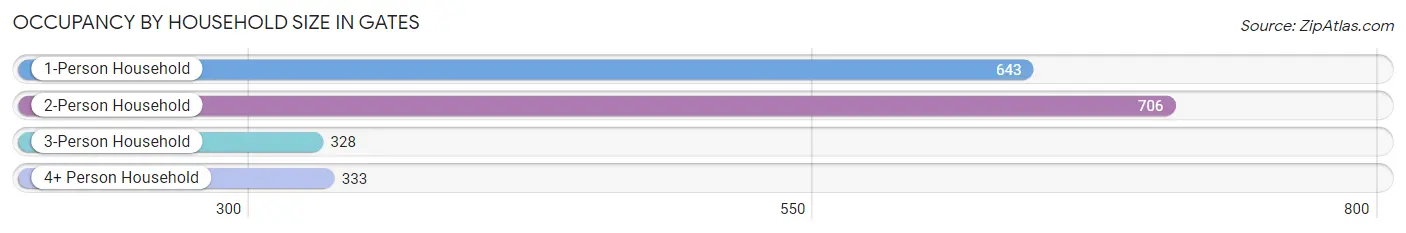
| Household Size | # Housing Units | % Housing Units |
| 1-Person Household | 643 | 32.0% |
| 2-Person Household | 706 | 35.1% |
| 3-Person Household | 328 | 16.3% |
| 4+ Person Household | 333 | 16.6% |
| Total Housing Units | 2,010 | 100.0% |
Occupancy by Ownership by Household Size in Gates
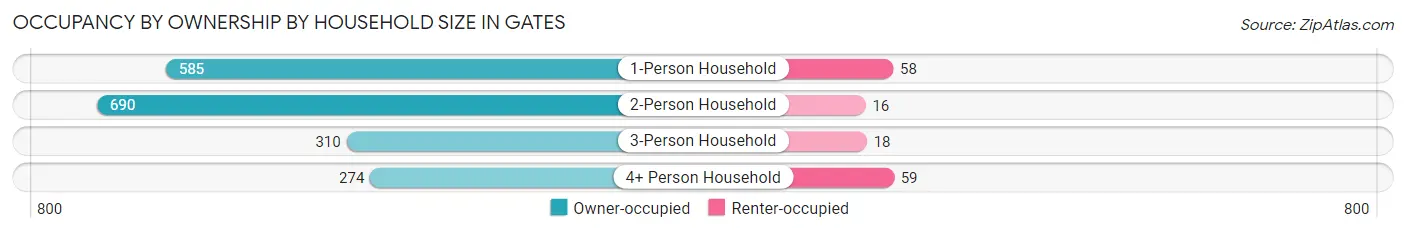
| Household Size | Owner-occupied | Renter-occupied |
| 1-Person Household | 585 (91.0%) | 58 (9.0%) |
| 2-Person Household | 690 (97.7%) | 16 (2.3%) |
| 3-Person Household | 310 (94.5%) | 18 (5.5%) |
| 4+ Person Household | 274 (82.3%) | 59 (17.7%) |
| Total Housing Units | 1,859 (92.5%) | 151 (7.5%) |
Occupancy by Educational Attainment in Gates
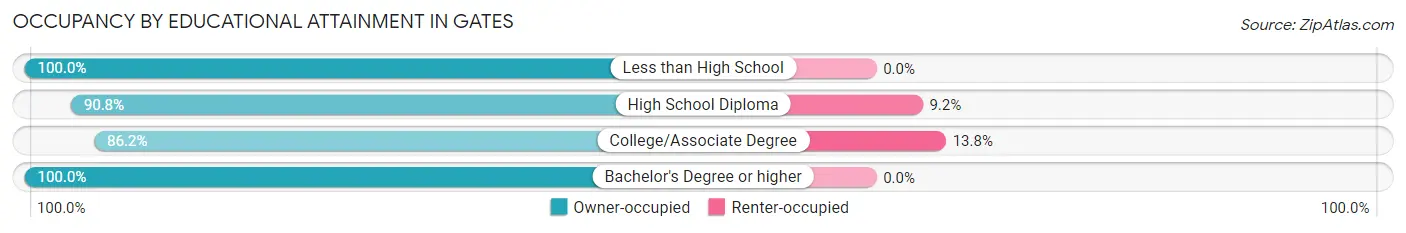
| Household Size | Owner-occupied | Renter-occupied |
| Less than High School | 224 (100.0%) | 0 (0.0%) |
| High School Diploma | 544 (90.8%) | 55 (9.2%) |
| College/Associate Degree | 600 (86.2%) | 96 (13.8%) |
| Bachelor's Degree or higher | 491 (100.0%) | 0 (0.0%) |
Occupancy by Age of Householder in Gates
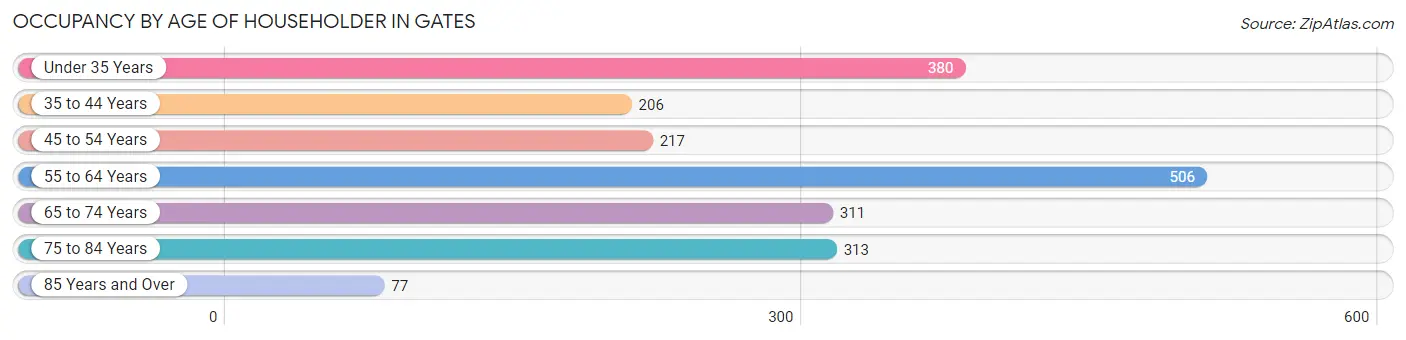
| Age Bracket | # Households | % Households |
| Under 35 Years | 380 | 18.9% |
| 35 to 44 Years | 206 | 10.2% |
| 45 to 54 Years | 217 | 10.8% |
| 55 to 64 Years | 506 | 25.2% |
| 65 to 74 Years | 311 | 15.5% |
| 75 to 84 Years | 313 | 15.6% |
| 85 Years and Over | 77 | 3.8% |
| Total | 2,010 | 100.0% |
Housing Finances in Gates
Median Income by Occupancy in Gates
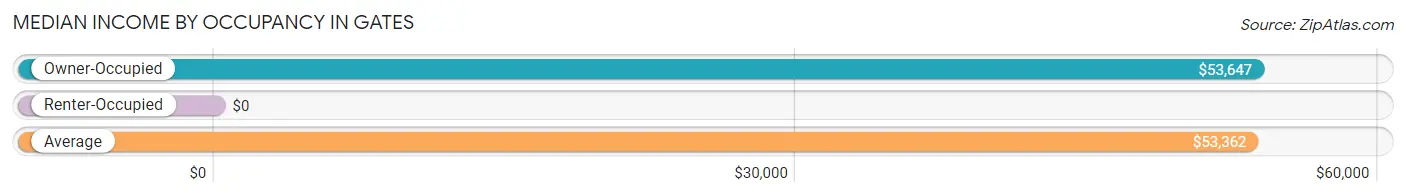
| Occupancy Type | # Households | Median Income |
| Owner-Occupied | 1,859 (92.5%) | $53,647 |
| Renter-Occupied | 151 (7.5%) | $0 |
| Average | 2,010 (100.0%) | $53,362 |
Occupancy by Householder Income Bracket in Gates
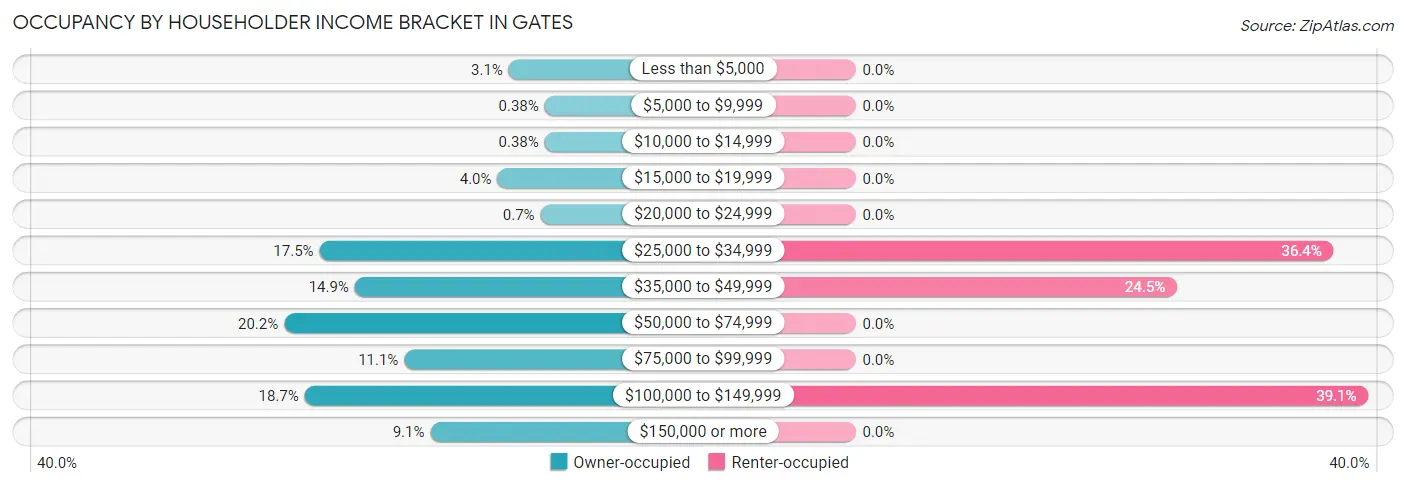
| Income Bracket | Owner-occupied | Renter-occupied |
| Less than $5,000 | 58 (3.1%) | 0 (0.0%) |
| $5,000 to $9,999 | 7 (0.4%) | 0 (0.0%) |
| $10,000 to $14,999 | 7 (0.4%) | 0 (0.0%) |
| $15,000 to $19,999 | 74 (4.0%) | 0 (0.0%) |
| $20,000 to $24,999 | 13 (0.7%) | 0 (0.0%) |
| $25,000 to $34,999 | 326 (17.5%) | 55 (36.4%) |
| $35,000 to $49,999 | 276 (14.8%) | 37 (24.5%) |
| $50,000 to $74,999 | 376 (20.2%) | 0 (0.0%) |
| $75,000 to $99,999 | 206 (11.1%) | 0 (0.0%) |
| $100,000 to $149,999 | 347 (18.7%) | 59 (39.1%) |
| $150,000 or more | 169 (9.1%) | 0 (0.0%) |
| Total | 1,859 (100.0%) | 151 (100.0%) |
Monthly Housing Cost Tiers in Gates
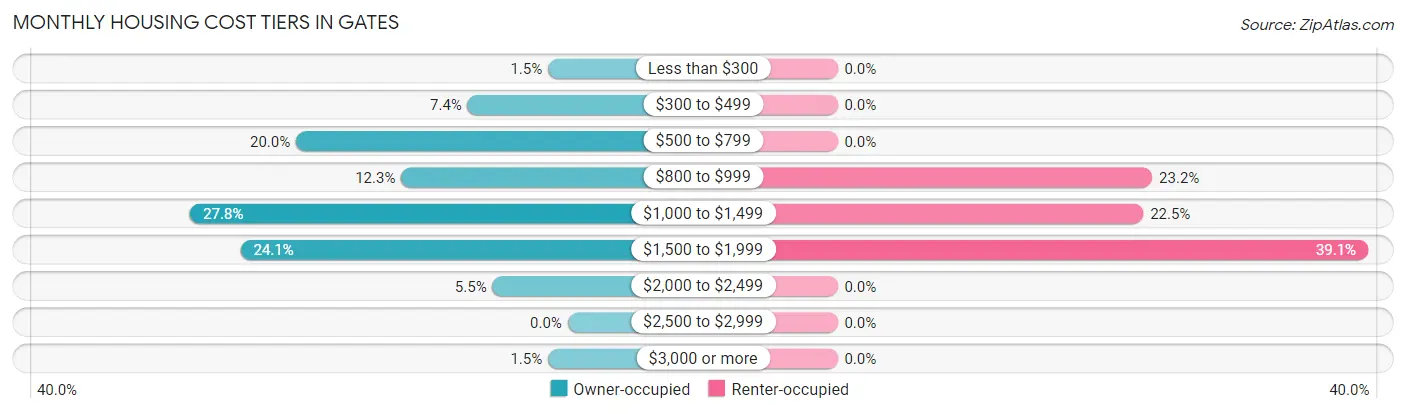
| Monthly Cost | Owner-occupied | Renter-occupied |
| Less than $300 | 27 (1.5%) | 0 (0.0%) |
| $300 to $499 | 137 (7.4%) | 0 (0.0%) |
| $500 to $799 | 372 (20.0%) | 0 (0.0%) |
| $800 to $999 | 228 (12.3%) | 35 (23.2%) |
| $1,000 to $1,499 | 517 (27.8%) | 34 (22.5%) |
| $1,500 to $1,999 | 448 (24.1%) | 59 (39.1%) |
| $2,000 to $2,499 | 103 (5.5%) | 0 (0.0%) |
| $2,500 to $2,999 | 0 (0.0%) | 0 (0.0%) |
| $3,000 or more | 27 (1.5%) | 0 (0.0%) |
| Total | 1,859 (100.0%) | 151 (100.0%) |
Physical Housing Characteristics in Gates
Housing Structures in Gates
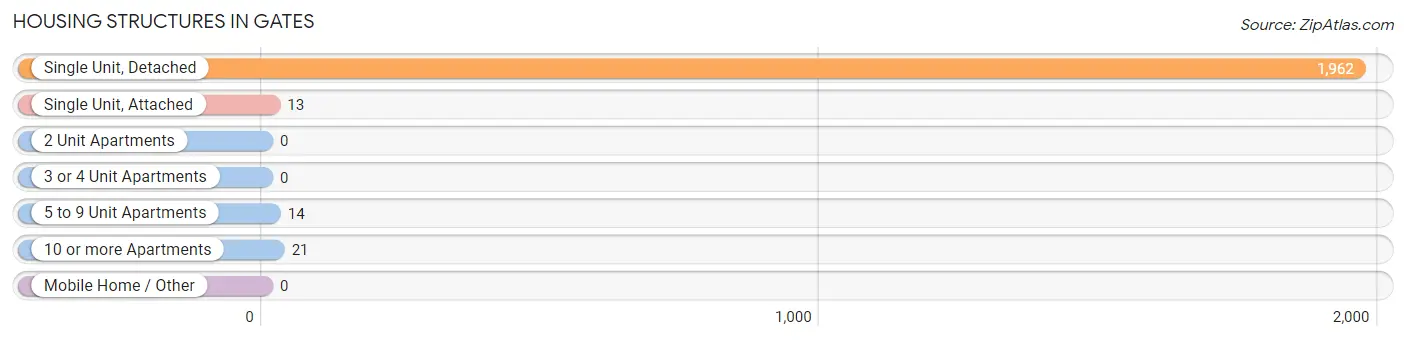
| Structure Type | # Housing Units | % Housing Units |
| Single Unit, Detached | 1,962 | 97.6% |
| Single Unit, Attached | 13 | 0.6% |
| 2 Unit Apartments | 0 | 0.0% |
| 3 or 4 Unit Apartments | 0 | 0.0% |
| 5 to 9 Unit Apartments | 14 | 0.7% |
| 10 or more Apartments | 21 | 1.0% |
| Mobile Home / Other | 0 | 0.0% |
| Total | 2,010 | 100.0% |
Housing Structures by Occupancy in Gates
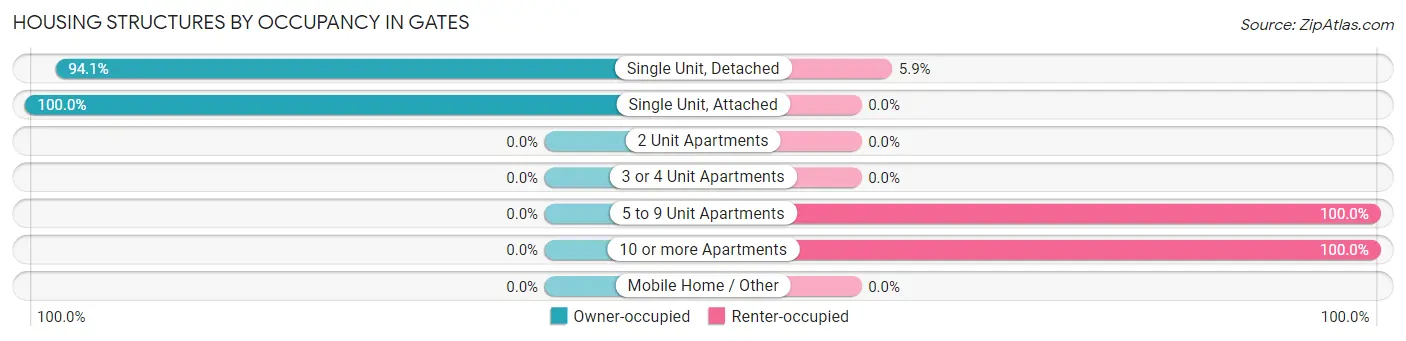
| Structure Type | Owner-occupied | Renter-occupied |
| Single Unit, Detached | 1,846 (94.1%) | 116 (5.9%) |
| Single Unit, Attached | 13 (100.0%) | 0 (0.0%) |
| 2 Unit Apartments | 0 (0.0%) | 0 (0.0%) |
| 3 or 4 Unit Apartments | 0 (0.0%) | 0 (0.0%) |
| 5 to 9 Unit Apartments | 0 (0.0%) | 14 (100.0%) |
| 10 or more Apartments | 0 (0.0%) | 21 (100.0%) |
| Mobile Home / Other | 0 (0.0%) | 0 (0.0%) |
| Total | 1,859 (92.5%) | 151 (7.5%) |
Housing Structures by Number of Rooms in Gates
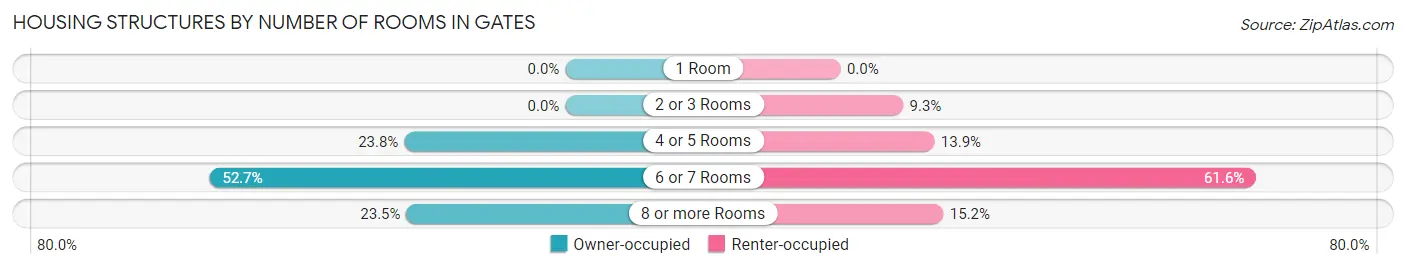
| Number of Rooms | Owner-occupied | Renter-occupied |
| 1 Room | 0 (0.0%) | 0 (0.0%) |
| 2 or 3 Rooms | 0 (0.0%) | 14 (9.3%) |
| 4 or 5 Rooms | 443 (23.8%) | 21 (13.9%) |
| 6 or 7 Rooms | 979 (52.7%) | 93 (61.6%) |
| 8 or more Rooms | 437 (23.5%) | 23 (15.2%) |
| Total | 1,859 (100.0%) | 151 (100.0%) |
Housing Structure by Heating Type in Gates
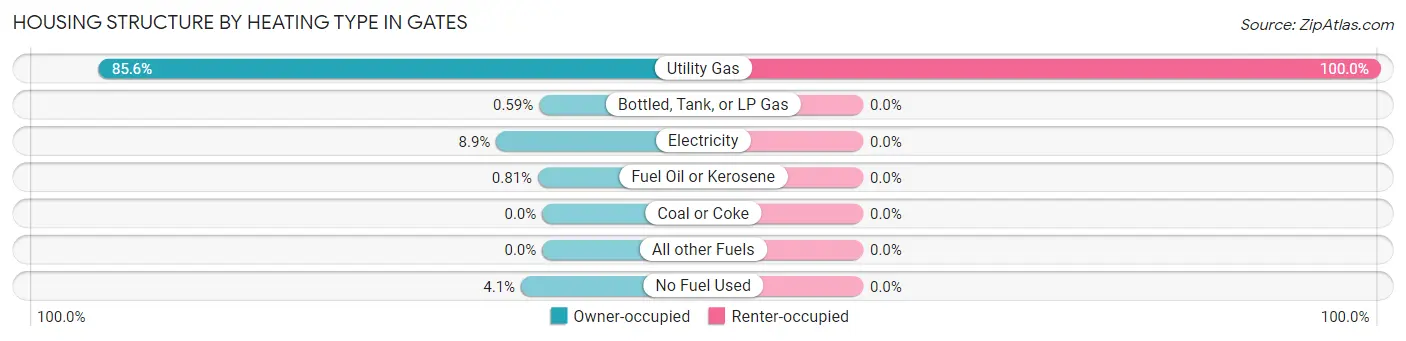
| Heating Type | Owner-occupied | Renter-occupied |
| Utility Gas | 1,592 (85.6%) | 151 (100.0%) |
| Bottled, Tank, or LP Gas | 11 (0.6%) | 0 (0.0%) |
| Electricity | 165 (8.9%) | 0 (0.0%) |
| Fuel Oil or Kerosene | 15 (0.8%) | 0 (0.0%) |
| Coal or Coke | 0 (0.0%) | 0 (0.0%) |
| All other Fuels | 0 (0.0%) | 0 (0.0%) |
| No Fuel Used | 76 (4.1%) | 0 (0.0%) |
| Total | 1,859 (100.0%) | 151 (100.0%) |
Household Vehicle Usage in Gates
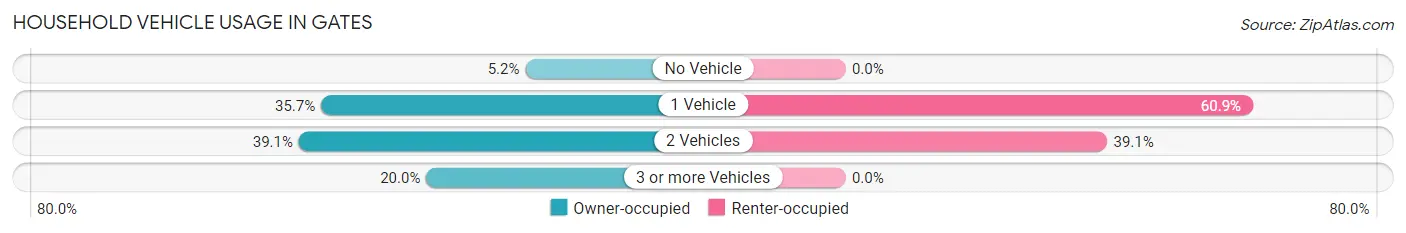
| Vehicles per Household | Owner-occupied | Renter-occupied |
| No Vehicle | 97 (5.2%) | 0 (0.0%) |
| 1 Vehicle | 664 (35.7%) | 92 (60.9%) |
| 2 Vehicles | 726 (39.1%) | 59 (39.1%) |
| 3 or more Vehicles | 372 (20.0%) | 0 (0.0%) |
| Total | 1,859 (100.0%) | 151 (100.0%) |
Real Estate & Mortgages in Gates
Real Estate and Mortgage Overview in Gates
| Characteristic | Without Mortgage | With Mortgage |
| Housing Units | 652 | 1,207 |
| Median Property Value | $145,000 | $149,100 |
| Median Household Income | $47,964 | $162 |
| Monthly Housing Costs | $588 | $27 |
| Real Estate Taxes | $4,268 | $0 |
Property Value by Mortgage Status in Gates
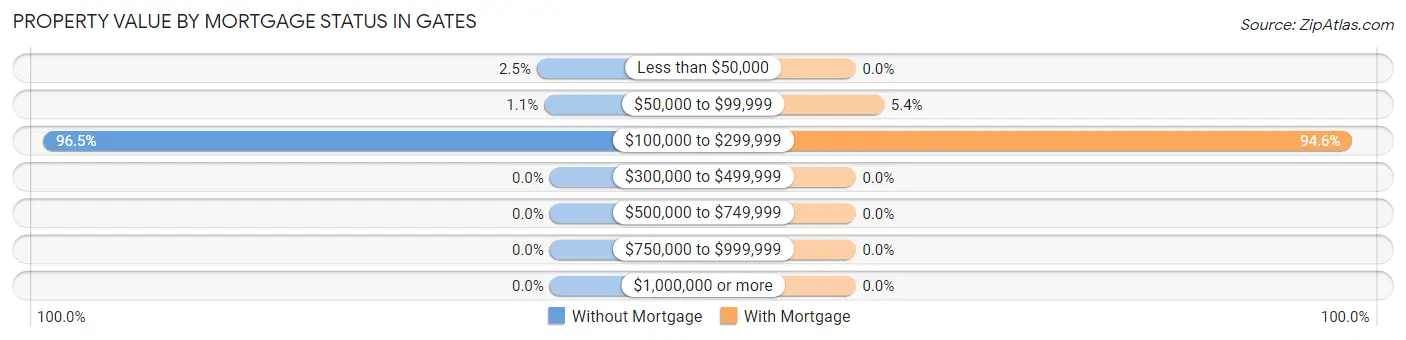
| Property Value | Without Mortgage | With Mortgage |
| Less than $50,000 | 16 (2.5%) | 0 (0.0%) |
| $50,000 to $99,999 | 7 (1.1%) | 65 (5.4%) |
| $100,000 to $299,999 | 629 (96.5%) | 1,142 (94.6%) |
| $300,000 to $499,999 | 0 (0.0%) | 0 (0.0%) |
| $500,000 to $749,999 | 0 (0.0%) | 0 (0.0%) |
| $750,000 to $999,999 | 0 (0.0%) | 0 (0.0%) |
| $1,000,000 or more | 0 (0.0%) | 0 (0.0%) |
| Total | 652 (100.0%) | 1,207 (100.0%) |
Household Income by Mortgage Status in Gates
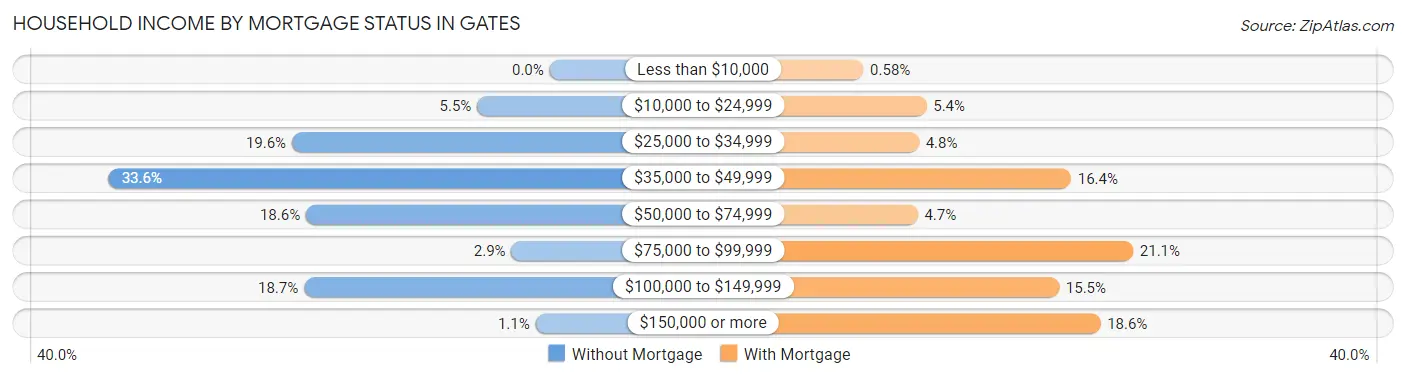
| Household Income | Without Mortgage | With Mortgage |
| Less than $10,000 | 0 (0.0%) | 7 (0.6%) |
| $10,000 to $24,999 | 36 (5.5%) | 65 (5.4%) |
| $25,000 to $34,999 | 128 (19.6%) | 58 (4.8%) |
| $35,000 to $49,999 | 219 (33.6%) | 198 (16.4%) |
| $50,000 to $74,999 | 121 (18.6%) | 57 (4.7%) |
| $75,000 to $99,999 | 19 (2.9%) | 255 (21.1%) |
| $100,000 to $149,999 | 122 (18.7%) | 187 (15.5%) |
| $150,000 or more | 7 (1.1%) | 225 (18.6%) |
| Total | 652 (100.0%) | 1,207 (100.0%) |
Property Value to Household Income Ratio in Gates
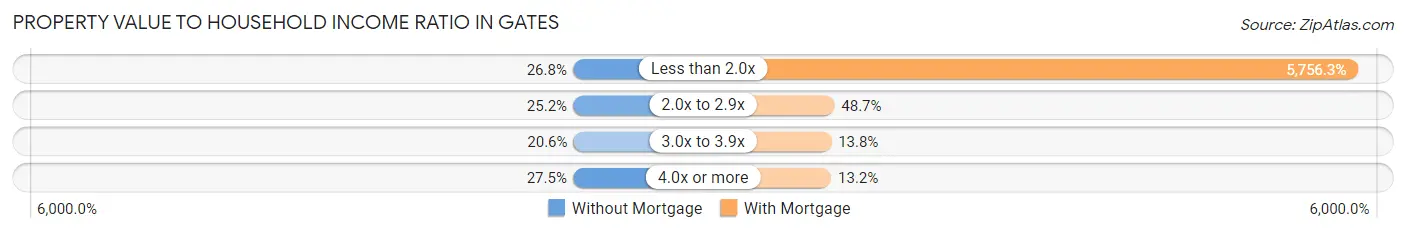
| Value-to-Income Ratio | Without Mortgage | With Mortgage |
| Less than 2.0x | 175 (26.8%) | 69,479 (5,756.3%) |
| 2.0x to 2.9x | 164 (25.2%) | 588 (48.7%) |
| 3.0x to 3.9x | 134 (20.5%) | 166 (13.8%) |
| 4.0x or more | 179 (27.5%) | 159 (13.2%) |
| Total | 652 (100.0%) | 1,207 (100.0%) |
Real Estate Taxes by Mortgage Status in Gates
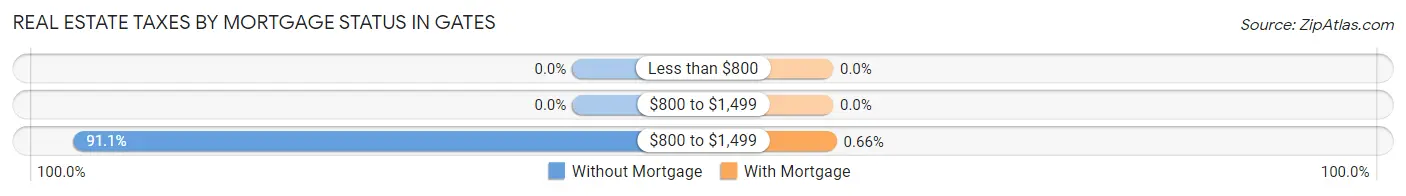
| Property Taxes | Without Mortgage | With Mortgage |
| Less than $800 | 0 (0.0%) | 0 (0.0%) |
| $800 to $1,499 | 0 (0.0%) | 0 (0.0%) |
| $800 to $1,499 | 594 (91.1%) | 8 (0.7%) |
| Total | 652 (100.0%) | 1,207 (100.0%) |
Health & Disability in Gates
Health Insurance Coverage by Age in Gates
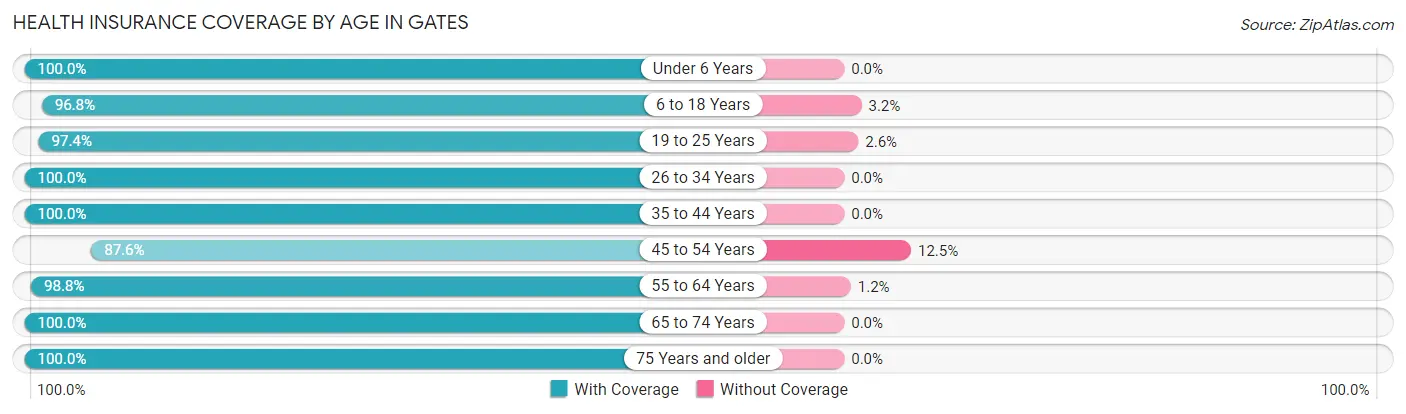
| Age Bracket | With Coverage | Without Coverage |
| Under 6 Years | 320 (100.0%) | 0 (0.0%) |
| 6 to 18 Years | 603 (96.8%) | 20 (3.2%) |
| 19 to 25 Years | 297 (97.4%) | 8 (2.6%) |
| 26 to 34 Years | 720 (100.0%) | 0 (0.0%) |
| 35 to 44 Years | 366 (100.0%) | 0 (0.0%) |
| 45 to 54 Years | 478 (87.5%) | 68 (12.4%) |
| 55 to 64 Years | 894 (98.8%) | 11 (1.2%) |
| 65 to 74 Years | 472 (100.0%) | 0 (0.0%) |
| 75 Years and older | 459 (100.0%) | 0 (0.0%) |
| Total | 4,609 (97.7%) | 107 (2.3%) |
Health Insurance Coverage by Citizenship Status in Gates
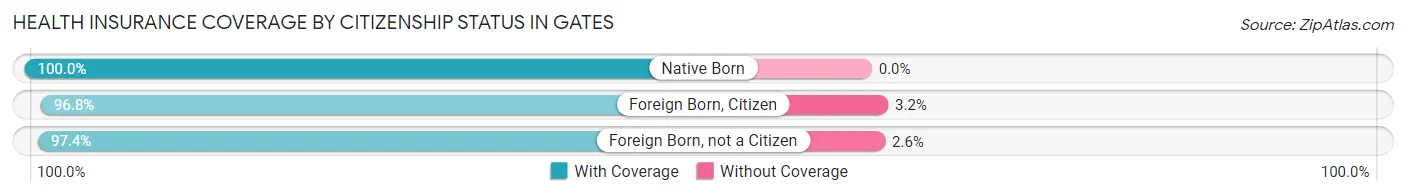
| Citizenship Status | With Coverage | Without Coverage |
| Native Born | 320 (100.0%) | 0 (0.0%) |
| Foreign Born, Citizen | 603 (96.8%) | 20 (3.2%) |
| Foreign Born, not a Citizen | 297 (97.4%) | 8 (2.6%) |
Health Insurance Coverage by Household Income in Gates
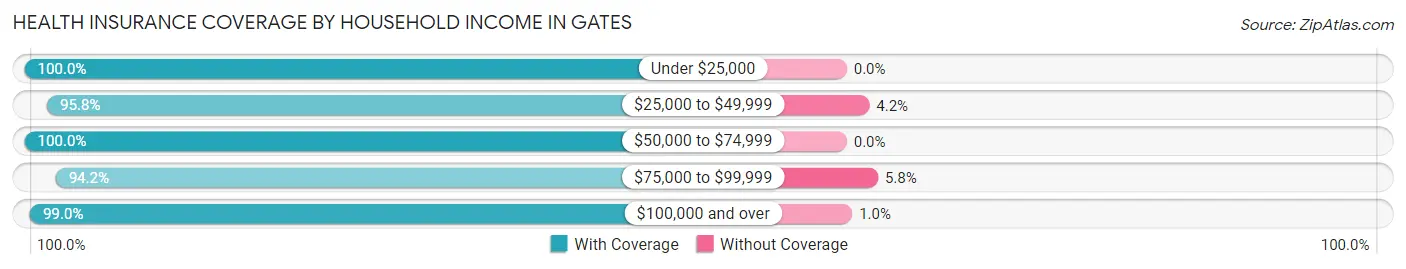
| Household Income | With Coverage | Without Coverage |
| Under $25,000 | 159 (100.0%) | 0 (0.0%) |
| $25,000 to $49,999 | 1,268 (95.8%) | 56 (4.2%) |
| $50,000 to $74,999 | 820 (100.0%) | 0 (0.0%) |
| $75,000 to $99,999 | 516 (94.2%) | 32 (5.8%) |
| $100,000 and over | 1,846 (99.0%) | 19 (1.0%) |
Public vs Private Health Insurance Coverage by Age in Gates

| Age Bracket | Public Insurance | Private Insurance |
| Under 6 | 87 (27.2%) | 301 (94.1%) |
| 6 to 18 Years | 263 (42.2%) | 340 (54.6%) |
| 19 to 25 Years | 38 (12.5%) | 259 (84.9%) |
| 25 to 34 Years | 121 (16.8%) | 645 (89.6%) |
| 35 to 44 Years | 144 (39.3%) | 283 (77.3%) |
| 45 to 54 Years | 279 (51.1%) | 229 (41.9%) |
| 55 to 64 Years | 232 (25.6%) | 726 (80.2%) |
| 65 to 74 Years | 455 (96.4%) | 333 (70.6%) |
| 75 Years and over | 449 (97.8%) | 331 (72.1%) |
| Total | 2,068 (43.9%) | 3,447 (73.1%) |
Disability Status by Sex by Age in Gates
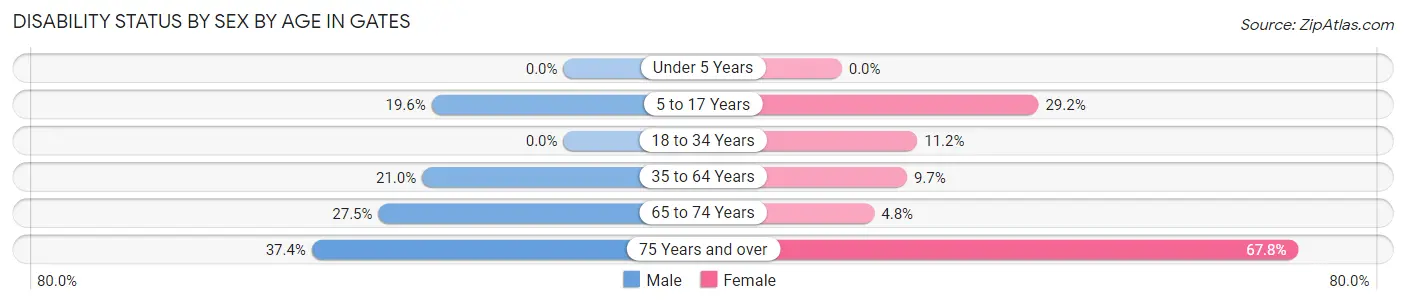
| Age Bracket | Male | Female |
| Under 5 Years | 0 (0.0%) | 0 (0.0%) |
| 5 to 17 Years | 46 (19.6%) | 104 (29.2%) |
| 18 to 34 Years | 0 (0.0%) | 63 (11.2%) |
| 35 to 64 Years | 184 (21.0%) | 91 (9.7%) |
| 65 to 74 Years | 50 (27.5%) | 14 (4.8%) |
| 75 Years and over | 37 (37.4%) | 244 (67.8%) |
Disability Class by Sex by Age in Gates
Disability Class: Hearing Difficulty
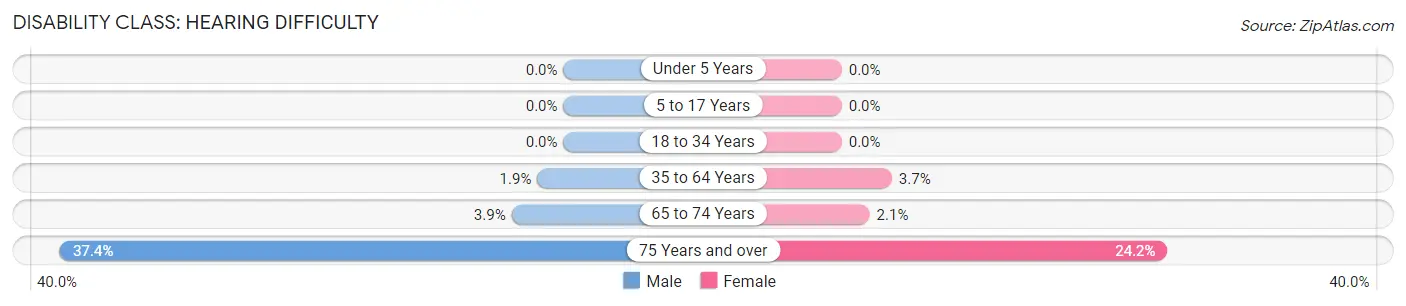
| Age Bracket | Male | Female |
| Under 5 Years | 0 (0.0%) | 0 (0.0%) |
| 5 to 17 Years | 0 (0.0%) | 0 (0.0%) |
| 18 to 34 Years | 0 (0.0%) | 0 (0.0%) |
| 35 to 64 Years | 17 (1.9%) | 35 (3.7%) |
| 65 to 74 Years | 7 (3.8%) | 6 (2.1%) |
| 75 Years and over | 37 (37.4%) | 87 (24.2%) |
Disability Class: Vision Difficulty
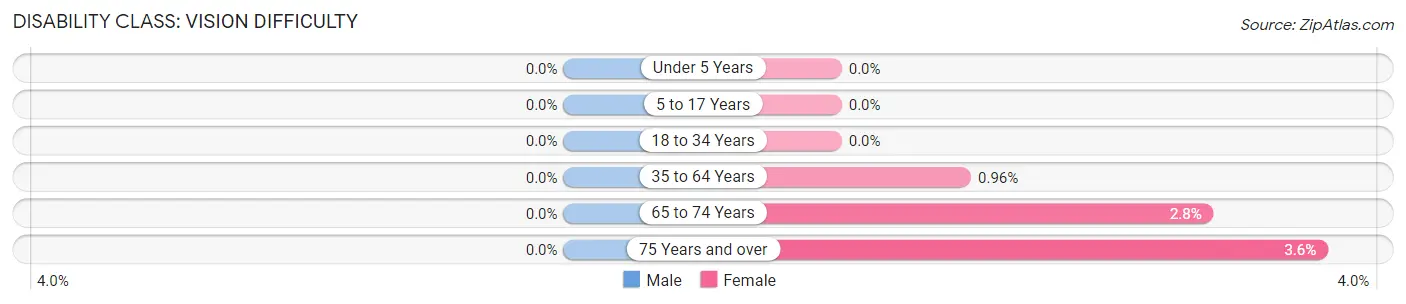
| Age Bracket | Male | Female |
| Under 5 Years | 0 (0.0%) | 0 (0.0%) |
| 5 to 17 Years | 0 (0.0%) | 0 (0.0%) |
| 18 to 34 Years | 0 (0.0%) | 0 (0.0%) |
| 35 to 64 Years | 0 (0.0%) | 9 (1.0%) |
| 65 to 74 Years | 0 (0.0%) | 8 (2.8%) |
| 75 Years and over | 0 (0.0%) | 13 (3.6%) |
Disability Class: Cognitive Difficulty
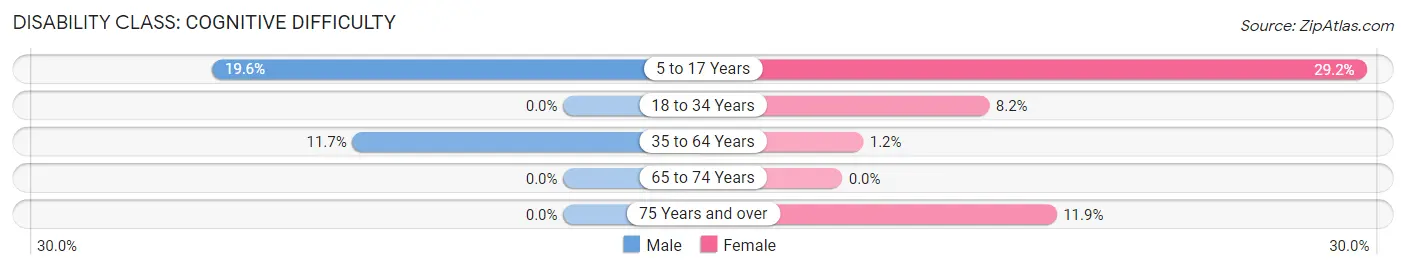
| Age Bracket | Male | Female |
| 5 to 17 Years | 46 (19.6%) | 104 (29.2%) |
| 18 to 34 Years | 0 (0.0%) | 46 (8.2%) |
| 35 to 64 Years | 103 (11.7%) | 11 (1.2%) |
| 65 to 74 Years | 0 (0.0%) | 0 (0.0%) |
| 75 Years and over | 0 (0.0%) | 43 (11.9%) |
Disability Class: Ambulatory Difficulty
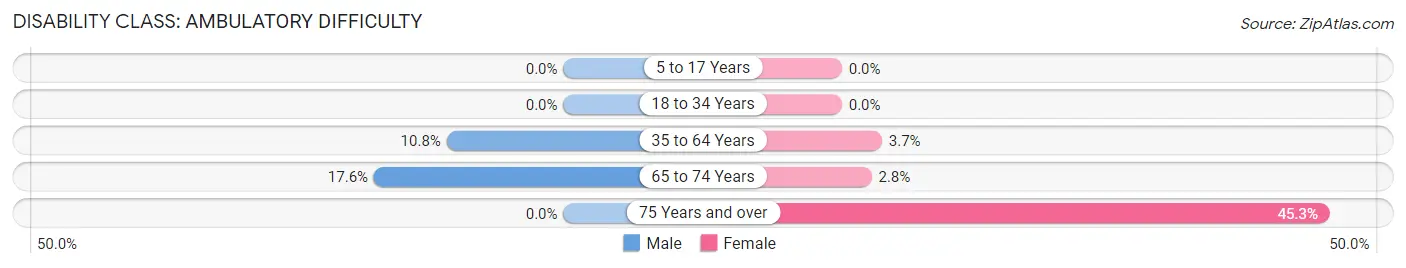
| Age Bracket | Male | Female |
| 5 to 17 Years | 0 (0.0%) | 0 (0.0%) |
| 18 to 34 Years | 0 (0.0%) | 0 (0.0%) |
| 35 to 64 Years | 95 (10.8%) | 35 (3.7%) |
| 65 to 74 Years | 32 (17.6%) | 8 (2.8%) |
| 75 Years and over | 0 (0.0%) | 163 (45.3%) |
Disability Class: Self-Care Difficulty
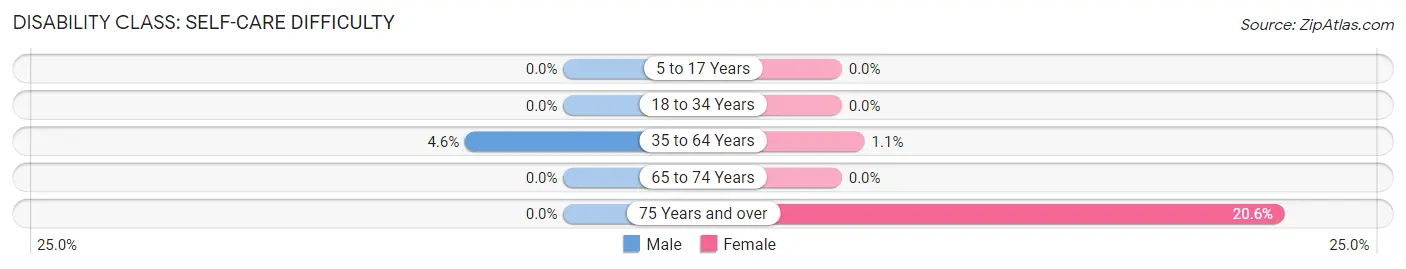
| Age Bracket | Male | Female |
| 5 to 17 Years | 0 (0.0%) | 0 (0.0%) |
| 18 to 34 Years | 0 (0.0%) | 0 (0.0%) |
| 35 to 64 Years | 40 (4.6%) | 10 (1.1%) |
| 65 to 74 Years | 0 (0.0%) | 0 (0.0%) |
| 75 Years and over | 0 (0.0%) | 74 (20.6%) |
Technology Access in Gates
Computing Device Access in Gates
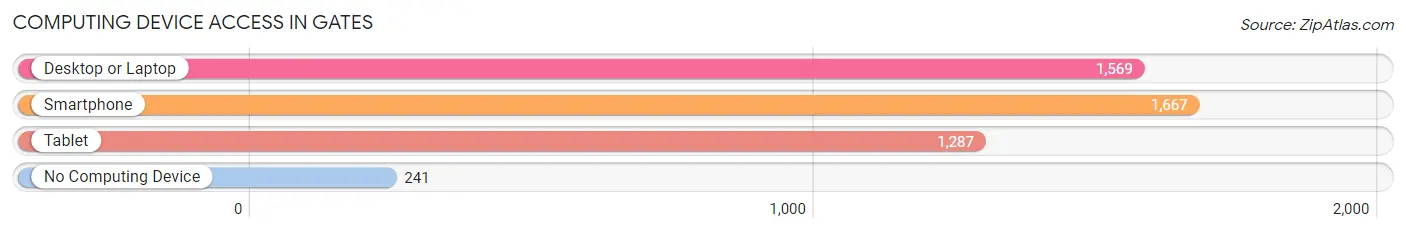
| Device Type | # Households | % Households |
| Desktop or Laptop | 1,569 | 78.1% |
| Smartphone | 1,667 | 82.9% |
| Tablet | 1,287 | 64.0% |
| No Computing Device | 241 | 12.0% |
| Total | 2,010 | 100.0% |
Internet Access in Gates
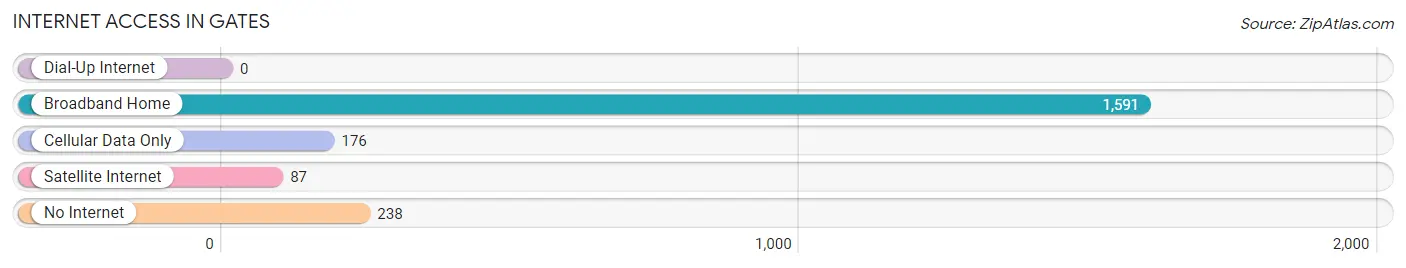
| Internet Type | # Households | % Households |
| Dial-Up Internet | 0 | 0.0% |
| Broadband Home | 1,591 | 79.1% |
| Cellular Data Only | 176 | 8.8% |
| Satellite Internet | 87 | 4.3% |
| No Internet | 238 | 11.8% |
| Total | 2,010 | 100.0% |
Gates Summary
Gates is a town located in Monroe County, New York, United States. The population was 28,400 at the 2010 census. It is the second largest suburb of the city of Rochester. Gates is located in the northwest corner of Monroe County and is bordered by the towns of Greece, Ogden, Parma, and Wheatland.
History
Gates was first settled in 1791 by William Gates, a Revolutionary War veteran. The town was originally part of the town of Northampton, which was later divided into the towns of Gates and Ogden. The town of Gates was officially established in 1813.
Gates was an agricultural community until the 1950s, when the population began to grow rapidly due to the expansion of the city of Rochester. The town has since become a bedroom community for Rochester, with many of its residents commuting to the city for work.
Geography
Gates is located in the northwest corner of Monroe County, bordered by the towns of Greece, Ogden, Parma, and Wheatland. The town is located on the Genesee River, which forms the western border of the town. The town is mostly flat, with some rolling hills in the northern and eastern parts of the town.
The town has a total area of 24.2 square miles, of which 24.1 square miles is land and 0.1 square miles is water.
Economy
Gates is primarily a residential community, with most of its residents commuting to the city of Rochester for work. The town does have some light industry, including manufacturing, warehousing, and distribution.
The town is also home to several large retail stores including Walmart Target and Lowe s
Demographics
As of the 2010 census, there were 28,400 people, 10,890 households, and 7,845 families residing in the town. The population density was 1,179.2 people per square mile. The racial makeup of the town was 87.3% White, 8.2% African American, 0.3% Native American, 1.7% Asian, 0.1% Pacific Islander, 0.7% from other races, and 1.9% from two or more races. Hispanic or Latino of any race were 3.2% of the population.
The median income for a household in the town was $60,945, and the median income for a family was $71,945. The per capita income for the town was $27,945. About 4.2% of families and 5.7% of the population were below the poverty line, including 7.2% of those under age 18 and 4.2% of those age 65 or over.
Common Questions
What is Per Capita Income in Gates?
Per Capita income in Gates is $31,966.
What is the Median Family Income in Gates?
Median Family Income in Gates is $59,848.
What is the Median Household income in Gates?
Median Household Income in Gates is $53,362.
What is Income or Wage Gap in Gates?
Income or Wage Gap in Gates is 38.6%.
Women in Gates earn 61.4 cents for every dollar earned by a man.
What is Inequality or Gini Index in Gates?
Inequality or Gini Index in Gates is 0.38.
What is the Total Population of Gates?
Total Population of Gates is 4,716.
What is the Total Male Population of Gates?
Total Male Population of Gates is 2,150.
What is the Total Female Population of Gates?
Total Female Population of Gates is 2,566.
What is the Ratio of Males per 100 Females in Gates?
There are 83.79 Males per 100 Females in Gates.
What is the Ratio of Females per 100 Males in Gates?
There are 119.35 Females per 100 Males in Gates.
What is the Median Population Age in Gates?
Median Population Age in Gates is 45.3 Years.
What is the Average Family Size in Gates
Average Family Size in Gates is 3.0 People.
What is the Average Household Size in Gates
Average Household Size in Gates is 2.4 People.
How Large is the Labor Force in Gates?
There are 2,482 People in the Labor Forcein in Gates.
What is the Percentage of People in the Labor Force in Gates?
63.0% of People are in the Labor Force in Gates.
What is the Unemployment Rate in Gates?
Unemployment Rate in Gates is 5.2%.