Mexico, NY Map & Demographics
Mexico Map
Mexico Overview
$37,077
PER CAPITA INCOME
$79,271
AVG FAMILY INCOME
$70,625
AVG HOUSEHOLD INCOME
21.4%
WAGE / INCOME GAP [ % ]
78.6¢/ $1
WAGE / INCOME GAP [ $ ]
0.38
INEQUALITY / GINI INDEX
1,925
TOTAL POPULATION
876
MALE POPULATION
1,049
FEMALE POPULATION
83.51
MALES / 100 FEMALES
119.75
FEMALES / 100 MALES
34.6
MEDIAN AGE
2.8
AVG FAMILY SIZE
2.2
AVG HOUSEHOLD SIZE
980
LABOR FORCE [ PEOPLE ]
63.7%
PERCENT IN LABOR FORCE
2.1%
UNEMPLOYMENT RATE
Mexico Zip Codes
Mexico Area Codes
Income in Mexico
Income Overview in Mexico
Per Capita Income in Mexico is $37,077, while median incomes of families and households are $79,271 and $70,625 respectively.
| Characteristic | Number | Measure |
| Per Capita Income | 1,925 | $37,077 |
| Median Family Income | 467 | $79,271 |
| Mean Family Income | 467 | $96,353 |
| Median Household Income | 860 | $70,625 |
| Mean Household Income | 860 | $83,426 |
| Income Deficit | 467 | $0 |
| Wage / Income Gap (%) | 1,925 | 21.38% |
| Wage / Income Gap ($) | 1,925 | 78.62¢ per $1 |
| Gini / Inequality Index | 1,925 | 0.38 |
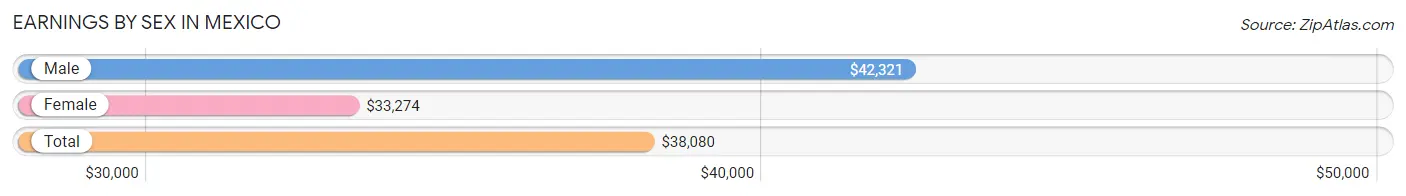
Earnings by Sex in Mexico
Average Earnings in Mexico are $38,080, $42,321 for men and $33,274 for women, a difference of 21.4%.
| Sex | Number | Average Earnings |
| Male | 480 (45.0%) | $42,321 |
| Female | 586 (55.0%) | $33,274 |
| Total | 1,066 (100.0%) | $38,080 |
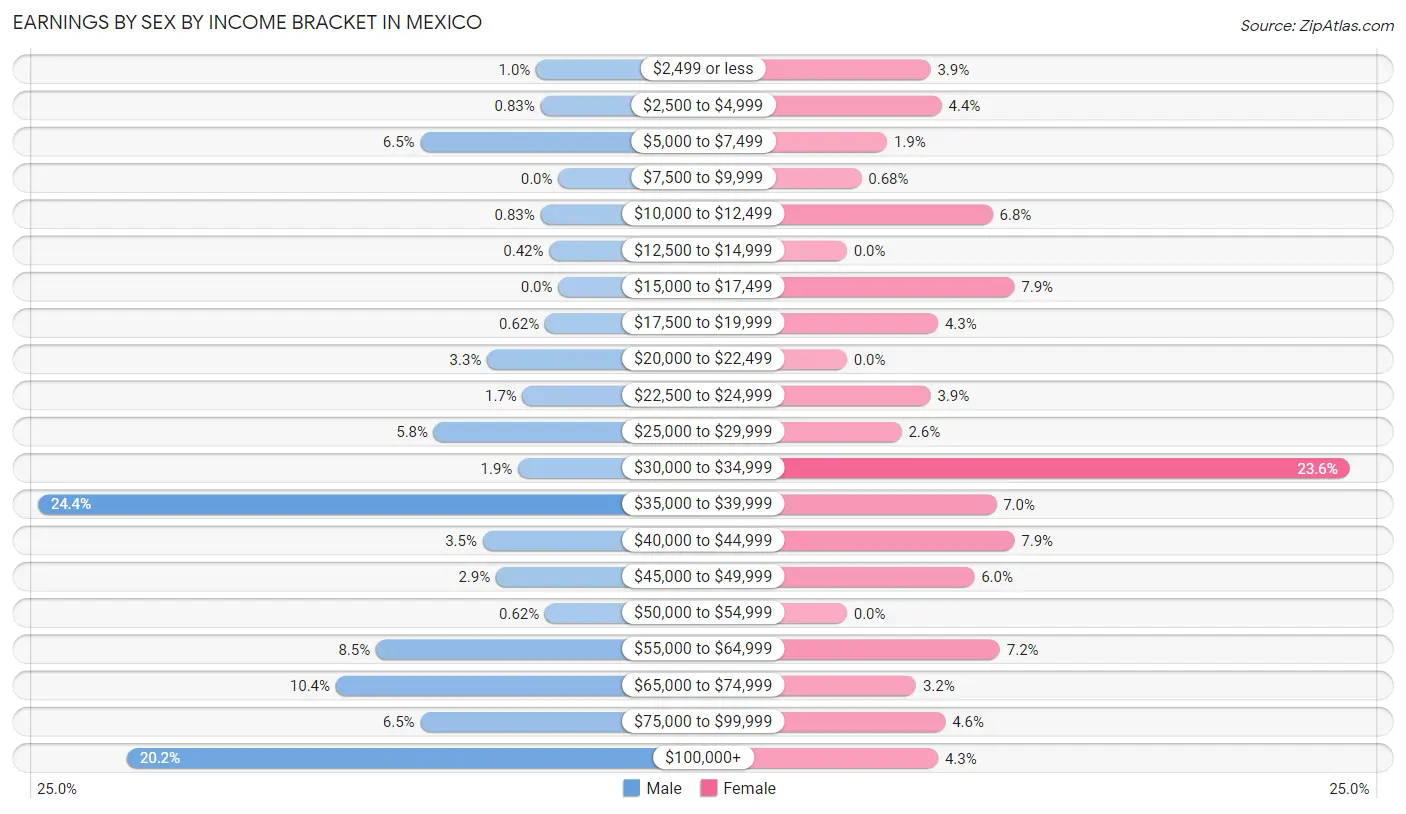
Earnings by Sex by Income Bracket in Mexico
The most common earnings brackets in Mexico are $35,000 to $39,999 for men (117 | 24.4%) and $30,000 to $34,999 for women (138 | 23.5%).
| Income | Male | Female |
| $2,499 or less | 5 (1.0%) | 23 (3.9%) |
| $2,500 to $4,999 | 4 (0.8%) | 26 (4.4%) |
| $5,000 to $7,499 | 31 (6.5%) | 11 (1.9%) |
| $7,500 to $9,999 | 0 (0.0%) | 4 (0.7%) |
| $10,000 to $12,499 | 4 (0.8%) | 40 (6.8%) |
| $12,500 to $14,999 | 2 (0.4%) | 0 (0.0%) |
| $15,000 to $17,499 | 0 (0.0%) | 46 (7.9%) |
| $17,500 to $19,999 | 3 (0.6%) | 25 (4.3%) |
| $20,000 to $22,499 | 16 (3.3%) | 0 (0.0%) |
| $22,500 to $24,999 | 8 (1.7%) | 23 (3.9%) |
| $25,000 to $29,999 | 28 (5.8%) | 15 (2.6%) |
| $30,000 to $34,999 | 9 (1.9%) | 138 (23.5%) |
| $35,000 to $39,999 | 117 (24.4%) | 41 (7.0%) |
| $40,000 to $44,999 | 17 (3.5%) | 46 (7.9%) |
| $45,000 to $49,999 | 14 (2.9%) | 35 (6.0%) |
| $50,000 to $54,999 | 3 (0.6%) | 0 (0.0%) |
| $55,000 to $64,999 | 41 (8.5%) | 42 (7.2%) |
| $65,000 to $74,999 | 50 (10.4%) | 19 (3.2%) |
| $75,000 to $99,999 | 31 (6.5%) | 27 (4.6%) |
| $100,000+ | 97 (20.2%) | 25 (4.3%) |
| Total | 480 (100.0%) | 586 (100.0%) |
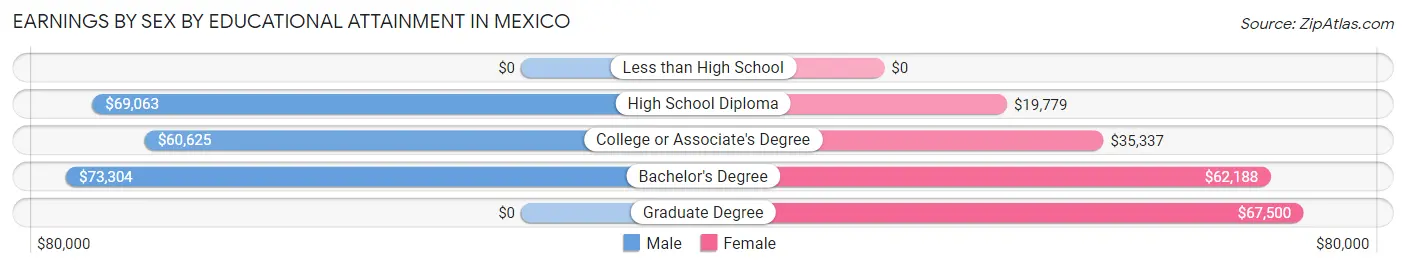
Earnings by Sex by Educational Attainment in Mexico
Average earnings in Mexico are $61,250 for men and $36,394 for women, a difference of 40.6%. Men with an educational attainment of bachelor's degree enjoy the highest average annual earnings of $73,304, while those with college or associate's degree education earn the least with $60,625. Women with an educational attainment of graduate degree earn the most with the average annual earnings of $67,500, while those with high school diploma education have the smallest earnings of $19,779.
| Educational Attainment | Male Income | Female Income |
| Less than High School | - | - |
| High School Diploma | $69,063 | $19,779 |
| College or Associate's Degree | $60,625 | $35,337 |
| Bachelor's Degree | $73,304 | $62,188 |
| Graduate Degree | - | - |
| Total | $61,250 | $36,394 |
Family Income in Mexico
Family Income Brackets in Mexico
According to the Mexico family income data, there are 120 families falling into the $100,000 to $149,999 income range, which is the most common income bracket and makes up 25.7% of all families. Conversely, the $10,000 to $14,999 income bracket is the least frequent group with only 2 families (0.4%) belonging to this category.
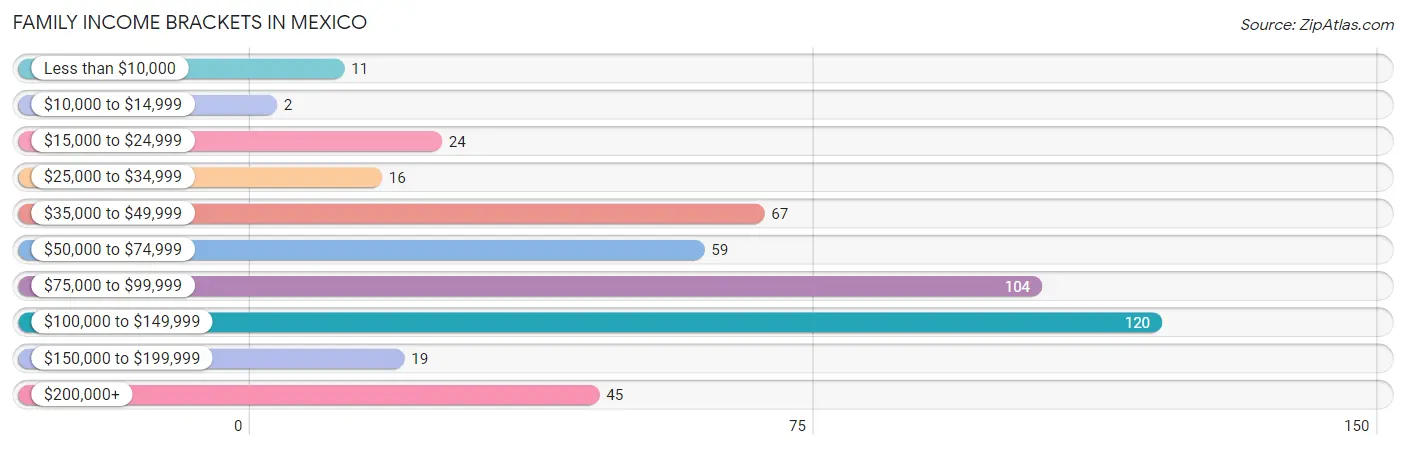
| Income Bracket | # Families | % Families |
| Less than $10,000 | 11 | 2.4% |
| $10,000 to $14,999 | 2 | 0.4% |
| $15,000 to $24,999 | 24 | 5.1% |
| $25,000 to $34,999 | 16 | 3.4% |
| $35,000 to $49,999 | 67 | 14.3% |
| $50,000 to $74,999 | 59 | 12.6% |
| $75,000 to $99,999 | 104 | 22.3% |
| $100,000 to $149,999 | 120 | 25.7% |
| $150,000 to $199,999 | 19 | 4.1% |
| $200,000+ | 45 | 9.6% |
Family Income by Famaliy Size in Mexico
4-person families (65 | 13.9%) account for the highest median family income in Mexico with $120,521 per family, while 2-person families (223 | 47.7%) have the highest median income of $37,704 per family member.
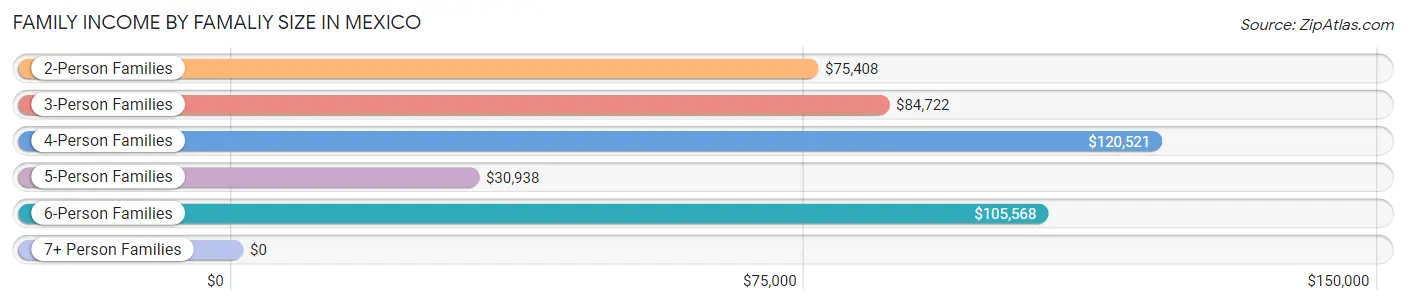
| Income Bracket | # Families | Median Income |
| 2-Person Families | 223 (47.7%) | $75,408 |
| 3-Person Families | 136 (29.1%) | $84,722 |
| 4-Person Families | 65 (13.9%) | $120,521 |
| 5-Person Families | 11 (2.4%) | $30,938 |
| 6-Person Families | 23 (4.9%) | $105,568 |
| 7+ Person Families | 9 (1.9%) | $0 |
| Total | 467 (100.0%) | $79,271 |
Family Income by Number of Earners in Mexico
The median family income in Mexico is $79,271, with families comprising 3+ earners (46) having the highest median family income of $250,001, while families with 1 earner (131) have the lowest median family income of $42,750, accounting for 9.9% and 28.1% of families, respectively.
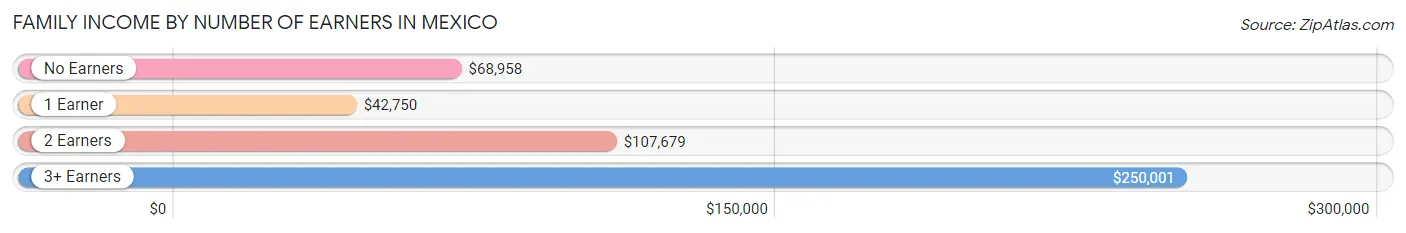
| Number of Earners | # Families | Median Income |
| No Earners | 111 (23.8%) | $68,958 |
| 1 Earner | 131 (28.1%) | $42,750 |
| 2 Earners | 179 (38.3%) | $107,679 |
| 3+ Earners | 46 (9.9%) | $250,001 |
| Total | 467 (100.0%) | $79,271 |
Household Income in Mexico
Household Income Brackets in Mexico
With 202 households falling in the category, the $50,000 to $74,999 income range is the most frequent in Mexico, accounting for 23.5% of all households. In contrast, only 15 households (1.7%) fall into the less than $10,000 income bracket, making it the least populous group.
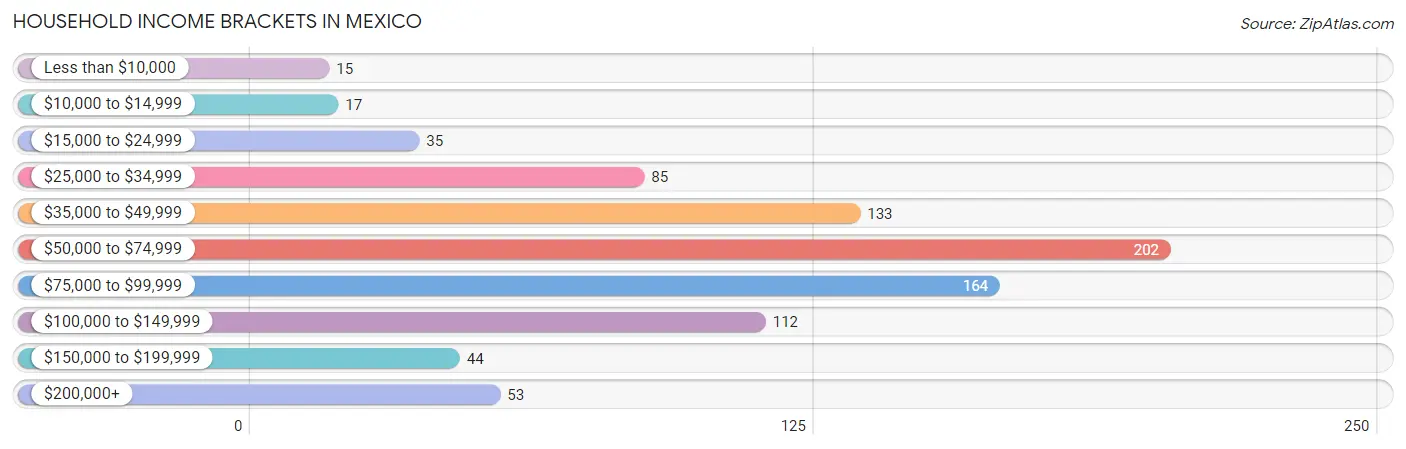
| Income Bracket | # Households | % Households |
| Less than $10,000 | 15 | 1.7% |
| $10,000 to $14,999 | 17 | 2.0% |
| $15,000 to $24,999 | 35 | 4.1% |
| $25,000 to $34,999 | 85 | 9.9% |
| $35,000 to $49,999 | 133 | 15.5% |
| $50,000 to $74,999 | 202 | 23.5% |
| $75,000 to $99,999 | 164 | 19.1% |
| $100,000 to $149,999 | 112 | 13.0% |
| $150,000 to $199,999 | 44 | 5.1% |
| $200,000+ | 53 | 6.2% |
Household Income by Householder Age in Mexico
The median household income in Mexico is $70,625, with the highest median household income of $80,000 found in the 25 to 44 years age bracket for the primary householder. A total of 282 households (32.8%) fall into this category. Meanwhile, the 15 to 24 years age bracket for the primary householder has the lowest median household income of $0, with 80 households (9.3%) in this group.
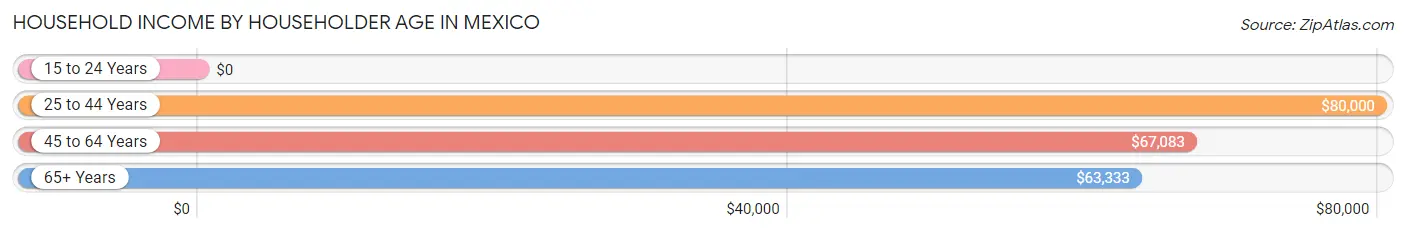
| Income Bracket | # Households | Median Income |
| 15 to 24 Years | 80 (9.3%) | $0 |
| 25 to 44 Years | 282 (32.8%) | $80,000 |
| 45 to 64 Years | 244 (28.4%) | $67,083 |
| 65+ Years | 254 (29.5%) | $63,333 |
| Total | 860 (100.0%) | $70,625 |
Poverty in Mexico
Income Below Poverty by Sex and Age in Mexico
With 9.0% poverty level for males and 9.1% for females among the residents of Mexico, 5 year old males and under 5 year old females are the most vulnerable to poverty, with 9 males (52.9%) and 14 females (25.0%) in their respective age groups living below the poverty level.
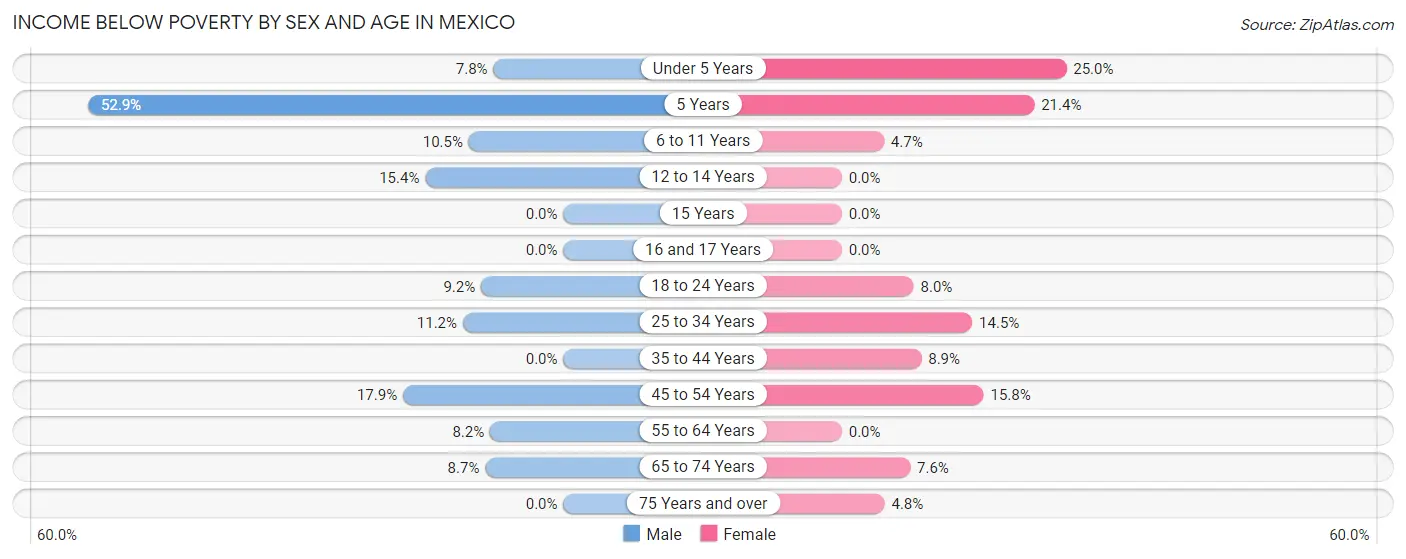
| Age Bracket | Male | Female |
| Under 5 Years | 6 (7.8%) | 14 (25.0%) |
| 5 Years | 9 (52.9%) | 3 (21.4%) |
| 6 to 11 Years | 8 (10.5%) | 3 (4.7%) |
| 12 to 14 Years | 4 (15.4%) | 0 (0.0%) |
| 15 Years | 0 (0.0%) | 0 (0.0%) |
| 16 and 17 Years | 0 (0.0%) | 0 (0.0%) |
| 18 to 24 Years | 11 (9.2%) | 12 (8.0%) |
| 25 to 34 Years | 15 (11.2%) | 27 (14.5%) |
| 35 to 44 Years | 0 (0.0%) | 10 (8.8%) |
| 45 to 54 Years | 15 (17.9%) | 12 (15.8%) |
| 55 to 64 Years | 8 (8.2%) | 0 (0.0%) |
| 65 to 74 Years | 2 (8.7%) | 7 (7.6%) |
| 75 Years and over | 0 (0.0%) | 7 (4.8%) |
| Total | 78 (9.0%) | 95 (9.1%) |
Income Above Poverty by Sex and Age in Mexico
According to the poverty statistics in Mexico, males aged 15 years and females aged 12 to 14 years are the age groups that are most secure financially, with 100.0% of males and 100.0% of females in these age groups living above the poverty line.
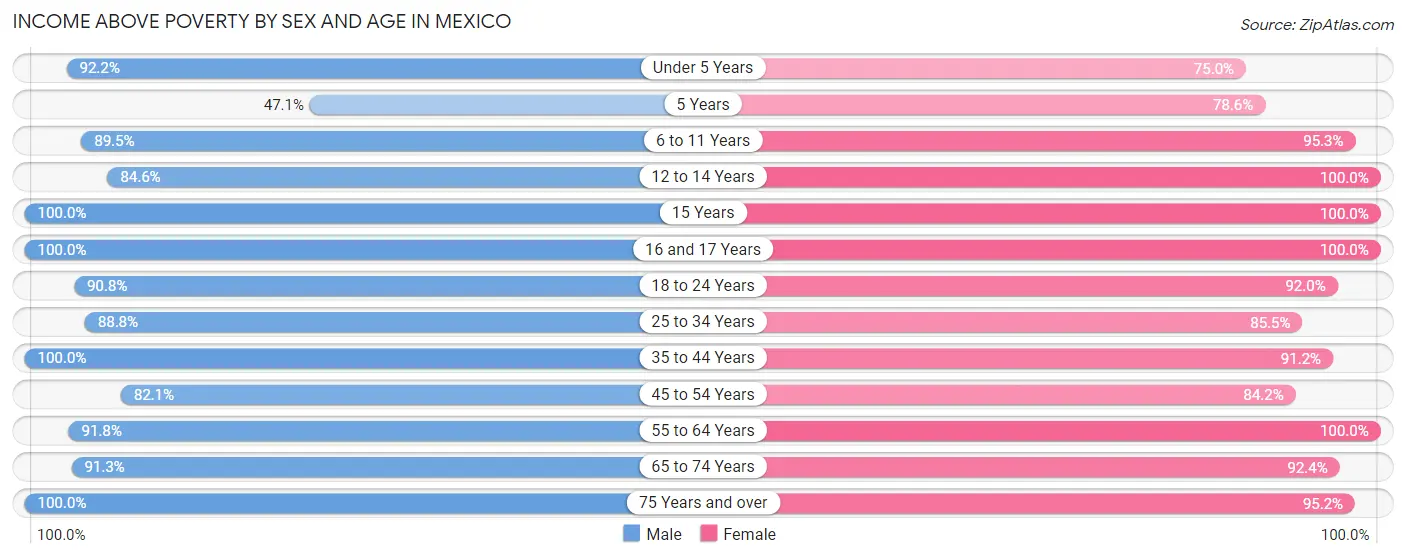
| Age Bracket | Male | Female |
| Under 5 Years | 71 (92.2%) | 42 (75.0%) |
| 5 Years | 8 (47.1%) | 11 (78.6%) |
| 6 to 11 Years | 68 (89.5%) | 61 (95.3%) |
| 12 to 14 Years | 22 (84.6%) | 26 (100.0%) |
| 15 Years | 14 (100.0%) | 6 (100.0%) |
| 16 and 17 Years | 5 (100.0%) | 10 (100.0%) |
| 18 to 24 Years | 109 (90.8%) | 138 (92.0%) |
| 25 to 34 Years | 119 (88.8%) | 159 (85.5%) |
| 35 to 44 Years | 93 (100.0%) | 103 (91.1%) |
| 45 to 54 Years | 69 (82.1%) | 64 (84.2%) |
| 55 to 64 Years | 90 (91.8%) | 106 (100.0%) |
| 65 to 74 Years | 21 (91.3%) | 85 (92.4%) |
| 75 Years and over | 101 (100.0%) | 140 (95.2%) |
| Total | 790 (91.0%) | 951 (90.9%) |
Income Below Poverty Among Married-Couple Families in Mexico
The poverty statistics for married-couple families in Mexico show that 3.5% or 11 of the total 311 families live below the poverty line. Families with 3 or 4 children have the highest poverty rate of 32.0%, comprising of 8 families. On the other hand, families with no children have the lowest poverty rate of 0.0%, which includes 0 families.
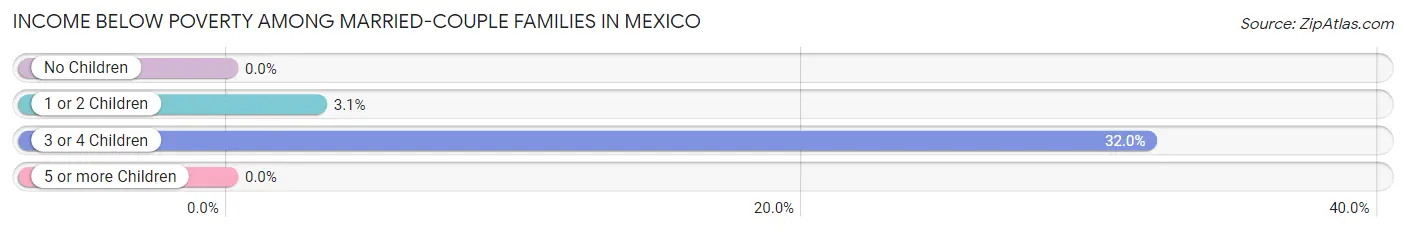
| Children | Above Poverty | Below Poverty |
| No Children | 180 (100.0%) | 0 (0.0%) |
| 1 or 2 Children | 94 (96.9%) | 3 (3.1%) |
| 3 or 4 Children | 17 (68.0%) | 8 (32.0%) |
| 5 or more Children | 9 (100.0%) | 0 (0.0%) |
| Total | 300 (96.5%) | 11 (3.5%) |
Income Below Poverty Among Single-Parent Households in Mexico
According to the poverty data in Mexico, 16.7% or 13 single-father households and 12.8% or 10 single-mother households are living below the poverty line. Among single-father households, those with no children have the highest poverty rate, with 11 households (78.6%) experiencing poverty. Likewise, among single-mother households, those with 1 or 2 children have the highest poverty rate, with 10 households (27.8%) falling below the poverty line.
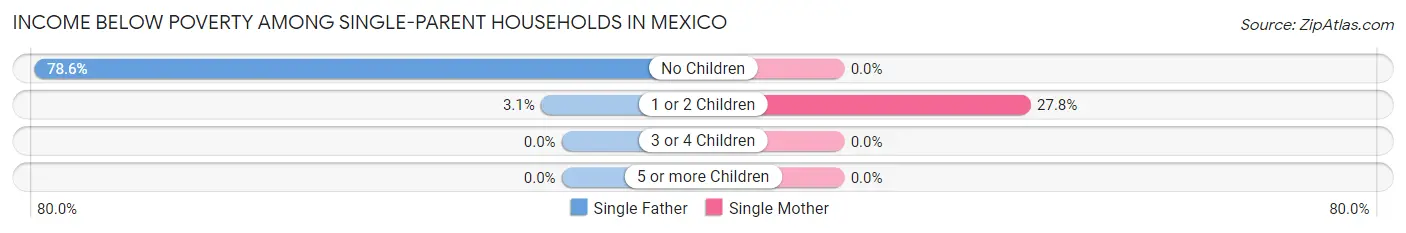
| Children | Single Father | Single Mother |
| No Children | 11 (78.6%) | 0 (0.0%) |
| 1 or 2 Children | 2 (3.1%) | 10 (27.8%) |
| 3 or 4 Children | 0 (0.0%) | 0 (0.0%) |
| 5 or more Children | 0 (0.0%) | 0 (0.0%) |
| Total | 13 (16.7%) | 10 (12.8%) |
Income Below Poverty Among Married-Couple vs Single-Parent Households in Mexico
The poverty data for Mexico shows that 11 of the married-couple family households (3.5%) and 23 of the single-parent households (14.7%) are living below the poverty level. Within the married-couple family households, those with 3 or 4 children have the highest poverty rate, with 8 households (32.0%) falling below the poverty line. Among the single-parent households, those with no children have the highest poverty rate, with 11 household (23.4%) living below poverty.
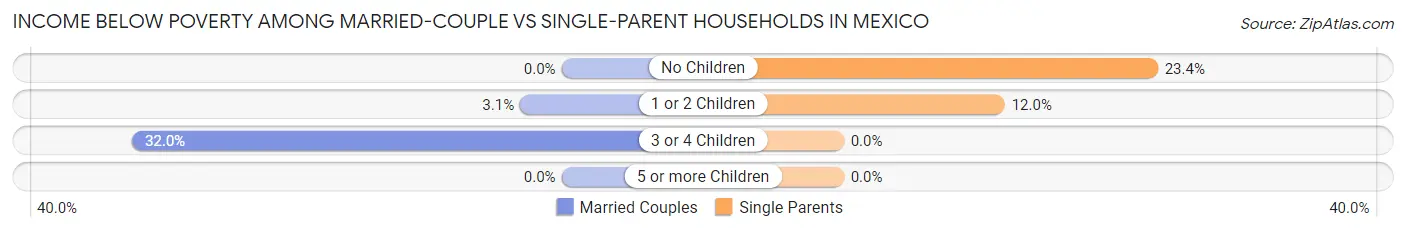
| Children | Married-Couple Families | Single-Parent Households |
| No Children | 0 (0.0%) | 11 (23.4%) |
| 1 or 2 Children | 3 (3.1%) | 12 (12.0%) |
| 3 or 4 Children | 8 (32.0%) | 0 (0.0%) |
| 5 or more Children | 0 (0.0%) | 0 (0.0%) |
| Total | 11 (3.5%) | 23 (14.7%) |
Race in Mexico
The most populous races in Mexico are White / Caucasian (1,832 | 95.2%), Two or more Races (57 | 3.0%), and Some other Race (15 | 0.8%).
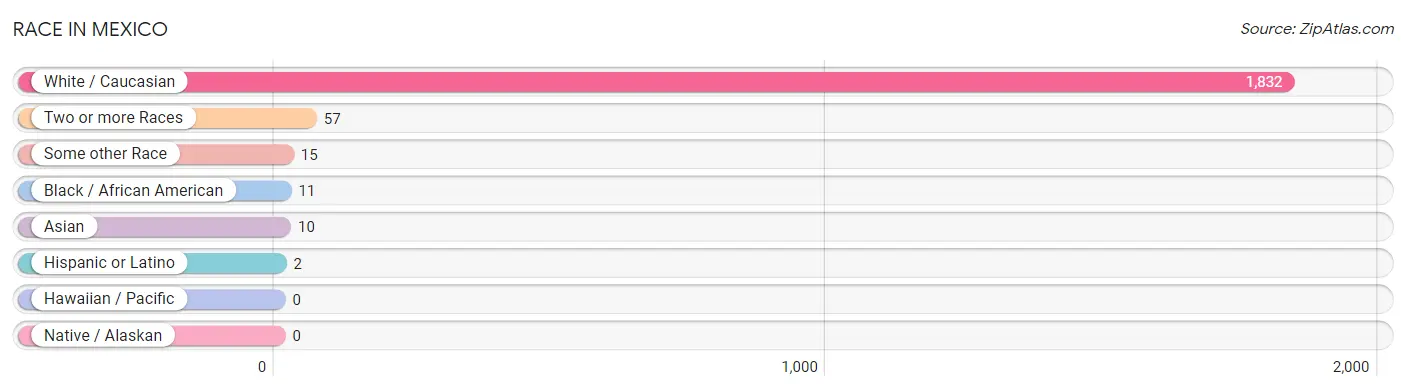
| Race | # Population | % Population |
| Asian | 10 | 0.5% |
| Black / African American | 11 | 0.6% |
| Hawaiian / Pacific | 0 | 0.0% |
| Hispanic or Latino | 2 | 0.1% |
| Native / Alaskan | 0 | 0.0% |
| White / Caucasian | 1,832 | 95.2% |
| Two or more Races | 57 | 3.0% |
| Some other Race | 15 | 0.8% |
| Total | 1,925 | 100.0% |
Ancestry in Mexico
The most populous ancestries reported in Mexico are Irish (318 | 16.5%), Italian (225 | 11.7%), English (211 | 11.0%), German (204 | 10.6%), and French (125 | 6.5%), together accounting for 56.3% of all Mexico residents.
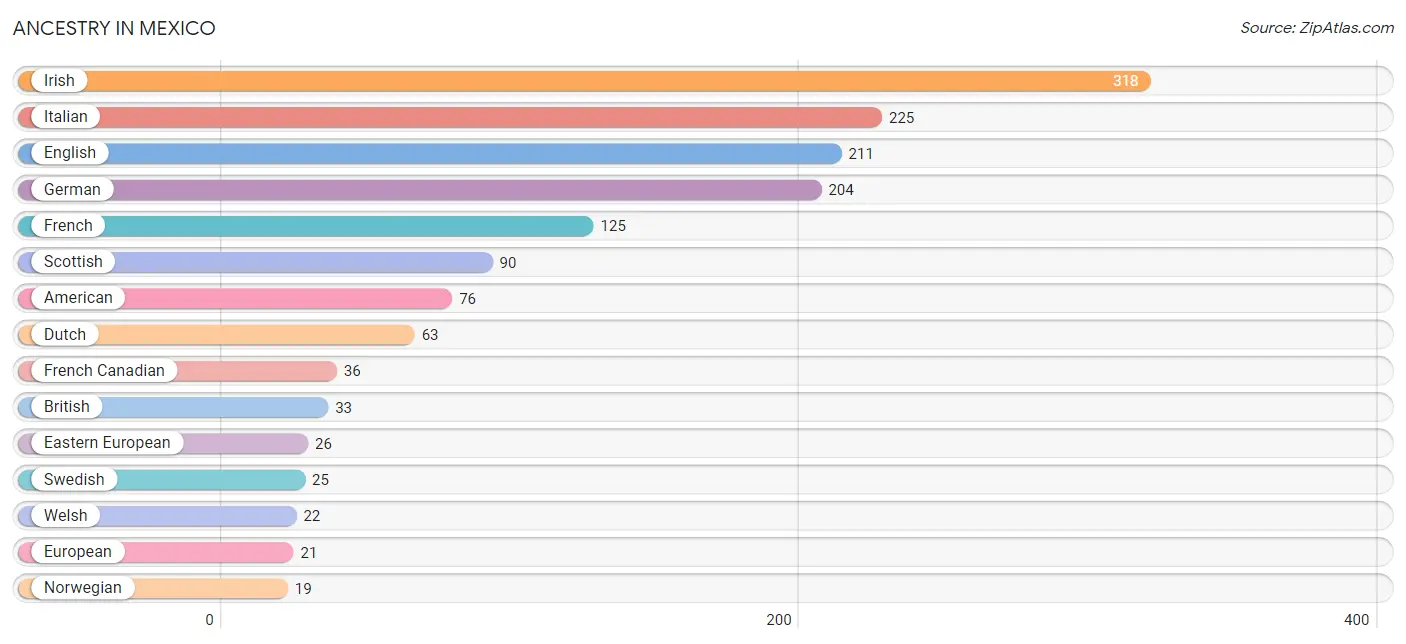
| Ancestry | # Population | % Population |
| American | 76 | 4.0% |
| Austrian | 4 | 0.2% |
| Brazilian | 15 | 0.8% |
| British | 33 | 1.7% |
| Canadian | 10 | 0.5% |
| Cherokee | 2 | 0.1% |
| Dutch | 63 | 3.3% |
| Eastern European | 26 | 1.3% |
| English | 211 | 11.0% |
| European | 21 | 1.1% |
| Finnish | 11 | 0.6% |
| French | 125 | 6.5% |
| French Canadian | 36 | 1.9% |
| German | 204 | 10.6% |
| Greek | 8 | 0.4% |
| Indian (Asian) | 6 | 0.3% |
| Irish | 318 | 16.5% |
| Italian | 225 | 11.7% |
| Korean | 4 | 0.2% |
| Latvian | 2 | 0.1% |
| Lithuanian | 5 | 0.3% |
| Northern European | 18 | 0.9% |
| Norwegian | 19 | 1.0% |
| Polish | 11 | 0.6% |
| Portuguese | 6 | 0.3% |
| Puerto Rican | 2 | 0.1% |
| Scotch-Irish | 14 | 0.7% |
| Scottish | 90 | 4.7% |
| Swedish | 25 | 1.3% |
| Welsh | 22 | 1.1% | View All 30 Rows |
Immigrants in Mexico
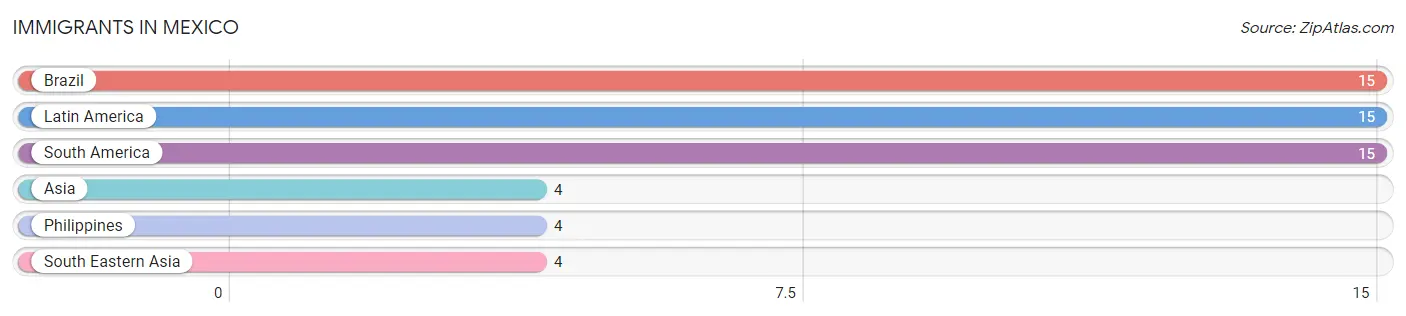
The most numerous immigrant groups reported in Mexico came from Brazil (15 | 0.8%), Latin America (15 | 0.8%), South America (15 | 0.8%), Asia (4 | 0.2%), and Philippines (4 | 0.2%), together accounting for 2.8% of all Mexico residents.
| Immigration Origin | # Population | % Population |
| Asia | 4 | 0.2% |
| Brazil | 15 | 0.8% |
| Latin America | 15 | 0.8% |
| Philippines | 4 | 0.2% |
| South America | 15 | 0.8% |
| South Eastern Asia | 4 | 0.2% | View All 6 Rows |
Sex and Age in Mexico
Sex and Age in Mexico
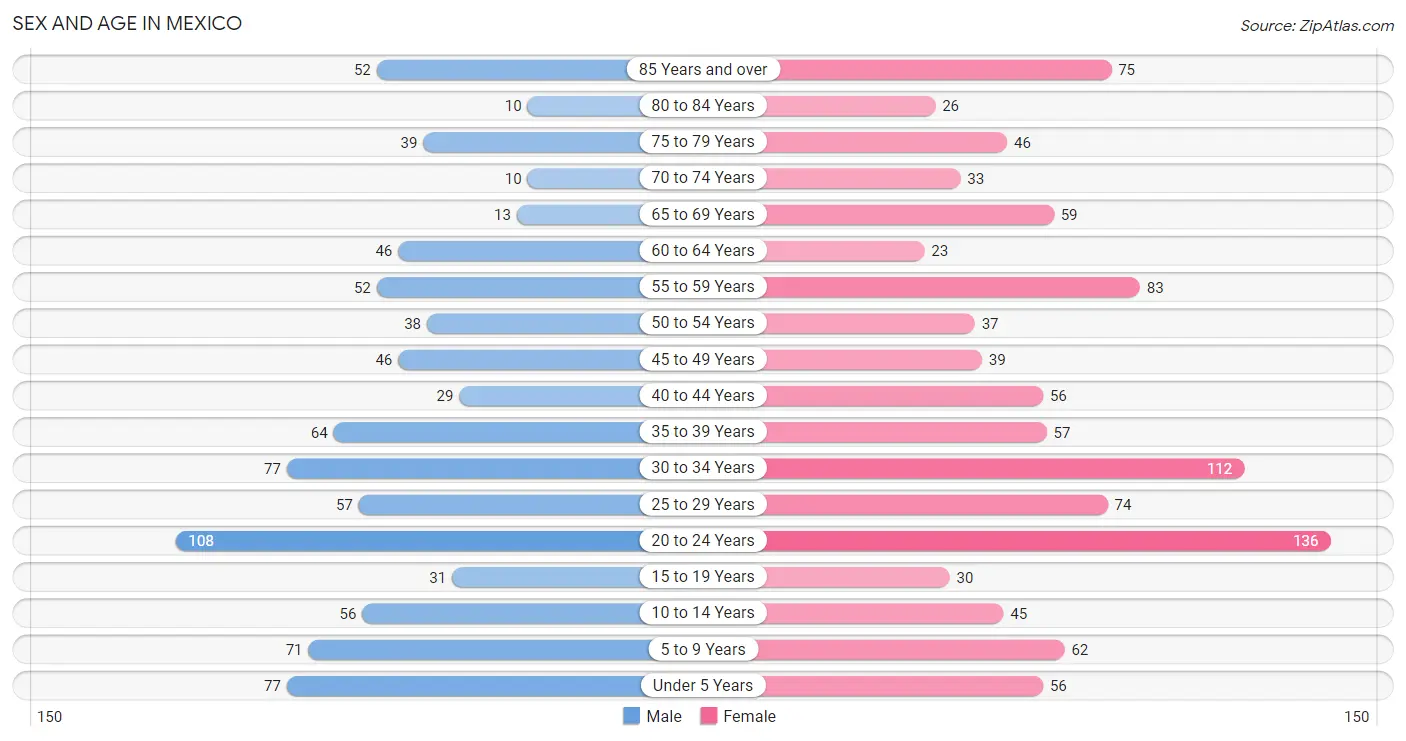
The most populous age groups in Mexico are 20 to 24 Years (108 | 12.3%) for men and 20 to 24 Years (136 | 13.0%) for women.
| Age Bracket | Male | Female |
| Under 5 Years | 77 (8.8%) | 56 (5.3%) |
| 5 to 9 Years | 71 (8.1%) | 62 (5.9%) |
| 10 to 14 Years | 56 (6.4%) | 45 (4.3%) |
| 15 to 19 Years | 31 (3.5%) | 30 (2.9%) |
| 20 to 24 Years | 108 (12.3%) | 136 (13.0%) |
| 25 to 29 Years | 57 (6.5%) | 74 (7.0%) |
| 30 to 34 Years | 77 (8.8%) | 112 (10.7%) |
| 35 to 39 Years | 64 (7.3%) | 57 (5.4%) |
| 40 to 44 Years | 29 (3.3%) | 56 (5.3%) |
| 45 to 49 Years | 46 (5.2%) | 39 (3.7%) |
| 50 to 54 Years | 38 (4.3%) | 37 (3.5%) |
| 55 to 59 Years | 52 (5.9%) | 83 (7.9%) |
| 60 to 64 Years | 46 (5.2%) | 23 (2.2%) |
| 65 to 69 Years | 13 (1.5%) | 59 (5.6%) |
| 70 to 74 Years | 10 (1.1%) | 33 (3.2%) |
| 75 to 79 Years | 39 (4.4%) | 46 (4.4%) |
| 80 to 84 Years | 10 (1.1%) | 26 (2.5%) |
| 85 Years and over | 52 (5.9%) | 75 (7.1%) |
| Total | 876 (100.0%) | 1,049 (100.0%) |
Families and Households in Mexico
Median Family Size in Mexico
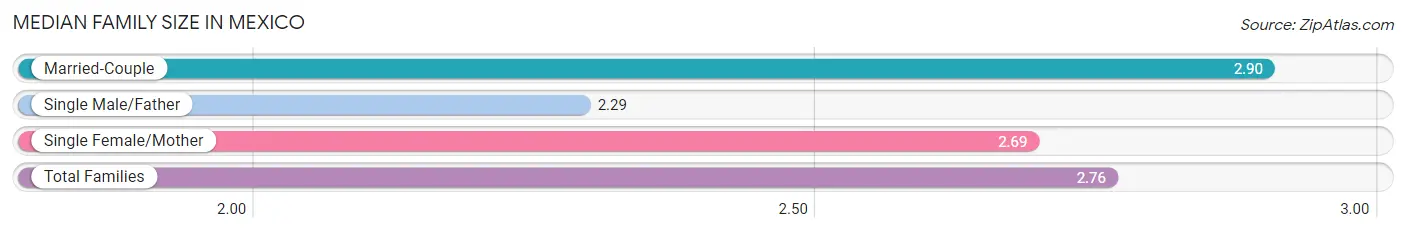
The median family size in Mexico is 2.76 persons per family, with married-couple families (311 | 66.6%) accounting for the largest median family size of 2.9 persons per family. On the other hand, single male/father families (78 | 16.7%) represent the smallest median family size with 2.29 persons per family.
| Family Type | # Families | Family Size |
| Married-Couple | 311 (66.6%) | 2.90 |
| Single Male/Father | 78 (16.7%) | 2.29 |
| Single Female/Mother | 78 (16.7%) | 2.69 |
| Total Families | 467 (100.0%) | 2.76 |
Median Household Size in Mexico
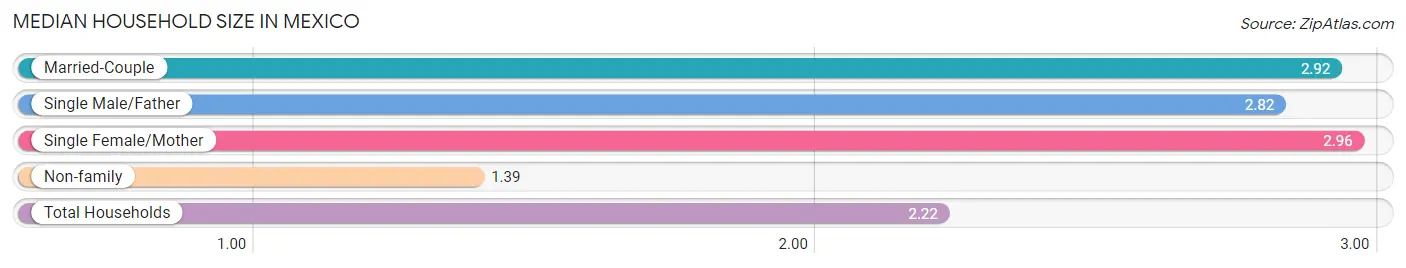
The median household size in Mexico is 2.22 persons per household, with single female/mother households (78 | 9.1%) accounting for the largest median household size of 2.96 persons per household. non-family households (393 | 45.7%) represent the smallest median household size with 1.39 persons per household.
| Household Type | # Households | Household Size |
| Married-Couple | 311 (36.2%) | 2.92 |
| Single Male/Father | 78 (9.1%) | 2.82 |
| Single Female/Mother | 78 (9.1%) | 2.96 |
| Non-family | 393 (45.7%) | 1.39 |
| Total Households | 860 (100.0%) | 2.22 |
Household Size by Marriage Status in Mexico
Out of a total of 860 households in Mexico, 467 (54.3%) are family households, while 393 (45.7%) are nonfamily households. The most numerous type of family households are 2-person households, comprising 189, and the most common type of nonfamily households are 1-person households, comprising 257.
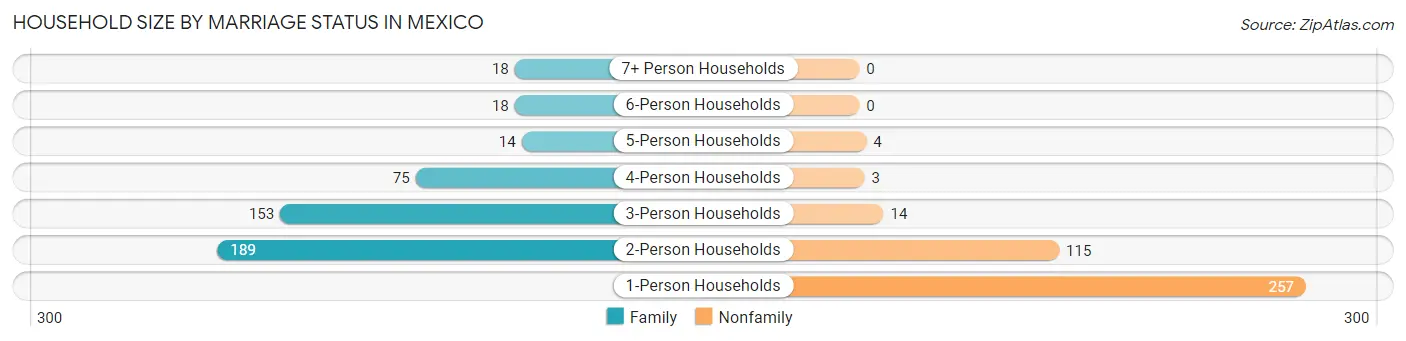
| Household Size | Family Households | Nonfamily Households |
| 1-Person Households | - | 257 (29.9%) |
| 2-Person Households | 189 (22.0%) | 115 (13.4%) |
| 3-Person Households | 153 (17.8%) | 14 (1.6%) |
| 4-Person Households | 75 (8.7%) | 3 (0.4%) |
| 5-Person Households | 14 (1.6%) | 4 (0.5%) |
| 6-Person Households | 18 (2.1%) | 0 (0.0%) |
| 7+ Person Households | 18 (2.1%) | 0 (0.0%) |
| Total | 467 (54.3%) | 393 (45.7%) |
Female Fertility in Mexico
Fertility by Age in Mexico
Average fertility rate in Mexico is 54.0 births per 1,000 women. Women in the age bracket of 35 to 50 years have the highest fertility rate with 66.0 births per 1,000 women. Women in the age bracket of 20 to 34 years acount for 63.0% of all women with births.
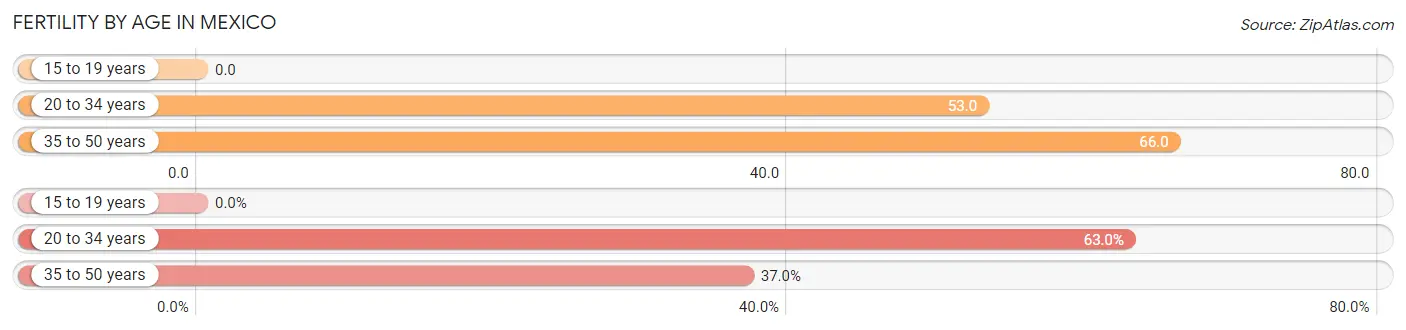
| Age Bracket | Women with Births | Births / 1,000 Women |
| 15 to 19 years | 0 (0.0%) | 0.0 |
| 20 to 34 years | 17 (63.0%) | 53.0 |
| 35 to 50 years | 10 (37.0%) | 66.0 |
| Total | 27 (100.0%) | 54.0 |
Fertility by Age by Marriage Status in Mexico
81.5% of women with births (27) in Mexico are married. The highest percentage of unmarried women with births falls into 20 to 34 years age bracket with 29.4% of them unmarried at the time of birth, while the lowest percentage of unmarried women with births belong to 35 to 50 years age bracket with 0.0% of them unmarried.
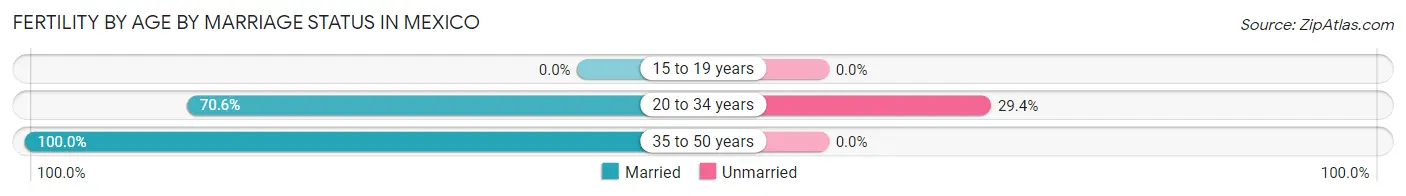
| Age Bracket | Married | Unmarried |
| 15 to 19 years | 0 (0.0%) | 0 (0.0%) |
| 20 to 34 years | 12 (70.6%) | 5 (29.4%) |
| 35 to 50 years | 10 (100.0%) | 0 (0.0%) |
| Total | 22 (81.5%) | 5 (18.5%) |
Fertility by Education in Mexico
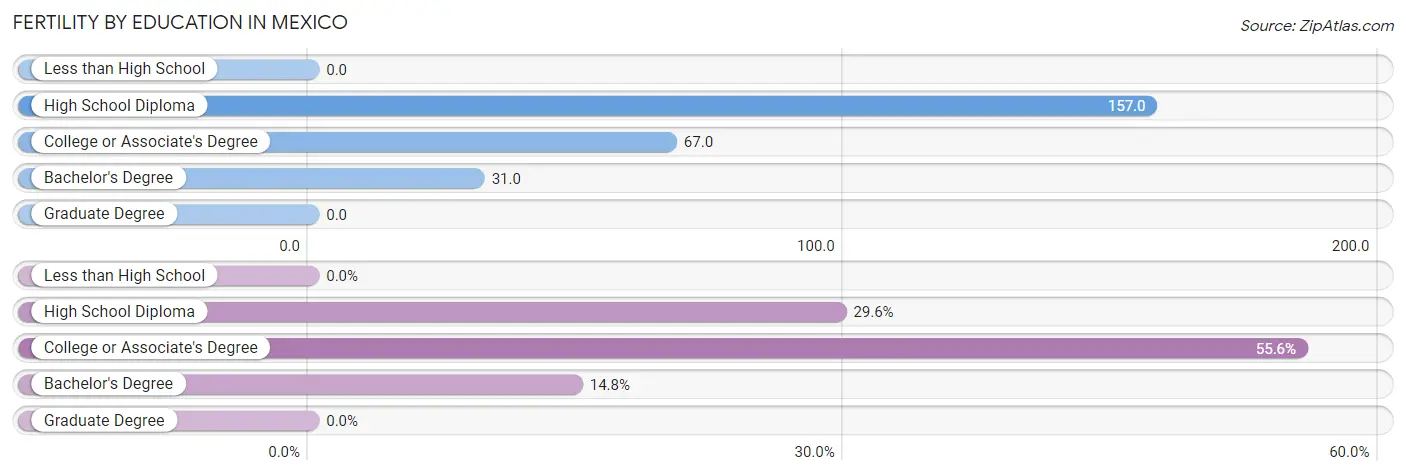
| Educational Attainment | Women with Births | Births / 1,000 Women |
| Less than High School | 0 (0.0%) | 0.0 |
| High School Diploma | 8 (29.6%) | 157.0 |
| College or Associate's Degree | 15 (55.6%) | 67.0 |
| Bachelor's Degree | 4 (14.8%) | 31.0 |
| Graduate Degree | 0 (0.0%) | 0.0 |
| Total | 27 (100.0%) | 54.0 |
Fertility by Education by Marriage Status in Mexico
18.5% of women with births in Mexico are unmarried. Women with the educational attainment of college or associate's degree are most likely to be married with 100.0% of them married at childbirth, while women with the educational attainment of high school diploma are least likely to be married with 62.5% of them unmarried at childbirth.
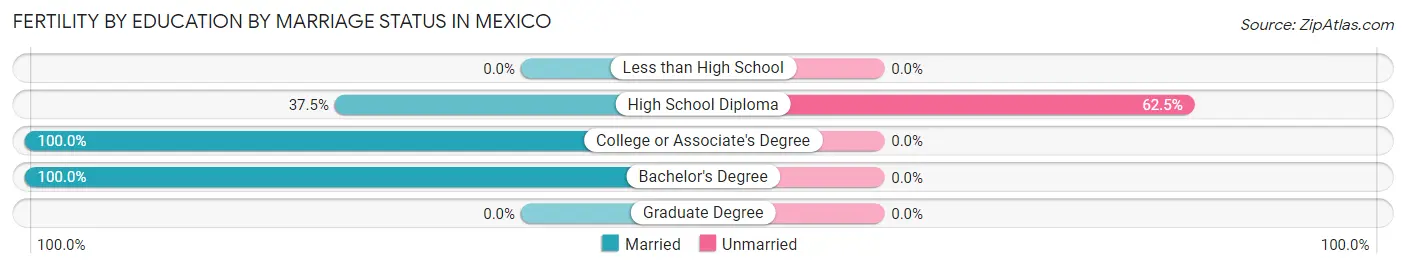
| Educational Attainment | Married | Unmarried |
| Less than High School | 0 (0.0%) | 0 (0.0%) |
| High School Diploma | 3 (37.5%) | 5 (62.5%) |
| College or Associate's Degree | 15 (100.0%) | 0 (0.0%) |
| Bachelor's Degree | 4 (100.0%) | 0 (0.0%) |
| Graduate Degree | 0 (0.0%) | 0 (0.0%) |
| Total | 22 (81.5%) | 5 (18.5%) |
Employment Characteristics in Mexico
Employment by Class of Employer in Mexico
Among the 861 employed individuals in Mexico, private company employees (435 | 50.5%), local government employees (213 | 24.7%), and not-for-profit organizations (75 | 8.7%) make up the most common classes of employment.
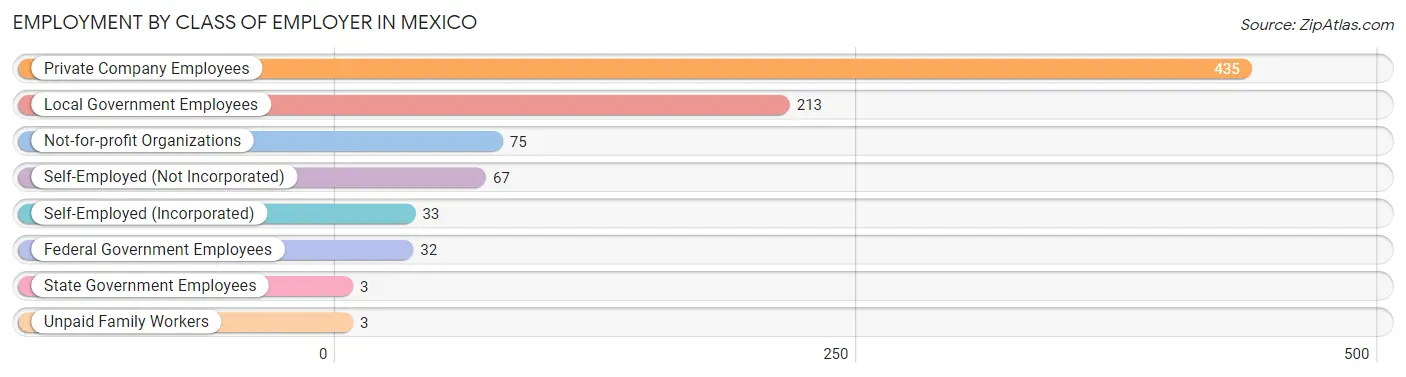
| Employer Class | # Employees | % Employees |
| Private Company Employees | 435 | 50.5% |
| Self-Employed (Incorporated) | 33 | 3.8% |
| Self-Employed (Not Incorporated) | 67 | 7.8% |
| Not-for-profit Organizations | 75 | 8.7% |
| Local Government Employees | 213 | 24.7% |
| State Government Employees | 3 | 0.4% |
| Federal Government Employees | 32 | 3.7% |
| Unpaid Family Workers | 3 | 0.4% |
| Total | 861 | 100.0% |
Employment Status by Age in Mexico
According to the labor force statistics for Mexico, out of the total population over 16 years of age (1,538), 63.7% or 980 individuals are in the labor force, with 2.1% or 21 of them unemployed. The age group with the highest labor force participation rate is 35 to 44 years, with 100.0% or 206 individuals in the labor force. Within the labor force, the 55 to 59 years age range has the highest percentage of unemployed individuals, with 10.6% or 9 of them being unemployed.
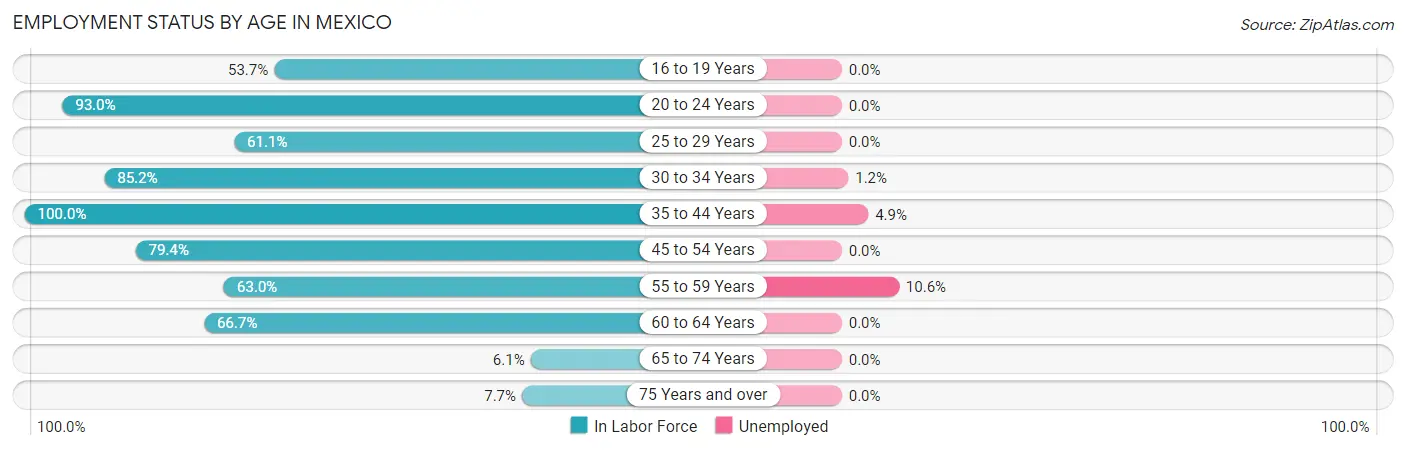
| Age Bracket | In Labor Force | Unemployed |
| 16 to 19 Years | 22 (53.7%) | 0 (0.0%) |
| 20 to 24 Years | 227 (93.0%) | 0 (0.0%) |
| 25 to 29 Years | 80 (61.1%) | 0 (0.0%) |
| 30 to 34 Years | 161 (85.2%) | 2 (1.2%) |
| 35 to 44 Years | 206 (100.0%) | 10 (4.9%) |
| 45 to 54 Years | 127 (79.4%) | 0 (0.0%) |
| 55 to 59 Years | 85 (63.0%) | 9 (10.6%) |
| 60 to 64 Years | 46 (66.7%) | 0 (0.0%) |
| 65 to 74 Years | 7 (6.1%) | 0 (0.0%) |
| 75 Years and over | 19 (7.7%) | 0 (0.0%) |
| Total | 980 (63.7%) | 21 (2.1%) |
Employment Status by Educational Attainment in Mexico
According to labor force statistics for Mexico, 79.2% of individuals (705) out of the total population between 25 and 64 years of age (890) are in the labor force, with 3.0% or 21 of them being unemployed. The group with the highest labor force participation rate are those with the educational attainment of bachelor's degree or higher, with 91.4% or 180 individuals in the labor force. Within the labor force, individuals with less than high school education have the highest percentage of unemployment, with 40.0% or 8 of them being unemployed.
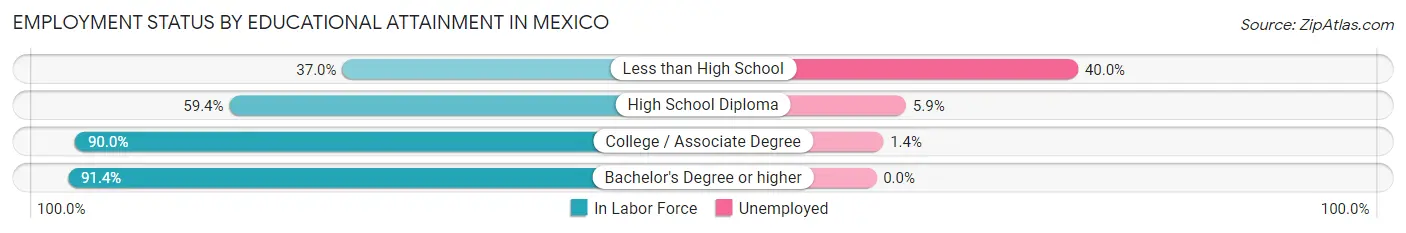
| Educational Attainment | In Labor Force | Unemployed |
| Less than High School | 20 (37.0%) | 22 (40.0%) |
| High School Diploma | 136 (59.4%) | 14 (5.9%) |
| College / Associate Degree | 369 (90.0%) | 6 (1.4%) |
| Bachelor's Degree or higher | 180 (91.4%) | 0 (0.0%) |
| Total | 705 (79.2%) | 27 (3.0%) |
Employment Occupations by Sex in Mexico
Management, Business, Science and Arts Occupations
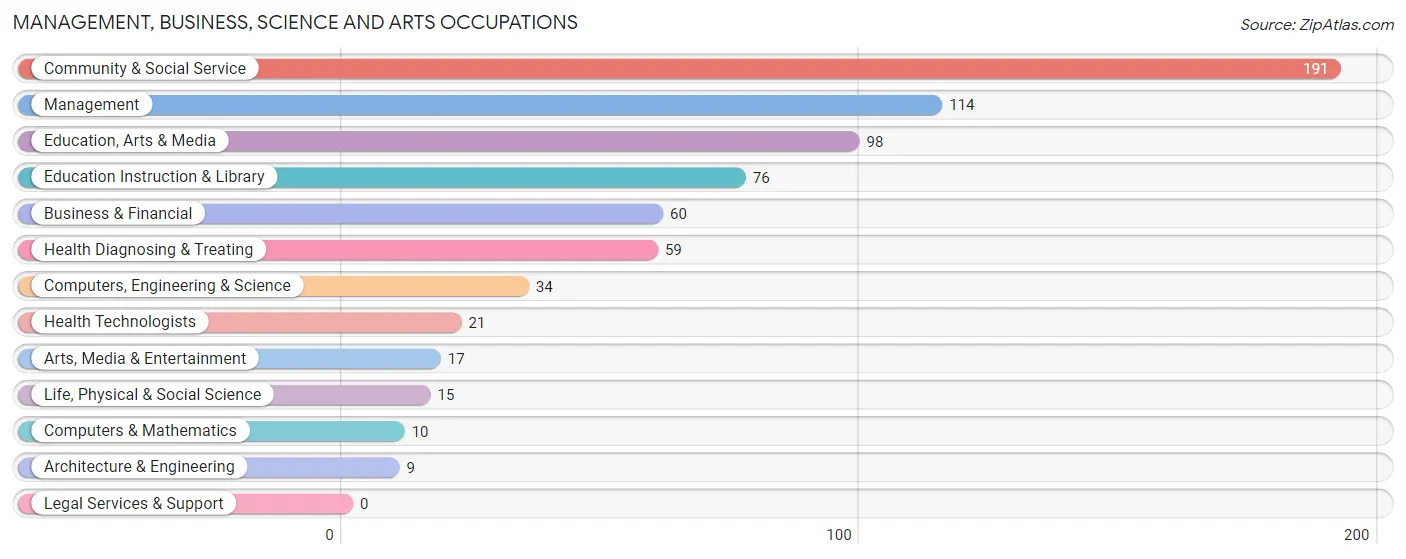
The most common Management, Business, Science and Arts occupations in Mexico are Community & Social Service (191 | 19.9%), Management (114 | 11.9%), Education, Arts & Media (98 | 10.2%), Education Instruction & Library (76 | 7.9%), and Business & Financial (60 | 6.3%).
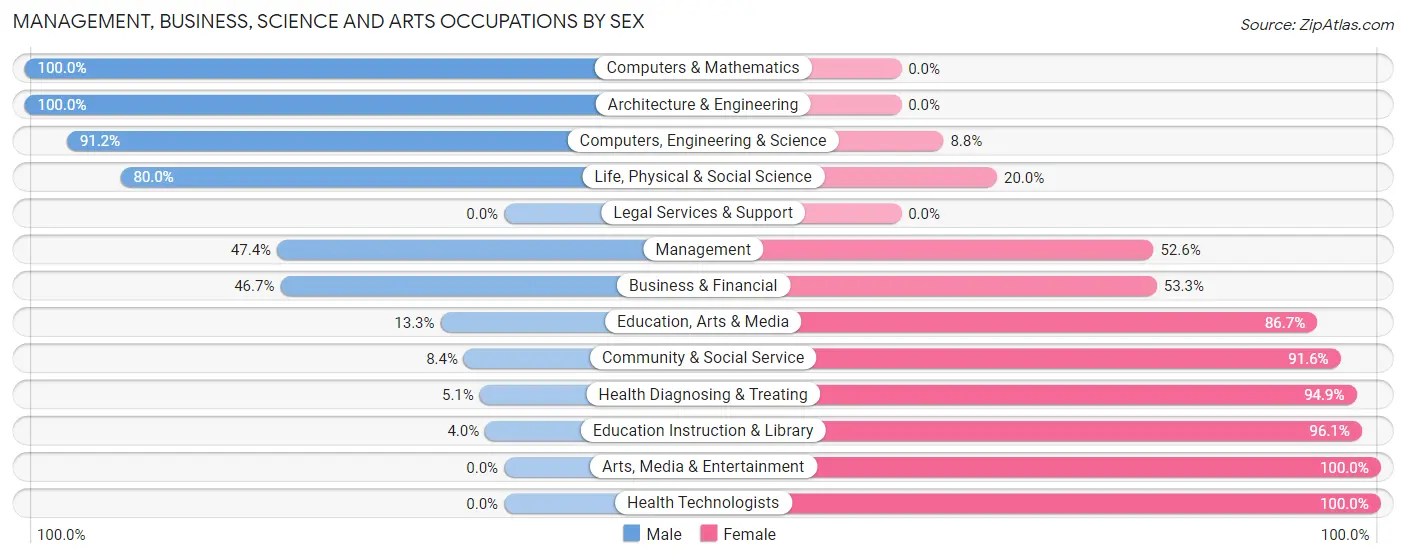
Management, Business, Science and Arts Occupations by Sex
Within the Management, Business, Science and Arts occupations in Mexico, the most male-oriented occupations are Computers & Mathematics (100.0%), Architecture & Engineering (100.0%), and Computers, Engineering & Science (91.2%), while the most female-oriented occupations are Arts, Media & Entertainment (100.0%), Health Technologists (100.0%), and Education Instruction & Library (96.1%).
| Occupation | Male | Female |
| Management | 54 (47.4%) | 60 (52.6%) |
| Business & Financial | 28 (46.7%) | 32 (53.3%) |
| Computers, Engineering & Science | 31 (91.2%) | 3 (8.8%) |
| Computers & Mathematics | 10 (100.0%) | 0 (0.0%) |
| Architecture & Engineering | 9 (100.0%) | 0 (0.0%) |
| Life, Physical & Social Science | 12 (80.0%) | 3 (20.0%) |
| Community & Social Service | 16 (8.4%) | 175 (91.6%) |
| Education, Arts & Media | 13 (13.3%) | 85 (86.7%) |
| Legal Services & Support | 0 (0.0%) | 0 (0.0%) |
| Education Instruction & Library | 3 (4.0%) | 73 (96.1%) |
| Arts, Media & Entertainment | 0 (0.0%) | 17 (100.0%) |
| Health Diagnosing & Treating | 3 (5.1%) | 56 (94.9%) |
| Health Technologists | 0 (0.0%) | 21 (100.0%) |
| Total (Category) | 132 (28.8%) | 326 (71.2%) |
| Total (Overall) | 443 (46.2%) | 516 (53.8%) |
Services Occupations
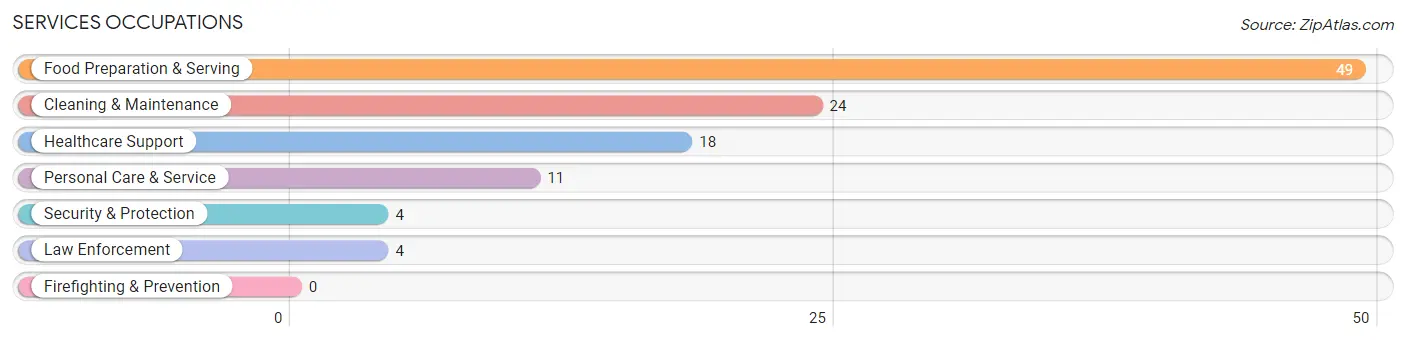
The most common Services occupations in Mexico are Food Preparation & Serving (49 | 5.1%), Cleaning & Maintenance (24 | 2.5%), Healthcare Support (18 | 1.9%), Personal Care & Service (11 | 1.1%), and Security & Protection (4 | 0.4%).
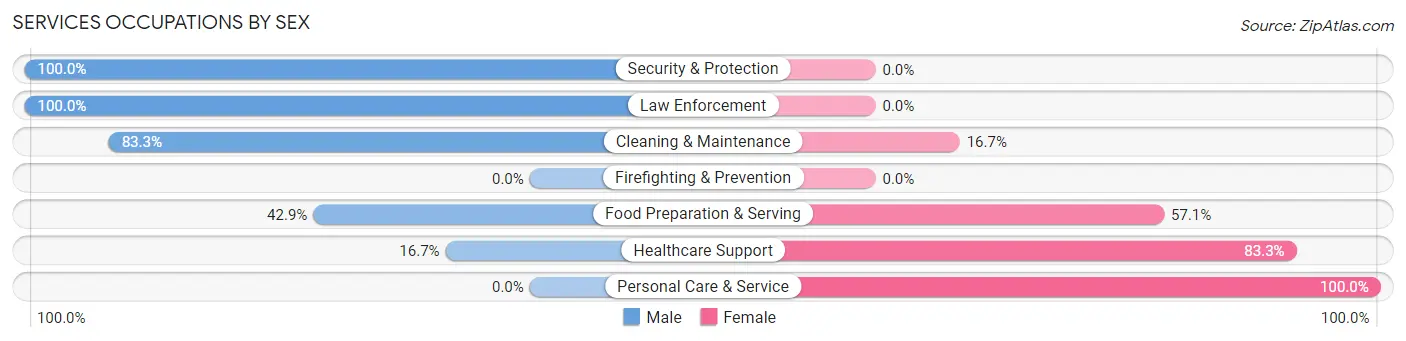
Services Occupations by Sex
Within the Services occupations in Mexico, the most male-oriented occupations are Security & Protection (100.0%), Law Enforcement (100.0%), and Cleaning & Maintenance (83.3%), while the most female-oriented occupations are Personal Care & Service (100.0%), Healthcare Support (83.3%), and Food Preparation & Serving (57.1%).
| Occupation | Male | Female |
| Healthcare Support | 3 (16.7%) | 15 (83.3%) |
| Security & Protection | 4 (100.0%) | 0 (0.0%) |
| Firefighting & Prevention | 0 (0.0%) | 0 (0.0%) |
| Law Enforcement | 4 (100.0%) | 0 (0.0%) |
| Food Preparation & Serving | 21 (42.9%) | 28 (57.1%) |
| Cleaning & Maintenance | 20 (83.3%) | 4 (16.7%) |
| Personal Care & Service | 0 (0.0%) | 11 (100.0%) |
| Total (Category) | 48 (45.3%) | 58 (54.7%) |
| Total (Overall) | 443 (46.2%) | 516 (53.8%) |
Sales and Office Occupations
The most common Sales and Office occupations in Mexico are Office & Administration (86 | 9.0%), and Sales & Related (65 | 6.8%).

Sales and Office Occupations by Sex
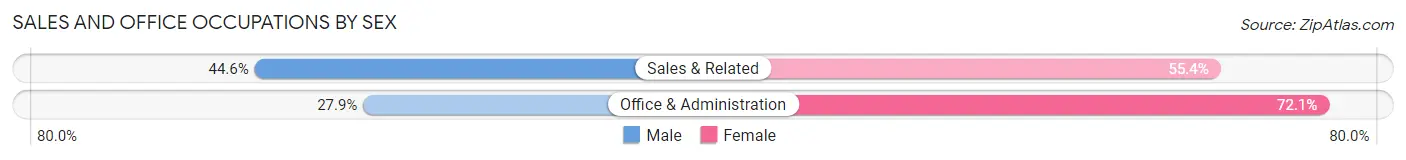
| Occupation | Male | Female |
| Sales & Related | 29 (44.6%) | 36 (55.4%) |
| Office & Administration | 24 (27.9%) | 62 (72.1%) |
| Total (Category) | 53 (35.1%) | 98 (64.9%) |
| Total (Overall) | 443 (46.2%) | 516 (53.8%) |
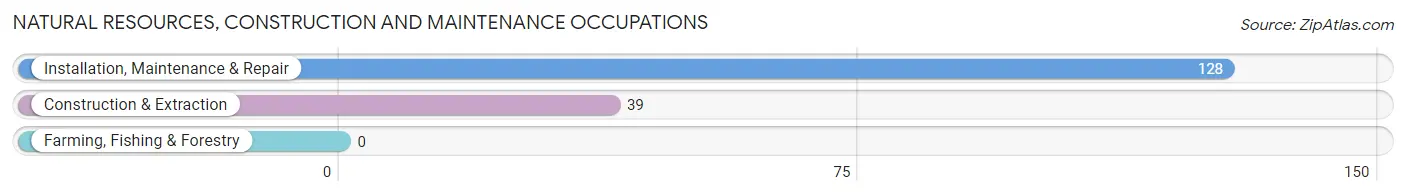
Natural Resources, Construction and Maintenance Occupations
The most common Natural Resources, Construction and Maintenance occupations in Mexico are Installation, Maintenance & Repair (128 | 13.4%), and Construction & Extraction (39 | 4.1%).
Natural Resources, Construction and Maintenance Occupations by Sex
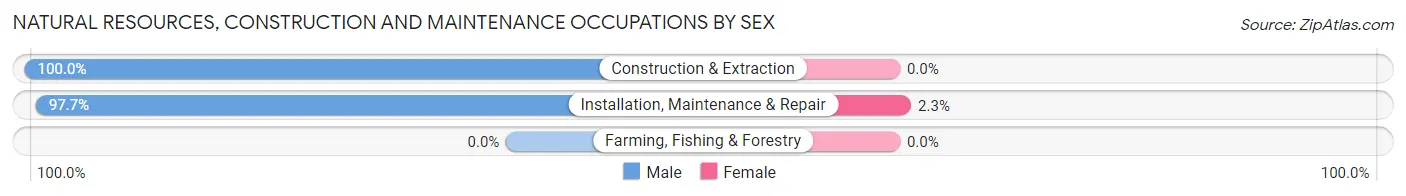
| Occupation | Male | Female |
| Farming, Fishing & Forestry | 0 (0.0%) | 0 (0.0%) |
| Construction & Extraction | 39 (100.0%) | 0 (0.0%) |
| Installation, Maintenance & Repair | 125 (97.7%) | 3 (2.3%) |
| Total (Category) | 164 (98.2%) | 3 (1.8%) |
| Total (Overall) | 443 (46.2%) | 516 (53.8%) |
Production, Transportation and Moving Occupations
The most common Production, Transportation and Moving occupations in Mexico are Transportation (34 | 3.5%), Material Moving (33 | 3.4%), and Production (10 | 1.0%).
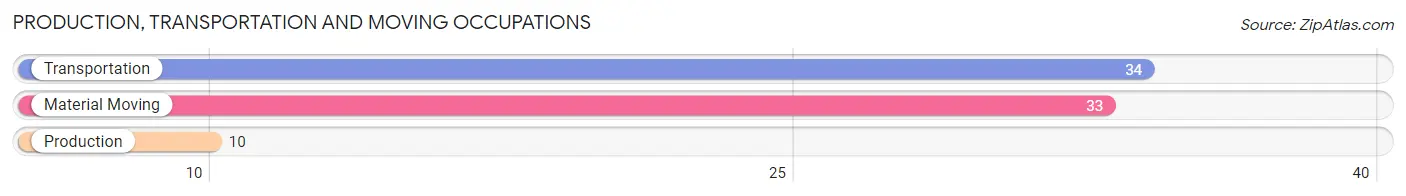
Production, Transportation and Moving Occupations by Sex
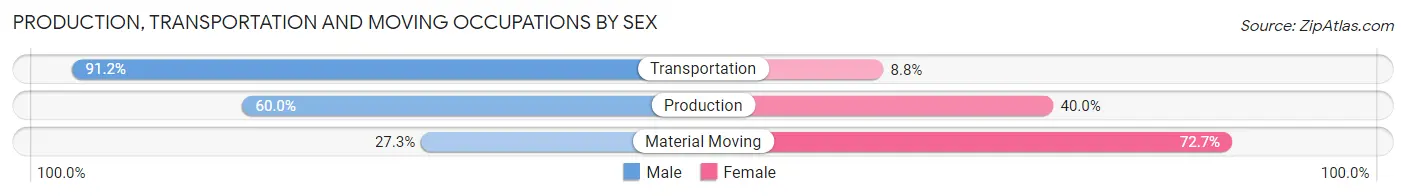
| Occupation | Male | Female |
| Production | 6 (60.0%) | 4 (40.0%) |
| Transportation | 31 (91.2%) | 3 (8.8%) |
| Material Moving | 9 (27.3%) | 24 (72.7%) |
| Total (Category) | 46 (59.7%) | 31 (40.3%) |
| Total (Overall) | 443 (46.2%) | 516 (53.8%) |
Employment Industries by Sex in Mexico
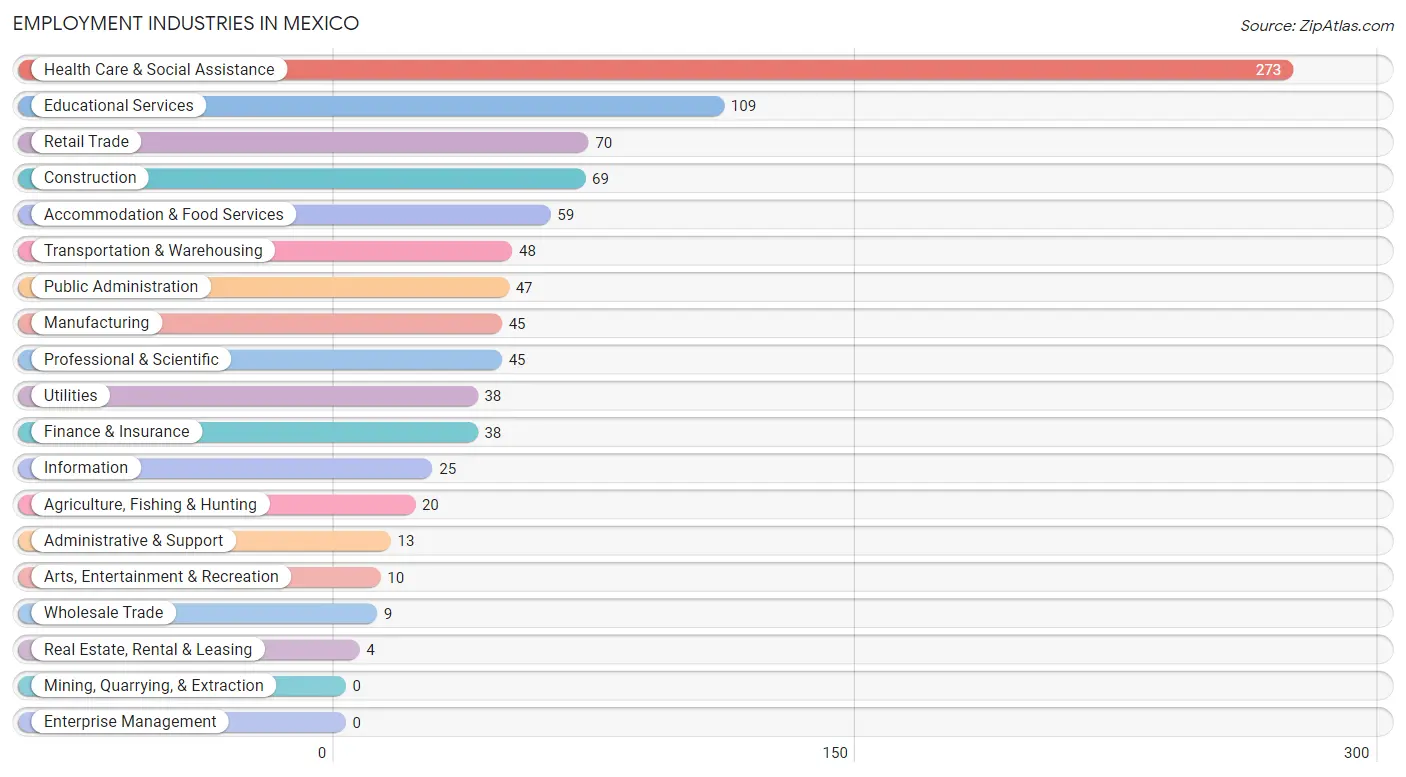
Employment Industries in Mexico
The major employment industries in Mexico include Health Care & Social Assistance (273 | 28.5%), Educational Services (109 | 11.4%), Retail Trade (70 | 7.3%), Construction (69 | 7.2%), and Accommodation & Food Services (59 | 6.1%).
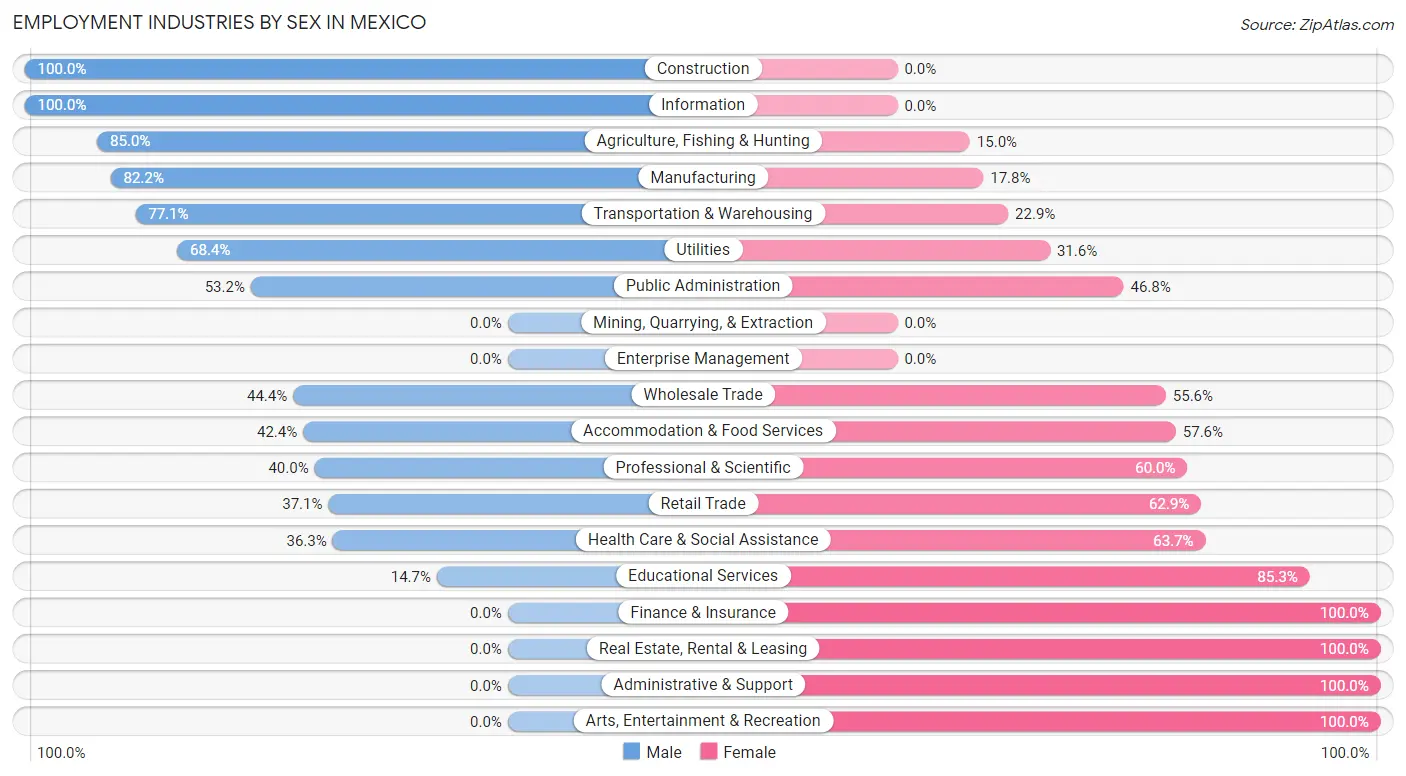
Employment Industries by Sex in Mexico
The Mexico industries that see more men than women are Construction (100.0%), Information (100.0%), and Agriculture, Fishing & Hunting (85.0%), whereas the industries that tend to have a higher number of women are Finance & Insurance (100.0%), Real Estate, Rental & Leasing (100.0%), and Administrative & Support (100.0%).
| Industry | Male | Female |
| Agriculture, Fishing & Hunting | 17 (85.0%) | 3 (15.0%) |
| Mining, Quarrying, & Extraction | 0 (0.0%) | 0 (0.0%) |
| Construction | 69 (100.0%) | 0 (0.0%) |
| Manufacturing | 37 (82.2%) | 8 (17.8%) |
| Wholesale Trade | 4 (44.4%) | 5 (55.6%) |
| Retail Trade | 26 (37.1%) | 44 (62.9%) |
| Transportation & Warehousing | 37 (77.1%) | 11 (22.9%) |
| Utilities | 26 (68.4%) | 12 (31.6%) |
| Information | 25 (100.0%) | 0 (0.0%) |
| Finance & Insurance | 0 (0.0%) | 38 (100.0%) |
| Real Estate, Rental & Leasing | 0 (0.0%) | 4 (100.0%) |
| Professional & Scientific | 18 (40.0%) | 27 (60.0%) |
| Enterprise Management | 0 (0.0%) | 0 (0.0%) |
| Administrative & Support | 0 (0.0%) | 13 (100.0%) |
| Educational Services | 16 (14.7%) | 93 (85.3%) |
| Health Care & Social Assistance | 99 (36.3%) | 174 (63.7%) |
| Arts, Entertainment & Recreation | 0 (0.0%) | 10 (100.0%) |
| Accommodation & Food Services | 25 (42.4%) | 34 (57.6%) |
| Public Administration | 25 (53.2%) | 22 (46.8%) |
| Total | 443 (46.2%) | 516 (53.8%) |
Education in Mexico
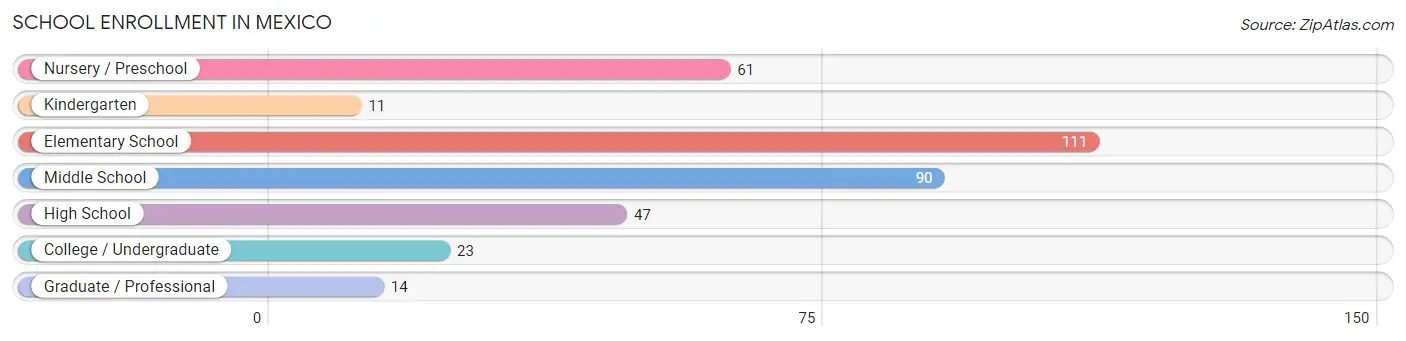
School Enrollment in Mexico
The most common levels of schooling among the 357 students in Mexico are elementary school (111 | 31.1%), middle school (90 | 25.2%), and nursery / preschool (61 | 17.1%).
| School Level | # Students | % Students |
| Nursery / Preschool | 61 | 17.1% |
| Kindergarten | 11 | 3.1% |
| Elementary School | 111 | 31.1% |
| Middle School | 90 | 25.2% |
| High School | 47 | 13.2% |
| College / Undergraduate | 23 | 6.4% |
| Graduate / Professional | 14 | 3.9% |
| Total | 357 | 100.0% |
School Enrollment by Age by Funding Source in Mexico
Out of a total of 357 students who are enrolled in schools in Mexico, 21 (5.9%) attend a private institution, while the remaining 336 (94.1%) are enrolled in public schools. The age group of 25 to 34 year olds has the highest likelihood of being enrolled in private schools, with 7 (63.6% in the age bracket) enrolled. Conversely, the age group of 5 to 9 year old has the lowest likelihood of being enrolled in a private school, with 130 (100.0% in the age bracket) attending a public institution.
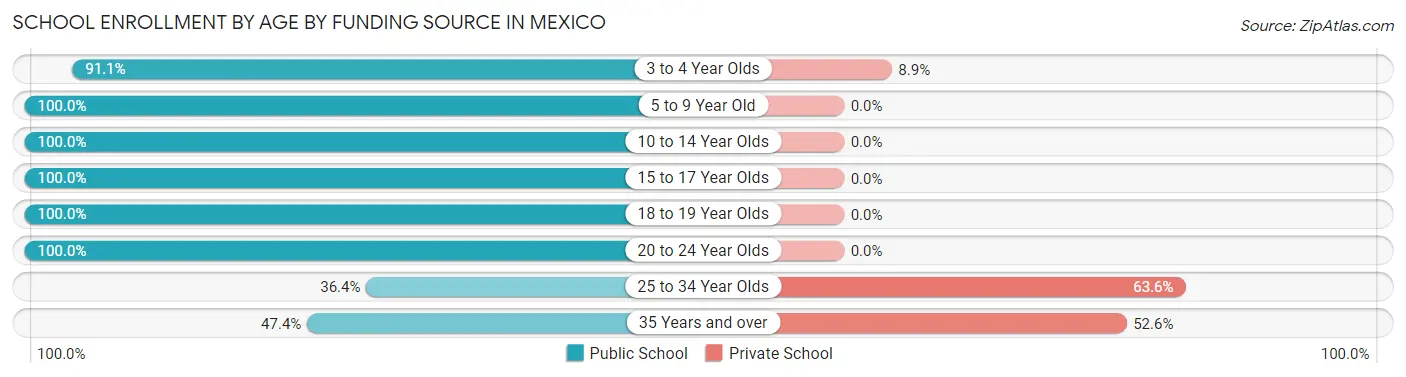
| Age Bracket | Public School | Private School |
| 3 to 4 Year Olds | 41 (91.1%) | 4 (8.9%) |
| 5 to 9 Year Old | 130 (100.0%) | 0 (0.0%) |
| 10 to 14 Year Olds | 101 (100.0%) | 0 (0.0%) |
| 15 to 17 Year Olds | 35 (100.0%) | 0 (0.0%) |
| 18 to 19 Year Olds | 9 (100.0%) | 0 (0.0%) |
| 20 to 24 Year Olds | 7 (100.0%) | 0 (0.0%) |
| 25 to 34 Year Olds | 4 (36.4%) | 7 (63.6%) |
| 35 Years and over | 9 (47.4%) | 10 (52.6%) |
| Total | 336 (94.1%) | 21 (5.9%) |
Educational Attainment by Field of Study in Mexico
Business (58 | 20.6%), education (55 | 19.6%), physical & health sciences (54 | 19.2%), science & technology (27 | 9.6%), and social sciences (19 | 6.8%) are the most common fields of study among 281 individuals in Mexico who have obtained a bachelor's degree or higher.
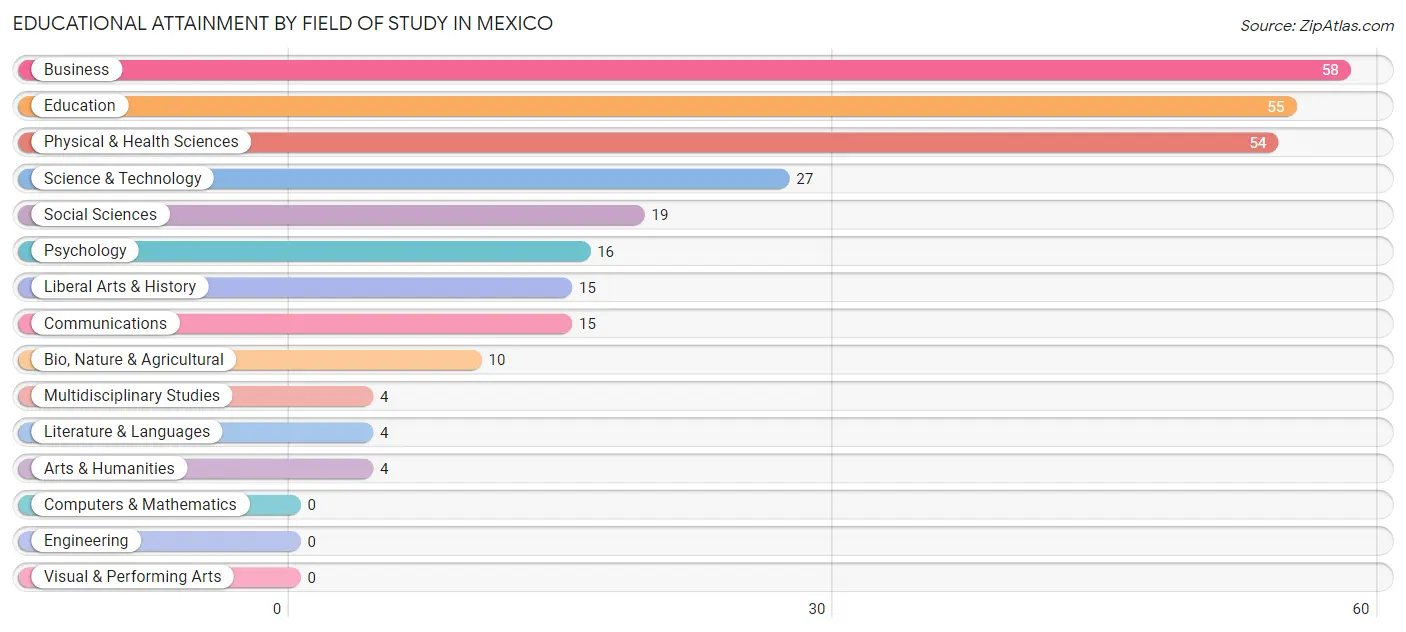
| Field of Study | # Graduates | % Graduates |
| Computers & Mathematics | 0 | 0.0% |
| Bio, Nature & Agricultural | 10 | 3.6% |
| Physical & Health Sciences | 54 | 19.2% |
| Psychology | 16 | 5.7% |
| Social Sciences | 19 | 6.8% |
| Engineering | 0 | 0.0% |
| Multidisciplinary Studies | 4 | 1.4% |
| Science & Technology | 27 | 9.6% |
| Business | 58 | 20.6% |
| Education | 55 | 19.6% |
| Literature & Languages | 4 | 1.4% |
| Liberal Arts & History | 15 | 5.3% |
| Visual & Performing Arts | 0 | 0.0% |
| Communications | 15 | 5.3% |
| Arts & Humanities | 4 | 1.4% |
| Total | 281 | 100.0% |
Transportation & Commute in Mexico
Vehicle Availability by Sex in Mexico
The most prevalent vehicle ownership categories in Mexico are males with 2 vehicles (200, accounting for 54.6%) and females with 2 vehicles (231, making up 40.4%).
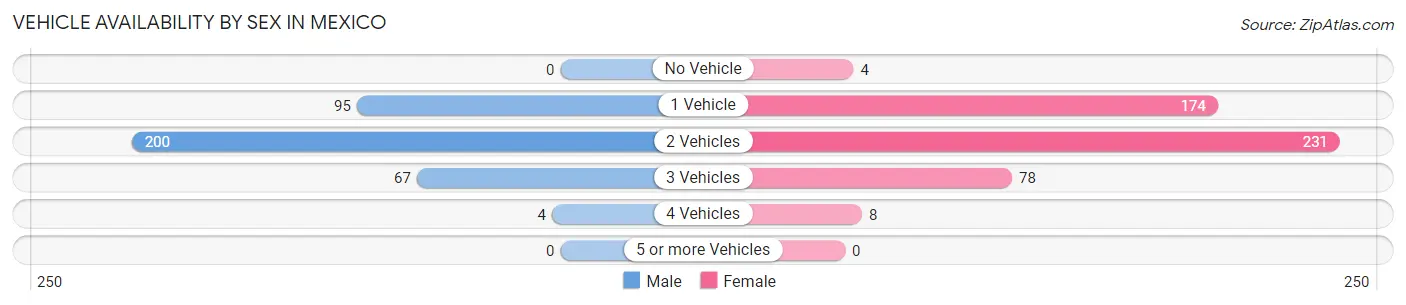
| Vehicles Available | Male | Female |
| No Vehicle | 0 (0.0%) | 4 (0.8%) |
| 1 Vehicle | 95 (26.0%) | 174 (35.1%) |
| 2 Vehicles | 200 (54.6%) | 231 (46.7%) |
| 3 Vehicles | 67 (18.3%) | 78 (15.8%) |
| 4 Vehicles | 4 (1.1%) | 8 (1.6%) |
| 5 or more Vehicles | 0 (0.0%) | 0 (0.0%) |
| Total | 366 (100.0%) | 495 (100.0%) |
Commute Time in Mexico
The most frequently occuring commute durations in Mexico are less than 5 minutes (137 commuters, 16.6%), 5 to 9 minutes (112 commuters, 13.5%), and 20 to 24 minutes (108 commuters, 13.1%).
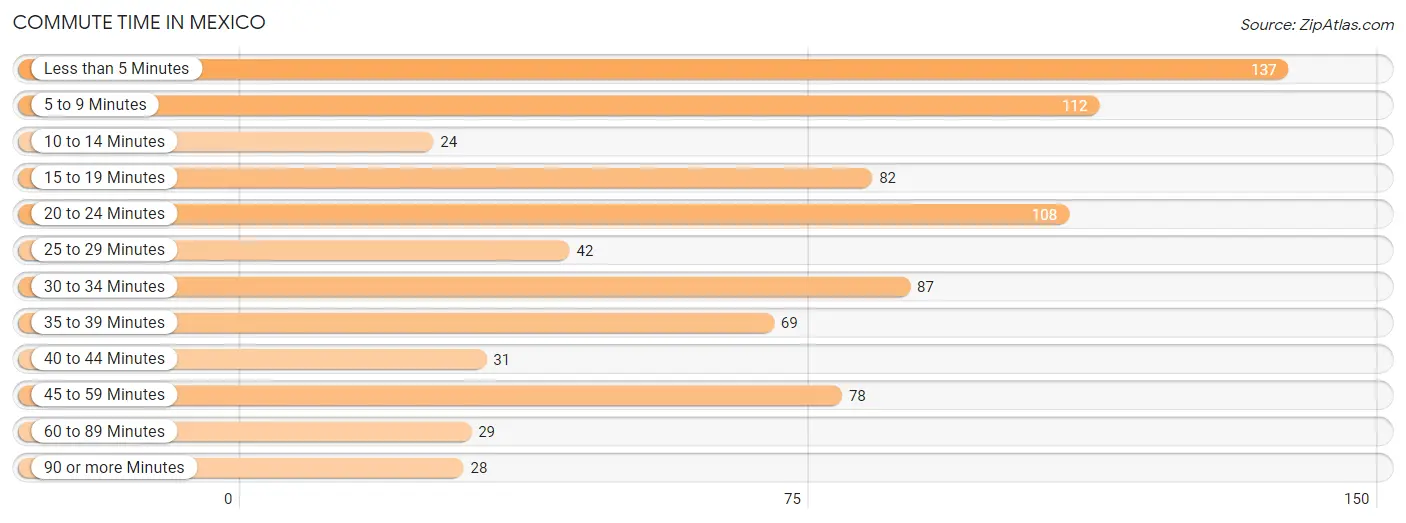
| Commute Time | # Commuters | % Commuters |
| Less than 5 Minutes | 137 | 16.6% |
| 5 to 9 Minutes | 112 | 13.5% |
| 10 to 14 Minutes | 24 | 2.9% |
| 15 to 19 Minutes | 82 | 9.9% |
| 20 to 24 Minutes | 108 | 13.1% |
| 25 to 29 Minutes | 42 | 5.1% |
| 30 to 34 Minutes | 87 | 10.5% |
| 35 to 39 Minutes | 69 | 8.3% |
| 40 to 44 Minutes | 31 | 3.7% |
| 45 to 59 Minutes | 78 | 9.4% |
| 60 to 89 Minutes | 29 | 3.5% |
| 90 or more Minutes | 28 | 3.4% |
Commute Time by Sex in Mexico
The most common commute times in Mexico are 20 to 24 minutes (69 commuters, 19.9%) for males and less than 5 minutes (130 commuters, 27.1%) for females.
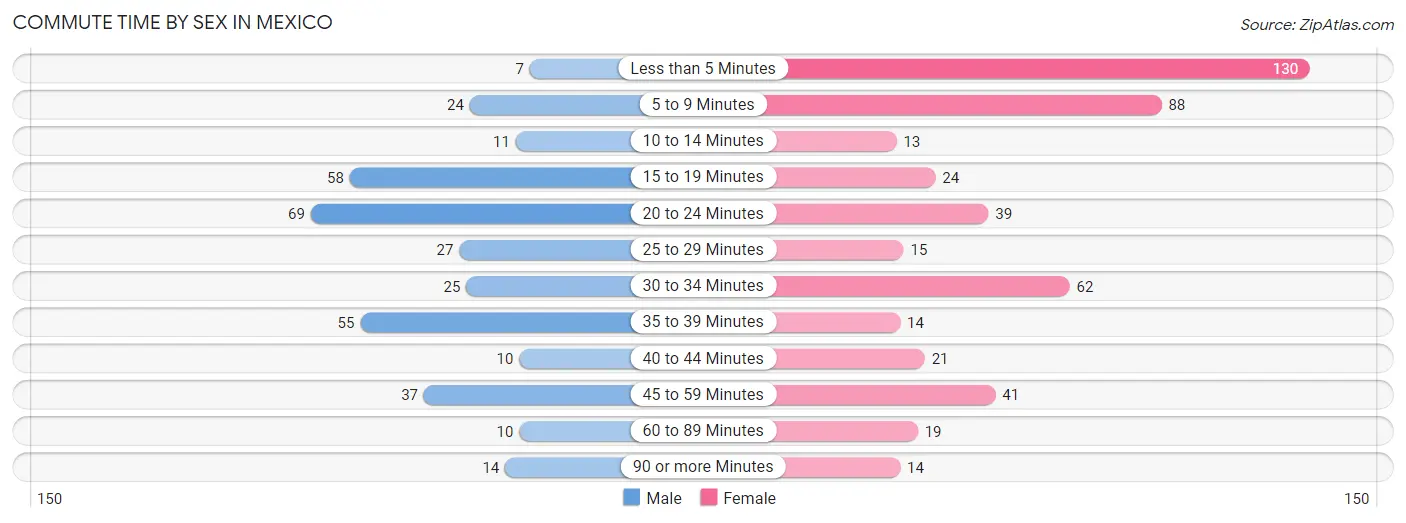
| Commute Time | Male | Female |
| Less than 5 Minutes | 7 (2.0%) | 130 (27.1%) |
| 5 to 9 Minutes | 24 (6.9%) | 88 (18.3%) |
| 10 to 14 Minutes | 11 (3.2%) | 13 (2.7%) |
| 15 to 19 Minutes | 58 (16.7%) | 24 (5.0%) |
| 20 to 24 Minutes | 69 (19.9%) | 39 (8.1%) |
| 25 to 29 Minutes | 27 (7.8%) | 15 (3.1%) |
| 30 to 34 Minutes | 25 (7.2%) | 62 (12.9%) |
| 35 to 39 Minutes | 55 (15.9%) | 14 (2.9%) |
| 40 to 44 Minutes | 10 (2.9%) | 21 (4.4%) |
| 45 to 59 Minutes | 37 (10.7%) | 41 (8.5%) |
| 60 to 89 Minutes | 10 (2.9%) | 19 (4.0%) |
| 90 or more Minutes | 14 (4.0%) | 14 (2.9%) |
Time of Departure to Work by Sex in Mexico
The most frequent times of departure to work in Mexico are 5:00 AM to 5:29 AM (54, 15.6%) for males and 8:30 AM to 8:59 AM (103, 21.5%) for females.
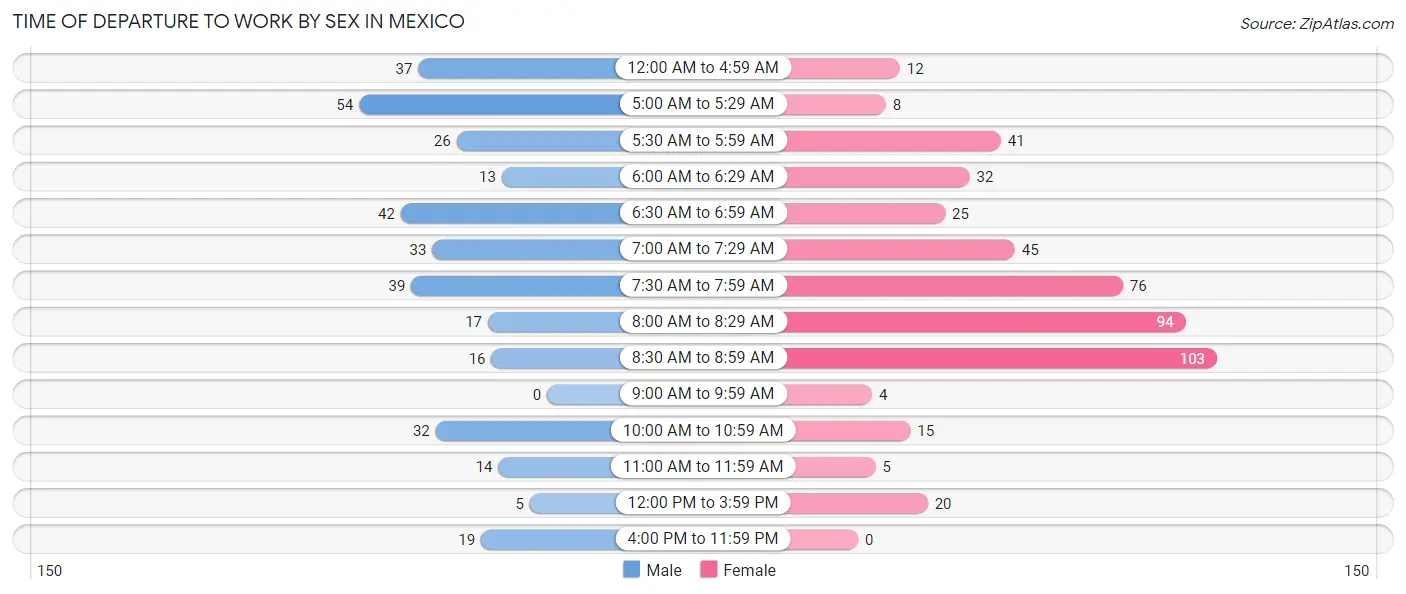
| Time of Departure | Male | Female |
| 12:00 AM to 4:59 AM | 37 (10.7%) | 12 (2.5%) |
| 5:00 AM to 5:29 AM | 54 (15.6%) | 8 (1.7%) |
| 5:30 AM to 5:59 AM | 26 (7.5%) | 41 (8.5%) |
| 6:00 AM to 6:29 AM | 13 (3.7%) | 32 (6.7%) |
| 6:30 AM to 6:59 AM | 42 (12.1%) | 25 (5.2%) |
| 7:00 AM to 7:29 AM | 33 (9.5%) | 45 (9.4%) |
| 7:30 AM to 7:59 AM | 39 (11.2%) | 76 (15.8%) |
| 8:00 AM to 8:29 AM | 17 (4.9%) | 94 (19.6%) |
| 8:30 AM to 8:59 AM | 16 (4.6%) | 103 (21.5%) |
| 9:00 AM to 9:59 AM | 0 (0.0%) | 4 (0.8%) |
| 10:00 AM to 10:59 AM | 32 (9.2%) | 15 (3.1%) |
| 11:00 AM to 11:59 AM | 14 (4.0%) | 5 (1.0%) |
| 12:00 PM to 3:59 PM | 5 (1.4%) | 20 (4.2%) |
| 4:00 PM to 11:59 PM | 19 (5.5%) | 0 (0.0%) |
| Total | 347 (100.0%) | 480 (100.0%) |
Housing Occupancy in Mexico
Occupancy by Ownership in Mexico
Of the total 860 dwellings in Mexico, owner-occupied units account for 427 (49.6%), while renter-occupied units make up 433 (50.3%).
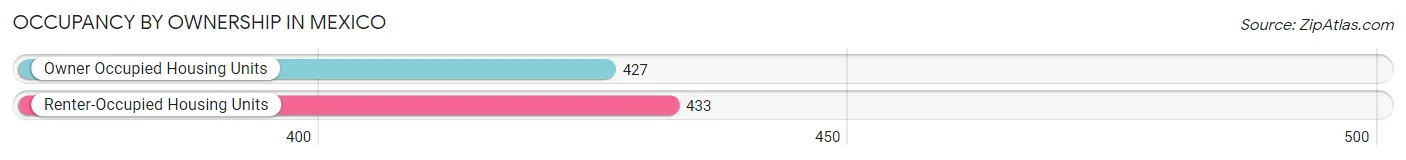
| Occupancy | # Housing Units | % Housing Units |
| Owner Occupied Housing Units | 427 | 49.6% |
| Renter-Occupied Housing Units | 433 | 50.3% |
| Total Occupied Housing Units | 860 | 100.0% |
Occupancy by Household Size in Mexico
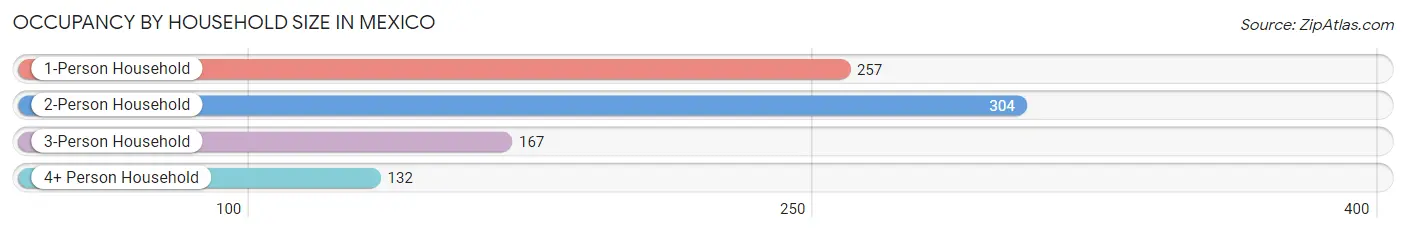
| Household Size | # Housing Units | % Housing Units |
| 1-Person Household | 257 | 29.9% |
| 2-Person Household | 304 | 35.3% |
| 3-Person Household | 167 | 19.4% |
| 4+ Person Household | 132 | 15.3% |
| Total Housing Units | 860 | 100.0% |
Occupancy by Ownership by Household Size in Mexico
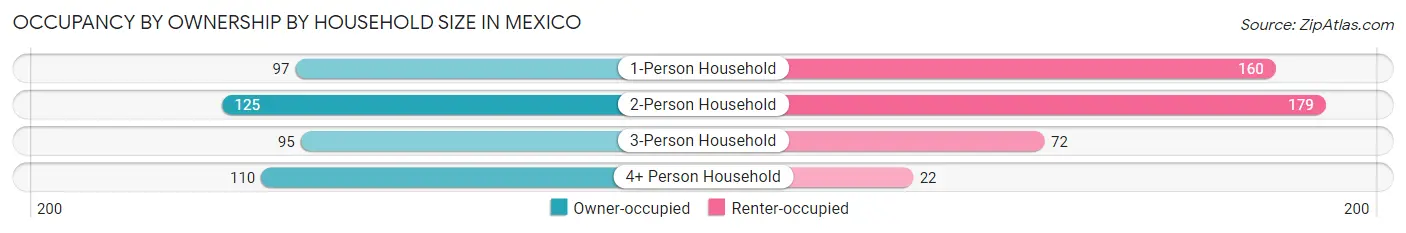
| Household Size | Owner-occupied | Renter-occupied |
| 1-Person Household | 97 (37.7%) | 160 (62.3%) |
| 2-Person Household | 125 (41.1%) | 179 (58.9%) |
| 3-Person Household | 95 (56.9%) | 72 (43.1%) |
| 4+ Person Household | 110 (83.3%) | 22 (16.7%) |
| Total Housing Units | 427 (49.6%) | 433 (50.3%) |
Occupancy by Educational Attainment in Mexico
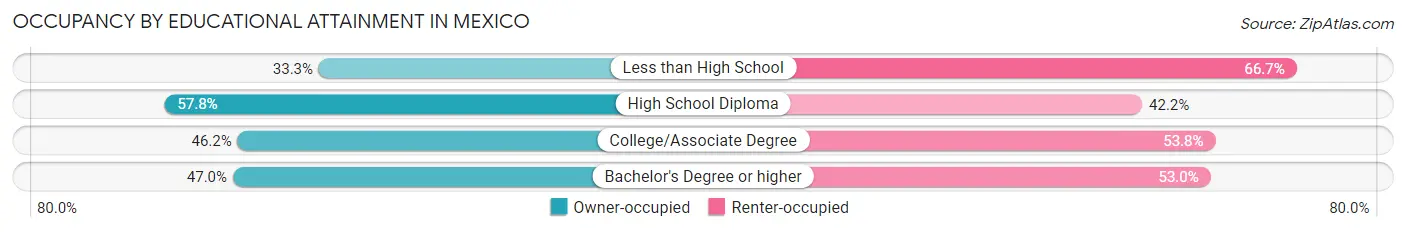
| Household Size | Owner-occupied | Renter-occupied |
| Less than High School | 10 (33.3%) | 20 (66.7%) |
| High School Diploma | 159 (57.8%) | 116 (42.2%) |
| College/Associate Degree | 165 (46.2%) | 192 (53.8%) |
| Bachelor's Degree or higher | 93 (47.0%) | 105 (53.0%) |
Occupancy by Age of Householder in Mexico
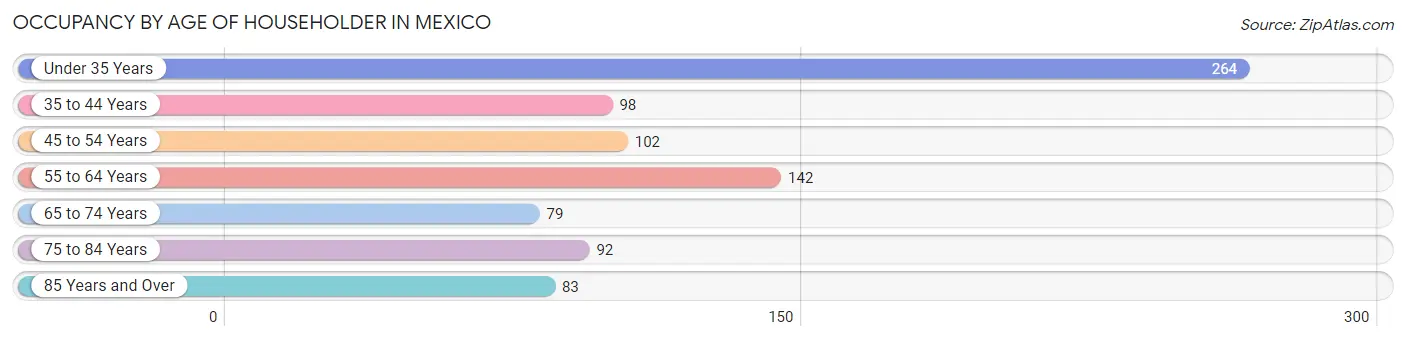
| Age Bracket | # Households | % Households |
| Under 35 Years | 264 | 30.7% |
| 35 to 44 Years | 98 | 11.4% |
| 45 to 54 Years | 102 | 11.9% |
| 55 to 64 Years | 142 | 16.5% |
| 65 to 74 Years | 79 | 9.2% |
| 75 to 84 Years | 92 | 10.7% |
| 85 Years and Over | 83 | 9.7% |
| Total | 860 | 100.0% |
Housing Finances in Mexico
Median Income by Occupancy in Mexico
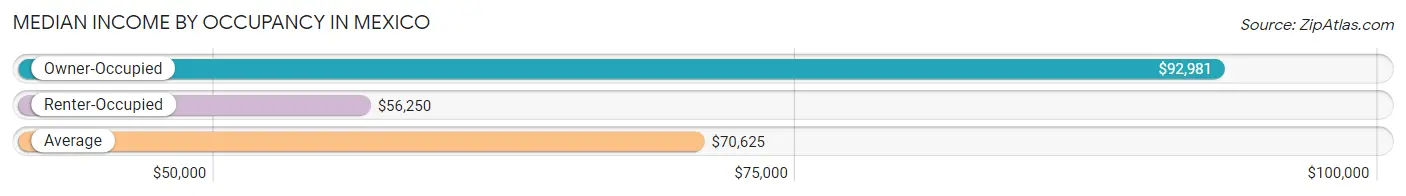
| Occupancy Type | # Households | Median Income |
| Owner-Occupied | 427 (49.6%) | $92,981 |
| Renter-Occupied | 433 (50.3%) | $56,250 |
| Average | 860 (100.0%) | $70,625 |
Occupancy by Householder Income Bracket in Mexico
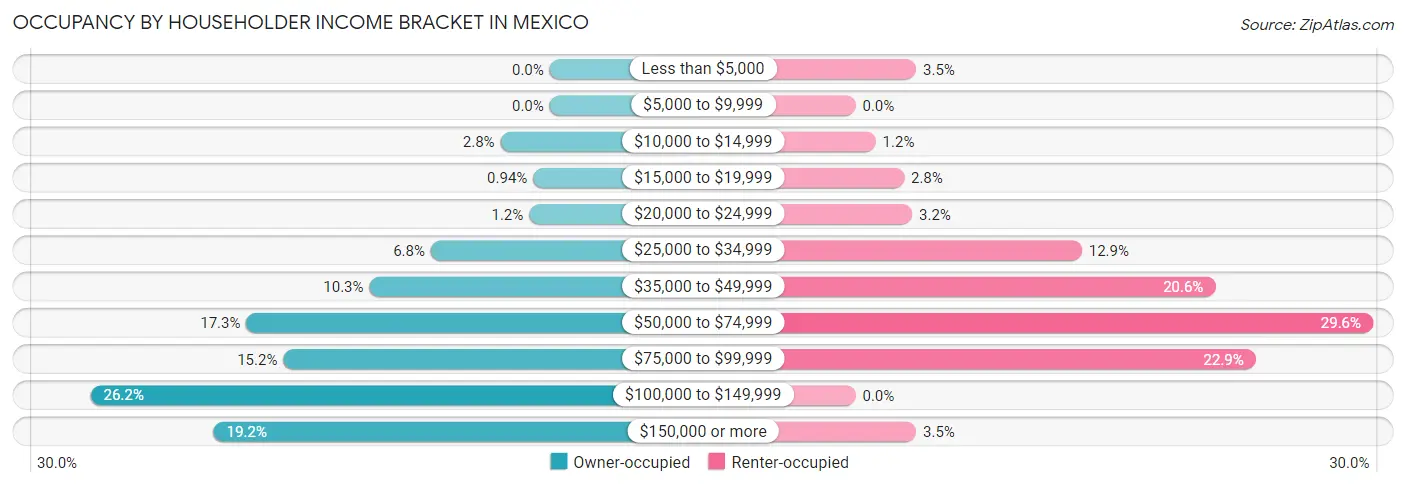
| Income Bracket | Owner-occupied | Renter-occupied |
| Less than $5,000 | 0 (0.0%) | 15 (3.5%) |
| $5,000 to $9,999 | 0 (0.0%) | 0 (0.0%) |
| $10,000 to $14,999 | 12 (2.8%) | 5 (1.1%) |
| $15,000 to $19,999 | 4 (0.9%) | 12 (2.8%) |
| $20,000 to $24,999 | 5 (1.2%) | 14 (3.2%) |
| $25,000 to $34,999 | 29 (6.8%) | 56 (12.9%) |
| $35,000 to $49,999 | 44 (10.3%) | 89 (20.5%) |
| $50,000 to $74,999 | 74 (17.3%) | 128 (29.6%) |
| $75,000 to $99,999 | 65 (15.2%) | 99 (22.9%) |
| $100,000 to $149,999 | 112 (26.2%) | 0 (0.0%) |
| $150,000 or more | 82 (19.2%) | 15 (3.5%) |
| Total | 427 (100.0%) | 433 (100.0%) |
Monthly Housing Cost Tiers in Mexico
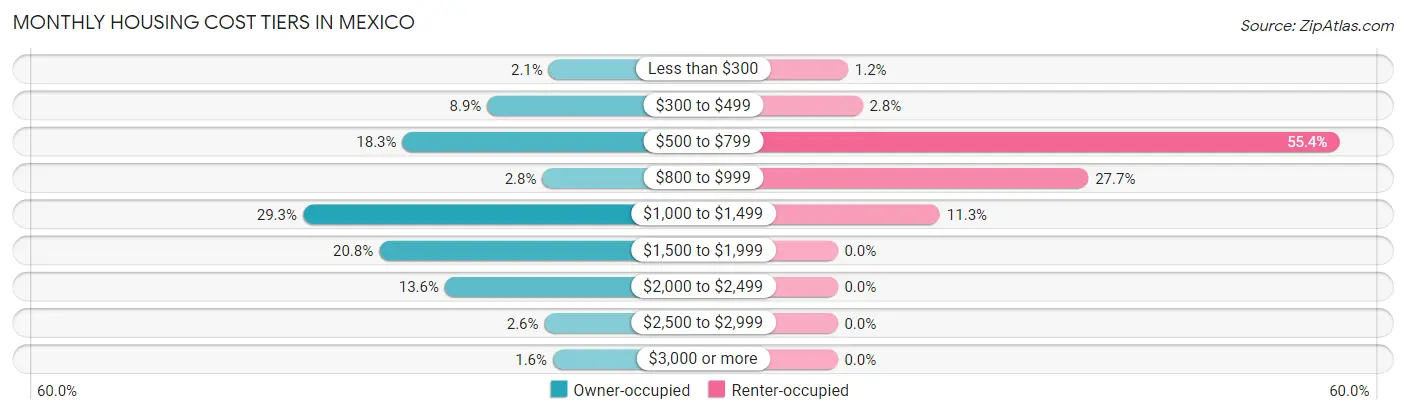
| Monthly Cost | Owner-occupied | Renter-occupied |
| Less than $300 | 9 (2.1%) | 5 (1.1%) |
| $300 to $499 | 38 (8.9%) | 12 (2.8%) |
| $500 to $799 | 78 (18.3%) | 240 (55.4%) |
| $800 to $999 | 12 (2.8%) | 120 (27.7%) |
| $1,000 to $1,499 | 125 (29.3%) | 49 (11.3%) |
| $1,500 to $1,999 | 89 (20.8%) | 0 (0.0%) |
| $2,000 to $2,499 | 58 (13.6%) | 0 (0.0%) |
| $2,500 to $2,999 | 11 (2.6%) | 0 (0.0%) |
| $3,000 or more | 7 (1.6%) | 0 (0.0%) |
| Total | 427 (100.0%) | 433 (100.0%) |
Physical Housing Characteristics in Mexico
Housing Structures in Mexico
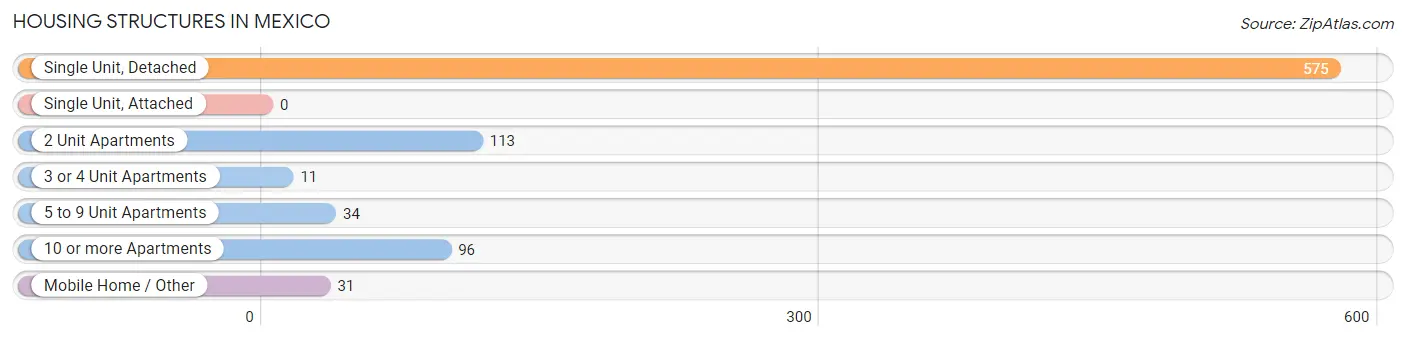
| Structure Type | # Housing Units | % Housing Units |
| Single Unit, Detached | 575 | 66.9% |
| Single Unit, Attached | 0 | 0.0% |
| 2 Unit Apartments | 113 | 13.1% |
| 3 or 4 Unit Apartments | 11 | 1.3% |
| 5 to 9 Unit Apartments | 34 | 4.0% |
| 10 or more Apartments | 96 | 11.2% |
| Mobile Home / Other | 31 | 3.6% |
| Total | 860 | 100.0% |
Housing Structures by Occupancy in Mexico
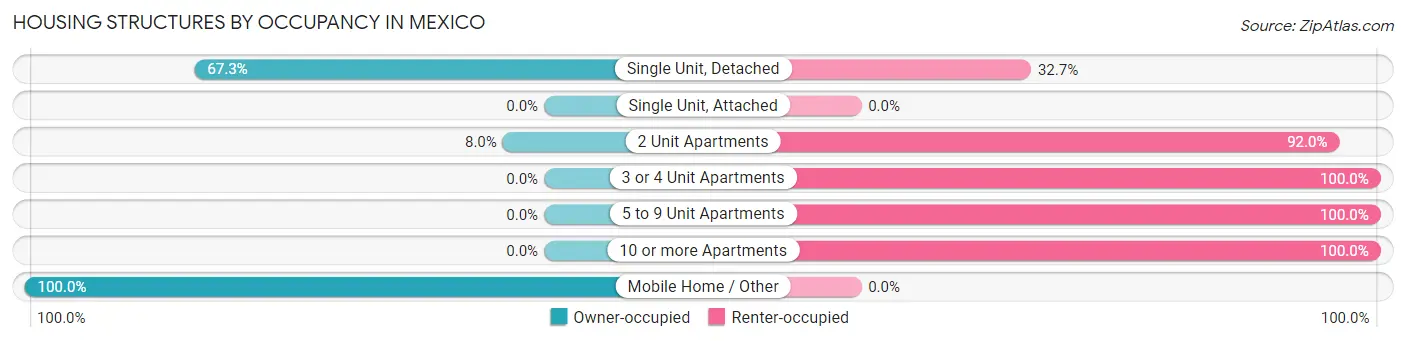
| Structure Type | Owner-occupied | Renter-occupied |
| Single Unit, Detached | 387 (67.3%) | 188 (32.7%) |
| Single Unit, Attached | 0 (0.0%) | 0 (0.0%) |
| 2 Unit Apartments | 9 (8.0%) | 104 (92.0%) |
| 3 or 4 Unit Apartments | 0 (0.0%) | 11 (100.0%) |
| 5 to 9 Unit Apartments | 0 (0.0%) | 34 (100.0%) |
| 10 or more Apartments | 0 (0.0%) | 96 (100.0%) |
| Mobile Home / Other | 31 (100.0%) | 0 (0.0%) |
| Total | 427 (49.6%) | 433 (50.3%) |
Housing Structures by Number of Rooms in Mexico
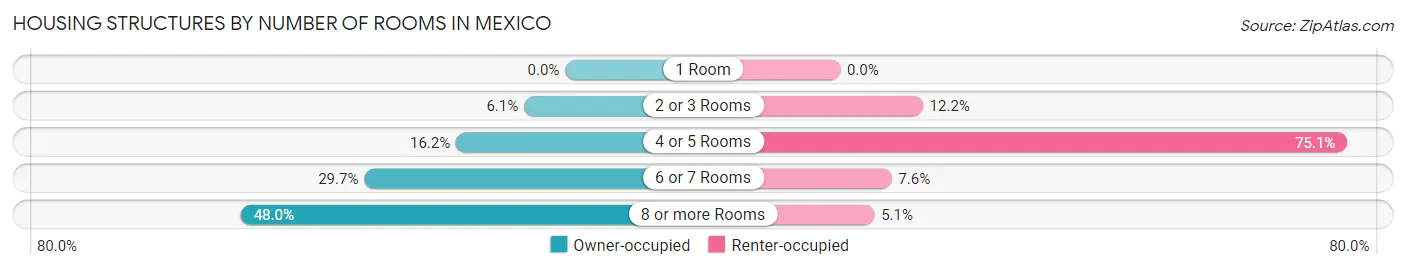
| Number of Rooms | Owner-occupied | Renter-occupied |
| 1 Room | 0 (0.0%) | 0 (0.0%) |
| 2 or 3 Rooms | 26 (6.1%) | 53 (12.2%) |
| 4 or 5 Rooms | 69 (16.2%) | 325 (75.1%) |
| 6 or 7 Rooms | 127 (29.7%) | 33 (7.6%) |
| 8 or more Rooms | 205 (48.0%) | 22 (5.1%) |
| Total | 427 (100.0%) | 433 (100.0%) |
Housing Structure by Heating Type in Mexico
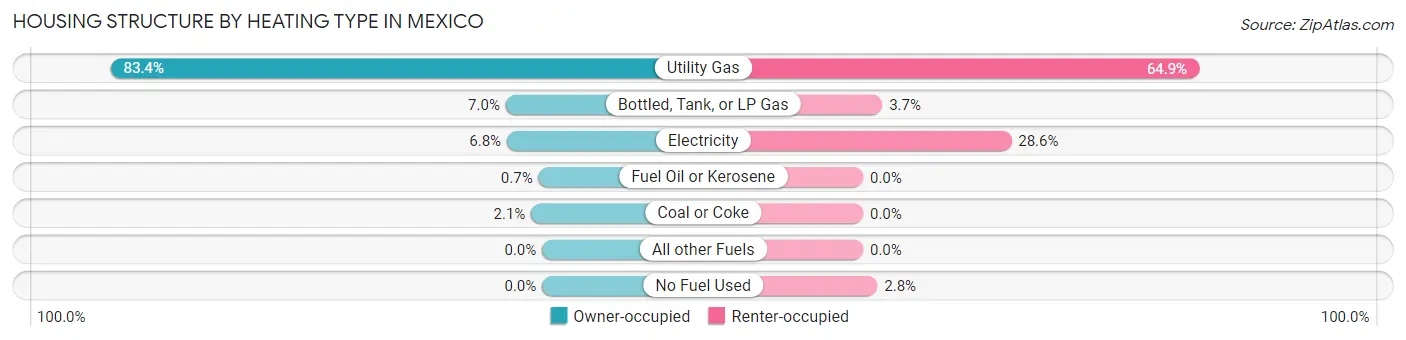
| Heating Type | Owner-occupied | Renter-occupied |
| Utility Gas | 356 (83.4%) | 281 (64.9%) |
| Bottled, Tank, or LP Gas | 30 (7.0%) | 16 (3.7%) |
| Electricity | 29 (6.8%) | 124 (28.6%) |
| Fuel Oil or Kerosene | 3 (0.7%) | 0 (0.0%) |
| Coal or Coke | 9 (2.1%) | 0 (0.0%) |
| All other Fuels | 0 (0.0%) | 0 (0.0%) |
| No Fuel Used | 0 (0.0%) | 12 (2.8%) |
| Total | 427 (100.0%) | 433 (100.0%) |
Household Vehicle Usage in Mexico
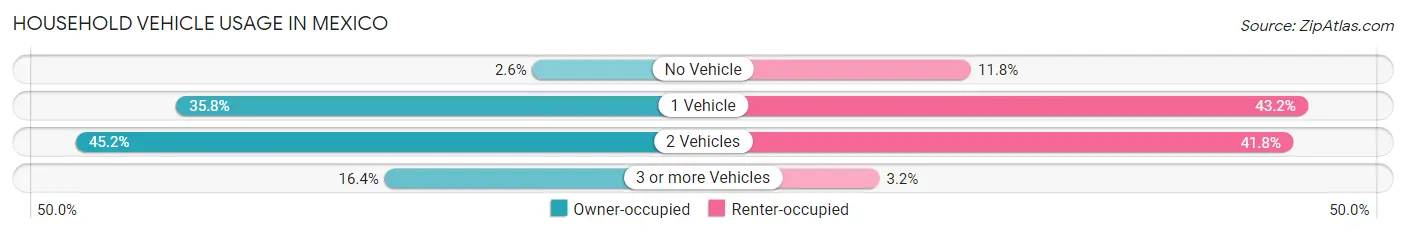
| Vehicles per Household | Owner-occupied | Renter-occupied |
| No Vehicle | 11 (2.6%) | 51 (11.8%) |
| 1 Vehicle | 153 (35.8%) | 187 (43.2%) |
| 2 Vehicles | 193 (45.2%) | 181 (41.8%) |
| 3 or more Vehicles | 70 (16.4%) | 14 (3.2%) |
| Total | 427 (100.0%) | 433 (100.0%) |
Real Estate & Mortgages in Mexico
Real Estate and Mortgage Overview in Mexico
| Characteristic | Without Mortgage | With Mortgage |
| Housing Units | 139 | 288 |
| Median Property Value | $124,100 | $151,000 |
| Median Household Income | $65,268 | $74 |
| Monthly Housing Costs | $543 | $7 |
| Real Estate Taxes | $1,382 | $26 |
Property Value by Mortgage Status in Mexico
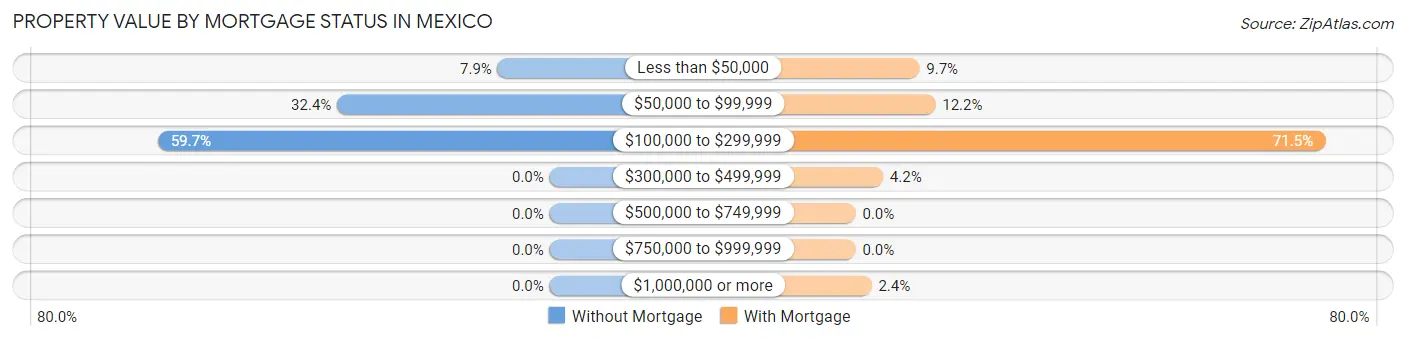
| Property Value | Without Mortgage | With Mortgage |
| Less than $50,000 | 11 (7.9%) | 28 (9.7%) |
| $50,000 to $99,999 | 45 (32.4%) | 35 (12.1%) |
| $100,000 to $299,999 | 83 (59.7%) | 206 (71.5%) |
| $300,000 to $499,999 | 0 (0.0%) | 12 (4.2%) |
| $500,000 to $749,999 | 0 (0.0%) | 0 (0.0%) |
| $750,000 to $999,999 | 0 (0.0%) | 0 (0.0%) |
| $1,000,000 or more | 0 (0.0%) | 7 (2.4%) |
| Total | 139 (100.0%) | 288 (100.0%) |
Household Income by Mortgage Status in Mexico
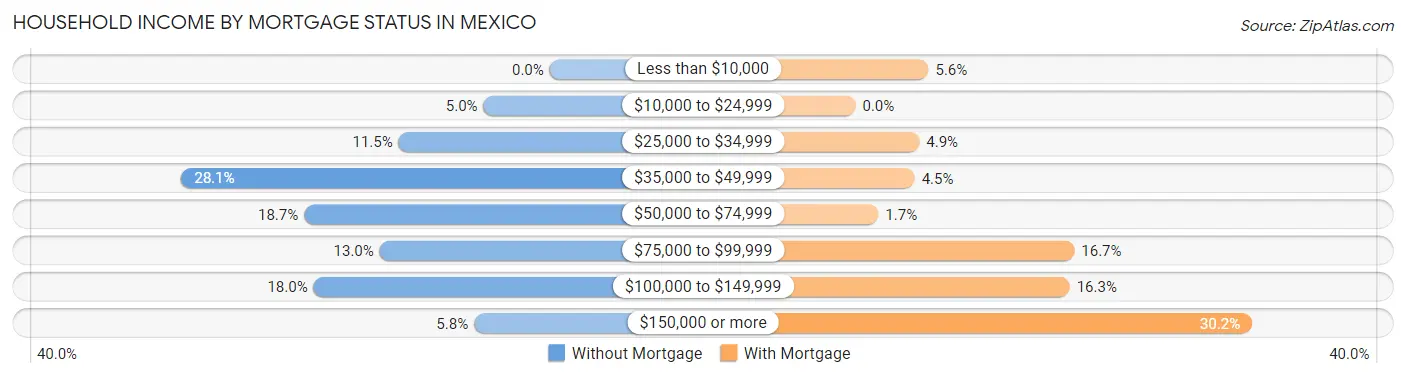
| Household Income | Without Mortgage | With Mortgage |
| Less than $10,000 | 0 (0.0%) | 16 (5.6%) |
| $10,000 to $24,999 | 7 (5.0%) | 0 (0.0%) |
| $25,000 to $34,999 | 16 (11.5%) | 14 (4.9%) |
| $35,000 to $49,999 | 39 (28.1%) | 13 (4.5%) |
| $50,000 to $74,999 | 26 (18.7%) | 5 (1.7%) |
| $75,000 to $99,999 | 18 (13.0%) | 48 (16.7%) |
| $100,000 to $149,999 | 25 (18.0%) | 47 (16.3%) |
| $150,000 or more | 8 (5.8%) | 87 (30.2%) |
| Total | 139 (100.0%) | 288 (100.0%) |
Property Value to Household Income Ratio in Mexico
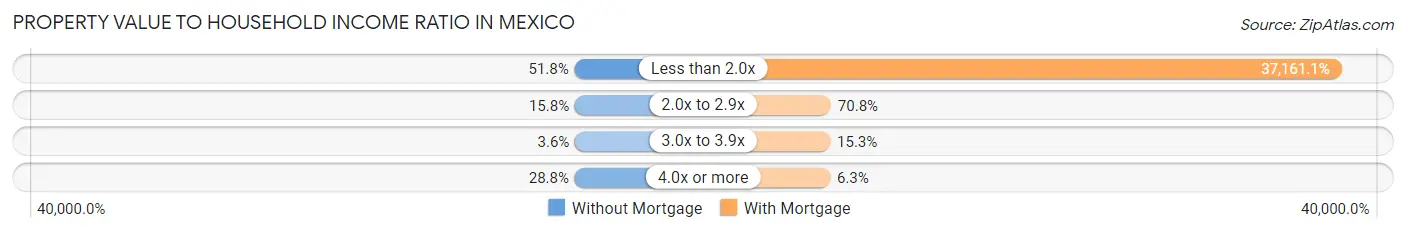
| Value-to-Income Ratio | Without Mortgage | With Mortgage |
| Less than 2.0x | 72 (51.8%) | 107,024 (37,161.1%) |
| 2.0x to 2.9x | 22 (15.8%) | 204 (70.8%) |
| 3.0x to 3.9x | 5 (3.6%) | 44 (15.3%) |
| 4.0x or more | 40 (28.8%) | 18 (6.2%) |
| Total | 139 (100.0%) | 288 (100.0%) |
Real Estate Taxes by Mortgage Status in Mexico
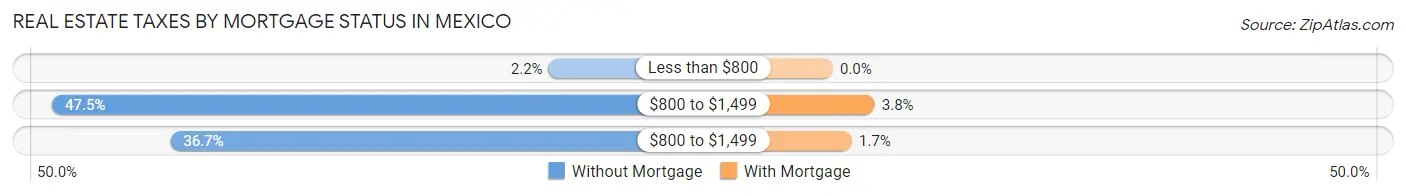
| Property Taxes | Without Mortgage | With Mortgage |
| Less than $800 | 3 (2.2%) | 0 (0.0%) |
| $800 to $1,499 | 66 (47.5%) | 11 (3.8%) |
| $800 to $1,499 | 51 (36.7%) | 5 (1.7%) |
| Total | 139 (100.0%) | 288 (100.0%) |
Health & Disability in Mexico
Health Insurance Coverage by Age in Mexico
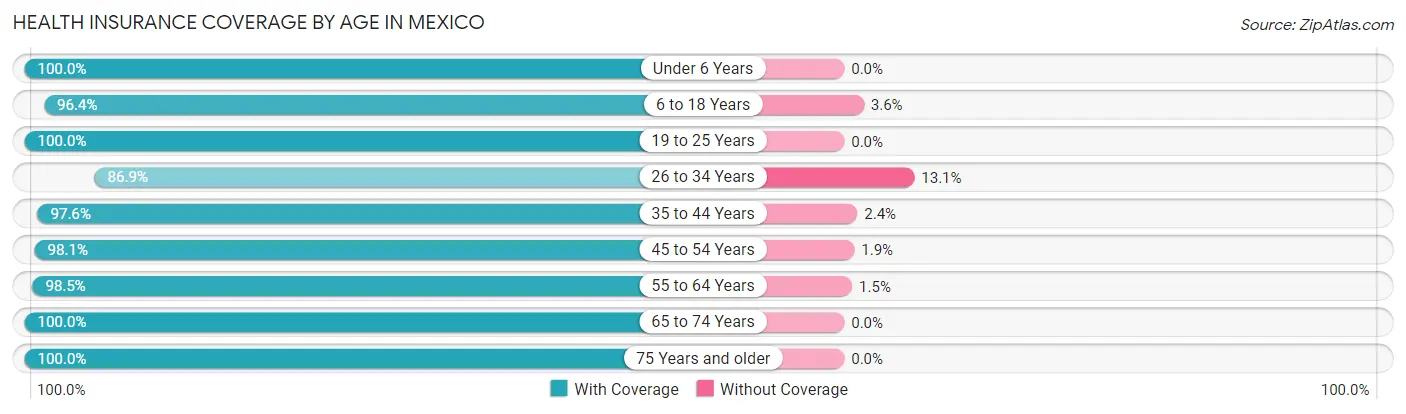
| Age Bracket | With Coverage | Without Coverage |
| Under 6 Years | 164 (100.0%) | 0 (0.0%) |
| 6 to 18 Years | 238 (96.4%) | 9 (3.6%) |
| 19 to 25 Years | 275 (100.0%) | 0 (0.0%) |
| 26 to 34 Years | 266 (86.9%) | 40 (13.1%) |
| 35 to 44 Years | 201 (97.6%) | 5 (2.4%) |
| 45 to 54 Years | 157 (98.1%) | 3 (1.9%) |
| 55 to 64 Years | 201 (98.5%) | 3 (1.5%) |
| 65 to 74 Years | 115 (100.0%) | 0 (0.0%) |
| 75 Years and older | 248 (100.0%) | 0 (0.0%) |
| Total | 1,865 (96.9%) | 60 (3.1%) |
Health Insurance Coverage by Citizenship Status in Mexico
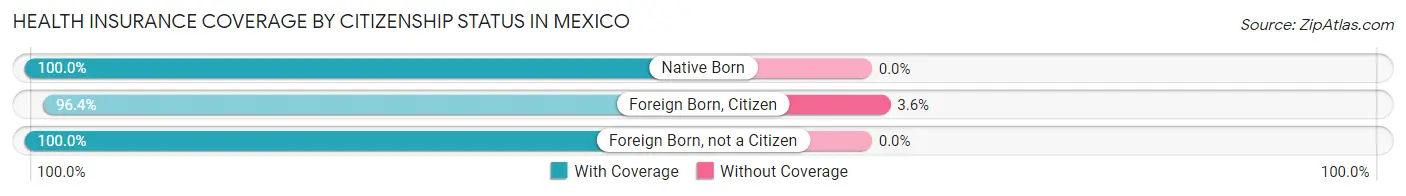
| Citizenship Status | With Coverage | Without Coverage |
| Native Born | 164 (100.0%) | 0 (0.0%) |
| Foreign Born, Citizen | 238 (96.4%) | 9 (3.6%) |
| Foreign Born, not a Citizen | 275 (100.0%) | 0 (0.0%) |
Health Insurance Coverage by Household Income in Mexico
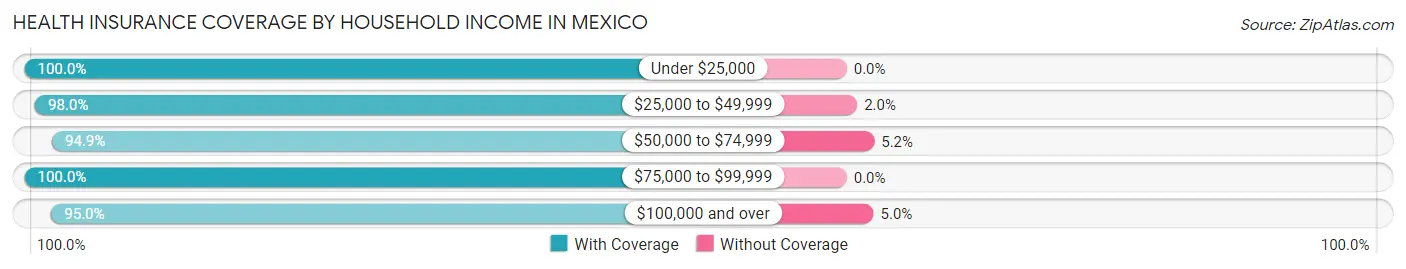
| Household Income | With Coverage | Without Coverage |
| Under $25,000 | 132 (100.0%) | 0 (0.0%) |
| $25,000 to $49,999 | 300 (98.0%) | 6 (2.0%) |
| $50,000 to $74,999 | 405 (94.9%) | 22 (5.1%) |
| $75,000 to $99,999 | 404 (100.0%) | 0 (0.0%) |
| $100,000 and over | 606 (95.0%) | 32 (5.0%) |
Public vs Private Health Insurance Coverage by Age in Mexico
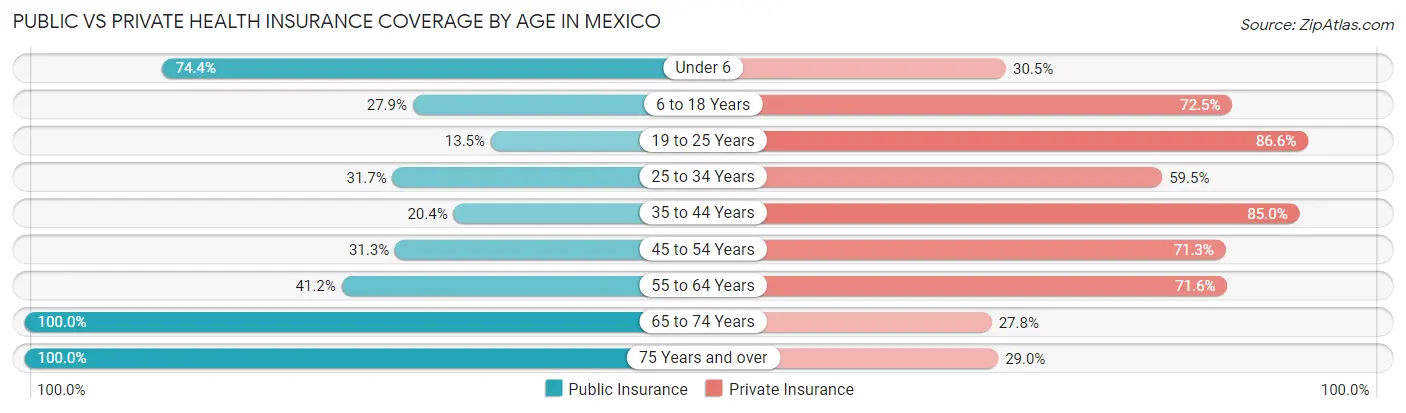
| Age Bracket | Public Insurance | Private Insurance |
| Under 6 | 122 (74.4%) | 50 (30.5%) |
| 6 to 18 Years | 69 (27.9%) | 179 (72.5%) |
| 19 to 25 Years | 37 (13.5%) | 238 (86.6%) |
| 25 to 34 Years | 97 (31.7%) | 182 (59.5%) |
| 35 to 44 Years | 42 (20.4%) | 175 (85.0%) |
| 45 to 54 Years | 50 (31.2%) | 114 (71.3%) |
| 55 to 64 Years | 84 (41.2%) | 146 (71.6%) |
| 65 to 74 Years | 115 (100.0%) | 32 (27.8%) |
| 75 Years and over | 248 (100.0%) | 72 (29.0%) |
| Total | 864 (44.9%) | 1,188 (61.7%) |
Disability Status by Sex by Age in Mexico
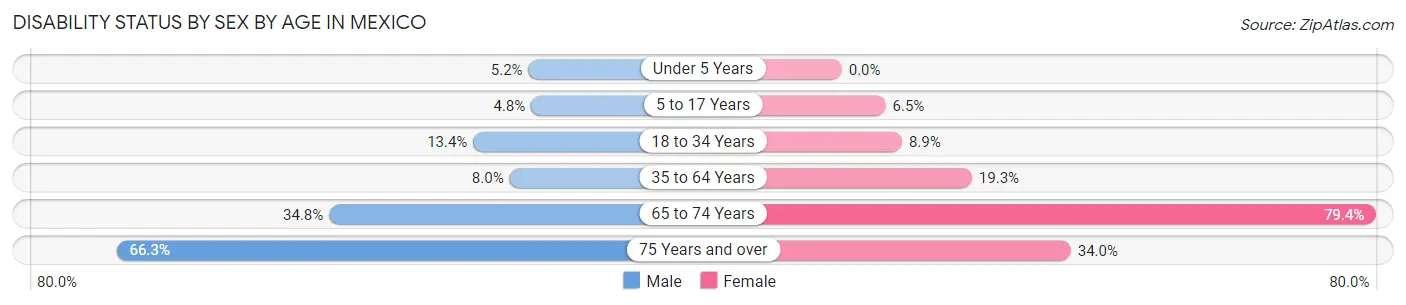
| Age Bracket | Male | Female |
| Under 5 Years | 4 (5.2%) | 0 (0.0%) |
| 5 to 17 Years | 7 (4.8%) | 8 (6.5%) |
| 18 to 34 Years | 34 (13.4%) | 30 (8.9%) |
| 35 to 64 Years | 22 (8.0%) | 57 (19.3%) |
| 65 to 74 Years | 8 (34.8%) | 73 (79.3%) |
| 75 Years and over | 67 (66.3%) | 50 (34.0%) |
Disability Class by Sex by Age in Mexico
Disability Class: Hearing Difficulty
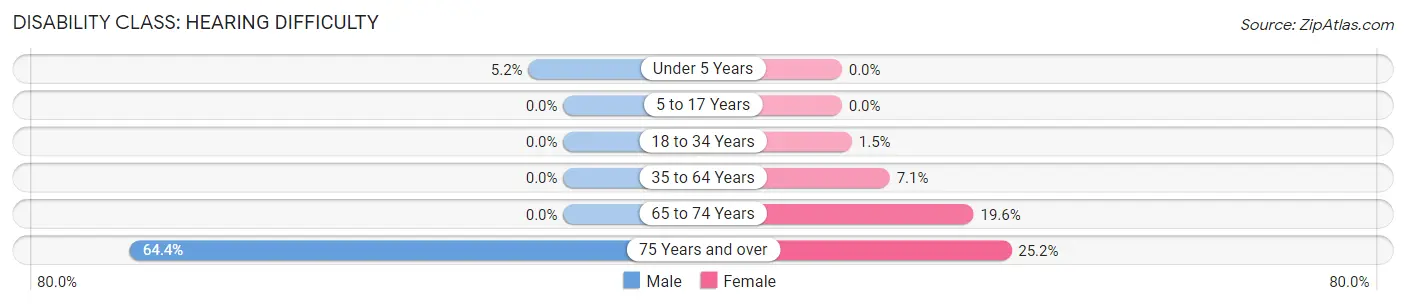
| Age Bracket | Male | Female |
| Under 5 Years | 4 (5.2%) | 0 (0.0%) |
| 5 to 17 Years | 0 (0.0%) | 0 (0.0%) |
| 18 to 34 Years | 0 (0.0%) | 5 (1.5%) |
| 35 to 64 Years | 0 (0.0%) | 21 (7.1%) |
| 65 to 74 Years | 0 (0.0%) | 18 (19.6%) |
| 75 Years and over | 65 (64.4%) | 37 (25.2%) |
Disability Class: Vision Difficulty
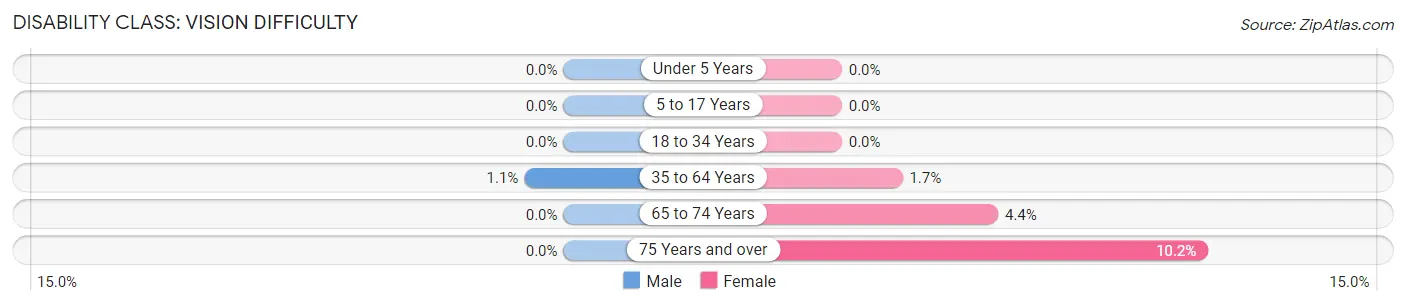
| Age Bracket | Male | Female |
| Under 5 Years | 0 (0.0%) | 0 (0.0%) |
| 5 to 17 Years | 0 (0.0%) | 0 (0.0%) |
| 18 to 34 Years | 0 (0.0%) | 0 (0.0%) |
| 35 to 64 Years | 3 (1.1%) | 5 (1.7%) |
| 65 to 74 Years | 0 (0.0%) | 4 (4.3%) |
| 75 Years and over | 0 (0.0%) | 15 (10.2%) |
Disability Class: Cognitive Difficulty
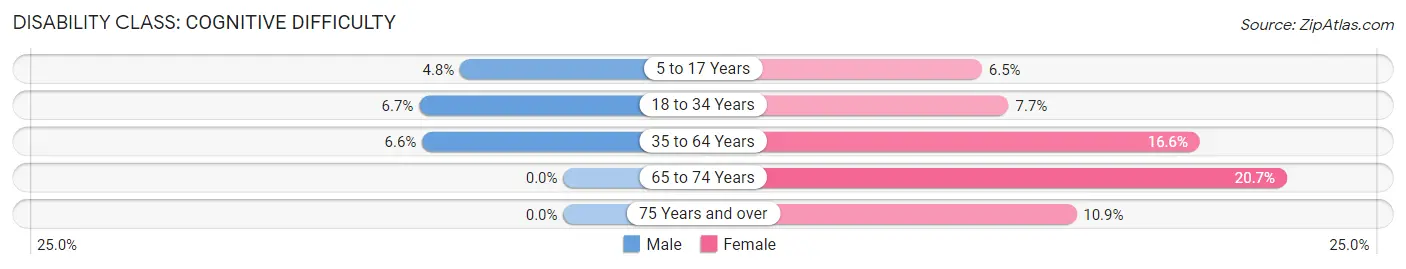
| Age Bracket | Male | Female |
| 5 to 17 Years | 7 (4.8%) | 8 (6.5%) |
| 18 to 34 Years | 17 (6.7%) | 26 (7.7%) |
| 35 to 64 Years | 18 (6.6%) | 49 (16.6%) |
| 65 to 74 Years | 0 (0.0%) | 19 (20.6%) |
| 75 Years and over | 0 (0.0%) | 16 (10.9%) |
Disability Class: Ambulatory Difficulty
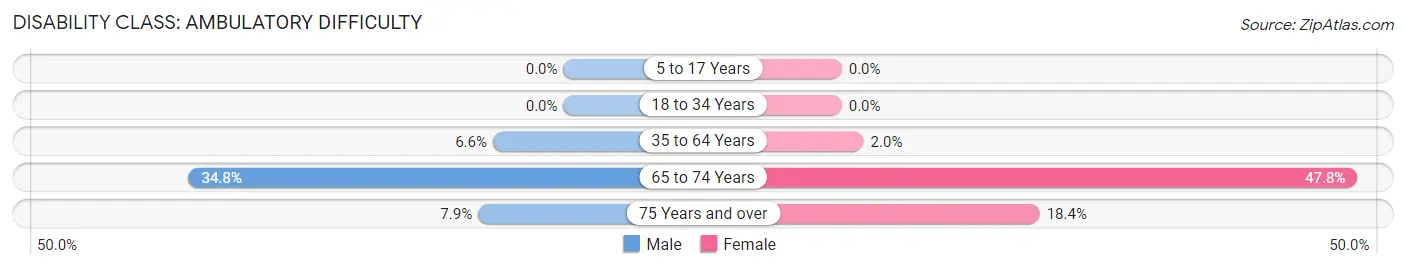
| Age Bracket | Male | Female |
| 5 to 17 Years | 0 (0.0%) | 0 (0.0%) |
| 18 to 34 Years | 0 (0.0%) | 0 (0.0%) |
| 35 to 64 Years | 18 (6.6%) | 6 (2.0%) |
| 65 to 74 Years | 8 (34.8%) | 44 (47.8%) |
| 75 Years and over | 8 (7.9%) | 27 (18.4%) |
Disability Class: Self-Care Difficulty
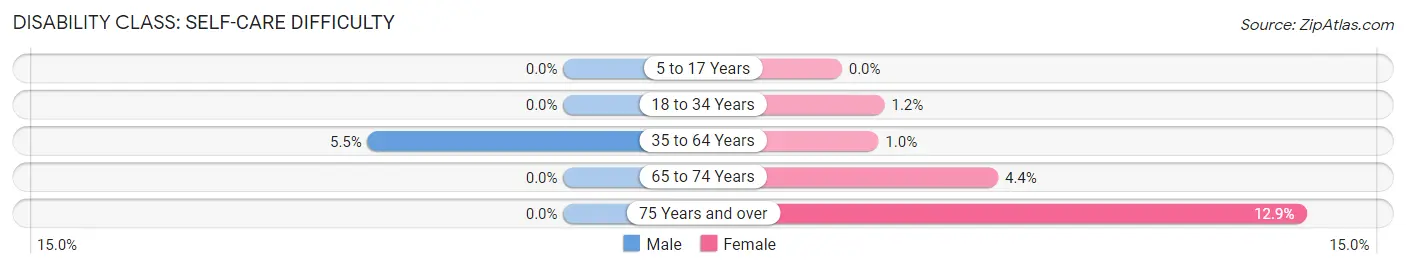
| Age Bracket | Male | Female |
| 5 to 17 Years | 0 (0.0%) | 0 (0.0%) |
| 18 to 34 Years | 0 (0.0%) | 4 (1.2%) |
| 35 to 64 Years | 15 (5.4%) | 3 (1.0%) |
| 65 to 74 Years | 0 (0.0%) | 4 (4.3%) |
| 75 Years and over | 0 (0.0%) | 19 (12.9%) |
Technology Access in Mexico
Computing Device Access in Mexico
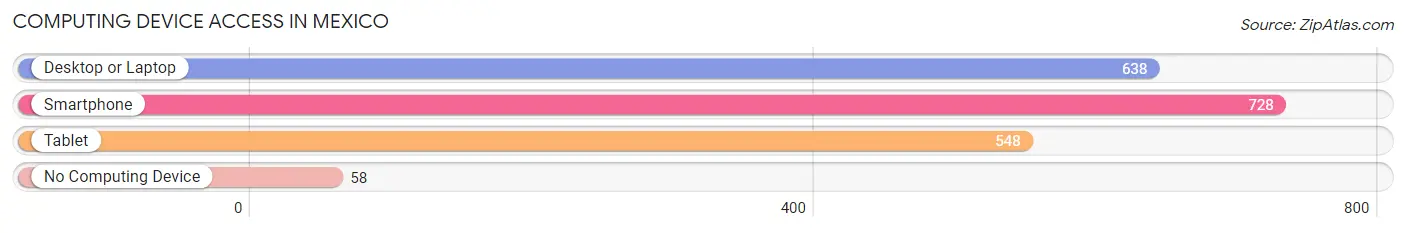
| Device Type | # Households | % Households |
| Desktop or Laptop | 638 | 74.2% |
| Smartphone | 728 | 84.7% |
| Tablet | 548 | 63.7% |
| No Computing Device | 58 | 6.7% |
| Total | 860 | 100.0% |
Internet Access in Mexico
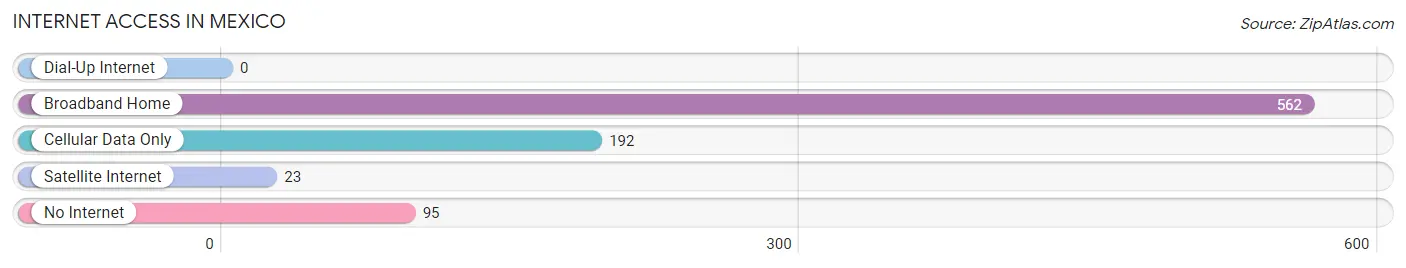
| Internet Type | # Households | % Households |
| Dial-Up Internet | 0 | 0.0% |
| Broadband Home | 562 | 65.3% |
| Cellular Data Only | 192 | 22.3% |
| Satellite Internet | 23 | 2.7% |
| No Internet | 95 | 11.1% |
| Total | 860 | 100.0% |
Mexico Summary
Mexico, New York is a small town located in Oswego County, New York. It is situated on the eastern shore of Lake Ontario, about 25 miles north of Syracuse. The town was founded in 1803 and has a population of approximately 4,000 people.
History
The area that is now Mexico, New York was originally inhabited by the Iroquois Native American tribe. The first European settlers arrived in the area in the late 1700s. The town was originally known as “New Mexico” and was part of the Town of Oswego. In 1803, the Town of Mexico was officially established.
The town was named after the country of Mexico, which was then in the midst of a revolution. The town was a popular destination for immigrants from Europe, particularly from Germany and Ireland. The town was also a popular destination for African Americans who were escaping slavery in the south.
In the late 1800s, the town was a major center for the production of salt. The salt industry was so important to the town that it was nicknamed “Salt City.” The salt industry declined in the early 1900s, and the town shifted its focus to agriculture and tourism.
Geography
Mexico, New York is located in Oswego County, New York. It is situated on the eastern shore of Lake Ontario, about 25 miles north of Syracuse. The town is bordered by the towns of Oswego, Scriba, and Granby. The town is located in the Finger Lakes region of New York and is part of the Tug Hill Plateau.
The town has a total area of 24.2 square miles, of which 23.7 square miles is land and 0.5 square miles is water. The terrain is mostly flat, with some rolling hills. The highest point in the town is located at an elevation of 1,068 feet.
Economy
The economy of Mexico, New York is largely based on agriculture and tourism. The town is home to several farms, which produce a variety of crops, including corn, soybeans, and hay. The town is also home to several wineries, which produce a variety of wines.
The town is also a popular destination for tourists. The town is home to several parks, including Mexico Point State Park and Salmon River Falls State Park. The town is also home to several historic sites, including the Mexico Point Lighthouse and the Mexico Point Historic District.
Demographics
As of the 2010 census, the population of Mexico, New York was 4,039. The racial makeup of the town was 97.2% White, 0.7% African American, 0.3% Native American, 0.3% Asian, 0.1% Pacific Islander, 0.3% from other races, and 1.2% from two or more races. Hispanic or Latino of any race were 1.3% of the population.
The median household income in the town was $45,938, and the median family income was $51,964. The per capita income in the town was $20,945. About 8.2% of families and 10.3% of the population were below the poverty line, including 14.2% of those under age 18 and 5.2% of those age 65 or over.
Common Questions
What is Per Capita Income in Mexico?
Per Capita income in Mexico is $37,077.
What is the Median Family Income in Mexico?
Median Family Income in Mexico is $79,271.
What is the Median Household income in Mexico?
Median Household Income in Mexico is $70,625.
What is Income or Wage Gap in Mexico?
Income or Wage Gap in Mexico is 21.4%.
Women in Mexico earn 78.6 cents for every dollar earned by a man.
What is Inequality or Gini Index in Mexico?
Inequality or Gini Index in Mexico is 0.38.
What is the Total Population of Mexico?
Total Population of Mexico is 1,925.
What is the Total Male Population of Mexico?
Total Male Population of Mexico is 876.
What is the Total Female Population of Mexico?
Total Female Population of Mexico is 1,049.
What is the Ratio of Males per 100 Females in Mexico?
There are 83.51 Males per 100 Females in Mexico.
What is the Ratio of Females per 100 Males in Mexico?
There are 119.75 Females per 100 Males in Mexico.
What is the Median Population Age in Mexico?
Median Population Age in Mexico is 34.6 Years.
What is the Average Family Size in Mexico
Average Family Size in Mexico is 2.8 People.
What is the Average Household Size in Mexico
Average Household Size in Mexico is 2.2 People.
How Large is the Labor Force in Mexico?
There are 980 People in the Labor Forcein in Mexico.
What is the Percentage of People in the Labor Force in Mexico?
63.7% of People are in the Labor Force in Mexico.
What is the Unemployment Rate in Mexico?
Unemployment Rate in Mexico is 2.1%.