Livonia Center, NY Map & Demographics
Livonia Center Map
Livonia Center Overview
$27,240
PER CAPITA INCOME
$110,694
AVG FAMILY INCOME
$59,250
AVG HOUSEHOLD INCOME
22.5%
WAGE / INCOME GAP [ % ]
77.5¢/ $1
WAGE / INCOME GAP [ $ ]
0.37
INEQUALITY / GINI INDEX
305
TOTAL POPULATION
167
MALE POPULATION
138
FEMALE POPULATION
121.01
MALES / 100 FEMALES
82.63
FEMALES / 100 MALES
37.9
MEDIAN AGE
2.7
AVG FAMILY SIZE
2.3
AVG HOUSEHOLD SIZE
206
LABOR FORCE [ PEOPLE ]
83.1%
PERCENT IN LABOR FORCE
14.6%
UNEMPLOYMENT RATE
Livonia Center Area Codes
Income in Livonia Center
Income Overview in Livonia Center
Per Capita Income in Livonia Center is $27,240, while median incomes of families and households are $110,694 and $59,250 respectively.
| Characteristic | Number | Measure |
| Per Capita Income | 305 | $27,240 |
| Median Family Income | 64 | $110,694 |
| Mean Family Income | 64 | $91,316 |
| Median Household Income | 126 | $59,250 |
| Mean Household Income | 126 | $64,558 |
| Income Deficit | 64 | $0 |
| Wage / Income Gap (%) | 305 | 22.52% |
| Wage / Income Gap ($) | 305 | 77.48¢ per $1 |
| Gini / Inequality Index | 305 | 0.37 |
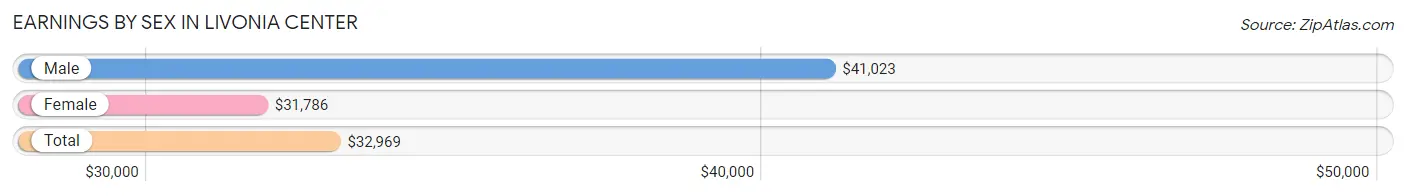
Earnings by Sex in Livonia Center
Average Earnings in Livonia Center are $32,969, $41,023 for men and $31,786 for women, a difference of 22.5%.
| Sex | Number | Average Earnings |
| Male | 62 (35.2%) | $41,023 |
| Female | 114 (64.8%) | $31,786 |
| Total | 176 (100.0%) | $32,969 |
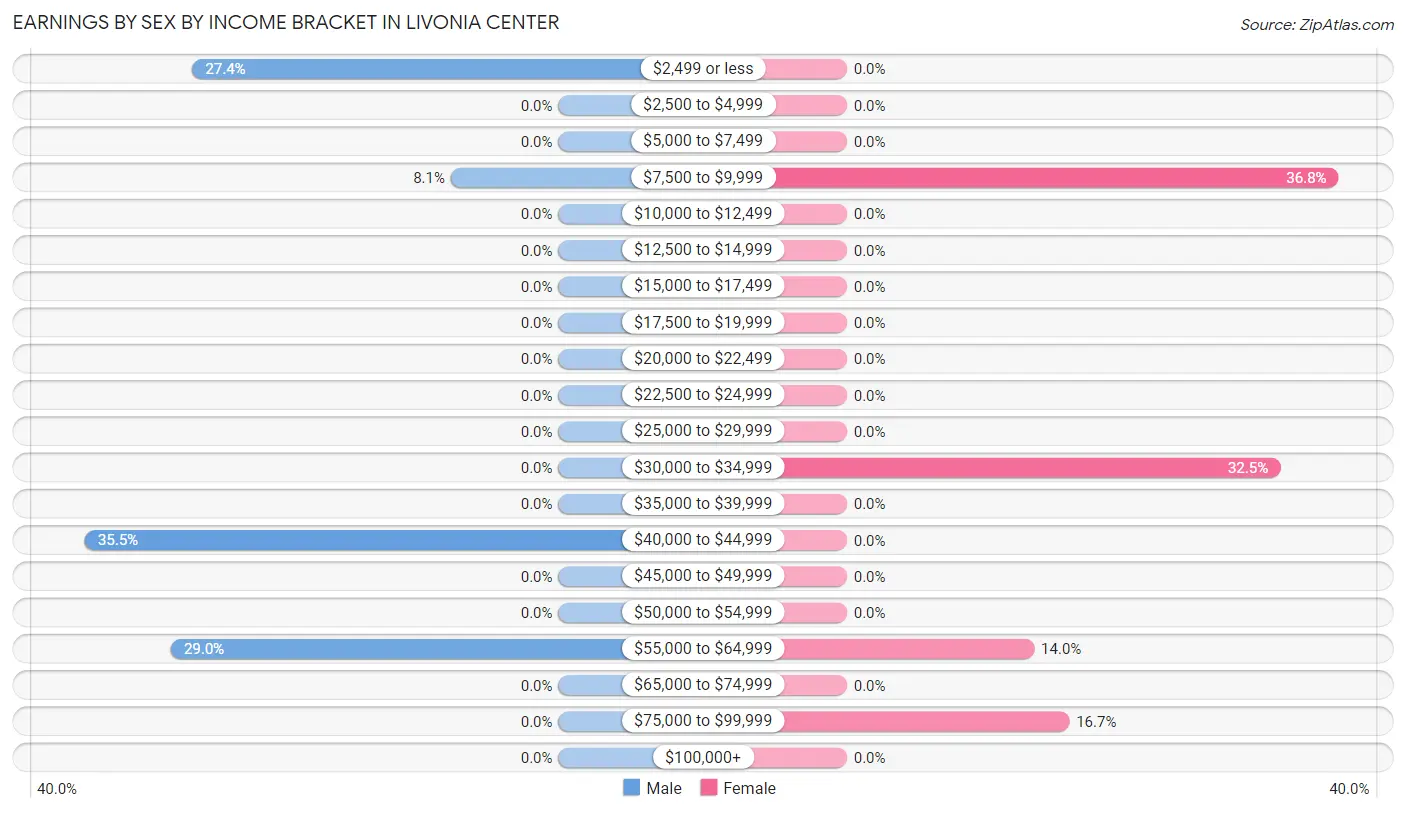
Earnings by Sex by Income Bracket in Livonia Center
The most common earnings brackets in Livonia Center are $40,000 to $44,999 for men (22 | 35.5%) and $7,500 to $9,999 for women (42 | 36.8%).
| Income | Male | Female |
| $2,499 or less | 17 (27.4%) | 0 (0.0%) |
| $2,500 to $4,999 | 0 (0.0%) | 0 (0.0%) |
| $5,000 to $7,499 | 0 (0.0%) | 0 (0.0%) |
| $7,500 to $9,999 | 5 (8.1%) | 42 (36.8%) |
| $10,000 to $12,499 | 0 (0.0%) | 0 (0.0%) |
| $12,500 to $14,999 | 0 (0.0%) | 0 (0.0%) |
| $15,000 to $17,499 | 0 (0.0%) | 0 (0.0%) |
| $17,500 to $19,999 | 0 (0.0%) | 0 (0.0%) |
| $20,000 to $22,499 | 0 (0.0%) | 0 (0.0%) |
| $22,500 to $24,999 | 0 (0.0%) | 0 (0.0%) |
| $25,000 to $29,999 | 0 (0.0%) | 0 (0.0%) |
| $30,000 to $34,999 | 0 (0.0%) | 37 (32.5%) |
| $35,000 to $39,999 | 0 (0.0%) | 0 (0.0%) |
| $40,000 to $44,999 | 22 (35.5%) | 0 (0.0%) |
| $45,000 to $49,999 | 0 (0.0%) | 0 (0.0%) |
| $50,000 to $54,999 | 0 (0.0%) | 0 (0.0%) |
| $55,000 to $64,999 | 18 (29.0%) | 16 (14.0%) |
| $65,000 to $74,999 | 0 (0.0%) | 0 (0.0%) |
| $75,000 to $99,999 | 0 (0.0%) | 19 (16.7%) |
| $100,000+ | 0 (0.0%) | 0 (0.0%) |
| Total | 62 (100.0%) | 114 (100.0%) |
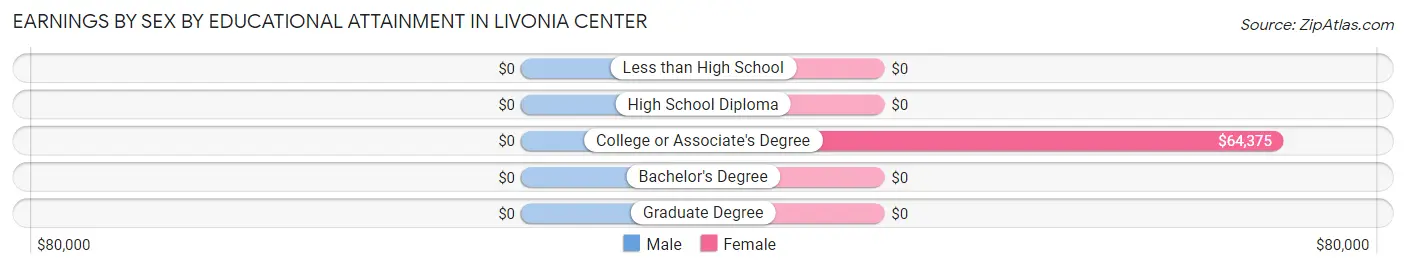
Earnings by Sex by Educational Attainment in Livonia Center
| Educational Attainment | Male Income | Female Income |
| Less than High School | - | - |
| High School Diploma | - | - |
| College or Associate's Degree | - | - |
| Bachelor's Degree | - | - |
| Graduate Degree | - | - |
| Total | $41,023 | $0 |
Family Income in Livonia Center
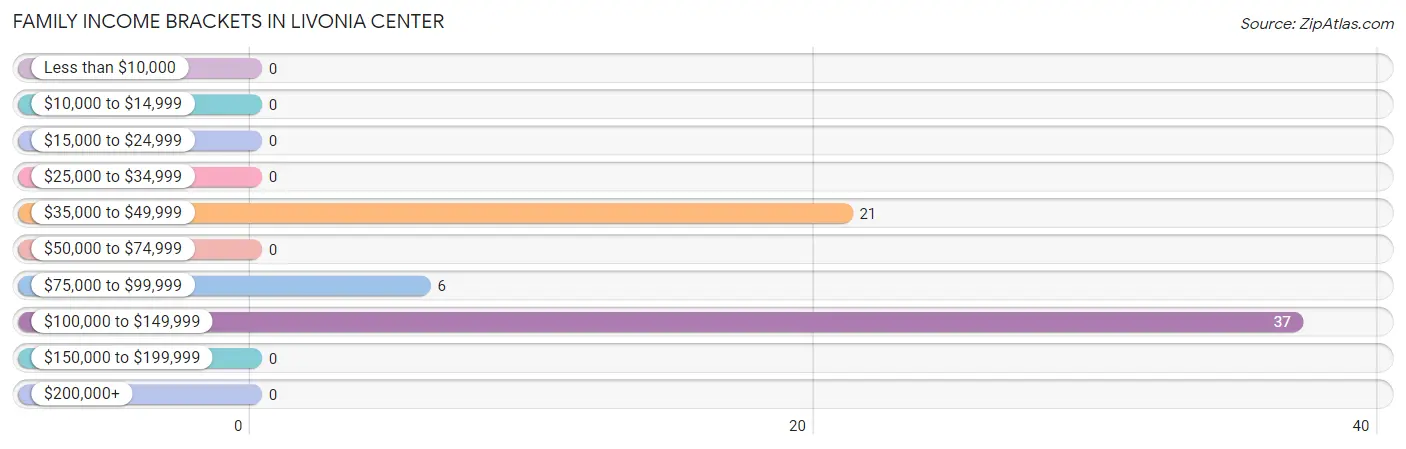
Family Income Brackets in Livonia Center
According to the Livonia Center family income data, there are 37 families falling into the $100,000 to $149,999 income range, which is the most common income bracket and makes up 57.8% of all families.
| Income Bracket | # Families | % Families |
| Less than $10,000 | 0 | 0.0% |
| $10,000 to $14,999 | 0 | 0.0% |
| $15,000 to $24,999 | 0 | 0.0% |
| $25,000 to $34,999 | 0 | 0.0% |
| $35,000 to $49,999 | 21 | 32.8% |
| $50,000 to $74,999 | 0 | 0.0% |
| $75,000 to $99,999 | 6 | 9.4% |
| $100,000 to $149,999 | 37 | 57.8% |
| $150,000 to $199,999 | 0 | 0.0% |
| $200,000+ | 0 | 0.0% |
Family Income by Famaliy Size in Livonia Center
| Income Bracket | # Families | Median Income |
| 2-Person Families | 45 (70.3%) | $0 |
| 3-Person Families | 0 (0.0%) | $0 |
| 4-Person Families | 19 (29.7%) | $0 |
| 5-Person Families | 0 (0.0%) | $0 |
| 6-Person Families | 0 (0.0%) | $0 |
| 7+ Person Families | 0 (0.0%) | $0 |
| Total | 64 (100.0%) | $110,694 |
Family Income by Number of Earners in Livonia Center
| Number of Earners | # Families | Median Income |
| No Earners | 0 (0.0%) | $0 |
| 1 Earner | 27 (42.2%) | $0 |
| 2 Earners | 37 (57.8%) | $0 |
| 3+ Earners | 0 (0.0%) | $0 |
| Total | 64 (100.0%) | $110,694 |
Household Income in Livonia Center
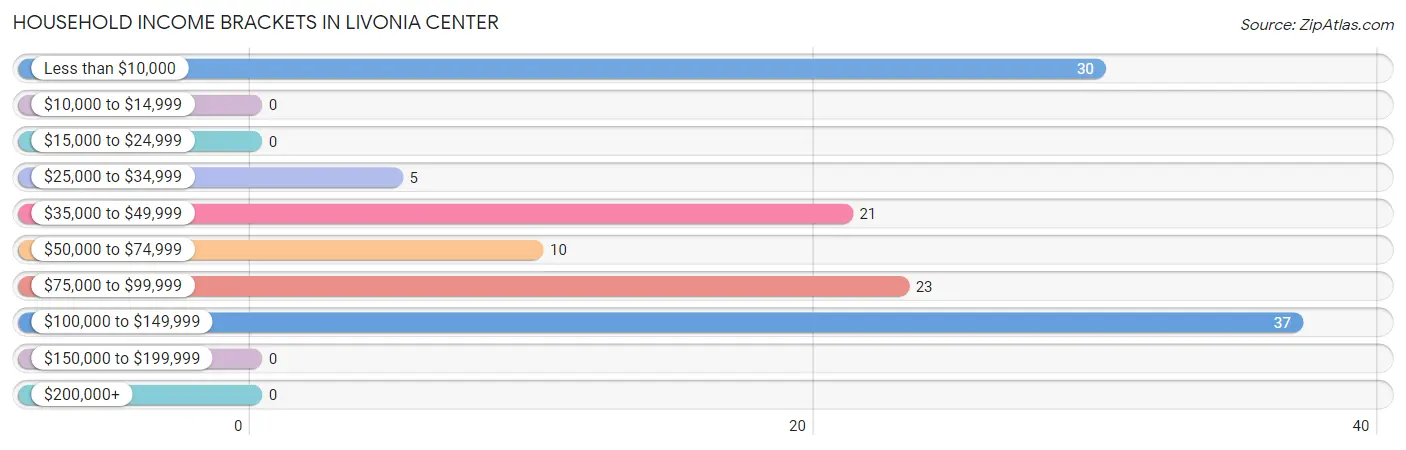
Household Income Brackets in Livonia Center
With 37 households falling in the category, the $100,000 to $149,999 income range is the most frequent in Livonia Center, accounting for 29.4% of all households.
| Income Bracket | # Households | % Households |
| Less than $10,000 | 30 | 23.8% |
| $10,000 to $14,999 | 0 | 0.0% |
| $15,000 to $24,999 | 0 | 0.0% |
| $25,000 to $34,999 | 5 | 4.0% |
| $35,000 to $49,999 | 21 | 16.7% |
| $50,000 to $74,999 | 10 | 7.9% |
| $75,000 to $99,999 | 23 | 18.3% |
| $100,000 to $149,999 | 37 | 29.4% |
| $150,000 to $199,999 | 0 | 0.0% |
| $200,000+ | 0 | 0.0% |
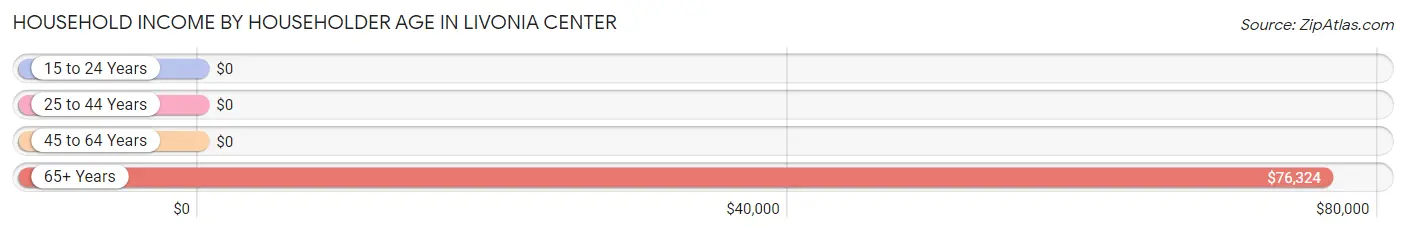
Household Income by Householder Age in Livonia Center
The median household income in Livonia Center is $59,250, with the highest median household income of $76,324 found in the 65+ years age bracket for the primary householder. A total of 28 households (22.2%) fall into this category.
| Income Bracket | # Households | Median Income |
| 15 to 24 Years | 0 (0.0%) | $0 |
| 25 to 44 Years | 49 (38.9%) | $0 |
| 45 to 64 Years | 49 (38.9%) | $0 |
| 65+ Years | 28 (22.2%) | $76,324 |
| Total | 126 (100.0%) | $59,250 |
Poverty in Livonia Center
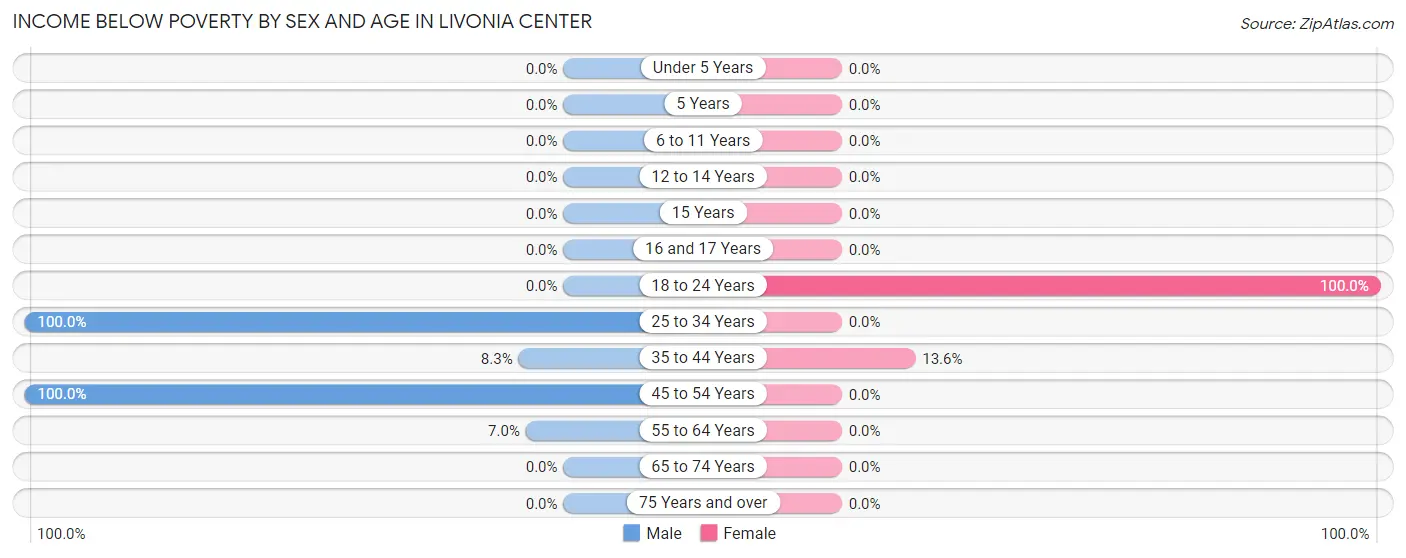
Income Below Poverty by Sex and Age in Livonia Center
With 26.5% poverty level for males and 19.6% for females among the residents of Livonia Center, 25 to 34 year old males and 18 to 24 year old females are the most vulnerable to poverty, with 33 males (100.0%) and 24 females (100.0%) in their respective age groups living below the poverty level.
| Age Bracket | Male | Female |
| Under 5 Years | 0 (0.0%) | 0 (0.0%) |
| 5 Years | 0 (0.0%) | 0 (0.0%) |
| 6 to 11 Years | 0 (0.0%) | 0 (0.0%) |
| 12 to 14 Years | 0 (0.0%) | 0 (0.0%) |
| 15 Years | 0 (0.0%) | 0 (0.0%) |
| 16 and 17 Years | 0 (0.0%) | 0 (0.0%) |
| 18 to 24 Years | 0 (0.0%) | 24 (100.0%) |
| 25 to 34 Years | 33 (100.0%) | 0 (0.0%) |
| 35 to 44 Years | 2 (8.3%) | 3 (13.6%) |
| 45 to 54 Years | 2 (100.0%) | 0 (0.0%) |
| 55 to 64 Years | 3 (7.0%) | 0 (0.0%) |
| 65 to 74 Years | 0 (0.0%) | 0 (0.0%) |
| 75 Years and over | 0 (0.0%) | 0 (0.0%) |
| Total | 40 (26.5%) | 27 (19.6%) |
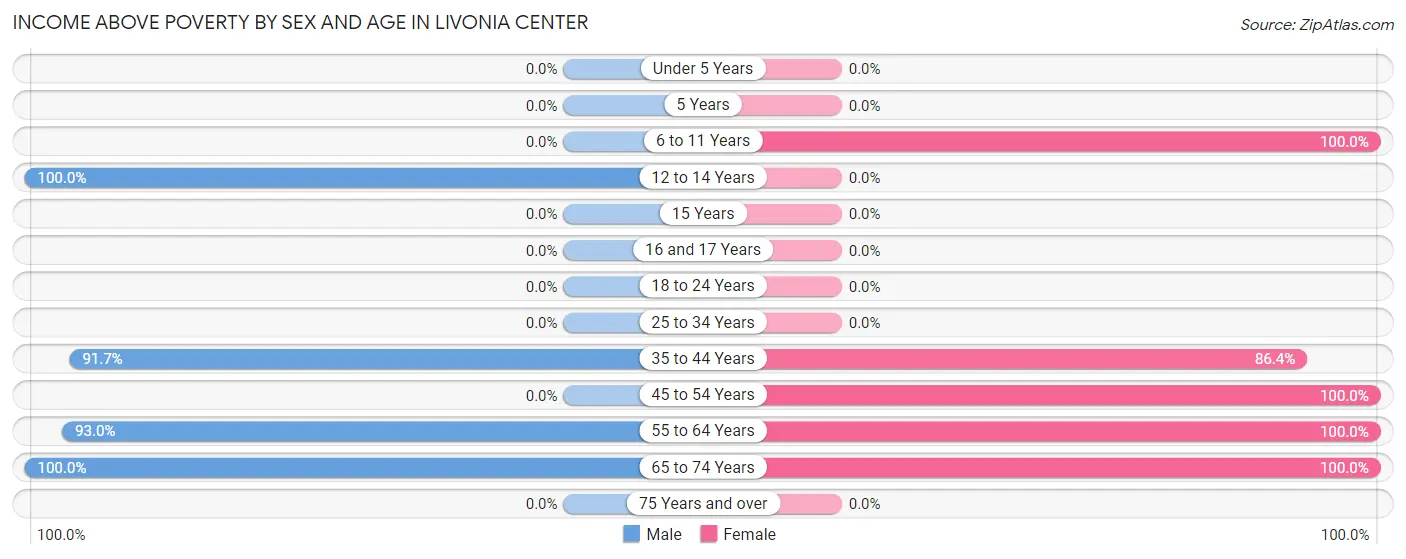
Income Above Poverty by Sex and Age in Livonia Center
According to the poverty statistics in Livonia Center, males aged 12 to 14 years and females aged 6 to 11 years are the age groups that are most secure financially, with 100.0% of males and 100.0% of females in these age groups living above the poverty line.
| Age Bracket | Male | Female |
| Under 5 Years | 0 (0.0%) | 0 (0.0%) |
| 5 Years | 0 (0.0%) | 0 (0.0%) |
| 6 to 11 Years | 0 (0.0%) | 20 (100.0%) |
| 12 to 14 Years | 21 (100.0%) | 0 (0.0%) |
| 15 Years | 0 (0.0%) | 0 (0.0%) |
| 16 and 17 Years | 0 (0.0%) | 0 (0.0%) |
| 18 to 24 Years | 0 (0.0%) | 0 (0.0%) |
| 25 to 34 Years | 0 (0.0%) | 0 (0.0%) |
| 35 to 44 Years | 22 (91.7%) | 19 (86.4%) |
| 45 to 54 Years | 0 (0.0%) | 37 (100.0%) |
| 55 to 64 Years | 40 (93.0%) | 29 (100.0%) |
| 65 to 74 Years | 28 (100.0%) | 6 (100.0%) |
| 75 Years and over | 0 (0.0%) | 0 (0.0%) |
| Total | 111 (73.5%) | 111 (80.4%) |
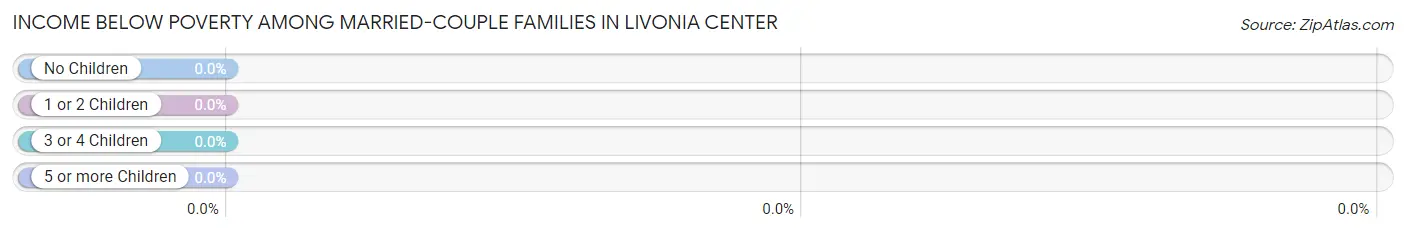
Income Below Poverty Among Married-Couple Families in Livonia Center
| Children | Above Poverty | Below Poverty |
| No Children | 45 (100.0%) | 0 (0.0%) |
| 1 or 2 Children | 19 (100.0%) | 0 (0.0%) |
| 3 or 4 Children | 0 (0.0%) | 0 (0.0%) |
| 5 or more Children | 0 (0.0%) | 0 (0.0%) |
| Total | 64 (100.0%) | 0 (0.0%) |
Income Below Poverty Among Single-Parent Households in Livonia Center
| Children | Single Father | Single Mother |
| No Children | 0 (0.0%) | 0 (0.0%) |
| 1 or 2 Children | 0 (0.0%) | 0 (0.0%) |
| 3 or 4 Children | 0 (0.0%) | 0 (0.0%) |
| 5 or more Children | 0 (0.0%) | 0 (0.0%) |
| Total | 0 (0.0%) | 0 (0.0%) |
Income Below Poverty Among Married-Couple vs Single-Parent Households in Livonia Center
| Children | Married-Couple Families | Single-Parent Households |
| No Children | 0 (0.0%) | 0 (0.0%) |
| 1 or 2 Children | 0 (0.0%) | 0 (0.0%) |
| 3 or 4 Children | 0 (0.0%) | 0 (0.0%) |
| 5 or more Children | 0 (0.0%) | 0 (0.0%) |
| Total | 0 (0.0%) | 0 (0.0%) |
Race in Livonia Center
The most populous races in Livonia Center are White / Caucasian (302 | 99.0%), and Black / African American (3 | 1.0%).
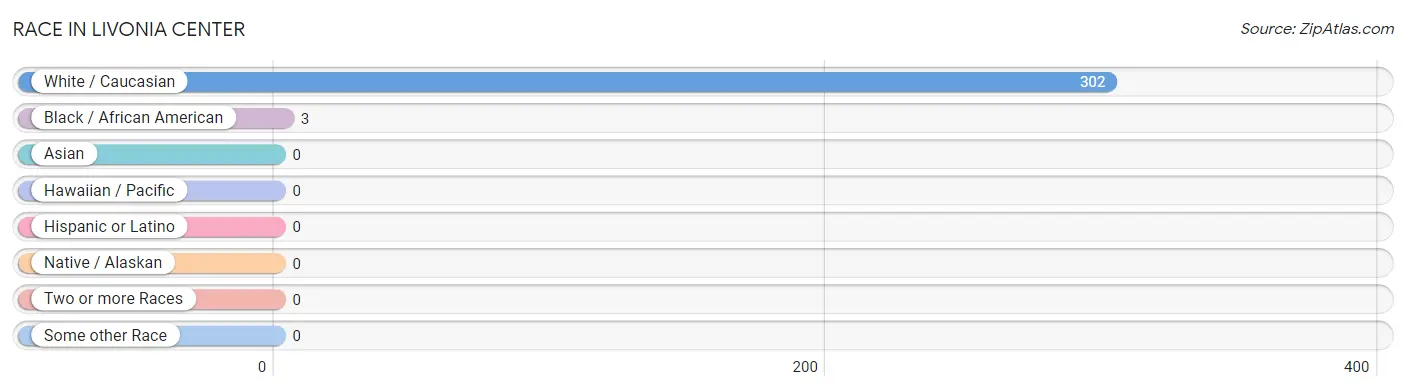
| Race | # Population | % Population |
| Asian | 0 | 0.0% |
| Black / African American | 3 | 1.0% |
| Hawaiian / Pacific | 0 | 0.0% |
| Hispanic or Latino | 0 | 0.0% |
| Native / Alaskan | 0 | 0.0% |
| White / Caucasian | 302 | 99.0% |
| Two or more Races | 0 | 0.0% |
| Some other Race | 0 | 0.0% |
| Total | 305 | 100.0% |
Ancestry in Livonia Center
The most populous ancestries reported in Livonia Center are German (77 | 25.3%), Italian (30 | 9.8%), Russian (24 | 7.9%), Ukrainian (24 | 7.9%), and Irish (23 | 7.5%), together accounting for 58.4% of all Livonia Center residents.
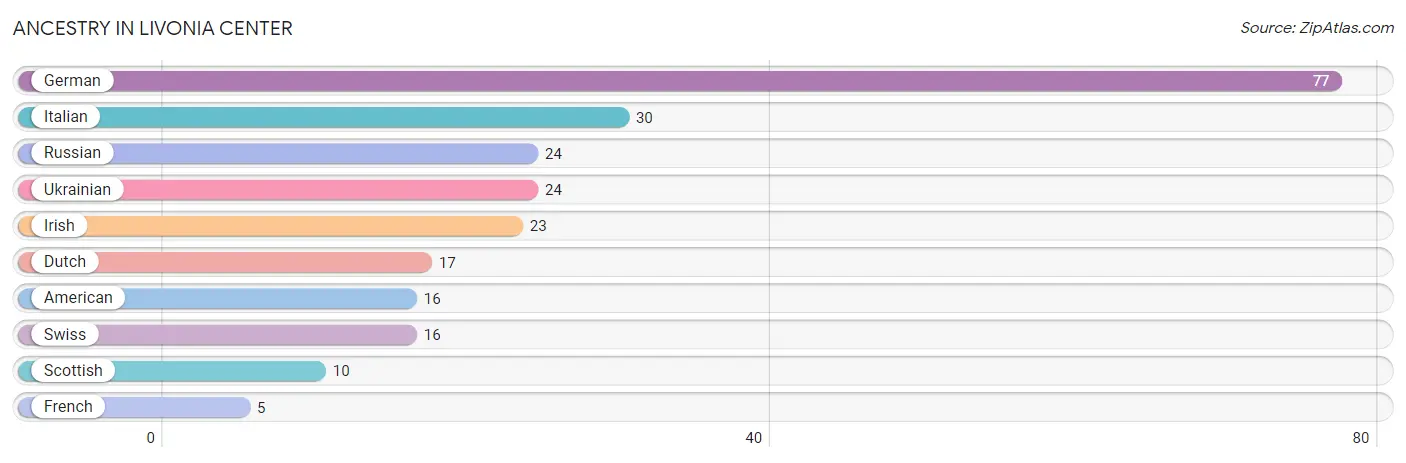
| Ancestry | # Population | % Population |
| American | 16 | 5.2% |
| Dutch | 17 | 5.6% |
| French | 5 | 1.6% |
| German | 77 | 25.3% |
| Irish | 23 | 7.5% |
| Italian | 30 | 9.8% |
| Russian | 24 | 7.9% |
| Scottish | 10 | 3.3% |
| Swiss | 16 | 5.2% |
| Ukrainian | 24 | 7.9% | View All 10 Rows |
Immigrants in Livonia Center

| Immigration Origin | # Population | % Population | View All 0 Rows |
Sex and Age in Livonia Center
Sex and Age in Livonia Center
The most populous age groups in Livonia Center are 10 to 14 Years (37 | 22.2%) for men and 50 to 54 Years (37 | 26.8%) for women.
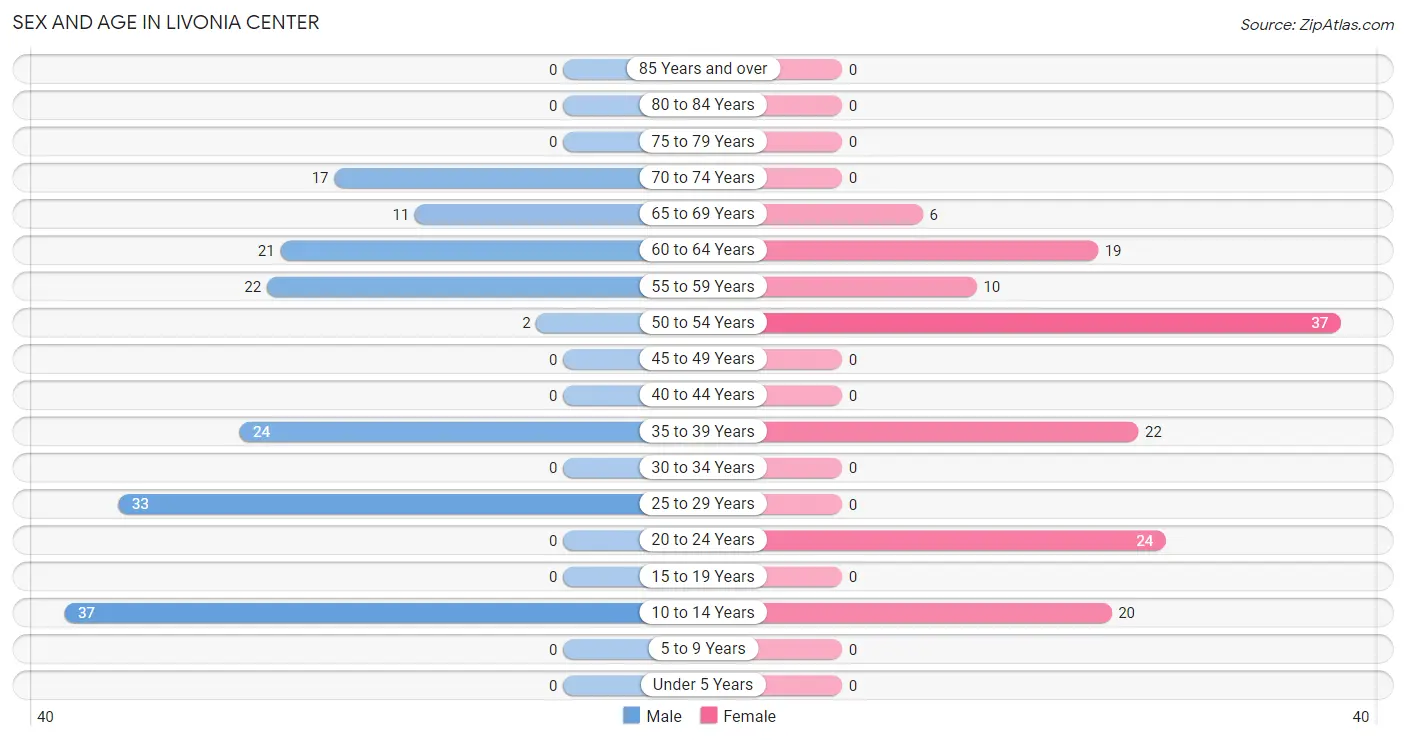
| Age Bracket | Male | Female |
| Under 5 Years | 0 (0.0%) | 0 (0.0%) |
| 5 to 9 Years | 0 (0.0%) | 0 (0.0%) |
| 10 to 14 Years | 37 (22.2%) | 20 (14.5%) |
| 15 to 19 Years | 0 (0.0%) | 0 (0.0%) |
| 20 to 24 Years | 0 (0.0%) | 24 (17.4%) |
| 25 to 29 Years | 33 (19.8%) | 0 (0.0%) |
| 30 to 34 Years | 0 (0.0%) | 0 (0.0%) |
| 35 to 39 Years | 24 (14.4%) | 22 (15.9%) |
| 40 to 44 Years | 0 (0.0%) | 0 (0.0%) |
| 45 to 49 Years | 0 (0.0%) | 0 (0.0%) |
| 50 to 54 Years | 2 (1.2%) | 37 (26.8%) |
| 55 to 59 Years | 22 (13.2%) | 10 (7.2%) |
| 60 to 64 Years | 21 (12.6%) | 19 (13.8%) |
| 65 to 69 Years | 11 (6.6%) | 6 (4.3%) |
| 70 to 74 Years | 17 (10.2%) | 0 (0.0%) |
| 75 to 79 Years | 0 (0.0%) | 0 (0.0%) |
| 80 to 84 Years | 0 (0.0%) | 0 (0.0%) |
| 85 Years and over | 0 (0.0%) | 0 (0.0%) |
| Total | 167 (100.0%) | 138 (100.0%) |
Families and Households in Livonia Center
Median Family Size in Livonia Center
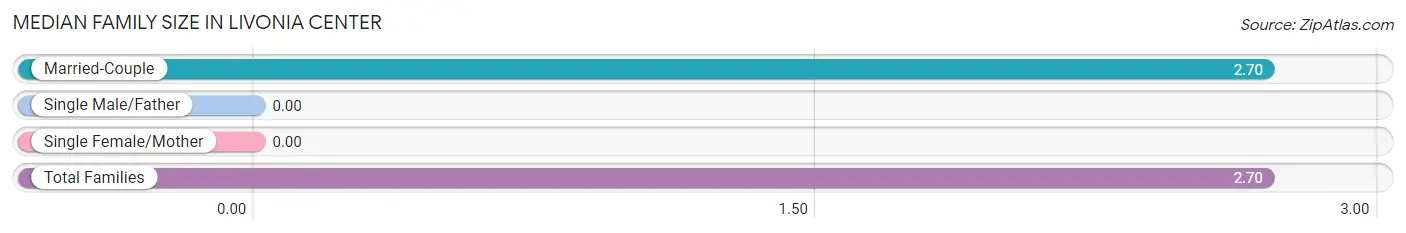
| Family Type | # Families | Family Size |
| Married-Couple | 64 (100.0%) | 2.70 |
| Single Male/Father | 0 (0.0%) | - |
| Single Female/Mother | 0 (0.0%) | - |
| Total Families | 64 (100.0%) | 2.70 |
Median Household Size in Livonia Center
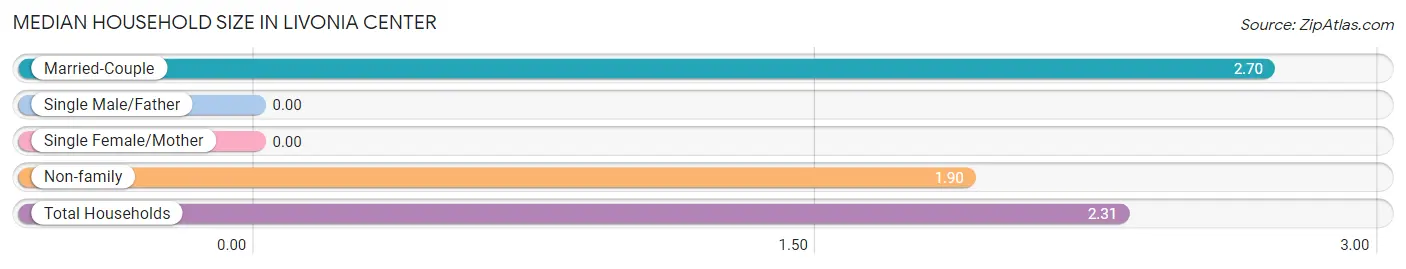
| Household Type | # Households | Household Size |
| Married-Couple | 64 (50.8%) | 2.70 |
| Single Male/Father | 0 (0.0%) | - |
| Single Female/Mother | 0 (0.0%) | - |
| Non-family | 62 (49.2%) | 1.90 |
| Total Households | 126 (100.0%) | 2.31 |
Household Size by Marriage Status in Livonia Center
Out of a total of 126 households in Livonia Center, 64 (50.8%) are family households, while 62 (49.2%) are nonfamily households. The most numerous type of family households are 2-person households, comprising 45, and the most common type of nonfamily households are 2-person households, comprising 30.
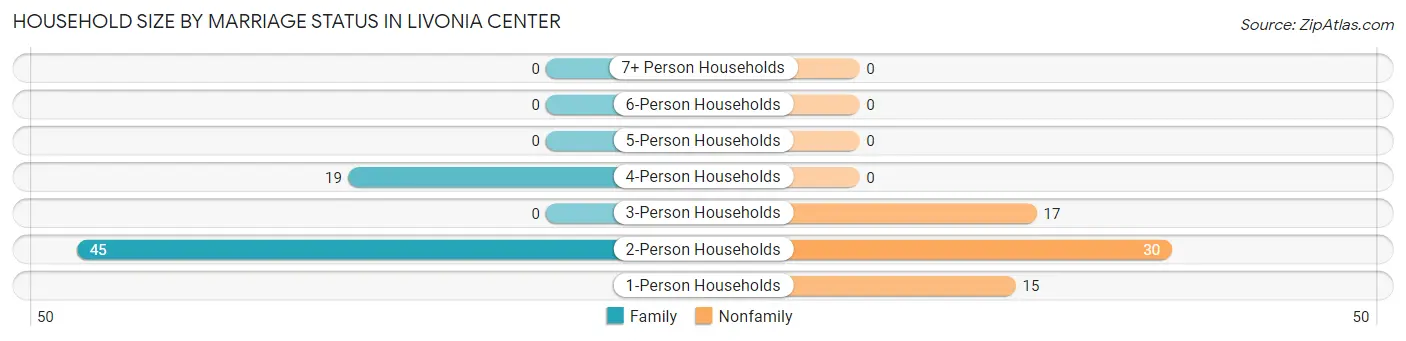
| Household Size | Family Households | Nonfamily Households |
| 1-Person Households | - | 15 (11.9%) |
| 2-Person Households | 45 (35.7%) | 30 (23.8%) |
| 3-Person Households | 0 (0.0%) | 17 (13.5%) |
| 4-Person Households | 19 (15.1%) | 0 (0.0%) |
| 5-Person Households | 0 (0.0%) | 0 (0.0%) |
| 6-Person Households | 0 (0.0%) | 0 (0.0%) |
| 7+ Person Households | 0 (0.0%) | 0 (0.0%) |
| Total | 64 (50.8%) | 62 (49.2%) |
Female Fertility in Livonia Center
Fertility by Age in Livonia Center
| Age Bracket | Women with Births | Births / 1,000 Women |
| 15 to 19 years | 0 (0.0%) | 0.0 |
| 20 to 34 years | 0 (0.0%) | 0.0 |
| 35 to 50 years | 0 (0.0%) | 0.0 |
| Total | 0 (0.0%) | 0.0 |
Fertility by Age by Marriage Status in Livonia Center
| Age Bracket | Married | Unmarried |
| 15 to 19 years | 0 (0.0%) | 0 (0.0%) |
| 20 to 34 years | 0 (0.0%) | 0 (0.0%) |
| 35 to 50 years | 0 (0.0%) | 0 (0.0%) |
| Total | 0 (0.0%) | 0 (0.0%) |
Fertility by Education in Livonia Center
| Educational Attainment | Women with Births | Births / 1,000 Women |
| Less than High School | 0 (0.0%) | 0.0 |
| High School Diploma | 0 (0.0%) | 0.0 |
| College or Associate's Degree | 0 (0.0%) | 0.0 |
| Bachelor's Degree | 0 (0.0%) | 0.0 |
| Graduate Degree | 0 (0.0%) | 0.0 |
| Total | 0 (0.0%) | 0.0 |
Fertility by Education by Marriage Status in Livonia Center
| Educational Attainment | Married | Unmarried |
| Less than High School | 0 (0.0%) | 0 (0.0%) |
| High School Diploma | 0 (0.0%) | 0 (0.0%) |
| College or Associate's Degree | 0 (0.0%) | 0 (0.0%) |
| Bachelor's Degree | 0 (0.0%) | 0 (0.0%) |
| Graduate Degree | 0 (0.0%) | 0 (0.0%) |
| Total | 0 (0.0%) | 0 (0.0%) |
Employment Characteristics in Livonia Center
Employment by Class of Employer in Livonia Center
Among the 171 employed individuals in Livonia Center, private company employees (79 | 46.2%), not-for-profit organizations (57 | 33.3%), and self-employed (incorporated) (18 | 10.5%) make up the most common classes of employment.
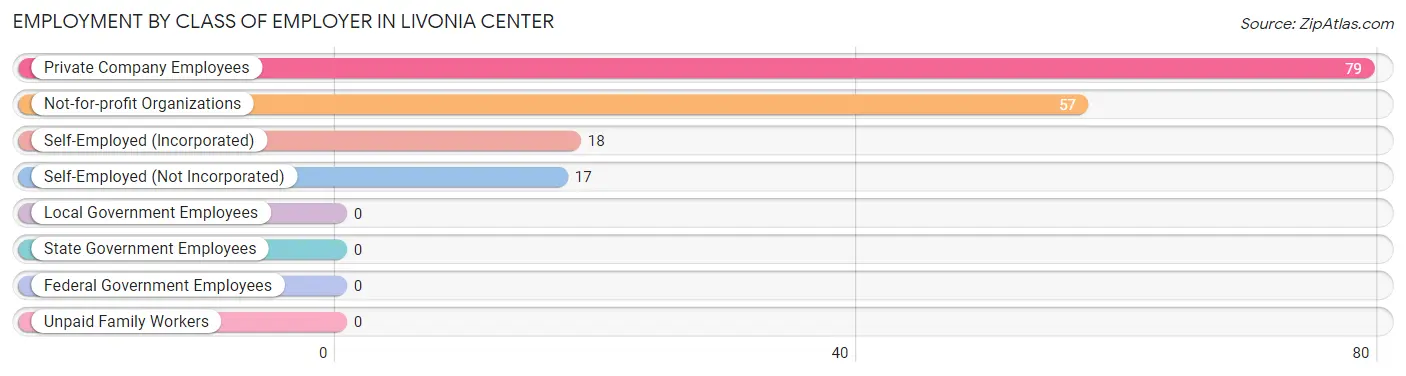
| Employer Class | # Employees | % Employees |
| Private Company Employees | 79 | 46.2% |
| Self-Employed (Incorporated) | 18 | 10.5% |
| Self-Employed (Not Incorporated) | 17 | 9.9% |
| Not-for-profit Organizations | 57 | 33.3% |
| Local Government Employees | 0 | 0.0% |
| State Government Employees | 0 | 0.0% |
| Federal Government Employees | 0 | 0.0% |
| Unpaid Family Workers | 0 | 0.0% |
| Total | 171 | 100.0% |
Employment Status by Age in Livonia Center
According to the labor force statistics for Livonia Center, out of the total population over 16 years of age (248), 83.1% or 206 individuals are in the labor force, with 14.6% or 30 of them unemployed. The age group with the highest labor force participation rate is 20 to 24 years, with 100.0% or 24 individuals in the labor force. Within the labor force, the 25 to 29 years age range has the highest percentage of unemployed individuals, with 100.0% or 30 of them being unemployed.
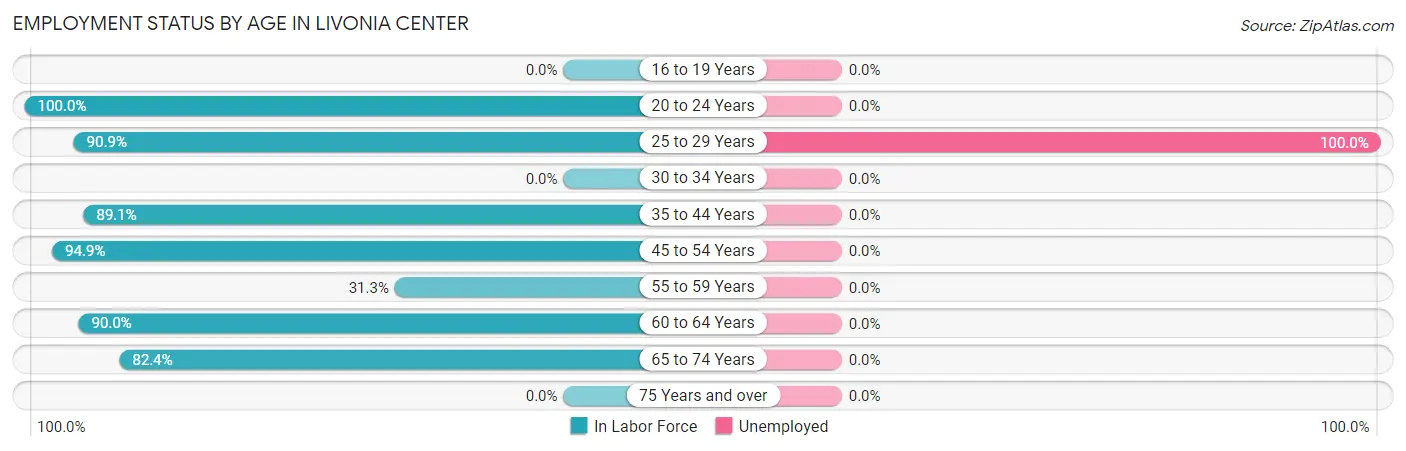
| Age Bracket | In Labor Force | Unemployed |
| 16 to 19 Years | 0 (0.0%) | 0 (0.0%) |
| 20 to 24 Years | 24 (100.0%) | 0 (0.0%) |
| 25 to 29 Years | 30 (90.9%) | 30 (100.0%) |
| 30 to 34 Years | 0 (0.0%) | 0 (0.0%) |
| 35 to 44 Years | 41 (89.1%) | 0 (0.0%) |
| 45 to 54 Years | 37 (94.9%) | 0 (0.0%) |
| 55 to 59 Years | 10 (31.3%) | 0 (0.0%) |
| 60 to 64 Years | 36 (90.0%) | 0 (0.0%) |
| 65 to 74 Years | 28 (82.4%) | 0 (0.0%) |
| 75 Years and over | 0 (0.0%) | 0 (0.0%) |
| Total | 206 (83.1%) | 30 (14.6%) |
Employment Status by Educational Attainment in Livonia Center
According to labor force statistics for Livonia Center, 81.1% of individuals (154) out of the total population between 25 and 64 years of age (190) are in the labor force, with 19.5% or 30 of them being unemployed. The group with the highest labor force participation rate are those with the educational attainment of college / associate degree, with 100.0% or 65 individuals in the labor force. Within the labor force, individuals with college / associate degree education have the highest percentage of unemployment, with 46.2% or 30 of them being unemployed.
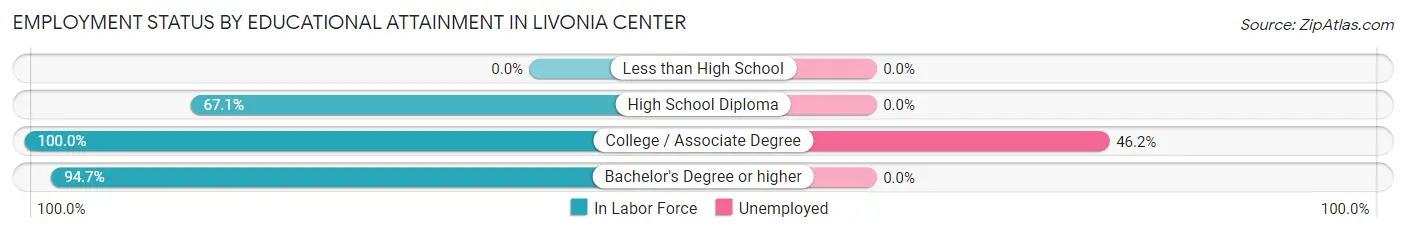
| Educational Attainment | In Labor Force | Unemployed |
| Less than High School | 0 (0.0%) | 0 (0.0%) |
| High School Diploma | 53 (67.1%) | 0 (0.0%) |
| College / Associate Degree | 65 (100.0%) | 30 (46.2%) |
| Bachelor's Degree or higher | 36 (94.7%) | 0 (0.0%) |
| Total | 154 (81.1%) | 37 (19.5%) |
Employment Occupations by Sex in Livonia Center
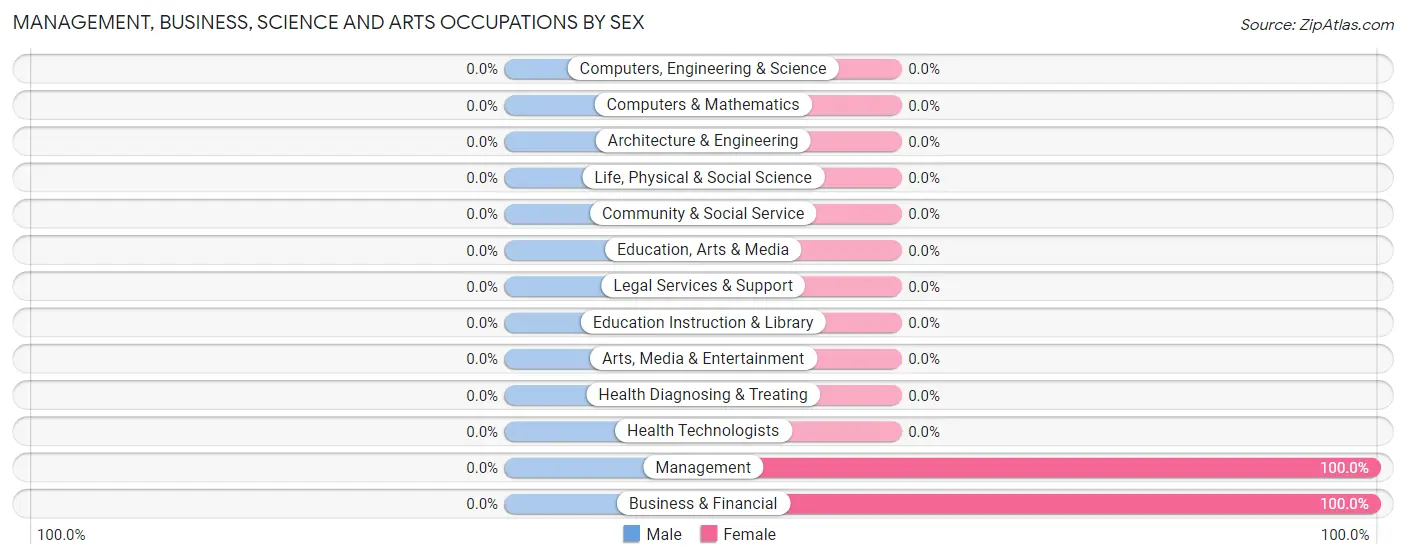
Management, Business, Science and Arts Occupations
The most common Management, Business, Science and Arts occupations in Livonia Center are Management (19 | 10.8%), and Business & Financial (10 | 5.7%).
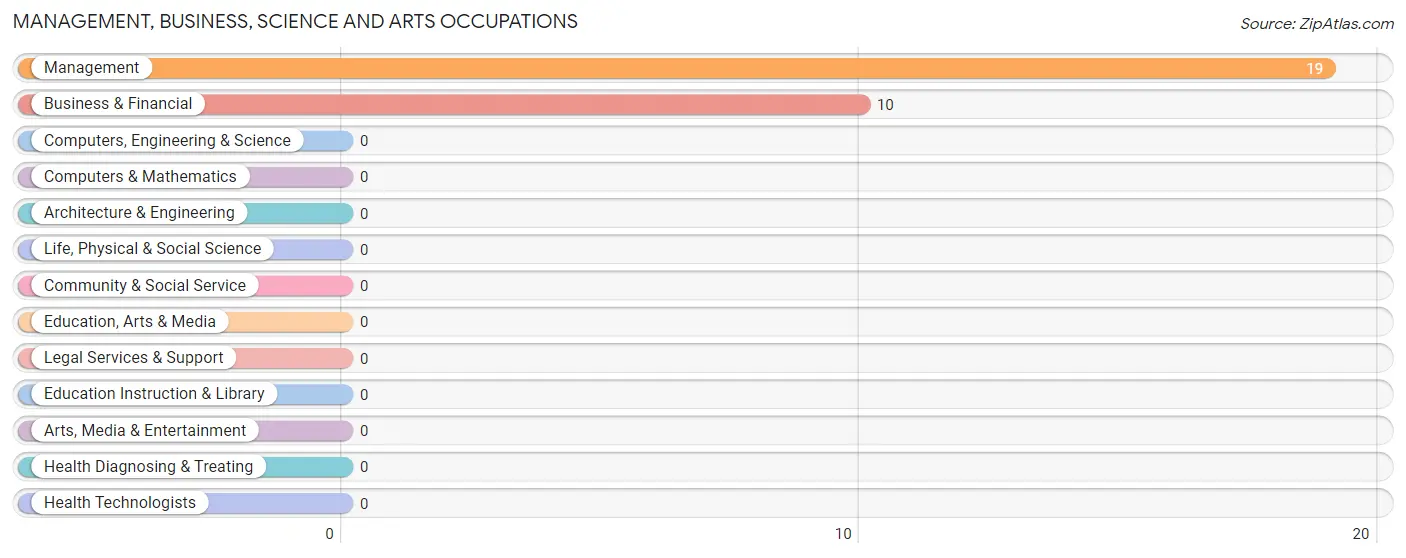
Management, Business, Science and Arts Occupations by Sex
| Occupation | Male | Female |
| Management | 0 (0.0%) | 19 (100.0%) |
| Business & Financial | 0 (0.0%) | 10 (100.0%) |
| Computers, Engineering & Science | 0 (0.0%) | 0 (0.0%) |
| Computers & Mathematics | 0 (0.0%) | 0 (0.0%) |
| Architecture & Engineering | 0 (0.0%) | 0 (0.0%) |
| Life, Physical & Social Science | 0 (0.0%) | 0 (0.0%) |
| Community & Social Service | 0 (0.0%) | 0 (0.0%) |
| Education, Arts & Media | 0 (0.0%) | 0 (0.0%) |
| Legal Services & Support | 0 (0.0%) | 0 (0.0%) |
| Education Instruction & Library | 0 (0.0%) | 0 (0.0%) |
| Arts, Media & Entertainment | 0 (0.0%) | 0 (0.0%) |
| Health Diagnosing & Treating | 0 (0.0%) | 0 (0.0%) |
| Health Technologists | 0 (0.0%) | 0 (0.0%) |
| Total (Category) | 0 (0.0%) | 29 (100.0%) |
| Total (Overall) | 62 (35.2%) | 114 (64.8%) |
Services Occupations
Services Occupations by Sex
| Occupation | Male | Female |
| Healthcare Support | 0 (0.0%) | 0 (0.0%) |
| Security & Protection | 0 (0.0%) | 0 (0.0%) |
| Firefighting & Prevention | 0 (0.0%) | 0 (0.0%) |
| Law Enforcement | 0 (0.0%) | 0 (0.0%) |
| Food Preparation & Serving | 0 (0.0%) | 0 (0.0%) |
| Cleaning & Maintenance | 0 (0.0%) | 0 (0.0%) |
| Personal Care & Service | 0 (0.0%) | 0 (0.0%) |
| Total (Category) | 0 (0.0%) | 0 (0.0%) |
| Total (Overall) | 62 (35.2%) | 114 (64.8%) |
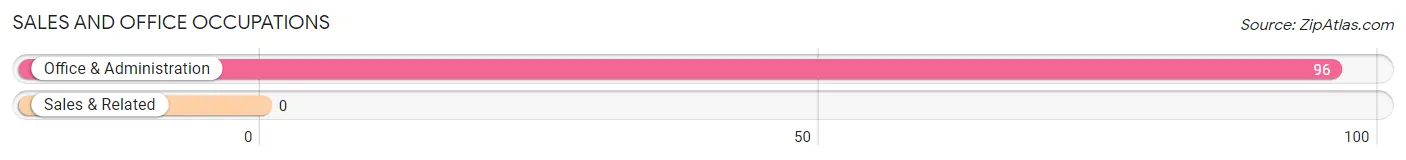
Sales and Office Occupations
The most common Sales and Office occupations in Livonia Center are , and Office & Administration (96 | 54.5%).
Sales and Office Occupations by Sex
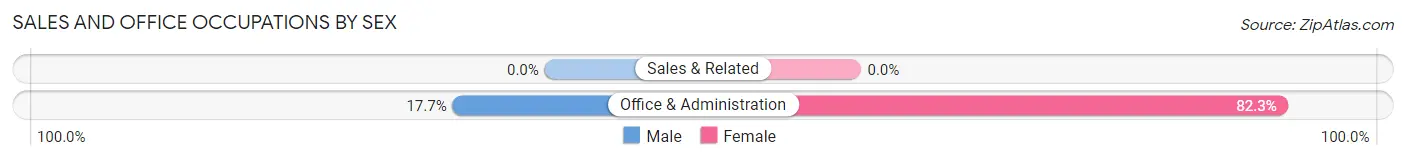
| Occupation | Male | Female |
| Sales & Related | 0 (0.0%) | 0 (0.0%) |
| Office & Administration | 17 (17.7%) | 79 (82.3%) |
| Total (Category) | 17 (17.7%) | 79 (82.3%) |
| Total (Overall) | 62 (35.2%) | 114 (64.8%) |
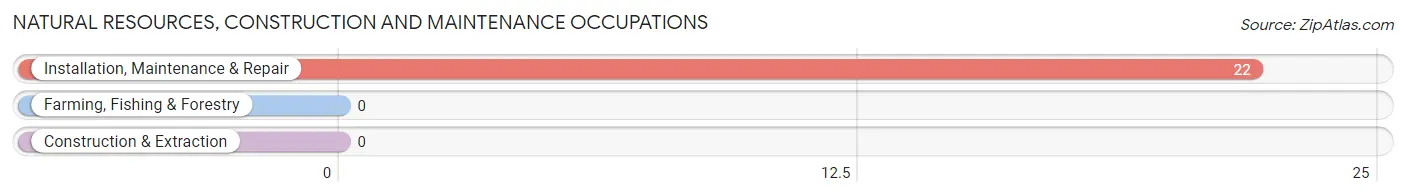
Natural Resources, Construction and Maintenance Occupations
The most common Natural Resources, Construction and Maintenance occupations in Livonia Center are , and Installation, Maintenance & Repair (22 | 12.5%).
Natural Resources, Construction and Maintenance Occupations by Sex
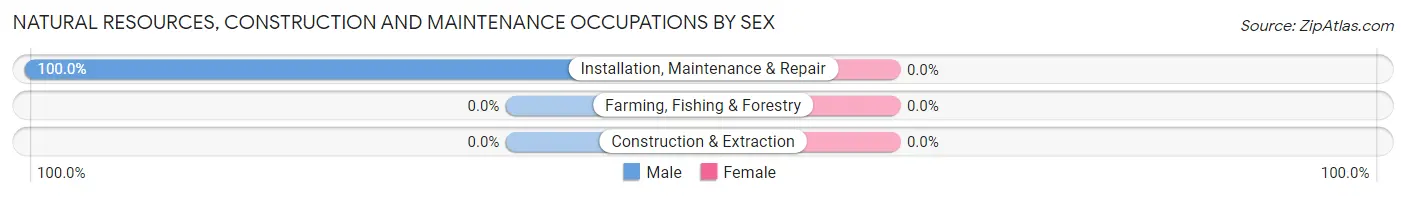
| Occupation | Male | Female |
| Farming, Fishing & Forestry | 0 (0.0%) | 0 (0.0%) |
| Construction & Extraction | 0 (0.0%) | 0 (0.0%) |
| Installation, Maintenance & Repair | 22 (100.0%) | 0 (0.0%) |
| Total (Category) | 22 (100.0%) | 0 (0.0%) |
| Total (Overall) | 62 (35.2%) | 114 (64.8%) |
Production, Transportation and Moving Occupations
The most common Production, Transportation and Moving occupations in Livonia Center are Production (24 | 13.6%), and Transportation (5 | 2.8%).
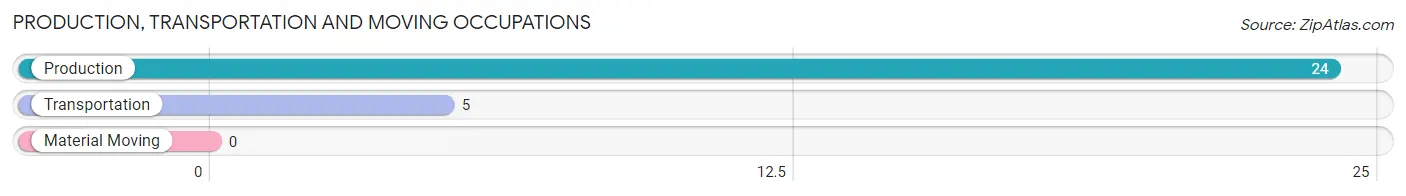
Production, Transportation and Moving Occupations by Sex
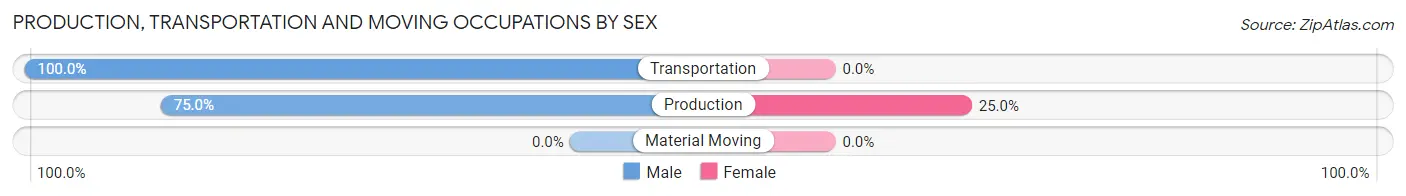
| Occupation | Male | Female |
| Production | 18 (75.0%) | 6 (25.0%) |
| Transportation | 5 (100.0%) | 0 (0.0%) |
| Material Moving | 0 (0.0%) | 0 (0.0%) |
| Total (Category) | 23 (79.3%) | 6 (20.7%) |
| Total (Overall) | 62 (35.2%) | 114 (64.8%) |
Employment Industries by Sex in Livonia Center
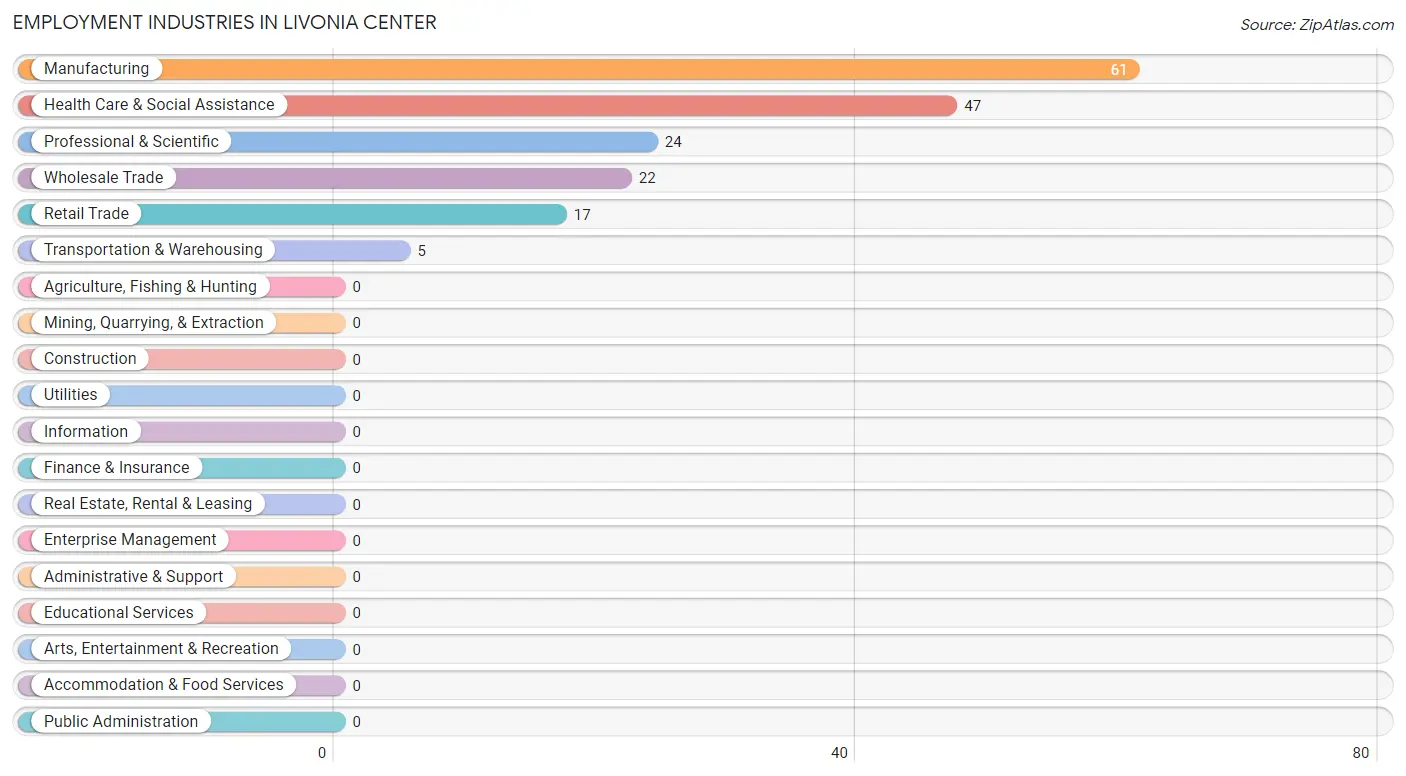
Employment Industries in Livonia Center
The major employment industries in Livonia Center include Manufacturing (61 | 34.7%), Health Care & Social Assistance (47 | 26.7%), Professional & Scientific (24 | 13.6%), Wholesale Trade (22 | 12.5%), and Retail Trade (17 | 9.7%).
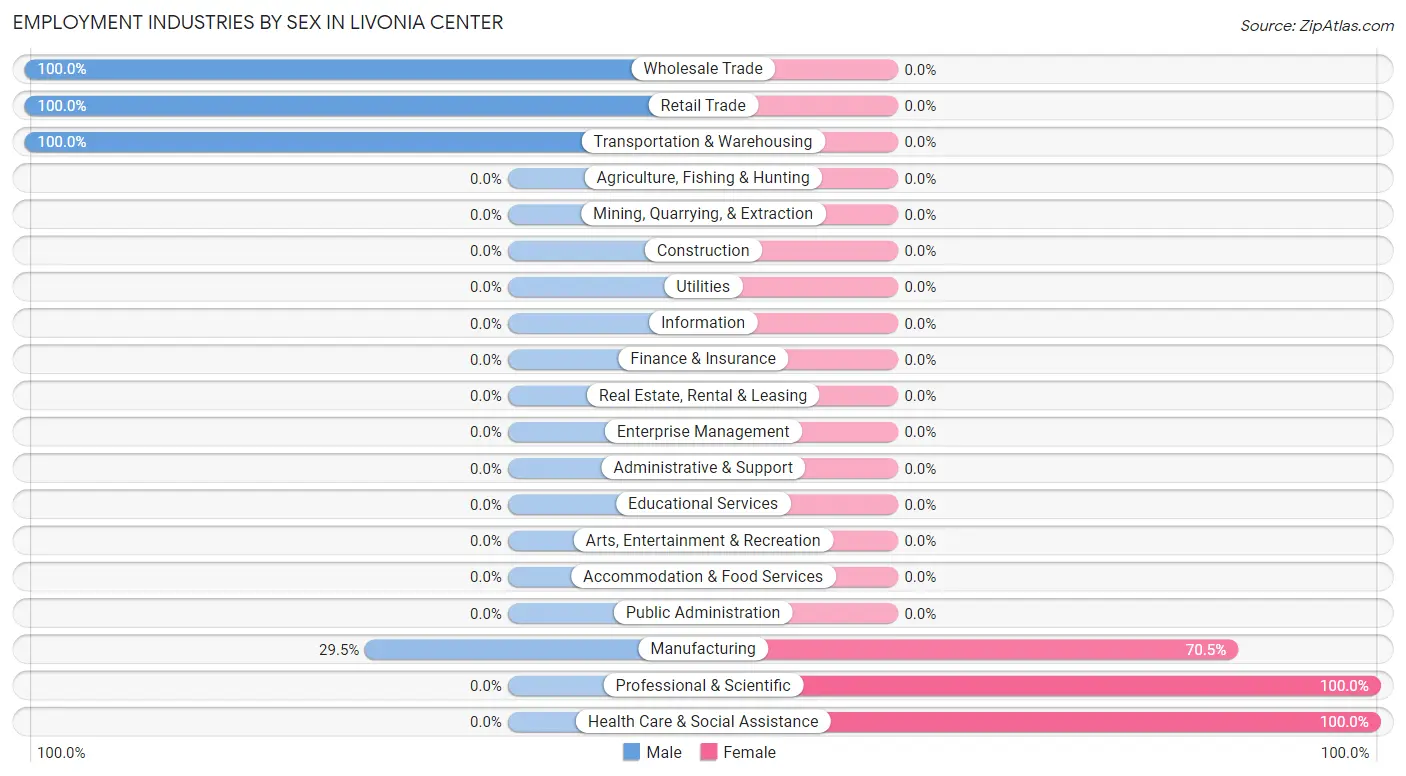
Employment Industries by Sex in Livonia Center
The Livonia Center industries that see more men than women are Wholesale Trade (100.0%), Retail Trade (100.0%), and Transportation & Warehousing (100.0%), whereas the industries that tend to have a higher number of women are Professional & Scientific (100.0%), Health Care & Social Assistance (100.0%), and Manufacturing (70.5%).
| Industry | Male | Female |
| Agriculture, Fishing & Hunting | 0 (0.0%) | 0 (0.0%) |
| Mining, Quarrying, & Extraction | 0 (0.0%) | 0 (0.0%) |
| Construction | 0 (0.0%) | 0 (0.0%) |
| Manufacturing | 18 (29.5%) | 43 (70.5%) |
| Wholesale Trade | 22 (100.0%) | 0 (0.0%) |
| Retail Trade | 17 (100.0%) | 0 (0.0%) |
| Transportation & Warehousing | 5 (100.0%) | 0 (0.0%) |
| Utilities | 0 (0.0%) | 0 (0.0%) |
| Information | 0 (0.0%) | 0 (0.0%) |
| Finance & Insurance | 0 (0.0%) | 0 (0.0%) |
| Real Estate, Rental & Leasing | 0 (0.0%) | 0 (0.0%) |
| Professional & Scientific | 0 (0.0%) | 24 (100.0%) |
| Enterprise Management | 0 (0.0%) | 0 (0.0%) |
| Administrative & Support | 0 (0.0%) | 0 (0.0%) |
| Educational Services | 0 (0.0%) | 0 (0.0%) |
| Health Care & Social Assistance | 0 (0.0%) | 47 (100.0%) |
| Arts, Entertainment & Recreation | 0 (0.0%) | 0 (0.0%) |
| Accommodation & Food Services | 0 (0.0%) | 0 (0.0%) |
| Public Administration | 0 (0.0%) | 0 (0.0%) |
| Total | 62 (35.2%) | 114 (64.8%) |
Education in Livonia Center
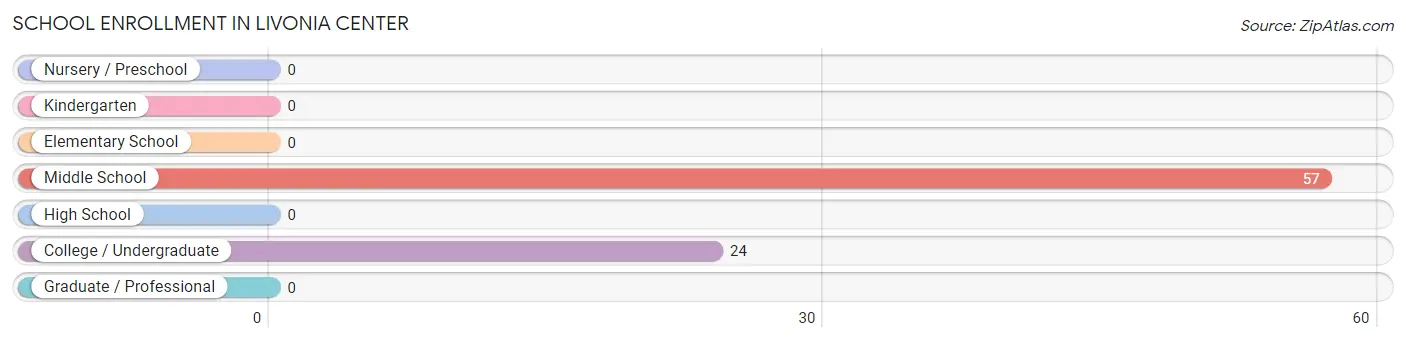
School Enrollment in Livonia Center
The most common levels of schooling among the 81 students in Livonia Center are middle school (57 | 70.4%), and college / undergraduate (24 | 29.6%).
| School Level | # Students | % Students |
| Nursery / Preschool | 0 | 0.0% |
| Kindergarten | 0 | 0.0% |
| Elementary School | 0 | 0.0% |
| Middle School | 57 | 70.4% |
| High School | 0 | 0.0% |
| College / Undergraduate | 24 | 29.6% |
| Graduate / Professional | 0 | 0.0% |
| Total | 81 | 100.0% |
School Enrollment by Age by Funding Source in Livonia Center
Out of a total of 81 students who are enrolled in schools in Livonia Center, 24 (29.6%) attend a private institution, while the remaining 57 (70.4%) are enrolled in public schools. The age group of 20 to 24 year olds has the highest likelihood of being enrolled in private schools, with 24 (100.0% in the age bracket) enrolled. Conversely, the age group of 10 to 14 year olds has the lowest likelihood of being enrolled in a private school, with 57 (100.0% in the age bracket) attending a public institution.
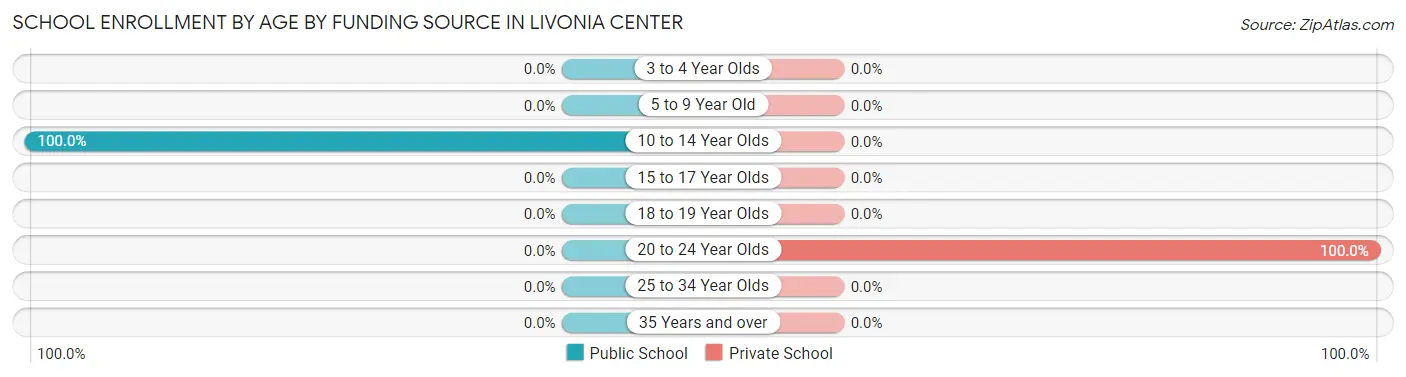
| Age Bracket | Public School | Private School |
| 3 to 4 Year Olds | 0 (0.0%) | 0 (0.0%) |
| 5 to 9 Year Old | 0 (0.0%) | 0 (0.0%) |
| 10 to 14 Year Olds | 57 (100.0%) | 0 (0.0%) |
| 15 to 17 Year Olds | 0 (0.0%) | 0 (0.0%) |
| 18 to 19 Year Olds | 0 (0.0%) | 0 (0.0%) |
| 20 to 24 Year Olds | 0 (0.0%) | 24 (100.0%) |
| 25 to 34 Year Olds | 0 (0.0%) | 0 (0.0%) |
| 35 Years and over | 0 (0.0%) | 0 (0.0%) |
| Total | 57 (70.4%) | 24 (29.6%) |
Educational Attainment by Field of Study in Livonia Center
Business (18 | 32.7%), arts & humanities (18 | 32.7%), education (17 | 30.9%), and liberal arts & history (2 | 3.6%) are the most common fields of study among 55 individuals in Livonia Center who have obtained a bachelor's degree or higher.
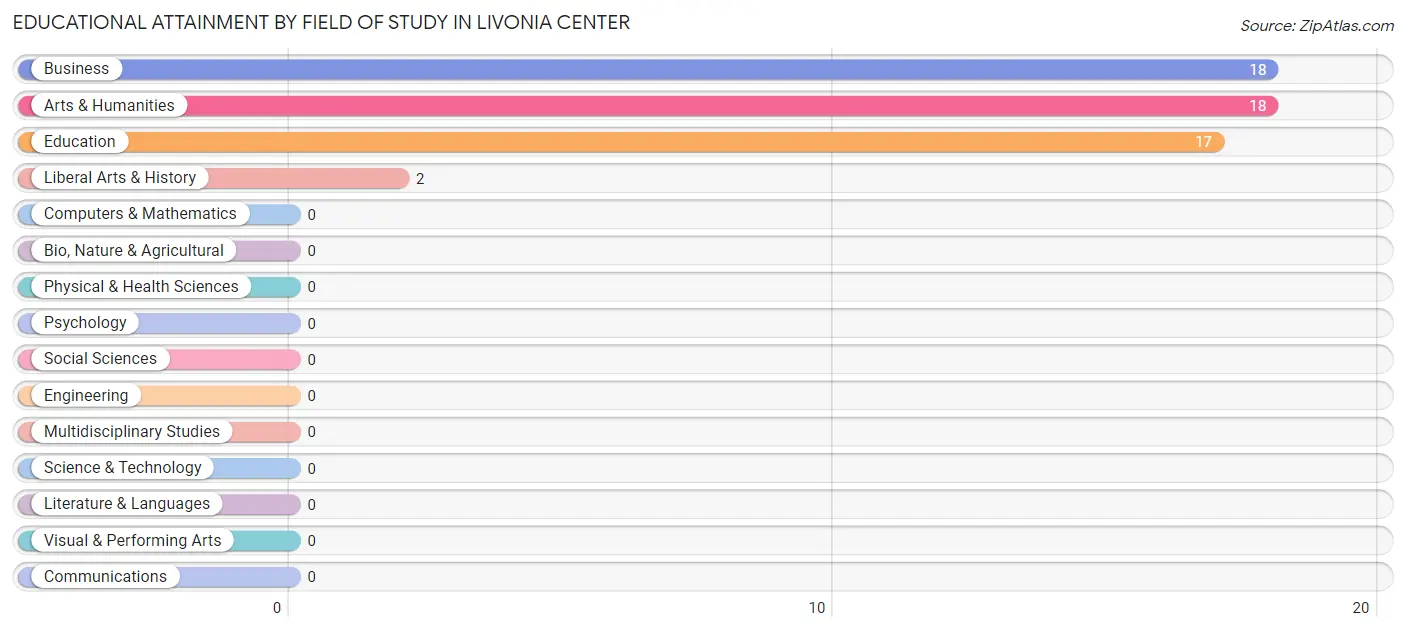
| Field of Study | # Graduates | % Graduates |
| Computers & Mathematics | 0 | 0.0% |
| Bio, Nature & Agricultural | 0 | 0.0% |
| Physical & Health Sciences | 0 | 0.0% |
| Psychology | 0 | 0.0% |
| Social Sciences | 0 | 0.0% |
| Engineering | 0 | 0.0% |
| Multidisciplinary Studies | 0 | 0.0% |
| Science & Technology | 0 | 0.0% |
| Business | 18 | 32.7% |
| Education | 17 | 30.9% |
| Literature & Languages | 0 | 0.0% |
| Liberal Arts & History | 2 | 3.6% |
| Visual & Performing Arts | 0 | 0.0% |
| Communications | 0 | 0.0% |
| Arts & Humanities | 18 | 32.7% |
| Total | 55 | 100.0% |
Transportation & Commute in Livonia Center
Vehicle Availability by Sex in Livonia Center
The most prevalent vehicle ownership categories in Livonia Center are males with 2 vehicles (40, accounting for 70.2%) and females with 2 vehicles (74, making up 35.1%).
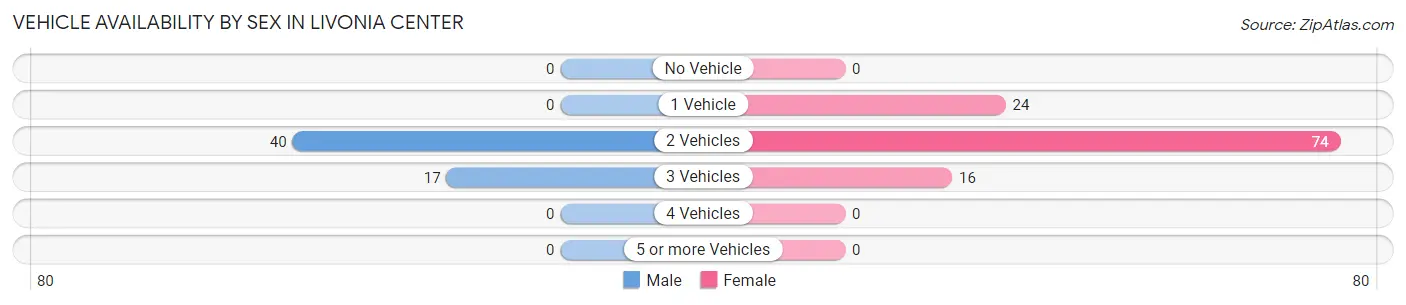
| Vehicles Available | Male | Female |
| No Vehicle | 0 (0.0%) | 0 (0.0%) |
| 1 Vehicle | 0 (0.0%) | 24 (21.0%) |
| 2 Vehicles | 40 (70.2%) | 74 (64.9%) |
| 3 Vehicles | 17 (29.8%) | 16 (14.0%) |
| 4 Vehicles | 0 (0.0%) | 0 (0.0%) |
| 5 or more Vehicles | 0 (0.0%) | 0 (0.0%) |
| Total | 57 (100.0%) | 114 (100.0%) |
Commute Time in Livonia Center
The most frequently occuring commute durations in Livonia Center are 5 to 9 minutes (33 commuters, 24.4%), 30 to 34 minutes (27 commuters, 20.0%), and 25 to 29 minutes (24 commuters, 17.8%).
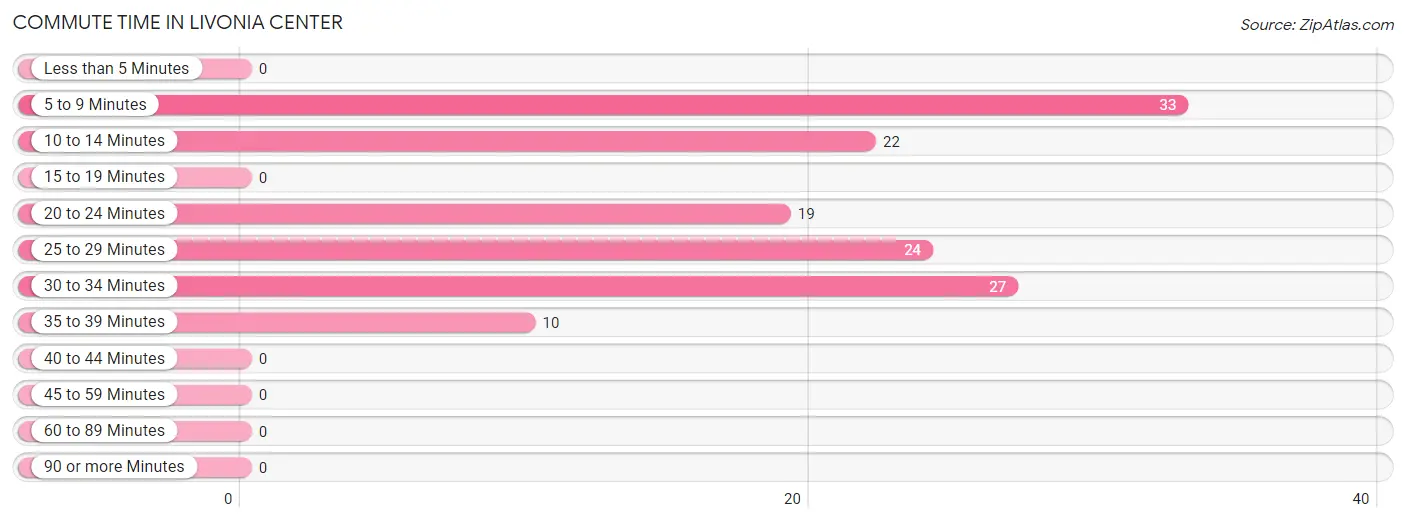
| Commute Time | # Commuters | % Commuters |
| Less than 5 Minutes | 0 | 0.0% |
| 5 to 9 Minutes | 33 | 24.4% |
| 10 to 14 Minutes | 22 | 16.3% |
| 15 to 19 Minutes | 0 | 0.0% |
| 20 to 24 Minutes | 19 | 14.1% |
| 25 to 29 Minutes | 24 | 17.8% |
| 30 to 34 Minutes | 27 | 20.0% |
| 35 to 39 Minutes | 10 | 7.4% |
| 40 to 44 Minutes | 0 | 0.0% |
| 45 to 59 Minutes | 0 | 0.0% |
| 60 to 89 Minutes | 0 | 0.0% |
| 90 or more Minutes | 0 | 0.0% |
Commute Time by Sex in Livonia Center
The most common commute times in Livonia Center are 10 to 14 minutes (22 commuters, 56.4%) for males and 30 to 34 minutes (27 commuters, 28.1%) for females.
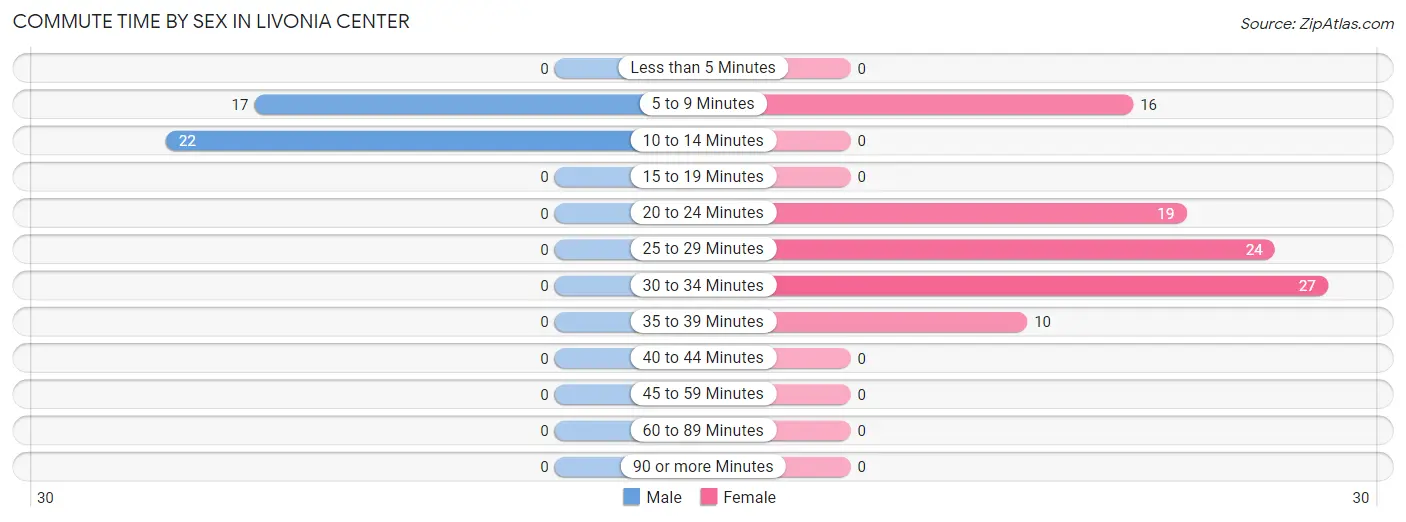
| Commute Time | Male | Female |
| Less than 5 Minutes | 0 (0.0%) | 0 (0.0%) |
| 5 to 9 Minutes | 17 (43.6%) | 16 (16.7%) |
| 10 to 14 Minutes | 22 (56.4%) | 0 (0.0%) |
| 15 to 19 Minutes | 0 (0.0%) | 0 (0.0%) |
| 20 to 24 Minutes | 0 (0.0%) | 19 (19.8%) |
| 25 to 29 Minutes | 0 (0.0%) | 24 (25.0%) |
| 30 to 34 Minutes | 0 (0.0%) | 27 (28.1%) |
| 35 to 39 Minutes | 0 (0.0%) | 10 (10.4%) |
| 40 to 44 Minutes | 0 (0.0%) | 0 (0.0%) |
| 45 to 59 Minutes | 0 (0.0%) | 0 (0.0%) |
| 60 to 89 Minutes | 0 (0.0%) | 0 (0.0%) |
| 90 or more Minutes | 0 (0.0%) | 0 (0.0%) |
Time of Departure to Work by Sex in Livonia Center
The most frequent times of departure to work in Livonia Center are 7:30 AM to 7:59 AM (22, 56.4%) for males and 6:30 AM to 6:59 AM (27, 28.1%) for females.
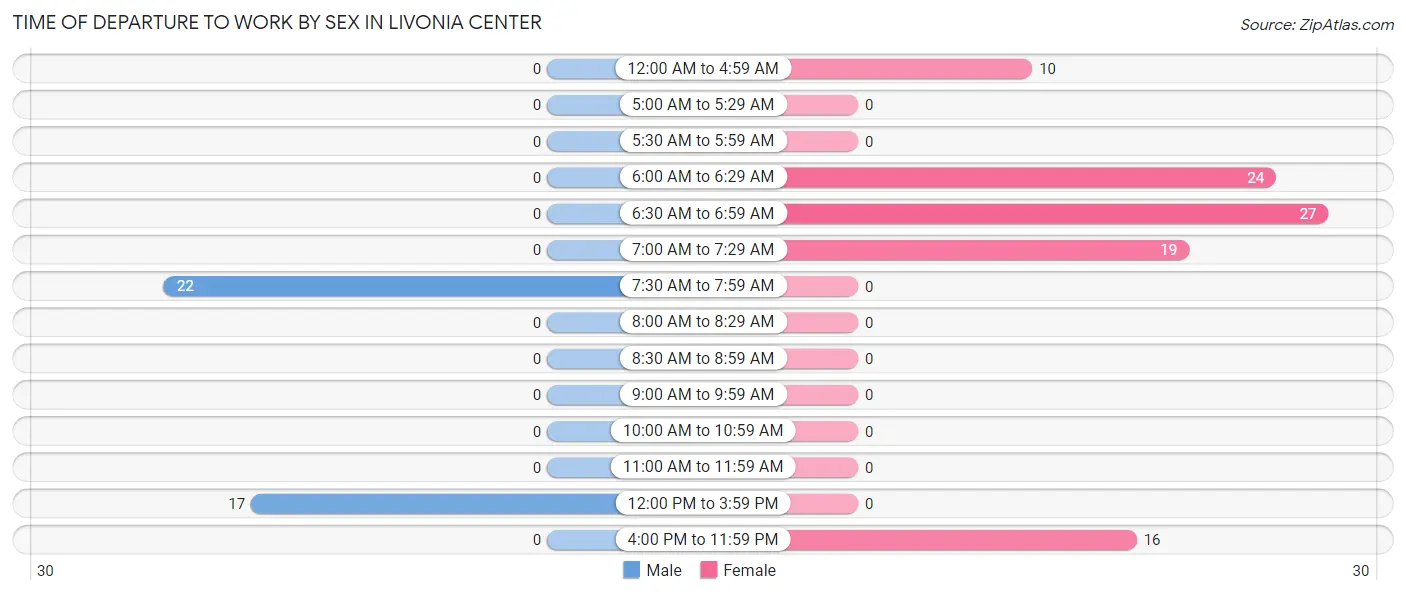
| Time of Departure | Male | Female |
| 12:00 AM to 4:59 AM | 0 (0.0%) | 10 (10.4%) |
| 5:00 AM to 5:29 AM | 0 (0.0%) | 0 (0.0%) |
| 5:30 AM to 5:59 AM | 0 (0.0%) | 0 (0.0%) |
| 6:00 AM to 6:29 AM | 0 (0.0%) | 24 (25.0%) |
| 6:30 AM to 6:59 AM | 0 (0.0%) | 27 (28.1%) |
| 7:00 AM to 7:29 AM | 0 (0.0%) | 19 (19.8%) |
| 7:30 AM to 7:59 AM | 22 (56.4%) | 0 (0.0%) |
| 8:00 AM to 8:29 AM | 0 (0.0%) | 0 (0.0%) |
| 8:30 AM to 8:59 AM | 0 (0.0%) | 0 (0.0%) |
| 9:00 AM to 9:59 AM | 0 (0.0%) | 0 (0.0%) |
| 10:00 AM to 10:59 AM | 0 (0.0%) | 0 (0.0%) |
| 11:00 AM to 11:59 AM | 0 (0.0%) | 0 (0.0%) |
| 12:00 PM to 3:59 PM | 17 (43.6%) | 0 (0.0%) |
| 4:00 PM to 11:59 PM | 0 (0.0%) | 16 (16.7%) |
| Total | 39 (100.0%) | 96 (100.0%) |
Housing Occupancy in Livonia Center
Occupancy by Ownership in Livonia Center
Of the total 126 dwellings in Livonia Center, owner-occupied units account for 105 (83.3%), while renter-occupied units make up 21 (16.7%).
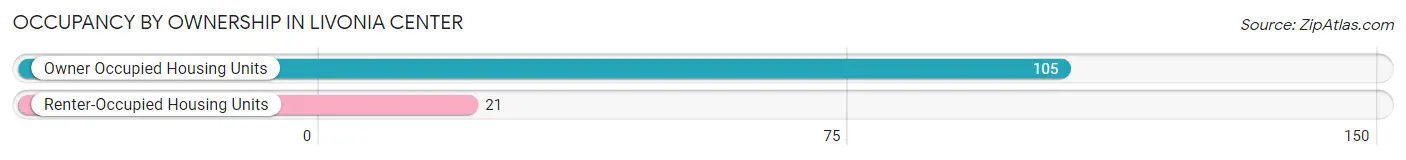
| Occupancy | # Housing Units | % Housing Units |
| Owner Occupied Housing Units | 105 | 83.3% |
| Renter-Occupied Housing Units | 21 | 16.7% |
| Total Occupied Housing Units | 126 | 100.0% |
Occupancy by Household Size in Livonia Center
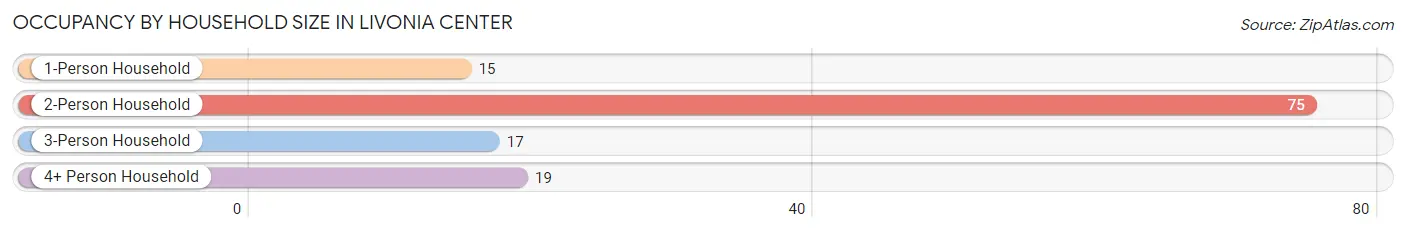
| Household Size | # Housing Units | % Housing Units |
| 1-Person Household | 15 | 11.9% |
| 2-Person Household | 75 | 59.5% |
| 3-Person Household | 17 | 13.5% |
| 4+ Person Household | 19 | 15.1% |
| Total Housing Units | 126 | 100.0% |
Occupancy by Ownership by Household Size in Livonia Center
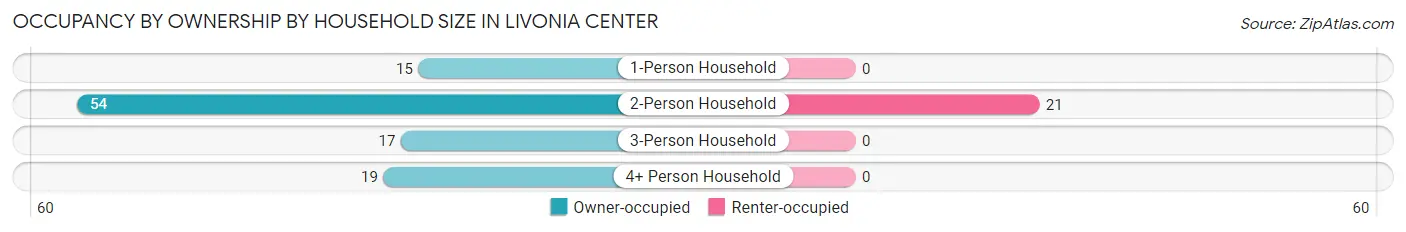
| Household Size | Owner-occupied | Renter-occupied |
| 1-Person Household | 15 (100.0%) | 0 (0.0%) |
| 2-Person Household | 54 (72.0%) | 21 (28.0%) |
| 3-Person Household | 17 (100.0%) | 0 (0.0%) |
| 4+ Person Household | 19 (100.0%) | 0 (0.0%) |
| Total Housing Units | 105 (83.3%) | 21 (16.7%) |
Occupancy by Educational Attainment in Livonia Center
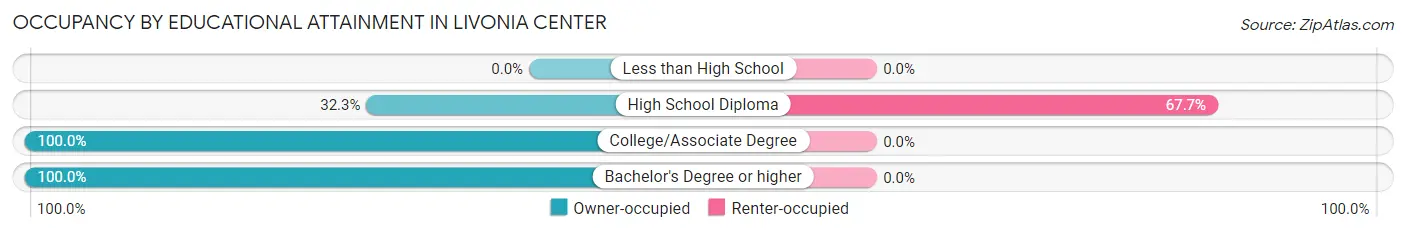
| Household Size | Owner-occupied | Renter-occupied |
| Less than High School | 0 (0.0%) | 0 (0.0%) |
| High School Diploma | 10 (32.3%) | 21 (67.7%) |
| College/Associate Degree | 60 (100.0%) | 0 (0.0%) |
| Bachelor's Degree or higher | 35 (100.0%) | 0 (0.0%) |
Occupancy by Age of Householder in Livonia Center
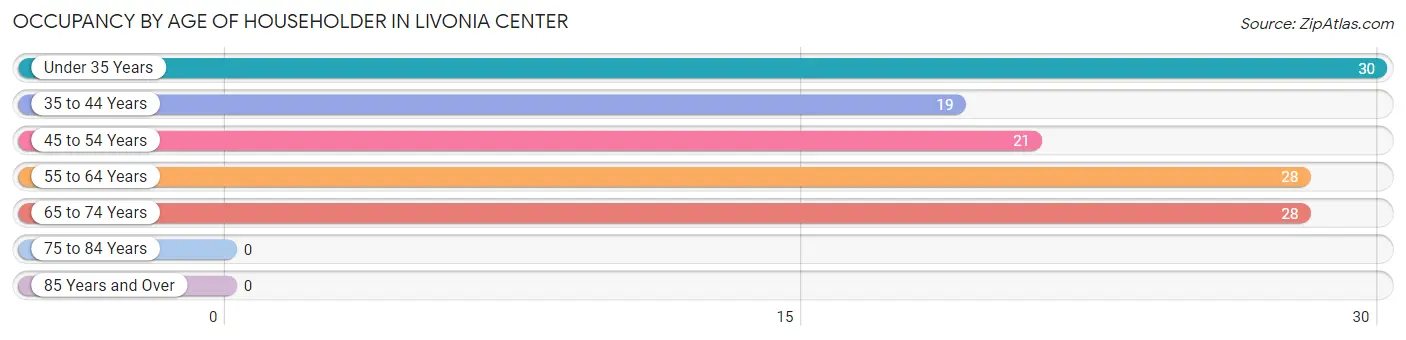
| Age Bracket | # Households | % Households |
| Under 35 Years | 30 | 23.8% |
| 35 to 44 Years | 19 | 15.1% |
| 45 to 54 Years | 21 | 16.7% |
| 55 to 64 Years | 28 | 22.2% |
| 65 to 74 Years | 28 | 22.2% |
| 75 to 84 Years | 0 | 0.0% |
| 85 Years and Over | 0 | 0.0% |
| Total | 126 | 100.0% |
Housing Finances in Livonia Center
Median Income by Occupancy in Livonia Center
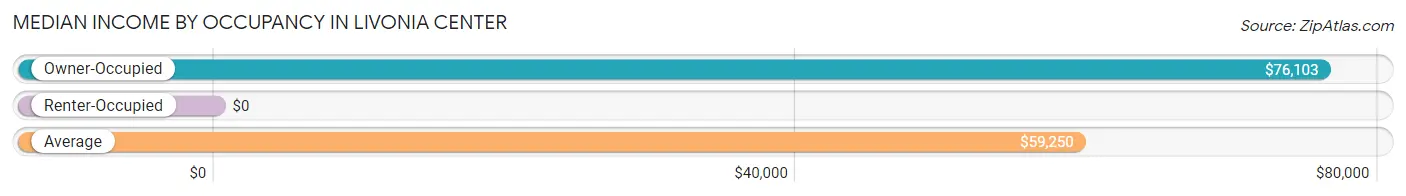
| Occupancy Type | # Households | Median Income |
| Owner-Occupied | 105 (83.3%) | $76,103 |
| Renter-Occupied | 21 (16.7%) | $0 |
| Average | 126 (100.0%) | $59,250 |
Occupancy by Householder Income Bracket in Livonia Center
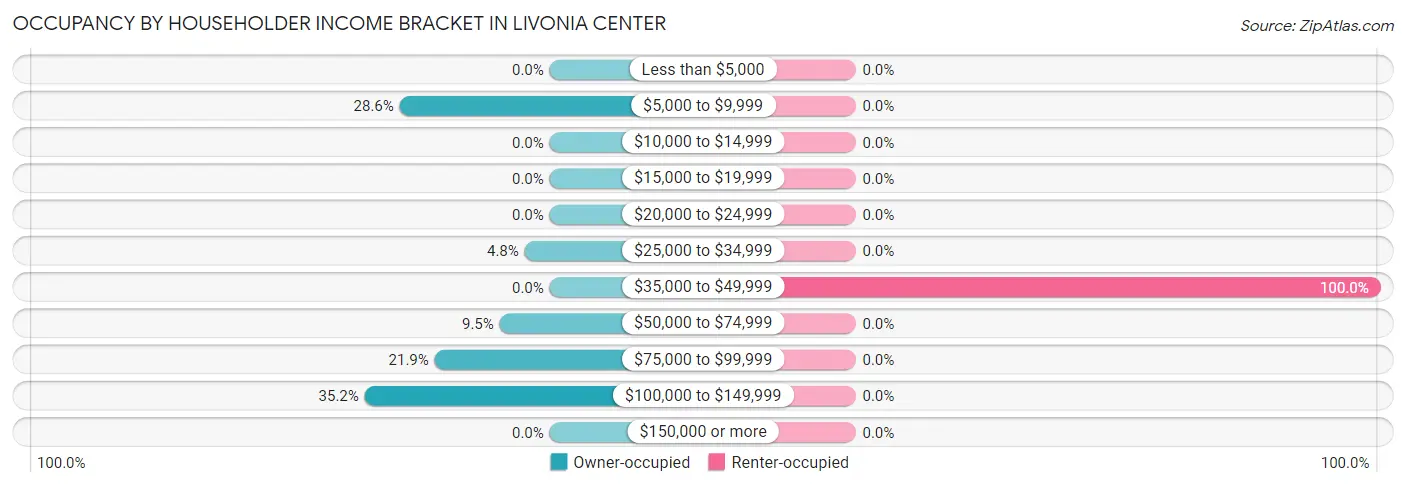
| Income Bracket | Owner-occupied | Renter-occupied |
| Less than $5,000 | 0 (0.0%) | 0 (0.0%) |
| $5,000 to $9,999 | 30 (28.6%) | 0 (0.0%) |
| $10,000 to $14,999 | 0 (0.0%) | 0 (0.0%) |
| $15,000 to $19,999 | 0 (0.0%) | 0 (0.0%) |
| $20,000 to $24,999 | 0 (0.0%) | 0 (0.0%) |
| $25,000 to $34,999 | 5 (4.8%) | 0 (0.0%) |
| $35,000 to $49,999 | 0 (0.0%) | 21 (100.0%) |
| $50,000 to $74,999 | 10 (9.5%) | 0 (0.0%) |
| $75,000 to $99,999 | 23 (21.9%) | 0 (0.0%) |
| $100,000 to $149,999 | 37 (35.2%) | 0 (0.0%) |
| $150,000 or more | 0 (0.0%) | 0 (0.0%) |
| Total | 105 (100.0%) | 21 (100.0%) |
Monthly Housing Cost Tiers in Livonia Center
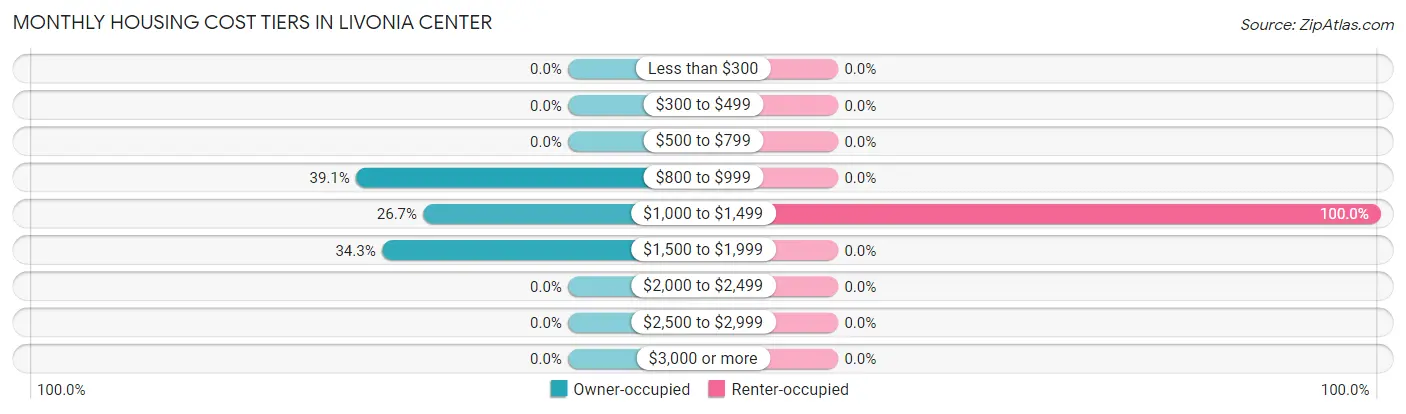
| Monthly Cost | Owner-occupied | Renter-occupied |
| Less than $300 | 0 (0.0%) | 0 (0.0%) |
| $300 to $499 | 0 (0.0%) | 0 (0.0%) |
| $500 to $799 | 0 (0.0%) | 0 (0.0%) |
| $800 to $999 | 41 (39.1%) | 0 (0.0%) |
| $1,000 to $1,499 | 28 (26.7%) | 21 (100.0%) |
| $1,500 to $1,999 | 36 (34.3%) | 0 (0.0%) |
| $2,000 to $2,499 | 0 (0.0%) | 0 (0.0%) |
| $2,500 to $2,999 | 0 (0.0%) | 0 (0.0%) |
| $3,000 or more | 0 (0.0%) | 0 (0.0%) |
| Total | 105 (100.0%) | 21 (100.0%) |
Physical Housing Characteristics in Livonia Center
Housing Structures in Livonia Center
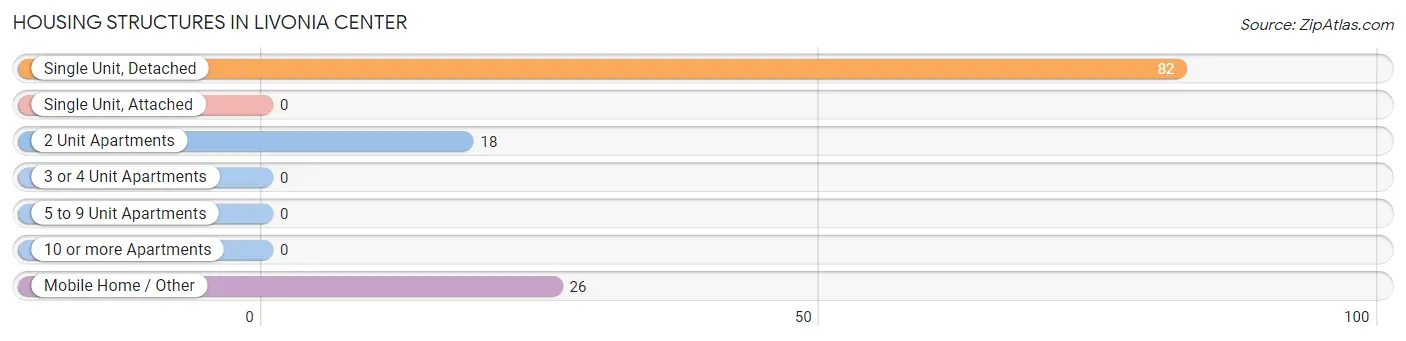
| Structure Type | # Housing Units | % Housing Units |
| Single Unit, Detached | 82 | 65.1% |
| Single Unit, Attached | 0 | 0.0% |
| 2 Unit Apartments | 18 | 14.3% |
| 3 or 4 Unit Apartments | 0 | 0.0% |
| 5 to 9 Unit Apartments | 0 | 0.0% |
| 10 or more Apartments | 0 | 0.0% |
| Mobile Home / Other | 26 | 20.6% |
| Total | 126 | 100.0% |
Housing Structures by Occupancy in Livonia Center
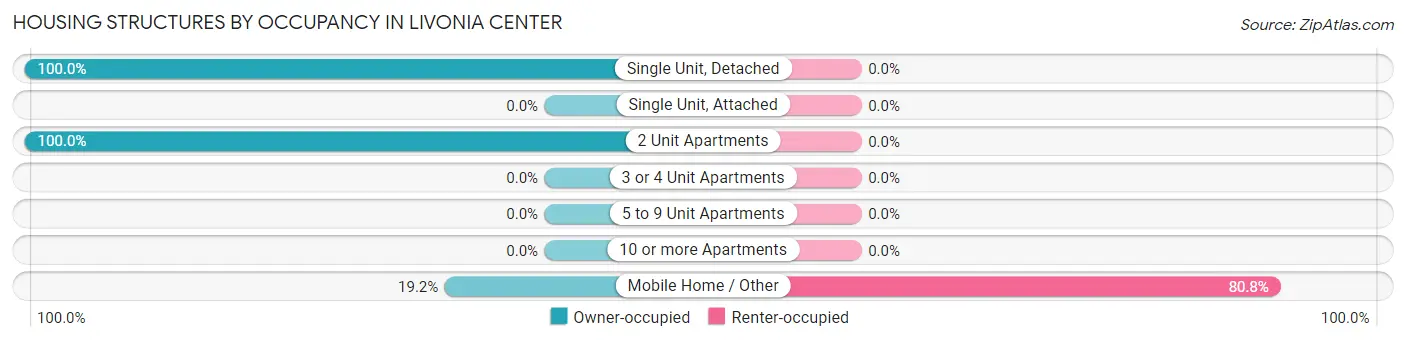
| Structure Type | Owner-occupied | Renter-occupied |
| Single Unit, Detached | 82 (100.0%) | 0 (0.0%) |
| Single Unit, Attached | 0 (0.0%) | 0 (0.0%) |
| 2 Unit Apartments | 18 (100.0%) | 0 (0.0%) |
| 3 or 4 Unit Apartments | 0 (0.0%) | 0 (0.0%) |
| 5 to 9 Unit Apartments | 0 (0.0%) | 0 (0.0%) |
| 10 or more Apartments | 0 (0.0%) | 0 (0.0%) |
| Mobile Home / Other | 5 (19.2%) | 21 (80.8%) |
| Total | 105 (83.3%) | 21 (16.7%) |
Housing Structures by Number of Rooms in Livonia Center
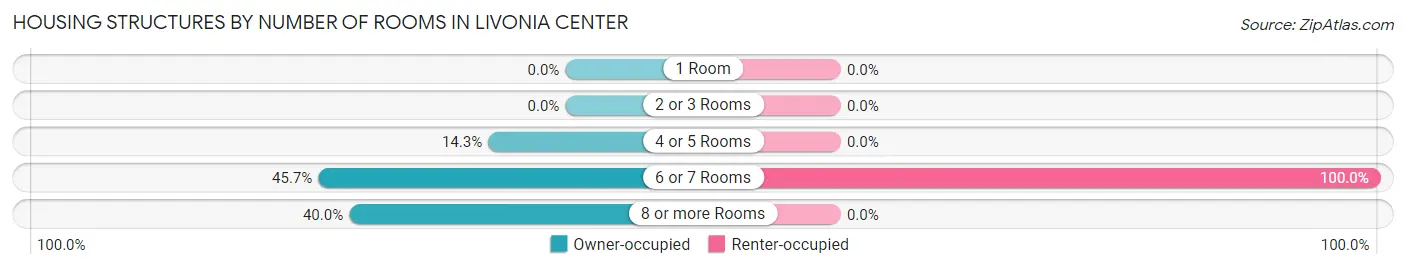
| Number of Rooms | Owner-occupied | Renter-occupied |
| 1 Room | 0 (0.0%) | 0 (0.0%) |
| 2 or 3 Rooms | 0 (0.0%) | 0 (0.0%) |
| 4 or 5 Rooms | 15 (14.3%) | 0 (0.0%) |
| 6 or 7 Rooms | 48 (45.7%) | 21 (100.0%) |
| 8 or more Rooms | 42 (40.0%) | 0 (0.0%) |
| Total | 105 (100.0%) | 21 (100.0%) |
Housing Structure by Heating Type in Livonia Center
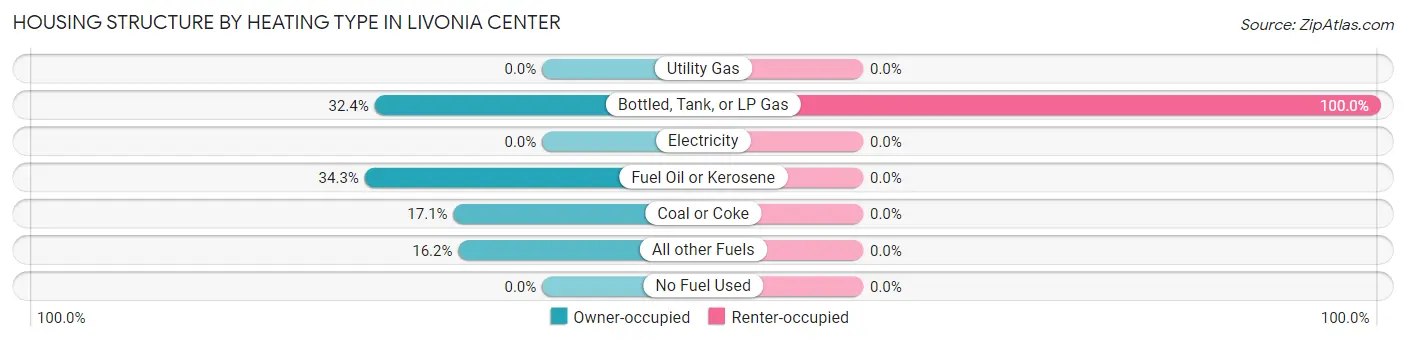
| Heating Type | Owner-occupied | Renter-occupied |
| Utility Gas | 0 (0.0%) | 0 (0.0%) |
| Bottled, Tank, or LP Gas | 34 (32.4%) | 21 (100.0%) |
| Electricity | 0 (0.0%) | 0 (0.0%) |
| Fuel Oil or Kerosene | 36 (34.3%) | 0 (0.0%) |
| Coal or Coke | 18 (17.1%) | 0 (0.0%) |
| All other Fuels | 17 (16.2%) | 0 (0.0%) |
| No Fuel Used | 0 (0.0%) | 0 (0.0%) |
| Total | 105 (100.0%) | 21 (100.0%) |
Household Vehicle Usage in Livonia Center
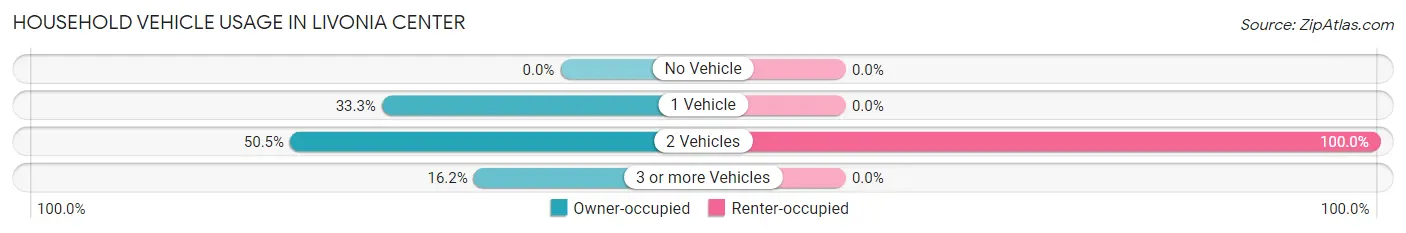
| Vehicles per Household | Owner-occupied | Renter-occupied |
| No Vehicle | 0 (0.0%) | 0 (0.0%) |
| 1 Vehicle | 35 (33.3%) | 0 (0.0%) |
| 2 Vehicles | 53 (50.5%) | 21 (100.0%) |
| 3 or more Vehicles | 17 (16.2%) | 0 (0.0%) |
| Total | 105 (100.0%) | 21 (100.0%) |
Real Estate & Mortgages in Livonia Center
Real Estate and Mortgage Overview in Livonia Center
| Characteristic | Without Mortgage | With Mortgage |
| Housing Units | 34 | 71 |
| Median Property Value | $173,600 | $150,300 |
| Median Household Income | $110,139 | $0 |
| Monthly Housing Costs | $1,039 | $0 |
| Real Estate Taxes | - | - |
Property Value by Mortgage Status in Livonia Center
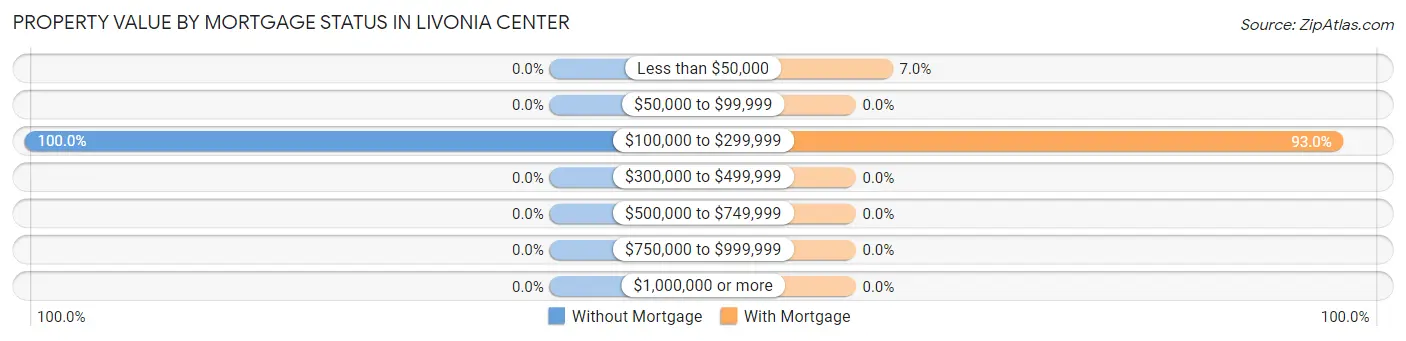
| Property Value | Without Mortgage | With Mortgage |
| Less than $50,000 | 0 (0.0%) | 5 (7.0%) |
| $50,000 to $99,999 | 0 (0.0%) | 0 (0.0%) |
| $100,000 to $299,999 | 34 (100.0%) | 66 (93.0%) |
| $300,000 to $499,999 | 0 (0.0%) | 0 (0.0%) |
| $500,000 to $749,999 | 0 (0.0%) | 0 (0.0%) |
| $750,000 to $999,999 | 0 (0.0%) | 0 (0.0%) |
| $1,000,000 or more | 0 (0.0%) | 0 (0.0%) |
| Total | 34 (100.0%) | 71 (100.0%) |
Household Income by Mortgage Status in Livonia Center
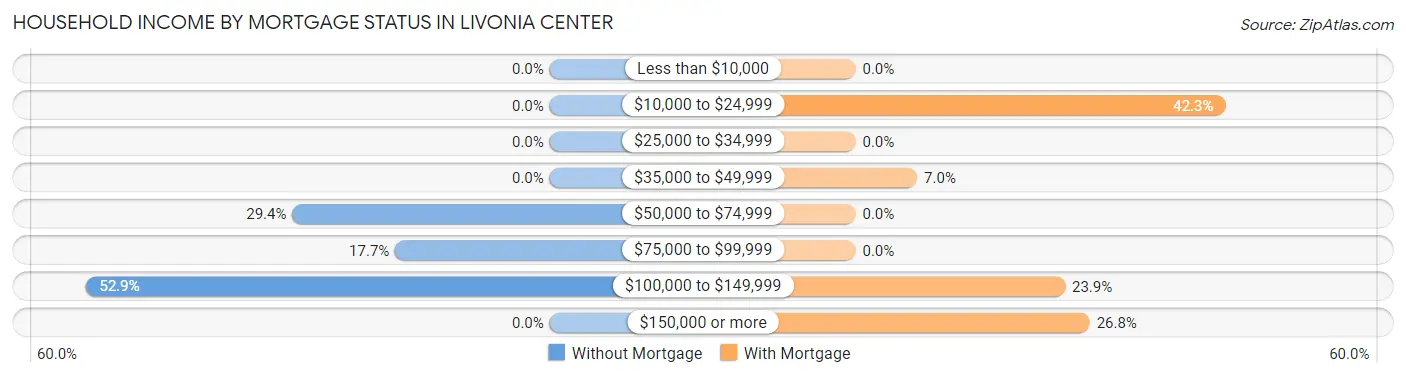
| Household Income | Without Mortgage | With Mortgage |
| Less than $10,000 | 0 (0.0%) | 0 (0.0%) |
| $10,000 to $24,999 | 0 (0.0%) | 30 (42.2%) |
| $25,000 to $34,999 | 0 (0.0%) | 0 (0.0%) |
| $35,000 to $49,999 | 0 (0.0%) | 5 (7.0%) |
| $50,000 to $74,999 | 10 (29.4%) | 0 (0.0%) |
| $75,000 to $99,999 | 6 (17.6%) | 0 (0.0%) |
| $100,000 to $149,999 | 18 (52.9%) | 17 (23.9%) |
| $150,000 or more | 0 (0.0%) | 19 (26.8%) |
| Total | 34 (100.0%) | 71 (100.0%) |
Property Value to Household Income Ratio in Livonia Center
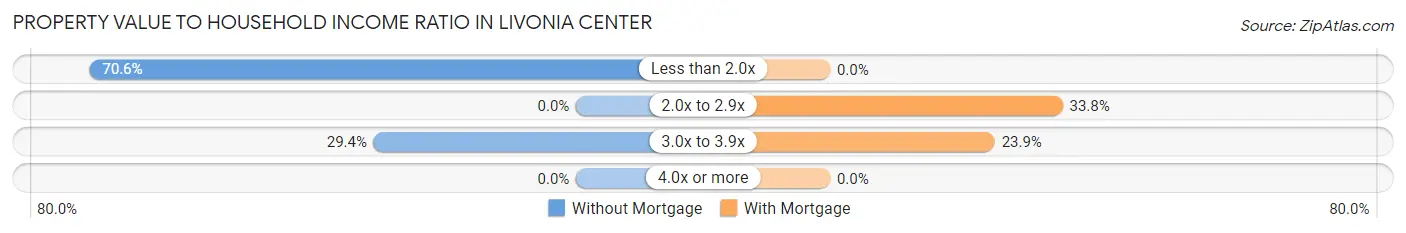
| Value-to-Income Ratio | Without Mortgage | With Mortgage |
| Less than 2.0x | 24 (70.6%) | 0 (0.0%) |
| 2.0x to 2.9x | 0 (0.0%) | 24 (33.8%) |
| 3.0x to 3.9x | 10 (29.4%) | 17 (23.9%) |
| 4.0x or more | 0 (0.0%) | 0 (0.0%) |
| Total | 34 (100.0%) | 71 (100.0%) |
Real Estate Taxes by Mortgage Status in Livonia Center
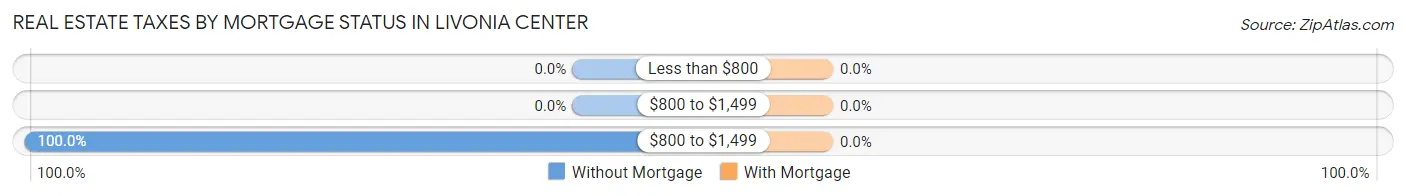
| Property Taxes | Without Mortgage | With Mortgage |
| Less than $800 | 0 (0.0%) | 0 (0.0%) |
| $800 to $1,499 | 0 (0.0%) | 0 (0.0%) |
| $800 to $1,499 | 34 (100.0%) | 0 (0.0%) |
| Total | 34 (100.0%) | 71 (100.0%) |
Health & Disability in Livonia Center
Health Insurance Coverage by Age in Livonia Center
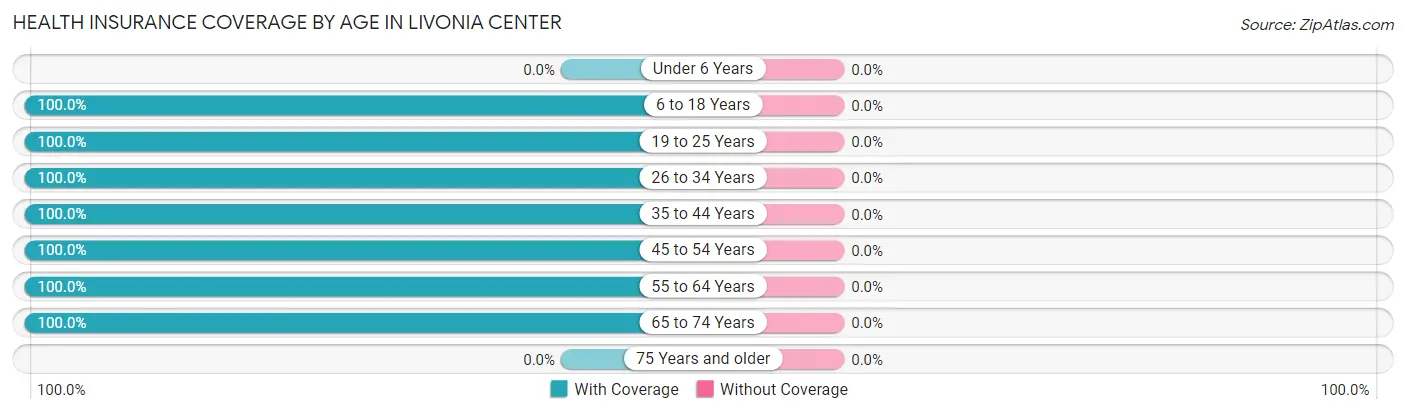
| Age Bracket | With Coverage | Without Coverage |
| Under 6 Years | 0 (0.0%) | 0 (0.0%) |
| 6 to 18 Years | 57 (100.0%) | 0 (0.0%) |
| 19 to 25 Years | 24 (100.0%) | 0 (0.0%) |
| 26 to 34 Years | 33 (100.0%) | 0 (0.0%) |
| 35 to 44 Years | 46 (100.0%) | 0 (0.0%) |
| 45 to 54 Years | 39 (100.0%) | 0 (0.0%) |
| 55 to 64 Years | 72 (100.0%) | 0 (0.0%) |
| 65 to 74 Years | 34 (100.0%) | 0 (0.0%) |
| 75 Years and older | 0 (0.0%) | 0 (0.0%) |
| Total | 305 (100.0%) | 0 (0.0%) |
Health Insurance Coverage by Citizenship Status in Livonia Center
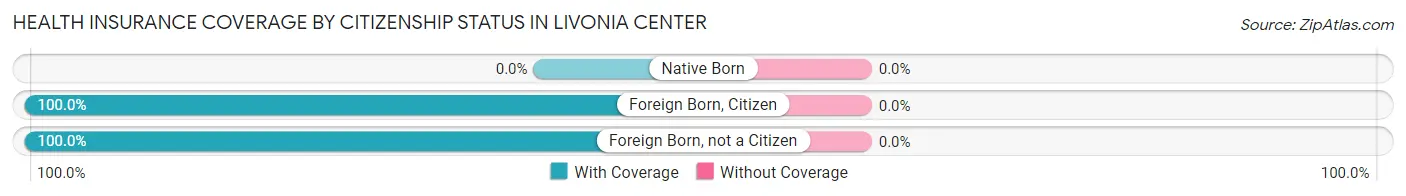
| Citizenship Status | With Coverage | Without Coverage |
| Native Born | 0 (0.0%) | 0 (0.0%) |
| Foreign Born, Citizen | 57 (100.0%) | 0 (0.0%) |
| Foreign Born, not a Citizen | 24 (100.0%) | 0 (0.0%) |
Health Insurance Coverage by Household Income in Livonia Center
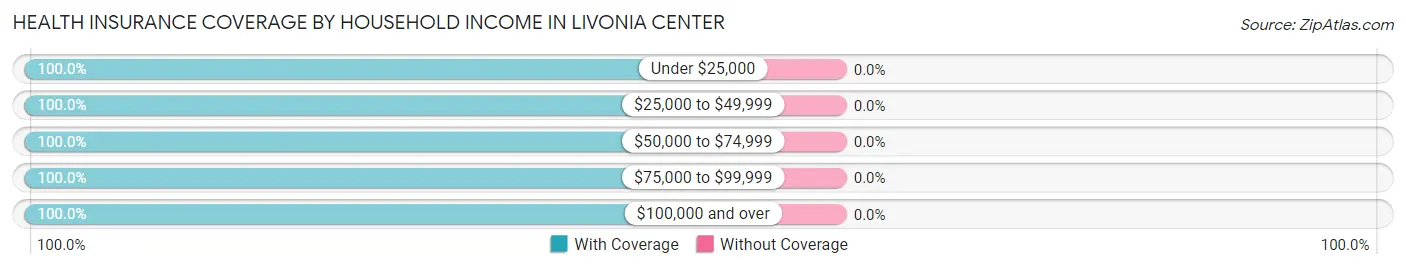
| Household Income | With Coverage | Without Coverage |
| Under $25,000 | 54 (100.0%) | 0 (0.0%) |
| $25,000 to $49,999 | 48 (100.0%) | 0 (0.0%) |
| $50,000 to $74,999 | 10 (100.0%) | 0 (0.0%) |
| $75,000 to $99,999 | 61 (100.0%) | 0 (0.0%) |
| $100,000 and over | 118 (100.0%) | 0 (0.0%) |
Public vs Private Health Insurance Coverage by Age in Livonia Center
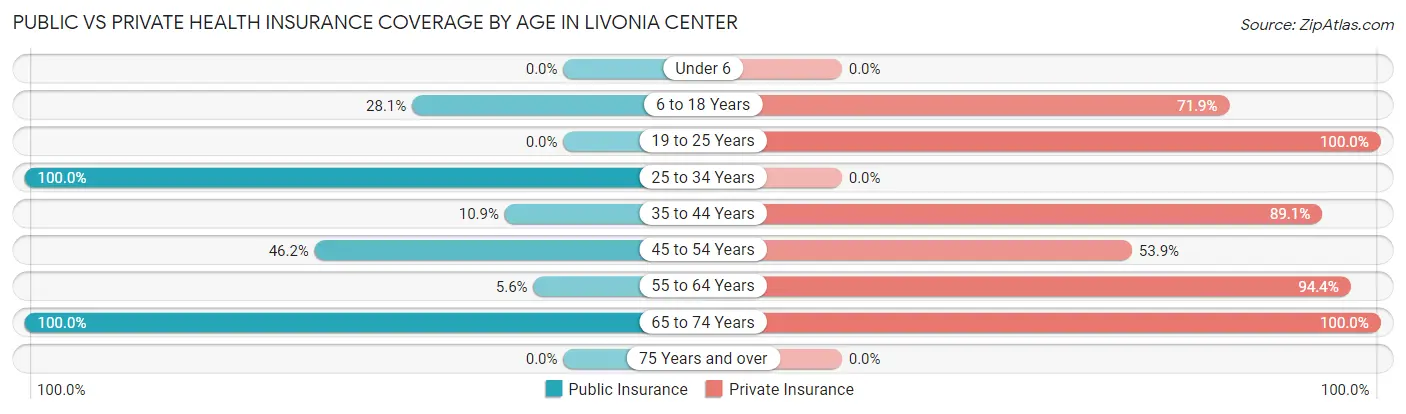
| Age Bracket | Public Insurance | Private Insurance |
| Under 6 | 0 (0.0%) | 0 (0.0%) |
| 6 to 18 Years | 16 (28.1%) | 41 (71.9%) |
| 19 to 25 Years | 0 (0.0%) | 24 (100.0%) |
| 25 to 34 Years | 33 (100.0%) | 0 (0.0%) |
| 35 to 44 Years | 5 (10.9%) | 41 (89.1%) |
| 45 to 54 Years | 18 (46.2%) | 21 (53.8%) |
| 55 to 64 Years | 4 (5.6%) | 68 (94.4%) |
| 65 to 74 Years | 34 (100.0%) | 34 (100.0%) |
| 75 Years and over | 0 (0.0%) | 0 (0.0%) |
| Total | 110 (36.1%) | 229 (75.1%) |
Disability Status by Sex by Age in Livonia Center
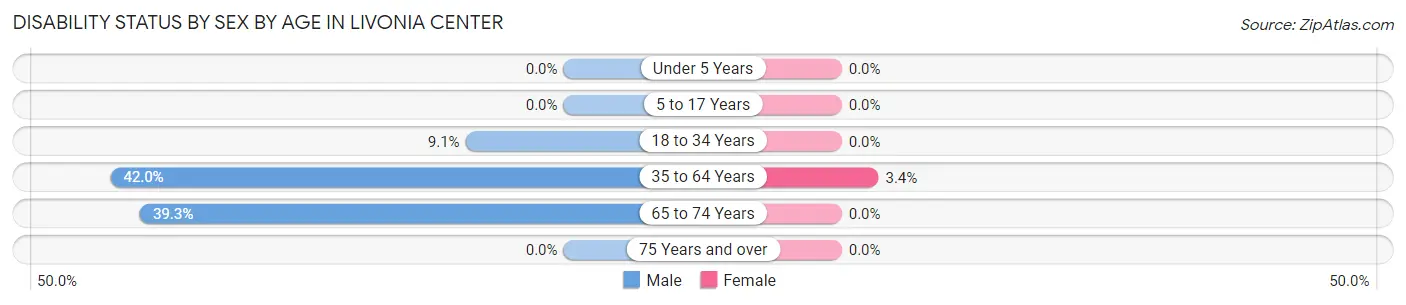
| Age Bracket | Male | Female |
| Under 5 Years | 0 (0.0%) | 0 (0.0%) |
| 5 to 17 Years | 0 (0.0%) | 0 (0.0%) |
| 18 to 34 Years | 3 (9.1%) | 0 (0.0%) |
| 35 to 64 Years | 29 (42.0%) | 3 (3.4%) |
| 65 to 74 Years | 11 (39.3%) | 0 (0.0%) |
| 75 Years and over | 0 (0.0%) | 0 (0.0%) |
Disability Class by Sex by Age in Livonia Center
Disability Class: Hearing Difficulty
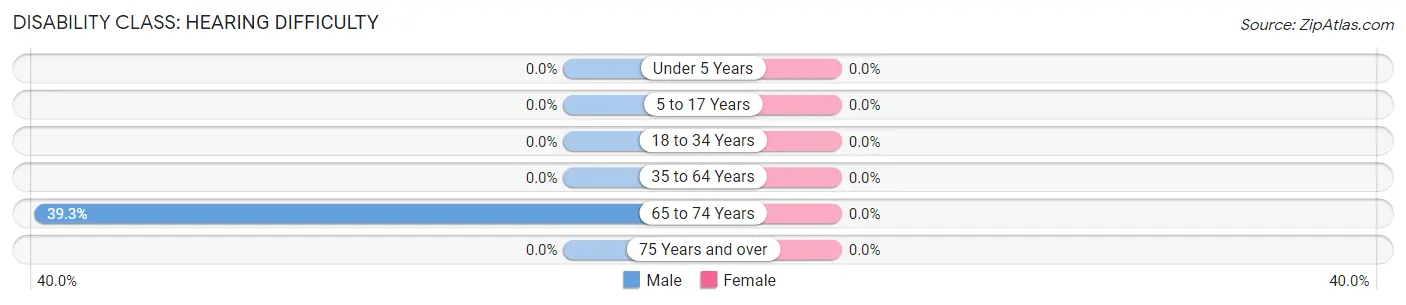
| Age Bracket | Male | Female |
| Under 5 Years | 0 (0.0%) | 0 (0.0%) |
| 5 to 17 Years | 0 (0.0%) | 0 (0.0%) |
| 18 to 34 Years | 0 (0.0%) | 0 (0.0%) |
| 35 to 64 Years | 0 (0.0%) | 0 (0.0%) |
| 65 to 74 Years | 11 (39.3%) | 0 (0.0%) |
| 75 Years and over | 0 (0.0%) | 0 (0.0%) |
Disability Class: Vision Difficulty
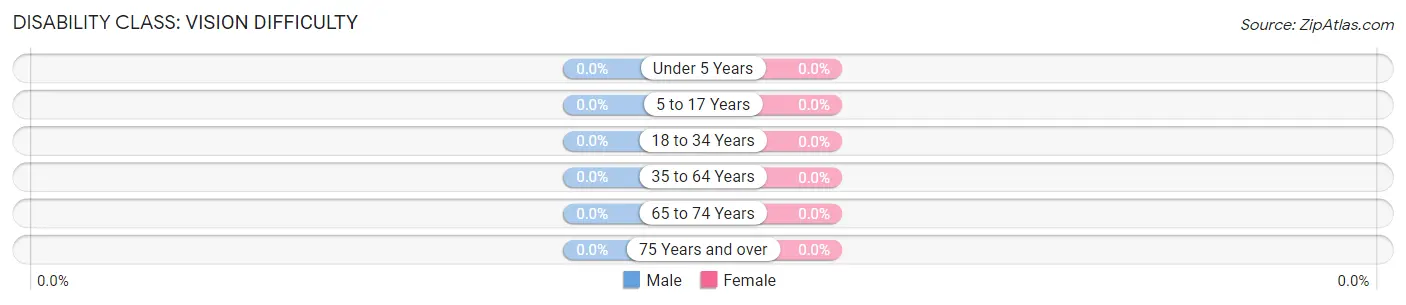
| Age Bracket | Male | Female |
| Under 5 Years | 0 (0.0%) | 0 (0.0%) |
| 5 to 17 Years | 0 (0.0%) | 0 (0.0%) |
| 18 to 34 Years | 0 (0.0%) | 0 (0.0%) |
| 35 to 64 Years | 0 (0.0%) | 0 (0.0%) |
| 65 to 74 Years | 0 (0.0%) | 0 (0.0%) |
| 75 Years and over | 0 (0.0%) | 0 (0.0%) |
Disability Class: Cognitive Difficulty
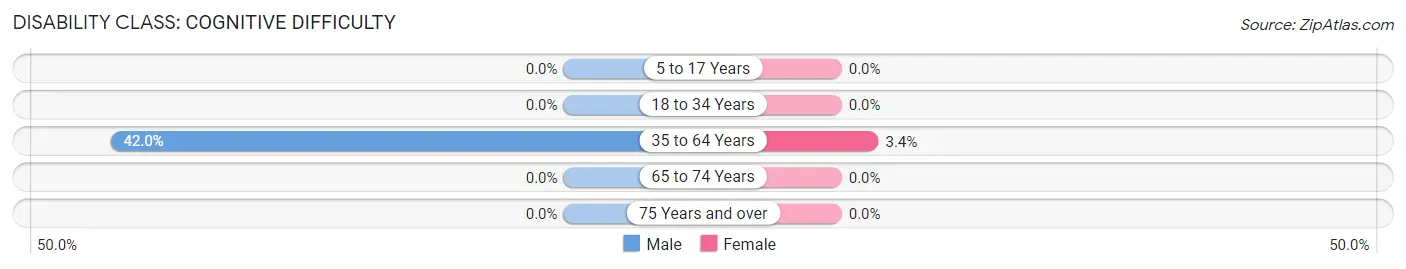
| Age Bracket | Male | Female |
| 5 to 17 Years | 0 (0.0%) | 0 (0.0%) |
| 18 to 34 Years | 0 (0.0%) | 0 (0.0%) |
| 35 to 64 Years | 29 (42.0%) | 3 (3.4%) |
| 65 to 74 Years | 0 (0.0%) | 0 (0.0%) |
| 75 Years and over | 0 (0.0%) | 0 (0.0%) |
Disability Class: Ambulatory Difficulty
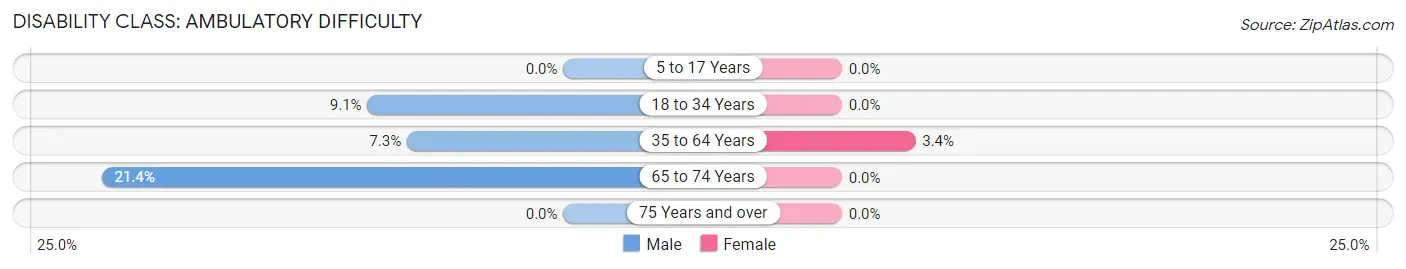
| Age Bracket | Male | Female |
| 5 to 17 Years | 0 (0.0%) | 0 (0.0%) |
| 18 to 34 Years | 3 (9.1%) | 0 (0.0%) |
| 35 to 64 Years | 5 (7.2%) | 3 (3.4%) |
| 65 to 74 Years | 6 (21.4%) | 0 (0.0%) |
| 75 Years and over | 0 (0.0%) | 0 (0.0%) |
Disability Class: Self-Care Difficulty
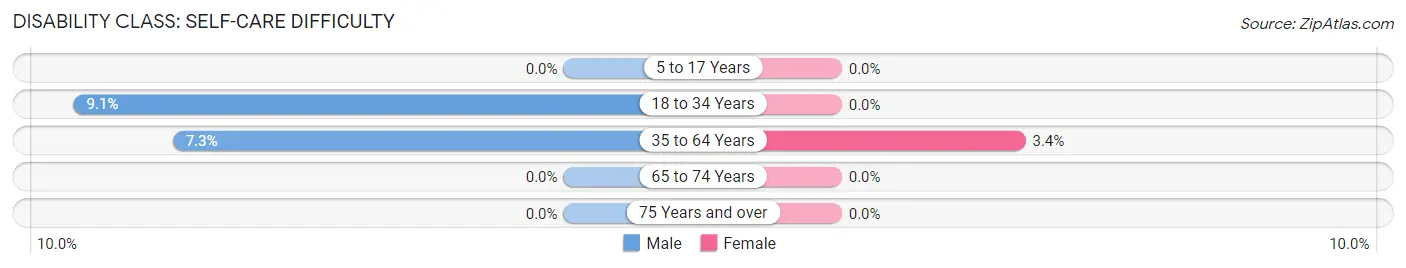
| Age Bracket | Male | Female |
| 5 to 17 Years | 0 (0.0%) | 0 (0.0%) |
| 18 to 34 Years | 3 (9.1%) | 0 (0.0%) |
| 35 to 64 Years | 5 (7.2%) | 3 (3.4%) |
| 65 to 74 Years | 0 (0.0%) | 0 (0.0%) |
| 75 Years and over | 0 (0.0%) | 0 (0.0%) |
Technology Access in Livonia Center
Computing Device Access in Livonia Center
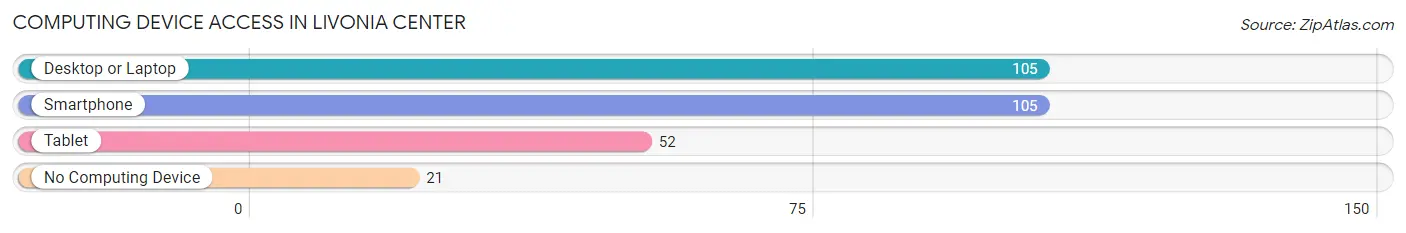
| Device Type | # Households | % Households |
| Desktop or Laptop | 105 | 83.3% |
| Smartphone | 105 | 83.3% |
| Tablet | 52 | 41.3% |
| No Computing Device | 21 | 16.7% |
| Total | 126 | 100.0% |
Internet Access in Livonia Center
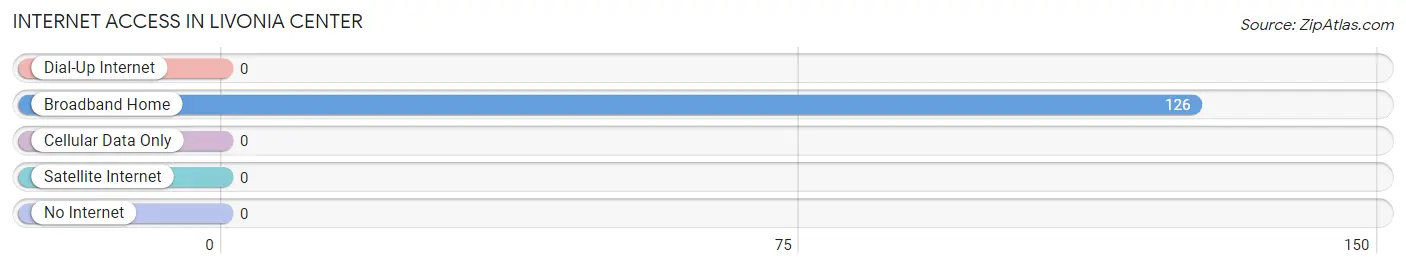
| Internet Type | # Households | % Households |
| Dial-Up Internet | 0 | 0.0% |
| Broadband Home | 126 | 100.0% |
| Cellular Data Only | 0 | 0.0% |
| Satellite Internet | 0 | 0.0% |
| No Internet | 0 | 0.0% |
| Total | 126 | 100.0% |
Livonia Center Summary
Livonia Center is a hamlet located in the town of Livonia in Livingston County, New York. It is situated on the east side of Conesus Lake, and is part of the Rochester Metropolitan Statistical Area. The hamlet has a population of approximately 1,000 people and is home to a variety of businesses, including a grocery store, a hardware store, a post office, and several restaurants.
Geography
Livonia Center is located in the Finger Lakes region of New York State. It is situated on the east side of Conesus Lake, which is the largest of the Finger Lakes. The hamlet is bordered by the towns of Livonia to the north, Lima to the east, and Geneseo to the south. The hamlet is located approximately 25 miles south of Rochester and 40 miles east of Buffalo.
The terrain of Livonia Center is mostly flat, with some rolling hills. The area is heavily forested, with a mix of deciduous and coniferous trees. The hamlet is located in a temperate climate, with warm summers and cold winters.
History
Livonia Center was first settled in the early 19th century by settlers from New England. The hamlet was originally known as “Livonia”, after the town of Livonia in which it is located. The hamlet was officially incorporated in 1845.
In the late 19th century, Livonia Center was a thriving agricultural community. The hamlet was home to several farms, as well as a number of small businesses. The hamlet was also home to a number of churches, including the First Presbyterian Church, which was founded in 1845.
In the early 20th century, Livonia Center began to experience a decline in population as many of its residents moved away in search of better economic opportunities. The hamlet’s population continued to decline until the 1950s, when the hamlet began to experience a resurgence in population.
Economy
Livonia Center is primarily a residential community, with a small number of businesses located in the hamlet. The hamlet is home to a grocery store, a hardware store, a post office, and several restaurants. The hamlet is also home to a number of small businesses, including a bakery, a florist, and a furniture store.
The hamlet is also home to a number of recreational activities, including fishing, boating, and swimming. The hamlet is also home to a number of parks, including the Livonia Center Park, which features a playground, picnic areas, and a walking trail.
Demographics
As of the 2010 census, Livonia Center had a population of 1,000 people. The median age of the population was 44.7 years, and the median household income was $50,000. The hamlet is predominantly white, with a small percentage of African American and Hispanic residents.
Conclusion
Livonia Center is a small hamlet located in the Finger Lakes region of New York State. The hamlet has a population of approximately 1,000 people and is home to a variety of businesses, including a grocery store, a hardware store, a post office, and several restaurants. The hamlet is primarily a residential community, with a small number of businesses located in the hamlet. The hamlet is also home to a number of recreational activities, including fishing, boating, and swimming. The hamlet is predominantly white, with a small percentage of African American and Hispanic residents.
Common Questions
What is Per Capita Income in Livonia Center?
Per Capita income in Livonia Center is $27,240.
What is the Median Family Income in Livonia Center?
Median Family Income in Livonia Center is $110,694.
What is the Median Household income in Livonia Center?
Median Household Income in Livonia Center is $59,250.
What is Income or Wage Gap in Livonia Center?
Income or Wage Gap in Livonia Center is 22.5%.
Women in Livonia Center earn 77.5 cents for every dollar earned by a man.
What is Inequality or Gini Index in Livonia Center?
Inequality or Gini Index in Livonia Center is 0.37.
What is the Total Population of Livonia Center?
Total Population of Livonia Center is 305.
What is the Total Male Population of Livonia Center?
Total Male Population of Livonia Center is 167.
What is the Total Female Population of Livonia Center?
Total Female Population of Livonia Center is 138.
What is the Ratio of Males per 100 Females in Livonia Center?
There are 121.01 Males per 100 Females in Livonia Center.
What is the Ratio of Females per 100 Males in Livonia Center?
There are 82.63 Females per 100 Males in Livonia Center.
What is the Median Population Age in Livonia Center?
Median Population Age in Livonia Center is 37.9 Years.
What is the Average Family Size in Livonia Center
Average Family Size in Livonia Center is 2.7 People.
What is the Average Household Size in Livonia Center
Average Household Size in Livonia Center is 2.3 People.
How Large is the Labor Force in Livonia Center?
There are 206 People in the Labor Forcein in Livonia Center.
What is the Percentage of People in the Labor Force in Livonia Center?
83.1% of People are in the Labor Force in Livonia Center.
What is the Unemployment Rate in Livonia Center?
Unemployment Rate in Livonia Center is 14.6%.