Nunda, NY Map & Demographics
Nunda Map
Nunda Overview
$29,084
PER CAPITA INCOME
$52,794
AVG FAMILY INCOME
$50,101
AVG HOUSEHOLD INCOME
37.3%
WAGE / INCOME GAP [ % ]
62.7¢/ $1
WAGE / INCOME GAP [ $ ]
0.47
INEQUALITY / GINI INDEX
1,140
TOTAL POPULATION
605
MALE POPULATION
535
FEMALE POPULATION
113.08
MALES / 100 FEMALES
88.43
FEMALES / 100 MALES
39.7
MEDIAN AGE
2.5
AVG FAMILY SIZE
2.0
AVG HOUSEHOLD SIZE
497
LABOR FORCE [ PEOPLE ]
51.8%
PERCENT IN LABOR FORCE
2.0%
UNEMPLOYMENT RATE
Nunda Zip Codes
Nunda Area Codes
Income in Nunda
Income Overview in Nunda
Per Capita Income in Nunda is $29,084, while median incomes of families and households are $52,794 and $50,101 respectively.
| Characteristic | Number | Measure |
| Per Capita Income | 1,140 | $29,084 |
| Median Family Income | 276 | $52,794 |
| Mean Family Income | 276 | $69,871 |
| Median Household Income | 539 | $50,101 |
| Mean Household Income | 539 | $59,263 |
| Income Deficit | 276 | $0 |
| Wage / Income Gap (%) | 1,140 | 37.33% |
| Wage / Income Gap ($) | 1,140 | 62.67¢ per $1 |
| Gini / Inequality Index | 1,140 | 0.47 |
Earnings by Sex in Nunda
Average Earnings in Nunda are $35,273, $41,544 for men and $26,037 for women, a difference of 37.3%.
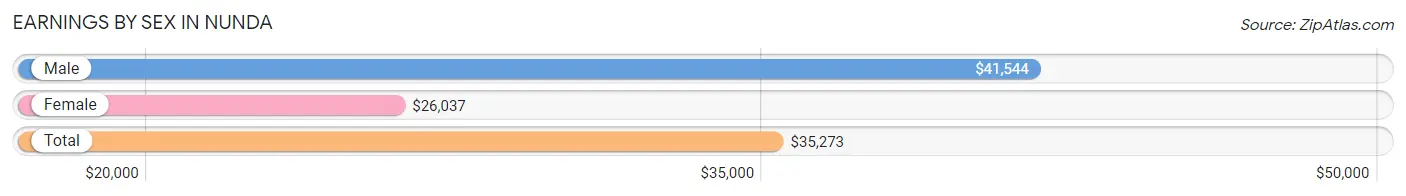
| Sex | Number | Average Earnings |
| Male | 295 (55.3%) | $41,544 |
| Female | 238 (44.7%) | $26,037 |
| Total | 533 (100.0%) | $35,273 |
Earnings by Sex by Income Bracket in Nunda
The most common earnings brackets in Nunda are $100,000+ for men (45 | 15.2%) and $2,499 or less for women (64 | 26.9%).
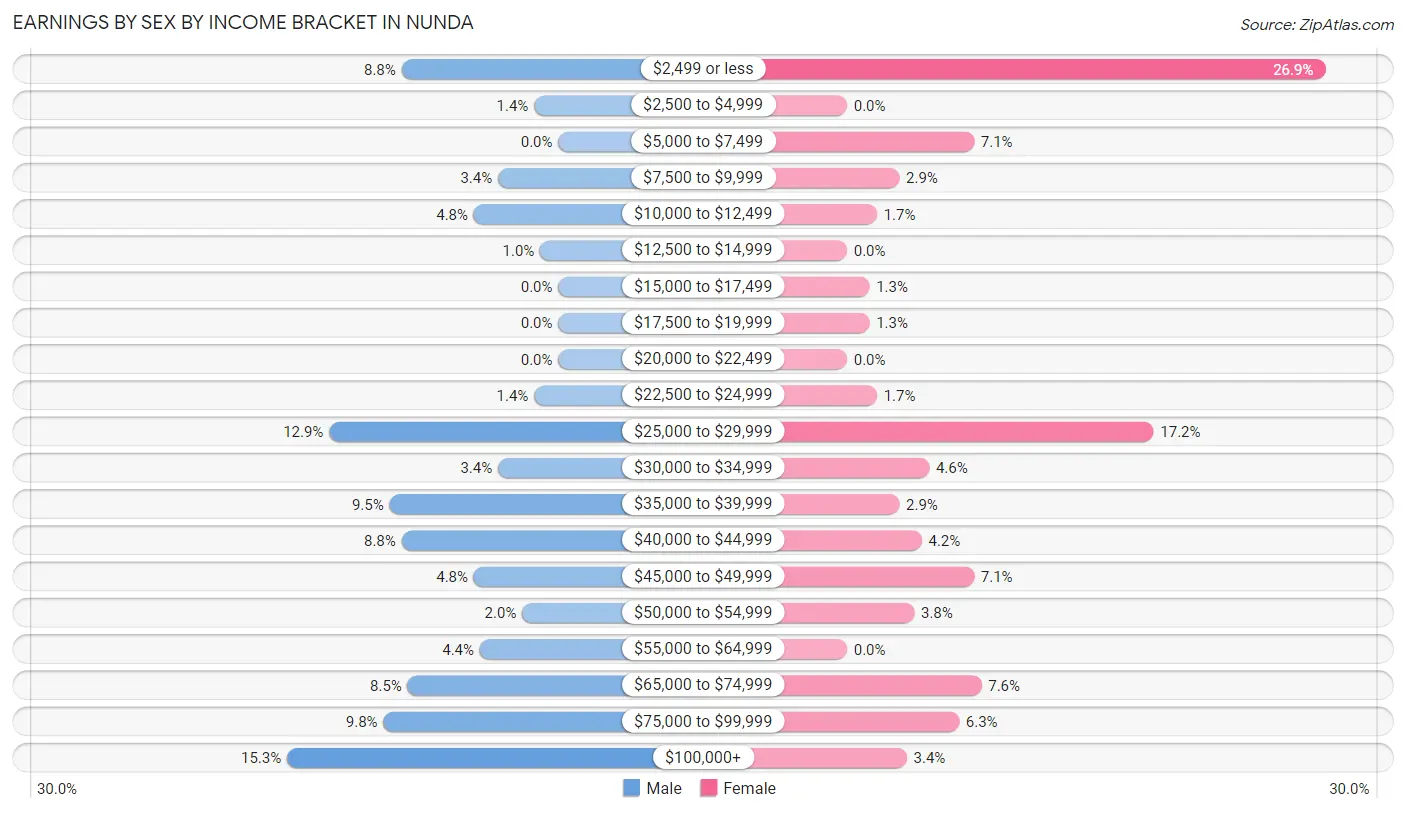
| Income | Male | Female |
| $2,499 or less | 26 (8.8%) | 64 (26.9%) |
| $2,500 to $4,999 | 4 (1.4%) | 0 (0.0%) |
| $5,000 to $7,499 | 0 (0.0%) | 17 (7.1%) |
| $7,500 to $9,999 | 10 (3.4%) | 7 (2.9%) |
| $10,000 to $12,499 | 14 (4.8%) | 4 (1.7%) |
| $12,500 to $14,999 | 3 (1.0%) | 0 (0.0%) |
| $15,000 to $17,499 | 0 (0.0%) | 3 (1.3%) |
| $17,500 to $19,999 | 0 (0.0%) | 3 (1.3%) |
| $20,000 to $22,499 | 0 (0.0%) | 0 (0.0%) |
| $22,500 to $24,999 | 4 (1.4%) | 4 (1.7%) |
| $25,000 to $29,999 | 38 (12.9%) | 41 (17.2%) |
| $30,000 to $34,999 | 10 (3.4%) | 11 (4.6%) |
| $35,000 to $39,999 | 28 (9.5%) | 7 (2.9%) |
| $40,000 to $44,999 | 26 (8.8%) | 10 (4.2%) |
| $45,000 to $49,999 | 14 (4.8%) | 17 (7.1%) |
| $50,000 to $54,999 | 6 (2.0%) | 9 (3.8%) |
| $55,000 to $64,999 | 13 (4.4%) | 0 (0.0%) |
| $65,000 to $74,999 | 25 (8.5%) | 18 (7.6%) |
| $75,000 to $99,999 | 29 (9.8%) | 15 (6.3%) |
| $100,000+ | 45 (15.2%) | 8 (3.4%) |
| Total | 295 (100.0%) | 238 (100.0%) |
Earnings by Sex by Educational Attainment in Nunda
Average earnings in Nunda are $42,132 for men and $26,343 for women, a difference of 37.5%. Men with an educational attainment of bachelor's degree enjoy the highest average annual earnings of $147,813, while those with college or associate's degree education earn the least with $37,303. Women with an educational attainment of graduate degree earn the most with the average annual earnings of $51,250, while those with bachelor's degree education have the smallest earnings of $2,499.
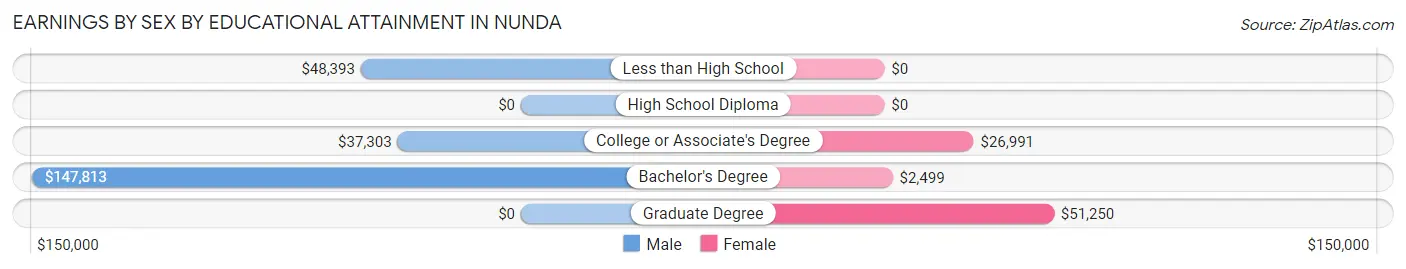
| Educational Attainment | Male Income | Female Income |
| Less than High School | $48,393 | $0 |
| High School Diploma | - | - |
| College or Associate's Degree | $37,303 | $26,991 |
| Bachelor's Degree | $147,813 | $2,499 |
| Graduate Degree | - | - |
| Total | $42,132 | $26,343 |
Family Income in Nunda
Family Income Brackets in Nunda
According to the Nunda family income data, there are 56 families falling into the less than $10,000 income range, which is the most common income bracket and makes up 20.3% of all families. Conversely, the $10,000 to $14,999 income bracket is the least frequent group with only 3 families (1.1%) belonging to this category.
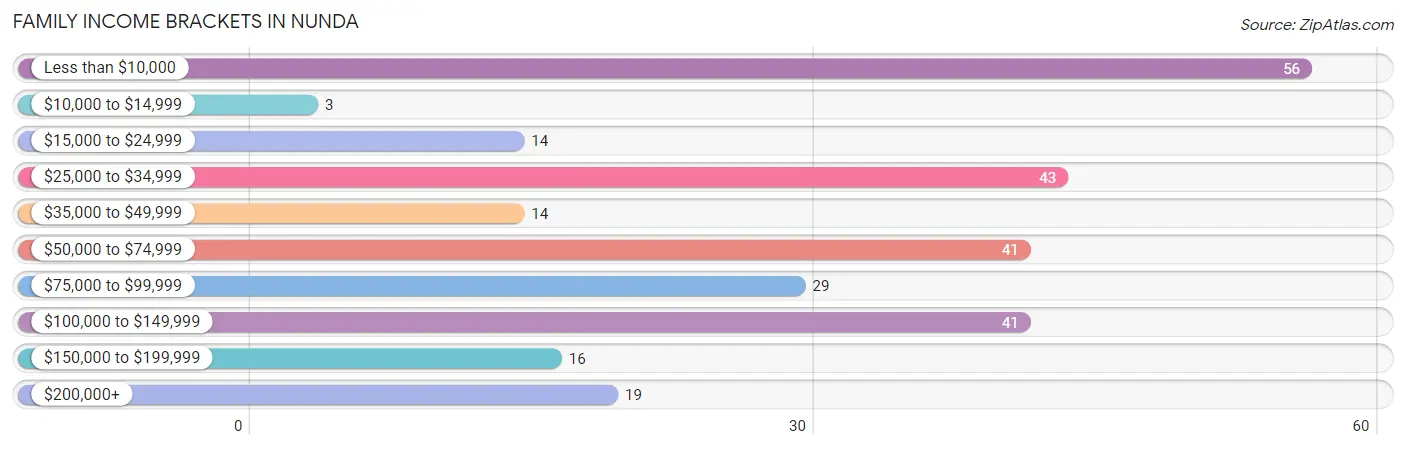
| Income Bracket | # Families | % Families |
| Less than $10,000 | 56 | 20.3% |
| $10,000 to $14,999 | 3 | 1.1% |
| $15,000 to $24,999 | 14 | 5.1% |
| $25,000 to $34,999 | 43 | 15.6% |
| $35,000 to $49,999 | 14 | 5.1% |
| $50,000 to $74,999 | 41 | 14.9% |
| $75,000 to $99,999 | 29 | 10.5% |
| $100,000 to $149,999 | 41 | 14.9% |
| $150,000 to $199,999 | 16 | 5.8% |
| $200,000+ | 19 | 6.9% |
Family Income by Famaliy Size in Nunda
2-person families (167 | 60.5%) account for the highest median family income in Nunda with $51,042 per family, while 2-person families (167 | 60.5%) have the highest median income of $25,521 per family member.
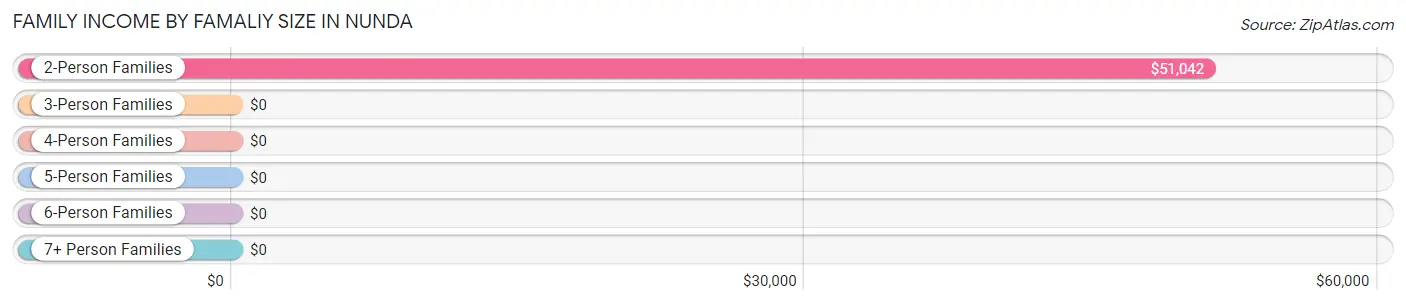
| Income Bracket | # Families | Median Income |
| 2-Person Families | 167 (60.5%) | $51,042 |
| 3-Person Families | 89 (32.3%) | $0 |
| 4-Person Families | 10 (3.6%) | $0 |
| 5-Person Families | 10 (3.6%) | $0 |
| 6-Person Families | 0 (0.0%) | $0 |
| 7+ Person Families | 0 (0.0%) | $0 |
| Total | 276 (100.0%) | $52,794 |
Family Income by Number of Earners in Nunda
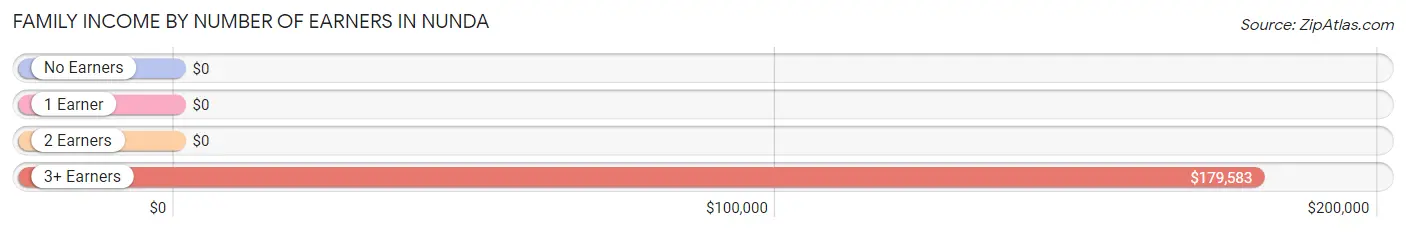
| Number of Earners | # Families | Median Income |
| No Earners | 61 (22.1%) | $0 |
| 1 Earner | 110 (39.9%) | $0 |
| 2 Earners | 89 (32.3%) | $0 |
| 3+ Earners | 16 (5.8%) | $179,583 |
| Total | 276 (100.0%) | $52,794 |
Household Income in Nunda
Household Income Brackets in Nunda
With 120 households falling in the category, the $50,000 to $74,999 income range is the most frequent in Nunda, accounting for 22.3% of all households. In contrast, only 16 households (3.0%) fall into the $150,000 to $199,999 income bracket, making it the least populous group.
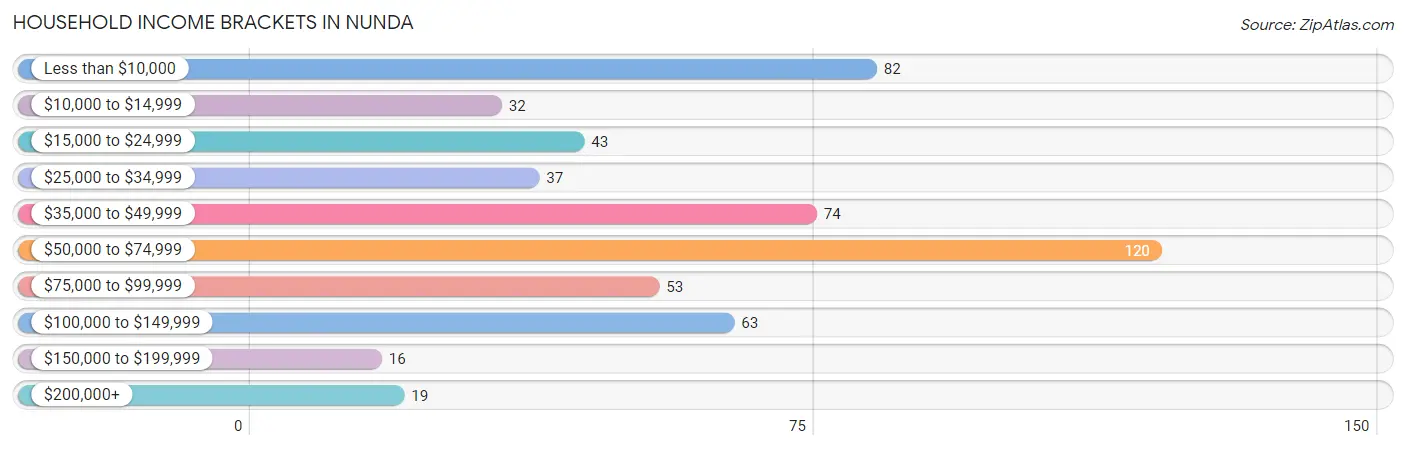
| Income Bracket | # Households | % Households |
| Less than $10,000 | 82 | 15.2% |
| $10,000 to $14,999 | 32 | 5.9% |
| $15,000 to $24,999 | 43 | 8.0% |
| $25,000 to $34,999 | 37 | 6.9% |
| $35,000 to $49,999 | 74 | 13.7% |
| $50,000 to $74,999 | 120 | 22.3% |
| $75,000 to $99,999 | 53 | 9.8% |
| $100,000 to $149,999 | 63 | 11.7% |
| $150,000 to $199,999 | 16 | 3.0% |
| $200,000+ | 19 | 3.5% |
Household Income by Householder Age in Nunda
The median household income in Nunda is $50,101, with the highest median household income of $79,167 found in the 45 to 64 years age bracket for the primary householder. A total of 128 households (23.7%) fall into this category. Meanwhile, the 15 to 24 years age bracket for the primary householder has the lowest median household income of $0, with 14 households (2.6%) in this group.
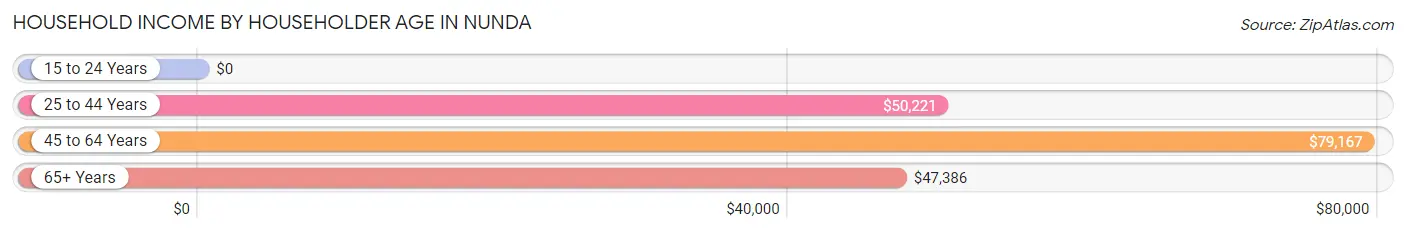
| Income Bracket | # Households | Median Income |
| 15 to 24 Years | 14 (2.6%) | $0 |
| 25 to 44 Years | 228 (42.3%) | $50,221 |
| 45 to 64 Years | 128 (23.7%) | $79,167 |
| 65+ Years | 169 (31.4%) | $47,386 |
| Total | 539 (100.0%) | $50,101 |
Poverty in Nunda
Income Below Poverty by Sex and Age in Nunda
With 23.3% poverty level for males and 26.5% for females among the residents of Nunda, 6 to 11 year old males and under 5 year old females are the most vulnerable to poverty, with 30 males (50.8%) and 5 females (55.6%) in their respective age groups living below the poverty level.
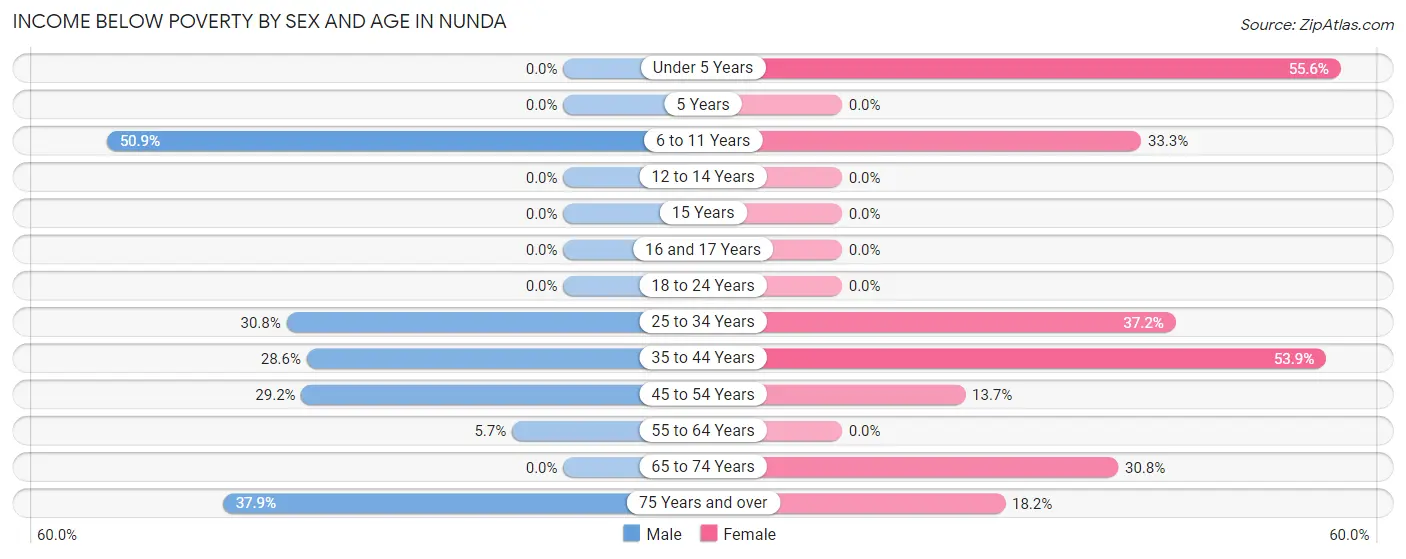
| Age Bracket | Male | Female |
| Under 5 Years | 0 (0.0%) | 5 (55.6%) |
| 5 Years | 0 (0.0%) | 0 (0.0%) |
| 6 to 11 Years | 30 (50.8%) | 4 (33.3%) |
| 12 to 14 Years | 0 (0.0%) | 0 (0.0%) |
| 15 Years | 0 (0.0%) | 0 (0.0%) |
| 16 and 17 Years | 0 (0.0%) | 0 (0.0%) |
| 18 to 24 Years | 0 (0.0%) | 0 (0.0%) |
| 25 to 34 Years | 41 (30.8%) | 29 (37.2%) |
| 35 to 44 Years | 34 (28.6%) | 55 (53.9%) |
| 45 to 54 Years | 21 (29.2%) | 7 (13.7%) |
| 55 to 64 Years | 4 (5.7%) | 0 (0.0%) |
| 65 to 74 Years | 0 (0.0%) | 16 (30.8%) |
| 75 Years and over | 11 (37.9%) | 16 (18.2%) |
| Total | 141 (23.3%) | 132 (26.5%) |
Income Above Poverty by Sex and Age in Nunda
According to the poverty statistics in Nunda, males aged under 5 years and females aged 12 to 14 years are the age groups that are most secure financially, with 100.0% of males and 100.0% of females in these age groups living above the poverty line.
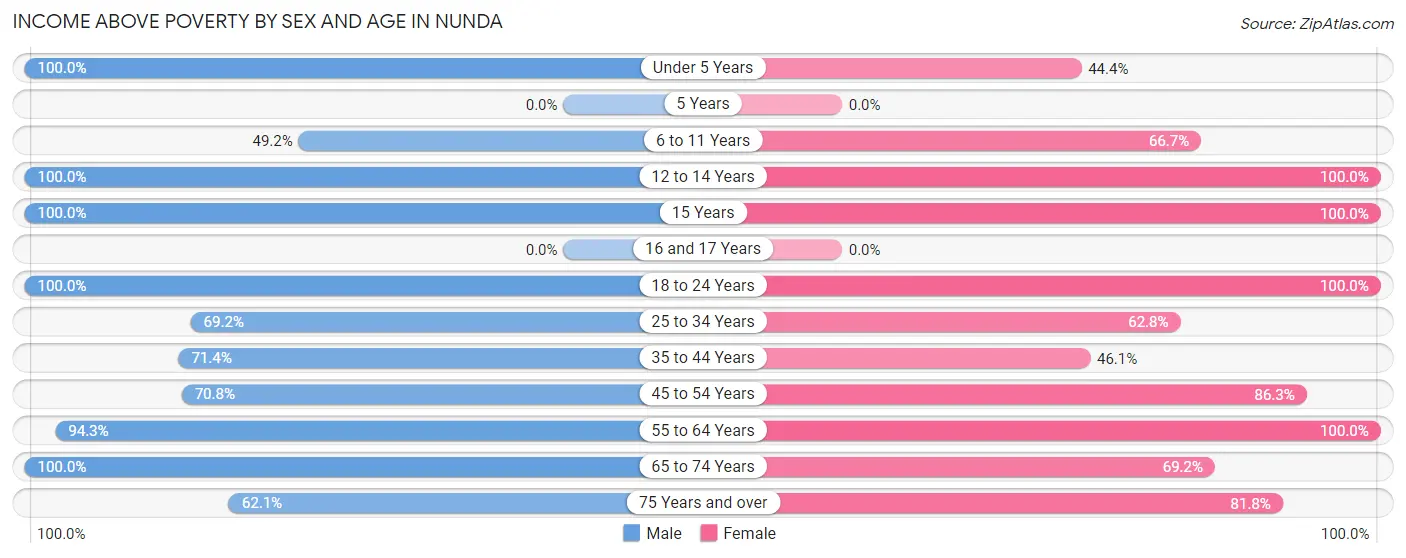
| Age Bracket | Male | Female |
| Under 5 Years | 27 (100.0%) | 4 (44.4%) |
| 5 Years | 0 (0.0%) | 0 (0.0%) |
| 6 to 11 Years | 29 (49.1%) | 8 (66.7%) |
| 12 to 14 Years | 4 (100.0%) | 10 (100.0%) |
| 15 Years | 16 (100.0%) | 7 (100.0%) |
| 16 and 17 Years | 0 (0.0%) | 0 (0.0%) |
| 18 to 24 Years | 8 (100.0%) | 29 (100.0%) |
| 25 to 34 Years | 92 (69.2%) | 49 (62.8%) |
| 35 to 44 Years | 85 (71.4%) | 47 (46.1%) |
| 45 to 54 Years | 51 (70.8%) | 44 (86.3%) |
| 55 to 64 Years | 66 (94.3%) | 61 (100.0%) |
| 65 to 74 Years | 68 (100.0%) | 36 (69.2%) |
| 75 Years and over | 18 (62.1%) | 72 (81.8%) |
| Total | 464 (76.7%) | 367 (73.6%) |
Income Below Poverty Among Married-Couple Families in Nunda
The poverty statistics for married-couple families in Nunda show that 24.4% or 39 of the total 160 families live below the poverty line. Families with no children have the highest poverty rate of 27.3%, comprising of 36 families. On the other hand, families with 3 or 4 children have the lowest poverty rate of 0.0%, which includes 0 families.
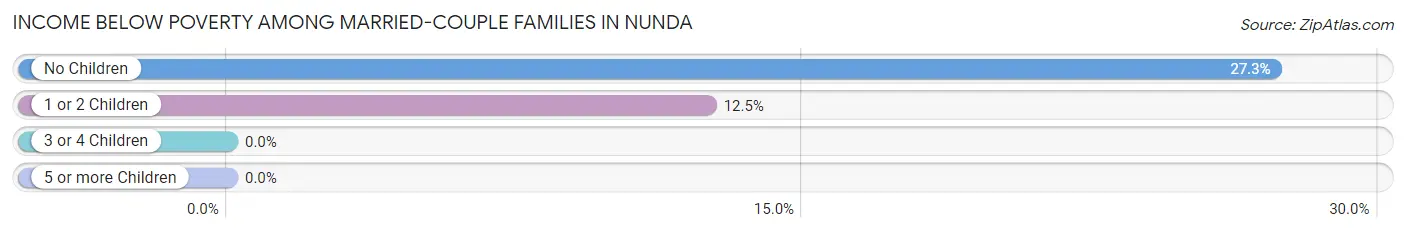
| Children | Above Poverty | Below Poverty |
| No Children | 96 (72.7%) | 36 (27.3%) |
| 1 or 2 Children | 21 (87.5%) | 3 (12.5%) |
| 3 or 4 Children | 4 (100.0%) | 0 (0.0%) |
| 5 or more Children | 0 (0.0%) | 0 (0.0%) |
| Total | 121 (75.6%) | 39 (24.4%) |
Income Below Poverty Among Single-Parent Households in Nunda
According to the poverty data in Nunda, 7.6% or 5 single-father households and 36.0% or 18 single-mother households are living below the poverty line. Among single-father households, those with 1 or 2 children have the highest poverty rate, with 5 households (10.6%) experiencing poverty. Likewise, among single-mother households, those with 1 or 2 children have the highest poverty rate, with 18 households (85.7%) falling below the poverty line.
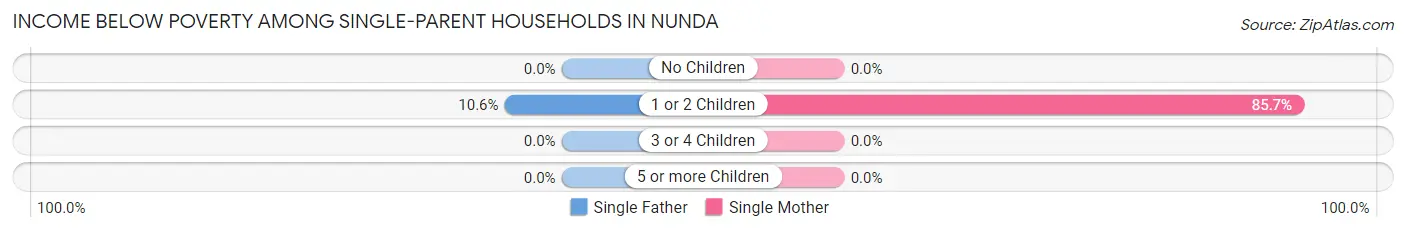
| Children | Single Father | Single Mother |
| No Children | 0 (0.0%) | 0 (0.0%) |
| 1 or 2 Children | 5 (10.6%) | 18 (85.7%) |
| 3 or 4 Children | 0 (0.0%) | 0 (0.0%) |
| 5 or more Children | 0 (0.0%) | 0 (0.0%) |
| Total | 5 (7.6%) | 18 (36.0%) |
Income Below Poverty Among Married-Couple vs Single-Parent Households in Nunda
The poverty data for Nunda shows that 39 of the married-couple family households (24.4%) and 23 of the single-parent households (19.8%) are living below the poverty level. Within the married-couple family households, those with no children have the highest poverty rate, with 36 households (27.3%) falling below the poverty line. Among the single-parent households, those with 1 or 2 children have the highest poverty rate, with 23 household (33.8%) living below poverty.
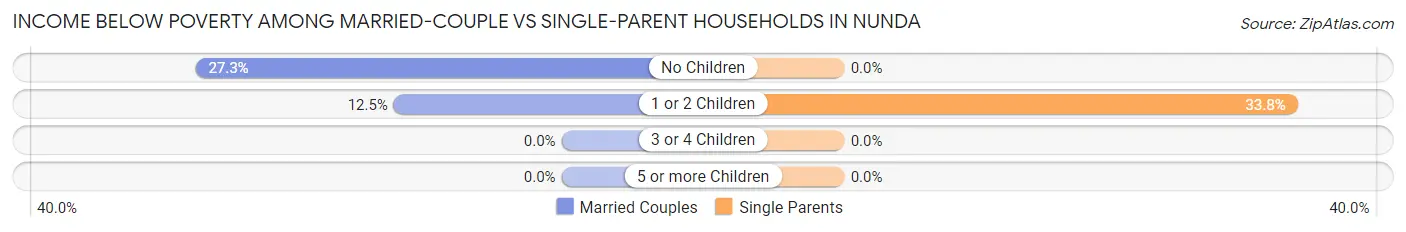
| Children | Married-Couple Families | Single-Parent Households |
| No Children | 36 (27.3%) | 0 (0.0%) |
| 1 or 2 Children | 3 (12.5%) | 23 (33.8%) |
| 3 or 4 Children | 0 (0.0%) | 0 (0.0%) |
| 5 or more Children | 0 (0.0%) | 0 (0.0%) |
| Total | 39 (24.4%) | 23 (19.8%) |
Race in Nunda
The most populous races in Nunda are White / Caucasian (982 | 86.1%), Two or more Races (110 | 9.7%), and Black / African American (48 | 4.2%).
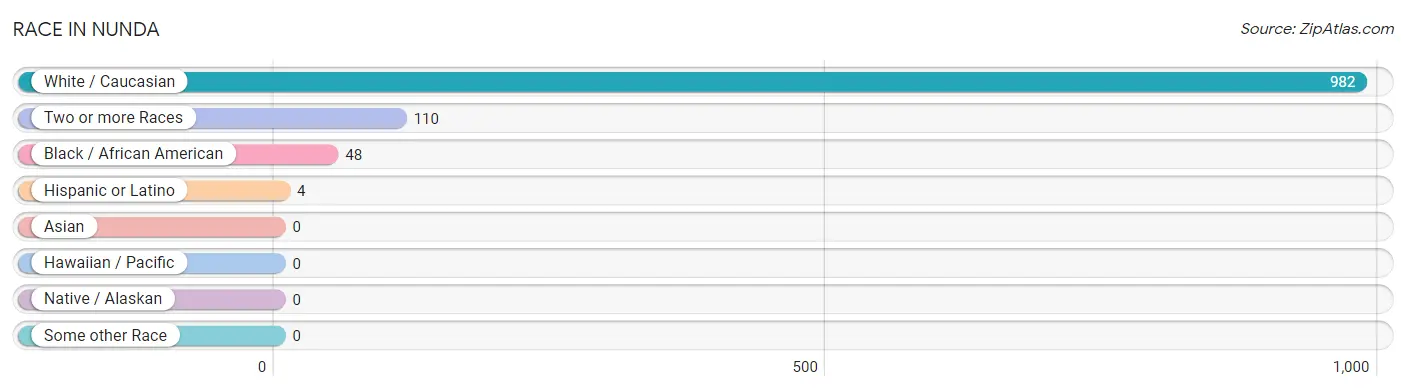
| Race | # Population | % Population |
| Asian | 0 | 0.0% |
| Black / African American | 48 | 4.2% |
| Hawaiian / Pacific | 0 | 0.0% |
| Hispanic or Latino | 4 | 0.4% |
| Native / Alaskan | 0 | 0.0% |
| White / Caucasian | 982 | 86.1% |
| Two or more Races | 110 | 9.7% |
| Some other Race | 0 | 0.0% |
| Total | 1,140 | 100.0% |
Ancestry in Nunda
The most populous ancestries reported in Nunda are Irish (206 | 18.1%), English (192 | 16.8%), American (108 | 9.5%), German (107 | 9.4%), and Polish (92 | 8.1%), together accounting for 61.8% of all Nunda residents.
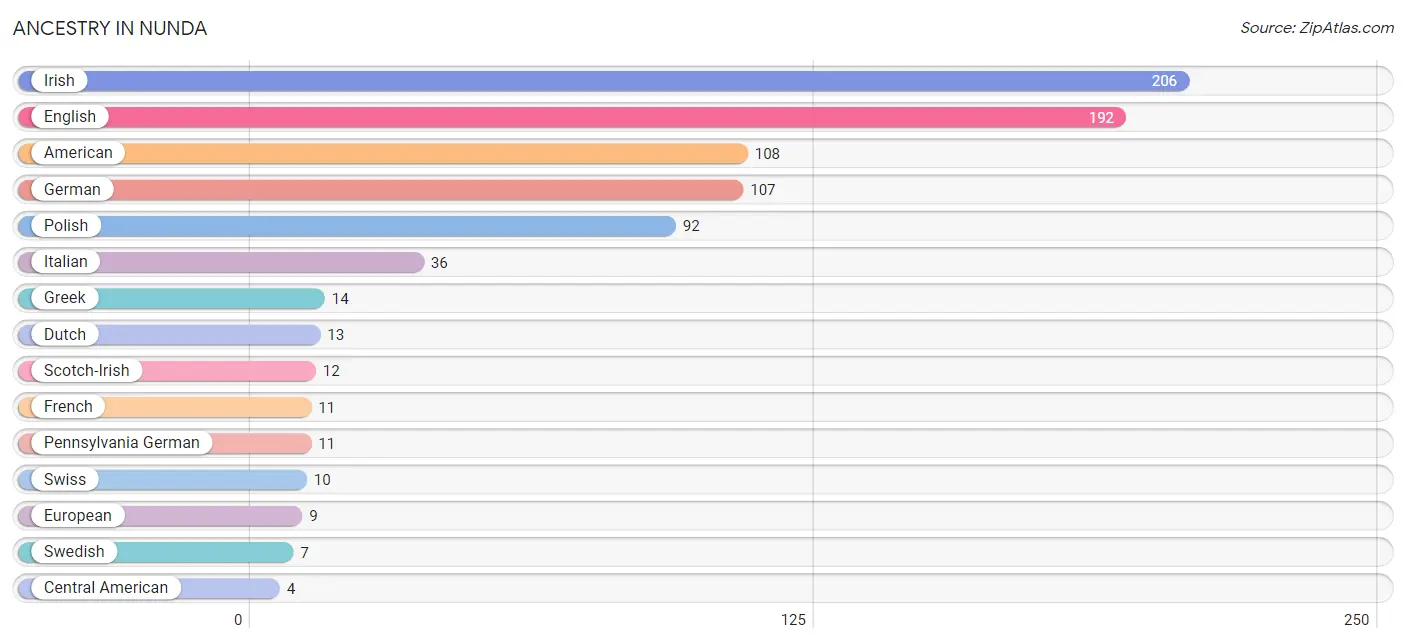
| Ancestry | # Population | % Population |
| American | 108 | 9.5% |
| Central American | 4 | 0.4% |
| Dutch | 13 | 1.1% |
| English | 192 | 16.8% |
| European | 9 | 0.8% |
| French | 11 | 1.0% |
| French Canadian | 2 | 0.2% |
| German | 107 | 9.4% |
| Greek | 14 | 1.2% |
| Guatemalan | 4 | 0.4% |
| Irish | 206 | 18.1% |
| Italian | 36 | 3.2% |
| Pennsylvania German | 11 | 1.0% |
| Polish | 92 | 8.1% |
| Russian | 2 | 0.2% |
| Scandinavian | 4 | 0.4% |
| Scotch-Irish | 12 | 1.1% |
| Scottish | 2 | 0.2% |
| Swedish | 7 | 0.6% |
| Swiss | 10 | 0.9% |
| Welsh | 4 | 0.4% | View All 21 Rows |
Immigrants in Nunda

| Immigration Origin | # Population | % Population | View All 0 Rows |
Sex and Age in Nunda
Sex and Age in Nunda
The most populous age groups in Nunda are 25 to 29 Years (98 | 16.2%) for men and 35 to 39 Years (73 | 13.6%) for women.
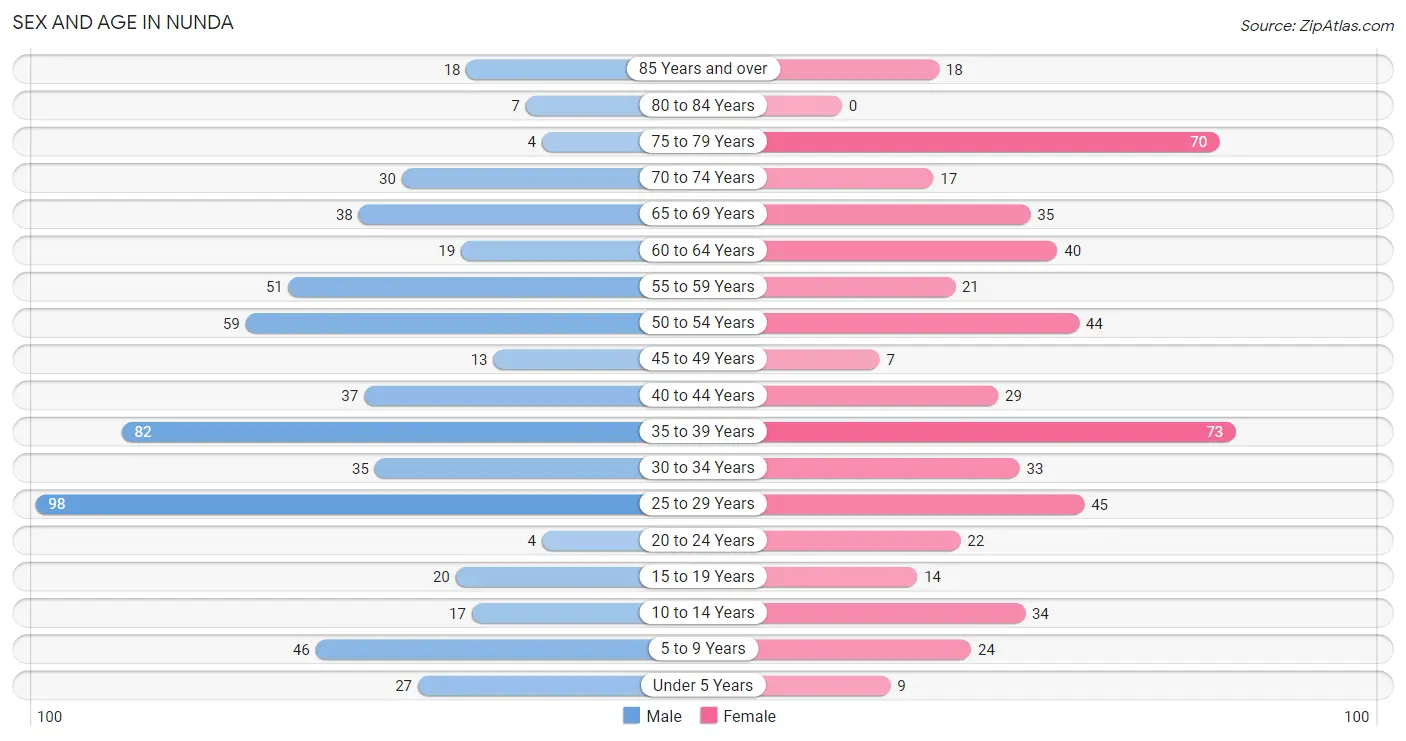
| Age Bracket | Male | Female |
| Under 5 Years | 27 (4.5%) | 9 (1.7%) |
| 5 to 9 Years | 46 (7.6%) | 24 (4.5%) |
| 10 to 14 Years | 17 (2.8%) | 34 (6.4%) |
| 15 to 19 Years | 20 (3.3%) | 14 (2.6%) |
| 20 to 24 Years | 4 (0.7%) | 22 (4.1%) |
| 25 to 29 Years | 98 (16.2%) | 45 (8.4%) |
| 30 to 34 Years | 35 (5.8%) | 33 (6.2%) |
| 35 to 39 Years | 82 (13.6%) | 73 (13.6%) |
| 40 to 44 Years | 37 (6.1%) | 29 (5.4%) |
| 45 to 49 Years | 13 (2.1%) | 7 (1.3%) |
| 50 to 54 Years | 59 (9.8%) | 44 (8.2%) |
| 55 to 59 Years | 51 (8.4%) | 21 (3.9%) |
| 60 to 64 Years | 19 (3.1%) | 40 (7.5%) |
| 65 to 69 Years | 38 (6.3%) | 35 (6.5%) |
| 70 to 74 Years | 30 (5.0%) | 17 (3.2%) |
| 75 to 79 Years | 4 (0.7%) | 70 (13.1%) |
| 80 to 84 Years | 7 (1.2%) | 0 (0.0%) |
| 85 Years and over | 18 (3.0%) | 18 (3.4%) |
| Total | 605 (100.0%) | 535 (100.0%) |
Families and Households in Nunda
Median Family Size in Nunda
The median family size in Nunda is 2.48 persons per family, with married-couple families (160 | 58.0%) accounting for the largest median family size of 2.54 persons per family. On the other hand, single female/mother families (50 | 18.1%) represent the smallest median family size with 2.26 persons per family.
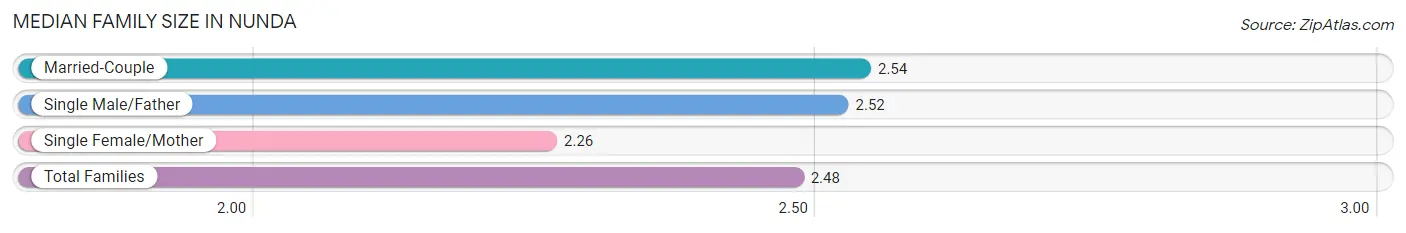
| Family Type | # Families | Family Size |
| Married-Couple | 160 (58.0%) | 2.54 |
| Single Male/Father | 66 (23.9%) | 2.52 |
| Single Female/Mother | 50 (18.1%) | 2.26 |
| Total Families | 276 (100.0%) | 2.48 |
Median Household Size in Nunda
The median household size in Nunda is 1.98 persons per household, with single male/father households (66 | 12.2%) accounting for the largest median household size of 2.92 persons per household. non-family households (263 | 48.8%) represent the smallest median household size with 1.34 persons per household.
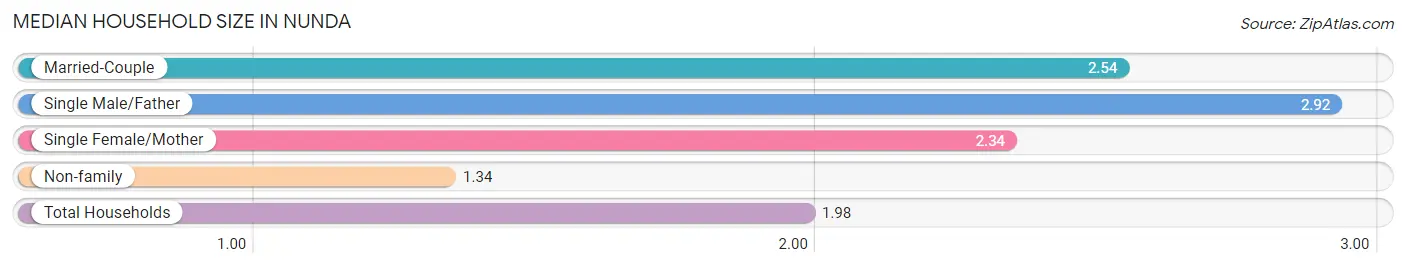
| Household Type | # Households | Household Size |
| Married-Couple | 160 (29.7%) | 2.54 |
| Single Male/Father | 66 (12.2%) | 2.92 |
| Single Female/Mother | 50 (9.3%) | 2.34 |
| Non-family | 263 (48.8%) | 1.34 |
| Total Households | 539 (100.0%) | 1.98 |
Household Size by Marriage Status in Nunda
Out of a total of 539 households in Nunda, 276 (51.2%) are family households, while 263 (48.8%) are nonfamily households. The most numerous type of family households are 2-person households, comprising 165, and the most common type of nonfamily households are 1-person households, comprising 205.
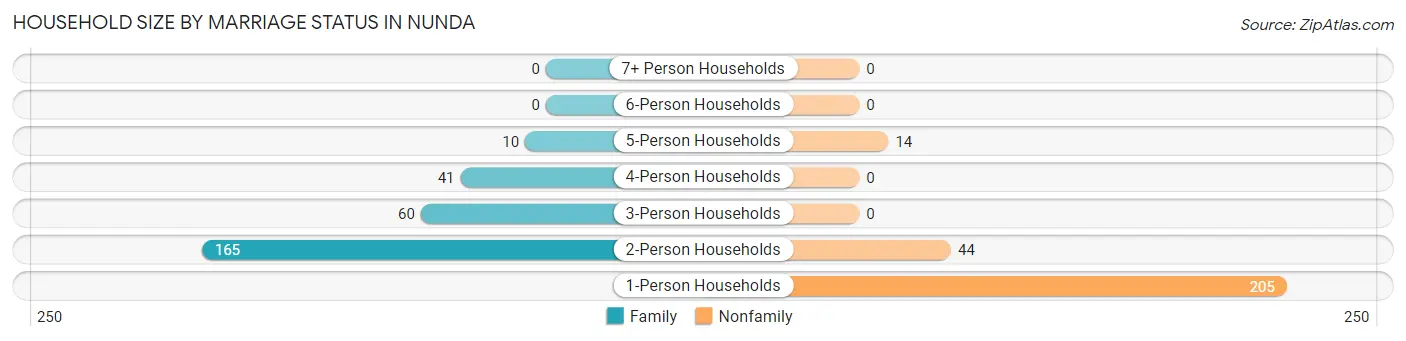
| Household Size | Family Households | Nonfamily Households |
| 1-Person Households | - | 205 (38.0%) |
| 2-Person Households | 165 (30.6%) | 44 (8.2%) |
| 3-Person Households | 60 (11.1%) | 0 (0.0%) |
| 4-Person Households | 41 (7.6%) | 0 (0.0%) |
| 5-Person Households | 10 (1.9%) | 14 (2.6%) |
| 6-Person Households | 0 (0.0%) | 0 (0.0%) |
| 7+ Person Households | 0 (0.0%) | 0 (0.0%) |
| Total | 276 (51.2%) | 263 (48.8%) |
Female Fertility in Nunda
Fertility by Age in Nunda
Average fertility rate in Nunda is 133.0 births per 1,000 women. Women in the age bracket of 20 to 34 years have the highest fertility rate with 310.0 births per 1,000 women. Women in the age bracket of 20 to 34 years acount for 100.0% of all women with births.
| Age Bracket | Women with Births | Births / 1,000 Women |
| 15 to 19 years | 0 (0.0%) | 0.0 |
| 20 to 34 years | 31 (100.0%) | 310.0 |
| 35 to 50 years | 0 (0.0%) | 0.0 |
| Total | 31 (100.0%) | 133.0 |
Fertility by Age by Marriage Status in Nunda
12.9% of women with births (31) in Nunda are married. The highest percentage of unmarried women with births falls into 20 to 34 years age bracket with 87.1% of them unmarried at the time of birth, while the lowest percentage of unmarried women with births belong to 20 to 34 years age bracket with 87.1% of them unmarried.
| Age Bracket | Married | Unmarried |
| 15 to 19 years | 0 (0.0%) | 0 (0.0%) |
| 20 to 34 years | 4 (12.9%) | 27 (87.1%) |
| 35 to 50 years | 0 (0.0%) | 0 (0.0%) |
| Total | 4 (12.9%) | 27 (87.1%) |
Fertility by Education in Nunda
| Educational Attainment | Women with Births | Births / 1,000 Women |
| Less than High School | 0 (0.0%) | 0.0 |
| High School Diploma | 0 (0.0%) | 0.0 |
| College or Associate's Degree | 27 (87.1%) | 409.0 |
| Bachelor's Degree | 0 (0.0%) | 0.0 |
| Graduate Degree | 4 (12.9%) | 500.0 |
| Total | 31 (100.0%) | 133.0 |
Fertility by Education by Marriage Status in Nunda
87.1% of women with births in Nunda are unmarried. Women with the educational attainment of graduate degree are most likely to be married with 100.0% of them married at childbirth, while women with the educational attainment of college or associate's degree are least likely to be married with 100.0% of them unmarried at childbirth.
| Educational Attainment | Married | Unmarried |
| Less than High School | 0 (0.0%) | 0 (0.0%) |
| High School Diploma | 0 (0.0%) | 0 (0.0%) |
| College or Associate's Degree | 0 (0.0%) | 27 (100.0%) |
| Bachelor's Degree | 0 (0.0%) | 0 (0.0%) |
| Graduate Degree | 4 (100.0%) | 0 (0.0%) |
| Total | 4 (12.9%) | 27 (87.1%) |
Employment Characteristics in Nunda
Employment by Class of Employer in Nunda
Among the 464 employed individuals in Nunda, private company employees (216 | 46.6%), not-for-profit organizations (114 | 24.6%), and self-employed (not incorporated) (60 | 12.9%) make up the most common classes of employment.
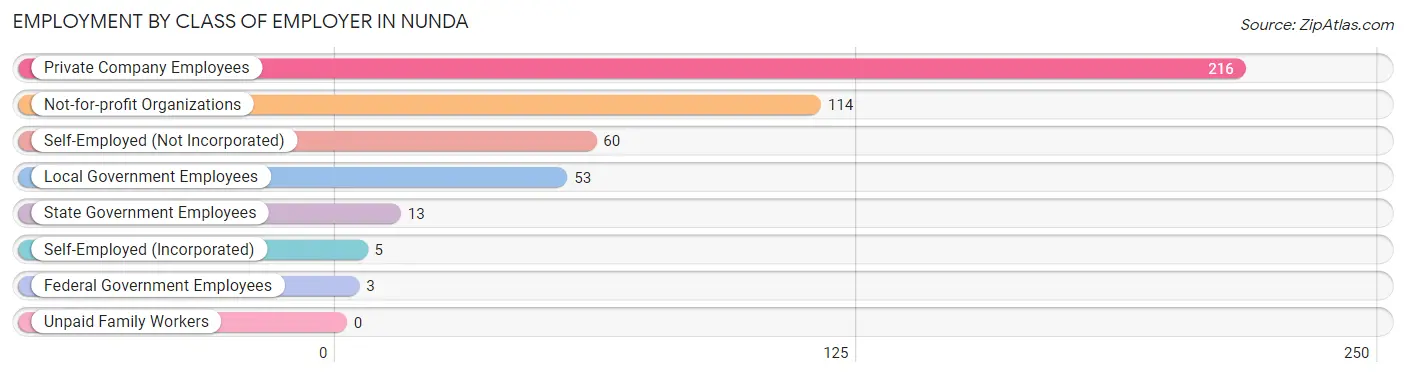
| Employer Class | # Employees | % Employees |
| Private Company Employees | 216 | 46.6% |
| Self-Employed (Incorporated) | 5 | 1.1% |
| Self-Employed (Not Incorporated) | 60 | 12.9% |
| Not-for-profit Organizations | 114 | 24.6% |
| Local Government Employees | 53 | 11.4% |
| State Government Employees | 13 | 2.8% |
| Federal Government Employees | 3 | 0.6% |
| Unpaid Family Workers | 0 | 0.0% |
| Total | 464 | 100.0% |
Employment Status by Age in Nunda
According to the labor force statistics for Nunda, out of the total population over 16 years of age (960), 51.8% or 497 individuals are in the labor force, with 2.0% or 10 of them unemployed. The age group with the highest labor force participation rate is 16 to 19 years, with 100.0% or 11 individuals in the labor force. Within the labor force, the 65 to 74 years age range has the highest percentage of unemployed individuals, with 37.5% or 6 of them being unemployed.
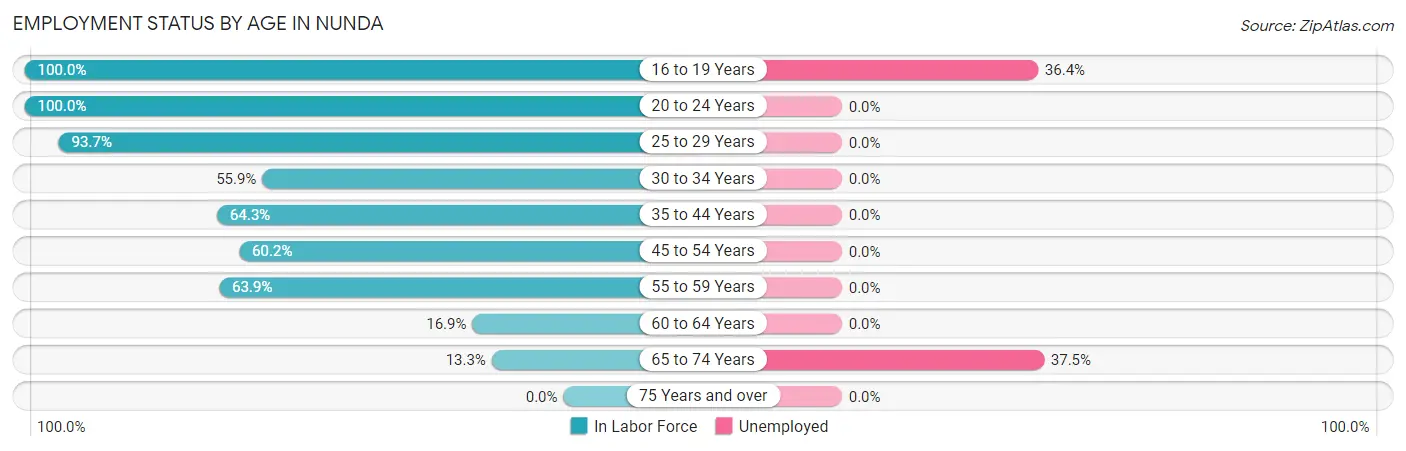
| Age Bracket | In Labor Force | Unemployed |
| 16 to 19 Years | 11 (100.0%) | 4 (36.4%) |
| 20 to 24 Years | 26 (100.0%) | 0 (0.0%) |
| 25 to 29 Years | 134 (93.7%) | 0 (0.0%) |
| 30 to 34 Years | 38 (55.9%) | 0 (0.0%) |
| 35 to 44 Years | 142 (64.3%) | 0 (0.0%) |
| 45 to 54 Years | 74 (60.2%) | 0 (0.0%) |
| 55 to 59 Years | 46 (63.9%) | 0 (0.0%) |
| 60 to 64 Years | 10 (16.9%) | 0 (0.0%) |
| 65 to 74 Years | 16 (13.3%) | 6 (37.5%) |
| 75 Years and over | 0 (0.0%) | 0 (0.0%) |
| Total | 497 (51.8%) | 10 (2.0%) |
Employment Status by Educational Attainment in Nunda
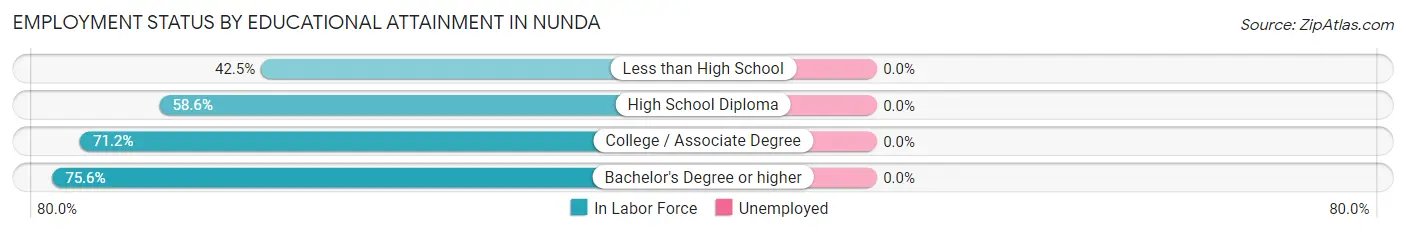
| Educational Attainment | In Labor Force | Unemployed |
| Less than High School | 34 (42.5%) | 0 (0.0%) |
| High School Diploma | 126 (58.6%) | 0 (0.0%) |
| College / Associate Degree | 185 (71.2%) | 0 (0.0%) |
| Bachelor's Degree or higher | 99 (75.6%) | 0 (0.0%) |
| Total | 444 (64.7%) | 0 (0.0%) |
Employment Occupations by Sex in Nunda
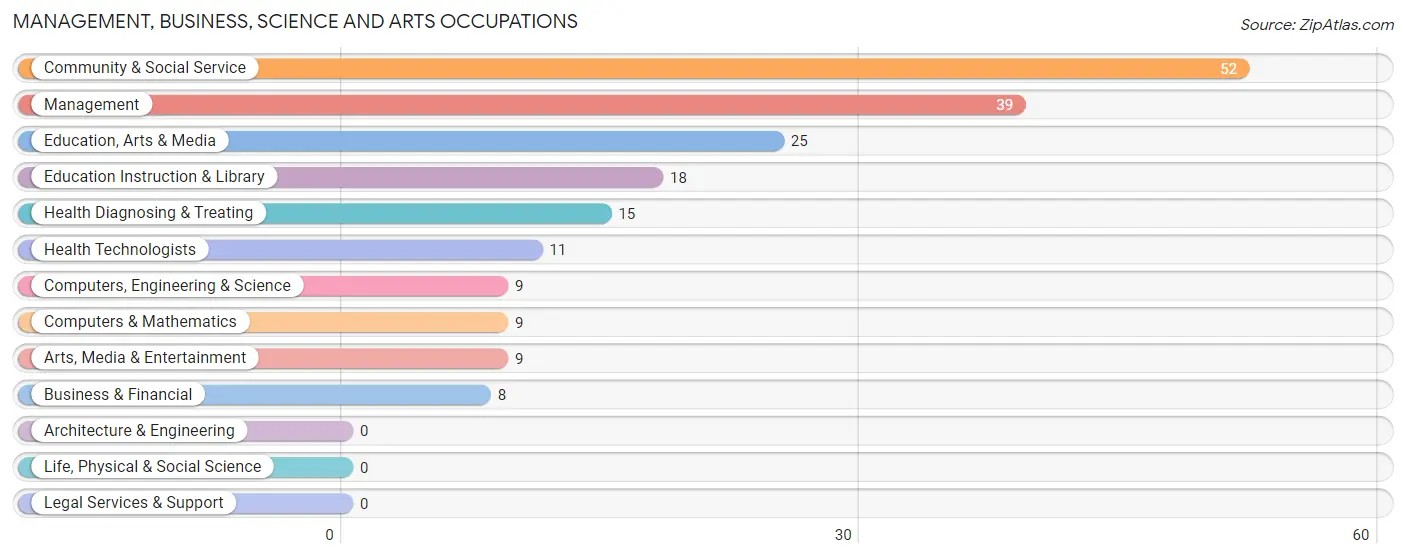
Management, Business, Science and Arts Occupations
The most common Management, Business, Science and Arts occupations in Nunda are Community & Social Service (52 | 10.7%), Management (39 | 8.0%), Education, Arts & Media (25 | 5.1%), Education Instruction & Library (18 | 3.7%), and Health Diagnosing & Treating (15 | 3.1%).
Management, Business, Science and Arts Occupations by Sex
Within the Management, Business, Science and Arts occupations in Nunda, the most male-oriented occupations are Education, Arts & Media (84.0%), Management (71.8%), and Business & Financial (50.0%), while the most female-oriented occupations are Education Instruction & Library (100.0%), Arts, Media & Entertainment (100.0%), and Health Diagnosing & Treating (73.3%).
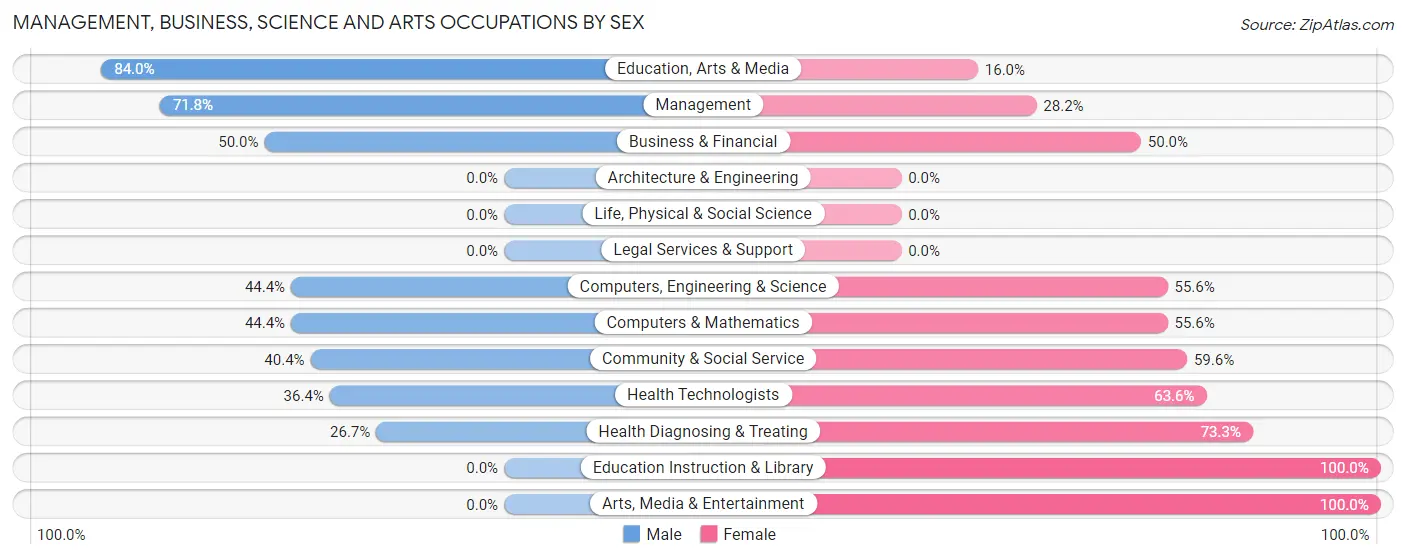
| Occupation | Male | Female |
| Management | 28 (71.8%) | 11 (28.2%) |
| Business & Financial | 4 (50.0%) | 4 (50.0%) |
| Computers, Engineering & Science | 4 (44.4%) | 5 (55.6%) |
| Computers & Mathematics | 4 (44.4%) | 5 (55.6%) |
| Architecture & Engineering | 0 (0.0%) | 0 (0.0%) |
| Life, Physical & Social Science | 0 (0.0%) | 0 (0.0%) |
| Community & Social Service | 21 (40.4%) | 31 (59.6%) |
| Education, Arts & Media | 21 (84.0%) | 4 (16.0%) |
| Legal Services & Support | 0 (0.0%) | 0 (0.0%) |
| Education Instruction & Library | 0 (0.0%) | 18 (100.0%) |
| Arts, Media & Entertainment | 0 (0.0%) | 9 (100.0%) |
| Health Diagnosing & Treating | 4 (26.7%) | 11 (73.3%) |
| Health Technologists | 4 (36.4%) | 7 (63.6%) |
| Total (Category) | 61 (49.6%) | 62 (50.4%) |
| Total (Overall) | 260 (53.4%) | 227 (46.6%) |
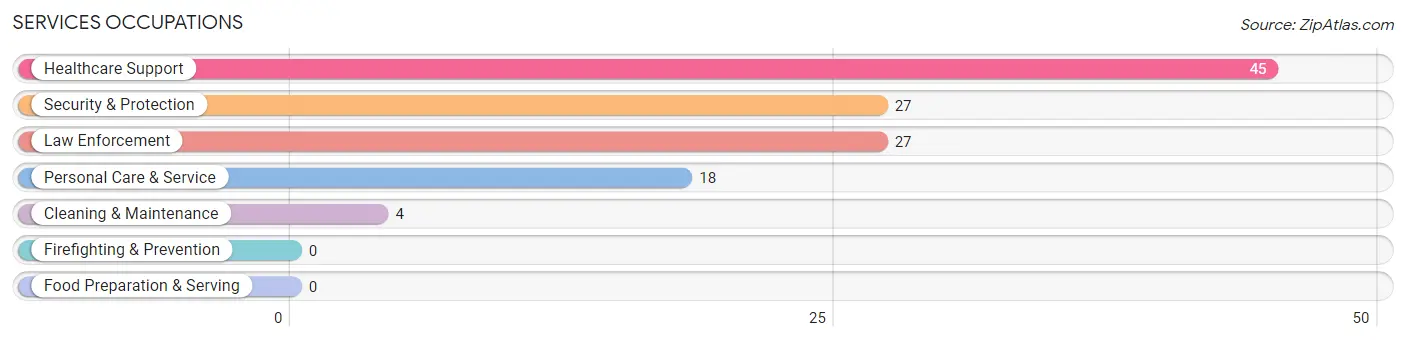
Services Occupations
The most common Services occupations in Nunda are Healthcare Support (45 | 9.2%), Security & Protection (27 | 5.5%), Law Enforcement (27 | 5.5%), Personal Care & Service (18 | 3.7%), and Cleaning & Maintenance (4 | 0.8%).
Services Occupations by Sex
Within the Services occupations in Nunda, the most male-oriented occupations are Cleaning & Maintenance (100.0%), Security & Protection (48.1%), and Law Enforcement (48.1%), while the most female-oriented occupations are Healthcare Support (100.0%), Personal Care & Service (100.0%), and Security & Protection (51.8%).
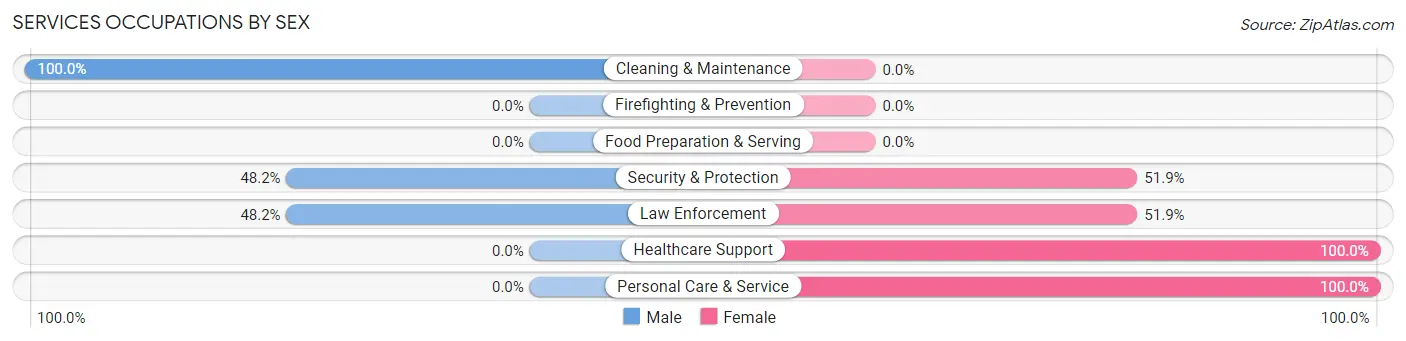
| Occupation | Male | Female |
| Healthcare Support | 0 (0.0%) | 45 (100.0%) |
| Security & Protection | 13 (48.1%) | 14 (51.8%) |
| Firefighting & Prevention | 0 (0.0%) | 0 (0.0%) |
| Law Enforcement | 13 (48.1%) | 14 (51.8%) |
| Food Preparation & Serving | 0 (0.0%) | 0 (0.0%) |
| Cleaning & Maintenance | 4 (100.0%) | 0 (0.0%) |
| Personal Care & Service | 0 (0.0%) | 18 (100.0%) |
| Total (Category) | 17 (18.1%) | 77 (81.9%) |
| Total (Overall) | 260 (53.4%) | 227 (46.6%) |
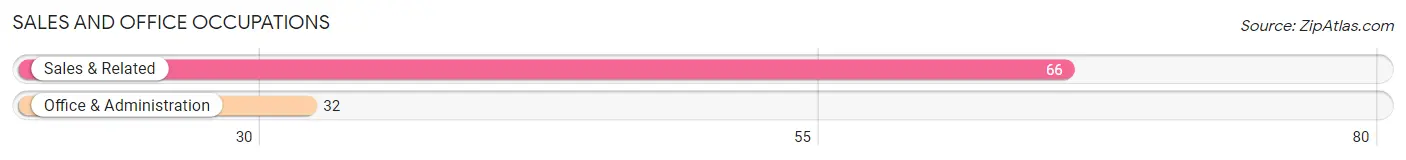
Sales and Office Occupations
The most common Sales and Office occupations in Nunda are Sales & Related (66 | 13.6%), and Office & Administration (32 | 6.6%).
Sales and Office Occupations by Sex
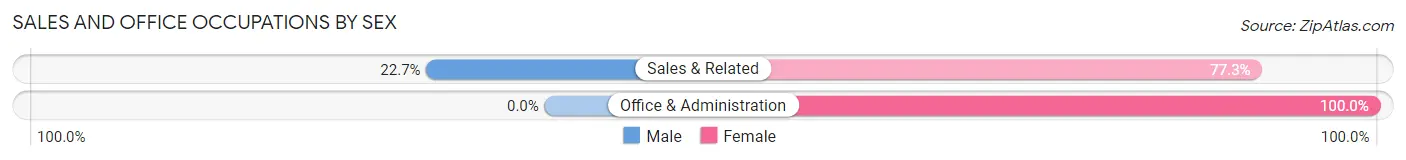
| Occupation | Male | Female |
| Sales & Related | 15 (22.7%) | 51 (77.3%) |
| Office & Administration | 0 (0.0%) | 32 (100.0%) |
| Total (Category) | 15 (15.3%) | 83 (84.7%) |
| Total (Overall) | 260 (53.4%) | 227 (46.6%) |
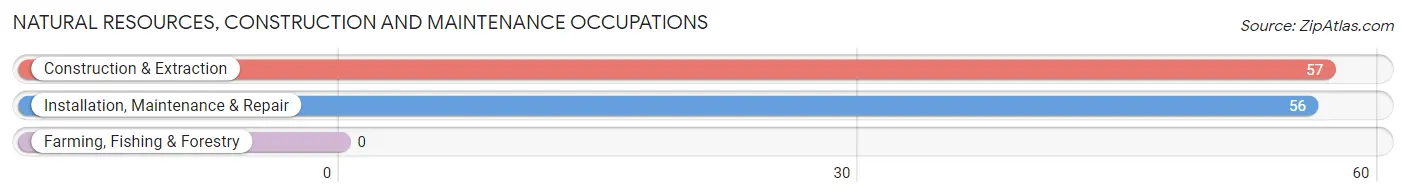
Natural Resources, Construction and Maintenance Occupations
The most common Natural Resources, Construction and Maintenance occupations in Nunda are Construction & Extraction (57 | 11.7%), and Installation, Maintenance & Repair (56 | 11.5%).
Natural Resources, Construction and Maintenance Occupations by Sex
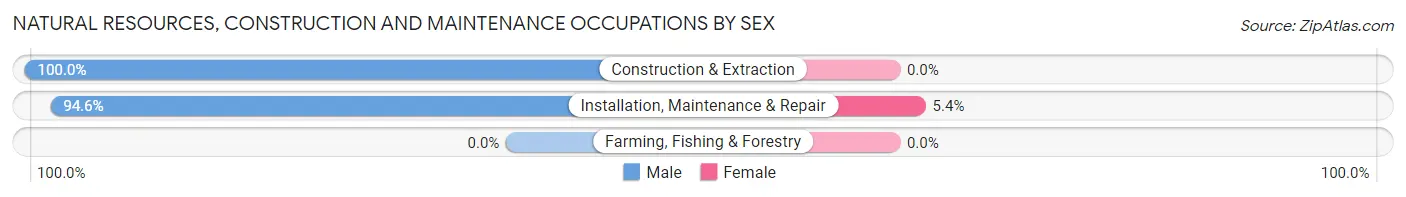
| Occupation | Male | Female |
| Farming, Fishing & Forestry | 0 (0.0%) | 0 (0.0%) |
| Construction & Extraction | 57 (100.0%) | 0 (0.0%) |
| Installation, Maintenance & Repair | 53 (94.6%) | 3 (5.4%) |
| Total (Category) | 110 (97.4%) | 3 (2.6%) |
| Total (Overall) | 260 (53.4%) | 227 (46.6%) |
Production, Transportation and Moving Occupations
The most common Production, Transportation and Moving occupations in Nunda are Production (37 | 7.6%), Material Moving (19 | 3.9%), and Transportation (3 | 0.6%).
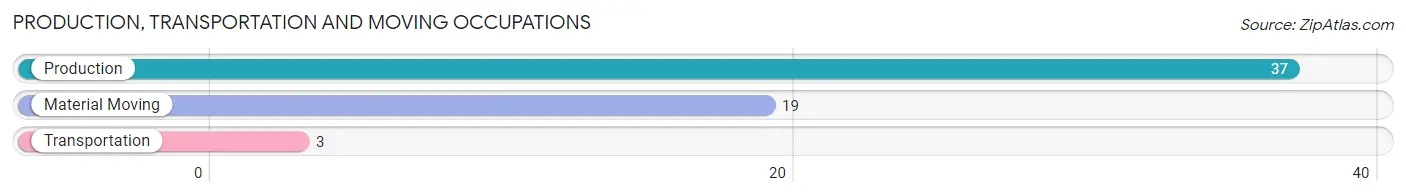
Production, Transportation and Moving Occupations by Sex
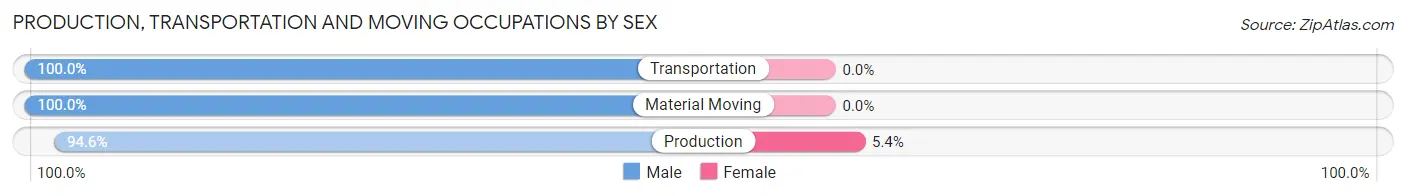
| Occupation | Male | Female |
| Production | 35 (94.6%) | 2 (5.4%) |
| Transportation | 3 (100.0%) | 0 (0.0%) |
| Material Moving | 19 (100.0%) | 0 (0.0%) |
| Total (Category) | 57 (96.6%) | 2 (3.4%) |
| Total (Overall) | 260 (53.4%) | 227 (46.6%) |
Employment Industries by Sex in Nunda
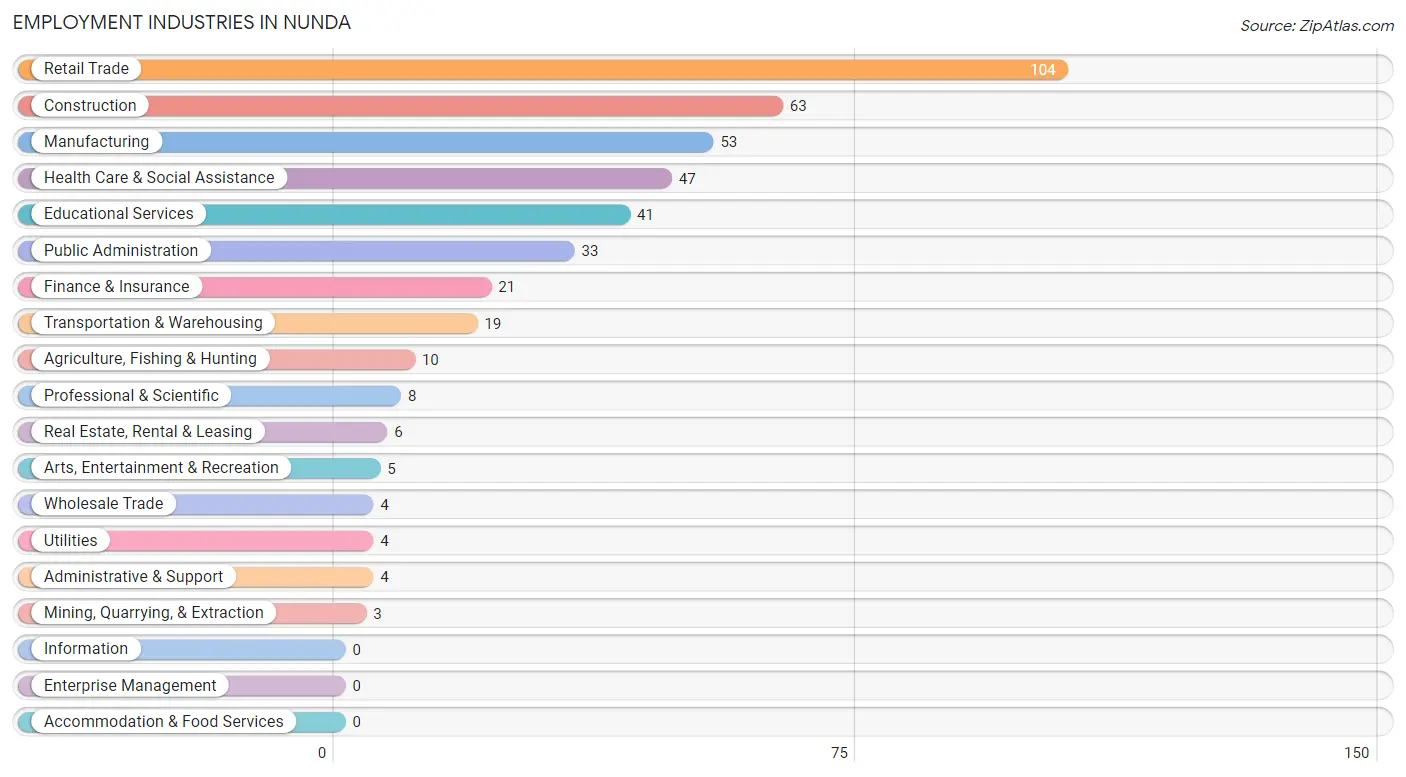
Employment Industries in Nunda
The major employment industries in Nunda include Retail Trade (104 | 21.4%), Construction (63 | 12.9%), Manufacturing (53 | 10.9%), Health Care & Social Assistance (47 | 9.7%), and Educational Services (41 | 8.4%).
Employment Industries by Sex in Nunda
The Nunda industries that see more men than women are Mining, Quarrying, & Extraction (100.0%), Transportation & Warehousing (100.0%), and Utilities (100.0%), whereas the industries that tend to have a higher number of women are Agriculture, Fishing & Hunting (100.0%), Wholesale Trade (100.0%), and Finance & Insurance (80.9%).
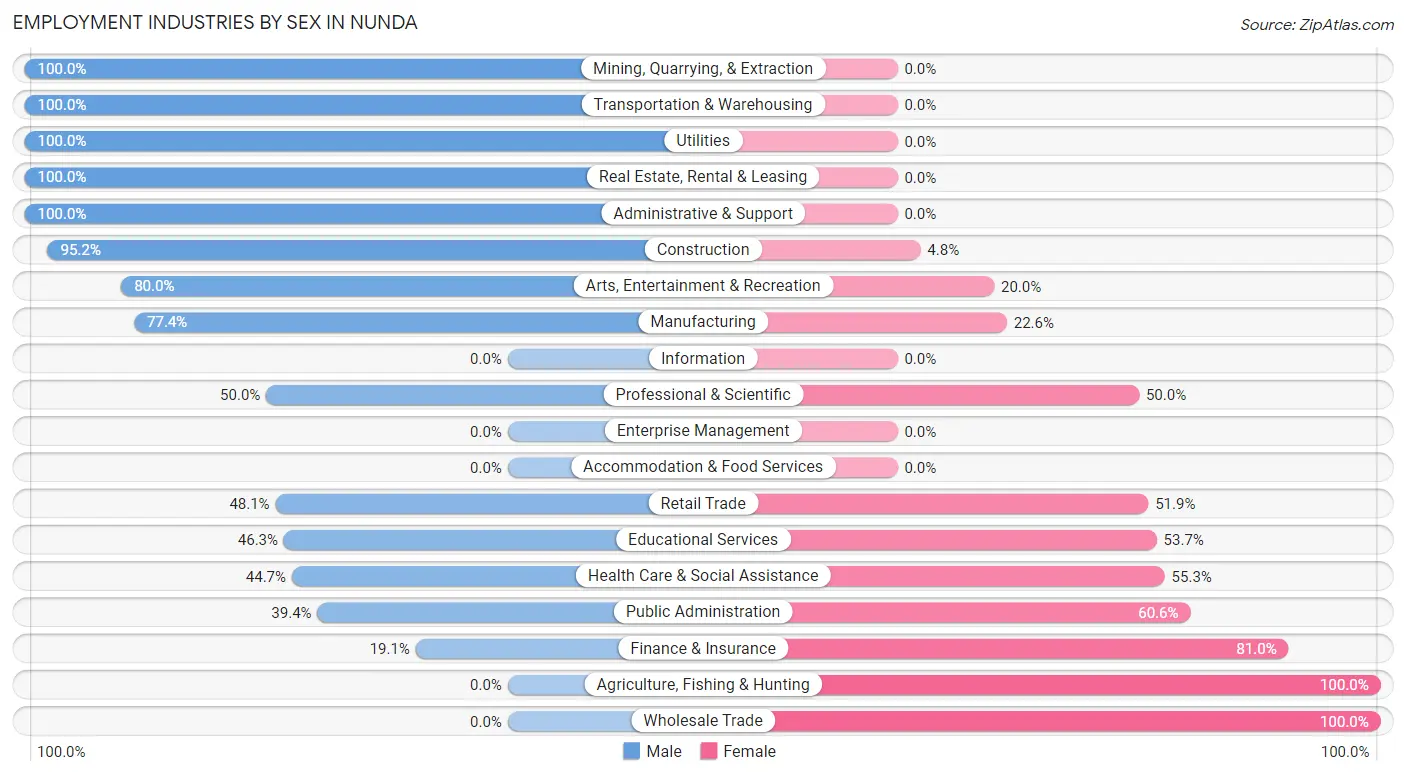
| Industry | Male | Female |
| Agriculture, Fishing & Hunting | 0 (0.0%) | 10 (100.0%) |
| Mining, Quarrying, & Extraction | 3 (100.0%) | 0 (0.0%) |
| Construction | 60 (95.2%) | 3 (4.8%) |
| Manufacturing | 41 (77.4%) | 12 (22.6%) |
| Wholesale Trade | 0 (0.0%) | 4 (100.0%) |
| Retail Trade | 50 (48.1%) | 54 (51.9%) |
| Transportation & Warehousing | 19 (100.0%) | 0 (0.0%) |
| Utilities | 4 (100.0%) | 0 (0.0%) |
| Information | 0 (0.0%) | 0 (0.0%) |
| Finance & Insurance | 4 (19.1%) | 17 (80.9%) |
| Real Estate, Rental & Leasing | 6 (100.0%) | 0 (0.0%) |
| Professional & Scientific | 4 (50.0%) | 4 (50.0%) |
| Enterprise Management | 0 (0.0%) | 0 (0.0%) |
| Administrative & Support | 4 (100.0%) | 0 (0.0%) |
| Educational Services | 19 (46.3%) | 22 (53.7%) |
| Health Care & Social Assistance | 21 (44.7%) | 26 (55.3%) |
| Arts, Entertainment & Recreation | 4 (80.0%) | 1 (20.0%) |
| Accommodation & Food Services | 0 (0.0%) | 0 (0.0%) |
| Public Administration | 13 (39.4%) | 20 (60.6%) |
| Total | 260 (53.4%) | 227 (46.6%) |
Education in Nunda
School Enrollment in Nunda
The most common levels of schooling among the 208 students in Nunda are elementary school (60 | 28.8%), college / undergraduate (45 | 21.6%), and high school (39 | 18.8%).
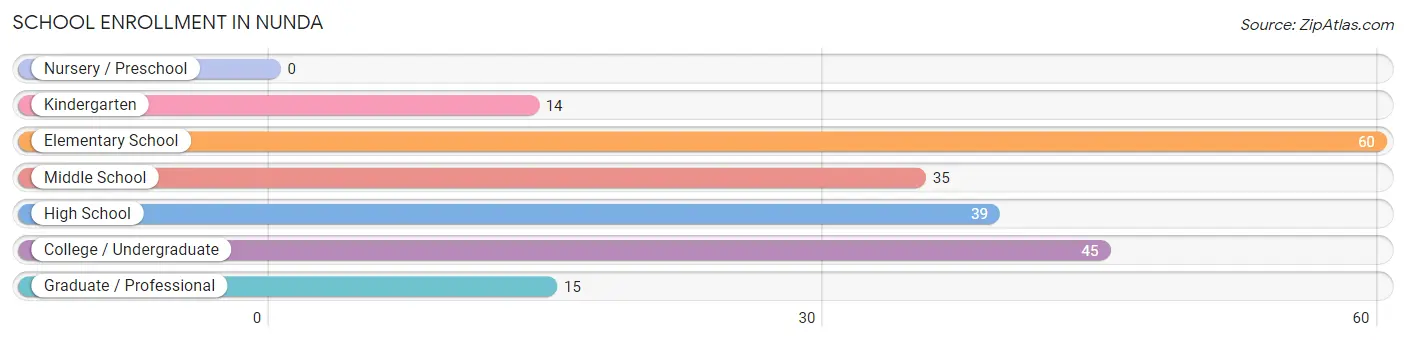
| School Level | # Students | % Students |
| Nursery / Preschool | 0 | 0.0% |
| Kindergarten | 14 | 6.7% |
| Elementary School | 60 | 28.8% |
| Middle School | 35 | 16.8% |
| High School | 39 | 18.8% |
| College / Undergraduate | 45 | 21.6% |
| Graduate / Professional | 15 | 7.2% |
| Total | 208 | 100.0% |
School Enrollment by Age by Funding Source in Nunda
Out of a total of 208 students who are enrolled in schools in Nunda, 65 (31.3%) attend a private institution, while the remaining 143 (68.7%) are enrolled in public schools. The age group of 20 to 24 year olds has the highest likelihood of being enrolled in private schools, with 4 (100.0% in the age bracket) enrolled. Conversely, the age group of 10 to 14 year olds has the lowest likelihood of being enrolled in a private school, with 51 (100.0% in the age bracket) attending a public institution.
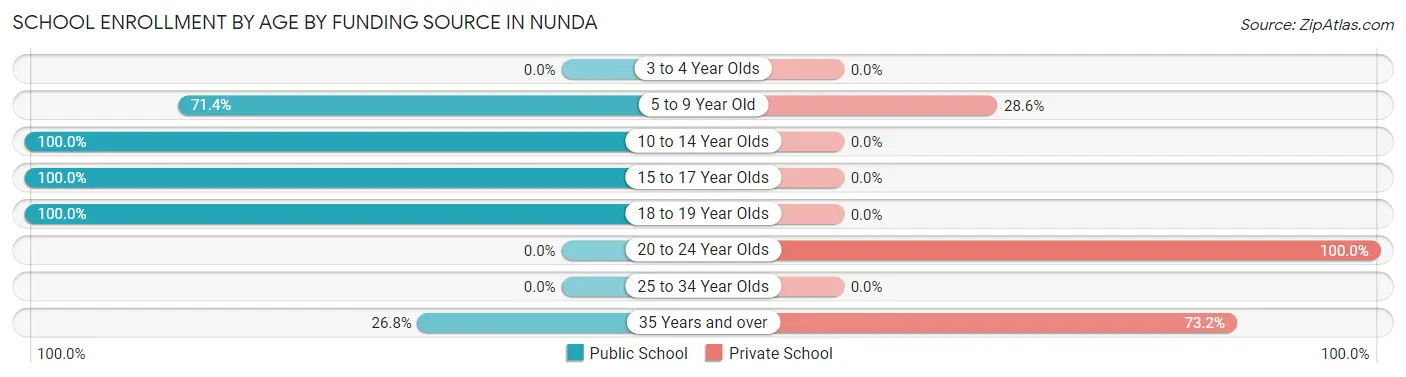
| Age Bracket | Public School | Private School |
| 3 to 4 Year Olds | 0 (0.0%) | 0 (0.0%) |
| 5 to 9 Year Old | 50 (71.4%) | 20 (28.6%) |
| 10 to 14 Year Olds | 51 (100.0%) | 0 (0.0%) |
| 15 to 17 Year Olds | 23 (100.0%) | 0 (0.0%) |
| 18 to 19 Year Olds | 4 (100.0%) | 0 (0.0%) |
| 20 to 24 Year Olds | 0 (0.0%) | 4 (100.0%) |
| 25 to 34 Year Olds | 0 (0.0%) | 0 (0.0%) |
| 35 Years and over | 15 (26.8%) | 41 (73.2%) |
| Total | 143 (68.8%) | 65 (31.3%) |
Educational Attainment by Field of Study in Nunda
Science & technology (55 | 28.1%), visual & performing arts (41 | 20.9%), arts & humanities (17 | 8.7%), social sciences (15 | 7.6%), and engineering (15 | 7.6%) are the most common fields of study among 196 individuals in Nunda who have obtained a bachelor's degree or higher.
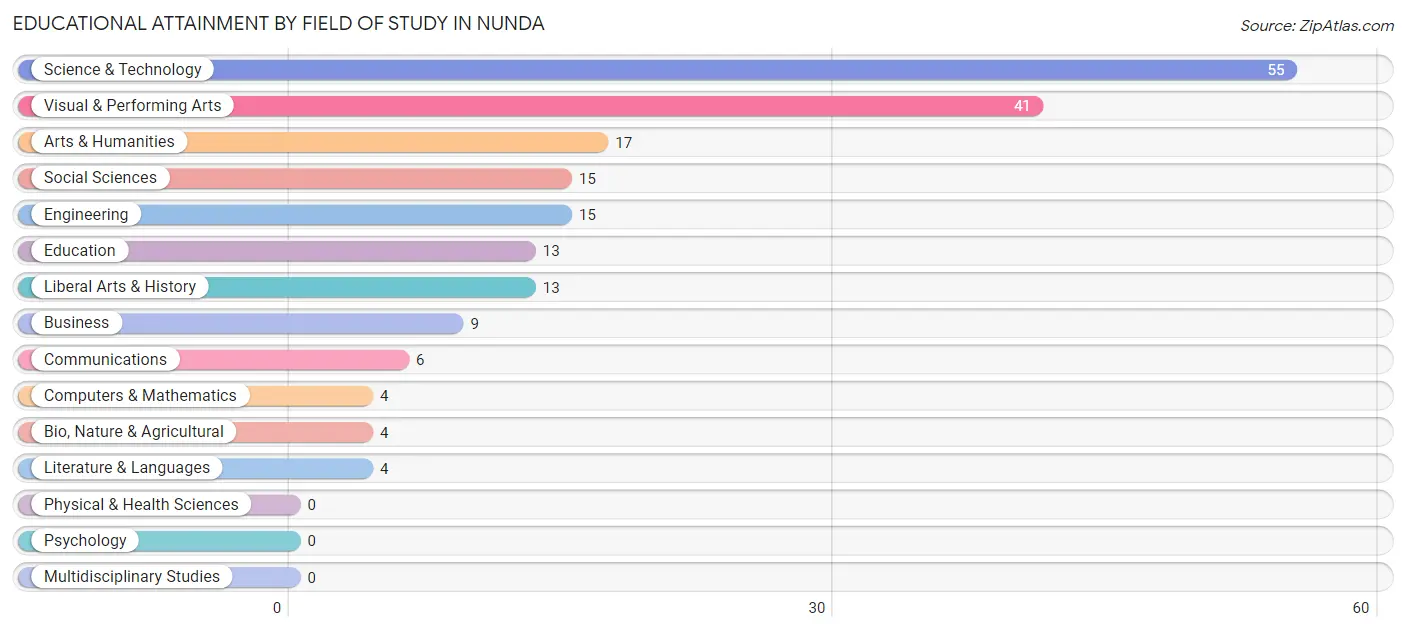
| Field of Study | # Graduates | % Graduates |
| Computers & Mathematics | 4 | 2.0% |
| Bio, Nature & Agricultural | 4 | 2.0% |
| Physical & Health Sciences | 0 | 0.0% |
| Psychology | 0 | 0.0% |
| Social Sciences | 15 | 7.6% |
| Engineering | 15 | 7.6% |
| Multidisciplinary Studies | 0 | 0.0% |
| Science & Technology | 55 | 28.1% |
| Business | 9 | 4.6% |
| Education | 13 | 6.6% |
| Literature & Languages | 4 | 2.0% |
| Liberal Arts & History | 13 | 6.6% |
| Visual & Performing Arts | 41 | 20.9% |
| Communications | 6 | 3.1% |
| Arts & Humanities | 17 | 8.7% |
| Total | 196 | 100.0% |
Transportation & Commute in Nunda
Vehicle Availability by Sex in Nunda
The most prevalent vehicle ownership categories in Nunda are males with 2 vehicles (142, accounting for 57.7%) and females with 2 vehicles (91, making up 65.1%).
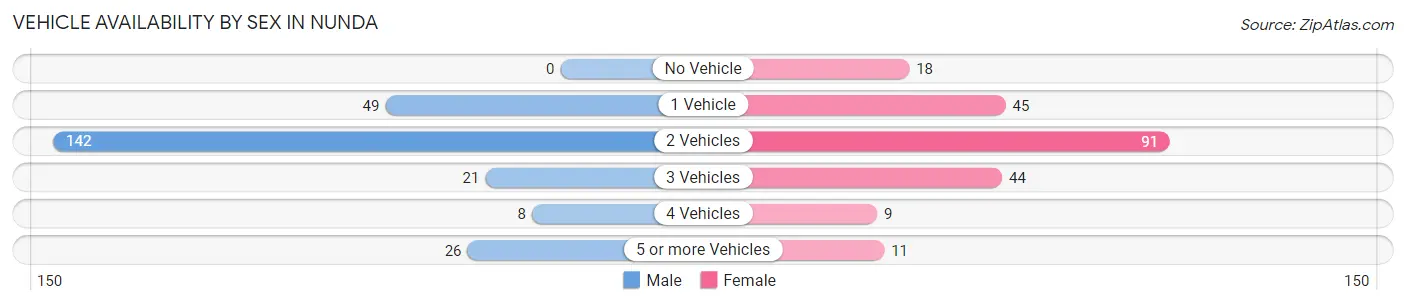
| Vehicles Available | Male | Female |
| No Vehicle | 0 (0.0%) | 18 (8.3%) |
| 1 Vehicle | 49 (19.9%) | 45 (20.6%) |
| 2 Vehicles | 142 (57.7%) | 91 (41.7%) |
| 3 Vehicles | 21 (8.5%) | 44 (20.2%) |
| 4 Vehicles | 8 (3.3%) | 9 (4.1%) |
| 5 or more Vehicles | 26 (10.6%) | 11 (5.1%) |
| Total | 246 (100.0%) | 218 (100.0%) |
Commute Time in Nunda
The most frequently occuring commute durations in Nunda are 30 to 34 minutes (65 commuters, 15.7%), 5 to 9 minutes (63 commuters, 15.2%), and less than 5 minutes (44 commuters, 10.6%).
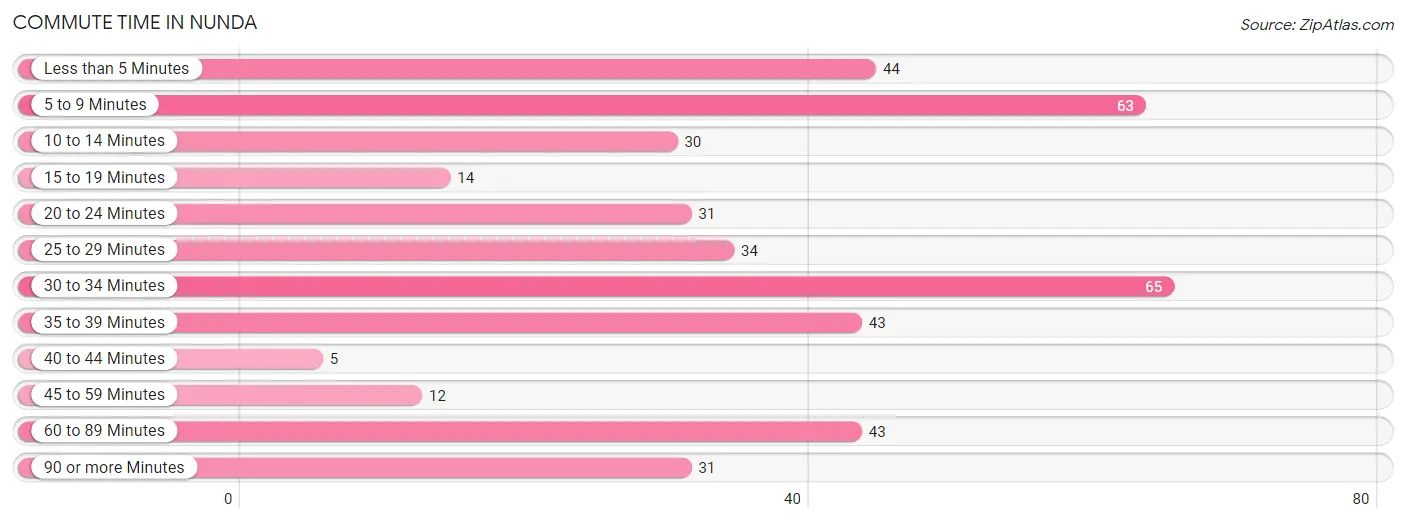
| Commute Time | # Commuters | % Commuters |
| Less than 5 Minutes | 44 | 10.6% |
| 5 to 9 Minutes | 63 | 15.2% |
| 10 to 14 Minutes | 30 | 7.2% |
| 15 to 19 Minutes | 14 | 3.4% |
| 20 to 24 Minutes | 31 | 7.5% |
| 25 to 29 Minutes | 34 | 8.2% |
| 30 to 34 Minutes | 65 | 15.7% |
| 35 to 39 Minutes | 43 | 10.4% |
| 40 to 44 Minutes | 5 | 1.2% |
| 45 to 59 Minutes | 12 | 2.9% |
| 60 to 89 Minutes | 43 | 10.4% |
| 90 or more Minutes | 31 | 7.5% |
Commute Time by Sex in Nunda
The most common commute times in Nunda are 30 to 34 minutes (59 commuters, 24.4%) for males and less than 5 minutes (31 commuters, 17.9%) for females.
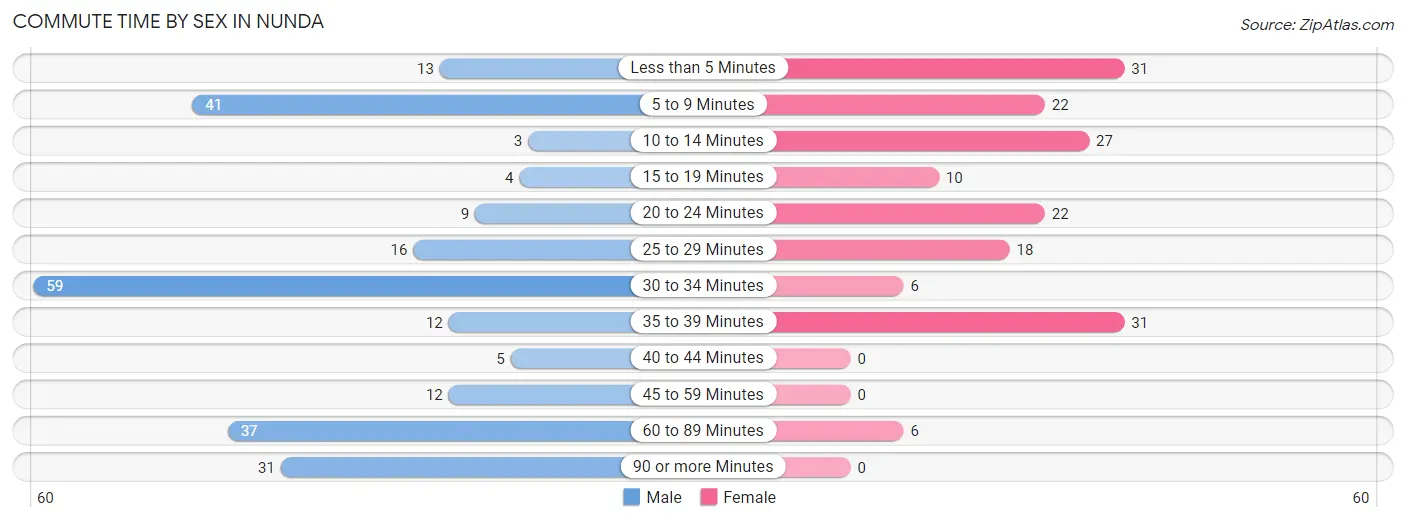
| Commute Time | Male | Female |
| Less than 5 Minutes | 13 (5.4%) | 31 (17.9%) |
| 5 to 9 Minutes | 41 (16.9%) | 22 (12.7%) |
| 10 to 14 Minutes | 3 (1.2%) | 27 (15.6%) |
| 15 to 19 Minutes | 4 (1.7%) | 10 (5.8%) |
| 20 to 24 Minutes | 9 (3.7%) | 22 (12.7%) |
| 25 to 29 Minutes | 16 (6.6%) | 18 (10.4%) |
| 30 to 34 Minutes | 59 (24.4%) | 6 (3.5%) |
| 35 to 39 Minutes | 12 (5.0%) | 31 (17.9%) |
| 40 to 44 Minutes | 5 (2.1%) | 0 (0.0%) |
| 45 to 59 Minutes | 12 (5.0%) | 0 (0.0%) |
| 60 to 89 Minutes | 37 (15.3%) | 6 (3.5%) |
| 90 or more Minutes | 31 (12.8%) | 0 (0.0%) |
Time of Departure to Work by Sex in Nunda
The most frequent times of departure to work in Nunda are 12:00 AM to 4:59 AM (57, 23.5%) for males and 4:00 PM to 11:59 PM (53, 30.6%) for females.
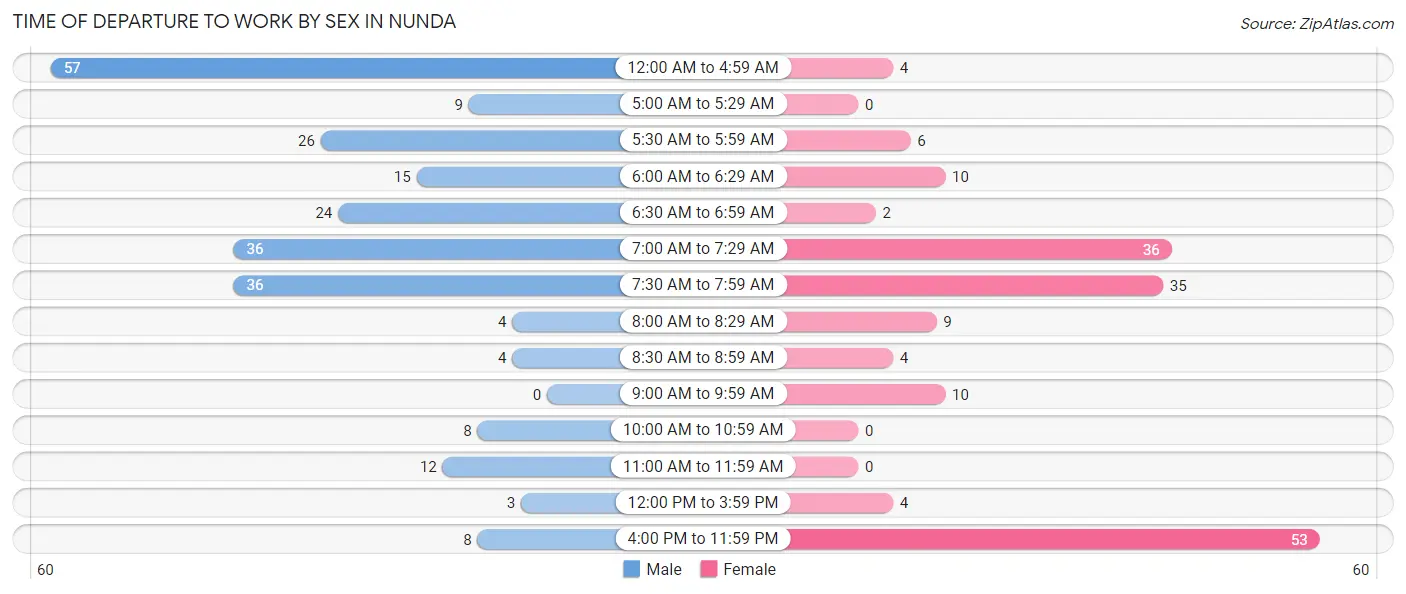
| Time of Departure | Male | Female |
| 12:00 AM to 4:59 AM | 57 (23.5%) | 4 (2.3%) |
| 5:00 AM to 5:29 AM | 9 (3.7%) | 0 (0.0%) |
| 5:30 AM to 5:59 AM | 26 (10.7%) | 6 (3.5%) |
| 6:00 AM to 6:29 AM | 15 (6.2%) | 10 (5.8%) |
| 6:30 AM to 6:59 AM | 24 (9.9%) | 2 (1.2%) |
| 7:00 AM to 7:29 AM | 36 (14.9%) | 36 (20.8%) |
| 7:30 AM to 7:59 AM | 36 (14.9%) | 35 (20.2%) |
| 8:00 AM to 8:29 AM | 4 (1.7%) | 9 (5.2%) |
| 8:30 AM to 8:59 AM | 4 (1.7%) | 4 (2.3%) |
| 9:00 AM to 9:59 AM | 0 (0.0%) | 10 (5.8%) |
| 10:00 AM to 10:59 AM | 8 (3.3%) | 0 (0.0%) |
| 11:00 AM to 11:59 AM | 12 (5.0%) | 0 (0.0%) |
| 12:00 PM to 3:59 PM | 3 (1.2%) | 4 (2.3%) |
| 4:00 PM to 11:59 PM | 8 (3.3%) | 53 (30.6%) |
| Total | 242 (100.0%) | 173 (100.0%) |
Housing Occupancy in Nunda
Occupancy by Ownership in Nunda
Of the total 539 dwellings in Nunda, owner-occupied units account for 317 (58.8%), while renter-occupied units make up 222 (41.2%).
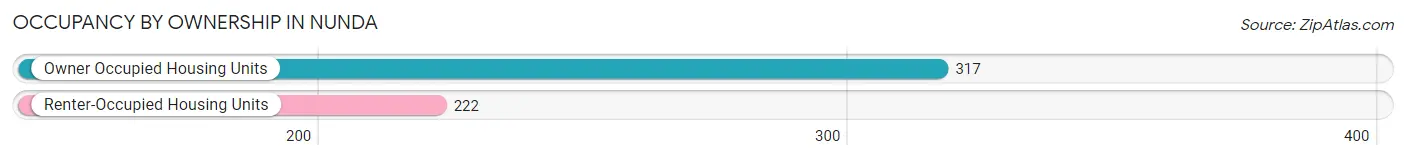
| Occupancy | # Housing Units | % Housing Units |
| Owner Occupied Housing Units | 317 | 58.8% |
| Renter-Occupied Housing Units | 222 | 41.2% |
| Total Occupied Housing Units | 539 | 100.0% |
Occupancy by Household Size in Nunda

| Household Size | # Housing Units | % Housing Units |
| 1-Person Household | 205 | 38.0% |
| 2-Person Household | 209 | 38.8% |
| 3-Person Household | 60 | 11.1% |
| 4+ Person Household | 65 | 12.1% |
| Total Housing Units | 539 | 100.0% |
Occupancy by Ownership by Household Size in Nunda
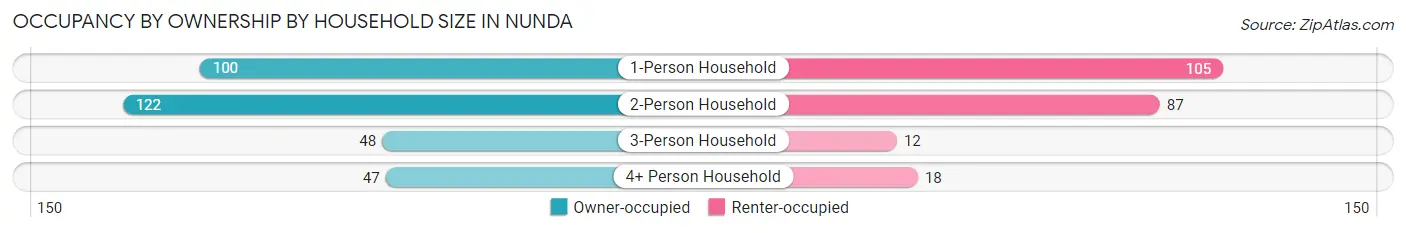
| Household Size | Owner-occupied | Renter-occupied |
| 1-Person Household | 100 (48.8%) | 105 (51.2%) |
| 2-Person Household | 122 (58.4%) | 87 (41.6%) |
| 3-Person Household | 48 (80.0%) | 12 (20.0%) |
| 4+ Person Household | 47 (72.3%) | 18 (27.7%) |
| Total Housing Units | 317 (58.8%) | 222 (41.2%) |
Occupancy by Educational Attainment in Nunda
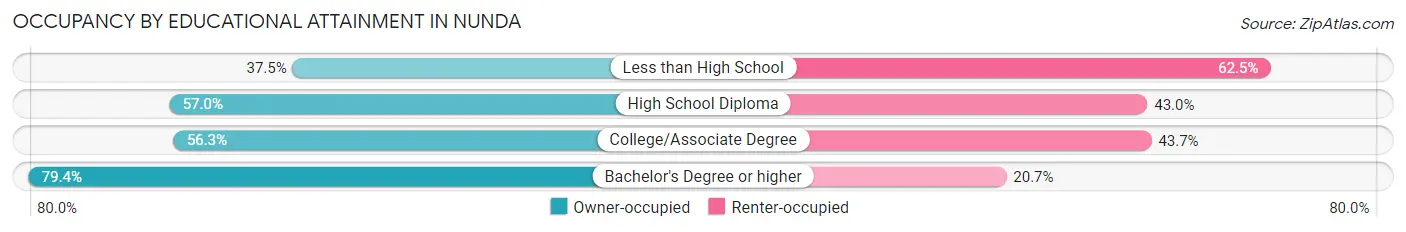
| Household Size | Owner-occupied | Renter-occupied |
| Less than High School | 18 (37.5%) | 30 (62.5%) |
| High School Diploma | 106 (57.0%) | 80 (43.0%) |
| College/Associate Degree | 120 (56.3%) | 93 (43.7%) |
| Bachelor's Degree or higher | 73 (79.3%) | 19 (20.6%) |
Occupancy by Age of Householder in Nunda
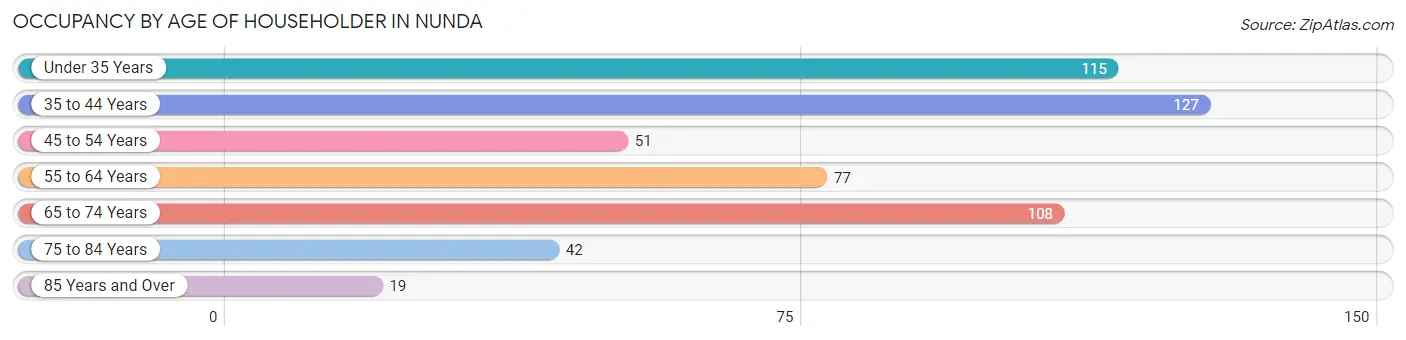
| Age Bracket | # Households | % Households |
| Under 35 Years | 115 | 21.3% |
| 35 to 44 Years | 127 | 23.6% |
| 45 to 54 Years | 51 | 9.5% |
| 55 to 64 Years | 77 | 14.3% |
| 65 to 74 Years | 108 | 20.0% |
| 75 to 84 Years | 42 | 7.8% |
| 85 Years and Over | 19 | 3.5% |
| Total | 539 | 100.0% |
Housing Finances in Nunda
Median Income by Occupancy in Nunda
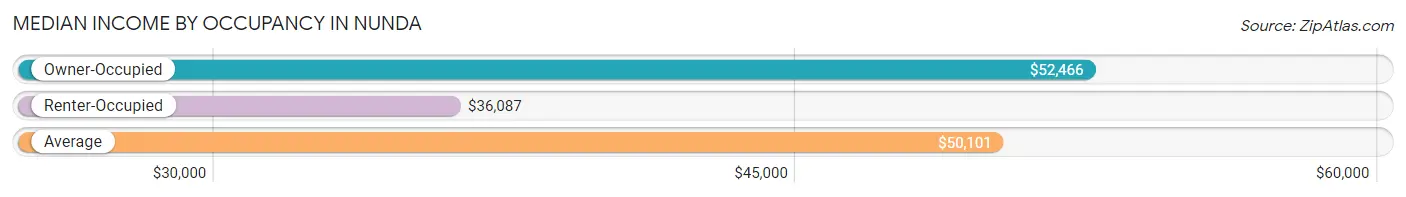
| Occupancy Type | # Households | Median Income |
| Owner-Occupied | 317 (58.8%) | $52,466 |
| Renter-Occupied | 222 (41.2%) | $36,087 |
| Average | 539 (100.0%) | $50,101 |
Occupancy by Householder Income Bracket in Nunda
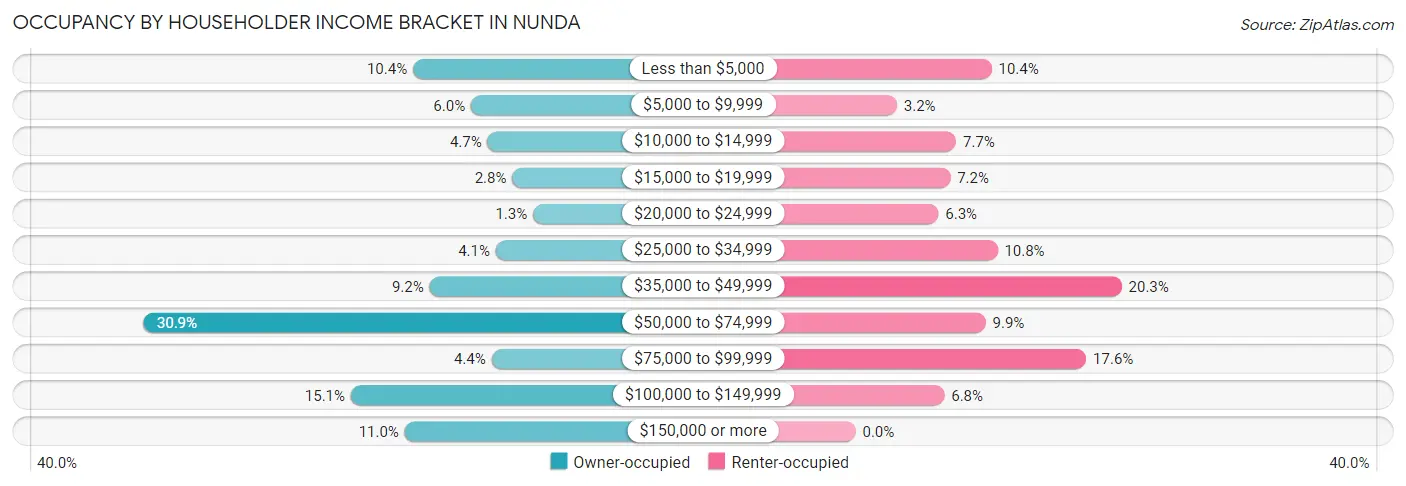
| Income Bracket | Owner-occupied | Renter-occupied |
| Less than $5,000 | 33 (10.4%) | 23 (10.4%) |
| $5,000 to $9,999 | 19 (6.0%) | 7 (3.2%) |
| $10,000 to $14,999 | 15 (4.7%) | 17 (7.7%) |
| $15,000 to $19,999 | 9 (2.8%) | 16 (7.2%) |
| $20,000 to $24,999 | 4 (1.3%) | 14 (6.3%) |
| $25,000 to $34,999 | 13 (4.1%) | 24 (10.8%) |
| $35,000 to $49,999 | 29 (9.1%) | 45 (20.3%) |
| $50,000 to $74,999 | 98 (30.9%) | 22 (9.9%) |
| $75,000 to $99,999 | 14 (4.4%) | 39 (17.6%) |
| $100,000 to $149,999 | 48 (15.1%) | 15 (6.8%) |
| $150,000 or more | 35 (11.0%) | 0 (0.0%) |
| Total | 317 (100.0%) | 222 (100.0%) |
Monthly Housing Cost Tiers in Nunda
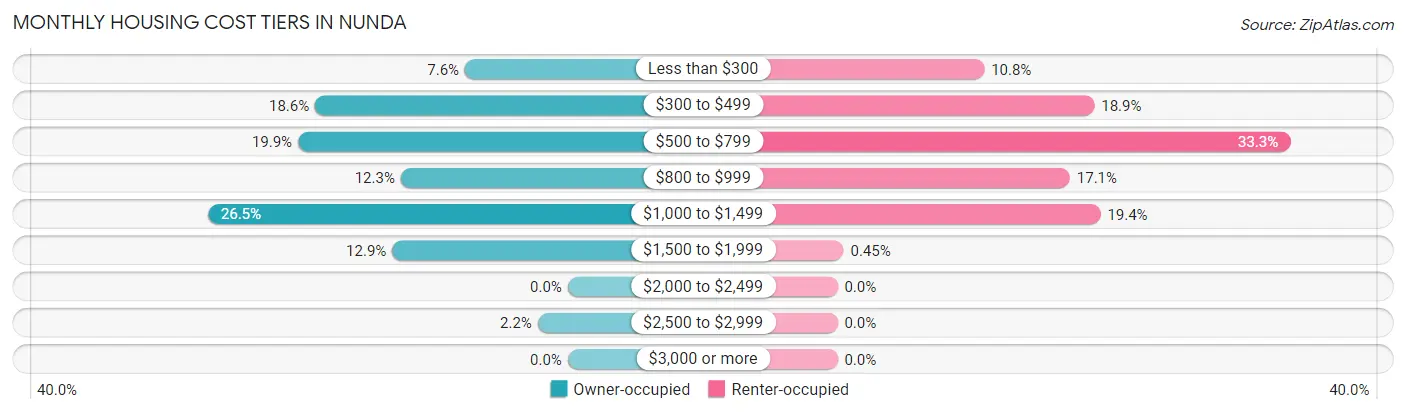
| Monthly Cost | Owner-occupied | Renter-occupied |
| Less than $300 | 24 (7.6%) | 24 (10.8%) |
| $300 to $499 | 59 (18.6%) | 42 (18.9%) |
| $500 to $799 | 63 (19.9%) | 74 (33.3%) |
| $800 to $999 | 39 (12.3%) | 38 (17.1%) |
| $1,000 to $1,499 | 84 (26.5%) | 43 (19.4%) |
| $1,500 to $1,999 | 41 (12.9%) | 1 (0.4%) |
| $2,000 to $2,499 | 0 (0.0%) | 0 (0.0%) |
| $2,500 to $2,999 | 7 (2.2%) | 0 (0.0%) |
| $3,000 or more | 0 (0.0%) | 0 (0.0%) |
| Total | 317 (100.0%) | 222 (100.0%) |
Physical Housing Characteristics in Nunda
Housing Structures in Nunda
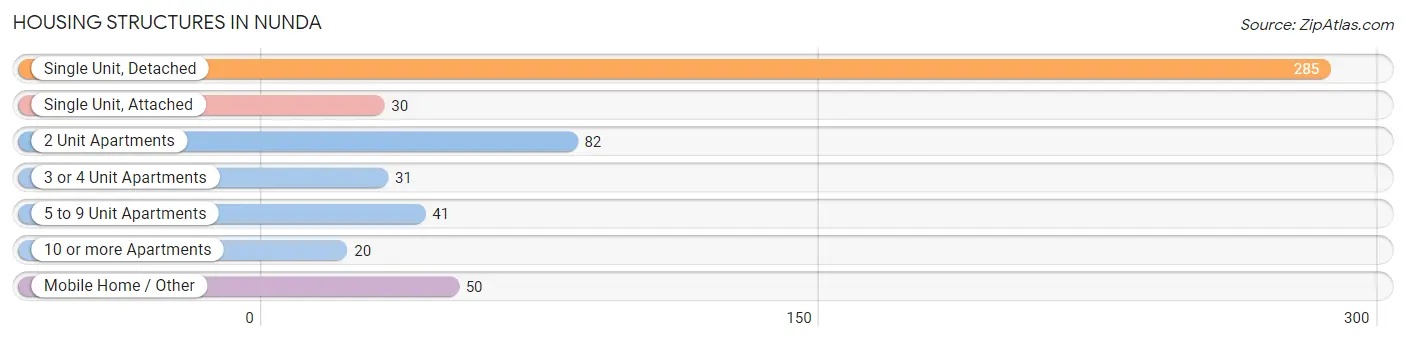
| Structure Type | # Housing Units | % Housing Units |
| Single Unit, Detached | 285 | 52.9% |
| Single Unit, Attached | 30 | 5.6% |
| 2 Unit Apartments | 82 | 15.2% |
| 3 or 4 Unit Apartments | 31 | 5.8% |
| 5 to 9 Unit Apartments | 41 | 7.6% |
| 10 or more Apartments | 20 | 3.7% |
| Mobile Home / Other | 50 | 9.3% |
| Total | 539 | 100.0% |
Housing Structures by Occupancy in Nunda
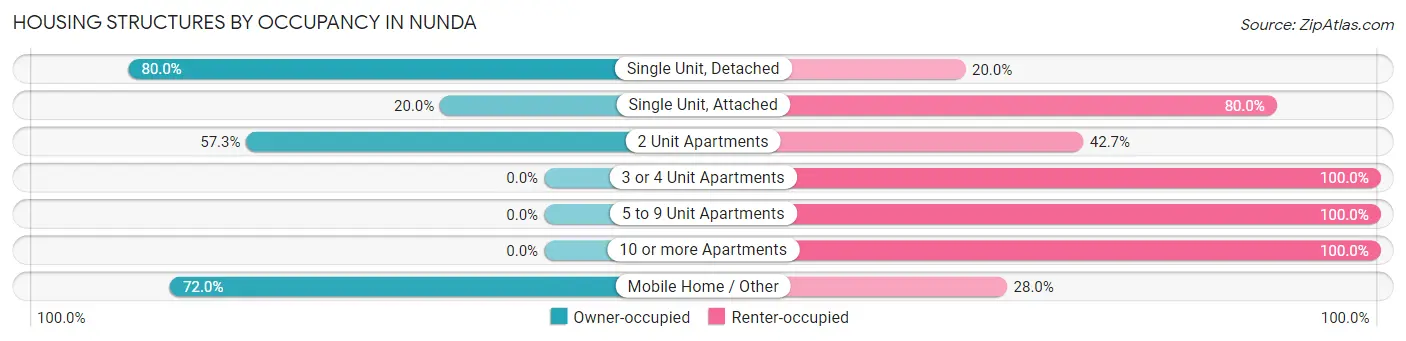
| Structure Type | Owner-occupied | Renter-occupied |
| Single Unit, Detached | 228 (80.0%) | 57 (20.0%) |
| Single Unit, Attached | 6 (20.0%) | 24 (80.0%) |
| 2 Unit Apartments | 47 (57.3%) | 35 (42.7%) |
| 3 or 4 Unit Apartments | 0 (0.0%) | 31 (100.0%) |
| 5 to 9 Unit Apartments | 0 (0.0%) | 41 (100.0%) |
| 10 or more Apartments | 0 (0.0%) | 20 (100.0%) |
| Mobile Home / Other | 36 (72.0%) | 14 (28.0%) |
| Total | 317 (58.8%) | 222 (41.2%) |
Housing Structures by Number of Rooms in Nunda
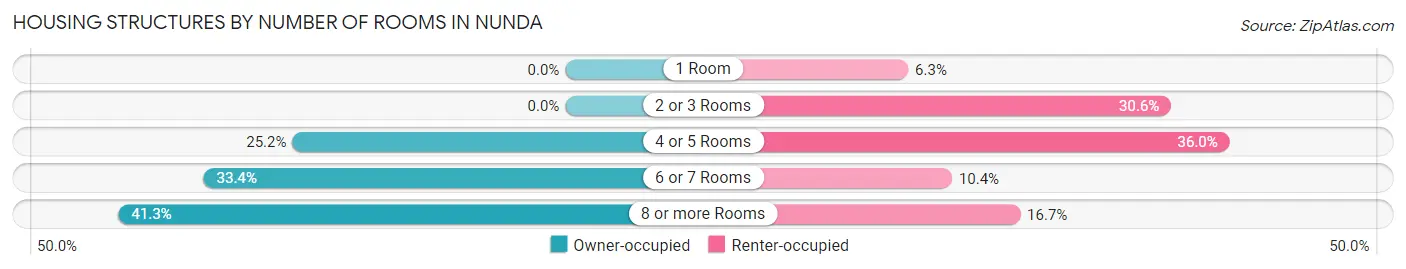
| Number of Rooms | Owner-occupied | Renter-occupied |
| 1 Room | 0 (0.0%) | 14 (6.3%) |
| 2 or 3 Rooms | 0 (0.0%) | 68 (30.6%) |
| 4 or 5 Rooms | 80 (25.2%) | 80 (36.0%) |
| 6 or 7 Rooms | 106 (33.4%) | 23 (10.4%) |
| 8 or more Rooms | 131 (41.3%) | 37 (16.7%) |
| Total | 317 (100.0%) | 222 (100.0%) |
Housing Structure by Heating Type in Nunda
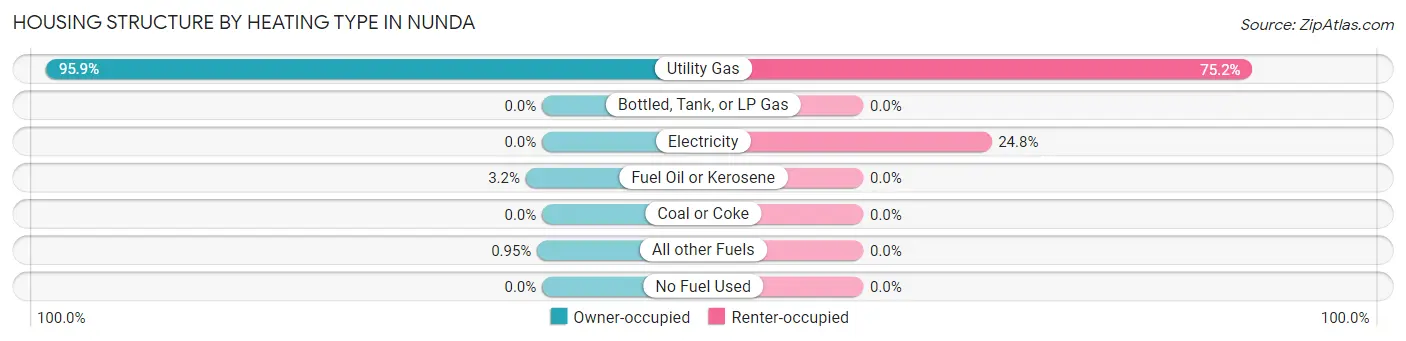
| Heating Type | Owner-occupied | Renter-occupied |
| Utility Gas | 304 (95.9%) | 167 (75.2%) |
| Bottled, Tank, or LP Gas | 0 (0.0%) | 0 (0.0%) |
| Electricity | 0 (0.0%) | 55 (24.8%) |
| Fuel Oil or Kerosene | 10 (3.2%) | 0 (0.0%) |
| Coal or Coke | 0 (0.0%) | 0 (0.0%) |
| All other Fuels | 3 (0.9%) | 0 (0.0%) |
| No Fuel Used | 0 (0.0%) | 0 (0.0%) |
| Total | 317 (100.0%) | 222 (100.0%) |
Household Vehicle Usage in Nunda
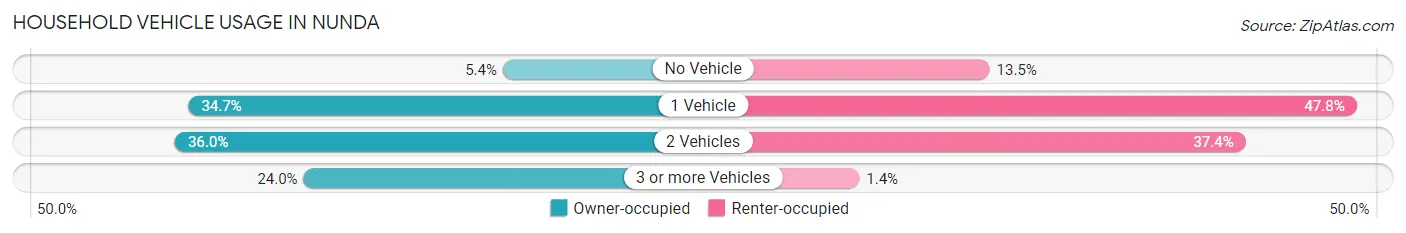
| Vehicles per Household | Owner-occupied | Renter-occupied |
| No Vehicle | 17 (5.4%) | 30 (13.5%) |
| 1 Vehicle | 110 (34.7%) | 106 (47.7%) |
| 2 Vehicles | 114 (36.0%) | 83 (37.4%) |
| 3 or more Vehicles | 76 (24.0%) | 3 (1.3%) |
| Total | 317 (100.0%) | 222 (100.0%) |
Real Estate & Mortgages in Nunda
Real Estate and Mortgage Overview in Nunda
| Characteristic | Without Mortgage | With Mortgage |
| Housing Units | 160 | 157 |
| Median Property Value | $107,100 | $105,300 |
| Median Household Income | $30,227 | $35 |
| Monthly Housing Costs | $486 | $0 |
| Real Estate Taxes | $2,809 | $17 |
Property Value by Mortgage Status in Nunda
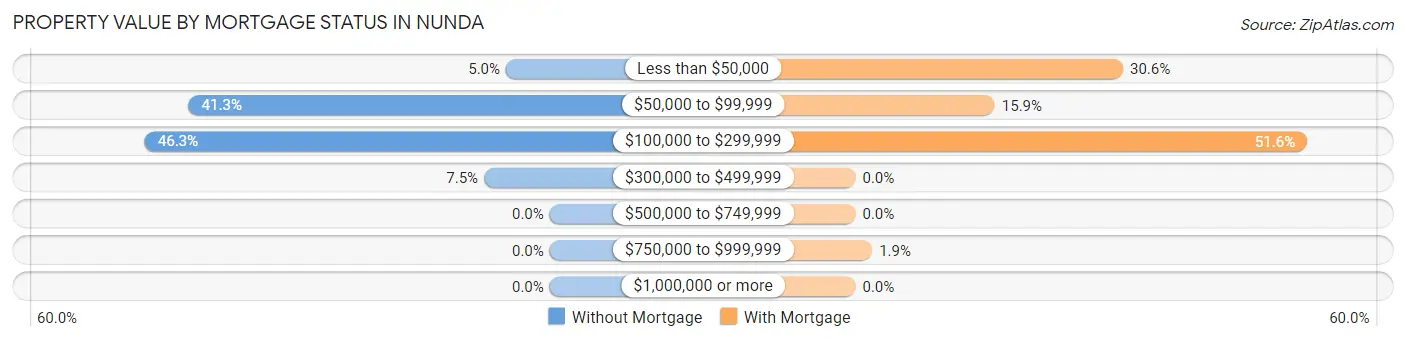
| Property Value | Without Mortgage | With Mortgage |
| Less than $50,000 | 8 (5.0%) | 48 (30.6%) |
| $50,000 to $99,999 | 66 (41.2%) | 25 (15.9%) |
| $100,000 to $299,999 | 74 (46.3%) | 81 (51.6%) |
| $300,000 to $499,999 | 12 (7.5%) | 0 (0.0%) |
| $500,000 to $749,999 | 0 (0.0%) | 0 (0.0%) |
| $750,000 to $999,999 | 0 (0.0%) | 3 (1.9%) |
| $1,000,000 or more | 0 (0.0%) | 0 (0.0%) |
| Total | 160 (100.0%) | 157 (100.0%) |
Household Income by Mortgage Status in Nunda
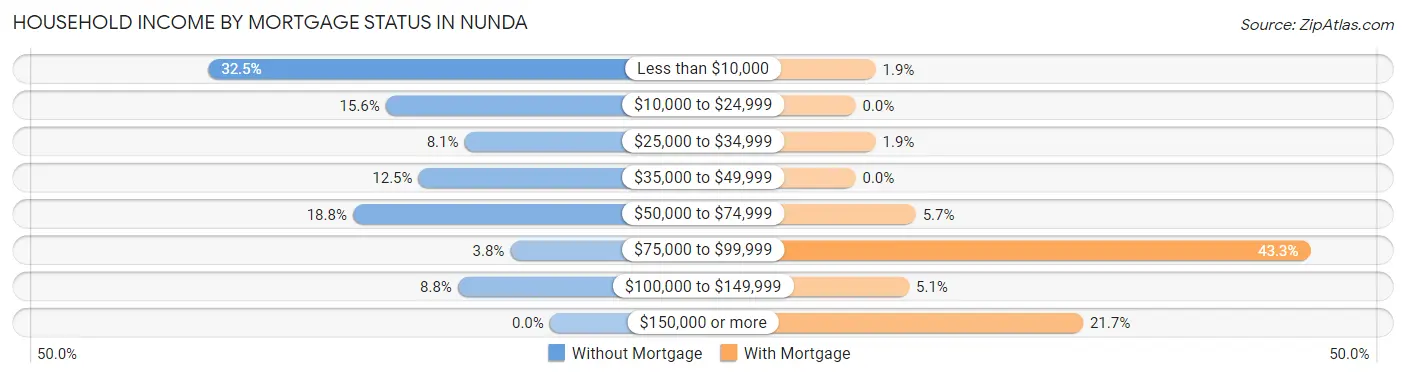
| Household Income | Without Mortgage | With Mortgage |
| Less than $10,000 | 52 (32.5%) | 3 (1.9%) |
| $10,000 to $24,999 | 25 (15.6%) | 0 (0.0%) |
| $25,000 to $34,999 | 13 (8.1%) | 3 (1.9%) |
| $35,000 to $49,999 | 20 (12.5%) | 0 (0.0%) |
| $50,000 to $74,999 | 30 (18.8%) | 9 (5.7%) |
| $75,000 to $99,999 | 6 (3.7%) | 68 (43.3%) |
| $100,000 to $149,999 | 14 (8.7%) | 8 (5.1%) |
| $150,000 or more | 0 (0.0%) | 34 (21.7%) |
| Total | 160 (100.0%) | 157 (100.0%) |
Property Value to Household Income Ratio in Nunda
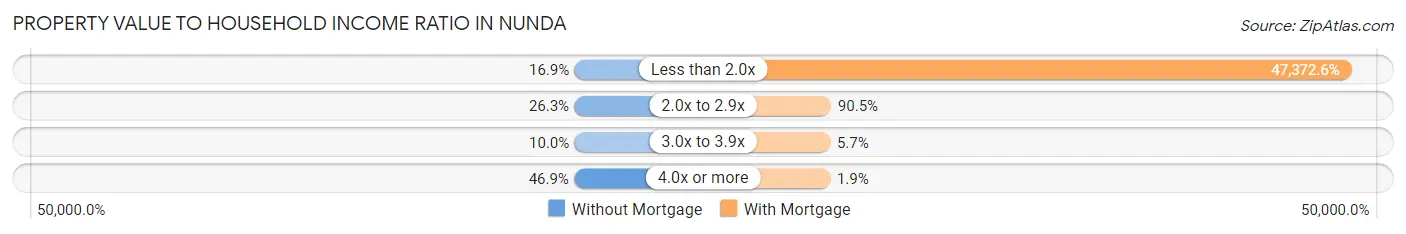
| Value-to-Income Ratio | Without Mortgage | With Mortgage |
| Less than 2.0x | 27 (16.9%) | 74,375 (47,372.6%) |
| 2.0x to 2.9x | 42 (26.3%) | 142 (90.4%) |
| 3.0x to 3.9x | 16 (10.0%) | 9 (5.7%) |
| 4.0x or more | 75 (46.9%) | 3 (1.9%) |
| Total | 160 (100.0%) | 157 (100.0%) |
Real Estate Taxes by Mortgage Status in Nunda
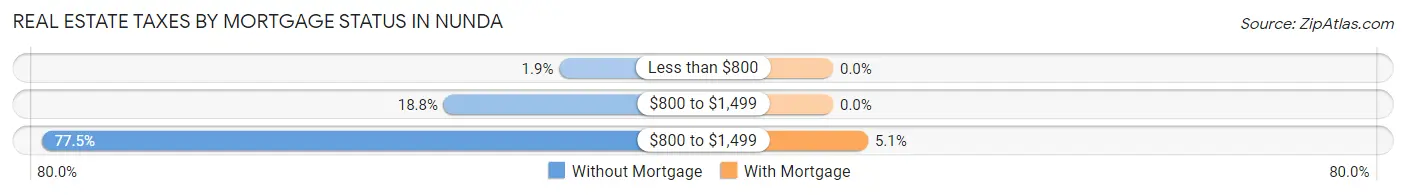
| Property Taxes | Without Mortgage | With Mortgage |
| Less than $800 | 3 (1.9%) | 0 (0.0%) |
| $800 to $1,499 | 30 (18.8%) | 0 (0.0%) |
| $800 to $1,499 | 124 (77.5%) | 8 (5.1%) |
| Total | 160 (100.0%) | 157 (100.0%) |
Health & Disability in Nunda
Health Insurance Coverage by Age in Nunda
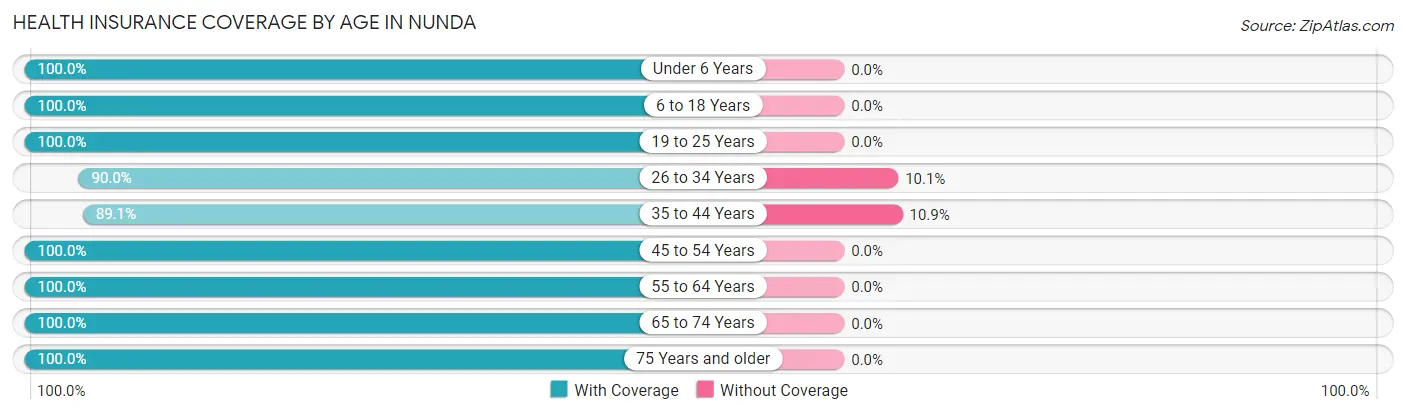
| Age Bracket | With Coverage | Without Coverage |
| Under 6 Years | 36 (100.0%) | 0 (0.0%) |
| 6 to 18 Years | 155 (100.0%) | 0 (0.0%) |
| 19 to 25 Years | 48 (100.0%) | 0 (0.0%) |
| 26 to 34 Years | 170 (89.9%) | 19 (10.1%) |
| 35 to 44 Years | 197 (89.1%) | 24 (10.9%) |
| 45 to 54 Years | 123 (100.0%) | 0 (0.0%) |
| 55 to 64 Years | 131 (100.0%) | 0 (0.0%) |
| 65 to 74 Years | 120 (100.0%) | 0 (0.0%) |
| 75 Years and older | 117 (100.0%) | 0 (0.0%) |
| Total | 1,097 (96.2%) | 43 (3.8%) |
Health Insurance Coverage by Citizenship Status in Nunda
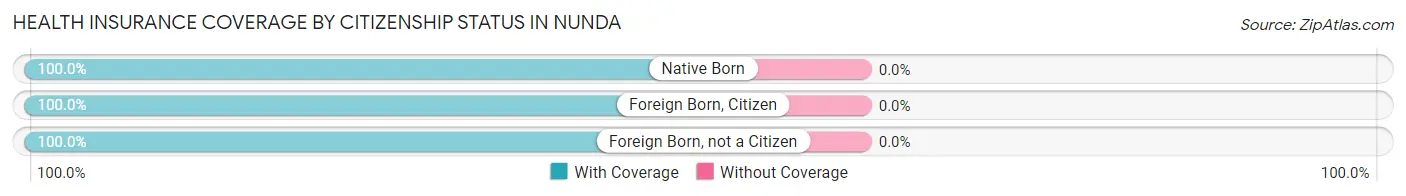
| Citizenship Status | With Coverage | Without Coverage |
| Native Born | 36 (100.0%) | 0 (0.0%) |
| Foreign Born, Citizen | 155 (100.0%) | 0 (0.0%) |
| Foreign Born, not a Citizen | 48 (100.0%) | 0 (0.0%) |
Health Insurance Coverage by Household Income in Nunda
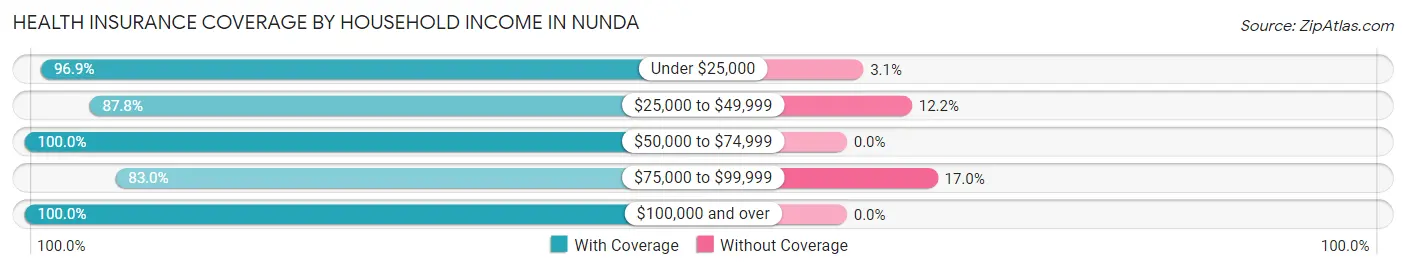
| Household Income | With Coverage | Without Coverage |
| Under $25,000 | 220 (96.9%) | 7 (3.1%) |
| $25,000 to $49,999 | 137 (87.8%) | 19 (12.2%) |
| $50,000 to $74,999 | 251 (100.0%) | 0 (0.0%) |
| $75,000 to $99,999 | 83 (83.0%) | 17 (17.0%) |
| $100,000 and over | 334 (100.0%) | 0 (0.0%) |
Public vs Private Health Insurance Coverage by Age in Nunda
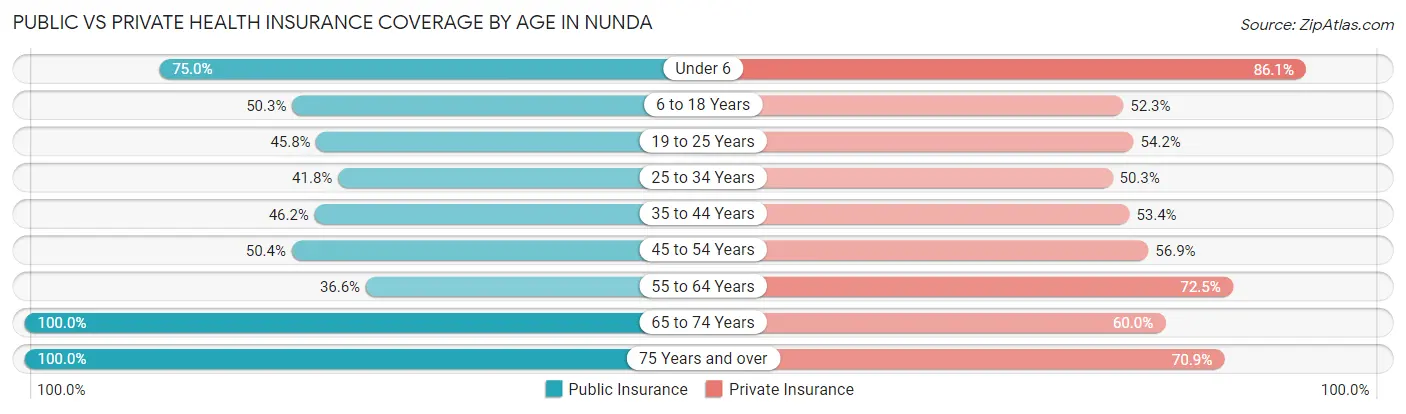
| Age Bracket | Public Insurance | Private Insurance |
| Under 6 | 27 (75.0%) | 31 (86.1%) |
| 6 to 18 Years | 78 (50.3%) | 81 (52.3%) |
| 19 to 25 Years | 22 (45.8%) | 26 (54.2%) |
| 25 to 34 Years | 79 (41.8%) | 95 (50.3%) |
| 35 to 44 Years | 102 (46.2%) | 118 (53.4%) |
| 45 to 54 Years | 62 (50.4%) | 70 (56.9%) |
| 55 to 64 Years | 48 (36.6%) | 95 (72.5%) |
| 65 to 74 Years | 120 (100.0%) | 72 (60.0%) |
| 75 Years and over | 117 (100.0%) | 83 (70.9%) |
| Total | 655 (57.5%) | 671 (58.9%) |
Disability Status by Sex by Age in Nunda
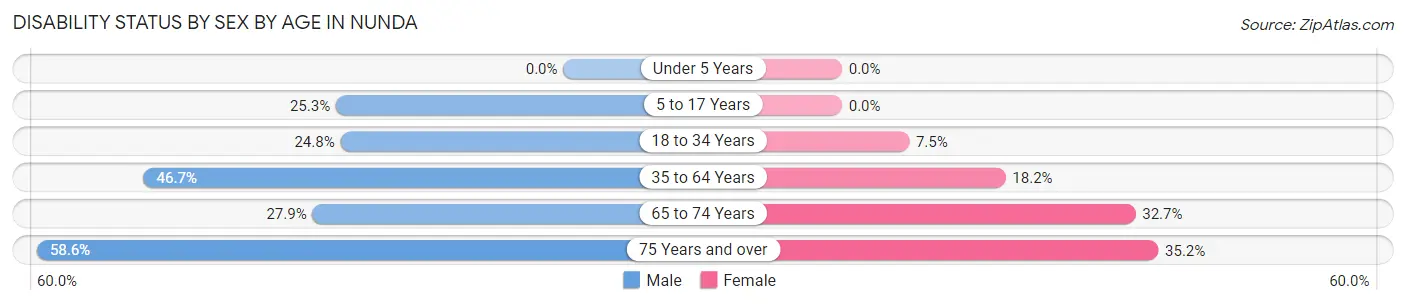
| Age Bracket | Male | Female |
| Under 5 Years | 0 (0.0%) | 0 (0.0%) |
| 5 to 17 Years | 20 (25.3%) | 0 (0.0%) |
| 18 to 34 Years | 35 (24.8%) | 8 (7.5%) |
| 35 to 64 Years | 122 (46.7%) | 39 (18.2%) |
| 65 to 74 Years | 19 (27.9%) | 17 (32.7%) |
| 75 Years and over | 17 (58.6%) | 31 (35.2%) |
Disability Class by Sex by Age in Nunda
Disability Class: Hearing Difficulty
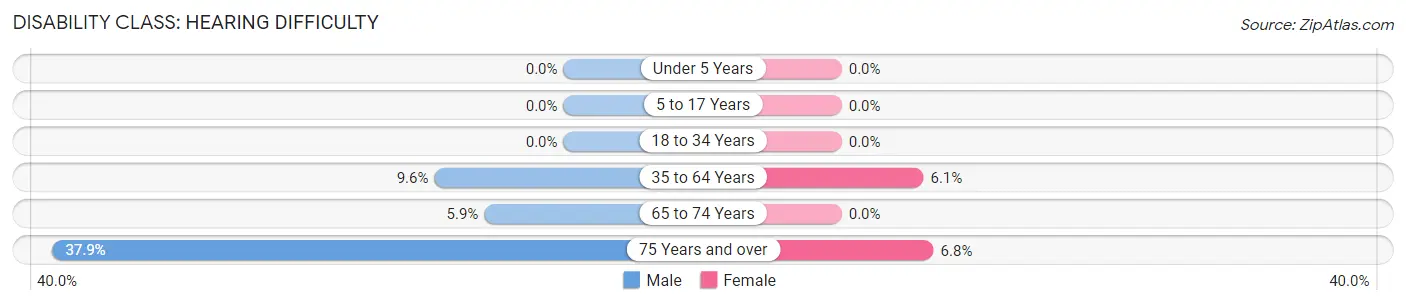
| Age Bracket | Male | Female |
| Under 5 Years | 0 (0.0%) | 0 (0.0%) |
| 5 to 17 Years | 0 (0.0%) | 0 (0.0%) |
| 18 to 34 Years | 0 (0.0%) | 0 (0.0%) |
| 35 to 64 Years | 25 (9.6%) | 13 (6.1%) |
| 65 to 74 Years | 4 (5.9%) | 0 (0.0%) |
| 75 Years and over | 11 (37.9%) | 6 (6.8%) |
Disability Class: Vision Difficulty
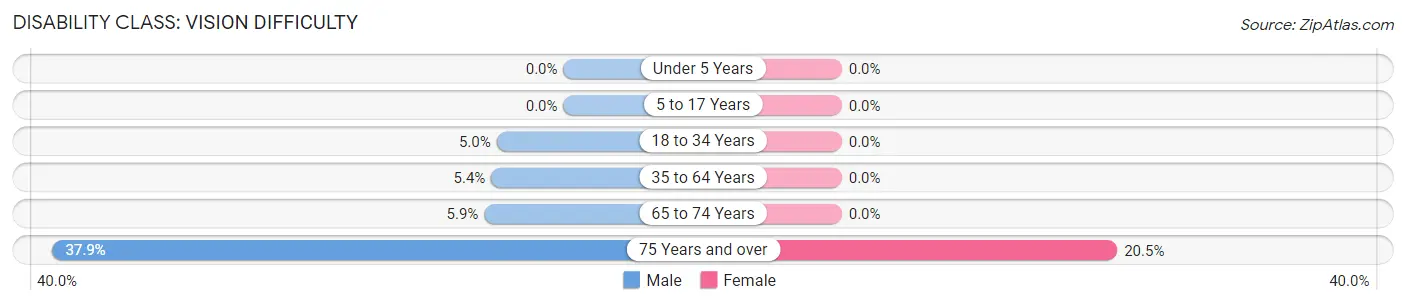
| Age Bracket | Male | Female |
| Under 5 Years | 0 (0.0%) | 0 (0.0%) |
| 5 to 17 Years | 0 (0.0%) | 0 (0.0%) |
| 18 to 34 Years | 7 (5.0%) | 0 (0.0%) |
| 35 to 64 Years | 14 (5.4%) | 0 (0.0%) |
| 65 to 74 Years | 4 (5.9%) | 0 (0.0%) |
| 75 Years and over | 11 (37.9%) | 18 (20.4%) |
Disability Class: Cognitive Difficulty
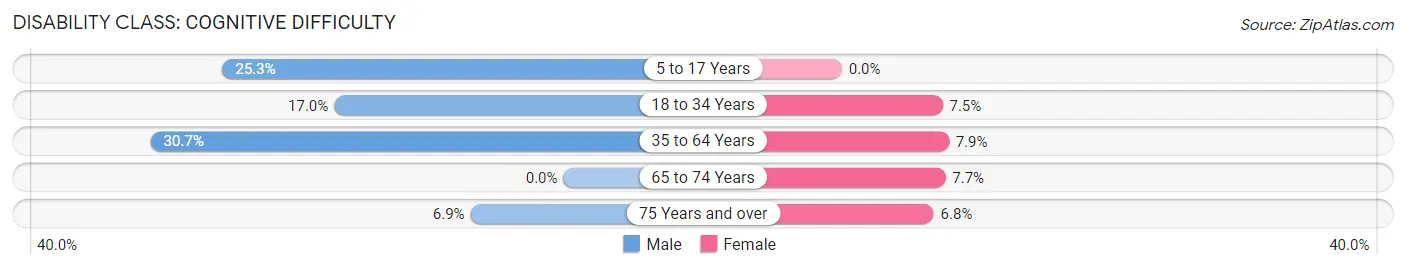
| Age Bracket | Male | Female |
| 5 to 17 Years | 20 (25.3%) | 0 (0.0%) |
| 18 to 34 Years | 24 (17.0%) | 8 (7.5%) |
| 35 to 64 Years | 80 (30.6%) | 17 (7.9%) |
| 65 to 74 Years | 0 (0.0%) | 4 (7.7%) |
| 75 Years and over | 2 (6.9%) | 6 (6.8%) |
Disability Class: Ambulatory Difficulty
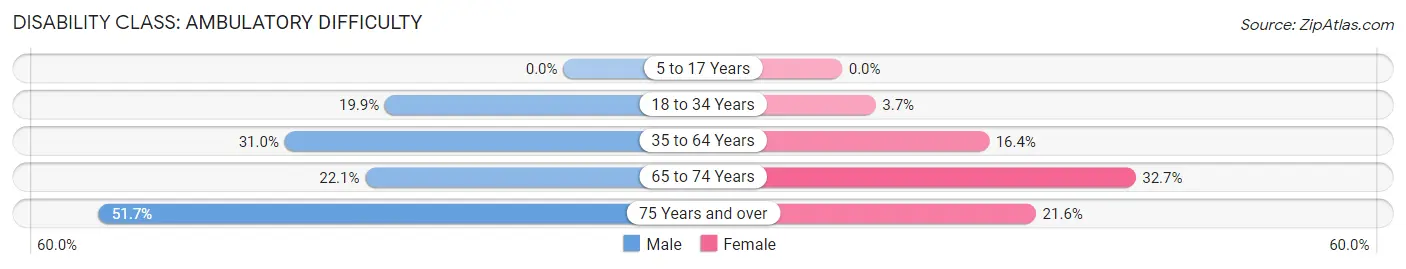
| Age Bracket | Male | Female |
| 5 to 17 Years | 0 (0.0%) | 0 (0.0%) |
| 18 to 34 Years | 28 (19.9%) | 4 (3.7%) |
| 35 to 64 Years | 81 (31.0%) | 35 (16.4%) |
| 65 to 74 Years | 15 (22.1%) | 17 (32.7%) |
| 75 Years and over | 15 (51.7%) | 19 (21.6%) |
Disability Class: Self-Care Difficulty
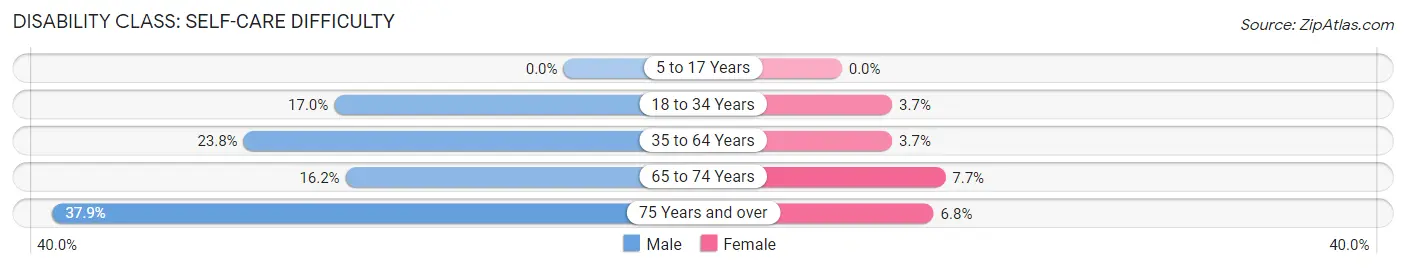
| Age Bracket | Male | Female |
| 5 to 17 Years | 0 (0.0%) | 0 (0.0%) |
| 18 to 34 Years | 24 (17.0%) | 4 (3.7%) |
| 35 to 64 Years | 62 (23.7%) | 8 (3.7%) |
| 65 to 74 Years | 11 (16.2%) | 4 (7.7%) |
| 75 Years and over | 11 (37.9%) | 6 (6.8%) |
Technology Access in Nunda
Computing Device Access in Nunda
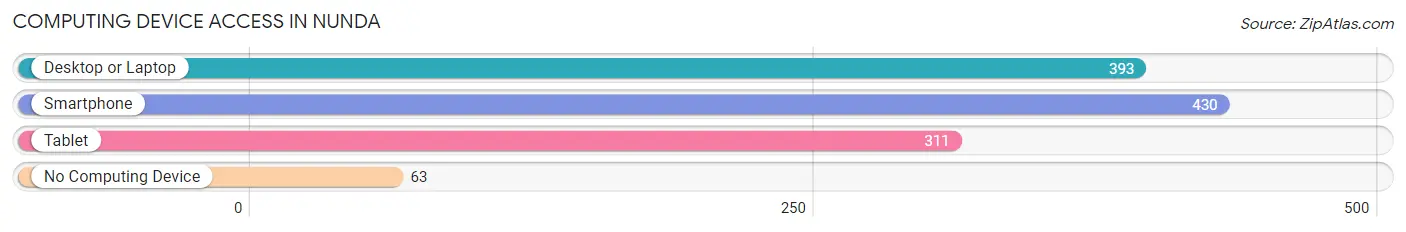
| Device Type | # Households | % Households |
| Desktop or Laptop | 393 | 72.9% |
| Smartphone | 430 | 79.8% |
| Tablet | 311 | 57.7% |
| No Computing Device | 63 | 11.7% |
| Total | 539 | 100.0% |
Internet Access in Nunda
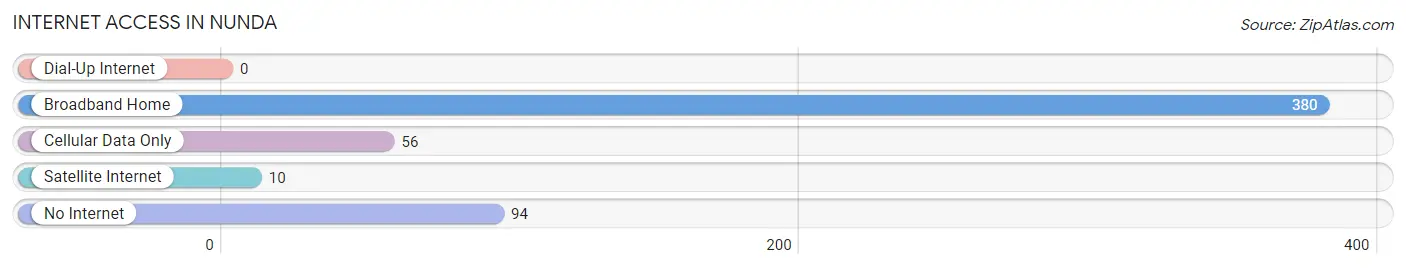
| Internet Type | # Households | % Households |
| Dial-Up Internet | 0 | 0.0% |
| Broadband Home | 380 | 70.5% |
| Cellular Data Only | 56 | 10.4% |
| Satellite Internet | 10 | 1.9% |
| No Internet | 94 | 17.4% |
| Total | 539 | 100.0% |
Nunda Summary
Nunda is a small town located in Livingston County, New York, United States. The town is situated in the Finger Lakes region of the state, and is part of the Rochester Metropolitan Statistical Area. As of the 2010 census, the town had a population of 2,845.
Geography
Nunda is located in the western part of Livingston County, in the Finger Lakes region of New York. It is bordered by the towns of Geneseo to the north, Leicester to the east, Portage to the south, and Groveland to the west. The town is located on the northern edge of the Genesee Valley, and is drained by tributaries of the Genesee River. The highest point in the town is an unnamed hill in the northeast corner, with an elevation of 1,400 feet (427 m) above sea level.
History
The area that is now Nunda was first settled around 1790. The town was formed in 1808 from the town of Leicester. The town was named after the Nunda Indians, a tribe of the Seneca Nation.
In the early 19th century, the town was a center of the lumber industry, with several sawmills located along the Genesee River. The town was also known for its production of potash, which was used in the production of soap and glass.
The Genesee Valley Canal, which ran through the town, was completed in 1841. The canal was used to transport goods from Rochester to the Genesee Valley. The canal was abandoned in 1878, and the towpath is now part of the Genesee Valley Greenway.
The town was also home to the Nunda Academy, a private school founded in 1817. The school closed in 1867, and the building is now used as a community center.
Economy
The economy of Nunda is largely based on agriculture. The town is home to several dairy farms, as well as a number of fruit and vegetable farms. The town is also home to several wineries, including the Nunda Vineyards and the Nunda Valley Winery.
The town is also home to several small businesses, including a hardware store, a grocery store, and a restaurant.
Demographics
As of the 2010 census, there were 2,845 people, 1,093 households, and 790 families residing in the town. The population density was 79.3 people per square mile (30.6/km2). There were 1,179 housing units at an average density of 32.7 per square mile (12.6/km2). The racial makeup of the town was 97.2% White, 0.7% African American, 0.2% Native American, 0.3% Asian, 0.1% Pacific Islander, 0.4% from other races, and 1.1% from two or more races. Hispanic or Latino of any race were 1.7% of the population.
There were 1,093 households, out of which 33.2% had children under the age of 18 living with them, 57.2% were married couples living together, 9.7% had a female householder with no husband present, and 28.7% were non-families. 24.2% of all households were made up of individuals, and 11.2% had someone living alone who was 65 years of age or older. The average household size was 2.60 and the average family size was 3.09.
In the town, the population was spread out, with 25.7% under the age of 18, 6.7% from 18 to 24, 27.2% from 25 to 44, 25.2% from 45 to 64, and 15.2% who were 65 years of age or older. The median age was 39 years. For every 100 females, there were 97.2 males. For every 100 females age 18 and over, there were 94.2 males.
The median income for a household in the town was $45,000, and the median income for a family was $51,250. Males had a median income of $36,250 versus $27,500 for females. The per capita income for the town was $20,945. About 5.2% of families and 7.2% of the population were below the poverty line, including 8.3% of those under age 18 and 6.2% of those age 65 or over.
Common Questions
What is Per Capita Income in Nunda?
Per Capita income in Nunda is $29,084.
What is the Median Family Income in Nunda?
Median Family Income in Nunda is $52,794.
What is the Median Household income in Nunda?
Median Household Income in Nunda is $50,101.
What is Income or Wage Gap in Nunda?
Income or Wage Gap in Nunda is 37.3%.
Women in Nunda earn 62.7 cents for every dollar earned by a man.
What is Inequality or Gini Index in Nunda?
Inequality or Gini Index in Nunda is 0.47.
What is the Total Population of Nunda?
Total Population of Nunda is 1,140.
What is the Total Male Population of Nunda?
Total Male Population of Nunda is 605.
What is the Total Female Population of Nunda?
Total Female Population of Nunda is 535.
What is the Ratio of Males per 100 Females in Nunda?
There are 113.08 Males per 100 Females in Nunda.
What is the Ratio of Females per 100 Males in Nunda?
There are 88.43 Females per 100 Males in Nunda.
What is the Median Population Age in Nunda?
Median Population Age in Nunda is 39.7 Years.
What is the Average Family Size in Nunda
Average Family Size in Nunda is 2.5 People.
What is the Average Household Size in Nunda
Average Household Size in Nunda is 2.0 People.
How Large is the Labor Force in Nunda?
There are 497 People in the Labor Forcein in Nunda.
What is the Percentage of People in the Labor Force in Nunda?
51.8% of People are in the Labor Force in Nunda.
What is the Unemployment Rate in Nunda?
Unemployment Rate in Nunda is 2.0%.