Taconic Shores, NY Map & Demographics
Taconic Shores Map
Taconic Shores Overview
$77,773
PER CAPITA INCOME
$165,863
AVG FAMILY INCOME
$146,364
AVG HOUSEHOLD INCOME
0.41
INEQUALITY / GINI INDEX
652
TOTAL POPULATION
339
MALE POPULATION
313
FEMALE POPULATION
108.31
MALES / 100 FEMALES
92.33
FEMALES / 100 MALES
55.4
MEDIAN AGE
2.4
AVG FAMILY SIZE
1.9
AVG HOUSEHOLD SIZE
429
LABOR FORCE [ PEOPLE ]
71.9%
PERCENT IN LABOR FORCE
Income in Taconic Shores
Income Overview in Taconic Shores
Per Capita Income in Taconic Shores is $77,773, while median incomes of families and households are $165,863 and $146,364 respectively.
| Characteristic | Number | Measure |
| Per Capita Income | 652 | $77,773 |
| Median Family Income | 210 | $165,863 |
| Mean Family Income | 210 | $196,929 |
| Median Household Income | 348 | $146,364 |
| Mean Household Income | 348 | $147,801 |
| Income Deficit | 210 | $0 |
| Wage / Income Gap (%) | 652 | 0.00% |
| Wage / Income Gap ($) | 652 | 100.00¢ per $1 |
| Gini / Inequality Index | 652 | 0.41 |
Earnings by Sex in Taconic Shores
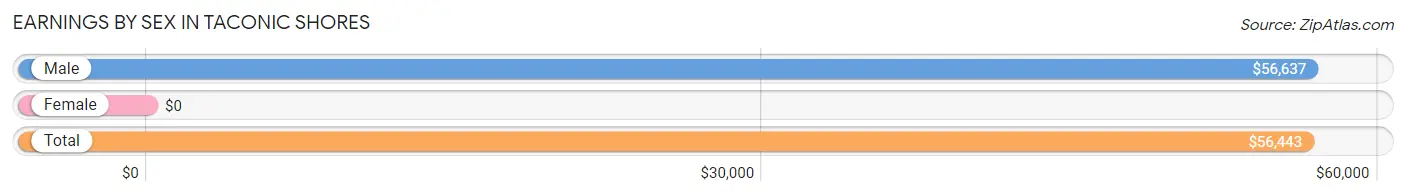
| Sex | Number | Average Earnings |
| Male | 312 (61.3%) | $56,637 |
| Female | 197 (38.7%) | $0 |
| Total | 509 (100.0%) | $56,443 |
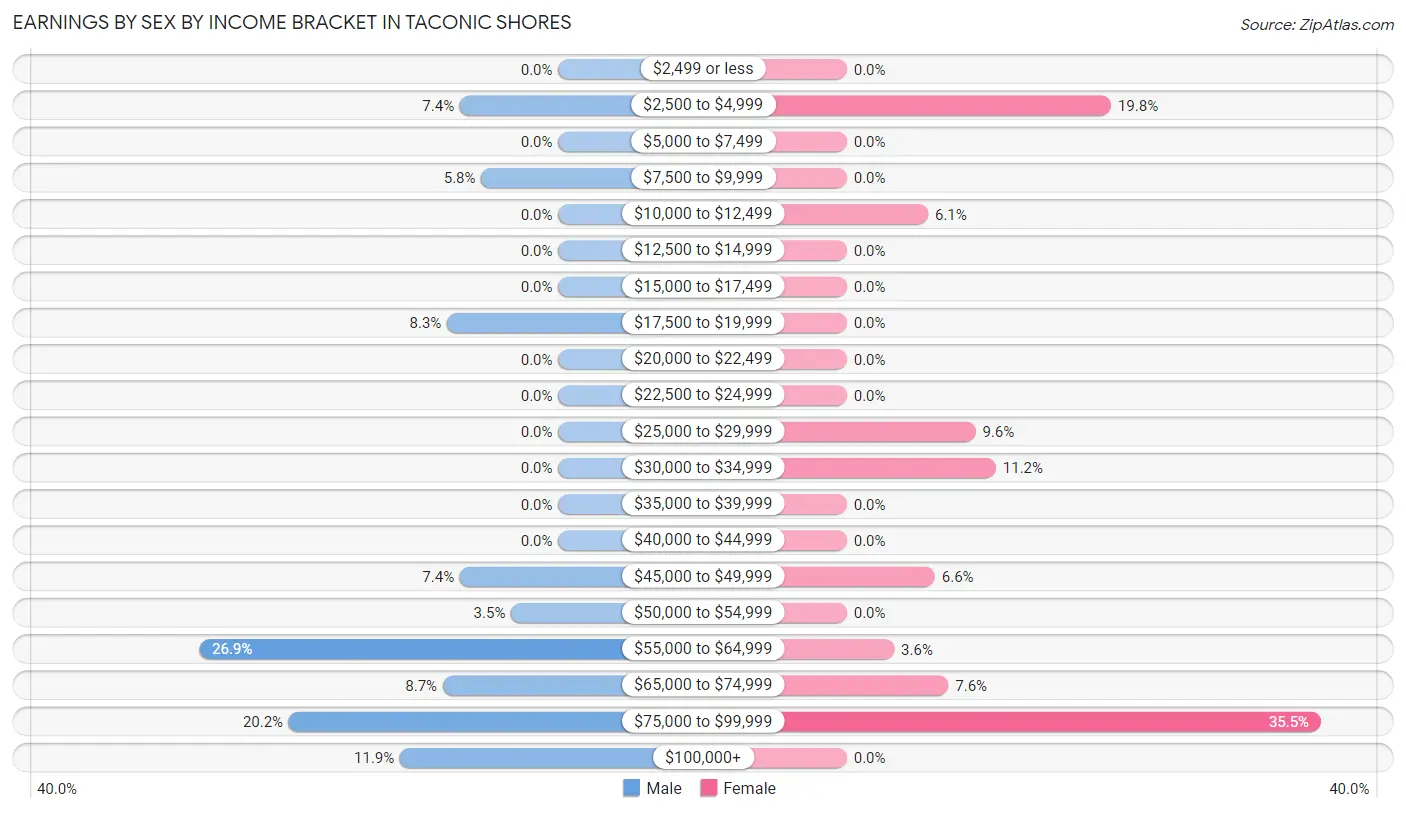
Earnings by Sex by Income Bracket in Taconic Shores
The most common earnings brackets in Taconic Shores are $55,000 to $64,999 for men (84 | 26.9%) and $75,000 to $99,999 for women (70 | 35.5%).
| Income | Male | Female |
| $2,499 or less | 0 (0.0%) | 0 (0.0%) |
| $2,500 to $4,999 | 23 (7.4%) | 39 (19.8%) |
| $5,000 to $7,499 | 0 (0.0%) | 0 (0.0%) |
| $7,500 to $9,999 | 18 (5.8%) | 0 (0.0%) |
| $10,000 to $12,499 | 0 (0.0%) | 12 (6.1%) |
| $12,500 to $14,999 | 0 (0.0%) | 0 (0.0%) |
| $15,000 to $17,499 | 0 (0.0%) | 0 (0.0%) |
| $17,500 to $19,999 | 26 (8.3%) | 0 (0.0%) |
| $20,000 to $22,499 | 0 (0.0%) | 0 (0.0%) |
| $22,500 to $24,999 | 0 (0.0%) | 0 (0.0%) |
| $25,000 to $29,999 | 0 (0.0%) | 19 (9.6%) |
| $30,000 to $34,999 | 0 (0.0%) | 22 (11.2%) |
| $35,000 to $39,999 | 0 (0.0%) | 0 (0.0%) |
| $40,000 to $44,999 | 0 (0.0%) | 0 (0.0%) |
| $45,000 to $49,999 | 23 (7.4%) | 13 (6.6%) |
| $50,000 to $54,999 | 11 (3.5%) | 0 (0.0%) |
| $55,000 to $64,999 | 84 (26.9%) | 7 (3.5%) |
| $65,000 to $74,999 | 27 (8.6%) | 15 (7.6%) |
| $75,000 to $99,999 | 63 (20.2%) | 70 (35.5%) |
| $100,000+ | 37 (11.9%) | 0 (0.0%) |
| Total | 312 (100.0%) | 197 (100.0%) |
Earnings by Sex by Educational Attainment in Taconic Shores
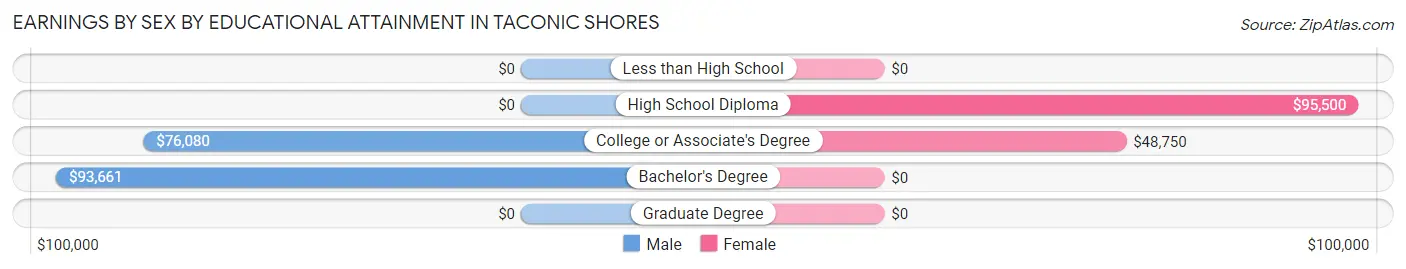
| Educational Attainment | Male Income | Female Income |
| Less than High School | - | - |
| High School Diploma | - | - |
| College or Associate's Degree | $76,080 | $48,750 |
| Bachelor's Degree | $93,661 | $0 |
| Graduate Degree | - | - |
| Total | $56,711 | $0 |
Family Income in Taconic Shores
Family Income Brackets in Taconic Shores
According to the Taconic Shores family income data, there are 104 families falling into the $150,000 to $199,999 income range, which is the most common income bracket and makes up 49.5% of all families.
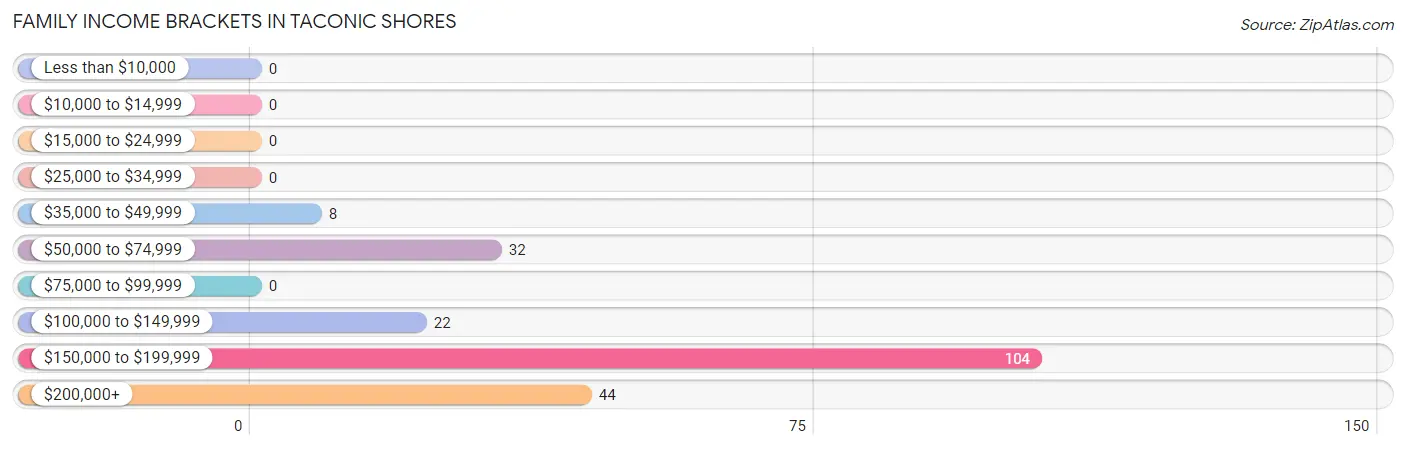
| Income Bracket | # Families | % Families |
| Less than $10,000 | 0 | 0.0% |
| $10,000 to $14,999 | 0 | 0.0% |
| $15,000 to $24,999 | 0 | 0.0% |
| $25,000 to $34,999 | 0 | 0.0% |
| $35,000 to $49,999 | 8 | 3.8% |
| $50,000 to $74,999 | 32 | 15.2% |
| $75,000 to $99,999 | 0 | 0.0% |
| $100,000 to $149,999 | 22 | 10.5% |
| $150,000 to $199,999 | 104 | 49.5% |
| $200,000+ | 44 | 21.0% |
Family Income by Famaliy Size in Taconic Shores
2-person families (171 | 81.4%) account for the highest median family income in Taconic Shores with $166,443 per family, while 2-person families (171 | 81.4%) have the highest median income of $83,222 per family member.
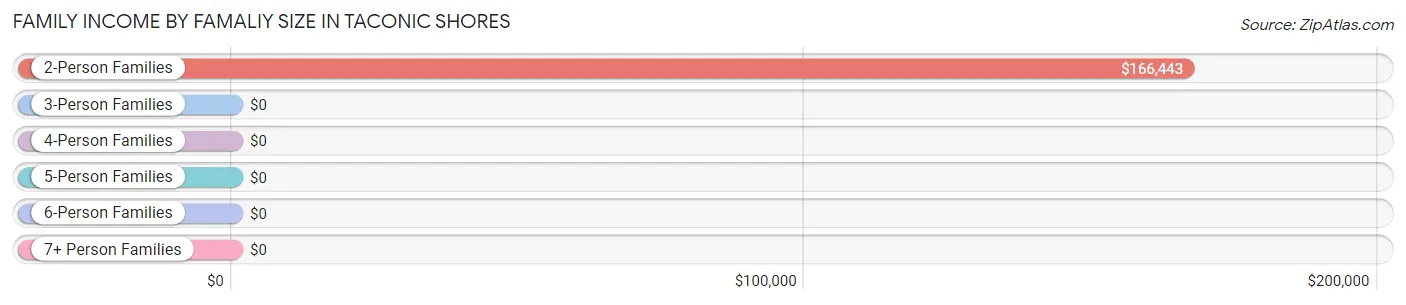
| Income Bracket | # Families | Median Income |
| 2-Person Families | 171 (81.4%) | $166,443 |
| 3-Person Families | 8 (3.8%) | $0 |
| 4-Person Families | 31 (14.8%) | $0 |
| 5-Person Families | 0 (0.0%) | $0 |
| 6-Person Families | 0 (0.0%) | $0 |
| 7+ Person Families | 0 (0.0%) | $0 |
| Total | 210 (100.0%) | $165,863 |
Family Income by Number of Earners in Taconic Shores
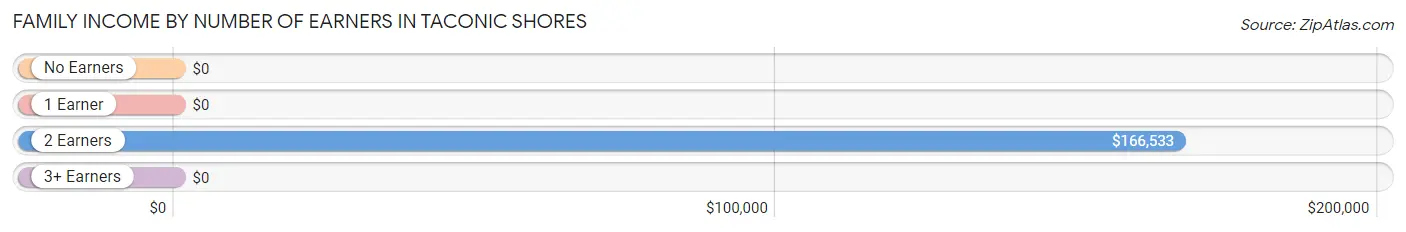
| Number of Earners | # Families | Median Income |
| No Earners | 16 (7.6%) | $0 |
| 1 Earner | 25 (11.9%) | $0 |
| 2 Earners | 147 (70.0%) | $166,533 |
| 3+ Earners | 22 (10.5%) | $0 |
| Total | 210 (100.0%) | $165,863 |
Household Income in Taconic Shores
Household Income Brackets in Taconic Shores
With 120 households falling in the category, the $150,000 to $199,999 income range is the most frequent in Taconic Shores, accounting for 34.5% of all households.
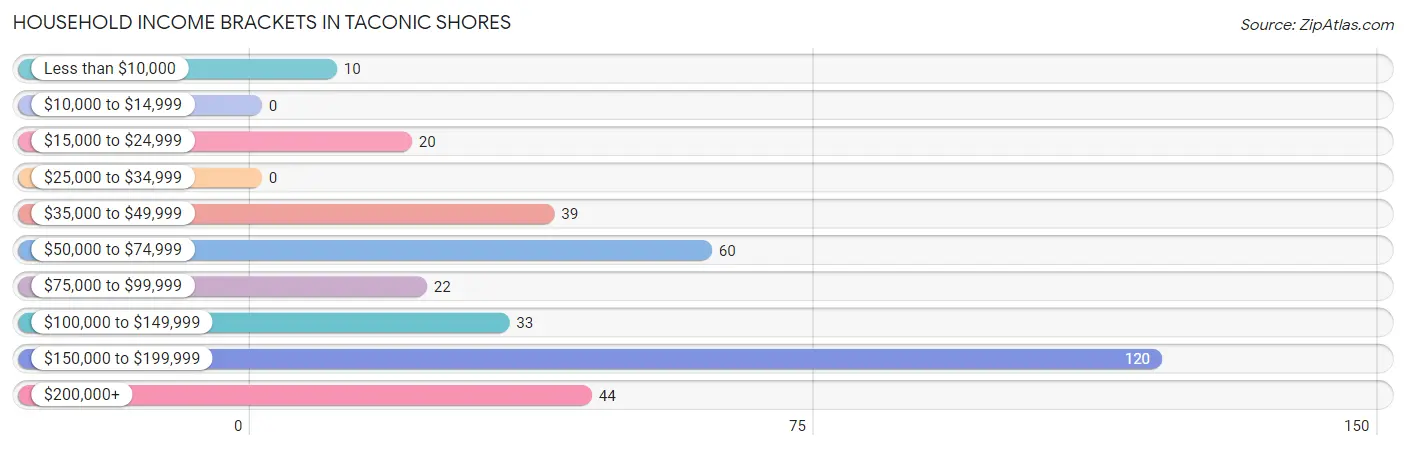
| Income Bracket | # Households | % Households |
| Less than $10,000 | 10 | 2.9% |
| $10,000 to $14,999 | 0 | 0.0% |
| $15,000 to $24,999 | 20 | 5.7% |
| $25,000 to $34,999 | 0 | 0.0% |
| $35,000 to $49,999 | 39 | 11.2% |
| $50,000 to $74,999 | 60 | 17.2% |
| $75,000 to $99,999 | 22 | 6.3% |
| $100,000 to $149,999 | 33 | 9.5% |
| $150,000 to $199,999 | 120 | 34.5% |
| $200,000+ | 44 | 12.6% |
Household Income by Householder Age in Taconic Shores
The median household income in Taconic Shores is $146,364, with the highest median household income of $198,672 found in the 65+ years age bracket for the primary householder. A total of 63 households (18.1%) fall into this category. Meanwhile, the 15 to 24 years age bracket for the primary householder has the lowest median household income of $0, with 21 households (6.0%) in this group.
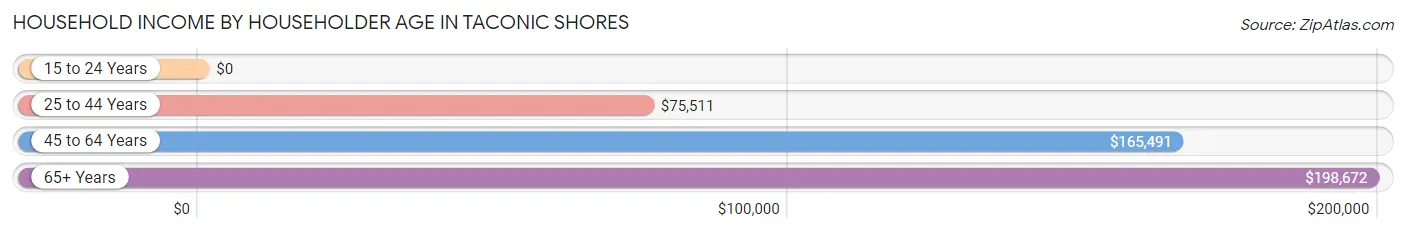
| Income Bracket | # Households | Median Income |
| 15 to 24 Years | 21 (6.0%) | $0 |
| 25 to 44 Years | 75 (21.5%) | $75,511 |
| 45 to 64 Years | 189 (54.3%) | $165,491 |
| 65+ Years | 63 (18.1%) | $198,672 |
| Total | 348 (100.0%) | $146,364 |
Poverty in Taconic Shores
Income Below Poverty by Sex and Age in Taconic Shores
With 2.9% poverty level for males and 2.9% for females among the residents of Taconic Shores, 35 to 44 year old males and 35 to 44 year old females are the most vulnerable to poverty, with 10 males (31.2%) and 9 females (100.0%) in their respective age groups living below the poverty level.
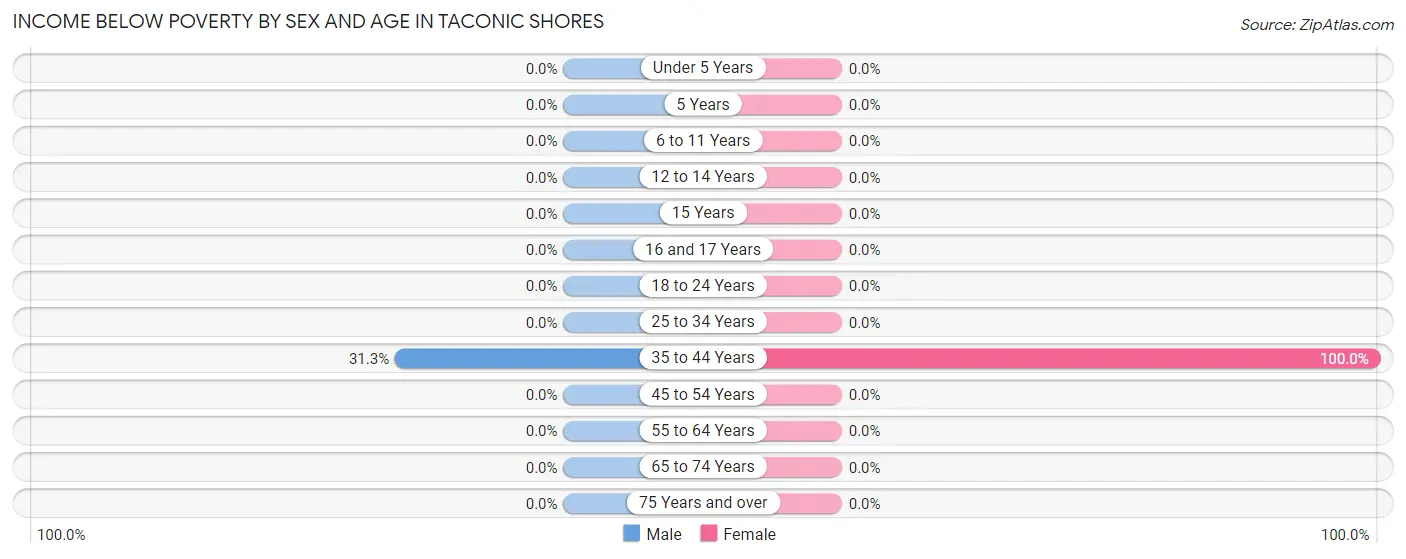
| Age Bracket | Male | Female |
| Under 5 Years | 0 (0.0%) | 0 (0.0%) |
| 5 Years | 0 (0.0%) | 0 (0.0%) |
| 6 to 11 Years | 0 (0.0%) | 0 (0.0%) |
| 12 to 14 Years | 0 (0.0%) | 0 (0.0%) |
| 15 Years | 0 (0.0%) | 0 (0.0%) |
| 16 and 17 Years | 0 (0.0%) | 0 (0.0%) |
| 18 to 24 Years | 0 (0.0%) | 0 (0.0%) |
| 25 to 34 Years | 0 (0.0%) | 0 (0.0%) |
| 35 to 44 Years | 10 (31.2%) | 9 (100.0%) |
| 45 to 54 Years | 0 (0.0%) | 0 (0.0%) |
| 55 to 64 Years | 0 (0.0%) | 0 (0.0%) |
| 65 to 74 Years | 0 (0.0%) | 0 (0.0%) |
| 75 Years and over | 0 (0.0%) | 0 (0.0%) |
| Total | 10 (2.9%) | 9 (2.9%) |
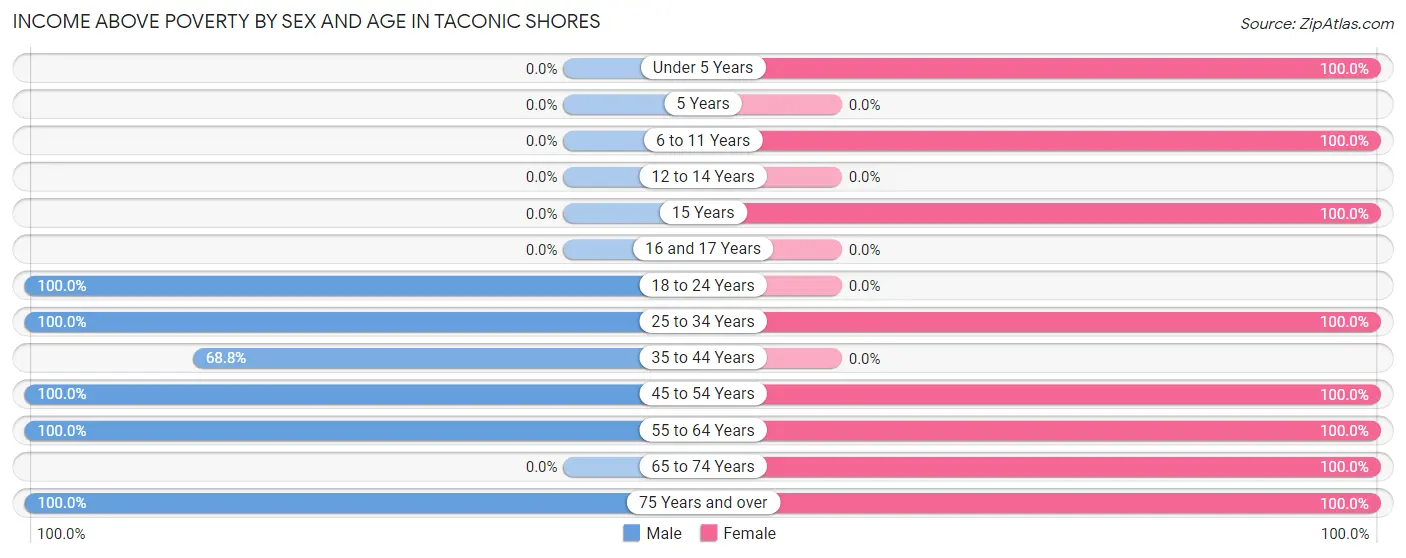
Income Above Poverty by Sex and Age in Taconic Shores
According to the poverty statistics in Taconic Shores, males aged 18 to 24 years and females aged under 5 years are the age groups that are most secure financially, with 100.0% of males and 100.0% of females in these age groups living above the poverty line.
| Age Bracket | Male | Female |
| Under 5 Years | 0 (0.0%) | 13 (100.0%) |
| 5 Years | 0 (0.0%) | 0 (0.0%) |
| 6 to 11 Years | 0 (0.0%) | 18 (100.0%) |
| 12 to 14 Years | 0 (0.0%) | 0 (0.0%) |
| 15 Years | 0 (0.0%) | 24 (100.0%) |
| 16 and 17 Years | 0 (0.0%) | 0 (0.0%) |
| 18 to 24 Years | 47 (100.0%) | 0 (0.0%) |
| 25 to 34 Years | 41 (100.0%) | 27 (100.0%) |
| 35 to 44 Years | 22 (68.8%) | 0 (0.0%) |
| 45 to 54 Years | 54 (100.0%) | 48 (100.0%) |
| 55 to 64 Years | 107 (100.0%) | 120 (100.0%) |
| 65 to 74 Years | 0 (0.0%) | 38 (100.0%) |
| 75 Years and over | 58 (100.0%) | 16 (100.0%) |
| Total | 329 (97.1%) | 304 (97.1%) |
Income Below Poverty Among Married-Couple Families in Taconic Shores
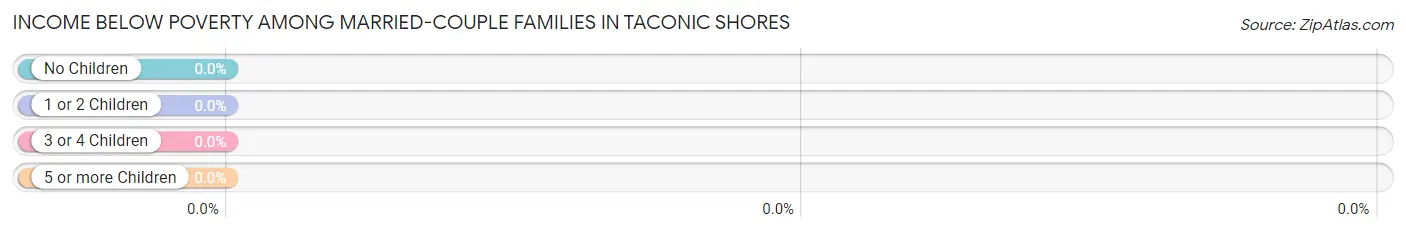
| Children | Above Poverty | Below Poverty |
| No Children | 171 (100.0%) | 0 (0.0%) |
| 1 or 2 Children | 31 (100.0%) | 0 (0.0%) |
| 3 or 4 Children | 0 (0.0%) | 0 (0.0%) |
| 5 or more Children | 0 (0.0%) | 0 (0.0%) |
| Total | 202 (100.0%) | 0 (0.0%) |
Income Below Poverty Among Single-Parent Households in Taconic Shores
| Children | Single Father | Single Mother |
| No Children | 0 (0.0%) | 0 (0.0%) |
| 1 or 2 Children | 0 (0.0%) | 0 (0.0%) |
| 3 or 4 Children | 0 (0.0%) | 0 (0.0%) |
| 5 or more Children | 0 (0.0%) | 0 (0.0%) |
| Total | 0 (0.0%) | 0 (0.0%) |
Income Below Poverty Among Married-Couple vs Single-Parent Households in Taconic Shores
| Children | Married-Couple Families | Single-Parent Households |
| No Children | 0 (0.0%) | 0 (0.0%) |
| 1 or 2 Children | 0 (0.0%) | 0 (0.0%) |
| 3 or 4 Children | 0 (0.0%) | 0 (0.0%) |
| 5 or more Children | 0 (0.0%) | 0 (0.0%) |
| Total | 0 (0.0%) | 0 (0.0%) |
Race in Taconic Shores
The most populous races in Taconic Shores are White / Caucasian (635 | 97.4%), Hispanic or Latino (47 | 7.2%), and Some other Race (17 | 2.6%).
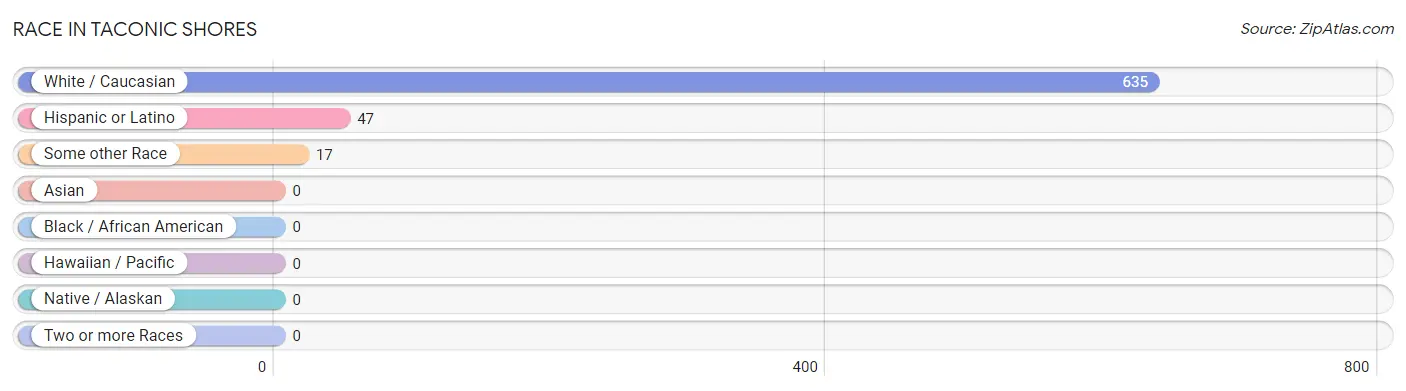
| Race | # Population | % Population |
| Asian | 0 | 0.0% |
| Black / African American | 0 | 0.0% |
| Hawaiian / Pacific | 0 | 0.0% |
| Hispanic or Latino | 47 | 7.2% |
| Native / Alaskan | 0 | 0.0% |
| White / Caucasian | 635 | 97.4% |
| Two or more Races | 0 | 0.0% |
| Some other Race | 17 | 2.6% |
| Total | 652 | 100.0% |
Ancestry in Taconic Shores
The most populous ancestries reported in Taconic Shores are Irish (238 | 36.5%), French (116 | 17.8%), German (102 | 15.6%), Italian (62 | 9.5%), and Eastern European (30 | 4.6%), together accounting for 84.0% of all Taconic Shores residents.
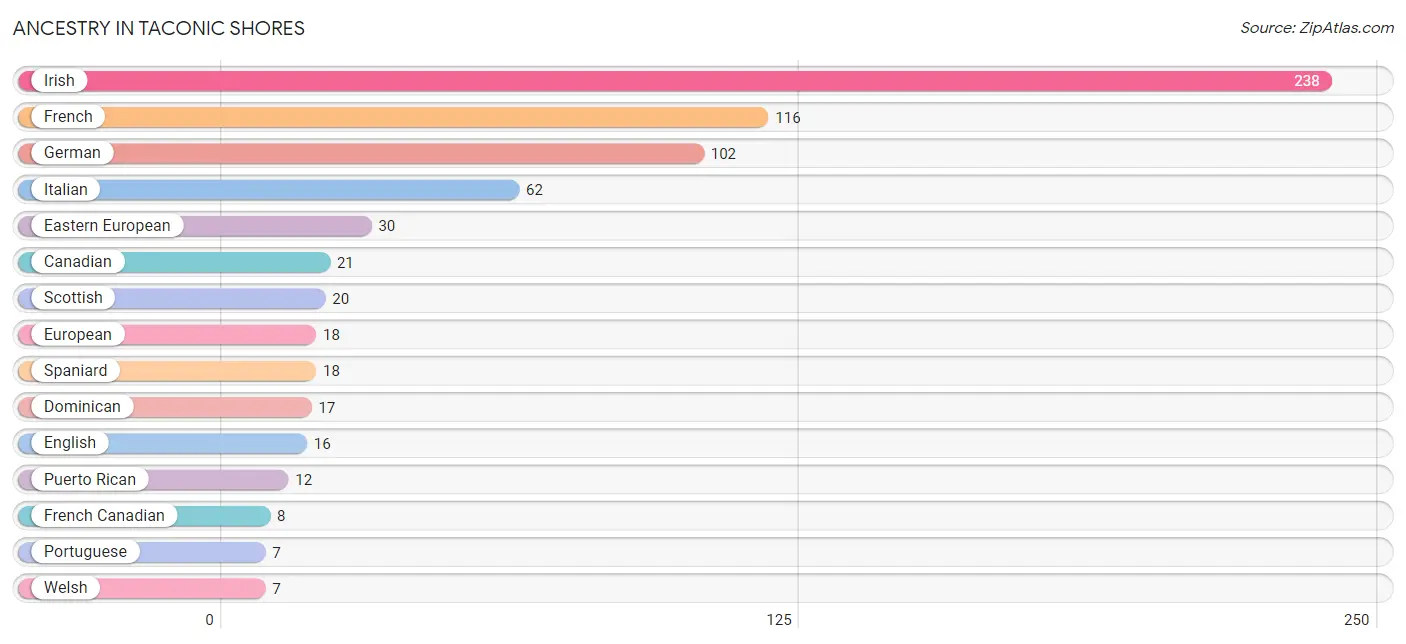
| Ancestry | # Population | % Population |
| Canadian | 21 | 3.2% |
| Dominican | 17 | 2.6% |
| Eastern European | 30 | 4.6% |
| English | 16 | 2.5% |
| European | 18 | 2.8% |
| French | 116 | 17.8% |
| French Canadian | 8 | 1.2% |
| German | 102 | 15.6% |
| Irish | 238 | 36.5% |
| Italian | 62 | 9.5% |
| Portuguese | 7 | 1.1% |
| Puerto Rican | 12 | 1.8% |
| Scottish | 20 | 3.1% |
| Spaniard | 18 | 2.8% |
| Welsh | 7 | 1.1% | View All 15 Rows |
Immigrants in Taconic Shores
The most numerous immigrant groups reported in Taconic Shores came from , and Oceania (7 | 1.1%), together accounting for 1.1% of all Taconic Shores residents.

| Immigration Origin | # Population | % Population |
| Oceania | 7 | 1.1% | View All 1 Rows |
Sex and Age in Taconic Shores
Sex and Age in Taconic Shores
The most populous age groups in Taconic Shores are 55 to 59 Years (93 | 27.4%) for men and 60 to 64 Years (65 | 20.8%) for women.
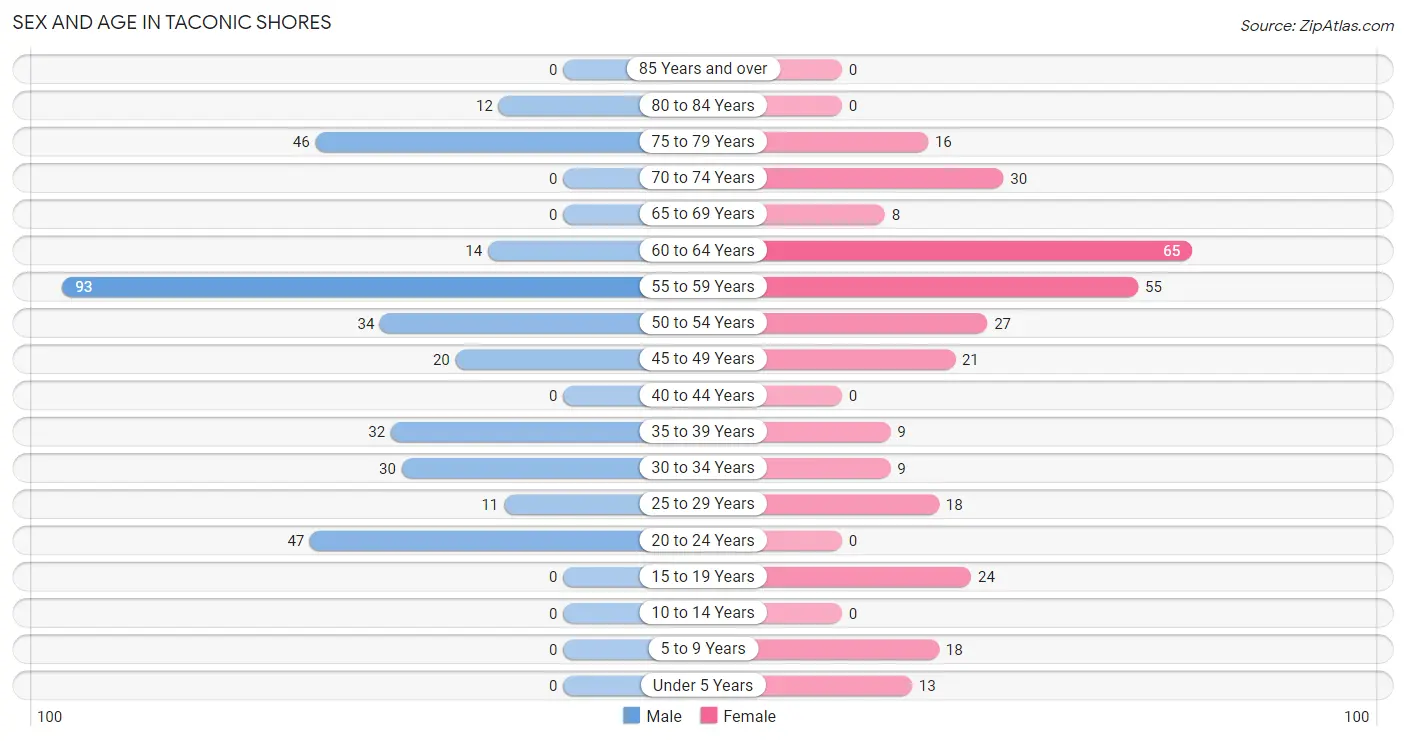
| Age Bracket | Male | Female |
| Under 5 Years | 0 (0.0%) | 13 (4.2%) |
| 5 to 9 Years | 0 (0.0%) | 18 (5.8%) |
| 10 to 14 Years | 0 (0.0%) | 0 (0.0%) |
| 15 to 19 Years | 0 (0.0%) | 24 (7.7%) |
| 20 to 24 Years | 47 (13.9%) | 0 (0.0%) |
| 25 to 29 Years | 11 (3.2%) | 18 (5.8%) |
| 30 to 34 Years | 30 (8.8%) | 9 (2.9%) |
| 35 to 39 Years | 32 (9.4%) | 9 (2.9%) |
| 40 to 44 Years | 0 (0.0%) | 0 (0.0%) |
| 45 to 49 Years | 20 (5.9%) | 21 (6.7%) |
| 50 to 54 Years | 34 (10.0%) | 27 (8.6%) |
| 55 to 59 Years | 93 (27.4%) | 55 (17.6%) |
| 60 to 64 Years | 14 (4.1%) | 65 (20.8%) |
| 65 to 69 Years | 0 (0.0%) | 8 (2.6%) |
| 70 to 74 Years | 0 (0.0%) | 30 (9.6%) |
| 75 to 79 Years | 46 (13.6%) | 16 (5.1%) |
| 80 to 84 Years | 12 (3.5%) | 0 (0.0%) |
| 85 Years and over | 0 (0.0%) | 0 (0.0%) |
| Total | 339 (100.0%) | 313 (100.0%) |
Families and Households in Taconic Shores
Median Family Size in Taconic Shores
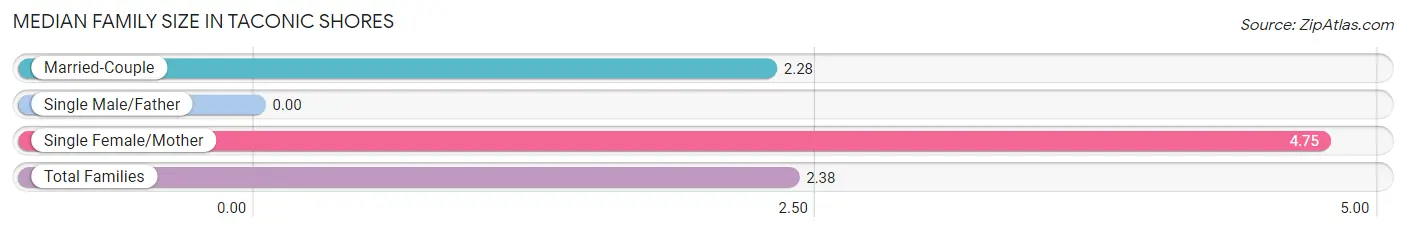
| Family Type | # Families | Family Size |
| Married-Couple | 202 (96.2%) | 2.28 |
| Single Male/Father | 0 (0.0%) | - |
| Single Female/Mother | 8 (3.8%) | 4.75 |
| Total Families | 210 (100.0%) | 2.38 |
Median Household Size in Taconic Shores
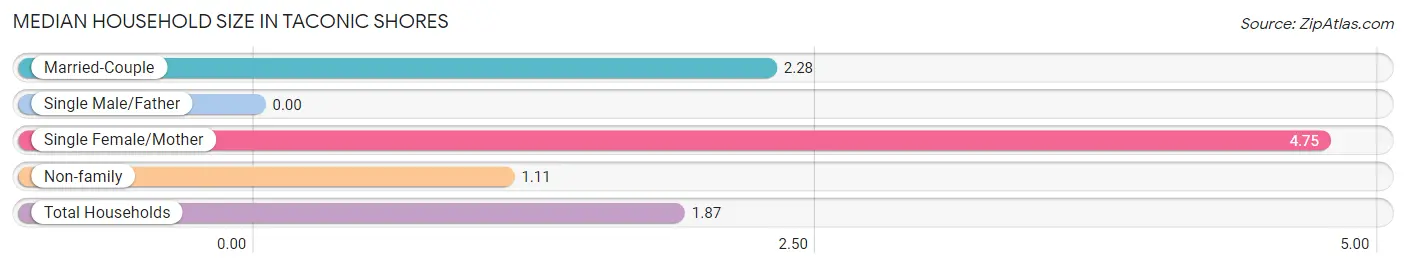
| Household Type | # Households | Household Size |
| Married-Couple | 202 (58.1%) | 2.28 |
| Single Male/Father | 0 (0.0%) | - |
| Single Female/Mother | 8 (2.3%) | 4.75 |
| Non-family | 138 (39.7%) | 1.11 |
| Total Households | 348 (100.0%) | 1.87 |
Household Size by Marriage Status in Taconic Shores
Out of a total of 348 households in Taconic Shores, 210 (60.3%) are family households, while 138 (39.7%) are nonfamily households. The most numerous type of family households are 2-person households, comprising 171, and the most common type of nonfamily households are 1-person households, comprising 117.
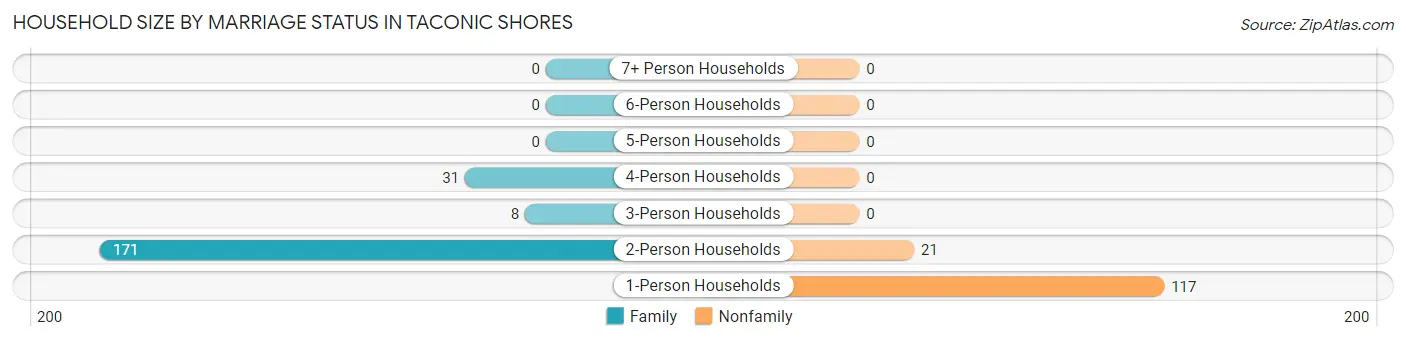
| Household Size | Family Households | Nonfamily Households |
| 1-Person Households | - | 117 (33.6%) |
| 2-Person Households | 171 (49.1%) | 21 (6.0%) |
| 3-Person Households | 8 (2.3%) | 0 (0.0%) |
| 4-Person Households | 31 (8.9%) | 0 (0.0%) |
| 5-Person Households | 0 (0.0%) | 0 (0.0%) |
| 6-Person Households | 0 (0.0%) | 0 (0.0%) |
| 7+ Person Households | 0 (0.0%) | 0 (0.0%) |
| Total | 210 (60.3%) | 138 (39.7%) |
Female Fertility in Taconic Shores
Fertility by Age in Taconic Shores
Average fertility rate in Taconic Shores is 111.0 births per 1,000 women. Women in the age bracket of 20 to 34 years have the highest fertility rate with 333.0 births per 1,000 women. Women in the age bracket of 20 to 34 years acount for 100.0% of all women with births.
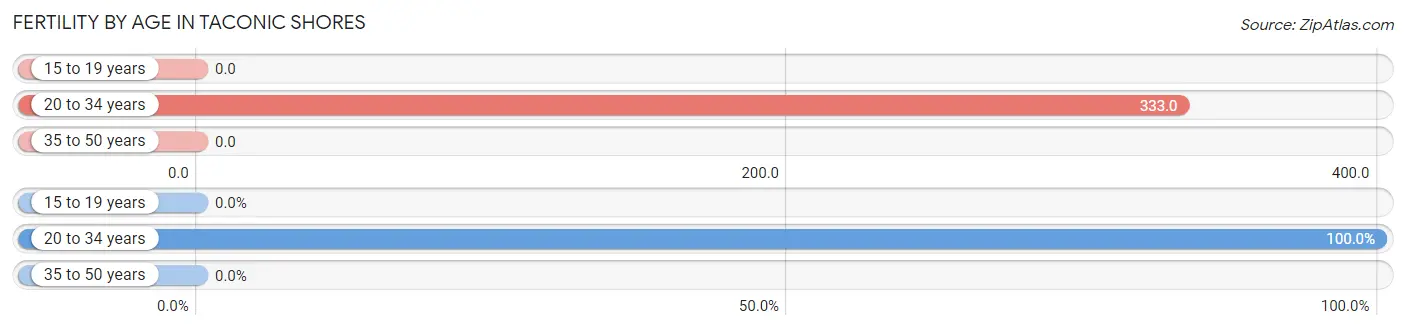
| Age Bracket | Women with Births | Births / 1,000 Women |
| 15 to 19 years | 0 (0.0%) | 0.0 |
| 20 to 34 years | 9 (100.0%) | 333.0 |
| 35 to 50 years | 0 (0.0%) | 0.0 |
| Total | 9 (100.0%) | 111.0 |
Fertility by Age by Marriage Status in Taconic Shores
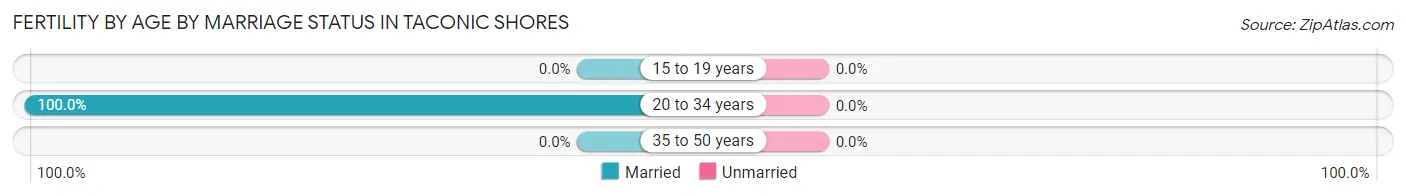
| Age Bracket | Married | Unmarried |
| 15 to 19 years | 0 (0.0%) | 0 (0.0%) |
| 20 to 34 years | 9 (100.0%) | 0 (0.0%) |
| 35 to 50 years | 0 (0.0%) | 0 (0.0%) |
| Total | 9 (100.0%) | 0 (0.0%) |
Fertility by Education in Taconic Shores
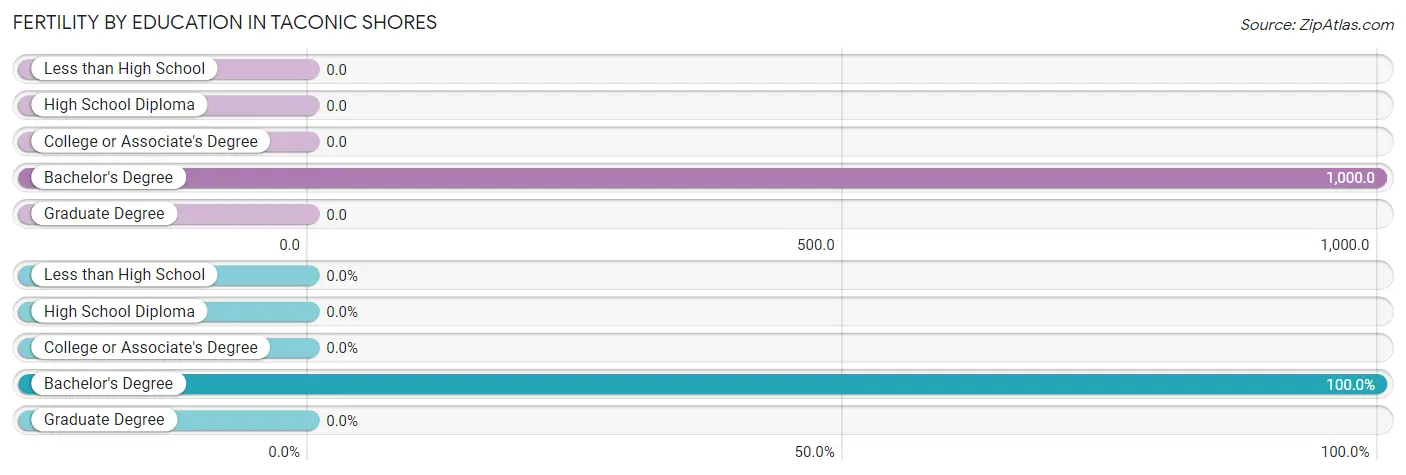
| Educational Attainment | Women with Births | Births / 1,000 Women |
| Less than High School | 0 (0.0%) | 0.0 |
| High School Diploma | 0 (0.0%) | 0.0 |
| College or Associate's Degree | 0 (0.0%) | 0.0 |
| Bachelor's Degree | 9 (100.0%) | 1,000.0 |
| Graduate Degree | 0 (0.0%) | 0.0 |
| Total | 9 (100.0%) | 111.0 |
Fertility by Education by Marriage Status in Taconic Shores
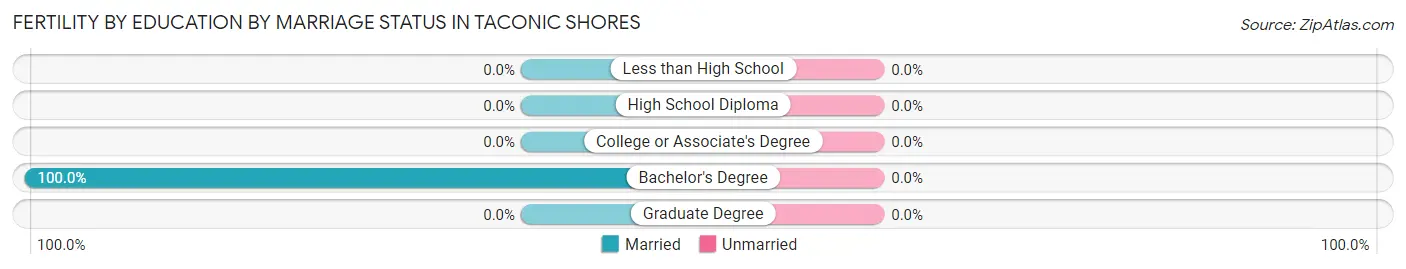
| Educational Attainment | Married | Unmarried |
| Less than High School | 0 (0.0%) | 0 (0.0%) |
| High School Diploma | 0 (0.0%) | 0 (0.0%) |
| College or Associate's Degree | 0 (0.0%) | 0 (0.0%) |
| Bachelor's Degree | 9 (100.0%) | 0 (0.0%) |
| Graduate Degree | 0 (0.0%) | 0 (0.0%) |
| Total | 9 (100.0%) | 0 (0.0%) |
Employment Characteristics in Taconic Shores
Employment by Class of Employer in Taconic Shores
Among the 429 employed individuals in Taconic Shores, private company employees (338 | 78.8%), local government employees (49 | 11.4%), and not-for-profit organizations (18 | 4.2%) make up the most common classes of employment.
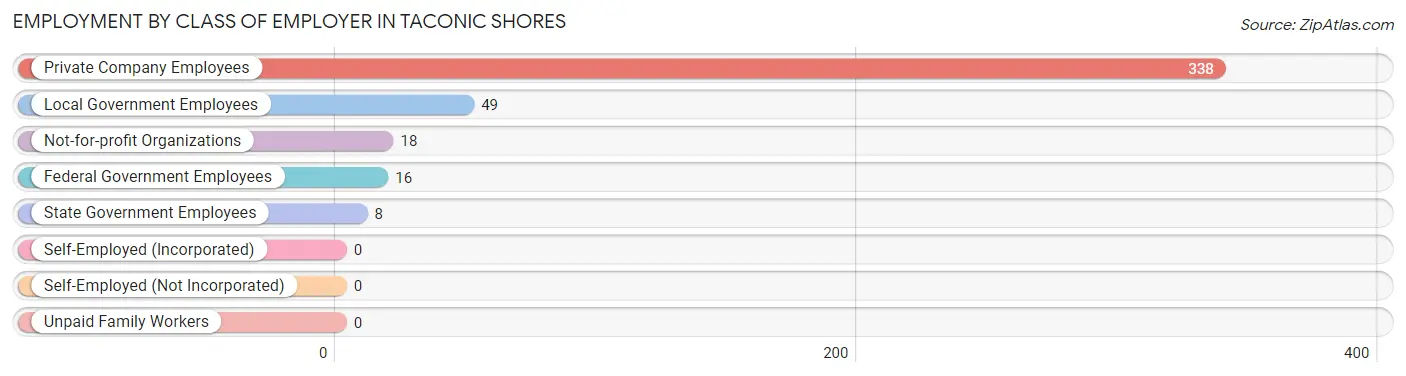
| Employer Class | # Employees | % Employees |
| Private Company Employees | 338 | 78.8% |
| Self-Employed (Incorporated) | 0 | 0.0% |
| Self-Employed (Not Incorporated) | 0 | 0.0% |
| Not-for-profit Organizations | 18 | 4.2% |
| Local Government Employees | 49 | 11.4% |
| State Government Employees | 8 | 1.9% |
| Federal Government Employees | 16 | 3.7% |
| Unpaid Family Workers | 0 | 0.0% |
| Total | 429 | 100.0% |
Employment Status by Age in Taconic Shores
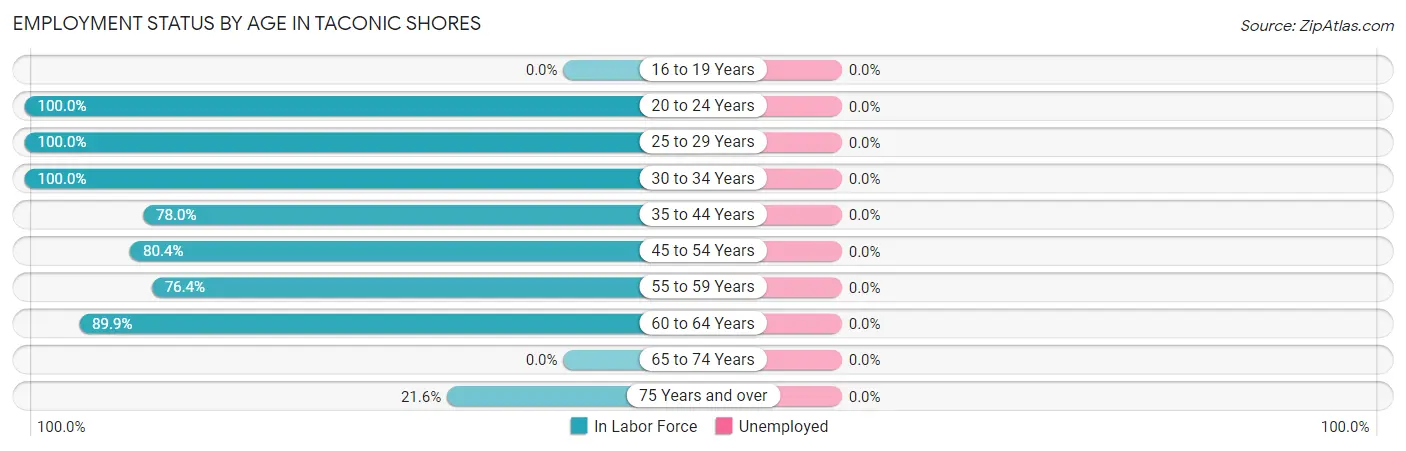
| Age Bracket | In Labor Force | Unemployed |
| 16 to 19 Years | 0 (0.0%) | 0 (0.0%) |
| 20 to 24 Years | 47 (100.0%) | 0 (0.0%) |
| 25 to 29 Years | 29 (100.0%) | 0 (0.0%) |
| 30 to 34 Years | 39 (100.0%) | 0 (0.0%) |
| 35 to 44 Years | 32 (78.0%) | 0 (0.0%) |
| 45 to 54 Years | 82 (80.4%) | 0 (0.0%) |
| 55 to 59 Years | 113 (76.4%) | 0 (0.0%) |
| 60 to 64 Years | 71 (89.9%) | 0 (0.0%) |
| 65 to 74 Years | 0 (0.0%) | 0 (0.0%) |
| 75 Years and over | 16 (21.6%) | 0 (0.0%) |
| Total | 429 (71.9%) | 0 (0.0%) |
Employment Status by Educational Attainment in Taconic Shores
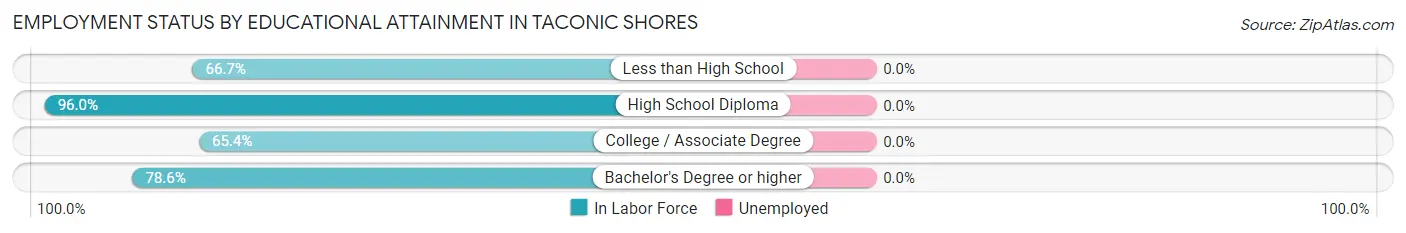
| Educational Attainment | In Labor Force | Unemployed |
| Less than High School | 18 (66.7%) | 0 (0.0%) |
| High School Diploma | 194 (96.0%) | 0 (0.0%) |
| College / Associate Degree | 51 (65.4%) | 0 (0.0%) |
| Bachelor's Degree or higher | 103 (78.6%) | 0 (0.0%) |
| Total | 366 (83.6%) | 0 (0.0%) |
Employment Occupations by Sex in Taconic Shores
Management, Business, Science and Arts Occupations
The most common Management, Business, Science and Arts occupations in Taconic Shores are Management (101 | 23.5%), Community & Social Service (33 | 7.7%), Business & Financial (24 | 5.6%), Education Instruction & Library (21 | 4.9%), and Legal Services & Support (12 | 2.8%).
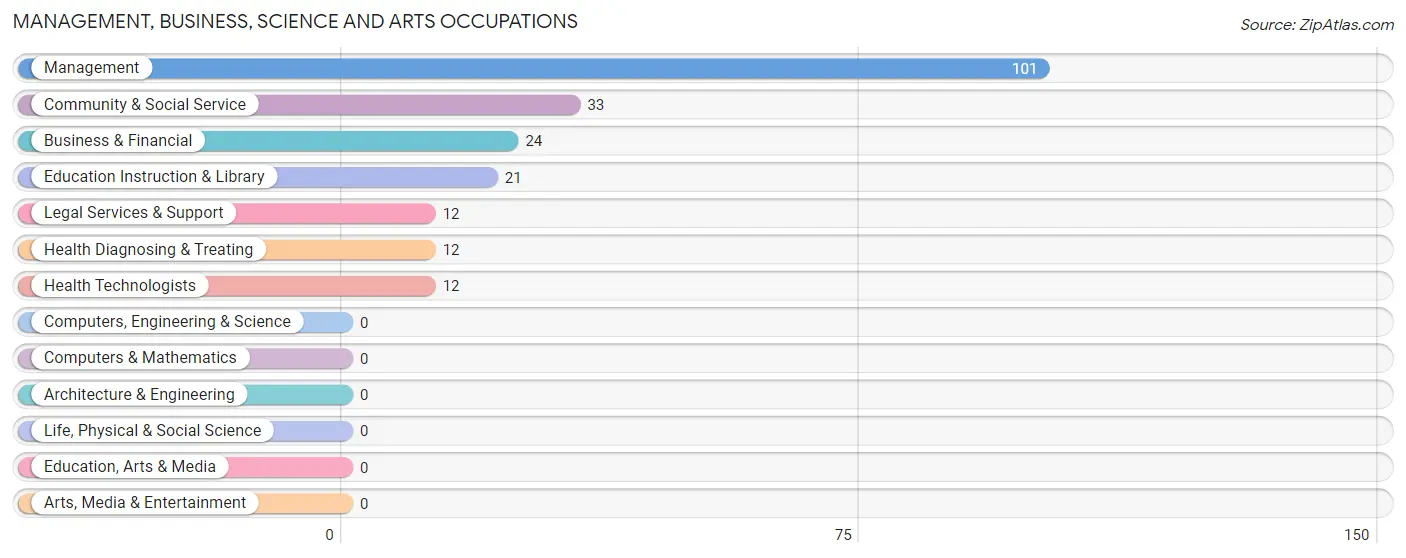
Management, Business, Science and Arts Occupations by Sex
Within the Management, Business, Science and Arts occupations in Taconic Shores, the most male-oriented occupations are Legal Services & Support (100.0%), Management (65.3%), and Business & Financial (62.5%), while the most female-oriented occupations are Education Instruction & Library (100.0%), Community & Social Service (63.6%), and Health Diagnosing & Treating (41.7%).
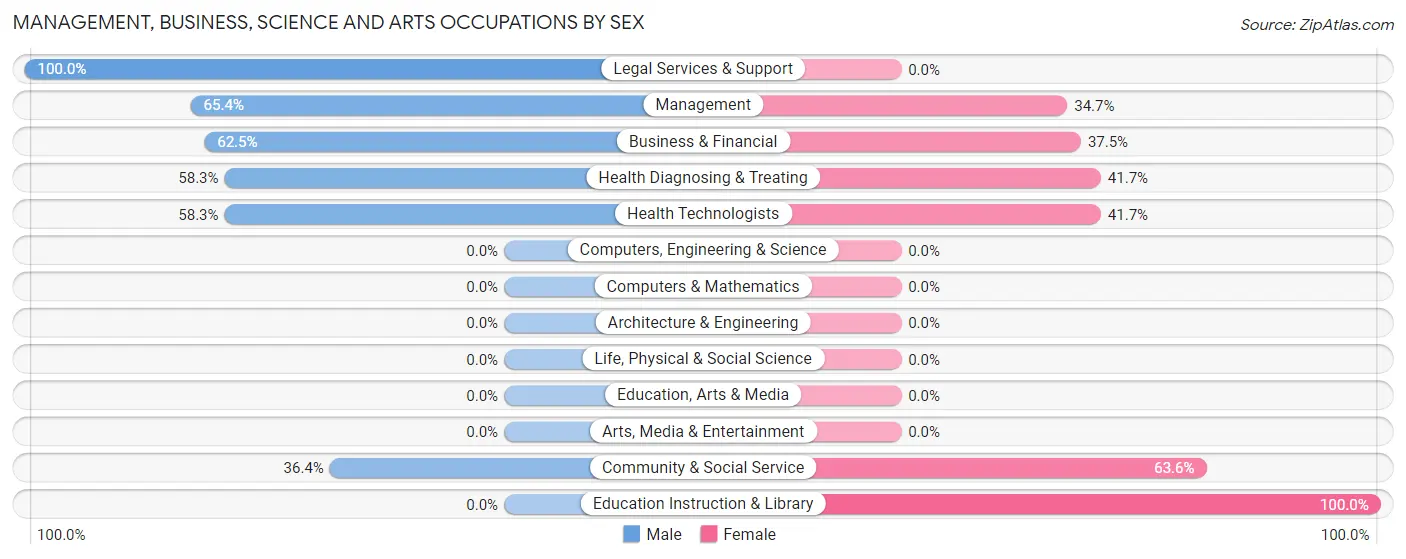
| Occupation | Male | Female |
| Management | 66 (65.3%) | 35 (34.6%) |
| Business & Financial | 15 (62.5%) | 9 (37.5%) |
| Computers, Engineering & Science | 0 (0.0%) | 0 (0.0%) |
| Computers & Mathematics | 0 (0.0%) | 0 (0.0%) |
| Architecture & Engineering | 0 (0.0%) | 0 (0.0%) |
| Life, Physical & Social Science | 0 (0.0%) | 0 (0.0%) |
| Community & Social Service | 12 (36.4%) | 21 (63.6%) |
| Education, Arts & Media | 0 (0.0%) | 0 (0.0%) |
| Legal Services & Support | 12 (100.0%) | 0 (0.0%) |
| Education Instruction & Library | 0 (0.0%) | 21 (100.0%) |
| Arts, Media & Entertainment | 0 (0.0%) | 0 (0.0%) |
| Health Diagnosing & Treating | 7 (58.3%) | 5 (41.7%) |
| Health Technologists | 7 (58.3%) | 5 (41.7%) |
| Total (Category) | 100 (58.8%) | 70 (41.2%) |
| Total (Overall) | 281 (65.5%) | 148 (34.5%) |
Services Occupations
The most common Services occupations in Taconic Shores are , and Food Preparation & Serving (23 | 5.4%).
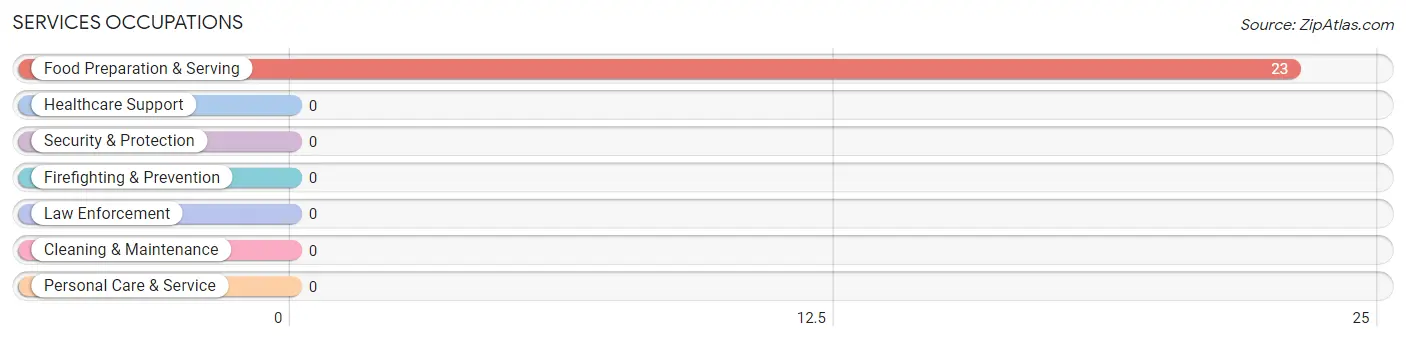
Services Occupations by Sex
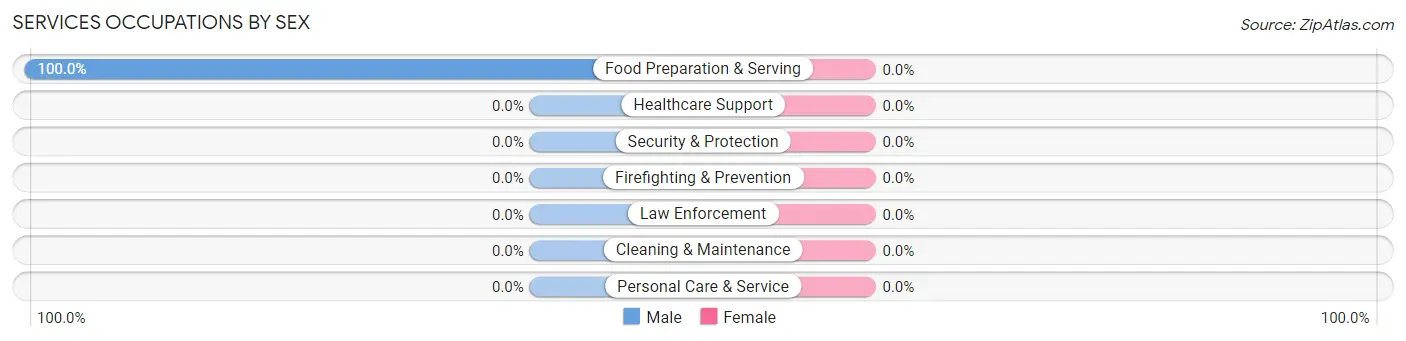
| Occupation | Male | Female |
| Healthcare Support | 0 (0.0%) | 0 (0.0%) |
| Security & Protection | 0 (0.0%) | 0 (0.0%) |
| Firefighting & Prevention | 0 (0.0%) | 0 (0.0%) |
| Law Enforcement | 0 (0.0%) | 0 (0.0%) |
| Food Preparation & Serving | 23 (100.0%) | 0 (0.0%) |
| Cleaning & Maintenance | 0 (0.0%) | 0 (0.0%) |
| Personal Care & Service | 0 (0.0%) | 0 (0.0%) |
| Total (Category) | 23 (100.0%) | 0 (0.0%) |
| Total (Overall) | 281 (65.5%) | 148 (34.5%) |
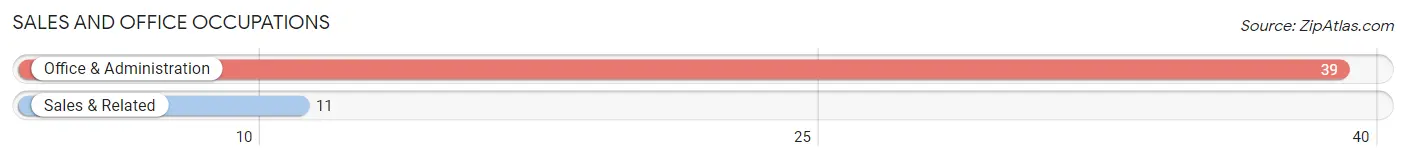
Sales and Office Occupations
The most common Sales and Office occupations in Taconic Shores are Office & Administration (39 | 9.1%), and Sales & Related (11 | 2.6%).
Sales and Office Occupations by Sex

| Occupation | Male | Female |
| Sales & Related | 11 (100.0%) | 0 (0.0%) |
| Office & Administration | 26 (66.7%) | 13 (33.3%) |
| Total (Category) | 37 (74.0%) | 13 (26.0%) |
| Total (Overall) | 281 (65.5%) | 148 (34.5%) |
Natural Resources, Construction and Maintenance Occupations
The most common Natural Resources, Construction and Maintenance occupations in Taconic Shores are Installation, Maintenance & Repair (90 | 21.0%), and Construction & Extraction (21 | 4.9%).
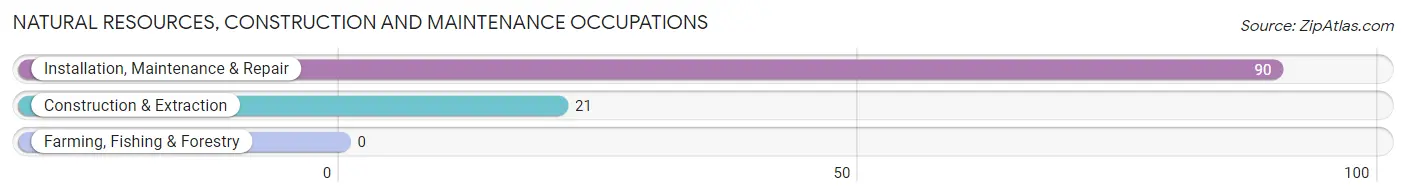
Natural Resources, Construction and Maintenance Occupations by Sex
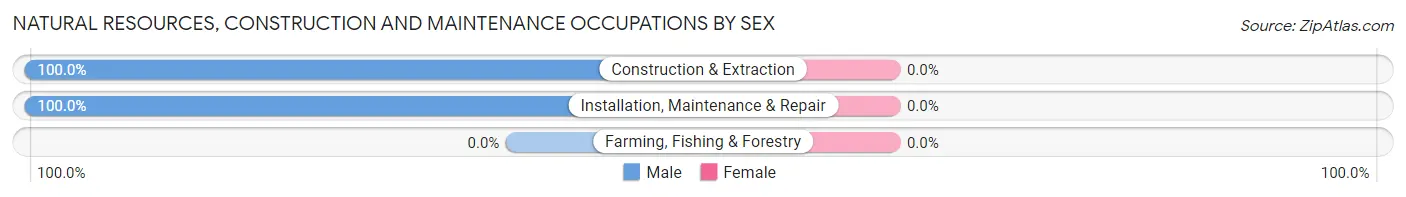
| Occupation | Male | Female |
| Farming, Fishing & Forestry | 0 (0.0%) | 0 (0.0%) |
| Construction & Extraction | 21 (100.0%) | 0 (0.0%) |
| Installation, Maintenance & Repair | 90 (100.0%) | 0 (0.0%) |
| Total (Category) | 111 (100.0%) | 0 (0.0%) |
| Total (Overall) | 281 (65.5%) | 148 (34.5%) |
Production, Transportation and Moving Occupations
The most common Production, Transportation and Moving occupations in Taconic Shores are , and Production (75 | 17.5%).
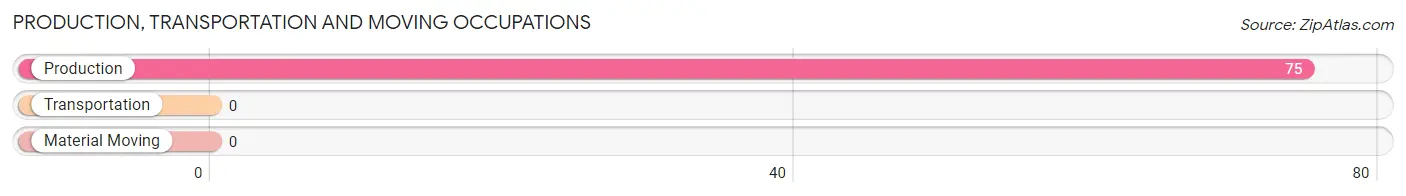
Production, Transportation and Moving Occupations by Sex
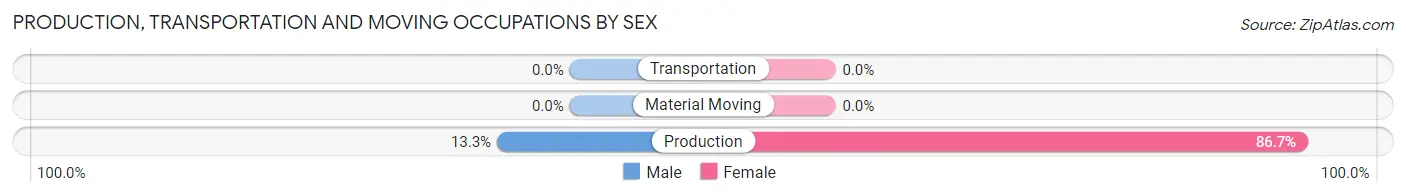
| Occupation | Male | Female |
| Production | 10 (13.3%) | 65 (86.7%) |
| Transportation | 0 (0.0%) | 0 (0.0%) |
| Material Moving | 0 (0.0%) | 0 (0.0%) |
| Total (Category) | 10 (13.3%) | 65 (86.7%) |
| Total (Overall) | 281 (65.5%) | 148 (34.5%) |
Employment Industries by Sex in Taconic Shores
Employment Industries in Taconic Shores
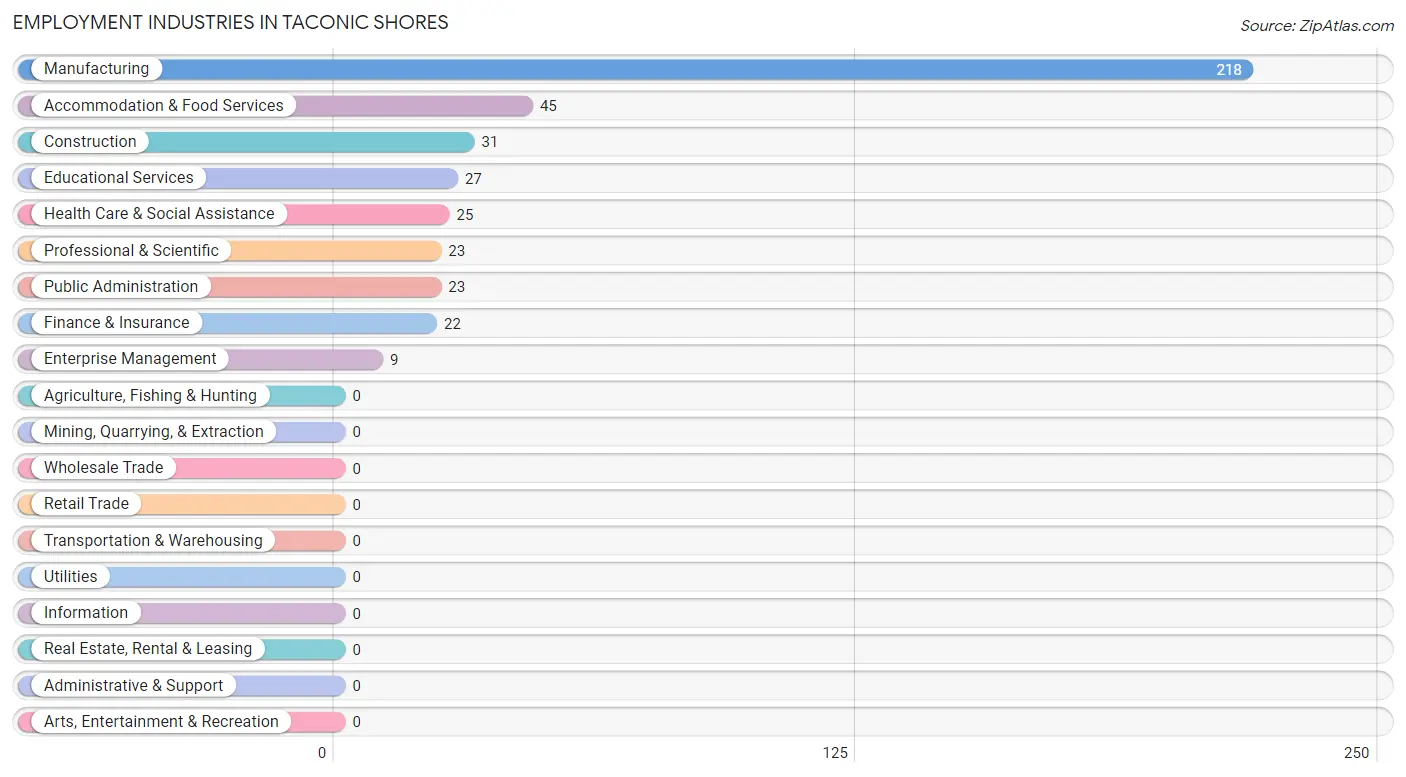
The major employment industries in Taconic Shores include Manufacturing (218 | 50.8%), Accommodation & Food Services (45 | 10.5%), Construction (31 | 7.2%), Educational Services (27 | 6.3%), and Health Care & Social Assistance (25 | 5.8%).
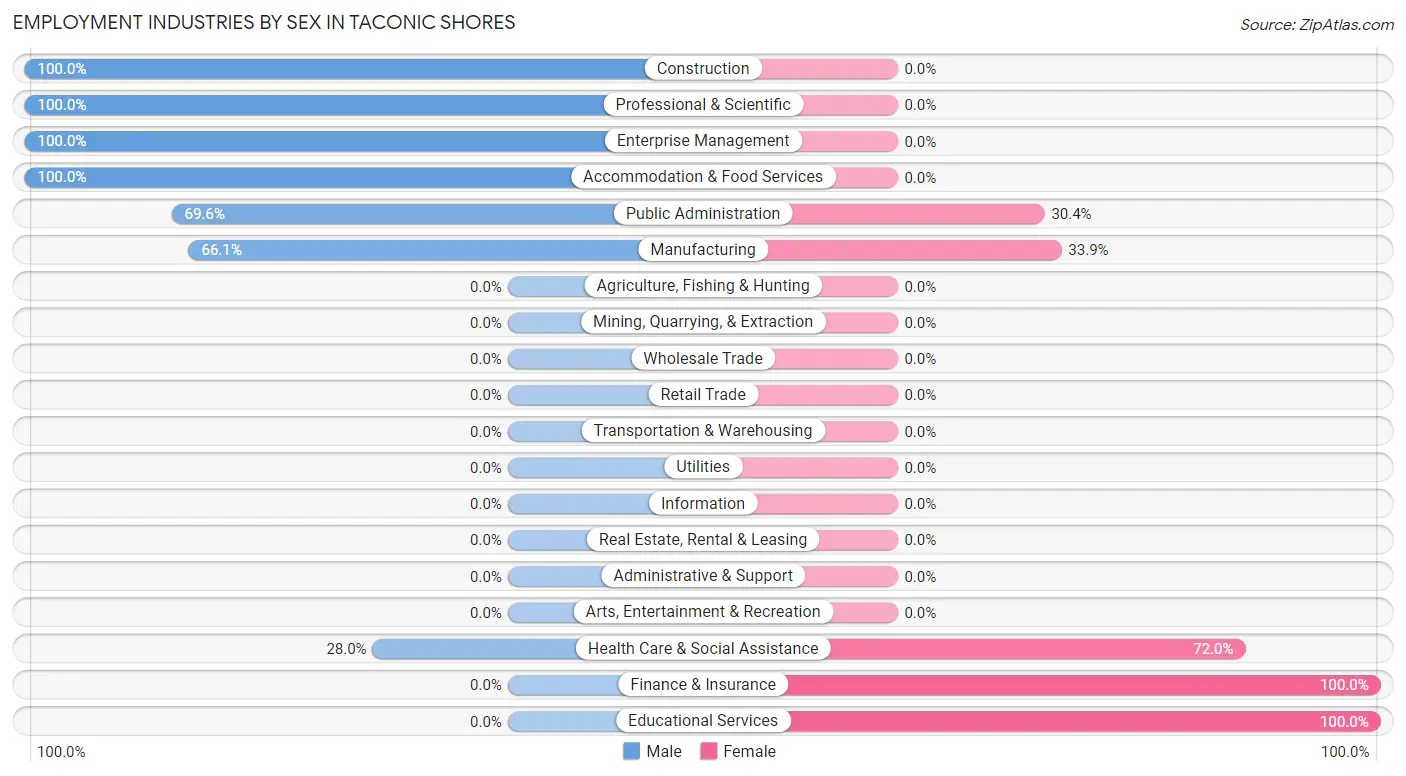
Employment Industries by Sex in Taconic Shores
The Taconic Shores industries that see more men than women are Construction (100.0%), Professional & Scientific (100.0%), and Enterprise Management (100.0%), whereas the industries that tend to have a higher number of women are Finance & Insurance (100.0%), Educational Services (100.0%), and Health Care & Social Assistance (72.0%).
| Industry | Male | Female |
| Agriculture, Fishing & Hunting | 0 (0.0%) | 0 (0.0%) |
| Mining, Quarrying, & Extraction | 0 (0.0%) | 0 (0.0%) |
| Construction | 31 (100.0%) | 0 (0.0%) |
| Manufacturing | 144 (66.1%) | 74 (33.9%) |
| Wholesale Trade | 0 (0.0%) | 0 (0.0%) |
| Retail Trade | 0 (0.0%) | 0 (0.0%) |
| Transportation & Warehousing | 0 (0.0%) | 0 (0.0%) |
| Utilities | 0 (0.0%) | 0 (0.0%) |
| Information | 0 (0.0%) | 0 (0.0%) |
| Finance & Insurance | 0 (0.0%) | 22 (100.0%) |
| Real Estate, Rental & Leasing | 0 (0.0%) | 0 (0.0%) |
| Professional & Scientific | 23 (100.0%) | 0 (0.0%) |
| Enterprise Management | 9 (100.0%) | 0 (0.0%) |
| Administrative & Support | 0 (0.0%) | 0 (0.0%) |
| Educational Services | 0 (0.0%) | 27 (100.0%) |
| Health Care & Social Assistance | 7 (28.0%) | 18 (72.0%) |
| Arts, Entertainment & Recreation | 0 (0.0%) | 0 (0.0%) |
| Accommodation & Food Services | 45 (100.0%) | 0 (0.0%) |
| Public Administration | 16 (69.6%) | 7 (30.4%) |
| Total | 281 (65.5%) | 148 (34.5%) |
Education in Taconic Shores
School Enrollment in Taconic Shores
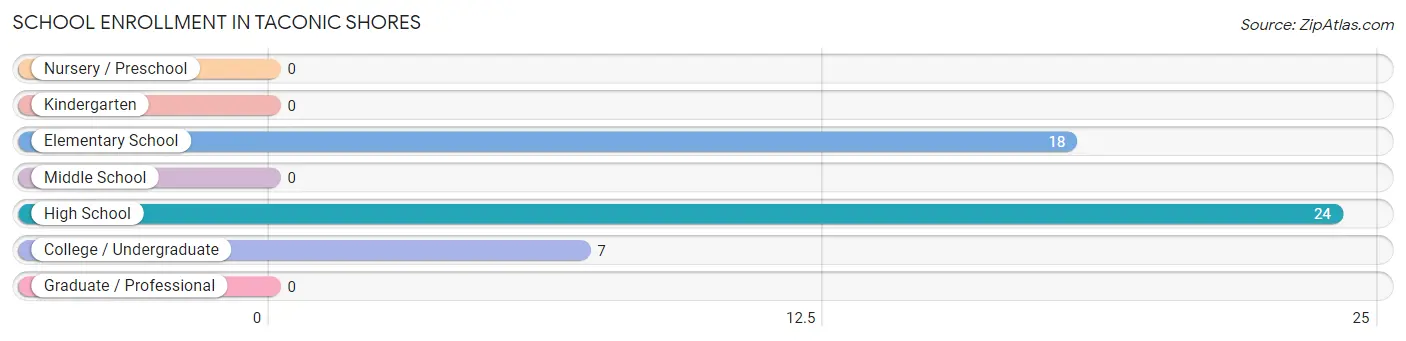
The most common levels of schooling among the 49 students in Taconic Shores are high school (24 | 49.0%), elementary school (18 | 36.7%), and college / undergraduate (7 | 14.3%).
| School Level | # Students | % Students |
| Nursery / Preschool | 0 | 0.0% |
| Kindergarten | 0 | 0.0% |
| Elementary School | 18 | 36.7% |
| Middle School | 0 | 0.0% |
| High School | 24 | 49.0% |
| College / Undergraduate | 7 | 14.3% |
| Graduate / Professional | 0 | 0.0% |
| Total | 49 | 100.0% |
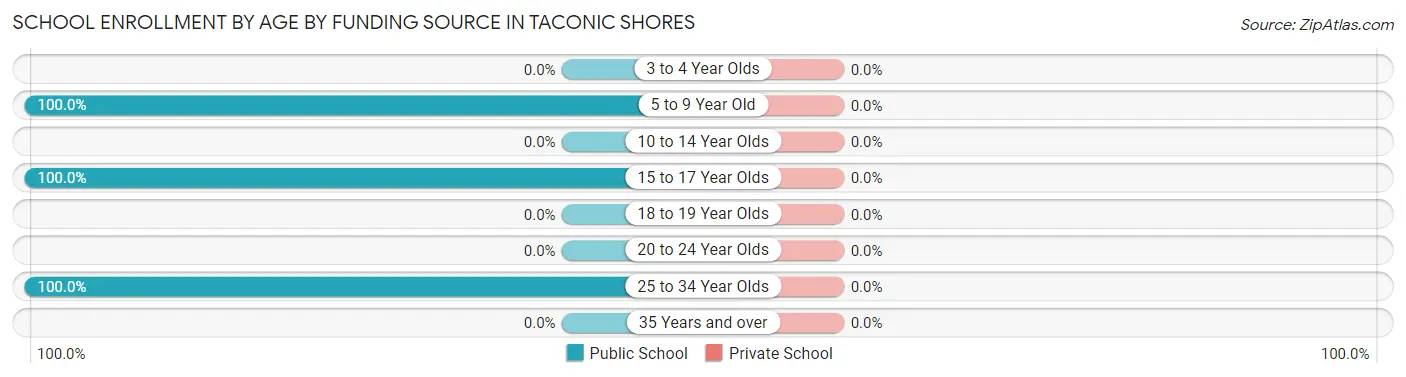
School Enrollment by Age by Funding Source in Taconic Shores
| Age Bracket | Public School | Private School |
| 3 to 4 Year Olds | 0 (0.0%) | 0 (0.0%) |
| 5 to 9 Year Old | 18 (100.0%) | 0 (0.0%) |
| 10 to 14 Year Olds | 0 (0.0%) | 0 (0.0%) |
| 15 to 17 Year Olds | 24 (100.0%) | 0 (0.0%) |
| 18 to 19 Year Olds | 0 (0.0%) | 0 (0.0%) |
| 20 to 24 Year Olds | 0 (0.0%) | 0 (0.0%) |
| 25 to 34 Year Olds | 7 (100.0%) | 0 (0.0%) |
| 35 Years and over | 0 (0.0%) | 0 (0.0%) |
| Total | 49 (100.0%) | 0 (0.0%) |
Educational Attainment by Field of Study in Taconic Shores
Bio, nature & agricultural (43 | 20.3%), business (30 | 14.1%), engineering (28 | 13.2%), physical & health sciences (23 | 10.8%), and liberal arts & history (23 | 10.8%) are the most common fields of study among 212 individuals in Taconic Shores who have obtained a bachelor's degree or higher.
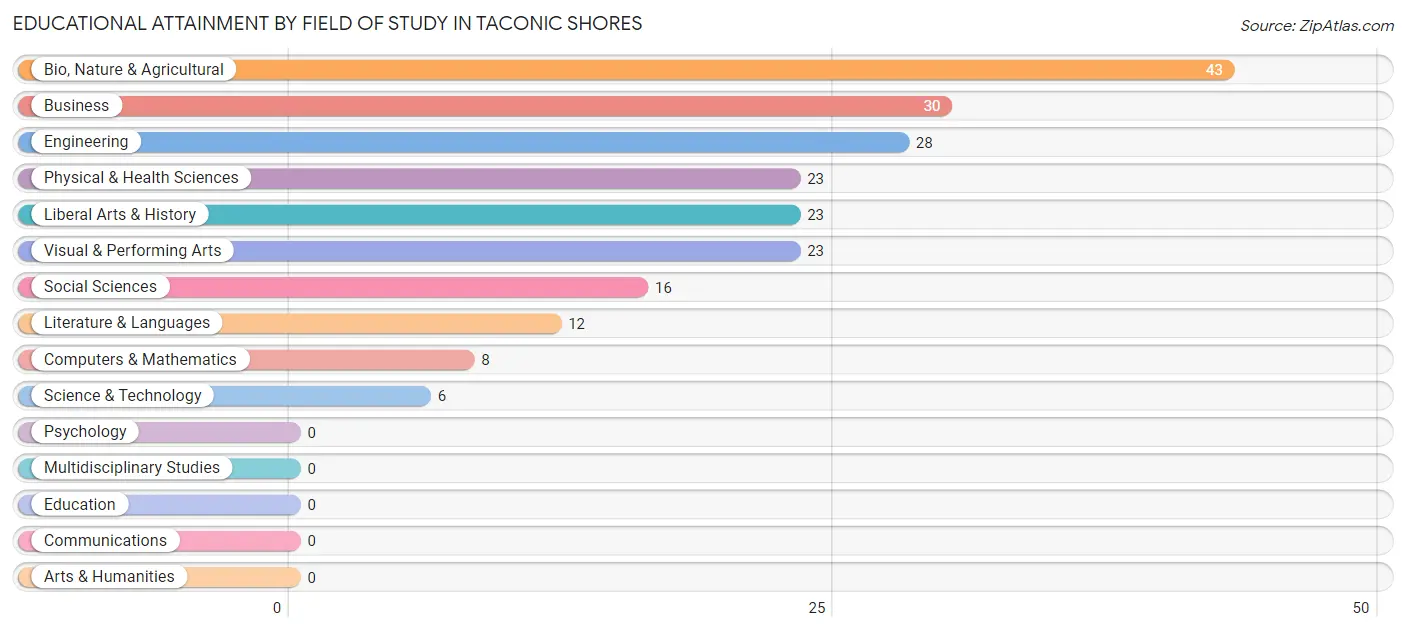
| Field of Study | # Graduates | % Graduates |
| Computers & Mathematics | 8 | 3.8% |
| Bio, Nature & Agricultural | 43 | 20.3% |
| Physical & Health Sciences | 23 | 10.8% |
| Psychology | 0 | 0.0% |
| Social Sciences | 16 | 7.5% |
| Engineering | 28 | 13.2% |
| Multidisciplinary Studies | 0 | 0.0% |
| Science & Technology | 6 | 2.8% |
| Business | 30 | 14.1% |
| Education | 0 | 0.0% |
| Literature & Languages | 12 | 5.7% |
| Liberal Arts & History | 23 | 10.8% |
| Visual & Performing Arts | 23 | 10.8% |
| Communications | 0 | 0.0% |
| Arts & Humanities | 0 | 0.0% |
| Total | 212 | 100.0% |
Transportation & Commute in Taconic Shores
Vehicle Availability by Sex in Taconic Shores
The most prevalent vehicle ownership categories in Taconic Shores are males with 5 or more vehicles (84, accounting for 29.9%) and females with 5 or more vehicles (65, making up 56.8%).
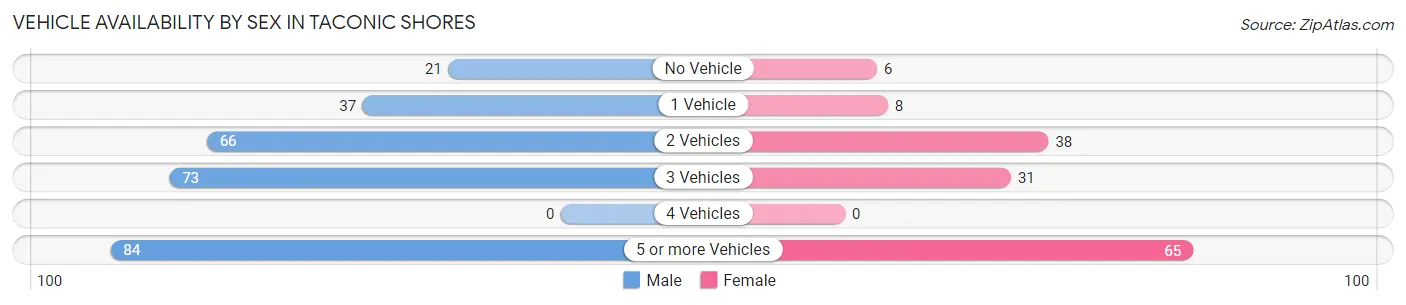
| Vehicles Available | Male | Female |
| No Vehicle | 21 (7.5%) | 6 (4.1%) |
| 1 Vehicle | 37 (13.2%) | 8 (5.4%) |
| 2 Vehicles | 66 (23.5%) | 38 (25.7%) |
| 3 Vehicles | 73 (26.0%) | 31 (20.9%) |
| 4 Vehicles | 0 (0.0%) | 0 (0.0%) |
| 5 or more Vehicles | 84 (29.9%) | 65 (43.9%) |
| Total | 281 (100.0%) | 148 (100.0%) |
Commute Time in Taconic Shores
The most frequently occuring commute durations in Taconic Shores are 45 to 59 minutes (156 commuters, 38.4%), 30 to 34 minutes (76 commuters, 18.7%), and 60 to 89 minutes (63 commuters, 15.5%).
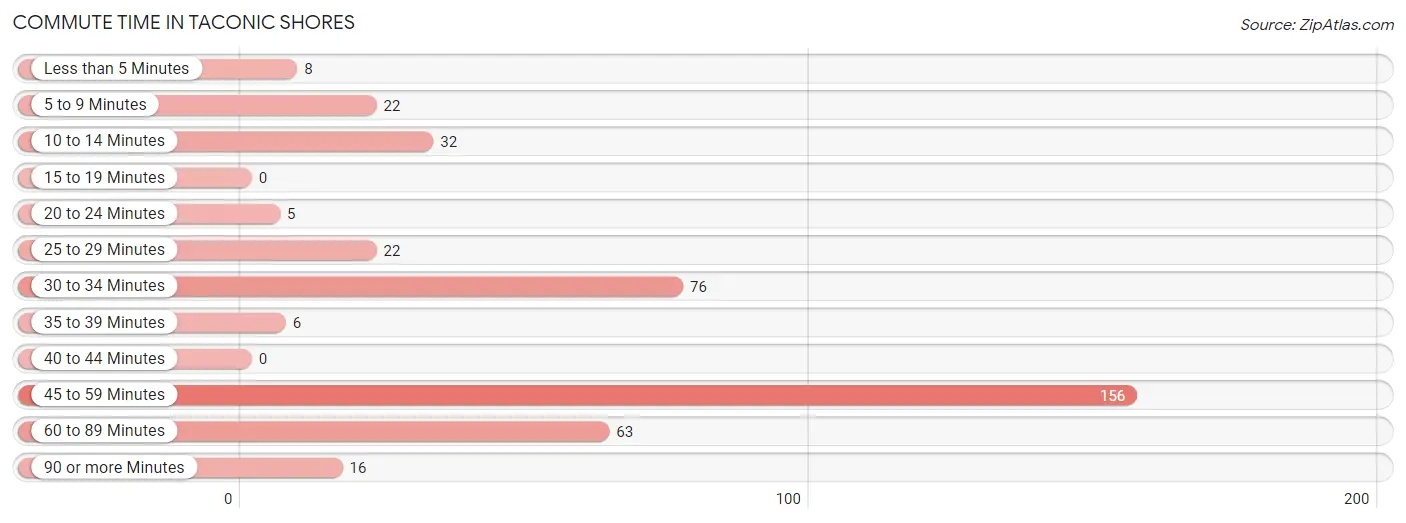
| Commute Time | # Commuters | % Commuters |
| Less than 5 Minutes | 8 | 2.0% |
| 5 to 9 Minutes | 22 | 5.4% |
| 10 to 14 Minutes | 32 | 7.9% |
| 15 to 19 Minutes | 0 | 0.0% |
| 20 to 24 Minutes | 5 | 1.2% |
| 25 to 29 Minutes | 22 | 5.4% |
| 30 to 34 Minutes | 76 | 18.7% |
| 35 to 39 Minutes | 6 | 1.5% |
| 40 to 44 Minutes | 0 | 0.0% |
| 45 to 59 Minutes | 156 | 38.4% |
| 60 to 89 Minutes | 63 | 15.5% |
| 90 or more Minutes | 16 | 3.9% |
Commute Time by Sex in Taconic Shores
The most common commute times in Taconic Shores are 45 to 59 minutes (91 commuters, 35.3%) for males and 45 to 59 minutes (65 commuters, 43.9%) for females.
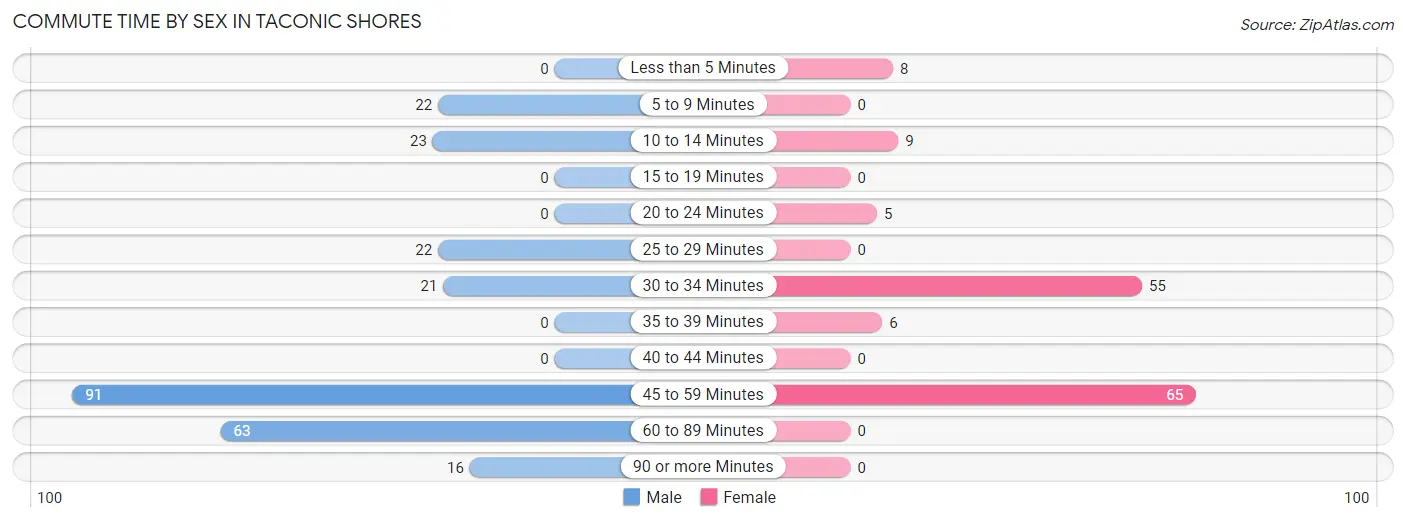
| Commute Time | Male | Female |
| Less than 5 Minutes | 0 (0.0%) | 8 (5.4%) |
| 5 to 9 Minutes | 22 (8.5%) | 0 (0.0%) |
| 10 to 14 Minutes | 23 (8.9%) | 9 (6.1%) |
| 15 to 19 Minutes | 0 (0.0%) | 0 (0.0%) |
| 20 to 24 Minutes | 0 (0.0%) | 5 (3.4%) |
| 25 to 29 Minutes | 22 (8.5%) | 0 (0.0%) |
| 30 to 34 Minutes | 21 (8.1%) | 55 (37.2%) |
| 35 to 39 Minutes | 0 (0.0%) | 6 (4.1%) |
| 40 to 44 Minutes | 0 (0.0%) | 0 (0.0%) |
| 45 to 59 Minutes | 91 (35.3%) | 65 (43.9%) |
| 60 to 89 Minutes | 63 (24.4%) | 0 (0.0%) |
| 90 or more Minutes | 16 (6.2%) | 0 (0.0%) |
Time of Departure to Work by Sex in Taconic Shores
The most frequent times of departure to work in Taconic Shores are 5:30 AM to 5:59 AM (84, 32.6%) for males and 11:00 AM to 11:59 AM (65, 43.9%) for females.
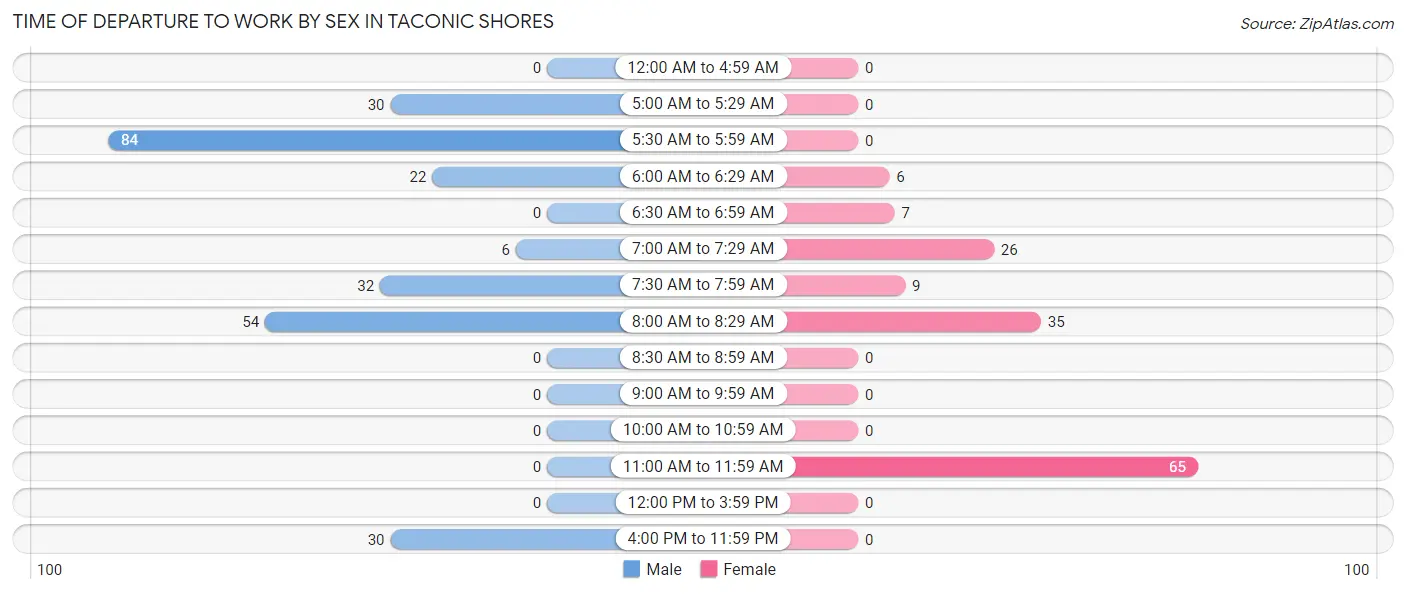
| Time of Departure | Male | Female |
| 12:00 AM to 4:59 AM | 0 (0.0%) | 0 (0.0%) |
| 5:00 AM to 5:29 AM | 30 (11.6%) | 0 (0.0%) |
| 5:30 AM to 5:59 AM | 84 (32.6%) | 0 (0.0%) |
| 6:00 AM to 6:29 AM | 22 (8.5%) | 6 (4.1%) |
| 6:30 AM to 6:59 AM | 0 (0.0%) | 7 (4.7%) |
| 7:00 AM to 7:29 AM | 6 (2.3%) | 26 (17.6%) |
| 7:30 AM to 7:59 AM | 32 (12.4%) | 9 (6.1%) |
| 8:00 AM to 8:29 AM | 54 (20.9%) | 35 (23.6%) |
| 8:30 AM to 8:59 AM | 0 (0.0%) | 0 (0.0%) |
| 9:00 AM to 9:59 AM | 0 (0.0%) | 0 (0.0%) |
| 10:00 AM to 10:59 AM | 0 (0.0%) | 0 (0.0%) |
| 11:00 AM to 11:59 AM | 0 (0.0%) | 65 (43.9%) |
| 12:00 PM to 3:59 PM | 0 (0.0%) | 0 (0.0%) |
| 4:00 PM to 11:59 PM | 30 (11.6%) | 0 (0.0%) |
| Total | 258 (100.0%) | 148 (100.0%) |
Housing Occupancy in Taconic Shores
Occupancy by Ownership in Taconic Shores
Of the total 348 dwellings in Taconic Shores, owner-occupied units account for 327 (94.0%), while renter-occupied units make up 21 (6.0%).
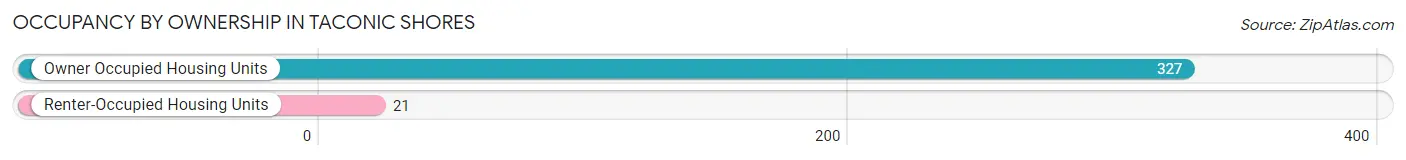
| Occupancy | # Housing Units | % Housing Units |
| Owner Occupied Housing Units | 327 | 94.0% |
| Renter-Occupied Housing Units | 21 | 6.0% |
| Total Occupied Housing Units | 348 | 100.0% |
Occupancy by Household Size in Taconic Shores
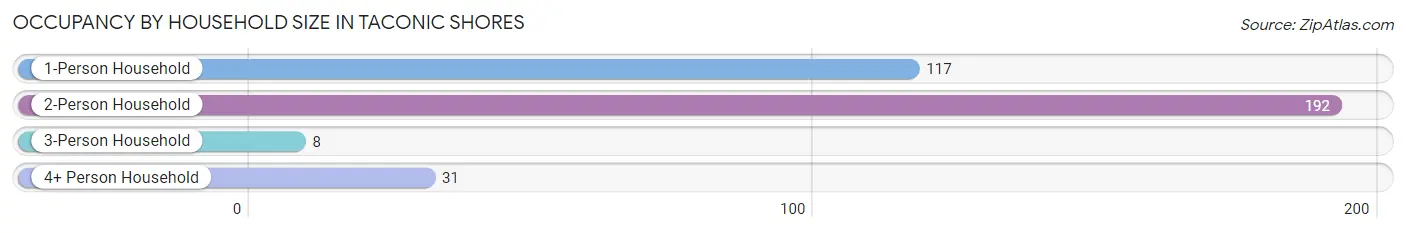
| Household Size | # Housing Units | % Housing Units |
| 1-Person Household | 117 | 33.6% |
| 2-Person Household | 192 | 55.2% |
| 3-Person Household | 8 | 2.3% |
| 4+ Person Household | 31 | 8.9% |
| Total Housing Units | 348 | 100.0% |
Occupancy by Ownership by Household Size in Taconic Shores
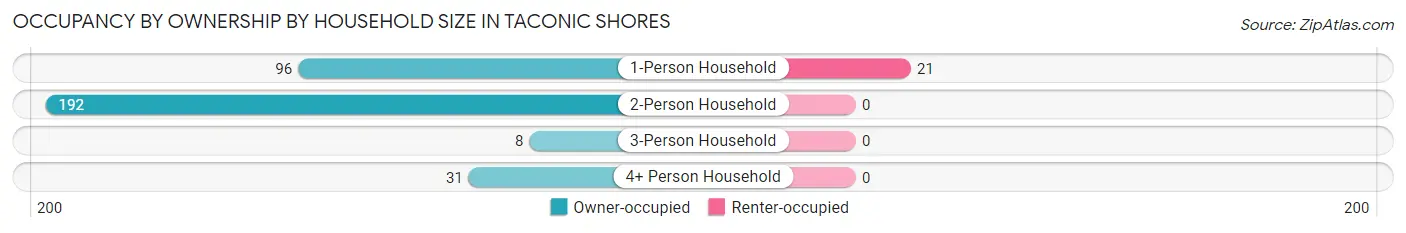
| Household Size | Owner-occupied | Renter-occupied |
| 1-Person Household | 96 (82.1%) | 21 (17.9%) |
| 2-Person Household | 192 (100.0%) | 0 (0.0%) |
| 3-Person Household | 8 (100.0%) | 0 (0.0%) |
| 4+ Person Household | 31 (100.0%) | 0 (0.0%) |
| Total Housing Units | 327 (94.0%) | 21 (6.0%) |
Occupancy by Educational Attainment in Taconic Shores
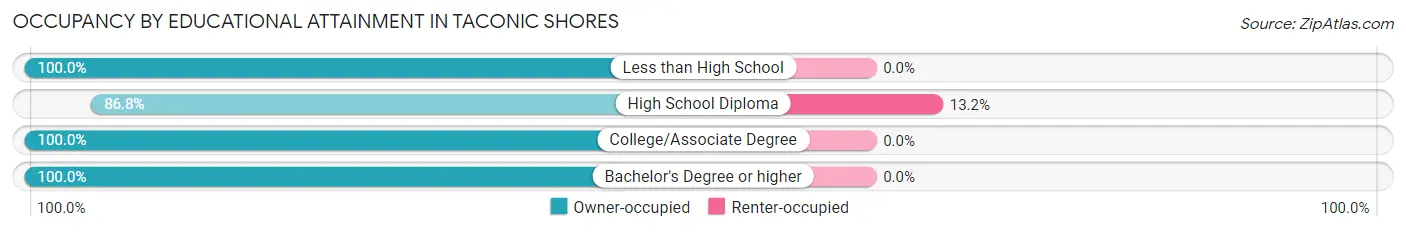
| Household Size | Owner-occupied | Renter-occupied |
| Less than High School | 6 (100.0%) | 0 (0.0%) |
| High School Diploma | 138 (86.8%) | 21 (13.2%) |
| College/Associate Degree | 67 (100.0%) | 0 (0.0%) |
| Bachelor's Degree or higher | 116 (100.0%) | 0 (0.0%) |
Occupancy by Age of Householder in Taconic Shores
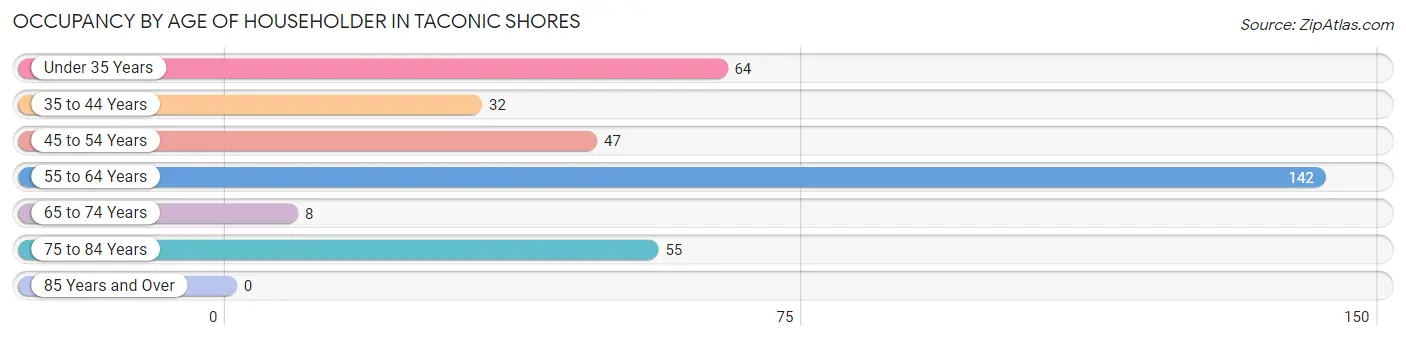
| Age Bracket | # Households | % Households |
| Under 35 Years | 64 | 18.4% |
| 35 to 44 Years | 32 | 9.2% |
| 45 to 54 Years | 47 | 13.5% |
| 55 to 64 Years | 142 | 40.8% |
| 65 to 74 Years | 8 | 2.3% |
| 75 to 84 Years | 55 | 15.8% |
| 85 Years and Over | 0 | 0.0% |
| Total | 348 | 100.0% |
Housing Finances in Taconic Shores
Median Income by Occupancy in Taconic Shores
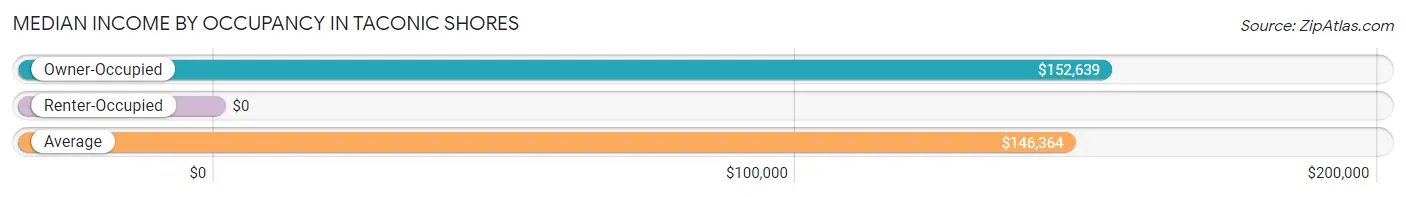
| Occupancy Type | # Households | Median Income |
| Owner-Occupied | 327 (94.0%) | $152,639 |
| Renter-Occupied | 21 (6.0%) | $0 |
| Average | 348 (100.0%) | $146,364 |
Occupancy by Householder Income Bracket in Taconic Shores

| Income Bracket | Owner-occupied | Renter-occupied |
| Less than $5,000 | 0 (0.0%) | 0 (0.0%) |
| $5,000 to $9,999 | 10 (3.1%) | 0 (0.0%) |
| $10,000 to $14,999 | 0 (0.0%) | 0 (0.0%) |
| $15,000 to $19,999 | 0 (0.0%) | 0 (0.0%) |
| $20,000 to $24,999 | 20 (6.1%) | 0 (0.0%) |
| $25,000 to $34,999 | 0 (0.0%) | 0 (0.0%) |
| $35,000 to $49,999 | 39 (11.9%) | 0 (0.0%) |
| $50,000 to $74,999 | 39 (11.9%) | 21 (100.0%) |
| $75,000 to $99,999 | 22 (6.7%) | 0 (0.0%) |
| $100,000 to $149,999 | 33 (10.1%) | 0 (0.0%) |
| $150,000 or more | 164 (50.1%) | 0 (0.0%) |
| Total | 327 (100.0%) | 21 (100.0%) |
Monthly Housing Cost Tiers in Taconic Shores
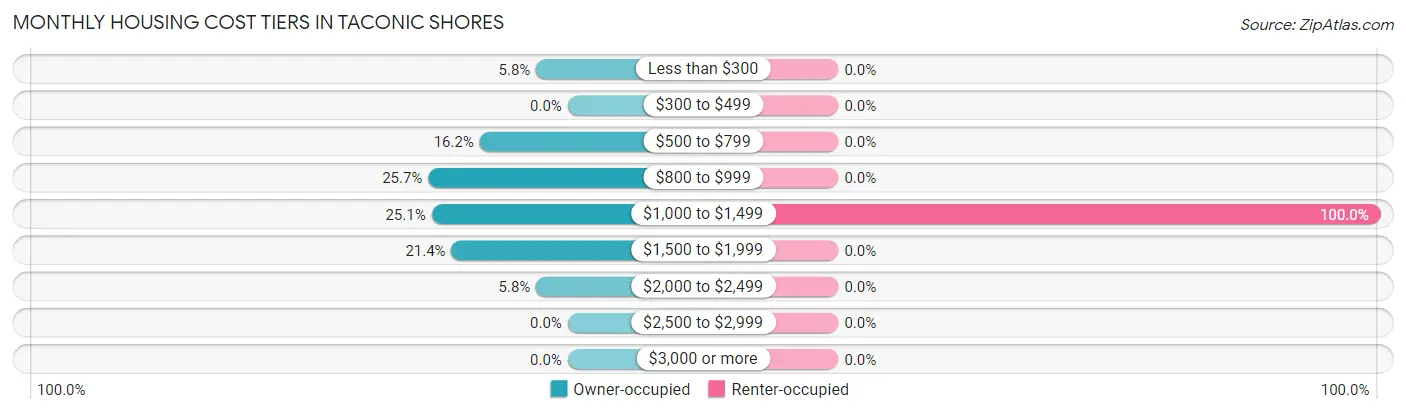
| Monthly Cost | Owner-occupied | Renter-occupied |
| Less than $300 | 19 (5.8%) | 0 (0.0%) |
| $300 to $499 | 0 (0.0%) | 0 (0.0%) |
| $500 to $799 | 53 (16.2%) | 0 (0.0%) |
| $800 to $999 | 84 (25.7%) | 0 (0.0%) |
| $1,000 to $1,499 | 82 (25.1%) | 21 (100.0%) |
| $1,500 to $1,999 | 70 (21.4%) | 0 (0.0%) |
| $2,000 to $2,499 | 19 (5.8%) | 0 (0.0%) |
| $2,500 to $2,999 | 0 (0.0%) | 0 (0.0%) |
| $3,000 or more | 0 (0.0%) | 0 (0.0%) |
| Total | 327 (100.0%) | 21 (100.0%) |
Physical Housing Characteristics in Taconic Shores
Housing Structures in Taconic Shores
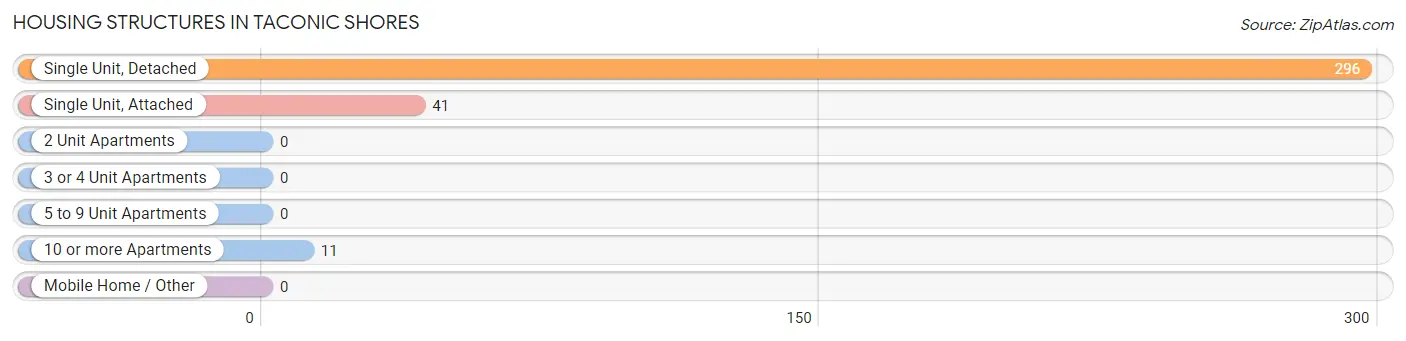
| Structure Type | # Housing Units | % Housing Units |
| Single Unit, Detached | 296 | 85.1% |
| Single Unit, Attached | 41 | 11.8% |
| 2 Unit Apartments | 0 | 0.0% |
| 3 or 4 Unit Apartments | 0 | 0.0% |
| 5 to 9 Unit Apartments | 0 | 0.0% |
| 10 or more Apartments | 11 | 3.2% |
| Mobile Home / Other | 0 | 0.0% |
| Total | 348 | 100.0% |
Housing Structures by Occupancy in Taconic Shores
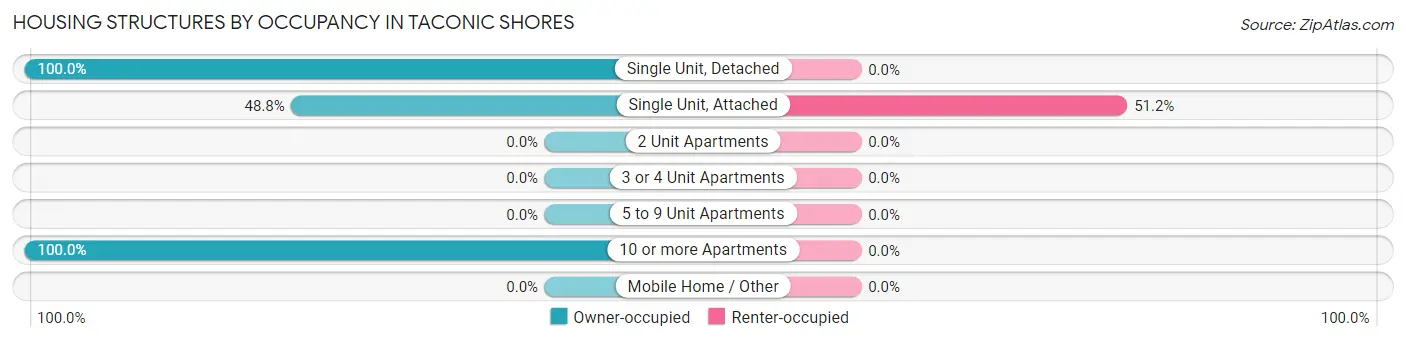
| Structure Type | Owner-occupied | Renter-occupied |
| Single Unit, Detached | 296 (100.0%) | 0 (0.0%) |
| Single Unit, Attached | 20 (48.8%) | 21 (51.2%) |
| 2 Unit Apartments | 0 (0.0%) | 0 (0.0%) |
| 3 or 4 Unit Apartments | 0 (0.0%) | 0 (0.0%) |
| 5 to 9 Unit Apartments | 0 (0.0%) | 0 (0.0%) |
| 10 or more Apartments | 11 (100.0%) | 0 (0.0%) |
| Mobile Home / Other | 0 (0.0%) | 0 (0.0%) |
| Total | 327 (94.0%) | 21 (6.0%) |
Housing Structures by Number of Rooms in Taconic Shores
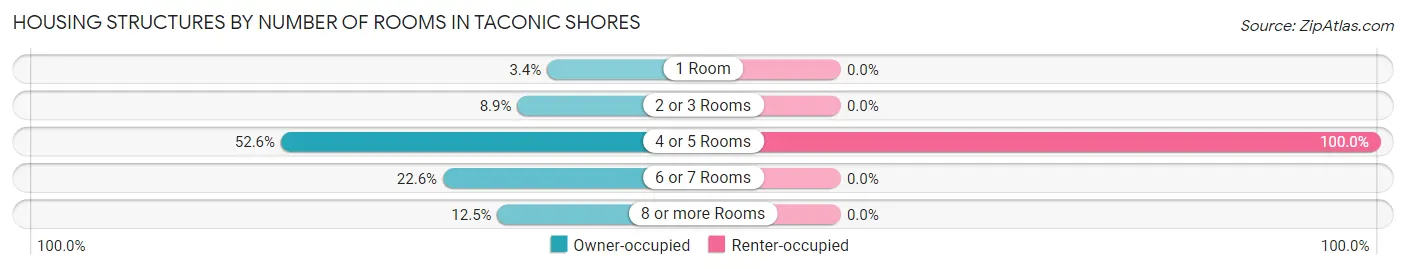
| Number of Rooms | Owner-occupied | Renter-occupied |
| 1 Room | 11 (3.4%) | 0 (0.0%) |
| 2 or 3 Rooms | 29 (8.9%) | 0 (0.0%) |
| 4 or 5 Rooms | 172 (52.6%) | 21 (100.0%) |
| 6 or 7 Rooms | 74 (22.6%) | 0 (0.0%) |
| 8 or more Rooms | 41 (12.5%) | 0 (0.0%) |
| Total | 327 (100.0%) | 21 (100.0%) |
Housing Structure by Heating Type in Taconic Shores
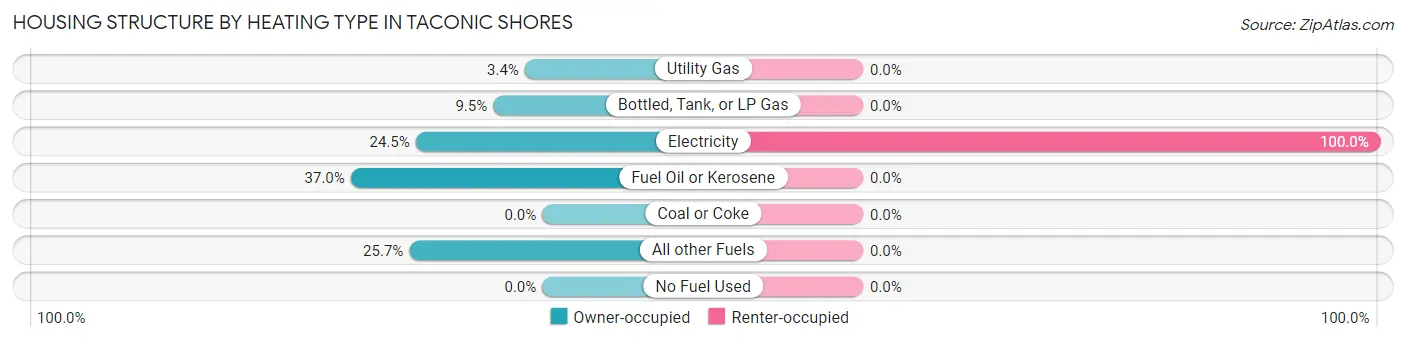
| Heating Type | Owner-occupied | Renter-occupied |
| Utility Gas | 11 (3.4%) | 0 (0.0%) |
| Bottled, Tank, or LP Gas | 31 (9.5%) | 0 (0.0%) |
| Electricity | 80 (24.5%) | 21 (100.0%) |
| Fuel Oil or Kerosene | 121 (37.0%) | 0 (0.0%) |
| Coal or Coke | 0 (0.0%) | 0 (0.0%) |
| All other Fuels | 84 (25.7%) | 0 (0.0%) |
| No Fuel Used | 0 (0.0%) | 0 (0.0%) |
| Total | 327 (100.0%) | 21 (100.0%) |
Household Vehicle Usage in Taconic Shores
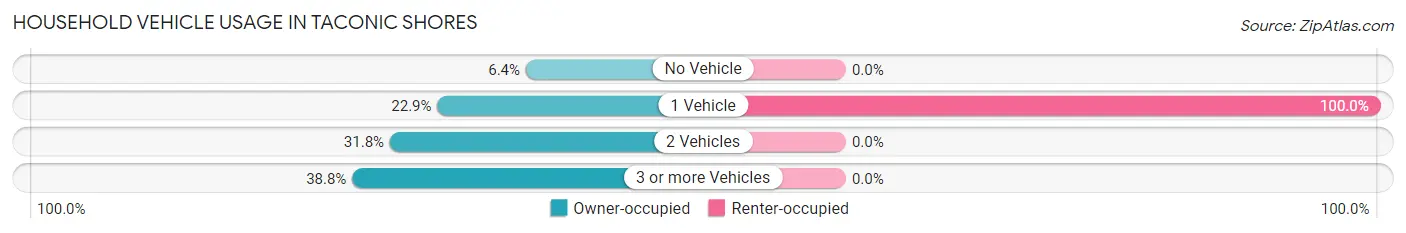
| Vehicles per Household | Owner-occupied | Renter-occupied |
| No Vehicle | 21 (6.4%) | 0 (0.0%) |
| 1 Vehicle | 75 (22.9%) | 21 (100.0%) |
| 2 Vehicles | 104 (31.8%) | 0 (0.0%) |
| 3 or more Vehicles | 127 (38.8%) | 0 (0.0%) |
| Total | 327 (100.0%) | 21 (100.0%) |
Real Estate & Mortgages in Taconic Shores
Real Estate and Mortgage Overview in Taconic Shores
| Characteristic | Without Mortgage | With Mortgage |
| Housing Units | 156 | 171 |
| Median Property Value | $119,900 | $233,500 |
| Median Household Income | $165,446 | $62 |
| Monthly Housing Costs | $817 | $0 |
| Real Estate Taxes | $3,449 | $0 |
Property Value by Mortgage Status in Taconic Shores
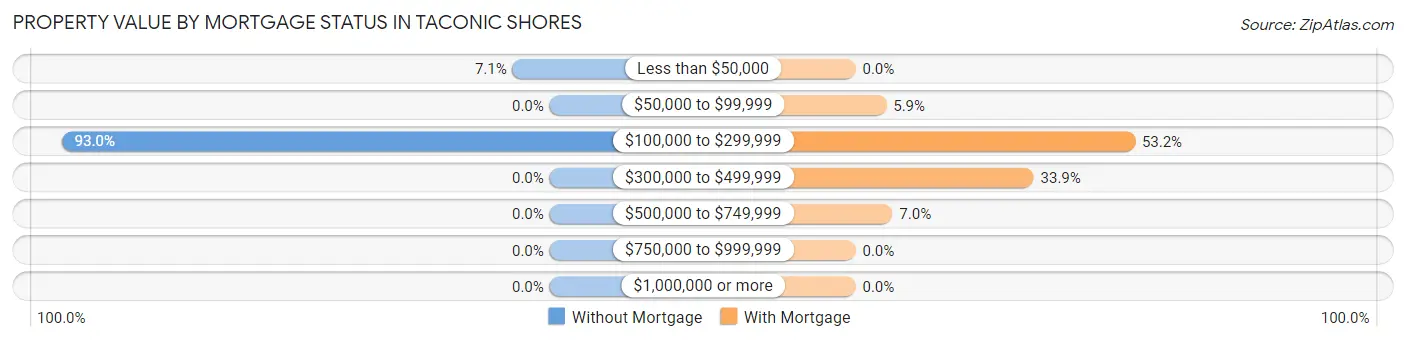
| Property Value | Without Mortgage | With Mortgage |
| Less than $50,000 | 11 (7.0%) | 0 (0.0%) |
| $50,000 to $99,999 | 0 (0.0%) | 10 (5.9%) |
| $100,000 to $299,999 | 145 (92.9%) | 91 (53.2%) |
| $300,000 to $499,999 | 0 (0.0%) | 58 (33.9%) |
| $500,000 to $749,999 | 0 (0.0%) | 12 (7.0%) |
| $750,000 to $999,999 | 0 (0.0%) | 0 (0.0%) |
| $1,000,000 or more | 0 (0.0%) | 0 (0.0%) |
| Total | 156 (100.0%) | 171 (100.0%) |
Household Income by Mortgage Status in Taconic Shores
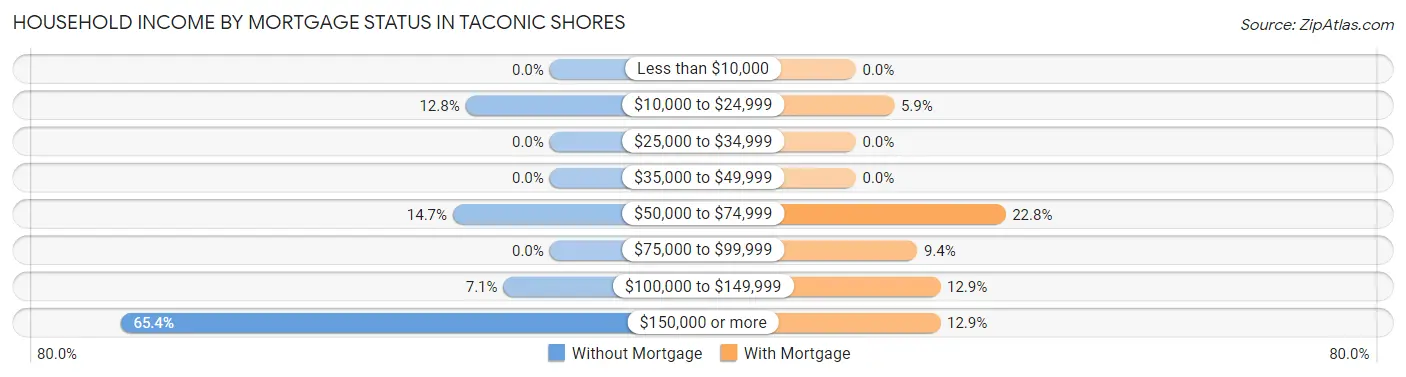
| Household Income | Without Mortgage | With Mortgage |
| Less than $10,000 | 0 (0.0%) | 0 (0.0%) |
| $10,000 to $24,999 | 20 (12.8%) | 10 (5.9%) |
| $25,000 to $34,999 | 0 (0.0%) | 0 (0.0%) |
| $35,000 to $49,999 | 0 (0.0%) | 0 (0.0%) |
| $50,000 to $74,999 | 23 (14.7%) | 39 (22.8%) |
| $75,000 to $99,999 | 0 (0.0%) | 16 (9.4%) |
| $100,000 to $149,999 | 11 (7.0%) | 22 (12.9%) |
| $150,000 or more | 102 (65.4%) | 22 (12.9%) |
| Total | 156 (100.0%) | 171 (100.0%) |
Property Value to Household Income Ratio in Taconic Shores
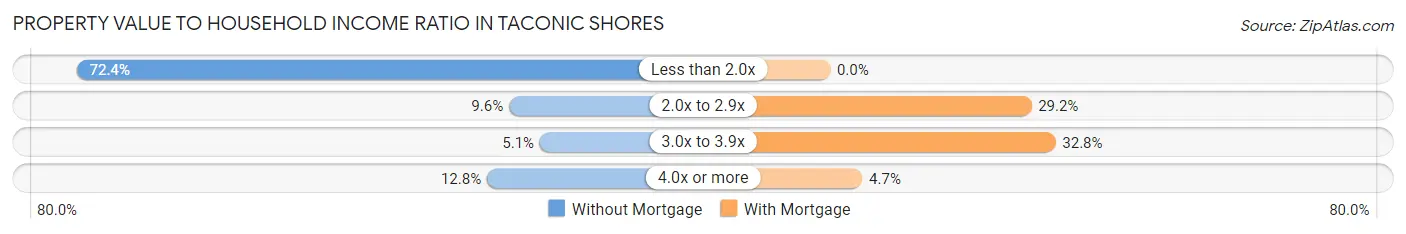
| Value-to-Income Ratio | Without Mortgage | With Mortgage |
| Less than 2.0x | 113 (72.4%) | 0 (0.0%) |
| 2.0x to 2.9x | 15 (9.6%) | 50 (29.2%) |
| 3.0x to 3.9x | 8 (5.1%) | 56 (32.8%) |
| 4.0x or more | 20 (12.8%) | 8 (4.7%) |
| Total | 156 (100.0%) | 171 (100.0%) |
Real Estate Taxes by Mortgage Status in Taconic Shores
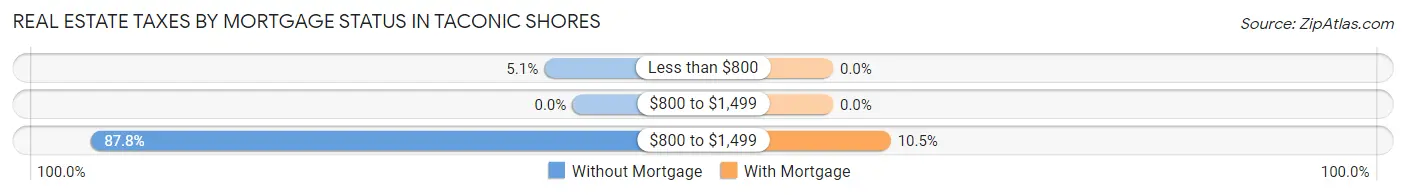
| Property Taxes | Without Mortgage | With Mortgage |
| Less than $800 | 8 (5.1%) | 0 (0.0%) |
| $800 to $1,499 | 0 (0.0%) | 0 (0.0%) |
| $800 to $1,499 | 137 (87.8%) | 18 (10.5%) |
| Total | 156 (100.0%) | 171 (100.0%) |
Health & Disability in Taconic Shores
Health Insurance Coverage by Age in Taconic Shores
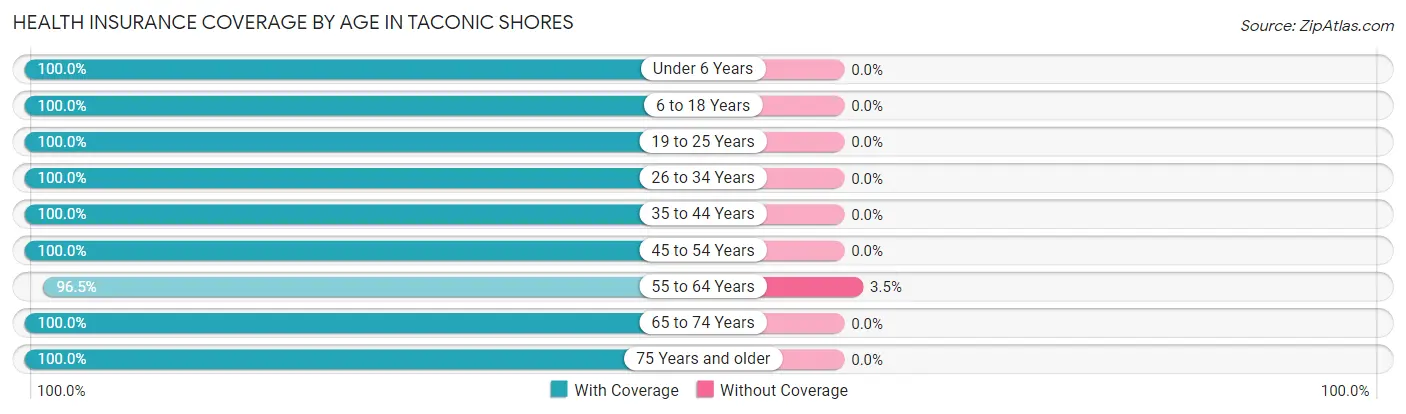
| Age Bracket | With Coverage | Without Coverage |
| Under 6 Years | 13 (100.0%) | 0 (0.0%) |
| 6 to 18 Years | 42 (100.0%) | 0 (0.0%) |
| 19 to 25 Years | 47 (100.0%) | 0 (0.0%) |
| 26 to 34 Years | 68 (100.0%) | 0 (0.0%) |
| 35 to 44 Years | 41 (100.0%) | 0 (0.0%) |
| 45 to 54 Years | 102 (100.0%) | 0 (0.0%) |
| 55 to 64 Years | 219 (96.5%) | 8 (3.5%) |
| 65 to 74 Years | 38 (100.0%) | 0 (0.0%) |
| 75 Years and older | 74 (100.0%) | 0 (0.0%) |
| Total | 644 (98.8%) | 8 (1.2%) |
Health Insurance Coverage by Citizenship Status in Taconic Shores

| Citizenship Status | With Coverage | Without Coverage |
| Native Born | 13 (100.0%) | 0 (0.0%) |
| Foreign Born, Citizen | 42 (100.0%) | 0 (0.0%) |
| Foreign Born, not a Citizen | 47 (100.0%) | 0 (0.0%) |
Health Insurance Coverage by Household Income in Taconic Shores
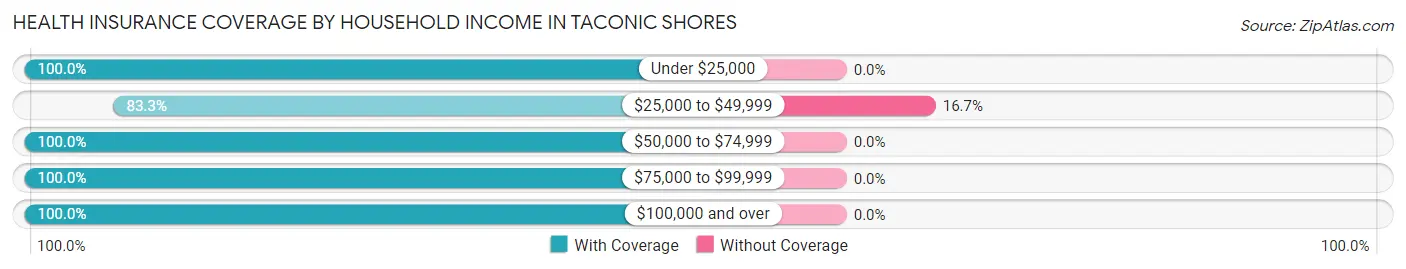
| Household Income | With Coverage | Without Coverage |
| Under $25,000 | 39 (100.0%) | 0 (0.0%) |
| $25,000 to $49,999 | 40 (83.3%) | 8 (16.7%) |
| $50,000 to $74,999 | 116 (100.0%) | 0 (0.0%) |
| $75,000 to $99,999 | 22 (100.0%) | 0 (0.0%) |
| $100,000 and over | 427 (100.0%) | 0 (0.0%) |
Public vs Private Health Insurance Coverage by Age in Taconic Shores
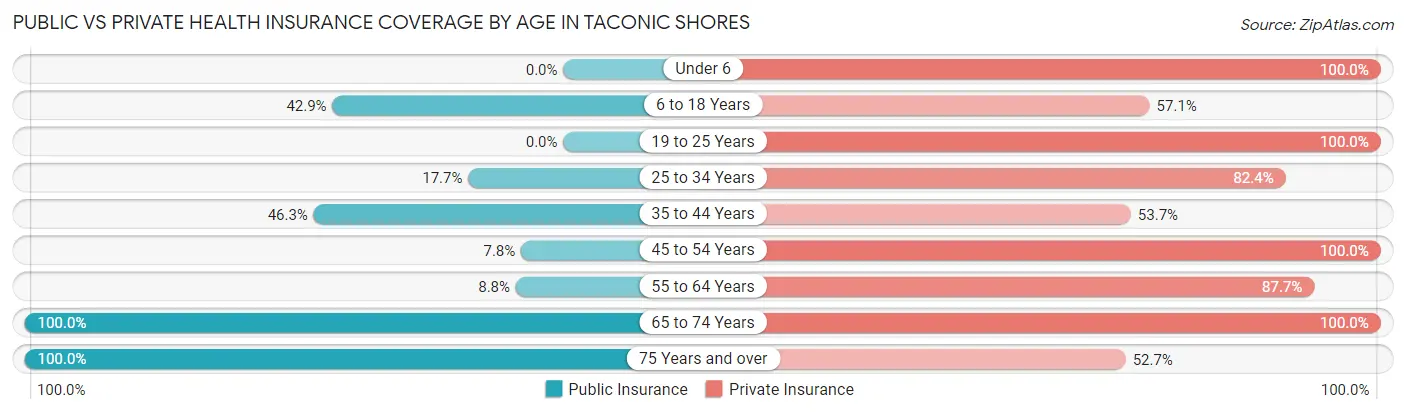
| Age Bracket | Public Insurance | Private Insurance |
| Under 6 | 0 (0.0%) | 13 (100.0%) |
| 6 to 18 Years | 18 (42.9%) | 24 (57.1%) |
| 19 to 25 Years | 0 (0.0%) | 47 (100.0%) |
| 25 to 34 Years | 12 (17.6%) | 56 (82.4%) |
| 35 to 44 Years | 19 (46.3%) | 22 (53.7%) |
| 45 to 54 Years | 8 (7.8%) | 102 (100.0%) |
| 55 to 64 Years | 20 (8.8%) | 199 (87.7%) |
| 65 to 74 Years | 38 (100.0%) | 38 (100.0%) |
| 75 Years and over | 74 (100.0%) | 39 (52.7%) |
| Total | 189 (29.0%) | 540 (82.8%) |
Disability Status by Sex by Age in Taconic Shores
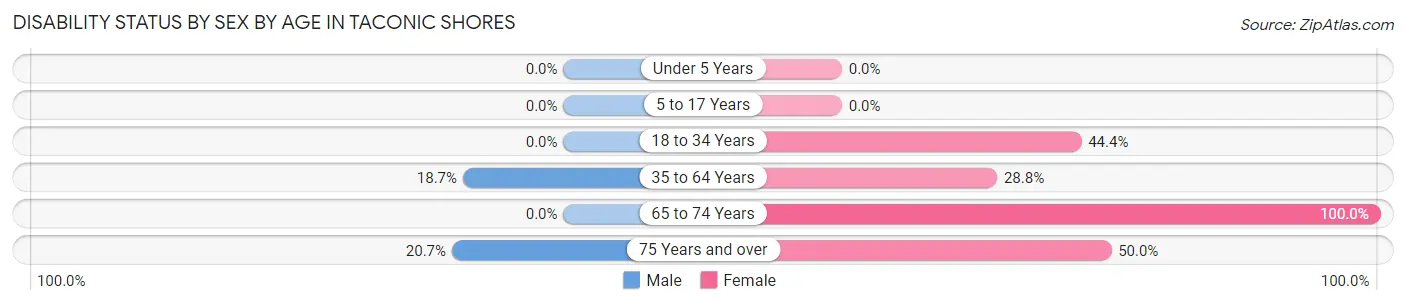
| Age Bracket | Male | Female |
| Under 5 Years | 0 (0.0%) | 0 (0.0%) |
| 5 to 17 Years | 0 (0.0%) | 0 (0.0%) |
| 18 to 34 Years | 0 (0.0%) | 12 (44.4%) |
| 35 to 64 Years | 36 (18.6%) | 51 (28.8%) |
| 65 to 74 Years | 0 (0.0%) | 38 (100.0%) |
| 75 Years and over | 12 (20.7%) | 8 (50.0%) |
Disability Class by Sex by Age in Taconic Shores
Disability Class: Hearing Difficulty
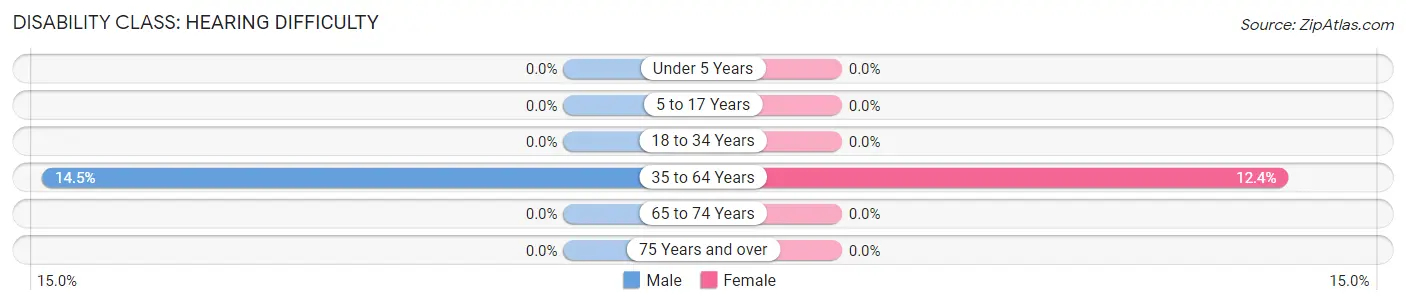
| Age Bracket | Male | Female |
| Under 5 Years | 0 (0.0%) | 0 (0.0%) |
| 5 to 17 Years | 0 (0.0%) | 0 (0.0%) |
| 18 to 34 Years | 0 (0.0%) | 0 (0.0%) |
| 35 to 64 Years | 28 (14.5%) | 22 (12.4%) |
| 65 to 74 Years | 0 (0.0%) | 0 (0.0%) |
| 75 Years and over | 0 (0.0%) | 0 (0.0%) |
Disability Class: Vision Difficulty
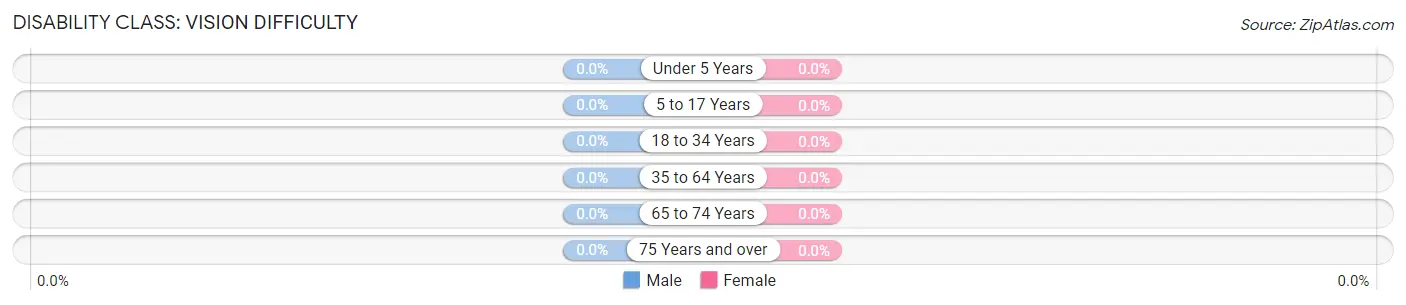
| Age Bracket | Male | Female |
| Under 5 Years | 0 (0.0%) | 0 (0.0%) |
| 5 to 17 Years | 0 (0.0%) | 0 (0.0%) |
| 18 to 34 Years | 0 (0.0%) | 0 (0.0%) |
| 35 to 64 Years | 0 (0.0%) | 0 (0.0%) |
| 65 to 74 Years | 0 (0.0%) | 0 (0.0%) |
| 75 Years and over | 0 (0.0%) | 0 (0.0%) |
Disability Class: Cognitive Difficulty
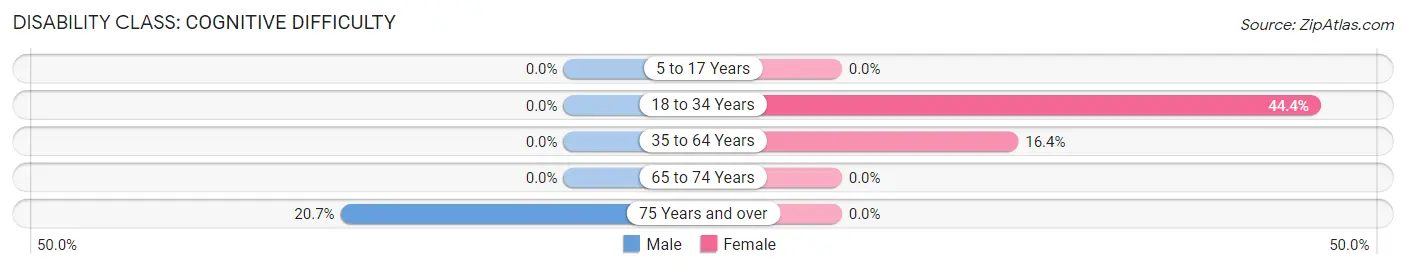
| Age Bracket | Male | Female |
| 5 to 17 Years | 0 (0.0%) | 0 (0.0%) |
| 18 to 34 Years | 0 (0.0%) | 12 (44.4%) |
| 35 to 64 Years | 0 (0.0%) | 29 (16.4%) |
| 65 to 74 Years | 0 (0.0%) | 0 (0.0%) |
| 75 Years and over | 12 (20.7%) | 0 (0.0%) |
Disability Class: Ambulatory Difficulty
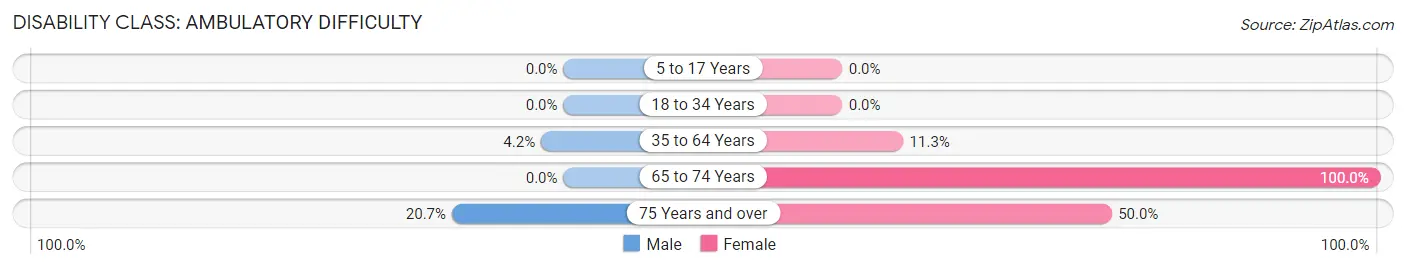
| Age Bracket | Male | Female |
| 5 to 17 Years | 0 (0.0%) | 0 (0.0%) |
| 18 to 34 Years | 0 (0.0%) | 0 (0.0%) |
| 35 to 64 Years | 8 (4.2%) | 20 (11.3%) |
| 65 to 74 Years | 0 (0.0%) | 38 (100.0%) |
| 75 Years and over | 12 (20.7%) | 8 (50.0%) |
Disability Class: Self-Care Difficulty
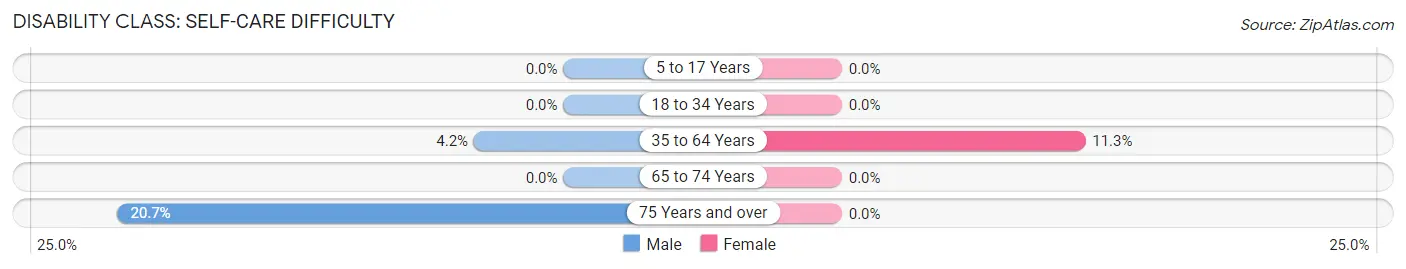
| Age Bracket | Male | Female |
| 5 to 17 Years | 0 (0.0%) | 0 (0.0%) |
| 18 to 34 Years | 0 (0.0%) | 0 (0.0%) |
| 35 to 64 Years | 8 (4.2%) | 20 (11.3%) |
| 65 to 74 Years | 0 (0.0%) | 0 (0.0%) |
| 75 Years and over | 12 (20.7%) | 0 (0.0%) |
Technology Access in Taconic Shores
Computing Device Access in Taconic Shores
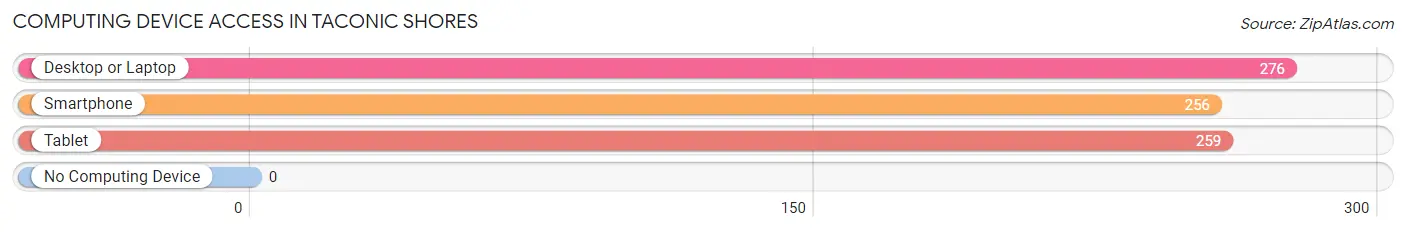
| Device Type | # Households | % Households |
| Desktop or Laptop | 276 | 79.3% |
| Smartphone | 256 | 73.6% |
| Tablet | 259 | 74.4% |
| No Computing Device | 0 | 0.0% |
| Total | 348 | 100.0% |
Internet Access in Taconic Shores
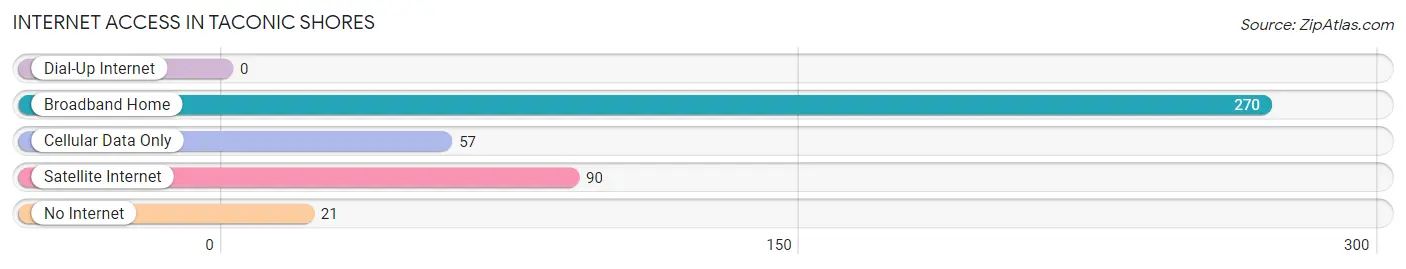
| Internet Type | # Households | % Households |
| Dial-Up Internet | 0 | 0.0% |
| Broadband Home | 270 | 77.6% |
| Cellular Data Only | 57 | 16.4% |
| Satellite Internet | 90 | 25.9% |
| No Internet | 21 | 6.0% |
| Total | 348 | 100.0% |
Taconic Shores Summary
Taconic Shores is a town located in Dutchess County, New York, United States. It is situated on the eastern shore of the Hudson River, approximately 60 miles north of New York City. The town was established in 1788 and is home to a population of approximately 4,000 people.
History
The area that is now Taconic Shores was originally inhabited by the Wappinger Indians. The first European settlers arrived in the area in the late 17th century. The town was officially established in 1788 and was originally known as “Taconic”. The name was changed to “Taconic Shores” in 1820.
The town was an important stop on the Hudson River during the 19th century. It was a popular destination for steamboats and ferries, which transported goods and passengers between New York City and Albany. The town was also home to several mills and factories, which produced a variety of goods including textiles, paper, and leather.
Geography
Taconic Shores is located in the eastern part of Dutchess County, approximately 60 miles north of New York City. The town is situated on the eastern shore of the Hudson River and is bordered by the towns of Amenia, Beekman, and East Fishkill. The town has a total area of 8.3 square miles, of which 7.9 square miles is land and 0.4 square miles is water.
The terrain of Taconic Shores is mostly flat, with some rolling hills. The town is home to several small lakes, including Lake Taghkanic and Lake Walton. The town is also home to several parks, including Taconic State Park and the Taconic State Park Preserve.
Economy
The economy of Taconic Shores is largely based on tourism and agriculture. The town is home to several wineries, including Millbrook Vineyards and Winery and Tousey Winery. The town is also home to several farms, which produce a variety of fruits and vegetables.
The town is also home to several small businesses, including restaurants, shops, and galleries. The town is also home to several manufacturing companies, which produce a variety of goods including textiles, paper, and leather.
Demographics
As of the 2010 census, the population of Taconic Shores was 4,000. The racial makeup of the town was 94.3% White, 2.2% African American, 0.3% Native American, 0.7% Asian, 0.1% Pacific Islander, and 2.4% from other races. The median household income was $60,000 and the median family income was $68,000.
The town is home to several churches, including the Taconic Shores United Methodist Church and the Taconic Shores Presbyterian Church. The town is also home to several schools, including the Taconic Hills Central School District and the Taconic Shores Elementary School.
Conclusion
Taconic Shores is a small town located in Dutchess County, New York. The town was established in 1788 and is home to a population of approximately 4,000 people. The economy of the town is largely based on tourism and agriculture, and the town is home to several wineries, farms, and small businesses. The town is also home to several churches and schools.
Common Questions
What is Per Capita Income in Taconic Shores?
Per Capita income in Taconic Shores is $77,773.
What is the Median Family Income in Taconic Shores?
Median Family Income in Taconic Shores is $165,863.
What is the Median Household income in Taconic Shores?
Median Household Income in Taconic Shores is $146,364.
What is Inequality or Gini Index in Taconic Shores?
Inequality or Gini Index in Taconic Shores is 0.41.
What is the Total Population of Taconic Shores?
Total Population of Taconic Shores is 652.
What is the Total Male Population of Taconic Shores?
Total Male Population of Taconic Shores is 339.
What is the Total Female Population of Taconic Shores?
Total Female Population of Taconic Shores is 313.
What is the Ratio of Males per 100 Females in Taconic Shores?
There are 108.31 Males per 100 Females in Taconic Shores.
What is the Ratio of Females per 100 Males in Taconic Shores?
There are 92.33 Females per 100 Males in Taconic Shores.
What is the Median Population Age in Taconic Shores?
Median Population Age in Taconic Shores is 55.4 Years.
What is the Average Family Size in Taconic Shores
Average Family Size in Taconic Shores is 2.4 People.
What is the Average Household Size in Taconic Shores
Average Household Size in Taconic Shores is 1.9 People.
How Large is the Labor Force in Taconic Shores?
There are 429 People in the Labor Forcein in Taconic Shores.
What is the Percentage of People in the Labor Force in Taconic Shores?
71.9% of People are in the Labor Force in Taconic Shores.