East Massapequa, NY Map & Demographics
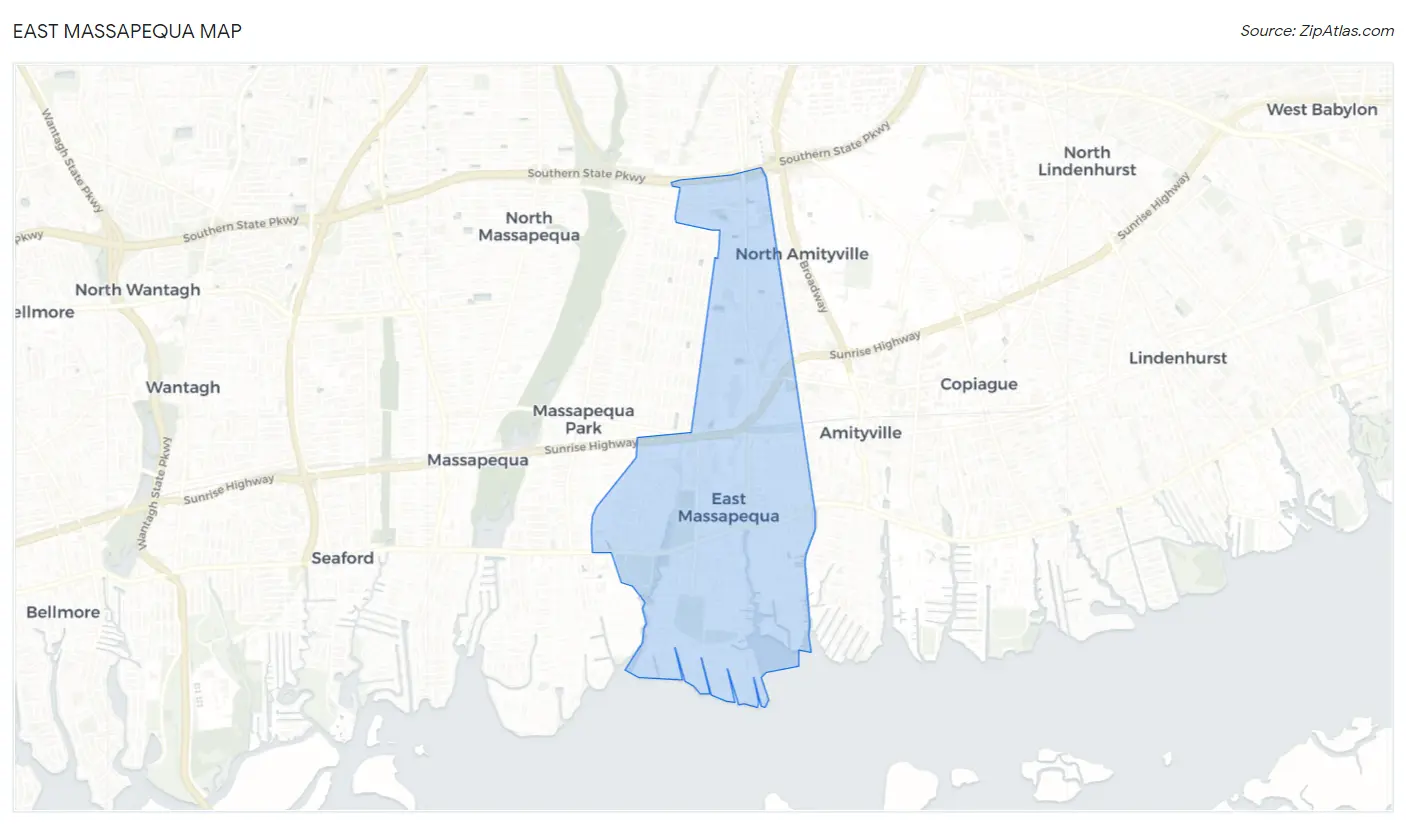
East Massapequa Map
East Massapequa Overview
$63,995
PER CAPITA INCOME
$171,912
AVG FAMILY INCOME
$138,613
AVG HOUSEHOLD INCOME
32.6%
WAGE / INCOME GAP [ % ]
67.4¢/ $1
WAGE / INCOME GAP [ $ ]
0.44
INEQUALITY / GINI INDEX
19,508
TOTAL POPULATION
9,830
MALE POPULATION
9,678
FEMALE POPULATION
101.57
MALES / 100 FEMALES
98.45
FEMALES / 100 MALES
45.9
MEDIAN AGE
3.3
AVG FAMILY SIZE
2.7
AVG HOUSEHOLD SIZE
10,598
LABOR FORCE [ PEOPLE ]
64.3%
PERCENT IN LABOR FORCE
4.9%
UNEMPLOYMENT RATE
Income in East Massapequa
Income Overview in East Massapequa
Per Capita Income in East Massapequa is $63,995, while median incomes of families and households are $171,912 and $138,613 respectively.
| Characteristic | Number | Measure |
| Per Capita Income | 19,508 | $63,995 |
| Median Family Income | 5,226 | $171,912 |
| Mean Family Income | 5,226 | $194,778 |
| Median Household Income | 7,060 | $138,613 |
| Mean Household Income | 7,060 | $174,067 |
| Income Deficit | 5,226 | $0 |
| Wage / Income Gap (%) | 19,508 | 32.65% |
| Wage / Income Gap ($) | 19,508 | 67.35¢ per $1 |
| Gini / Inequality Index | 19,508 | 0.44 |
Earnings by Sex in East Massapequa
Average Earnings in East Massapequa are $59,509, $78,605 for men and $52,943 for women, a difference of 32.7%.
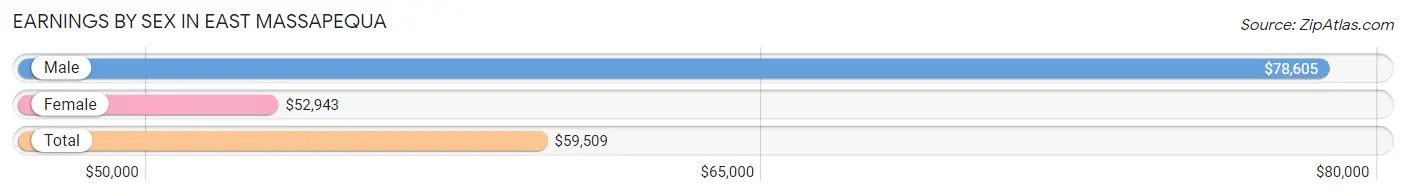
| Sex | Number | Average Earnings |
| Male | 5,691 (52.5%) | $78,605 |
| Female | 5,157 (47.5%) | $52,943 |
| Total | 10,848 (100.0%) | $59,509 |
Earnings by Sex by Income Bracket in East Massapequa
The most common earnings brackets in East Massapequa are $100,000+ for men (2,215 | 38.9%) and $100,000+ for women (956 | 18.5%).
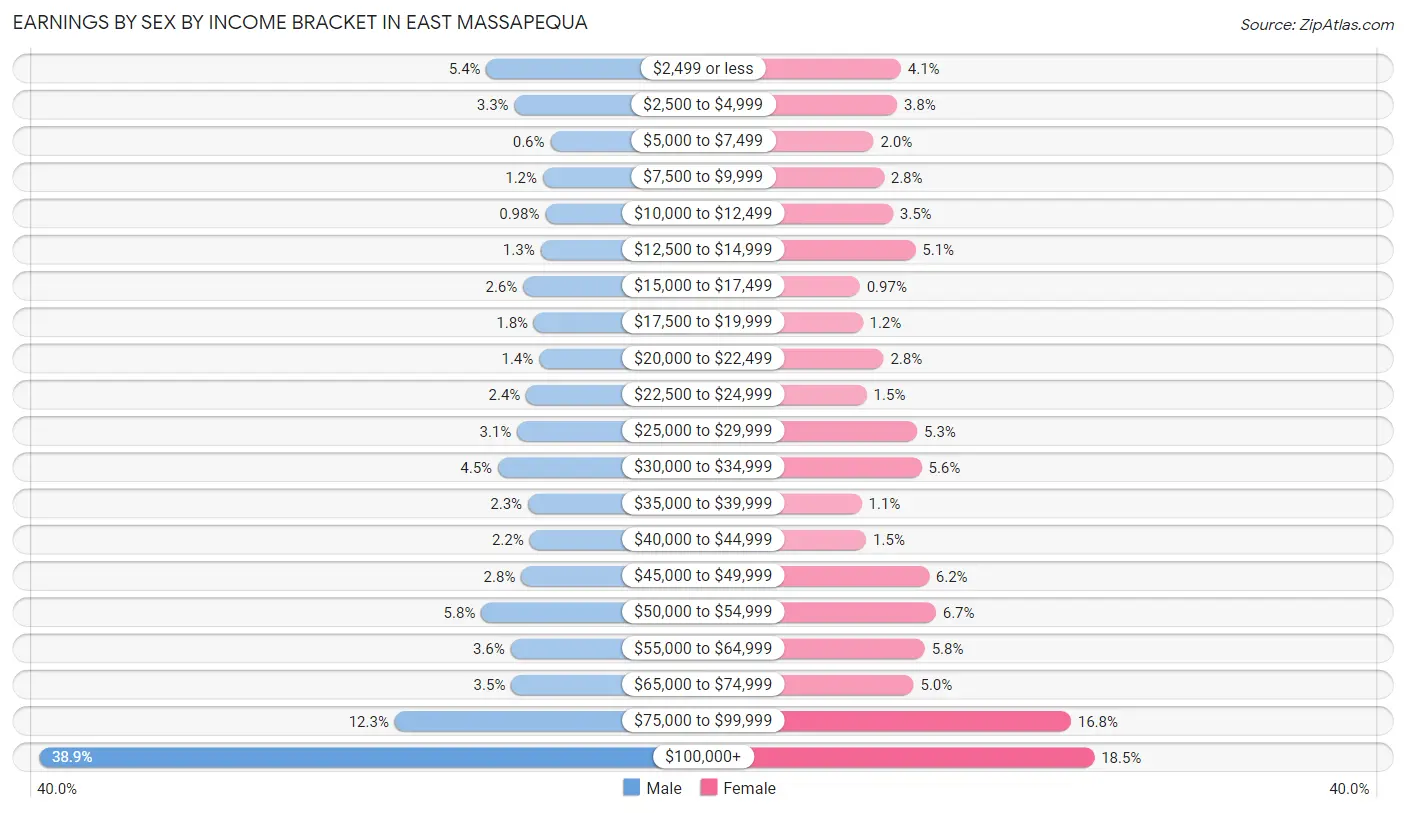
| Income | Male | Female |
| $2,499 or less | 307 (5.4%) | 209 (4.1%) |
| $2,500 to $4,999 | 187 (3.3%) | 194 (3.8%) |
| $5,000 to $7,499 | 34 (0.6%) | 103 (2.0%) |
| $7,500 to $9,999 | 66 (1.2%) | 143 (2.8%) |
| $10,000 to $12,499 | 56 (1.0%) | 178 (3.5%) |
| $12,500 to $14,999 | 76 (1.3%) | 265 (5.1%) |
| $15,000 to $17,499 | 150 (2.6%) | 50 (1.0%) |
| $17,500 to $19,999 | 104 (1.8%) | 61 (1.2%) |
| $20,000 to $22,499 | 82 (1.4%) | 142 (2.8%) |
| $22,500 to $24,999 | 137 (2.4%) | 77 (1.5%) |
| $25,000 to $29,999 | 176 (3.1%) | 272 (5.3%) |
| $30,000 to $34,999 | 258 (4.5%) | 289 (5.6%) |
| $35,000 to $39,999 | 130 (2.3%) | 57 (1.1%) |
| $40,000 to $44,999 | 123 (2.2%) | 75 (1.5%) |
| $45,000 to $49,999 | 158 (2.8%) | 317 (6.1%) |
| $50,000 to $54,999 | 329 (5.8%) | 344 (6.7%) |
| $55,000 to $64,999 | 204 (3.6%) | 301 (5.8%) |
| $65,000 to $74,999 | 201 (3.5%) | 258 (5.0%) |
| $75,000 to $99,999 | 698 (12.3%) | 866 (16.8%) |
| $100,000+ | 2,215 (38.9%) | 956 (18.5%) |
| Total | 5,691 (100.0%) | 5,157 (100.0%) |
Earnings by Sex by Educational Attainment in East Massapequa
Average earnings in East Massapequa are $89,948 for men and $59,258 for women, a difference of 34.1%. Men with an educational attainment of bachelor's degree enjoy the highest average annual earnings of $143,125, while those with high school diploma education earn the least with $65,958. Women with an educational attainment of graduate degree earn the most with the average annual earnings of $81,673, while those with college or associate's degree education have the smallest earnings of $34,406.
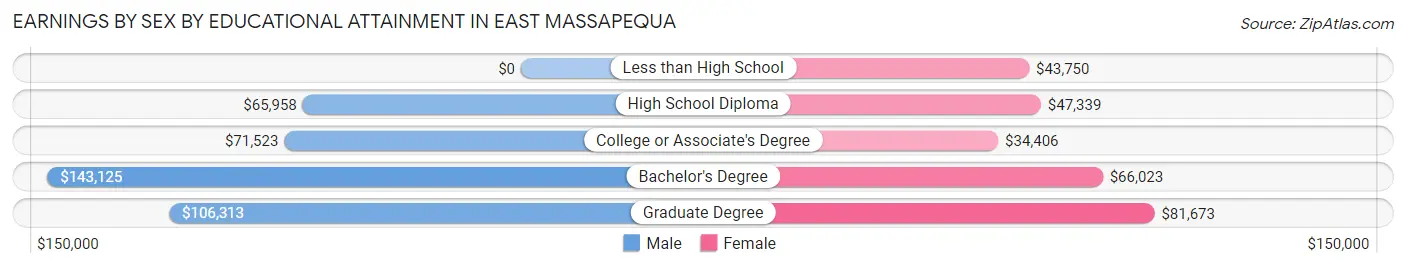
| Educational Attainment | Male Income | Female Income |
| Less than High School | - | - |
| High School Diploma | $65,958 | $47,339 |
| College or Associate's Degree | $71,523 | $34,406 |
| Bachelor's Degree | $143,125 | $66,023 |
| Graduate Degree | $106,313 | $81,673 |
| Total | $89,948 | $59,258 |
Family Income in East Massapequa
Family Income Brackets in East Massapequa
According to the East Massapequa family income data, there are 1,949 families falling into the $200,000+ income range, which is the most common income bracket and makes up 37.3% of all families. Conversely, the $10,000 to $14,999 income bracket is the least frequent group with only 21 families (0.4%) belonging to this category.
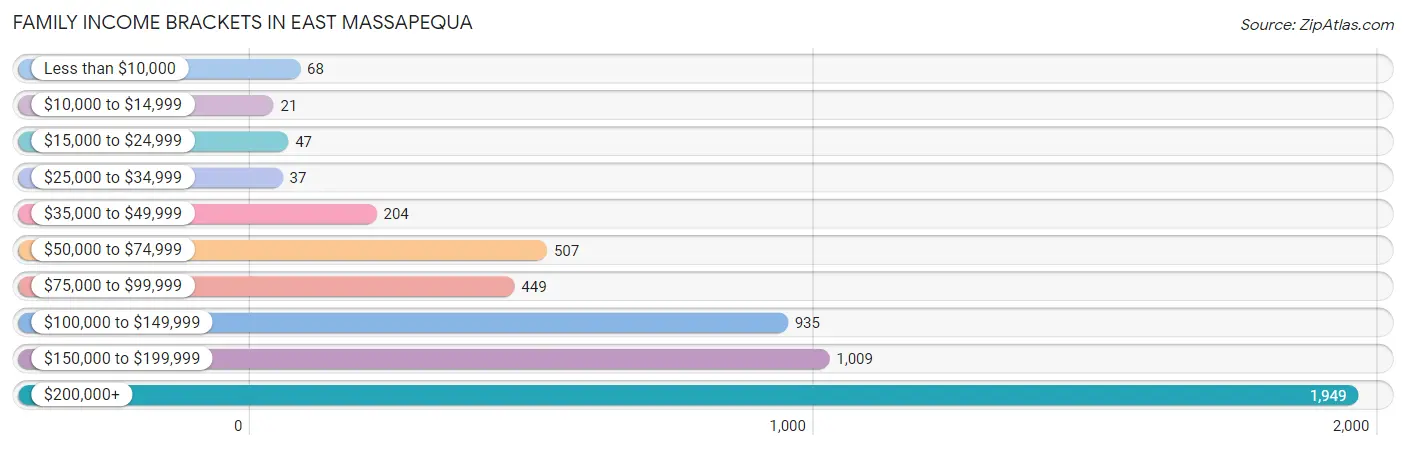
| Income Bracket | # Families | % Families |
| Less than $10,000 | 68 | 1.3% |
| $10,000 to $14,999 | 21 | 0.4% |
| $15,000 to $24,999 | 47 | 0.9% |
| $25,000 to $34,999 | 37 | 0.7% |
| $35,000 to $49,999 | 204 | 3.9% |
| $50,000 to $74,999 | 507 | 9.7% |
| $75,000 to $99,999 | 449 | 8.6% |
| $100,000 to $149,999 | 935 | 17.9% |
| $150,000 to $199,999 | 1,009 | 19.3% |
| $200,000+ | 1,949 | 37.3% |
Family Income by Famaliy Size in East Massapequa
5-person families (560 | 10.7%) account for the highest median family income in East Massapequa with $217,411 per family, while 2-person families (2,124 | 40.6%) have the highest median income of $59,219 per family member.
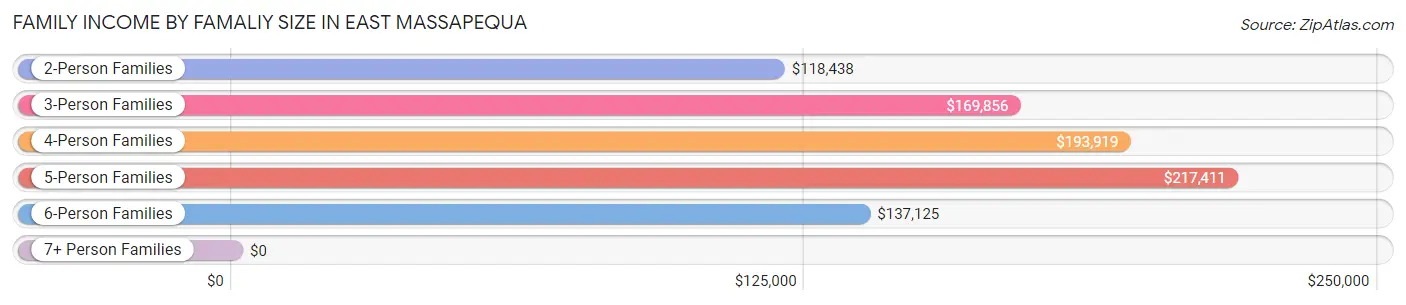
| Income Bracket | # Families | Median Income |
| 2-Person Families | 2,124 (40.6%) | $118,438 |
| 3-Person Families | 1,167 (22.3%) | $169,856 |
| 4-Person Families | 1,204 (23.0%) | $193,919 |
| 5-Person Families | 560 (10.7%) | $217,411 |
| 6-Person Families | 86 (1.7%) | $137,125 |
| 7+ Person Families | 85 (1.6%) | $0 |
| Total | 5,226 (100.0%) | $171,912 |
Family Income by Number of Earners in East Massapequa
The median family income in East Massapequa is $171,912, with families comprising 3+ earners (1,364) having the highest median family income of $210,909, while families with no earners (816) have the lowest median family income of $85,143, accounting for 26.1% and 15.6% of families, respectively.
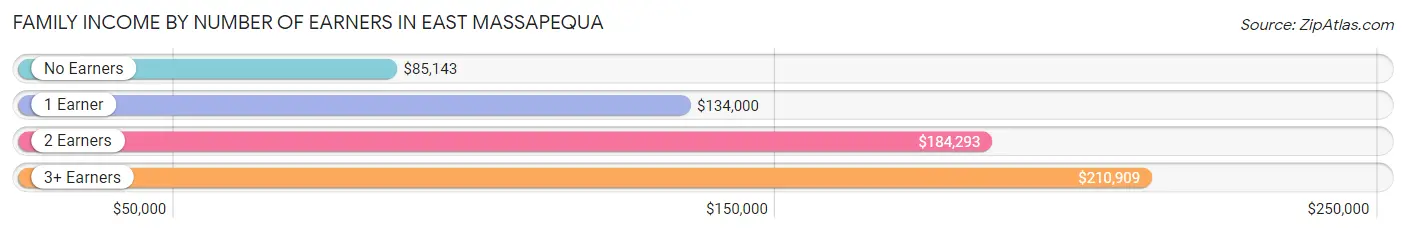
| Number of Earners | # Families | Median Income |
| No Earners | 816 (15.6%) | $85,143 |
| 1 Earner | 1,048 (20.1%) | $134,000 |
| 2 Earners | 1,998 (38.2%) | $184,293 |
| 3+ Earners | 1,364 (26.1%) | $210,909 |
| Total | 5,226 (100.0%) | $171,912 |
Household Income in East Massapequa
Household Income Brackets in East Massapequa
With 2,132 households falling in the category, the $200,000+ income range is the most frequent in East Massapequa, accounting for 30.2% of all households. In contrast, only 99 households (1.4%) fall into the $10,000 to $14,999 income bracket, making it the least populous group.
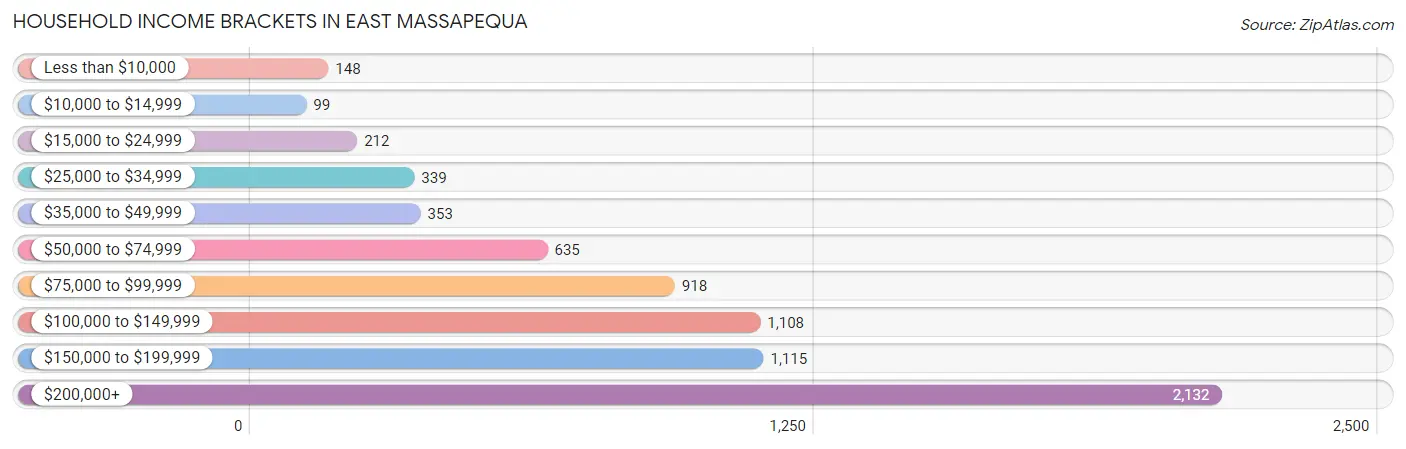
| Income Bracket | # Households | % Households |
| Less than $10,000 | 148 | 2.1% |
| $10,000 to $14,999 | 99 | 1.4% |
| $15,000 to $24,999 | 212 | 3.0% |
| $25,000 to $34,999 | 339 | 4.8% |
| $35,000 to $49,999 | 353 | 5.0% |
| $50,000 to $74,999 | 635 | 9.0% |
| $75,000 to $99,999 | 918 | 13.0% |
| $100,000 to $149,999 | 1,108 | 15.7% |
| $150,000 to $199,999 | 1,115 | 15.8% |
| $200,000+ | 2,132 | 30.2% |
Household Income by Householder Age in East Massapequa
The median household income in East Massapequa is $138,613, with the highest median household income of $178,068 found in the 25 to 44 years age bracket for the primary householder. A total of 1,547 households (21.9%) fall into this category. Meanwhile, the 15 to 24 years age bracket for the primary householder has the lowest median household income of $0, with 16 households (0.2%) in this group.
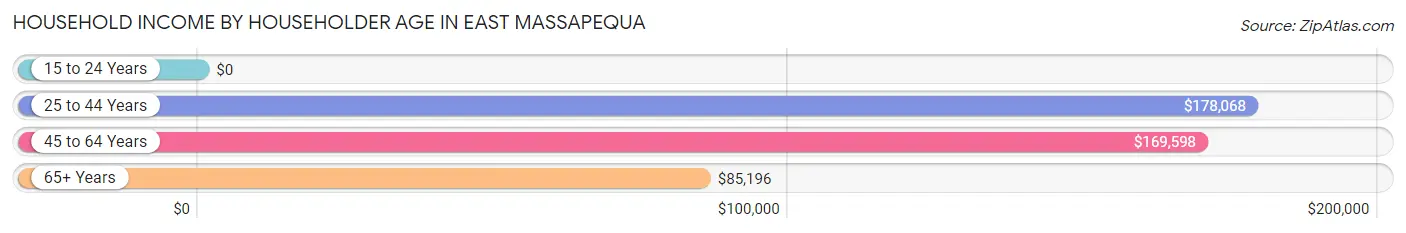
| Income Bracket | # Households | Median Income |
| 15 to 24 Years | 16 (0.2%) | $0 |
| 25 to 44 Years | 1,547 (21.9%) | $178,068 |
| 45 to 64 Years | 2,643 (37.4%) | $169,598 |
| 65+ Years | 2,854 (40.4%) | $85,196 |
| Total | 7,060 (100.0%) | $138,613 |
Poverty in East Massapequa
Income Below Poverty by Sex and Age in East Massapequa
With 3.5% poverty level for males and 3.2% for females among the residents of East Massapequa, 75 year old and over males and 75 year old and over females are the most vulnerable to poverty, with 78 males (10.8%) and 83 females (8.4%) in their respective age groups living below the poverty level.
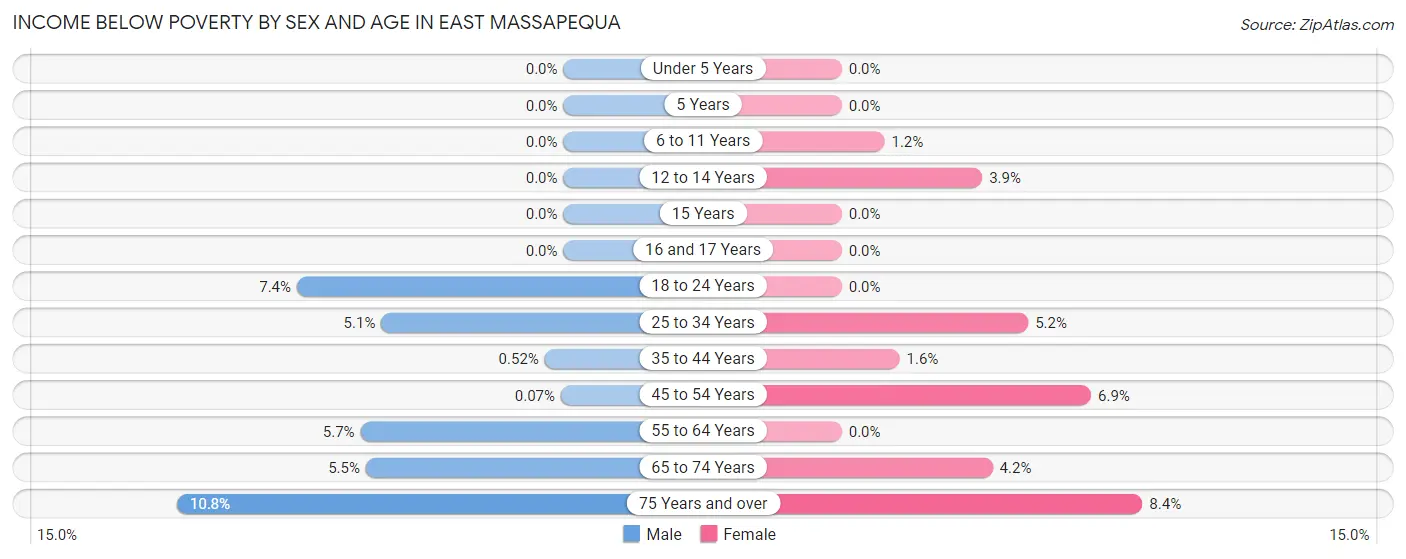
| Age Bracket | Male | Female |
| Under 5 Years | 0 (0.0%) | 0 (0.0%) |
| 5 Years | 0 (0.0%) | 0 (0.0%) |
| 6 to 11 Years | 0 (0.0%) | 4 (1.2%) |
| 12 to 14 Years | 0 (0.0%) | 9 (3.9%) |
| 15 Years | 0 (0.0%) | 0 (0.0%) |
| 16 and 17 Years | 0 (0.0%) | 0 (0.0%) |
| 18 to 24 Years | 47 (7.4%) | 0 (0.0%) |
| 25 to 34 Years | 55 (5.1%) | 54 (5.2%) |
| 35 to 44 Years | 6 (0.5%) | 19 (1.6%) |
| 45 to 54 Years | 1 (0.1%) | 72 (6.9%) |
| 55 to 64 Years | 76 (5.7%) | 0 (0.0%) |
| 65 to 74 Years | 75 (5.5%) | 66 (4.2%) |
| 75 Years and over | 78 (10.8%) | 83 (8.4%) |
| Total | 338 (3.5%) | 307 (3.2%) |
Income Above Poverty by Sex and Age in East Massapequa
According to the poverty statistics in East Massapequa, males aged under 5 years and females aged under 5 years are the age groups that are most secure financially, with 100.0% of males and 100.0% of females in these age groups living above the poverty line.
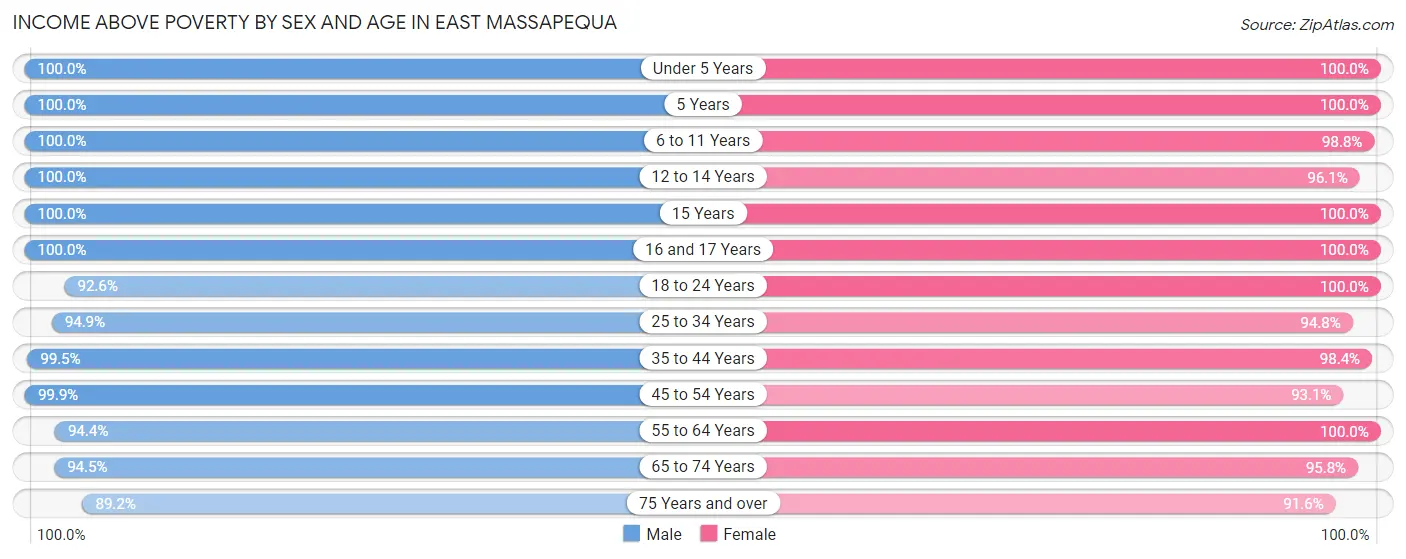
| Age Bracket | Male | Female |
| Under 5 Years | 521 (100.0%) | 524 (100.0%) |
| 5 Years | 18 (100.0%) | 121 (100.0%) |
| 6 to 11 Years | 680 (100.0%) | 332 (98.8%) |
| 12 to 14 Years | 313 (100.0%) | 221 (96.1%) |
| 15 Years | 153 (100.0%) | 127 (100.0%) |
| 16 and 17 Years | 323 (100.0%) | 209 (100.0%) |
| 18 to 24 Years | 586 (92.6%) | 811 (100.0%) |
| 25 to 34 Years | 1,030 (94.9%) | 987 (94.8%) |
| 35 to 44 Years | 1,142 (99.5%) | 1,158 (98.4%) |
| 45 to 54 Years | 1,467 (99.9%) | 966 (93.1%) |
| 55 to 64 Years | 1,268 (94.4%) | 1,420 (100.0%) |
| 65 to 74 Years | 1,289 (94.5%) | 1,506 (95.8%) |
| 75 Years and over | 647 (89.2%) | 909 (91.6%) |
| Total | 9,437 (96.5%) | 9,291 (96.8%) |
Income Below Poverty Among Married-Couple Families in East Massapequa
The poverty statistics for married-couple families in East Massapequa show that 2.0% or 84 of the total 4,219 families live below the poverty line. Families with no children have the highest poverty rate of 3.1%, comprising of 84 families. On the other hand, families with 1 or 2 children have the lowest poverty rate of 0.0%, which includes 0 families.
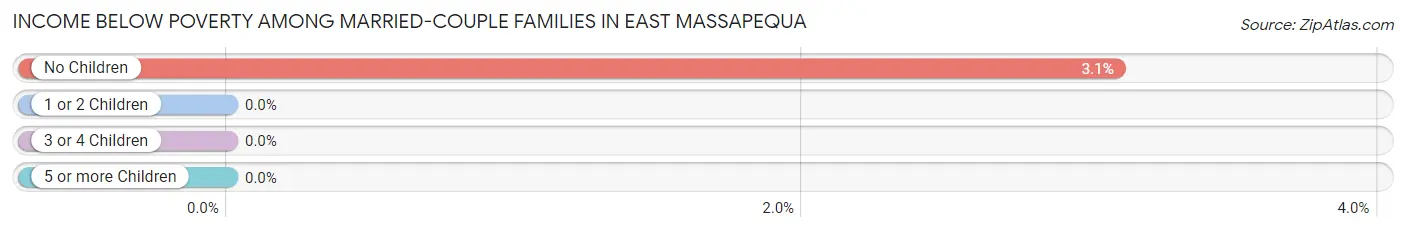
| Children | Above Poverty | Below Poverty |
| No Children | 2,637 (96.9%) | 84 (3.1%) |
| 1 or 2 Children | 1,191 (100.0%) | 0 (0.0%) |
| 3 or 4 Children | 275 (100.0%) | 0 (0.0%) |
| 5 or more Children | 32 (100.0%) | 0 (0.0%) |
| Total | 4,135 (98.0%) | 84 (2.0%) |
Income Below Poverty Among Single-Parent Households in East Massapequa
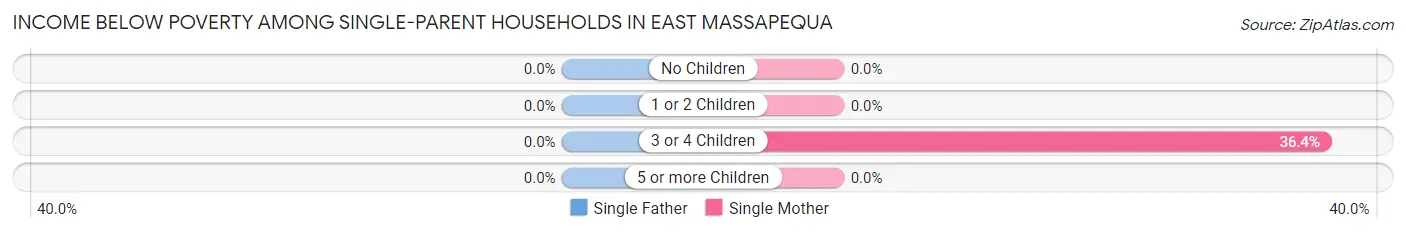
| Children | Single Father | Single Mother |
| No Children | 0 (0.0%) | 0 (0.0%) |
| 1 or 2 Children | 0 (0.0%) | 0 (0.0%) |
| 3 or 4 Children | 0 (0.0%) | 4 (36.4%) |
| 5 or more Children | 0 (0.0%) | 0 (0.0%) |
| Total | 0 (0.0%) | 4 (0.5%) |
Income Below Poverty Among Married-Couple vs Single-Parent Households in East Massapequa
The poverty data for East Massapequa shows that 84 of the married-couple family households (2.0%) and 4 of the single-parent households (0.4%) are living below the poverty level. Within the married-couple family households, those with no children have the highest poverty rate, with 84 households (3.1%) falling below the poverty line. Among the single-parent households, those with 3 or 4 children have the highest poverty rate, with 4 household (36.4%) living below poverty.
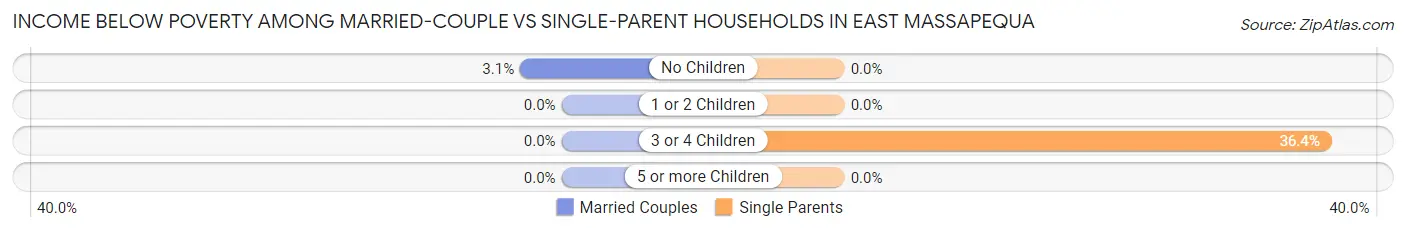
| Children | Married-Couple Families | Single-Parent Households |
| No Children | 84 (3.1%) | 0 (0.0%) |
| 1 or 2 Children | 0 (0.0%) | 0 (0.0%) |
| 3 or 4 Children | 0 (0.0%) | 4 (36.4%) |
| 5 or more Children | 0 (0.0%) | 0 (0.0%) |
| Total | 84 (2.0%) | 4 (0.4%) |
Race in East Massapequa
The most populous races in East Massapequa are White / Caucasian (14,922 | 76.5%), Black / African American (2,698 | 13.8%), and Hispanic or Latino (2,089 | 10.7%).
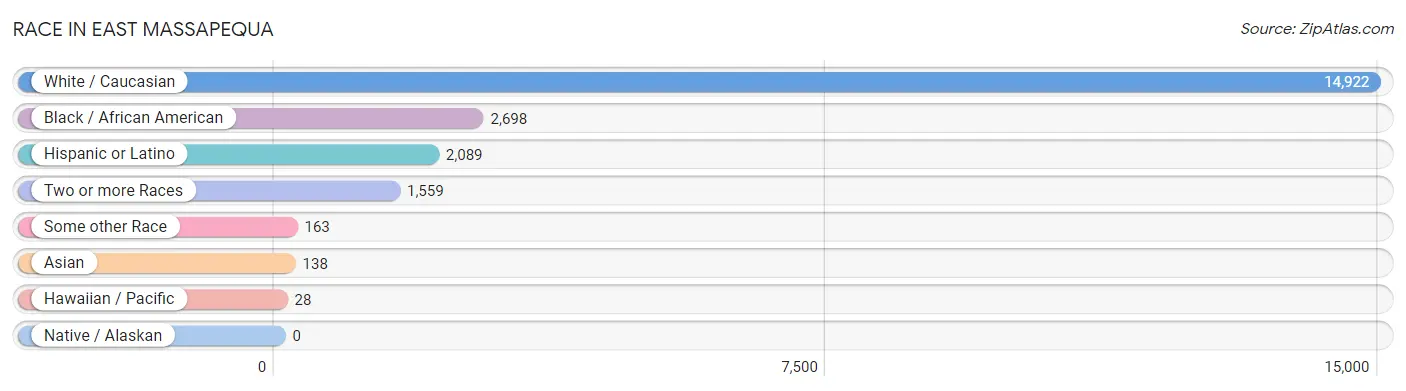
| Race | # Population | % Population |
| Asian | 138 | 0.7% |
| Black / African American | 2,698 | 13.8% |
| Hawaiian / Pacific | 28 | 0.1% |
| Hispanic or Latino | 2,089 | 10.7% |
| Native / Alaskan | 0 | 0.0% |
| White / Caucasian | 14,922 | 76.5% |
| Two or more Races | 1,559 | 8.0% |
| Some other Race | 163 | 0.8% |
| Total | 19,508 | 100.0% |
Ancestry in East Massapequa
The most populous ancestries reported in East Massapequa are Italian (6,256 | 32.1%), Irish (3,694 | 18.9%), German (2,714 | 13.9%), Polish (1,332 | 6.8%), and South American (605 | 3.1%), together accounting for 74.9% of all East Massapequa residents.
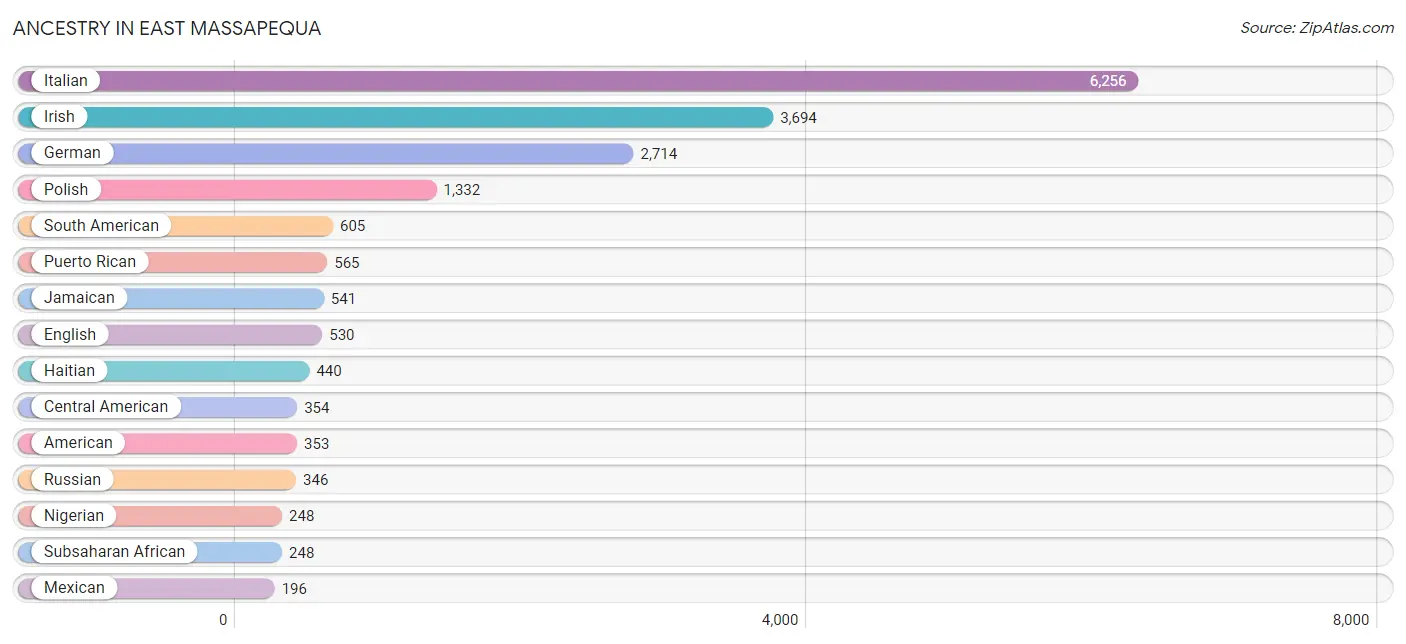
| Ancestry | # Population | % Population |
| American | 353 | 1.8% |
| Arab | 39 | 0.2% |
| Armenian | 18 | 0.1% |
| Austrian | 57 | 0.3% |
| British | 6 | 0.0% |
| British West Indian | 32 | 0.2% |
| Burmese | 24 | 0.1% |
| Canadian | 9 | 0.1% |
| Central American | 354 | 1.8% |
| Central American Indian | 23 | 0.1% |
| Chilean | 18 | 0.1% |
| Costa Rican | 157 | 0.8% |
| Croatian | 98 | 0.5% |
| Cuban | 59 | 0.3% |
| Czech | 12 | 0.1% |
| Czechoslovakian | 60 | 0.3% |
| Danish | 50 | 0.3% |
| Dominican | 151 | 0.8% |
| Dutch | 67 | 0.3% |
| Eastern European | 174 | 0.9% |
| Ecuadorian | 173 | 0.9% |
| English | 530 | 2.7% |
| European | 113 | 0.6% |
| Finnish | 20 | 0.1% |
| French | 81 | 0.4% |
| French Canadian | 94 | 0.5% |
| German | 2,714 | 13.9% |
| Greek | 186 | 0.9% |
| Guatemalan | 138 | 0.7% |
| Guyanese | 50 | 0.3% |
| Haitian | 440 | 2.3% |
| Hungarian | 60 | 0.3% |
| Indian (Asian) | 33 | 0.2% |
| Iranian | 22 | 0.1% |
| Irish | 3,694 | 18.9% |
| Israeli | 76 | 0.4% |
| Italian | 6,256 | 32.1% |
| Jamaican | 541 | 2.8% |
| Korean | 5 | 0.0% |
| Lebanese | 39 | 0.2% |
| Lithuanian | 97 | 0.5% |
| Luxembourger | 10 | 0.1% |
| Maltese | 62 | 0.3% |
| Mexican | 196 | 1.0% |
| Nigerian | 248 | 1.3% |
| Norwegian | 92 | 0.5% |
| Panamanian | 13 | 0.1% |
| Pennsylvania German | 31 | 0.2% |
| Peruvian | 23 | 0.1% |
| Polish | 1,332 | 6.8% |
| Puerto Rican | 565 | 2.9% |
| Romanian | 126 | 0.6% |
| Russian | 346 | 1.8% |
| Salvadoran | 46 | 0.2% |
| Samoan | 28 | 0.1% |
| Scotch-Irish | 98 | 0.5% |
| Scottish | 172 | 0.9% |
| South American | 605 | 3.1% |
| Spaniard | 112 | 0.6% |
| Spanish | 2 | 0.0% |
| Subsaharan African | 248 | 1.3% |
| Swedish | 44 | 0.2% |
| Swiss | 19 | 0.1% |
| Thai | 109 | 0.6% |
| Trinidadian and Tobagonian | 38 | 0.2% |
| Ukrainian | 142 | 0.7% |
| Uruguayan | 43 | 0.2% |
| Venezuelan | 150 | 0.8% |
| Welsh | 9 | 0.1% |
| West Indian | 110 | 0.6% |
| Yugoslavian | 16 | 0.1% | View All 71 Rows |
Immigrants in East Massapequa
The most numerous immigrant groups reported in East Massapequa came from Latin America (1,314 | 6.7%), Caribbean (863 | 4.4%), Europe (410 | 2.1%), Jamaica (318 | 1.6%), and South America (301 | 1.5%), together accounting for 16.4% of all East Massapequa residents.
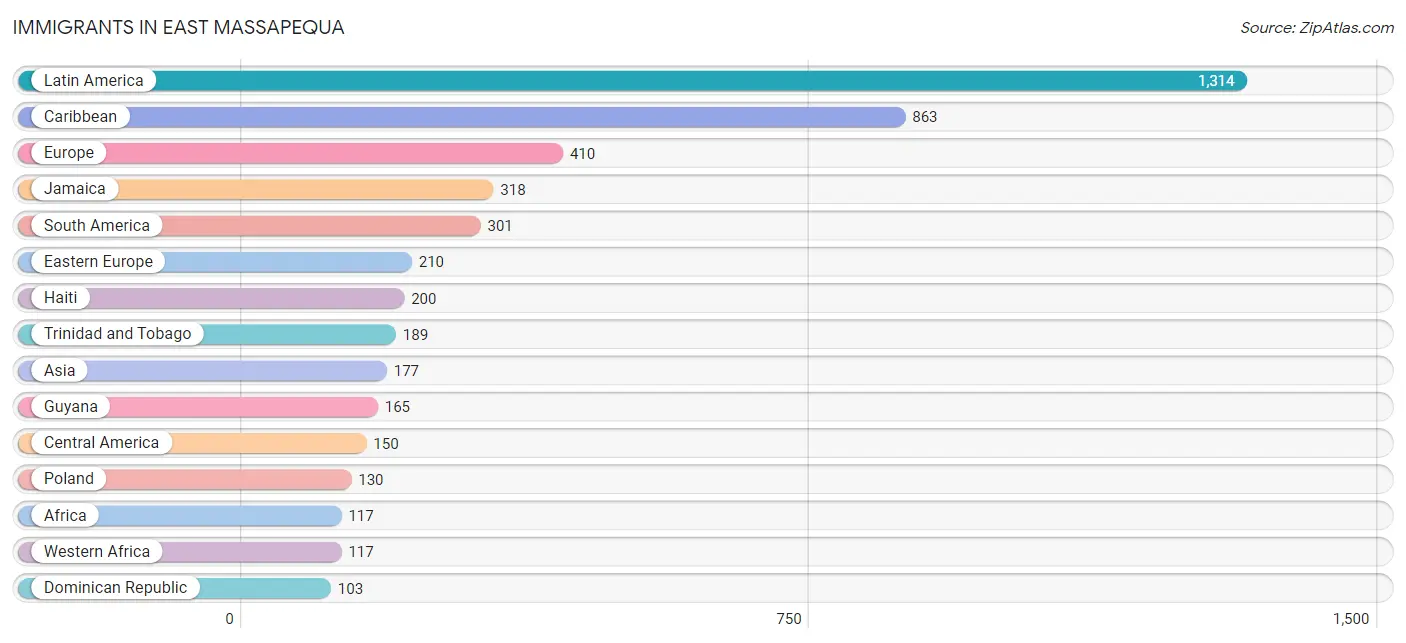
| Immigration Origin | # Population | % Population |
| Africa | 117 | 0.6% |
| Asia | 177 | 0.9% |
| Austria | 18 | 0.1% |
| Barbados | 20 | 0.1% |
| Canada | 6 | 0.0% |
| Caribbean | 863 | 4.4% |
| Central America | 150 | 0.8% |
| Chile | 9 | 0.1% |
| China | 12 | 0.1% |
| Cuba | 18 | 0.1% |
| Dominican Republic | 103 | 0.5% |
| Eastern Asia | 36 | 0.2% |
| Eastern Europe | 210 | 1.1% |
| Ecuador | 66 | 0.3% |
| El Salvador | 42 | 0.2% |
| Europe | 410 | 2.1% |
| France | 13 | 0.1% |
| Germany | 22 | 0.1% |
| Greece | 24 | 0.1% |
| Grenada | 15 | 0.1% |
| Guatemala | 95 | 0.5% |
| Guyana | 165 | 0.9% |
| Haiti | 200 | 1.0% |
| Hungary | 14 | 0.1% |
| India | 24 | 0.1% |
| Iran | 22 | 0.1% |
| Ireland | 57 | 0.3% |
| Israel | 69 | 0.4% |
| Italy | 51 | 0.3% |
| Jamaica | 318 | 1.6% |
| Korea | 24 | 0.1% |
| Latin America | 1,314 | 6.7% |
| Liberia | 30 | 0.2% |
| Nigeria | 87 | 0.4% |
| Northern Europe | 57 | 0.3% |
| Panama | 13 | 0.1% |
| Philippines | 21 | 0.1% |
| Poland | 130 | 0.7% |
| Portugal | 10 | 0.1% |
| Romania | 18 | 0.1% |
| South America | 301 | 1.5% |
| South Central Asia | 46 | 0.2% |
| South Eastern Asia | 21 | 0.1% |
| Southern Europe | 90 | 0.5% |
| Syria | 5 | 0.0% |
| Taiwan | 12 | 0.1% |
| Trinidad and Tobago | 189 | 1.0% |
| Uruguay | 22 | 0.1% |
| Venezuela | 39 | 0.2% |
| Western Africa | 117 | 0.6% |
| Western Asia | 74 | 0.4% |
| Western Europe | 53 | 0.3% | View All 52 Rows |
Sex and Age in East Massapequa
Sex and Age in East Massapequa
The most populous age groups in East Massapequa are 50 to 54 Years (776 | 7.9%) for men and 65 to 69 Years (890 | 9.2%) for women.
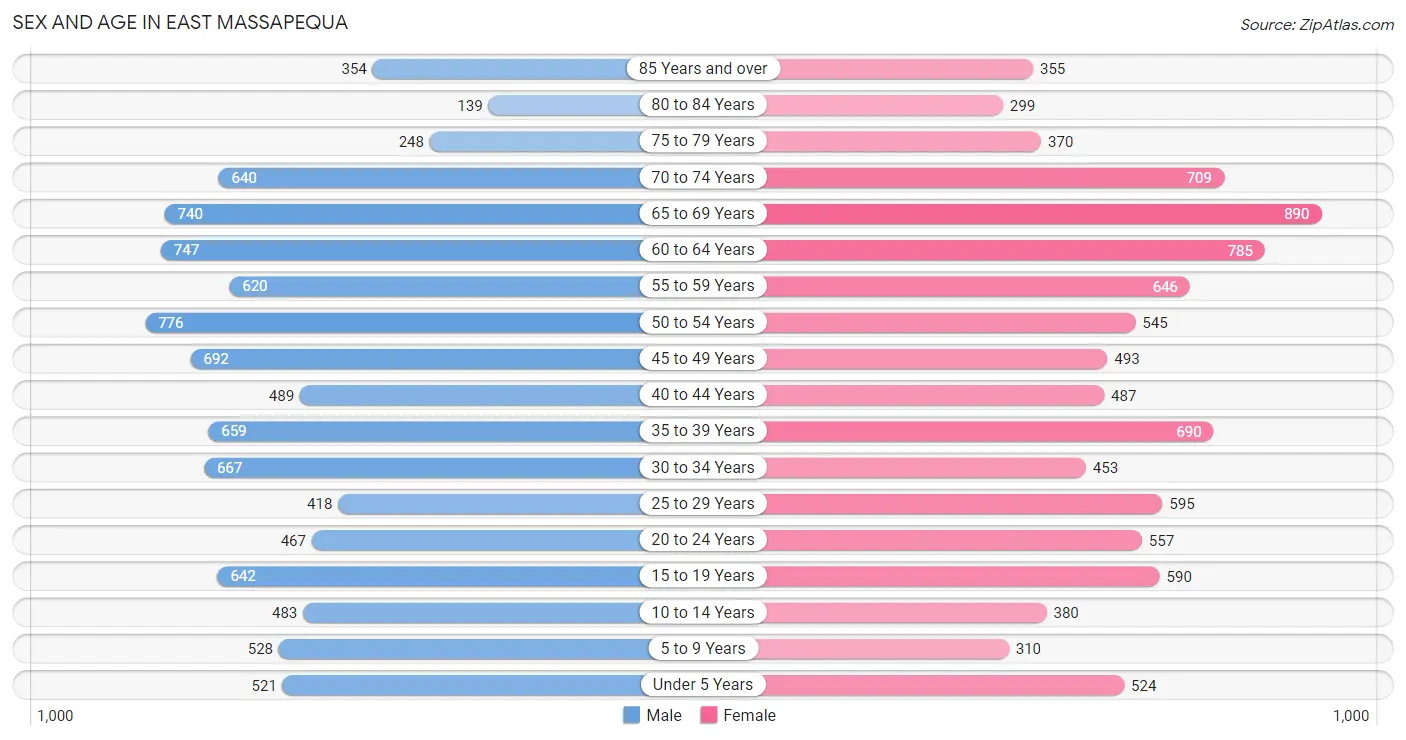
| Age Bracket | Male | Female |
| Under 5 Years | 521 (5.3%) | 524 (5.4%) |
| 5 to 9 Years | 528 (5.4%) | 310 (3.2%) |
| 10 to 14 Years | 483 (4.9%) | 380 (3.9%) |
| 15 to 19 Years | 642 (6.5%) | 590 (6.1%) |
| 20 to 24 Years | 467 (4.8%) | 557 (5.8%) |
| 25 to 29 Years | 418 (4.3%) | 595 (6.1%) |
| 30 to 34 Years | 667 (6.8%) | 453 (4.7%) |
| 35 to 39 Years | 659 (6.7%) | 690 (7.1%) |
| 40 to 44 Years | 489 (5.0%) | 487 (5.0%) |
| 45 to 49 Years | 692 (7.0%) | 493 (5.1%) |
| 50 to 54 Years | 776 (7.9%) | 545 (5.6%) |
| 55 to 59 Years | 620 (6.3%) | 646 (6.7%) |
| 60 to 64 Years | 747 (7.6%) | 785 (8.1%) |
| 65 to 69 Years | 740 (7.5%) | 890 (9.2%) |
| 70 to 74 Years | 640 (6.5%) | 709 (7.3%) |
| 75 to 79 Years | 248 (2.5%) | 370 (3.8%) |
| 80 to 84 Years | 139 (1.4%) | 299 (3.1%) |
| 85 Years and over | 354 (3.6%) | 355 (3.7%) |
| Total | 9,830 (100.0%) | 9,678 (100.0%) |
Families and Households in East Massapequa
Median Family Size in East Massapequa
The median family size in East Massapequa is 3.26 persons per family, with single female/mother families (725 | 13.9%) accounting for the largest median family size of 3.61 persons per family. On the other hand, single male/father families (282 | 5.4%) represent the smallest median family size with 3.17 persons per family.
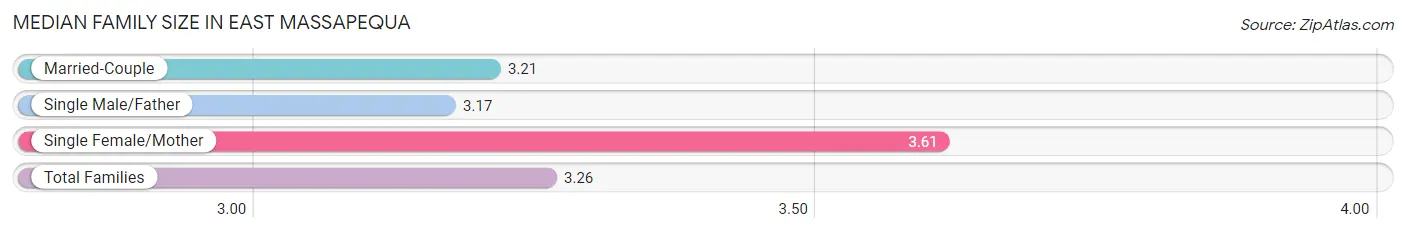
| Family Type | # Families | Family Size |
| Married-Couple | 4,219 (80.7%) | 3.21 |
| Single Male/Father | 282 (5.4%) | 3.17 |
| Single Female/Mother | 725 (13.9%) | 3.61 |
| Total Families | 5,226 (100.0%) | 3.26 |
Median Household Size in East Massapequa
The median household size in East Massapequa is 2.73 persons per household, with single female/mother households (725 | 10.3%) accounting for the largest median household size of 3.68 persons per household. non-family households (1,834 | 26.0%) represent the smallest median household size with 1.14 persons per household.
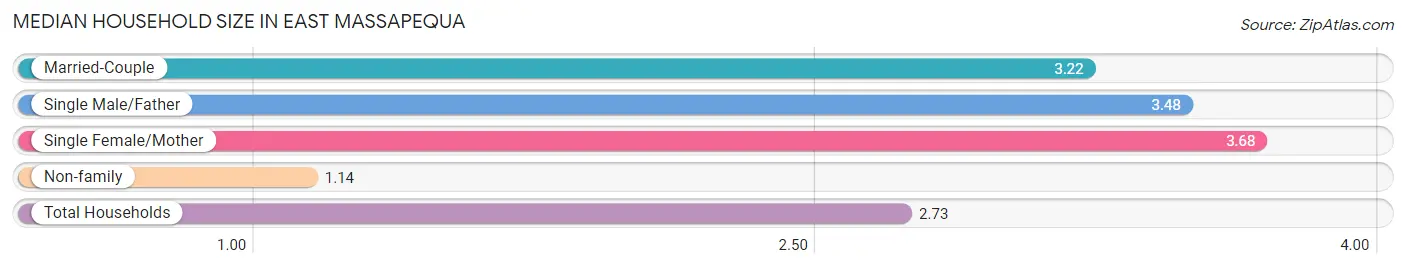
| Household Type | # Households | Household Size |
| Married-Couple | 4,219 (59.8%) | 3.22 |
| Single Male/Father | 282 (4.0%) | 3.48 |
| Single Female/Mother | 725 (10.3%) | 3.68 |
| Non-family | 1,834 (26.0%) | 1.14 |
| Total Households | 7,060 (100.0%) | 2.73 |
Household Size by Marriage Status in East Massapequa
Out of a total of 7,060 households in East Massapequa, 5,226 (74.0%) are family households, while 1,834 (26.0%) are nonfamily households. The most numerous type of family households are 2-person households, comprising 2,100, and the most common type of nonfamily households are 1-person households, comprising 1,666.
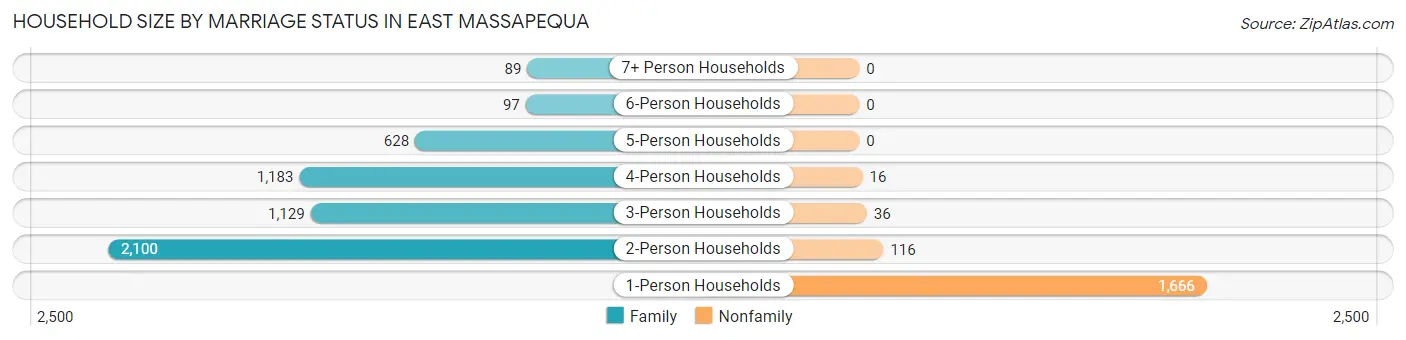
| Household Size | Family Households | Nonfamily Households |
| 1-Person Households | - | 1,666 (23.6%) |
| 2-Person Households | 2,100 (29.7%) | 116 (1.6%) |
| 3-Person Households | 1,129 (16.0%) | 36 (0.5%) |
| 4-Person Households | 1,183 (16.8%) | 16 (0.2%) |
| 5-Person Households | 628 (8.9%) | 0 (0.0%) |
| 6-Person Households | 97 (1.4%) | 0 (0.0%) |
| 7+ Person Households | 89 (1.3%) | 0 (0.0%) |
| Total | 5,226 (74.0%) | 1,834 (26.0%) |
Female Fertility in East Massapequa
Fertility by Age in East Massapequa
Average fertility rate in East Massapequa is 67.0 births per 1,000 women. Women in the age bracket of 20 to 34 years have the highest fertility rate with 115.0 births per 1,000 women. Women in the age bracket of 20 to 34 years acount for 69.0% of all women with births.
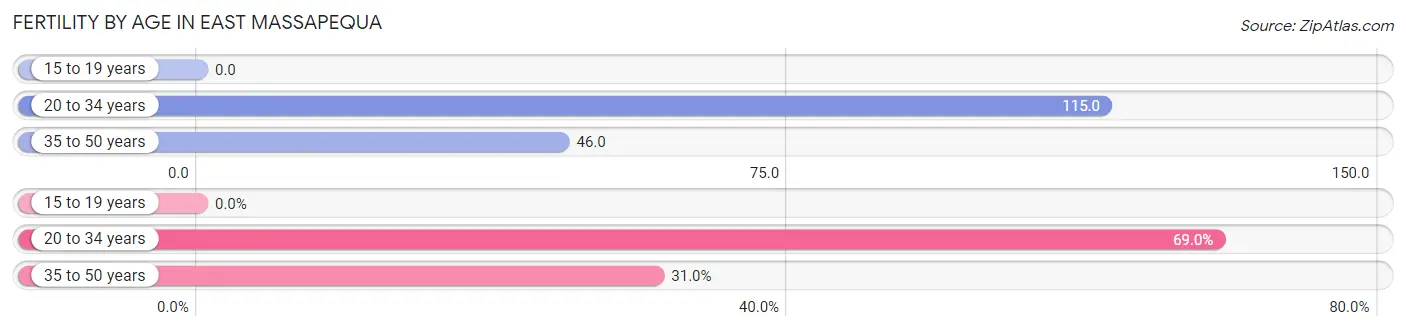
| Age Bracket | Women with Births | Births / 1,000 Women |
| 15 to 19 years | 0 (0.0%) | 0.0 |
| 20 to 34 years | 185 (69.0%) | 115.0 |
| 35 to 50 years | 83 (31.0%) | 46.0 |
| Total | 268 (100.0%) | 67.0 |
Fertility by Age by Marriage Status in East Massapequa
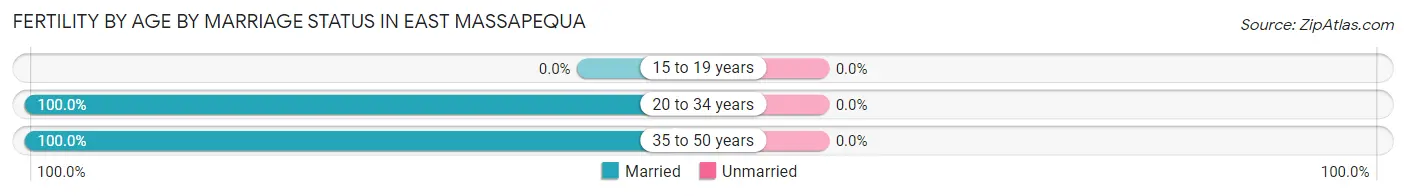
| Age Bracket | Married | Unmarried |
| 15 to 19 years | 0 (0.0%) | 0 (0.0%) |
| 20 to 34 years | 185 (100.0%) | 0 (0.0%) |
| 35 to 50 years | 83 (100.0%) | 0 (0.0%) |
| Total | 268 (100.0%) | 0 (0.0%) |
Fertility by Education in East Massapequa
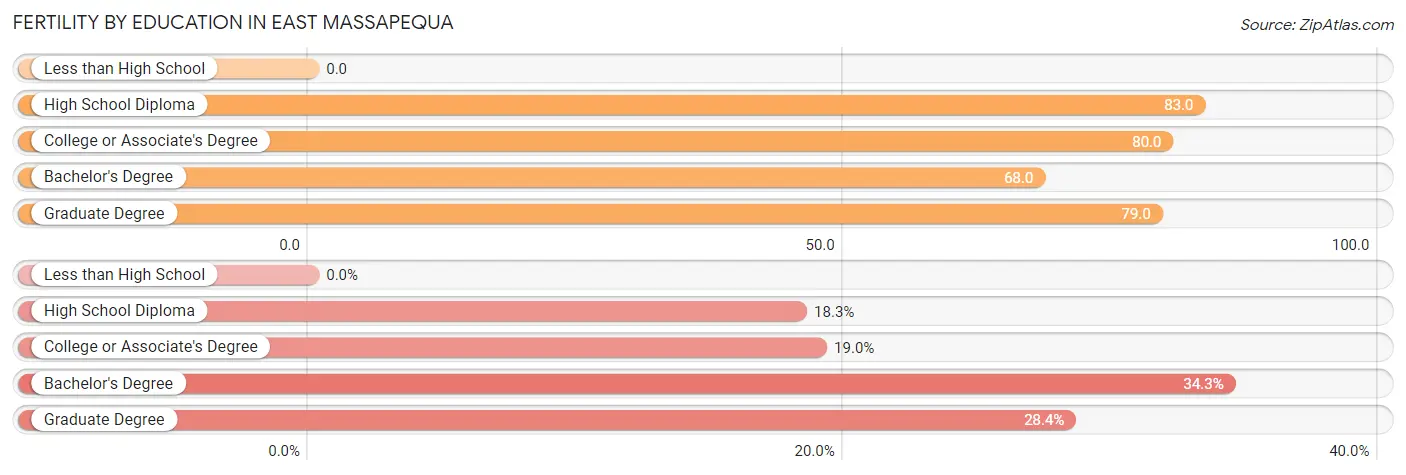
| Educational Attainment | Women with Births | Births / 1,000 Women |
| Less than High School | 0 (0.0%) | 0.0 |
| High School Diploma | 49 (18.3%) | 83.0 |
| College or Associate's Degree | 51 (19.0%) | 80.0 |
| Bachelor's Degree | 92 (34.3%) | 68.0 |
| Graduate Degree | 76 (28.4%) | 79.0 |
| Total | 268 (100.0%) | 67.0 |
Fertility by Education by Marriage Status in East Massapequa
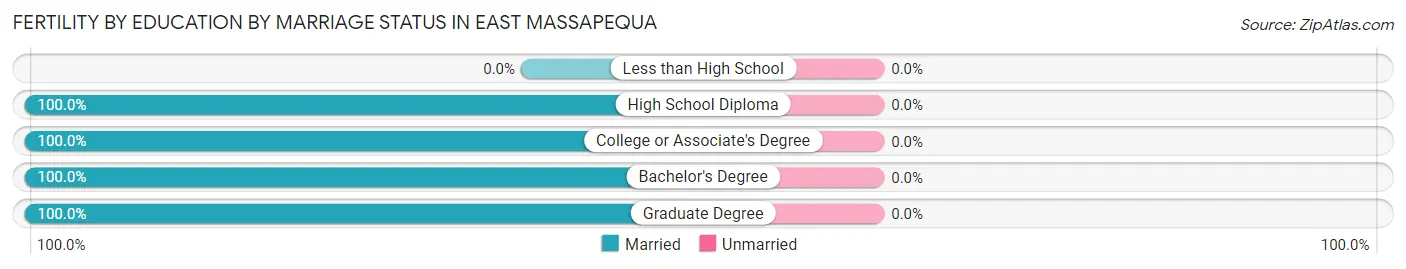
| Educational Attainment | Married | Unmarried |
| Less than High School | 0 (0.0%) | 0 (0.0%) |
| High School Diploma | 49 (100.0%) | 0 (0.0%) |
| College or Associate's Degree | 51 (100.0%) | 0 (0.0%) |
| Bachelor's Degree | 92 (100.0%) | 0 (0.0%) |
| Graduate Degree | 76 (100.0%) | 0 (0.0%) |
| Total | 268 (100.0%) | 0 (0.0%) |
Employment Characteristics in East Massapequa
Employment by Class of Employer in East Massapequa
Among the 9,813 employed individuals in East Massapequa, private company employees (5,770 | 58.8%), local government employees (1,436 | 14.6%), and not-for-profit organizations (1,143 | 11.7%) make up the most common classes of employment.
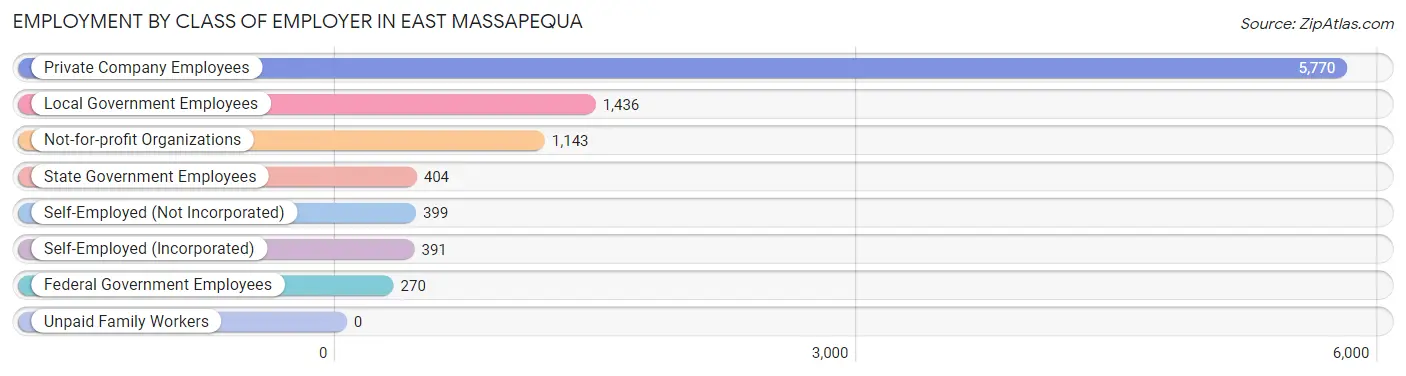
| Employer Class | # Employees | % Employees |
| Private Company Employees | 5,770 | 58.8% |
| Self-Employed (Incorporated) | 391 | 4.0% |
| Self-Employed (Not Incorporated) | 399 | 4.1% |
| Not-for-profit Organizations | 1,143 | 11.7% |
| Local Government Employees | 1,436 | 14.6% |
| State Government Employees | 404 | 4.1% |
| Federal Government Employees | 270 | 2.8% |
| Unpaid Family Workers | 0 | 0.0% |
| Total | 9,813 | 100.0% |
Employment Status by Age in East Massapequa
According to the labor force statistics for East Massapequa, out of the total population over 16 years of age (16,482), 64.3% or 10,598 individuals are in the labor force, with 4.9% or 519 of them unemployed. The age group with the highest labor force participation rate is 25 to 29 years, with 94.2% or 954 individuals in the labor force. Within the labor force, the 20 to 24 years age range has the highest percentage of unemployed individuals, with 15.4% or 123 of them being unemployed.
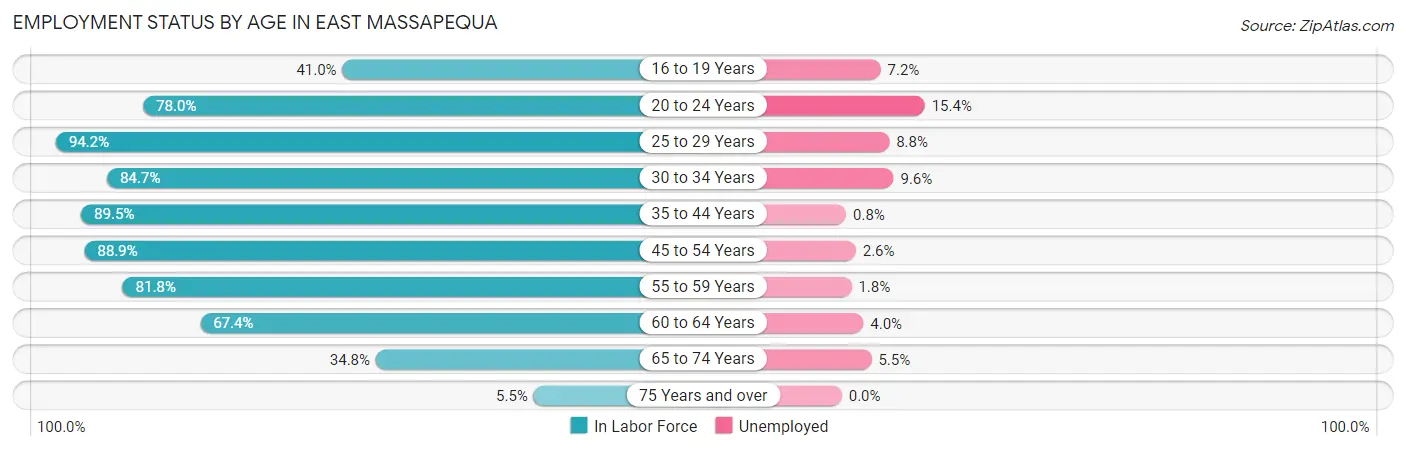
| Age Bracket | In Labor Force | Unemployed |
| 16 to 19 Years | 390 (41.0%) | 28 (7.2%) |
| 20 to 24 Years | 799 (78.0%) | 123 (15.4%) |
| 25 to 29 Years | 954 (94.2%) | 84 (8.8%) |
| 30 to 34 Years | 949 (84.7%) | 91 (9.6%) |
| 35 to 44 Years | 2,081 (89.5%) | 17 (0.8%) |
| 45 to 54 Years | 2,228 (88.9%) | 58 (2.6%) |
| 55 to 59 Years | 1,036 (81.8%) | 19 (1.8%) |
| 60 to 64 Years | 1,033 (67.4%) | 41 (4.0%) |
| 65 to 74 Years | 1,037 (34.8%) | 57 (5.5%) |
| 75 Years and over | 97 (5.5%) | 0 (0.0%) |
| Total | 10,598 (64.3%) | 519 (4.9%) |
Employment Status by Educational Attainment in East Massapequa
According to labor force statistics for East Massapequa, 84.8% of individuals (8,278) out of the total population between 25 and 64 years of age (9,762) are in the labor force, with 3.7% or 306 of them being unemployed. The group with the highest labor force participation rate are those with the educational attainment of bachelor's degree or higher, with 90.5% or 4,445 individuals in the labor force. Within the labor force, individuals with high school diploma education have the highest percentage of unemployment, with 4.9% or 105 of them being unemployed.
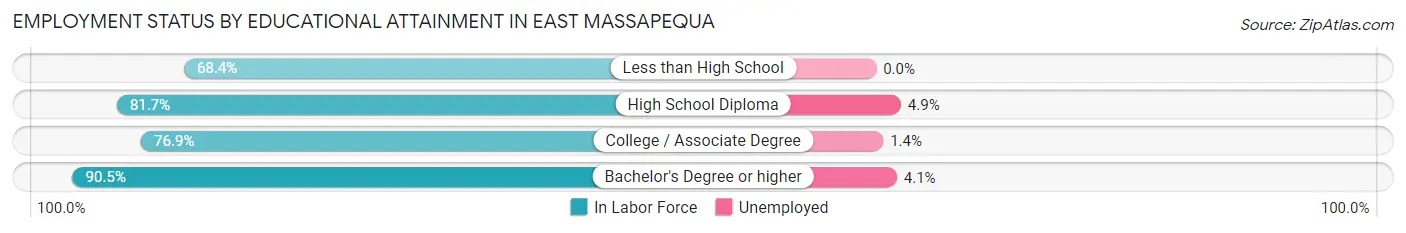
| Educational Attainment | In Labor Force | Unemployed |
| Less than High School | 167 (68.4%) | 0 (0.0%) |
| High School Diploma | 2,150 (81.7%) | 129 (4.9%) |
| College / Associate Degree | 1,518 (76.9%) | 28 (1.4%) |
| Bachelor's Degree or higher | 4,445 (90.5%) | 201 (4.1%) |
| Total | 8,278 (84.8%) | 361 (3.7%) |
Employment Occupations by Sex in East Massapequa
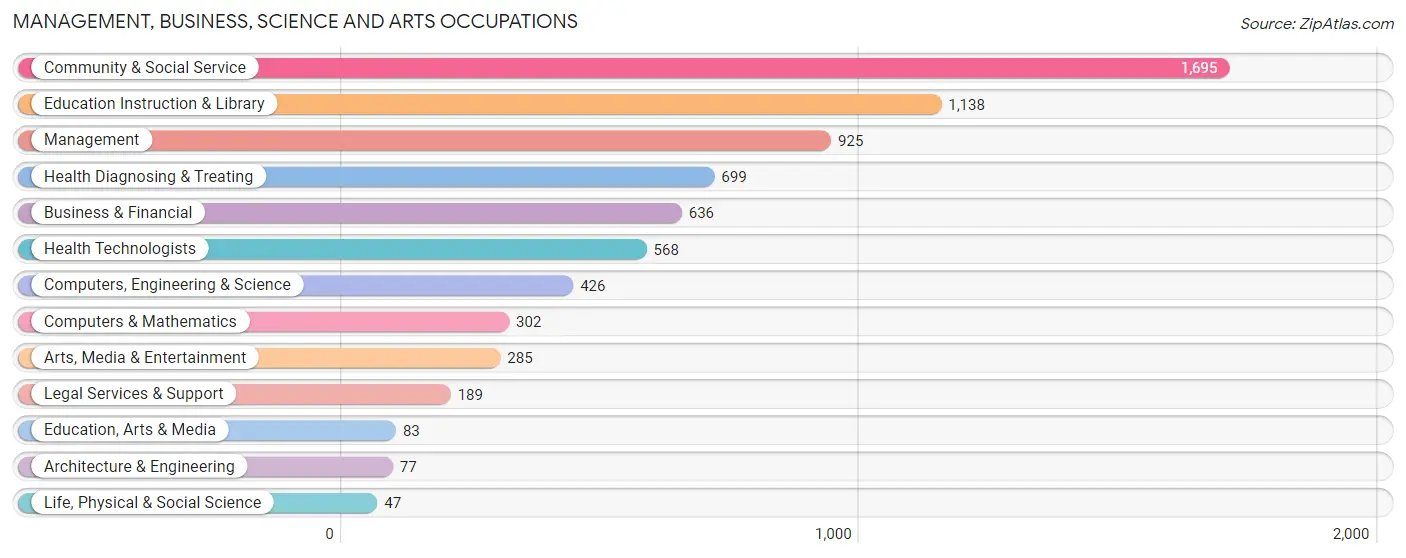
Management, Business, Science and Arts Occupations
The most common Management, Business, Science and Arts occupations in East Massapequa are Community & Social Service (1,695 | 16.8%), Education Instruction & Library (1,138 | 11.3%), Management (925 | 9.2%), Health Diagnosing & Treating (699 | 6.9%), and Business & Financial (636 | 6.3%).
Management, Business, Science and Arts Occupations by Sex
Within the Management, Business, Science and Arts occupations in East Massapequa, the most male-oriented occupations are Computers & Mathematics (92.4%), Computers, Engineering & Science (75.3%), and Education, Arts & Media (68.7%), while the most female-oriented occupations are Life, Physical & Social Science (100.0%), Health Technologists (88.0%), and Health Diagnosing & Treating (82.3%).
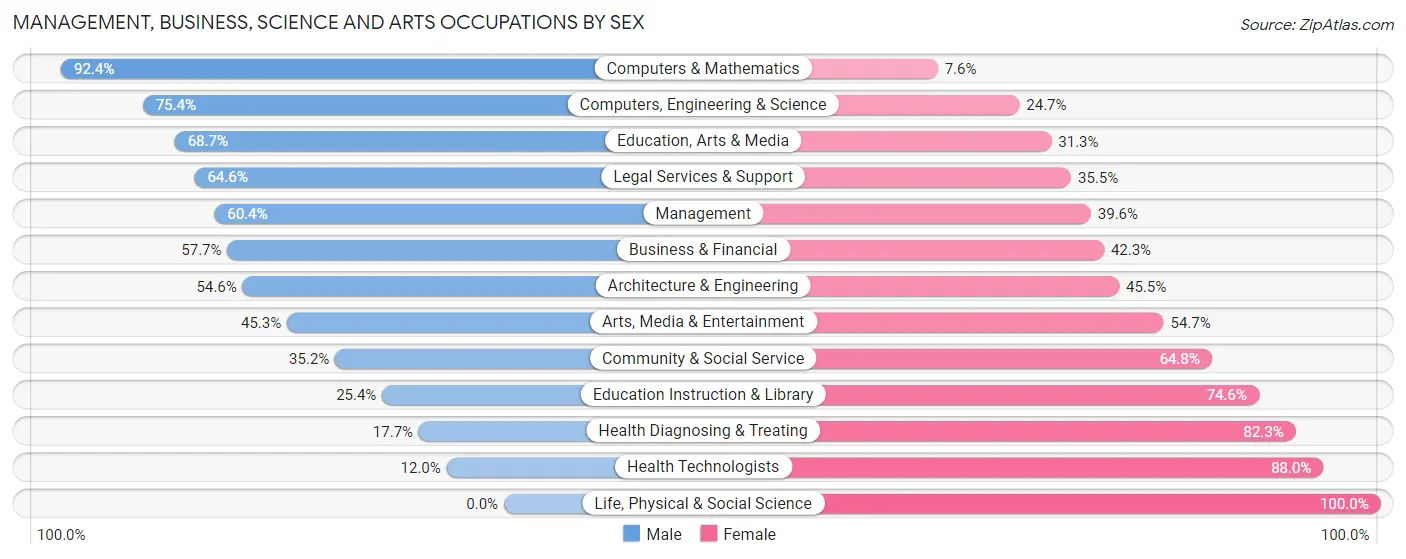
| Occupation | Male | Female |
| Management | 559 (60.4%) | 366 (39.6%) |
| Business & Financial | 367 (57.7%) | 269 (42.3%) |
| Computers, Engineering & Science | 321 (75.3%) | 105 (24.6%) |
| Computers & Mathematics | 279 (92.4%) | 23 (7.6%) |
| Architecture & Engineering | 42 (54.5%) | 35 (45.5%) |
| Life, Physical & Social Science | 0 (0.0%) | 47 (100.0%) |
| Community & Social Service | 597 (35.2%) | 1,098 (64.8%) |
| Education, Arts & Media | 57 (68.7%) | 26 (31.3%) |
| Legal Services & Support | 122 (64.5%) | 67 (35.4%) |
| Education Instruction & Library | 289 (25.4%) | 849 (74.6%) |
| Arts, Media & Entertainment | 129 (45.3%) | 156 (54.7%) |
| Health Diagnosing & Treating | 124 (17.7%) | 575 (82.3%) |
| Health Technologists | 68 (12.0%) | 500 (88.0%) |
| Total (Category) | 1,968 (44.9%) | 2,413 (55.1%) |
| Total (Overall) | 5,328 (52.8%) | 4,758 (47.2%) |
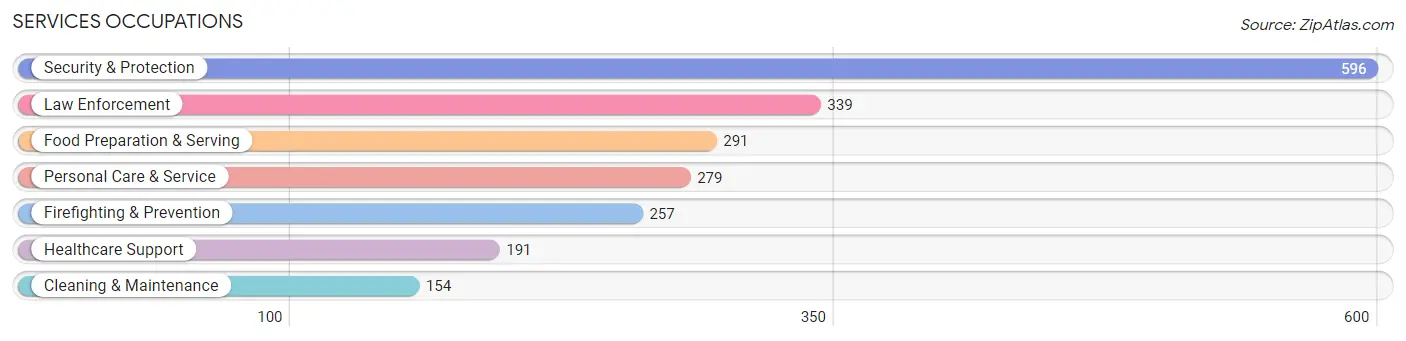
Services Occupations
The most common Services occupations in East Massapequa are Security & Protection (596 | 5.9%), Law Enforcement (339 | 3.4%), Food Preparation & Serving (291 | 2.9%), Personal Care & Service (279 | 2.8%), and Firefighting & Prevention (257 | 2.5%).
Services Occupations by Sex
Within the Services occupations in East Massapequa, the most male-oriented occupations are Cleaning & Maintenance (97.4%), Law Enforcement (93.8%), and Security & Protection (87.7%), while the most female-oriented occupations are Healthcare Support (95.8%), Personal Care & Service (57.0%), and Food Preparation & Serving (43.0%).
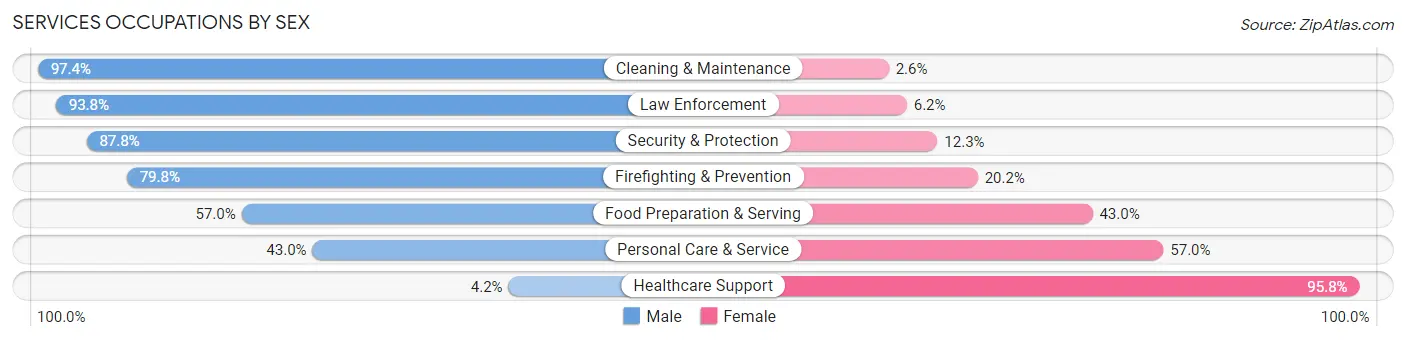
| Occupation | Male | Female |
| Healthcare Support | 8 (4.2%) | 183 (95.8%) |
| Security & Protection | 523 (87.7%) | 73 (12.2%) |
| Firefighting & Prevention | 205 (79.8%) | 52 (20.2%) |
| Law Enforcement | 318 (93.8%) | 21 (6.2%) |
| Food Preparation & Serving | 166 (57.0%) | 125 (43.0%) |
| Cleaning & Maintenance | 150 (97.4%) | 4 (2.6%) |
| Personal Care & Service | 120 (43.0%) | 159 (57.0%) |
| Total (Category) | 967 (64.0%) | 544 (36.0%) |
| Total (Overall) | 5,328 (52.8%) | 4,758 (47.2%) |
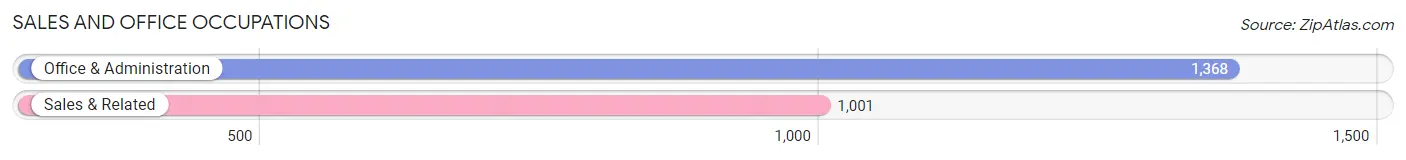
Sales and Office Occupations
The most common Sales and Office occupations in East Massapequa are Office & Administration (1,368 | 13.6%), and Sales & Related (1,001 | 9.9%).
Sales and Office Occupations by Sex
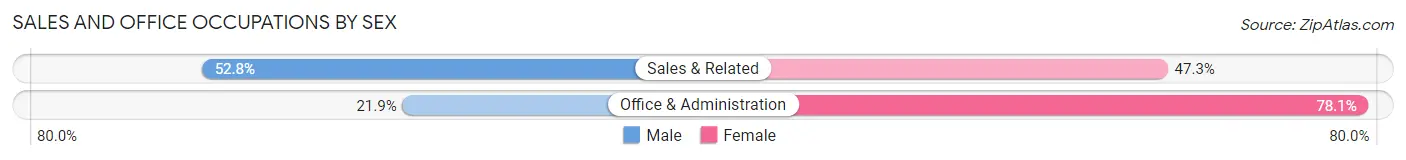
| Occupation | Male | Female |
| Sales & Related | 528 (52.7%) | 473 (47.2%) |
| Office & Administration | 299 (21.9%) | 1,069 (78.1%) |
| Total (Category) | 827 (34.9%) | 1,542 (65.1%) |
| Total (Overall) | 5,328 (52.8%) | 4,758 (47.2%) |
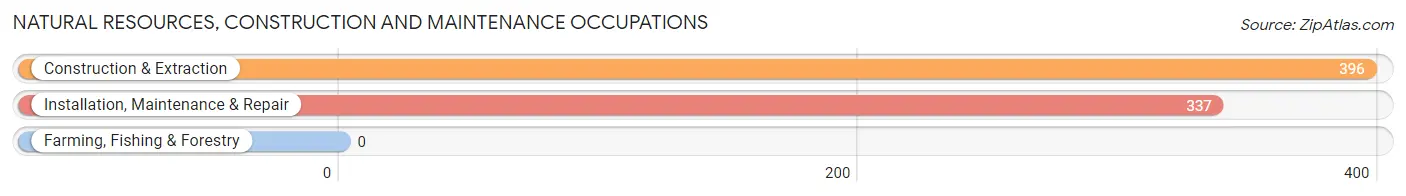
Natural Resources, Construction and Maintenance Occupations
The most common Natural Resources, Construction and Maintenance occupations in East Massapequa are Construction & Extraction (396 | 3.9%), and Installation, Maintenance & Repair (337 | 3.3%).
Natural Resources, Construction and Maintenance Occupations by Sex
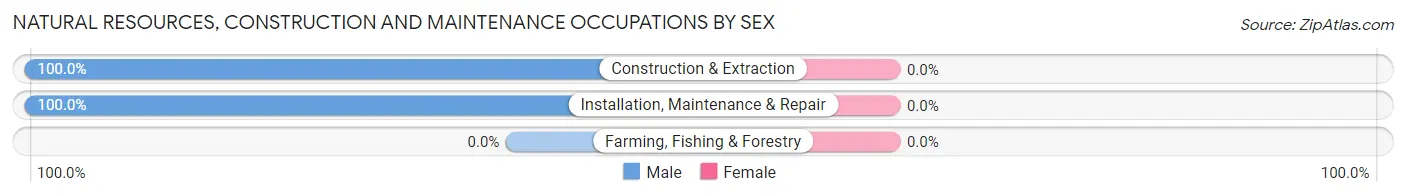
| Occupation | Male | Female |
| Farming, Fishing & Forestry | 0 (0.0%) | 0 (0.0%) |
| Construction & Extraction | 396 (100.0%) | 0 (0.0%) |
| Installation, Maintenance & Repair | 337 (100.0%) | 0 (0.0%) |
| Total (Category) | 733 (100.0%) | 0 (0.0%) |
| Total (Overall) | 5,328 (52.8%) | 4,758 (47.2%) |
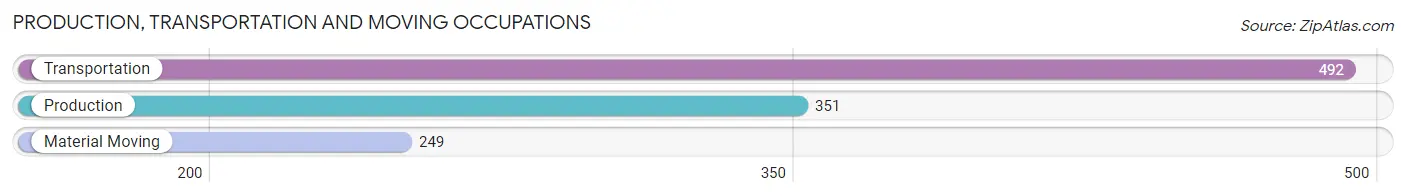
Production, Transportation and Moving Occupations
The most common Production, Transportation and Moving occupations in East Massapequa are Transportation (492 | 4.9%), Production (351 | 3.5%), and Material Moving (249 | 2.5%).
Production, Transportation and Moving Occupations by Sex
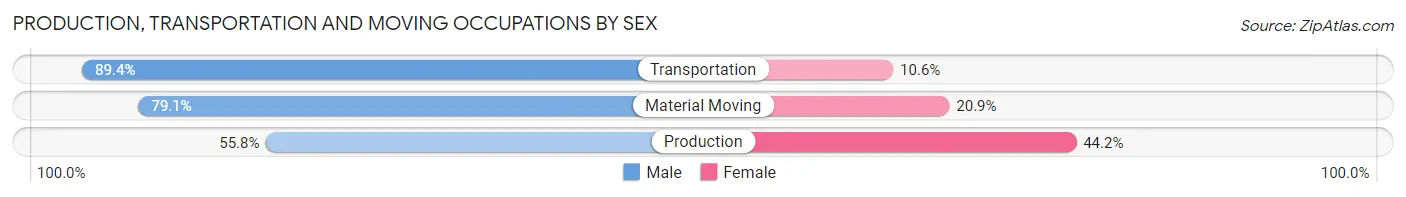
| Occupation | Male | Female |
| Production | 196 (55.8%) | 155 (44.2%) |
| Transportation | 440 (89.4%) | 52 (10.6%) |
| Material Moving | 197 (79.1%) | 52 (20.9%) |
| Total (Category) | 833 (76.3%) | 259 (23.7%) |
| Total (Overall) | 5,328 (52.8%) | 4,758 (47.2%) |
Employment Industries by Sex in East Massapequa
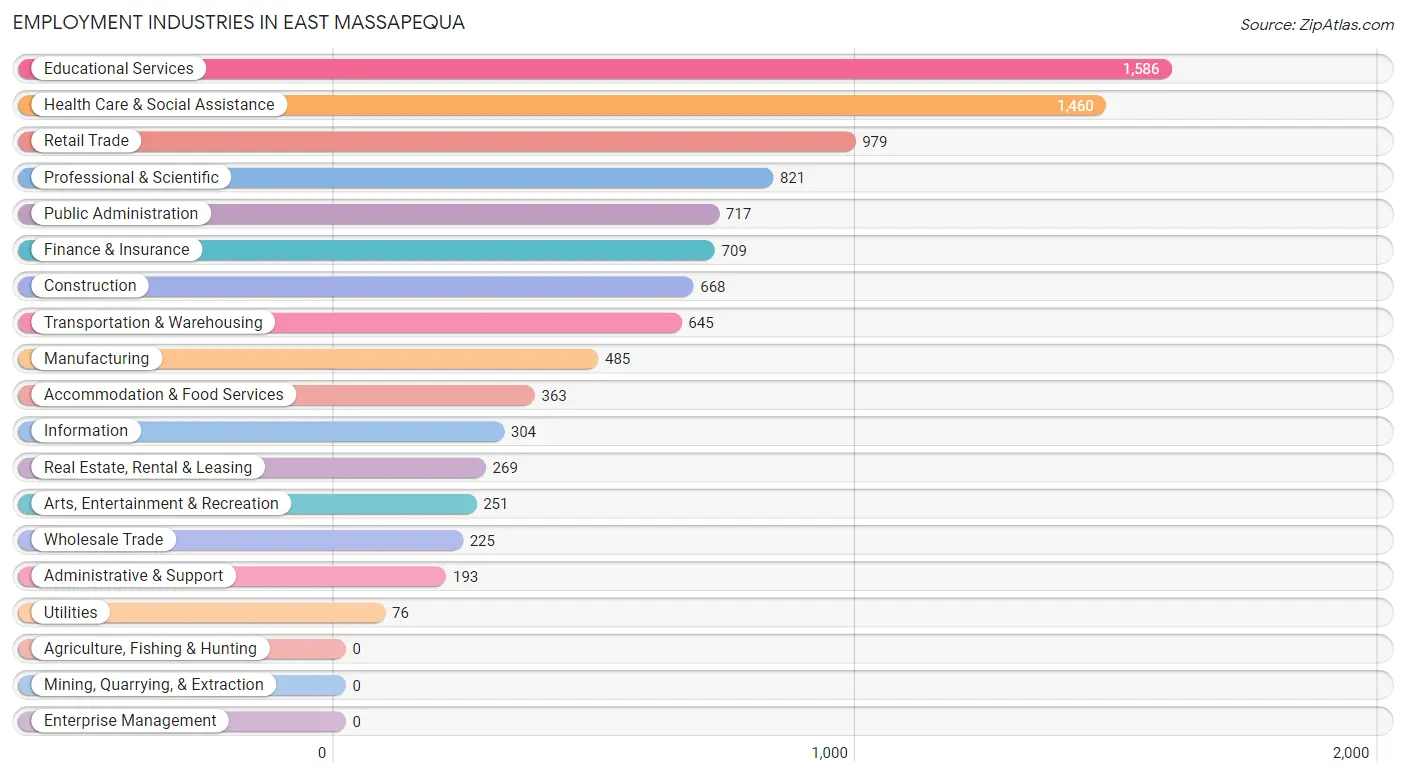
Employment Industries in East Massapequa
The major employment industries in East Massapequa include Educational Services (1,586 | 15.7%), Health Care & Social Assistance (1,460 | 14.5%), Retail Trade (979 | 9.7%), Professional & Scientific (821 | 8.1%), and Public Administration (717 | 7.1%).
Employment Industries by Sex in East Massapequa
The East Massapequa industries that see more men than women are Construction (96.0%), Arts, Entertainment & Recreation (86.1%), and Information (83.2%), whereas the industries that tend to have a higher number of women are Health Care & Social Assistance (78.6%), Utilities (73.7%), and Educational Services (67.0%).
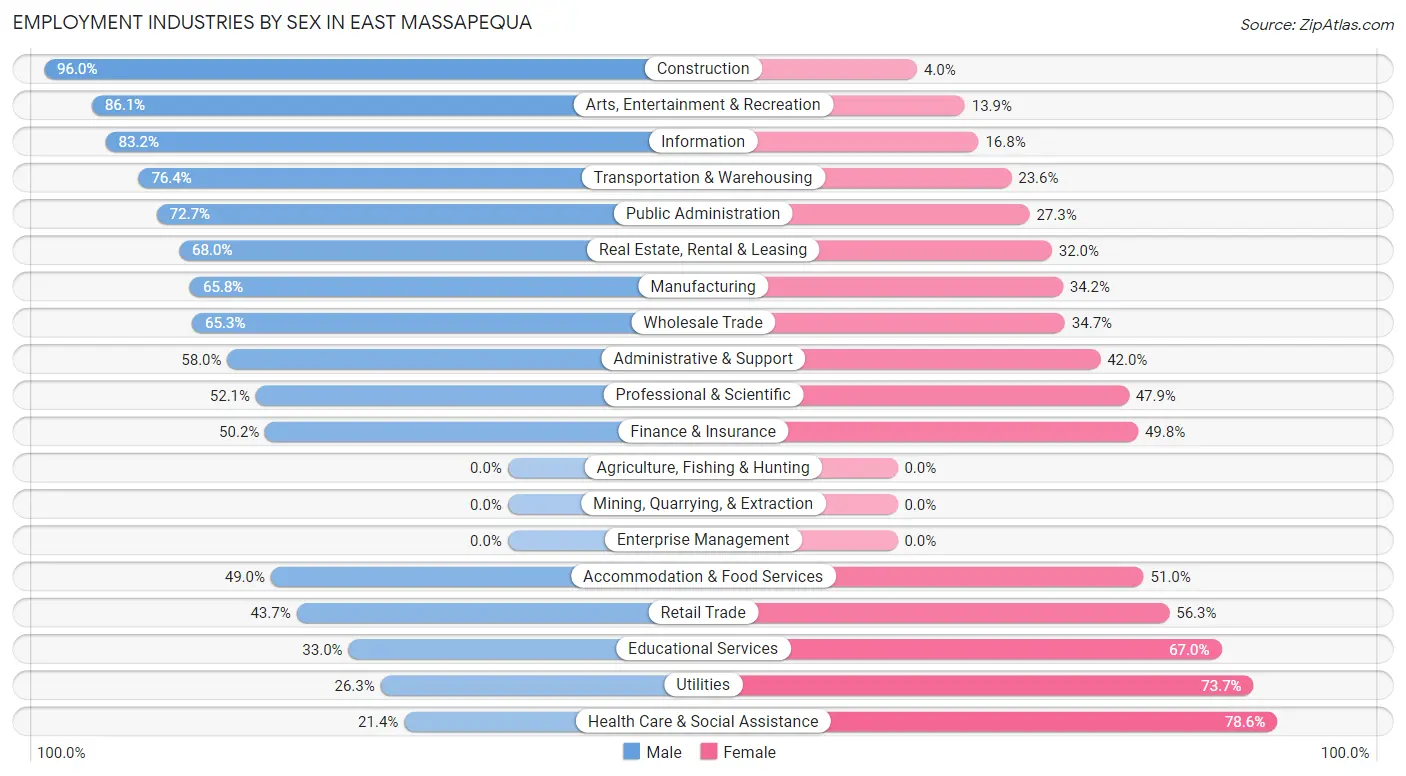
| Industry | Male | Female |
| Agriculture, Fishing & Hunting | 0 (0.0%) | 0 (0.0%) |
| Mining, Quarrying, & Extraction | 0 (0.0%) | 0 (0.0%) |
| Construction | 641 (96.0%) | 27 (4.0%) |
| Manufacturing | 319 (65.8%) | 166 (34.2%) |
| Wholesale Trade | 147 (65.3%) | 78 (34.7%) |
| Retail Trade | 428 (43.7%) | 551 (56.3%) |
| Transportation & Warehousing | 493 (76.4%) | 152 (23.6%) |
| Utilities | 20 (26.3%) | 56 (73.7%) |
| Information | 253 (83.2%) | 51 (16.8%) |
| Finance & Insurance | 356 (50.2%) | 353 (49.8%) |
| Real Estate, Rental & Leasing | 183 (68.0%) | 86 (32.0%) |
| Professional & Scientific | 428 (52.1%) | 393 (47.9%) |
| Enterprise Management | 0 (0.0%) | 0 (0.0%) |
| Administrative & Support | 112 (58.0%) | 81 (42.0%) |
| Educational Services | 523 (33.0%) | 1,063 (67.0%) |
| Health Care & Social Assistance | 313 (21.4%) | 1,147 (78.6%) |
| Arts, Entertainment & Recreation | 216 (86.1%) | 35 (13.9%) |
| Accommodation & Food Services | 178 (49.0%) | 185 (51.0%) |
| Public Administration | 521 (72.7%) | 196 (27.3%) |
| Total | 5,328 (52.8%) | 4,758 (47.2%) |
Education in East Massapequa
School Enrollment in East Massapequa
The most common levels of schooling among the 3,936 students in East Massapequa are college / undergraduate (890 | 22.6%), high school (863 | 21.9%), and middle school (765 | 19.4%).
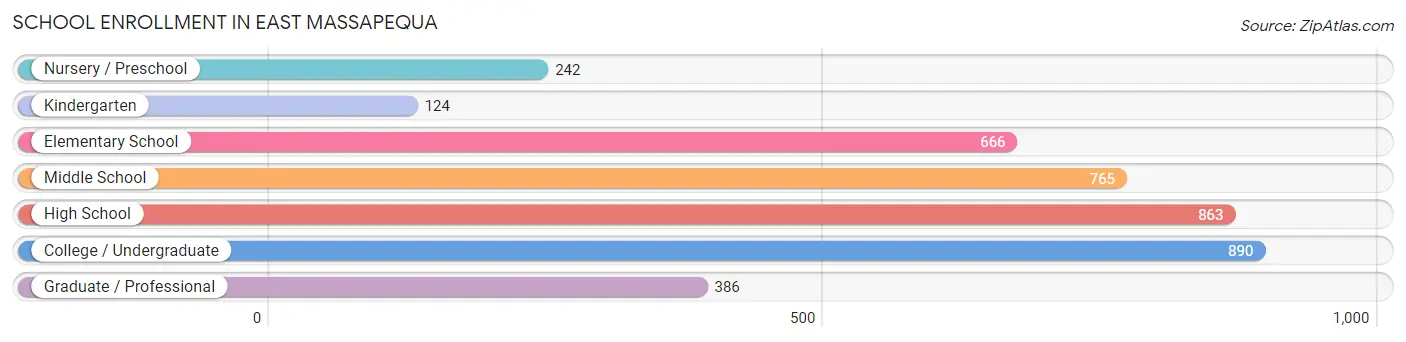
| School Level | # Students | % Students |
| Nursery / Preschool | 242 | 6.1% |
| Kindergarten | 124 | 3.2% |
| Elementary School | 666 | 16.9% |
| Middle School | 765 | 19.4% |
| High School | 863 | 21.9% |
| College / Undergraduate | 890 | 22.6% |
| Graduate / Professional | 386 | 9.8% |
| Total | 3,936 | 100.0% |
School Enrollment by Age by Funding Source in East Massapequa
Out of a total of 3,936 students who are enrolled in schools in East Massapequa, 1,248 (31.7%) attend a private institution, while the remaining 2,688 (68.3%) are enrolled in public schools. The age group of 3 to 4 year olds has the highest likelihood of being enrolled in private schools, with 160 (74.1% in the age bracket) enrolled. Conversely, the age group of 5 to 9 year old has the lowest likelihood of being enrolled in a private school, with 692 (86.4% in the age bracket) attending a public institution.
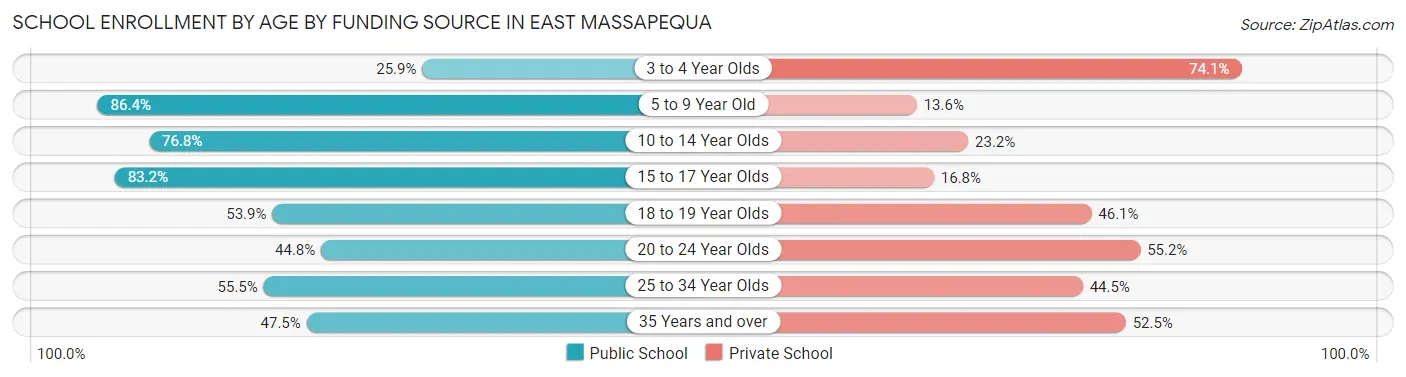
| Age Bracket | Public School | Private School |
| 3 to 4 Year Olds | 56 (25.9%) | 160 (74.1%) |
| 5 to 9 Year Old | 692 (86.4%) | 109 (13.6%) |
| 10 to 14 Year Olds | 643 (76.8%) | 194 (23.2%) |
| 15 to 17 Year Olds | 639 (83.2%) | 129 (16.8%) |
| 18 to 19 Year Olds | 202 (53.9%) | 173 (46.1%) |
| 20 to 24 Year Olds | 201 (44.8%) | 248 (55.2%) |
| 25 to 34 Year Olds | 162 (55.5%) | 130 (44.5%) |
| 35 Years and over | 94 (47.5%) | 104 (52.5%) |
| Total | 2,688 (68.3%) | 1,248 (31.7%) |
Educational Attainment by Field of Study in East Massapequa
Business (1,471 | 21.1%), education (1,240 | 17.8%), social sciences (701 | 10.0%), science & technology (628 | 9.0%), and psychology (494 | 7.1%) are the most common fields of study among 6,982 individuals in East Massapequa who have obtained a bachelor's degree or higher.
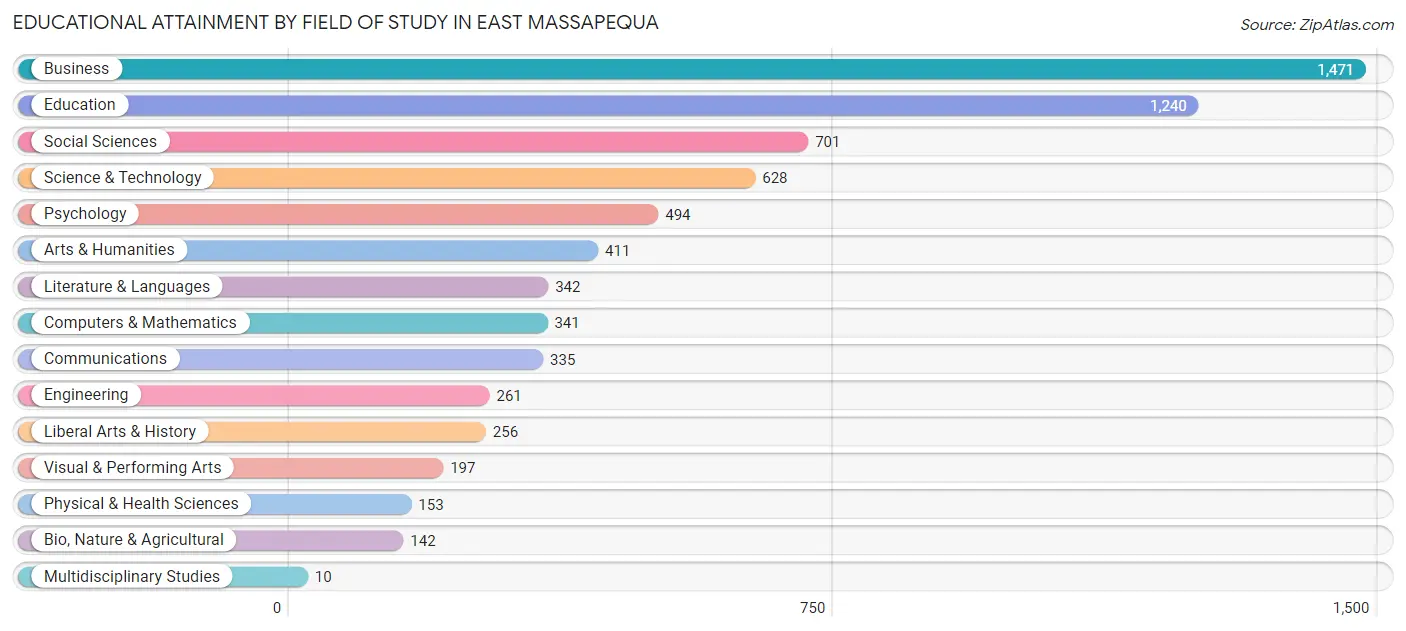
| Field of Study | # Graduates | % Graduates |
| Computers & Mathematics | 341 | 4.9% |
| Bio, Nature & Agricultural | 142 | 2.0% |
| Physical & Health Sciences | 153 | 2.2% |
| Psychology | 494 | 7.1% |
| Social Sciences | 701 | 10.0% |
| Engineering | 261 | 3.7% |
| Multidisciplinary Studies | 10 | 0.1% |
| Science & Technology | 628 | 9.0% |
| Business | 1,471 | 21.1% |
| Education | 1,240 | 17.8% |
| Literature & Languages | 342 | 4.9% |
| Liberal Arts & History | 256 | 3.7% |
| Visual & Performing Arts | 197 | 2.8% |
| Communications | 335 | 4.8% |
| Arts & Humanities | 411 | 5.9% |
| Total | 6,982 | 100.0% |
Transportation & Commute in East Massapequa
Vehicle Availability by Sex in East Massapequa
The most prevalent vehicle ownership categories in East Massapequa are males with 2 vehicles (2,255, accounting for 44.2%) and females with 2 vehicles (1,865, making up 47.9%).
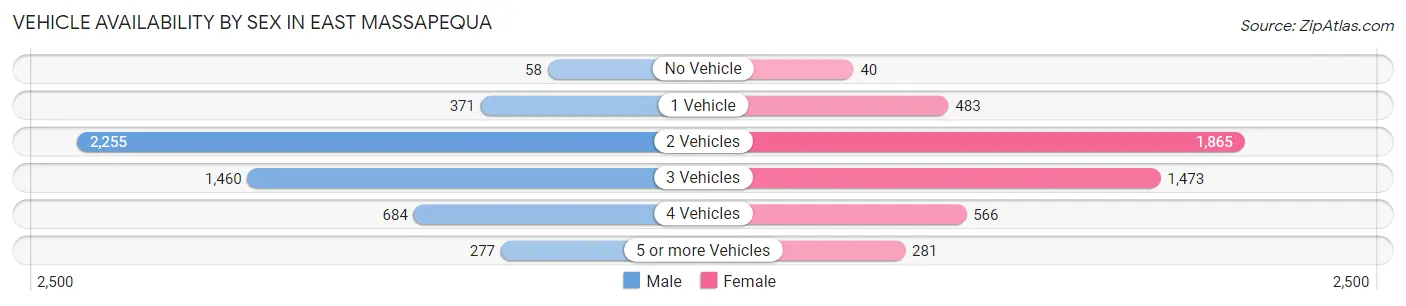
| Vehicles Available | Male | Female |
| No Vehicle | 58 (1.1%) | 40 (0.9%) |
| 1 Vehicle | 371 (7.3%) | 483 (10.3%) |
| 2 Vehicles | 2,255 (44.2%) | 1,865 (39.6%) |
| 3 Vehicles | 1,460 (28.6%) | 1,473 (31.3%) |
| 4 Vehicles | 684 (13.4%) | 566 (12.0%) |
| 5 or more Vehicles | 277 (5.4%) | 281 (6.0%) |
| Total | 5,105 (100.0%) | 4,708 (100.0%) |
Commute Time in East Massapequa
The most frequently occuring commute durations in East Massapequa are 60 to 89 minutes (1,458 commuters, 16.5%), 30 to 34 minutes (1,442 commuters, 16.4%), and 20 to 24 minutes (880 commuters, 10.0%).
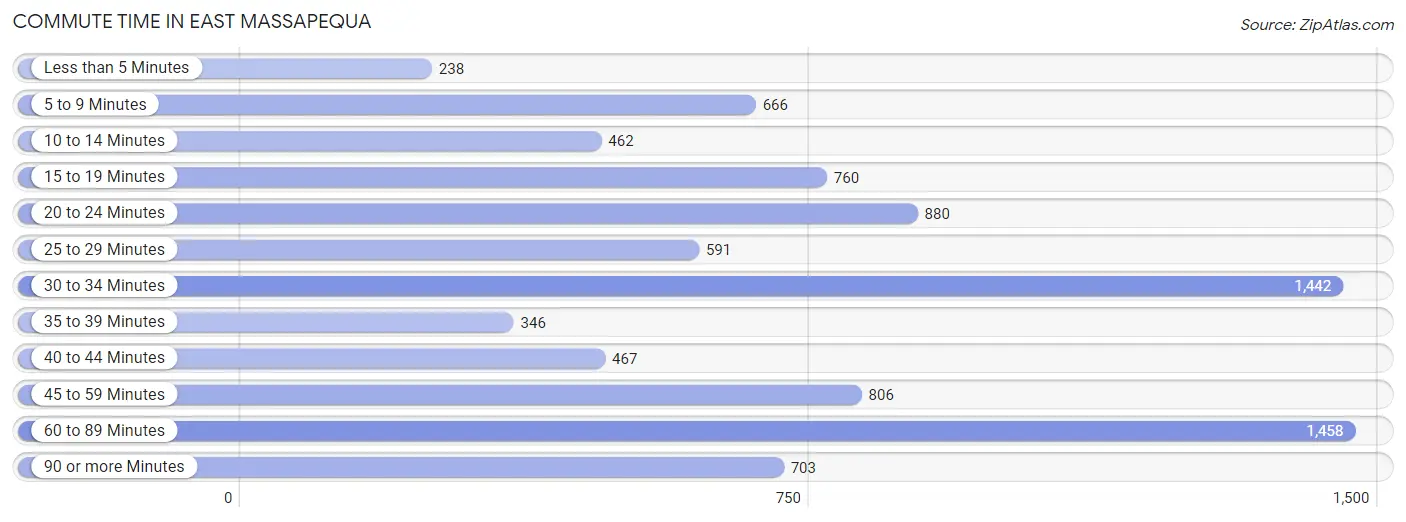
| Commute Time | # Commuters | % Commuters |
| Less than 5 Minutes | 238 | 2.7% |
| 5 to 9 Minutes | 666 | 7.5% |
| 10 to 14 Minutes | 462 | 5.2% |
| 15 to 19 Minutes | 760 | 8.6% |
| 20 to 24 Minutes | 880 | 10.0% |
| 25 to 29 Minutes | 591 | 6.7% |
| 30 to 34 Minutes | 1,442 | 16.4% |
| 35 to 39 Minutes | 346 | 3.9% |
| 40 to 44 Minutes | 467 | 5.3% |
| 45 to 59 Minutes | 806 | 9.1% |
| 60 to 89 Minutes | 1,458 | 16.5% |
| 90 or more Minutes | 703 | 8.0% |
Commute Time by Sex in East Massapequa
The most common commute times in East Massapequa are 60 to 89 minutes (899 commuters, 19.5%) for males and 30 to 34 minutes (703 commuters, 16.7%) for females.
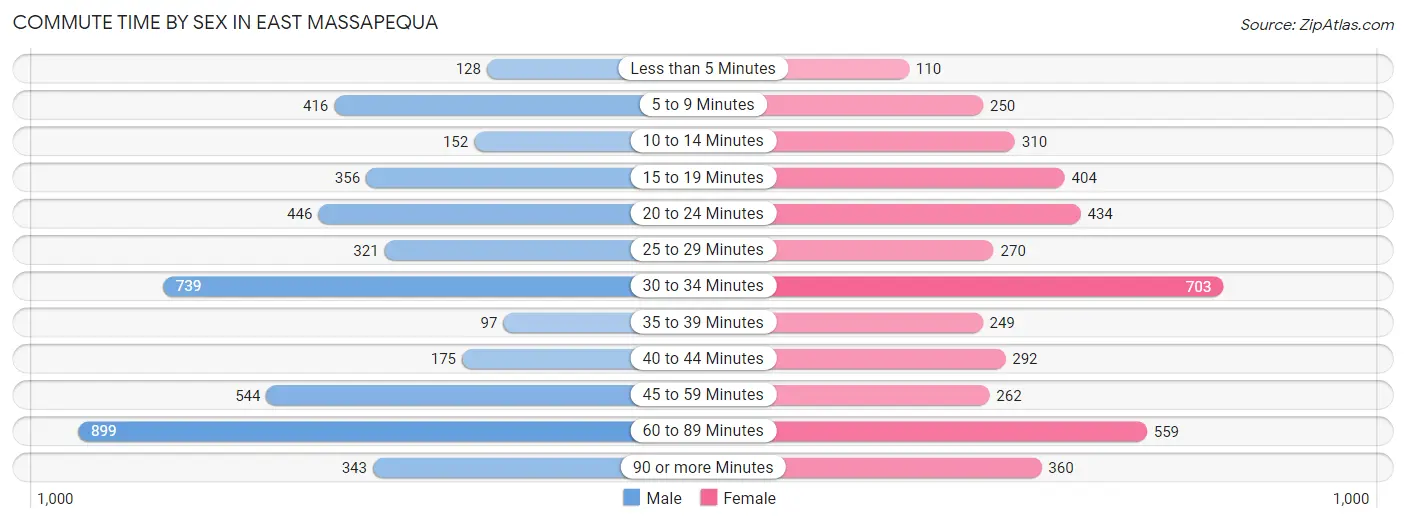
| Commute Time | Male | Female |
| Less than 5 Minutes | 128 (2.8%) | 110 (2.6%) |
| 5 to 9 Minutes | 416 (9.0%) | 250 (5.9%) |
| 10 to 14 Minutes | 152 (3.3%) | 310 (7.4%) |
| 15 to 19 Minutes | 356 (7.7%) | 404 (9.6%) |
| 20 to 24 Minutes | 446 (9.7%) | 434 (10.3%) |
| 25 to 29 Minutes | 321 (7.0%) | 270 (6.4%) |
| 30 to 34 Minutes | 739 (16.0%) | 703 (16.7%) |
| 35 to 39 Minutes | 97 (2.1%) | 249 (5.9%) |
| 40 to 44 Minutes | 175 (3.8%) | 292 (7.0%) |
| 45 to 59 Minutes | 544 (11.8%) | 262 (6.2%) |
| 60 to 89 Minutes | 899 (19.5%) | 559 (13.3%) |
| 90 or more Minutes | 343 (7.4%) | 360 (8.6%) |
Time of Departure to Work by Sex in East Massapequa
The most frequent times of departure to work in East Massapequa are 6:00 AM to 6:29 AM (764, 16.6%) for males and 7:00 AM to 7:29 AM (934, 22.2%) for females.
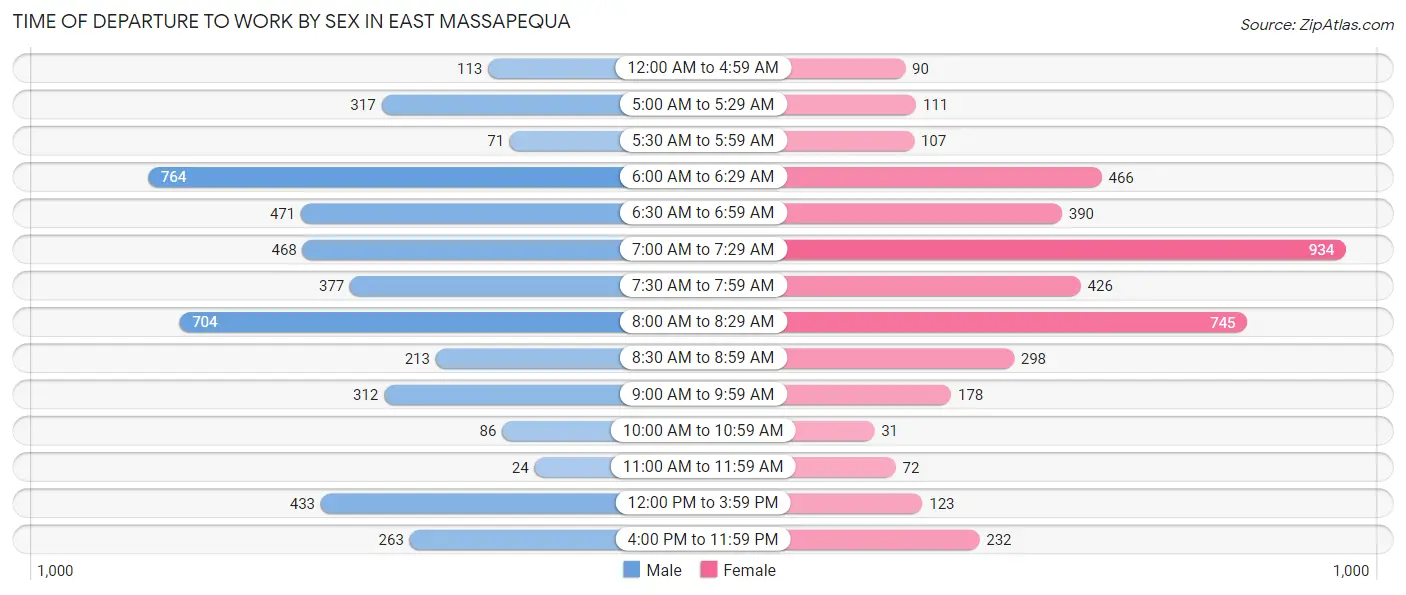
| Time of Departure | Male | Female |
| 12:00 AM to 4:59 AM | 113 (2.5%) | 90 (2.1%) |
| 5:00 AM to 5:29 AM | 317 (6.9%) | 111 (2.6%) |
| 5:30 AM to 5:59 AM | 71 (1.5%) | 107 (2.5%) |
| 6:00 AM to 6:29 AM | 764 (16.6%) | 466 (11.1%) |
| 6:30 AM to 6:59 AM | 471 (10.2%) | 390 (9.3%) |
| 7:00 AM to 7:29 AM | 468 (10.1%) | 934 (22.2%) |
| 7:30 AM to 7:59 AM | 377 (8.2%) | 426 (10.1%) |
| 8:00 AM to 8:29 AM | 704 (15.2%) | 745 (17.7%) |
| 8:30 AM to 8:59 AM | 213 (4.6%) | 298 (7.1%) |
| 9:00 AM to 9:59 AM | 312 (6.8%) | 178 (4.2%) |
| 10:00 AM to 10:59 AM | 86 (1.9%) | 31 (0.7%) |
| 11:00 AM to 11:59 AM | 24 (0.5%) | 72 (1.7%) |
| 12:00 PM to 3:59 PM | 433 (9.4%) | 123 (2.9%) |
| 4:00 PM to 11:59 PM | 263 (5.7%) | 232 (5.5%) |
| Total | 4,616 (100.0%) | 4,203 (100.0%) |
Housing Occupancy in East Massapequa
Occupancy by Ownership in East Massapequa
Of the total 7,060 dwellings in East Massapequa, owner-occupied units account for 6,369 (90.2%), while renter-occupied units make up 691 (9.8%).
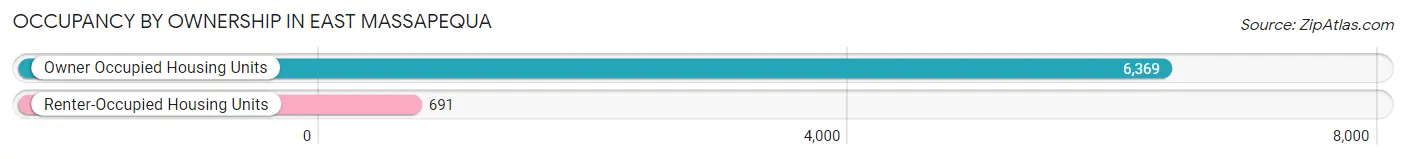
| Occupancy | # Housing Units | % Housing Units |
| Owner Occupied Housing Units | 6,369 | 90.2% |
| Renter-Occupied Housing Units | 691 | 9.8% |
| Total Occupied Housing Units | 7,060 | 100.0% |
Occupancy by Household Size in East Massapequa
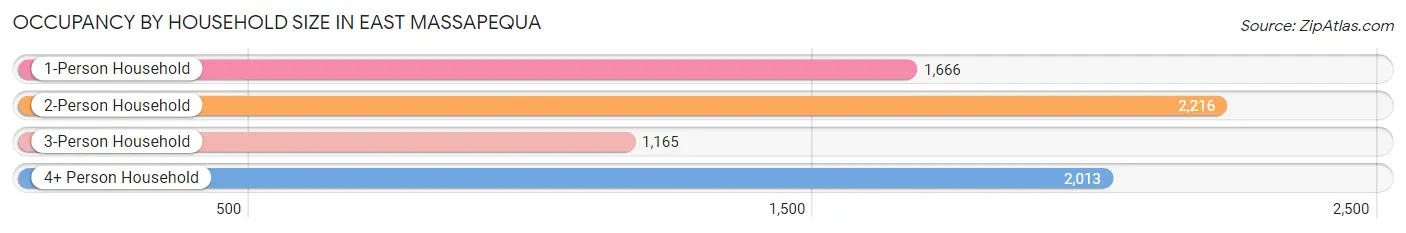
| Household Size | # Housing Units | % Housing Units |
| 1-Person Household | 1,666 | 23.6% |
| 2-Person Household | 2,216 | 31.4% |
| 3-Person Household | 1,165 | 16.5% |
| 4+ Person Household | 2,013 | 28.5% |
| Total Housing Units | 7,060 | 100.0% |
Occupancy by Ownership by Household Size in East Massapequa
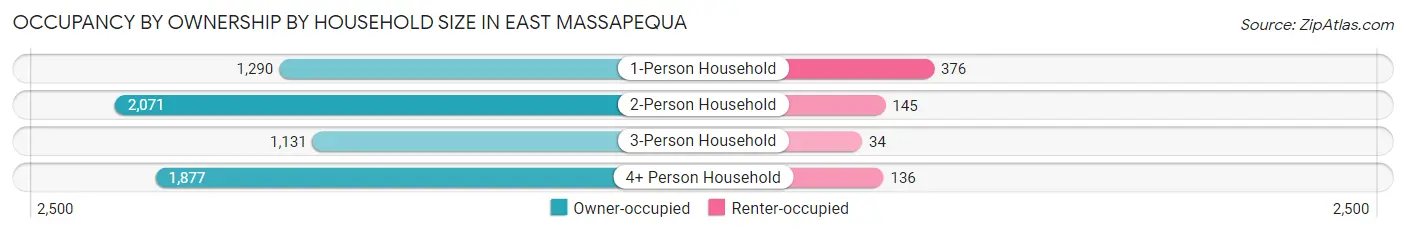
| Household Size | Owner-occupied | Renter-occupied |
| 1-Person Household | 1,290 (77.4%) | 376 (22.6%) |
| 2-Person Household | 2,071 (93.5%) | 145 (6.5%) |
| 3-Person Household | 1,131 (97.1%) | 34 (2.9%) |
| 4+ Person Household | 1,877 (93.2%) | 136 (6.8%) |
| Total Housing Units | 6,369 (90.2%) | 691 (9.8%) |
Occupancy by Educational Attainment in East Massapequa
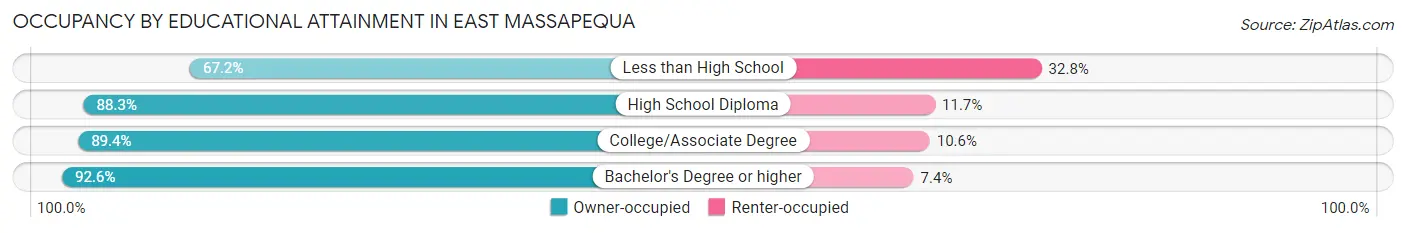
| Household Size | Owner-occupied | Renter-occupied |
| Less than High School | 86 (67.2%) | 42 (32.8%) |
| High School Diploma | 1,701 (88.3%) | 225 (11.7%) |
| College/Associate Degree | 1,454 (89.4%) | 173 (10.6%) |
| Bachelor's Degree or higher | 3,128 (92.6%) | 251 (7.4%) |
Occupancy by Age of Householder in East Massapequa
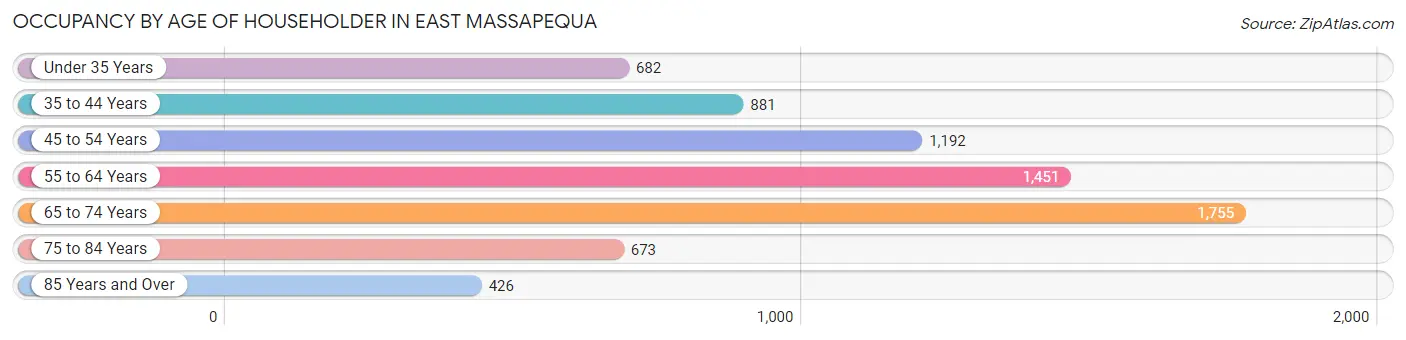
| Age Bracket | # Households | % Households |
| Under 35 Years | 682 | 9.7% |
| 35 to 44 Years | 881 | 12.5% |
| 45 to 54 Years | 1,192 | 16.9% |
| 55 to 64 Years | 1,451 | 20.5% |
| 65 to 74 Years | 1,755 | 24.9% |
| 75 to 84 Years | 673 | 9.5% |
| 85 Years and Over | 426 | 6.0% |
| Total | 7,060 | 100.0% |
Housing Finances in East Massapequa
Median Income by Occupancy in East Massapequa
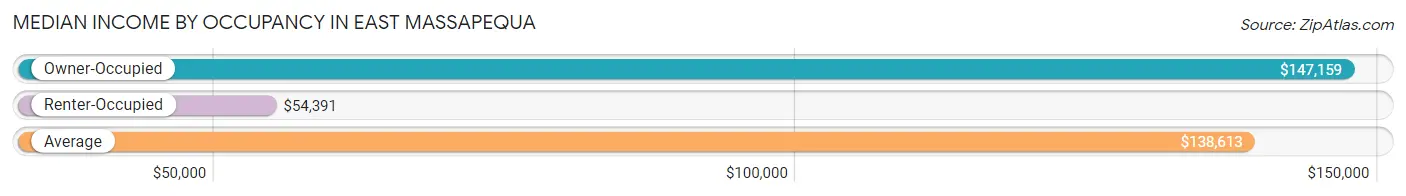
| Occupancy Type | # Households | Median Income |
| Owner-Occupied | 6,369 (90.2%) | $147,159 |
| Renter-Occupied | 691 (9.8%) | $54,391 |
| Average | 7,060 (100.0%) | $138,613 |
Occupancy by Householder Income Bracket in East Massapequa
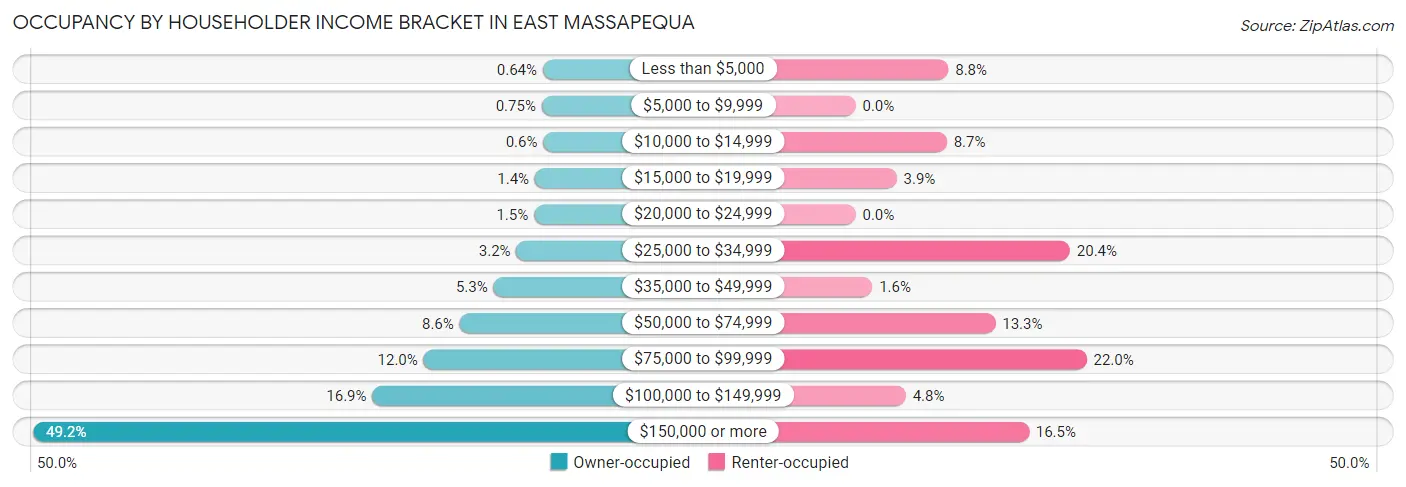
| Income Bracket | Owner-occupied | Renter-occupied |
| Less than $5,000 | 41 (0.6%) | 61 (8.8%) |
| $5,000 to $9,999 | 48 (0.7%) | 0 (0.0%) |
| $10,000 to $14,999 | 38 (0.6%) | 60 (8.7%) |
| $15,000 to $19,999 | 89 (1.4%) | 27 (3.9%) |
| $20,000 to $24,999 | 94 (1.5%) | 0 (0.0%) |
| $25,000 to $34,999 | 201 (3.2%) | 141 (20.4%) |
| $35,000 to $49,999 | 340 (5.3%) | 11 (1.6%) |
| $50,000 to $74,999 | 546 (8.6%) | 92 (13.3%) |
| $75,000 to $99,999 | 764 (12.0%) | 152 (22.0%) |
| $100,000 to $149,999 | 1,075 (16.9%) | 33 (4.8%) |
| $150,000 or more | 3,133 (49.2%) | 114 (16.5%) |
| Total | 6,369 (100.0%) | 691 (100.0%) |
Monthly Housing Cost Tiers in East Massapequa
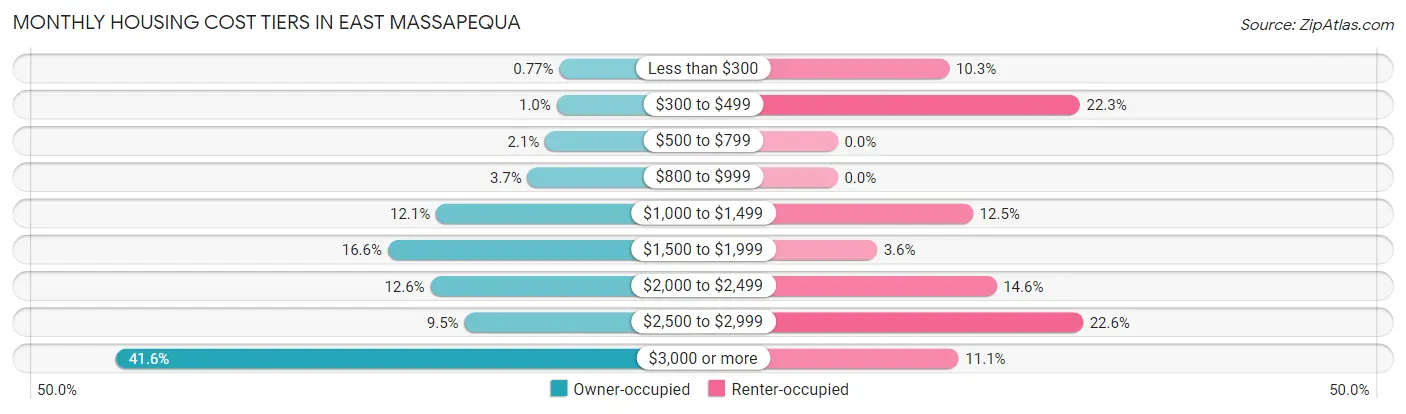
| Monthly Cost | Owner-occupied | Renter-occupied |
| Less than $300 | 49 (0.8%) | 71 (10.3%) |
| $300 to $499 | 65 (1.0%) | 154 (22.3%) |
| $500 to $799 | 133 (2.1%) | 0 (0.0%) |
| $800 to $999 | 235 (3.7%) | 0 (0.0%) |
| $1,000 to $1,499 | 772 (12.1%) | 86 (12.4%) |
| $1,500 to $1,999 | 1,055 (16.6%) | 25 (3.6%) |
| $2,000 to $2,499 | 805 (12.6%) | 101 (14.6%) |
| $2,500 to $2,999 | 606 (9.5%) | 156 (22.6%) |
| $3,000 or more | 2,649 (41.6%) | 77 (11.1%) |
| Total | 6,369 (100.0%) | 691 (100.0%) |
Physical Housing Characteristics in East Massapequa
Housing Structures in East Massapequa
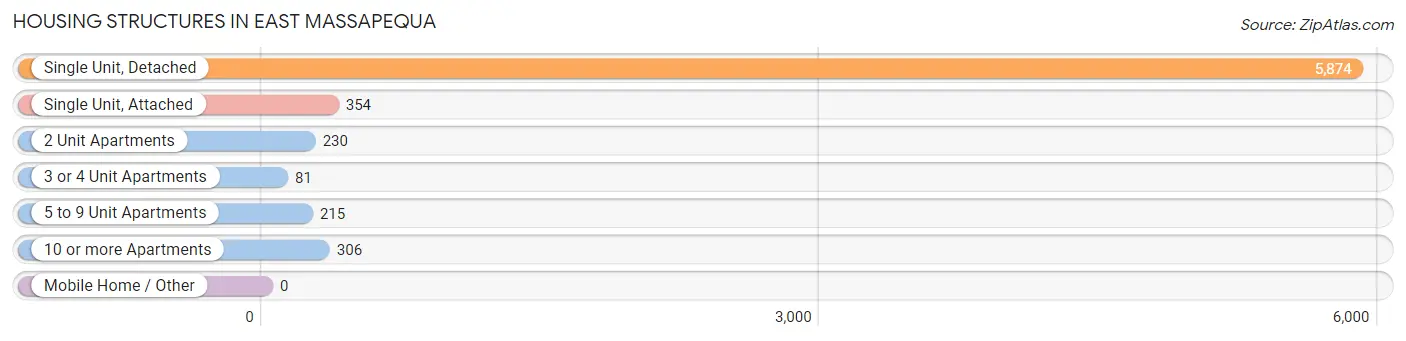
| Structure Type | # Housing Units | % Housing Units |
| Single Unit, Detached | 5,874 | 83.2% |
| Single Unit, Attached | 354 | 5.0% |
| 2 Unit Apartments | 230 | 3.3% |
| 3 or 4 Unit Apartments | 81 | 1.1% |
| 5 to 9 Unit Apartments | 215 | 3.0% |
| 10 or more Apartments | 306 | 4.3% |
| Mobile Home / Other | 0 | 0.0% |
| Total | 7,060 | 100.0% |
Housing Structures by Occupancy in East Massapequa
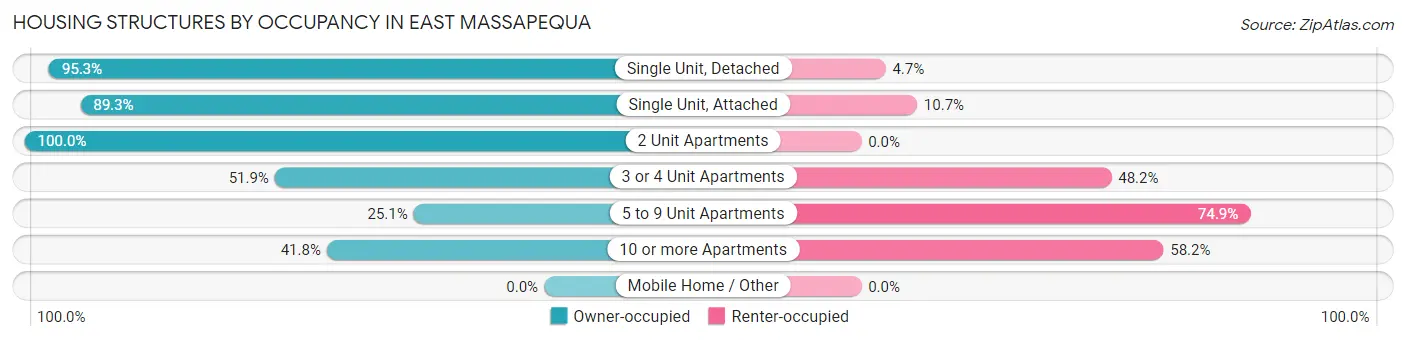
| Structure Type | Owner-occupied | Renter-occupied |
| Single Unit, Detached | 5,599 (95.3%) | 275 (4.7%) |
| Single Unit, Attached | 316 (89.3%) | 38 (10.7%) |
| 2 Unit Apartments | 230 (100.0%) | 0 (0.0%) |
| 3 or 4 Unit Apartments | 42 (51.8%) | 39 (48.1%) |
| 5 to 9 Unit Apartments | 54 (25.1%) | 161 (74.9%) |
| 10 or more Apartments | 128 (41.8%) | 178 (58.2%) |
| Mobile Home / Other | 0 (0.0%) | 0 (0.0%) |
| Total | 6,369 (90.2%) | 691 (9.8%) |
Housing Structures by Number of Rooms in East Massapequa
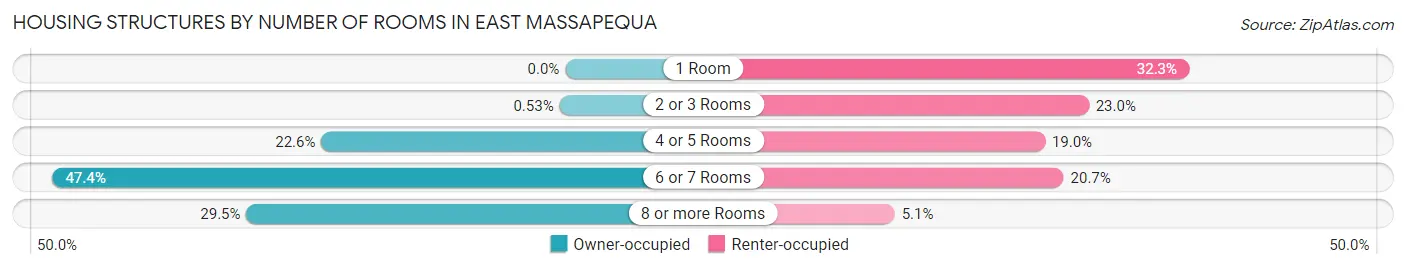
| Number of Rooms | Owner-occupied | Renter-occupied |
| 1 Room | 0 (0.0%) | 223 (32.3%) |
| 2 or 3 Rooms | 34 (0.5%) | 159 (23.0%) |
| 4 or 5 Rooms | 1,437 (22.6%) | 131 (19.0%) |
| 6 or 7 Rooms | 3,020 (47.4%) | 143 (20.7%) |
| 8 or more Rooms | 1,878 (29.5%) | 35 (5.1%) |
| Total | 6,369 (100.0%) | 691 (100.0%) |
Housing Structure by Heating Type in East Massapequa
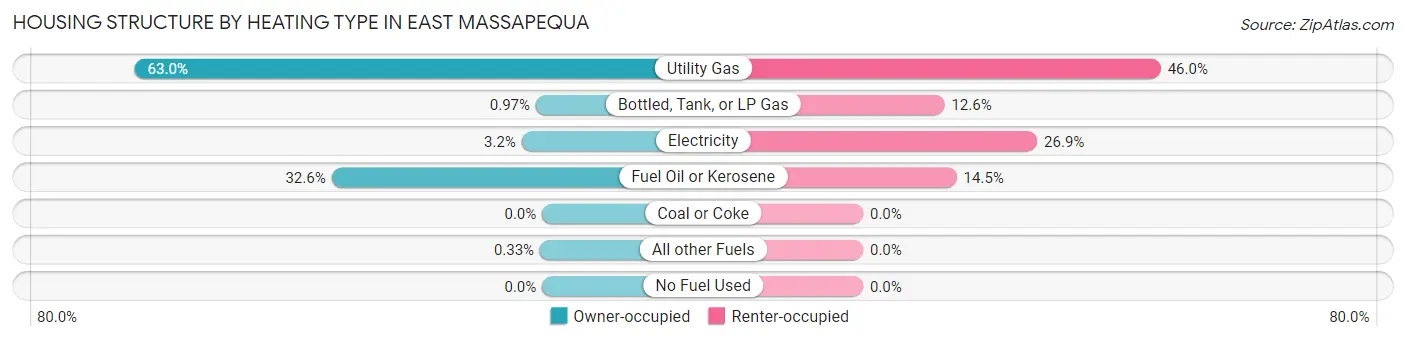
| Heating Type | Owner-occupied | Renter-occupied |
| Utility Gas | 4,011 (63.0%) | 318 (46.0%) |
| Bottled, Tank, or LP Gas | 62 (1.0%) | 87 (12.6%) |
| Electricity | 201 (3.2%) | 186 (26.9%) |
| Fuel Oil or Kerosene | 2,074 (32.6%) | 100 (14.5%) |
| Coal or Coke | 0 (0.0%) | 0 (0.0%) |
| All other Fuels | 21 (0.3%) | 0 (0.0%) |
| No Fuel Used | 0 (0.0%) | 0 (0.0%) |
| Total | 6,369 (100.0%) | 691 (100.0%) |
Household Vehicle Usage in East Massapequa
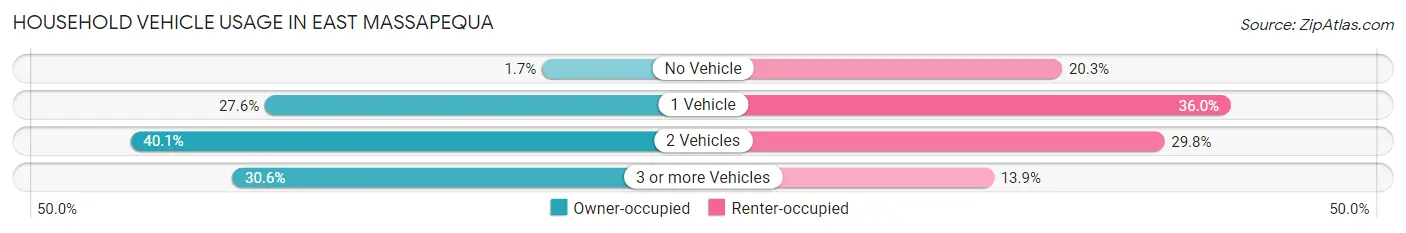
| Vehicles per Household | Owner-occupied | Renter-occupied |
| No Vehicle | 108 (1.7%) | 140 (20.3%) |
| 1 Vehicle | 1,755 (27.6%) | 249 (36.0%) |
| 2 Vehicles | 2,555 (40.1%) | 206 (29.8%) |
| 3 or more Vehicles | 1,951 (30.6%) | 96 (13.9%) |
| Total | 6,369 (100.0%) | 691 (100.0%) |
Real Estate & Mortgages in East Massapequa
Real Estate and Mortgage Overview in East Massapequa
| Characteristic | Without Mortgage | With Mortgage |
| Housing Units | 2,810 | 3,559 |
| Median Property Value | $548,300 | $584,100 |
| Median Household Income | $95,600 | $2,171 |
| Monthly Housing Costs | $1,501 | $2,547 |
| Real Estate Taxes | $10,001 | $51 |
Property Value by Mortgage Status in East Massapequa
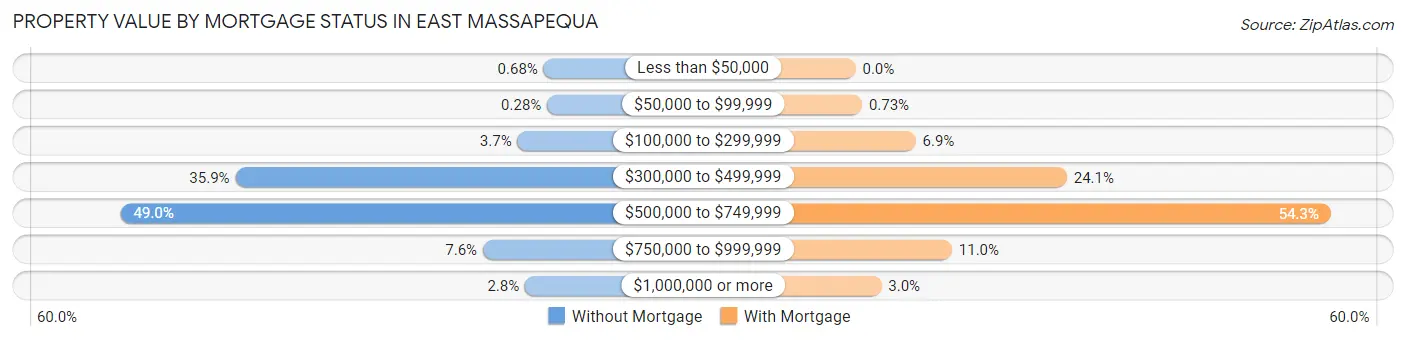
| Property Value | Without Mortgage | With Mortgage |
| Less than $50,000 | 19 (0.7%) | 0 (0.0%) |
| $50,000 to $99,999 | 8 (0.3%) | 26 (0.7%) |
| $100,000 to $299,999 | 103 (3.7%) | 244 (6.9%) |
| $300,000 to $499,999 | 1,009 (35.9%) | 859 (24.1%) |
| $500,000 to $749,999 | 1,378 (49.0%) | 1,933 (54.3%) |
| $750,000 to $999,999 | 214 (7.6%) | 392 (11.0%) |
| $1,000,000 or more | 79 (2.8%) | 105 (2.9%) |
| Total | 2,810 (100.0%) | 3,559 (100.0%) |
Household Income by Mortgage Status in East Massapequa
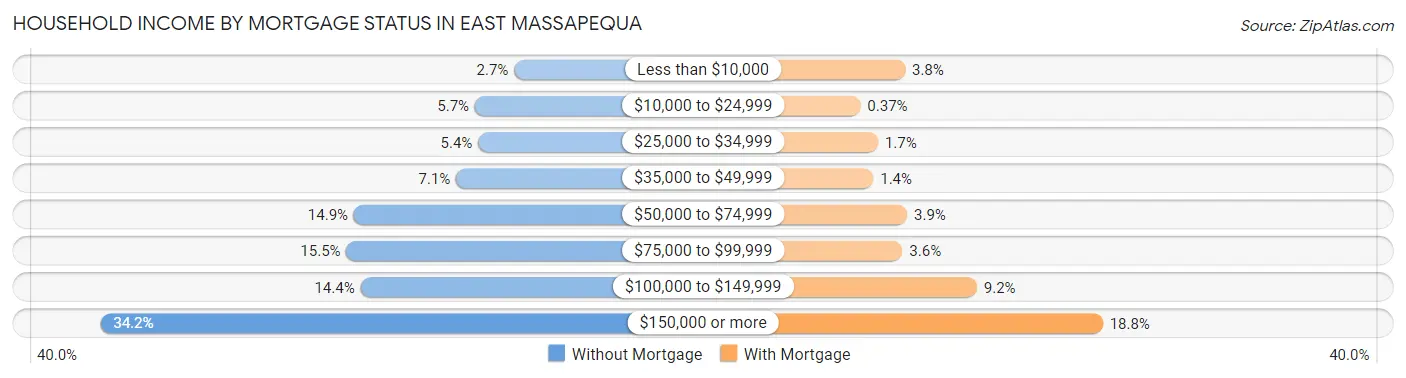
| Household Income | Without Mortgage | With Mortgage |
| Less than $10,000 | 76 (2.7%) | 134 (3.8%) |
| $10,000 to $24,999 | 160 (5.7%) | 13 (0.4%) |
| $25,000 to $34,999 | 153 (5.4%) | 61 (1.7%) |
| $35,000 to $49,999 | 200 (7.1%) | 48 (1.3%) |
| $50,000 to $74,999 | 419 (14.9%) | 140 (3.9%) |
| $75,000 to $99,999 | 435 (15.5%) | 127 (3.6%) |
| $100,000 to $149,999 | 405 (14.4%) | 329 (9.2%) |
| $150,000 or more | 962 (34.2%) | 670 (18.8%) |
| Total | 2,810 (100.0%) | 3,559 (100.0%) |
Property Value to Household Income Ratio in East Massapequa
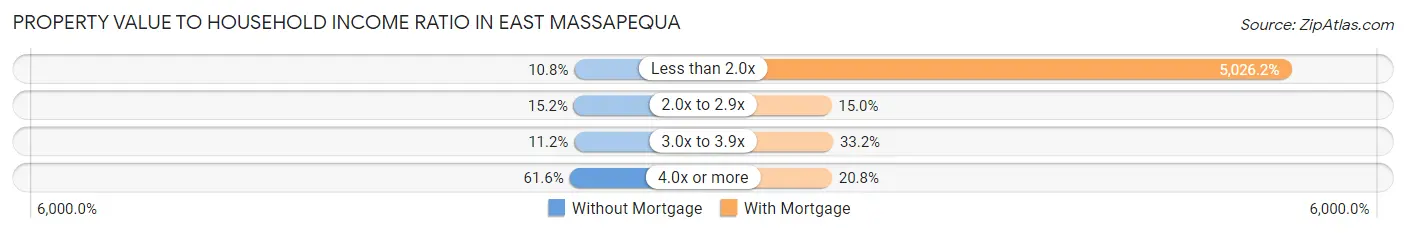
| Value-to-Income Ratio | Without Mortgage | With Mortgage |
| Less than 2.0x | 304 (10.8%) | 178,883 (5,026.2%) |
| 2.0x to 2.9x | 428 (15.2%) | 534 (15.0%) |
| 3.0x to 3.9x | 314 (11.2%) | 1,180 (33.2%) |
| 4.0x or more | 1,732 (61.6%) | 741 (20.8%) |
| Total | 2,810 (100.0%) | 3,559 (100.0%) |
Real Estate Taxes by Mortgage Status in East Massapequa
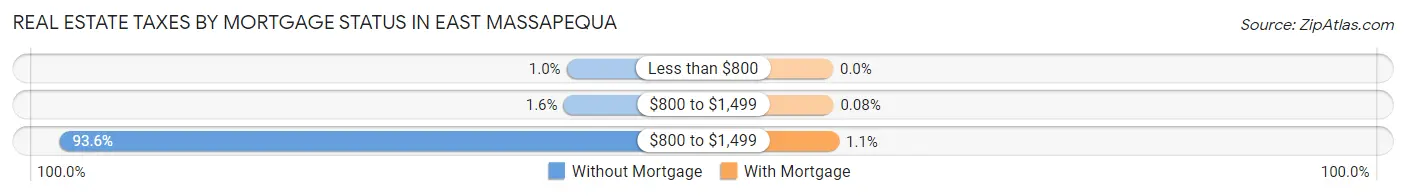
| Property Taxes | Without Mortgage | With Mortgage |
| Less than $800 | 29 (1.0%) | 0 (0.0%) |
| $800 to $1,499 | 45 (1.6%) | 3 (0.1%) |
| $800 to $1,499 | 2,630 (93.6%) | 39 (1.1%) |
| Total | 2,810 (100.0%) | 3,559 (100.0%) |
Health & Disability in East Massapequa
Health Insurance Coverage by Age in East Massapequa
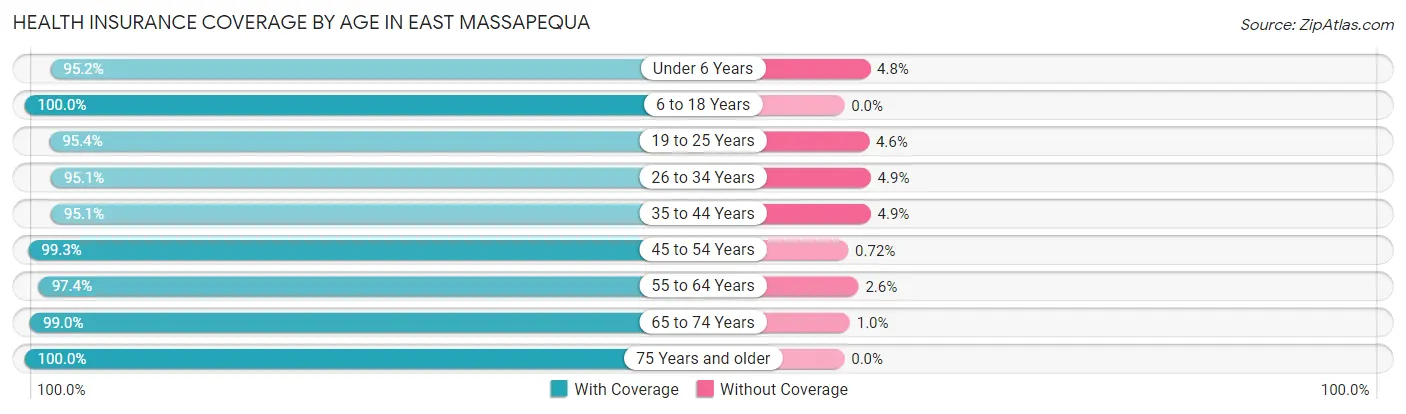
| Age Bracket | With Coverage | Without Coverage |
| Under 6 Years | 1,127 (95.2%) | 57 (4.8%) |
| 6 to 18 Years | 2,623 (100.0%) | 0 (0.0%) |
| 19 to 25 Years | 1,287 (95.4%) | 62 (4.6%) |
| 26 to 34 Years | 1,875 (95.1%) | 97 (4.9%) |
| 35 to 44 Years | 2,211 (95.1%) | 114 (4.9%) |
| 45 to 54 Years | 2,488 (99.3%) | 18 (0.7%) |
| 55 to 64 Years | 2,691 (97.4%) | 73 (2.6%) |
| 65 to 74 Years | 2,906 (99.0%) | 30 (1.0%) |
| 75 Years and older | 1,717 (100.0%) | 0 (0.0%) |
| Total | 18,925 (97.7%) | 451 (2.3%) |
Health Insurance Coverage by Citizenship Status in East Massapequa
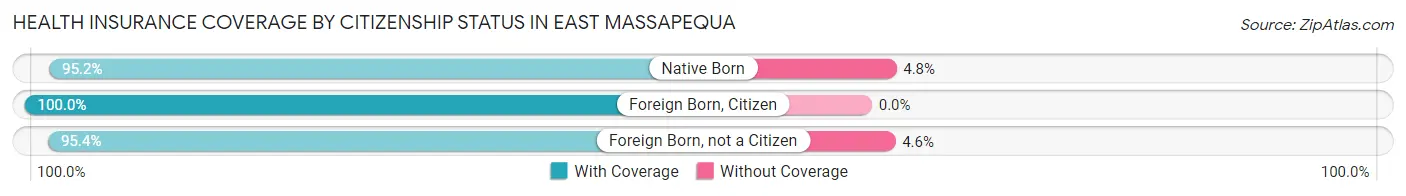
| Citizenship Status | With Coverage | Without Coverage |
| Native Born | 1,127 (95.2%) | 57 (4.8%) |
| Foreign Born, Citizen | 2,623 (100.0%) | 0 (0.0%) |
| Foreign Born, not a Citizen | 1,287 (95.4%) | 62 (4.6%) |
Health Insurance Coverage by Household Income in East Massapequa
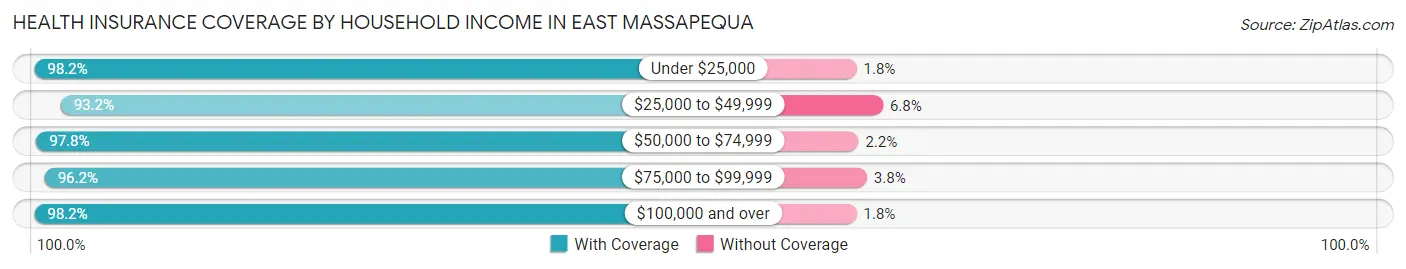
| Household Income | With Coverage | Without Coverage |
| Under $25,000 | 753 (98.2%) | 14 (1.8%) |
| $25,000 to $49,999 | 990 (93.2%) | 72 (6.8%) |
| $50,000 to $74,999 | 1,289 (97.8%) | 29 (2.2%) |
| $75,000 to $99,999 | 1,912 (96.2%) | 75 (3.8%) |
| $100,000 and over | 13,916 (98.2%) | 259 (1.8%) |
Public vs Private Health Insurance Coverage by Age in East Massapequa
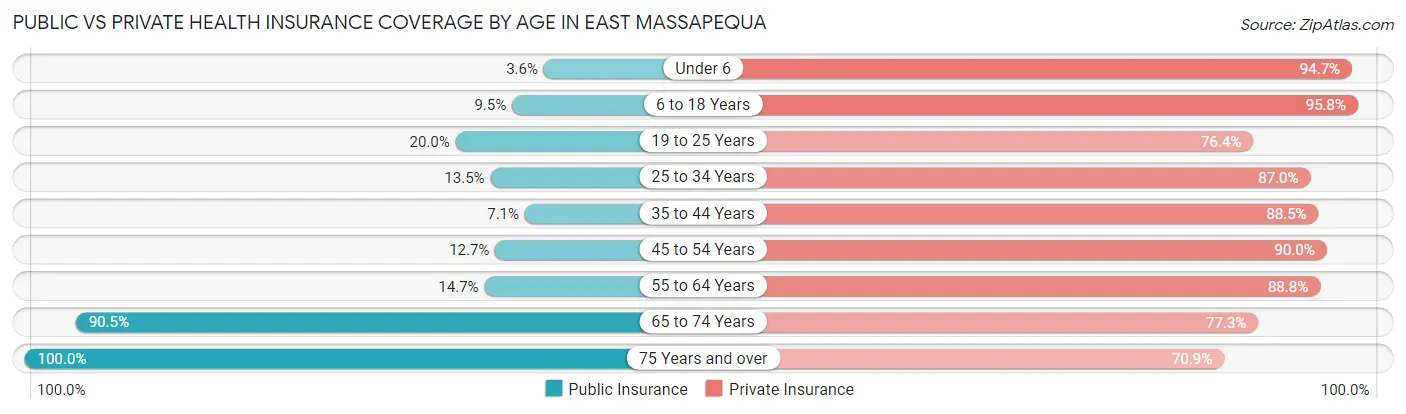
| Age Bracket | Public Insurance | Private Insurance |
| Under 6 | 43 (3.6%) | 1,121 (94.7%) |
| 6 to 18 Years | 250 (9.5%) | 2,512 (95.8%) |
| 19 to 25 Years | 270 (20.0%) | 1,030 (76.3%) |
| 25 to 34 Years | 267 (13.5%) | 1,715 (87.0%) |
| 35 to 44 Years | 166 (7.1%) | 2,057 (88.5%) |
| 45 to 54 Years | 317 (12.7%) | 2,255 (90.0%) |
| 55 to 64 Years | 405 (14.6%) | 2,453 (88.7%) |
| 65 to 74 Years | 2,657 (90.5%) | 2,269 (77.3%) |
| 75 Years and over | 1,717 (100.0%) | 1,218 (70.9%) |
| Total | 6,092 (31.4%) | 16,630 (85.8%) |
Disability Status by Sex by Age in East Massapequa
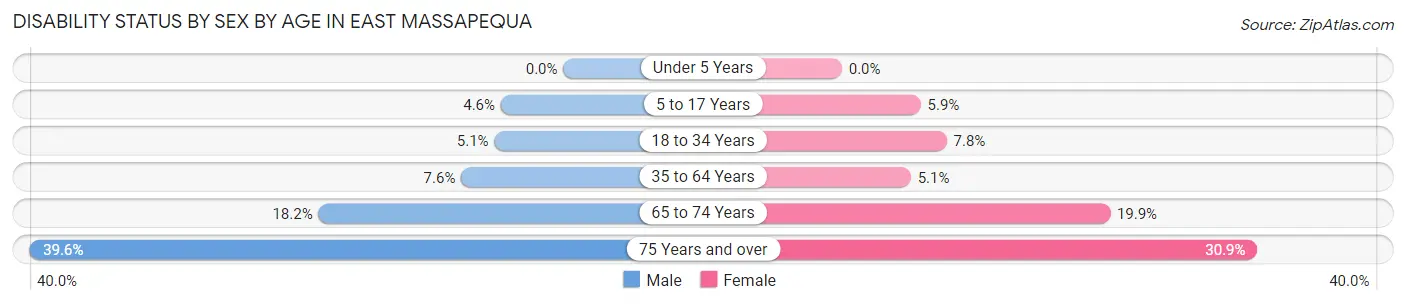
| Age Bracket | Male | Female |
| Under 5 Years | 0 (0.0%) | 0 (0.0%) |
| 5 to 17 Years | 69 (4.6%) | 60 (5.9%) |
| 18 to 34 Years | 88 (5.1%) | 144 (7.8%) |
| 35 to 64 Years | 300 (7.6%) | 186 (5.1%) |
| 65 to 74 Years | 248 (18.2%) | 313 (19.9%) |
| 75 Years and over | 287 (39.6%) | 306 (30.8%) |
Disability Class by Sex by Age in East Massapequa
Disability Class: Hearing Difficulty
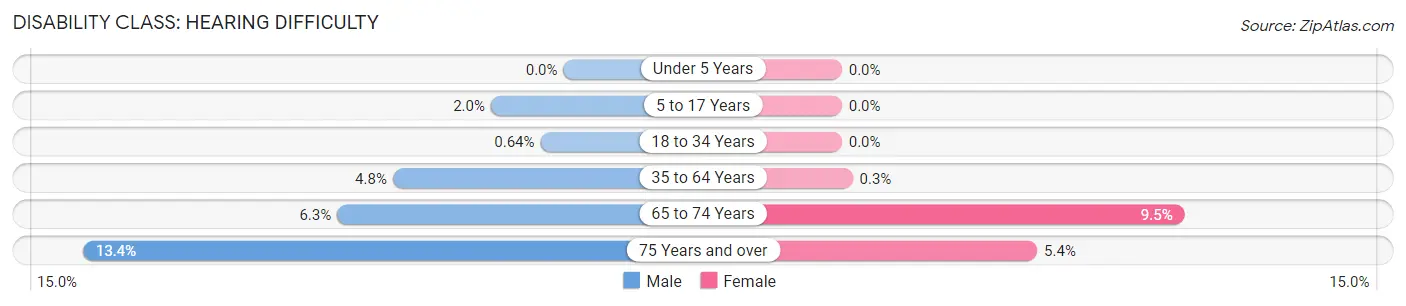
| Age Bracket | Male | Female |
| Under 5 Years | 0 (0.0%) | 0 (0.0%) |
| 5 to 17 Years | 30 (2.0%) | 0 (0.0%) |
| 18 to 34 Years | 11 (0.6%) | 0 (0.0%) |
| 35 to 64 Years | 188 (4.8%) | 11 (0.3%) |
| 65 to 74 Years | 86 (6.3%) | 150 (9.5%) |
| 75 Years and over | 97 (13.4%) | 54 (5.4%) |
Disability Class: Vision Difficulty
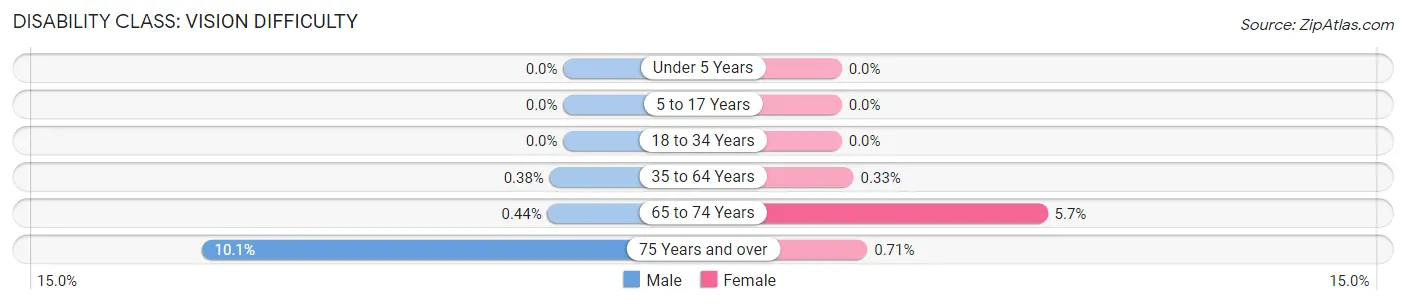
| Age Bracket | Male | Female |
| Under 5 Years | 0 (0.0%) | 0 (0.0%) |
| 5 to 17 Years | 0 (0.0%) | 0 (0.0%) |
| 18 to 34 Years | 0 (0.0%) | 0 (0.0%) |
| 35 to 64 Years | 15 (0.4%) | 12 (0.3%) |
| 65 to 74 Years | 6 (0.4%) | 90 (5.7%) |
| 75 Years and over | 73 (10.1%) | 7 (0.7%) |
Disability Class: Cognitive Difficulty
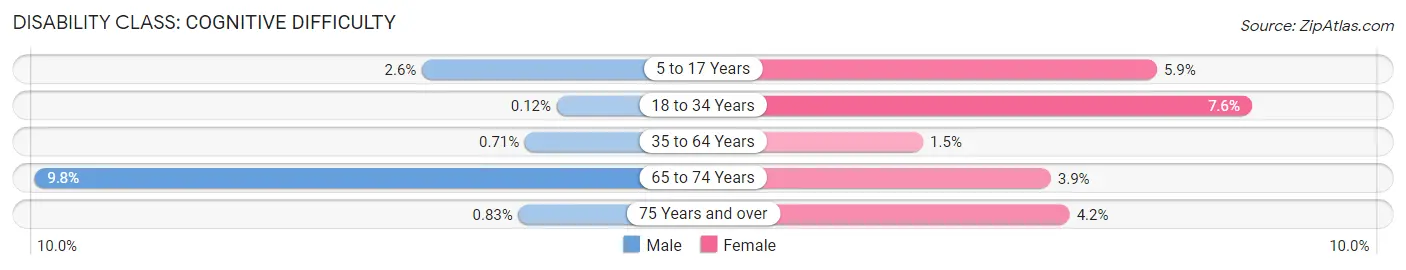
| Age Bracket | Male | Female |
| 5 to 17 Years | 39 (2.6%) | 60 (5.9%) |
| 18 to 34 Years | 2 (0.1%) | 141 (7.6%) |
| 35 to 64 Years | 28 (0.7%) | 55 (1.5%) |
| 65 to 74 Years | 134 (9.8%) | 61 (3.9%) |
| 75 Years and over | 6 (0.8%) | 42 (4.2%) |
Disability Class: Ambulatory Difficulty
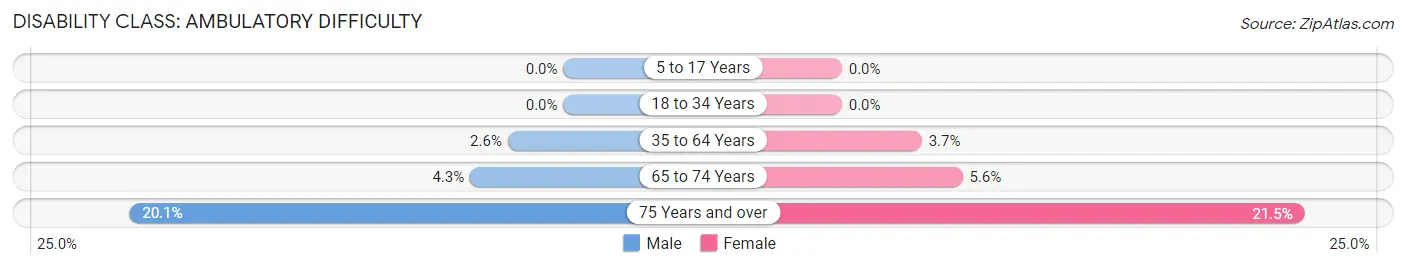
| Age Bracket | Male | Female |
| 5 to 17 Years | 0 (0.0%) | 0 (0.0%) |
| 18 to 34 Years | 0 (0.0%) | 0 (0.0%) |
| 35 to 64 Years | 102 (2.6%) | 135 (3.7%) |
| 65 to 74 Years | 59 (4.3%) | 88 (5.6%) |
| 75 Years and over | 146 (20.1%) | 213 (21.5%) |
Disability Class: Self-Care Difficulty
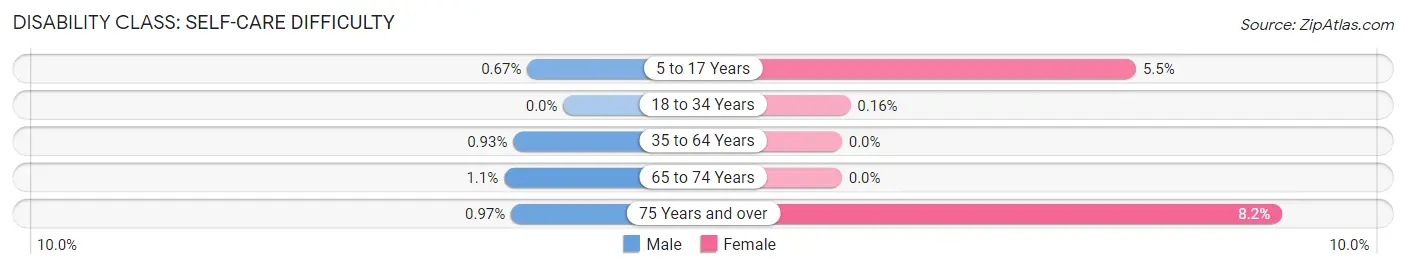
| Age Bracket | Male | Female |
| 5 to 17 Years | 10 (0.7%) | 56 (5.5%) |
| 18 to 34 Years | 0 (0.0%) | 3 (0.2%) |
| 35 to 64 Years | 37 (0.9%) | 0 (0.0%) |
| 65 to 74 Years | 15 (1.1%) | 0 (0.0%) |
| 75 Years and over | 7 (1.0%) | 81 (8.2%) |
Technology Access in East Massapequa
Computing Device Access in East Massapequa
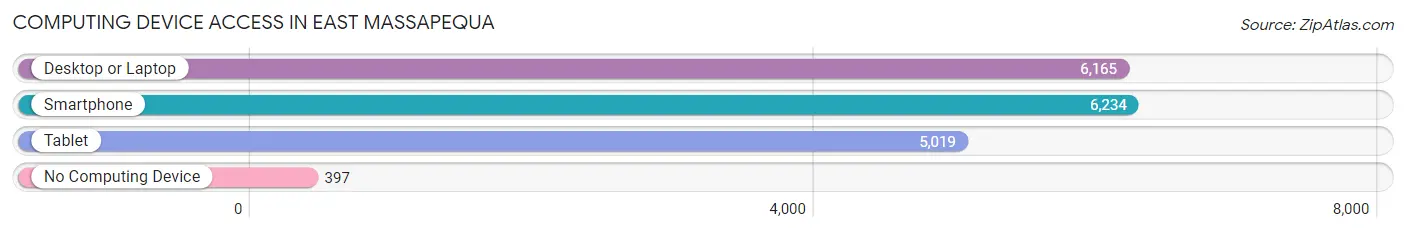
| Device Type | # Households | % Households |
| Desktop or Laptop | 6,165 | 87.3% |
| Smartphone | 6,234 | 88.3% |
| Tablet | 5,019 | 71.1% |
| No Computing Device | 397 | 5.6% |
| Total | 7,060 | 100.0% |
Internet Access in East Massapequa
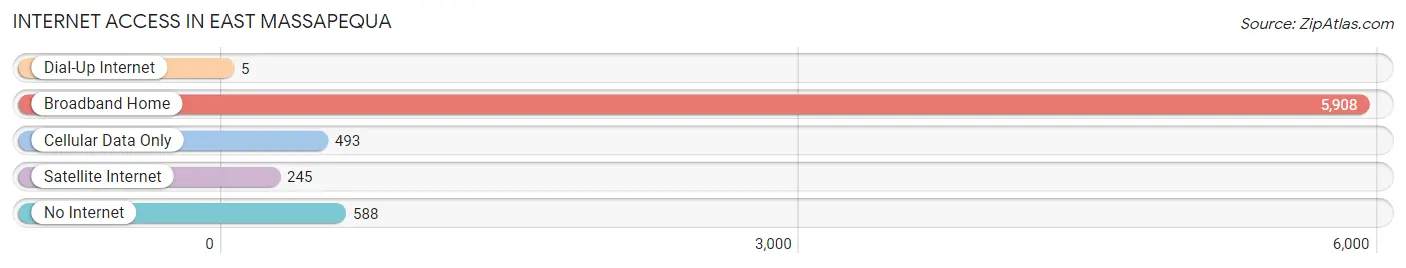
| Internet Type | # Households | % Households |
| Dial-Up Internet | 5 | 0.1% |
| Broadband Home | 5,908 | 83.7% |
| Cellular Data Only | 493 | 7.0% |
| Satellite Internet | 245 | 3.5% |
| No Internet | 588 | 8.3% |
| Total | 7,060 | 100.0% |
East Massapequa Summary
Massapequa is a hamlet and census-designated place (CDP) located in Nassau County, New York, United States. It is located within the Town of Oyster Bay. As of the 2010 census, the CDP had a population of 21,685.
History
The area now known as Massapequa was originally inhabited by the Massapequa Indians, a branch of the Meroke tribe. The name Massapequa is derived from the Native American word for “great water.” The area was first settled by Europeans in the mid-17th century. The first settlers were Dutch, followed by English and German immigrants.
In the late 19th century, the area was developed as a farming community. The first post office was established in 1867. In the early 20th century, the area began to be developed as a residential community. The first school was built in 1910.
Geography
Massapequa is located at 40°39′N 73°27′W (40.65, -73.45). According to the United States Census Bureau, the CDP has a total area of 5.2 square miles (13.4 km2), of which 5.1 square miles (13.2 km2) is land and 0.1 square miles (0.2 km2) (1.90%) is water.
Economy
The economy of Massapequa is largely based on retail and services. The area is home to several shopping centers, including the Sunrise Mall, the Massapequa Mall, and the Broadway Mall. There are also several restaurants, banks, and other businesses located in the area.
Demographics
As of the 2010 census, there were 21,685 people, 7,845 households, and 5,845 families residing in the CDP. The population density was 4,241.3 people per square mile (1,633.2/km2). There were 8,093 housing units at an average density of 1,590.3 per square mile (614.2/km2). The racial makeup of the CDP was 87.2% White, 2.3% African American, 0.2% Native American, 5.7% Asian, 0.1% Pacific Islander, 1.7% from other races, and 3.0% from two or more races. Hispanic or Latino of any race were 8.2% of the population.
There were 7,845 households, out of which 33.2% had children under the age of 18 living with them, 57.2% were married couples living together, 10.7% had a female householder with no husband present, and 28.2% were non-families. 22.7% of all households were made up of individuals, and 10.2% had someone living alone who was 65 years of age or older. The average household size was 2.75 and the average family size was 3.26.
In the CDP, the population was spread out, with 24.2% under the age of 18, 6.7% from 18 to 24, 28.2% from 25 to 44, 25.2% from 45 to 64, and 15.7% who were 65 years of age or older. The median age was 39 years. For every 100 females, there were 93.2 males. For every 100 females age 18 and over, there were 90.2 males.
The median income for a household in the CDP was $76,845, and the median income for a family was $87,845. Males had a median income of $55,000 versus $41,000 for females. The per capita income for the CDP was $31,845. About 2.7% of families and 3.7% of the population were below the poverty line, including 4.2% of those under age 18 and 4.2% of those age 65 or over.
Common Questions
What is Per Capita Income in East Massapequa?
Per Capita income in East Massapequa is $63,995.
What is the Median Family Income in East Massapequa?
Median Family Income in East Massapequa is $171,912.
What is the Median Household income in East Massapequa?
Median Household Income in East Massapequa is $138,613.
What is Income or Wage Gap in East Massapequa?
Income or Wage Gap in East Massapequa is 32.6%.
Women in East Massapequa earn 67.4 cents for every dollar earned by a man.
What is Inequality or Gini Index in East Massapequa?
Inequality or Gini Index in East Massapequa is 0.44.
What is the Total Population of East Massapequa?
Total Population of East Massapequa is 19,508.
What is the Total Male Population of East Massapequa?
Total Male Population of East Massapequa is 9,830.
What is the Total Female Population of East Massapequa?
Total Female Population of East Massapequa is 9,678.
What is the Ratio of Males per 100 Females in East Massapequa?
There are 101.57 Males per 100 Females in East Massapequa.
What is the Ratio of Females per 100 Males in East Massapequa?
There are 98.45 Females per 100 Males in East Massapequa.
What is the Median Population Age in East Massapequa?
Median Population Age in East Massapequa is 45.9 Years.
What is the Average Family Size in East Massapequa
Average Family Size in East Massapequa is 3.3 People.
What is the Average Household Size in East Massapequa
Average Household Size in East Massapequa is 2.7 People.
How Large is the Labor Force in East Massapequa?
There are 10,598 People in the Labor Forcein in East Massapequa.
What is the Percentage of People in the Labor Force in East Massapequa?
64.3% of People are in the Labor Force in East Massapequa.
What is the Unemployment Rate in East Massapequa?
Unemployment Rate in East Massapequa is 4.9%.