Galeville, NY Map & Demographics
Galeville Map
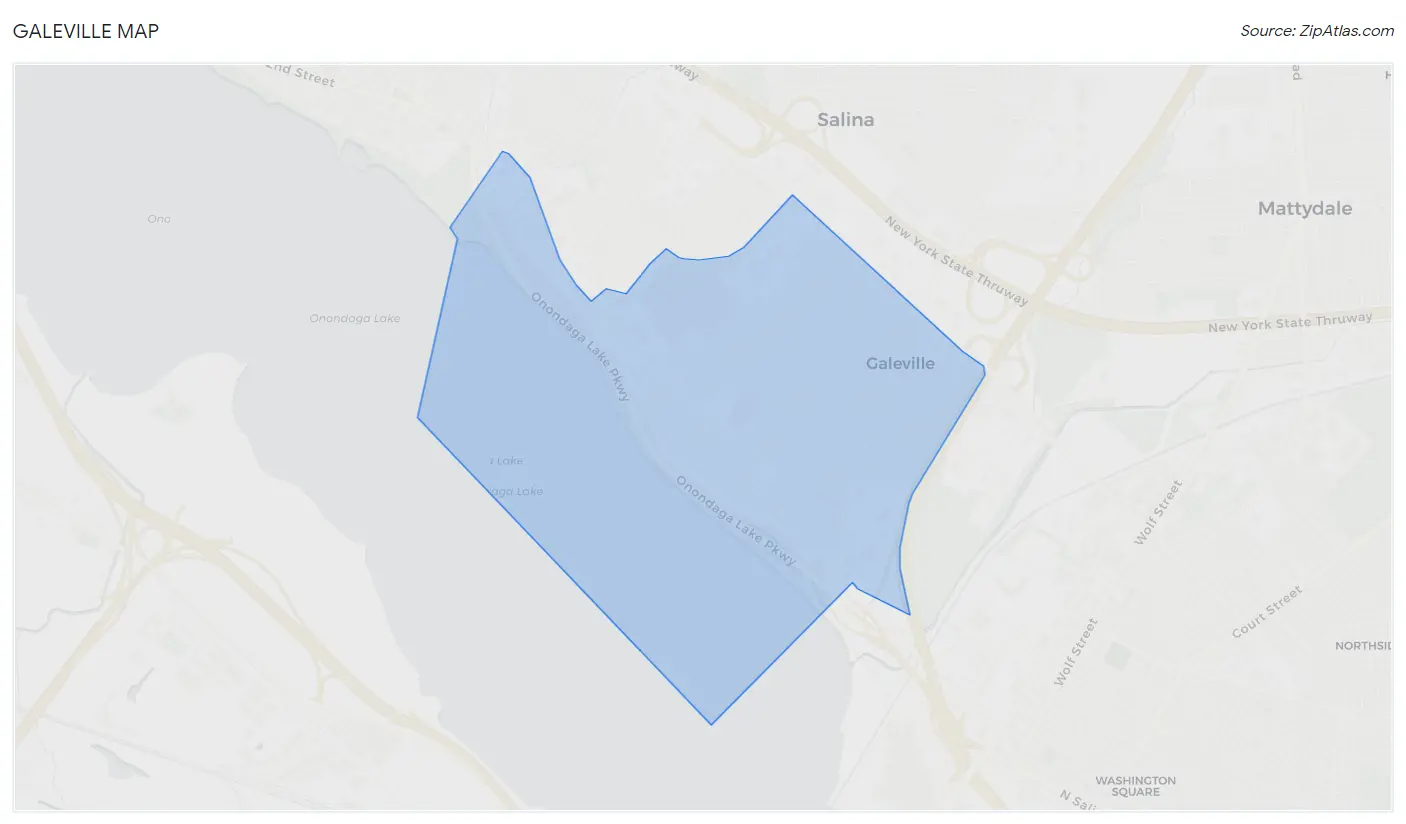
Galeville Overview
$33,030
PER CAPITA INCOME
$74,552
AVG FAMILY INCOME
$71,415
AVG HOUSEHOLD INCOME
5.0%
WAGE / INCOME GAP [ % ]
95.0¢/ $1
WAGE / INCOME GAP [ $ ]
0.31
INEQUALITY / GINI INDEX
4,591
TOTAL POPULATION
2,080
MALE POPULATION
2,511
FEMALE POPULATION
82.84
MALES / 100 FEMALES
120.72
FEMALES / 100 MALES
44.1
MEDIAN AGE
3.2
AVG FAMILY SIZE
2.3
AVG HOUSEHOLD SIZE
2,156
LABOR FORCE [ PEOPLE ]
55.3%
PERCENT IN LABOR FORCE
10.0%
UNEMPLOYMENT RATE
Income in Galeville
Income Overview in Galeville
Per Capita Income in Galeville is $33,030, while median incomes of families and households are $74,552 and $71,415 respectively.
| Characteristic | Number | Measure |
| Per Capita Income | 4,591 | $33,030 |
| Median Family Income | 957 | $74,552 |
| Mean Family Income | 957 | $84,503 |
| Median Household Income | 1,995 | $71,415 |
| Mean Household Income | 1,995 | $72,098 |
| Income Deficit | 957 | $0 |
| Wage / Income Gap (%) | 4,591 | 5.02% |
| Wage / Income Gap ($) | 4,591 | 94.98¢ per $1 |
| Gini / Inequality Index | 4,591 | 0.31 |
Earnings by Sex in Galeville
Average Earnings in Galeville are $43,271, $44,792 for men and $42,544 for women, a difference of 5.0%.
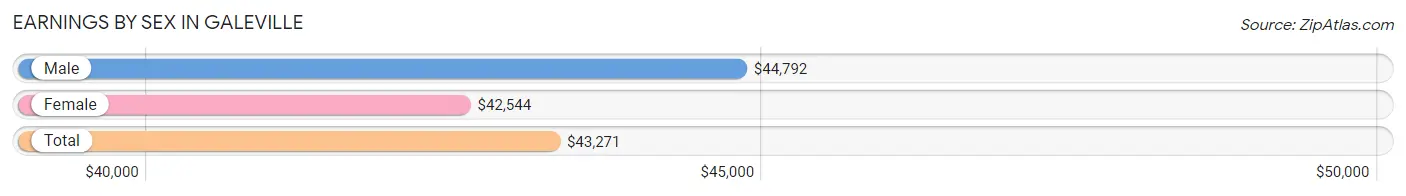
| Sex | Number | Average Earnings |
| Male | 993 (43.8%) | $44,792 |
| Female | 1,276 (56.2%) | $42,544 |
| Total | 2,269 (100.0%) | $43,271 |
Earnings by Sex by Income Bracket in Galeville
The most common earnings brackets in Galeville are $75,000 to $99,999 for men (297 | 29.9%) and $40,000 to $44,999 for women (157 | 12.3%).
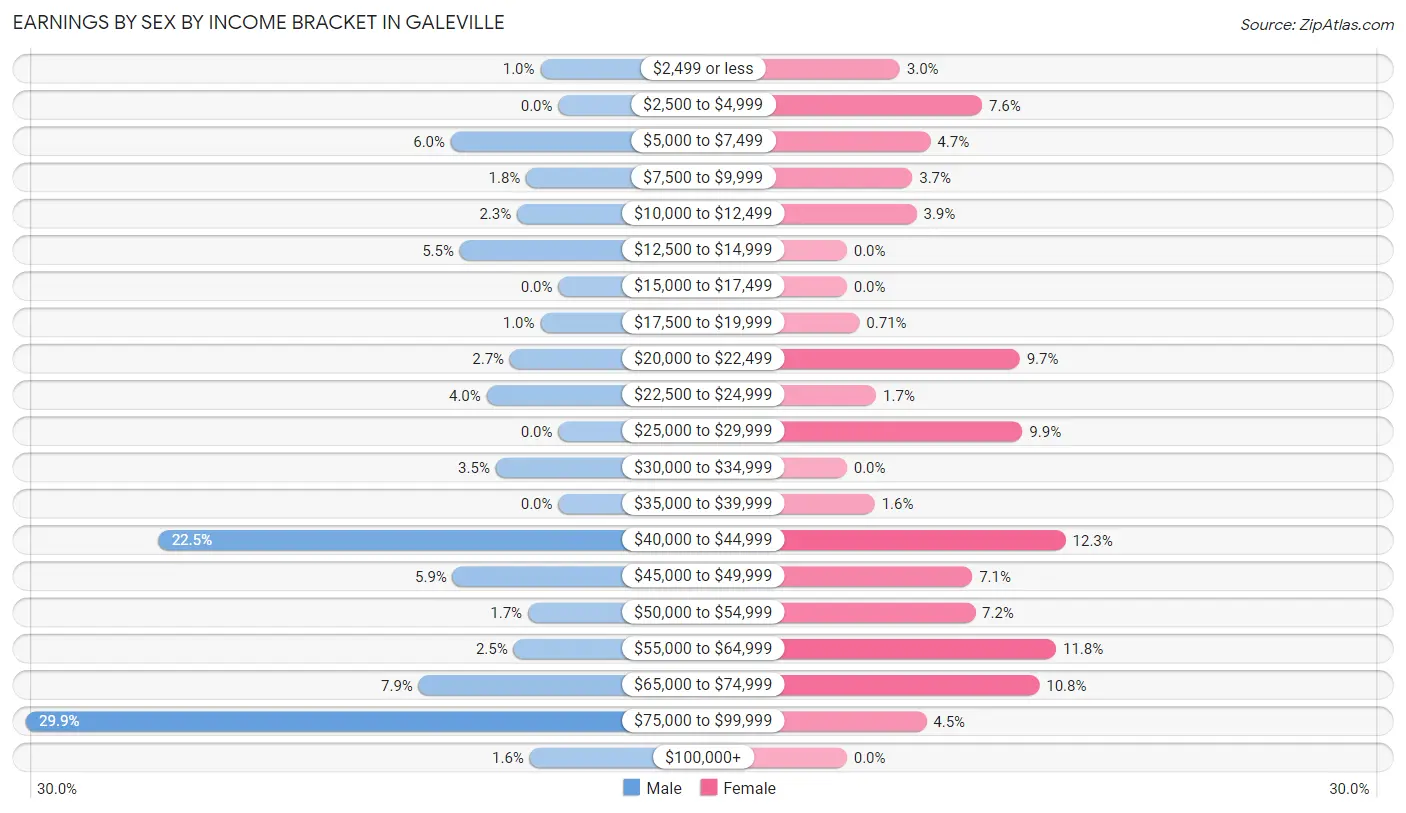
| Income | Male | Female |
| $2,499 or less | 10 (1.0%) | 38 (3.0%) |
| $2,500 to $4,999 | 0 (0.0%) | 97 (7.6%) |
| $5,000 to $7,499 | 60 (6.0%) | 60 (4.7%) |
| $7,500 to $9,999 | 18 (1.8%) | 47 (3.7%) |
| $10,000 to $12,499 | 23 (2.3%) | 50 (3.9%) |
| $12,500 to $14,999 | 55 (5.5%) | 0 (0.0%) |
| $15,000 to $17,499 | 0 (0.0%) | 0 (0.0%) |
| $17,500 to $19,999 | 10 (1.0%) | 9 (0.7%) |
| $20,000 to $22,499 | 27 (2.7%) | 124 (9.7%) |
| $22,500 to $24,999 | 40 (4.0%) | 21 (1.7%) |
| $25,000 to $29,999 | 0 (0.0%) | 126 (9.9%) |
| $30,000 to $34,999 | 35 (3.5%) | 0 (0.0%) |
| $35,000 to $39,999 | 0 (0.0%) | 20 (1.6%) |
| $40,000 to $44,999 | 223 (22.5%) | 157 (12.3%) |
| $45,000 to $49,999 | 59 (5.9%) | 90 (7.0%) |
| $50,000 to $54,999 | 17 (1.7%) | 92 (7.2%) |
| $55,000 to $64,999 | 25 (2.5%) | 150 (11.8%) |
| $65,000 to $74,999 | 78 (7.9%) | 138 (10.8%) |
| $75,000 to $99,999 | 297 (29.9%) | 57 (4.5%) |
| $100,000+ | 16 (1.6%) | 0 (0.0%) |
| Total | 993 (100.0%) | 1,276 (100.0%) |
Earnings by Sex by Educational Attainment in Galeville
Average earnings in Galeville are $47,924 for men and $45,111 for women, a difference of 5.9%. Men with an educational attainment of bachelor's degree enjoy the highest average annual earnings of $64,750, while those with high school diploma education earn the least with $40,526. Women with an educational attainment of bachelor's degree earn the most with the average annual earnings of $67,879, while those with high school diploma education have the smallest earnings of $21,744.
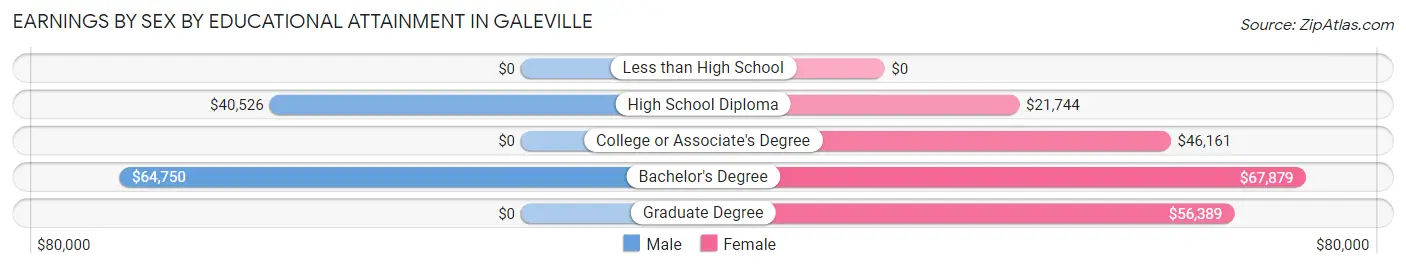
| Educational Attainment | Male Income | Female Income |
| Less than High School | - | - |
| High School Diploma | $40,526 | $21,744 |
| College or Associate's Degree | - | - |
| Bachelor's Degree | $64,750 | $67,879 |
| Graduate Degree | - | - |
| Total | $47,924 | $45,111 |
Family Income in Galeville
Family Income Brackets in Galeville
According to the Galeville family income data, there are 306 families falling into the $50,000 to $74,999 income range, which is the most common income bracket and makes up 32.0% of all families.
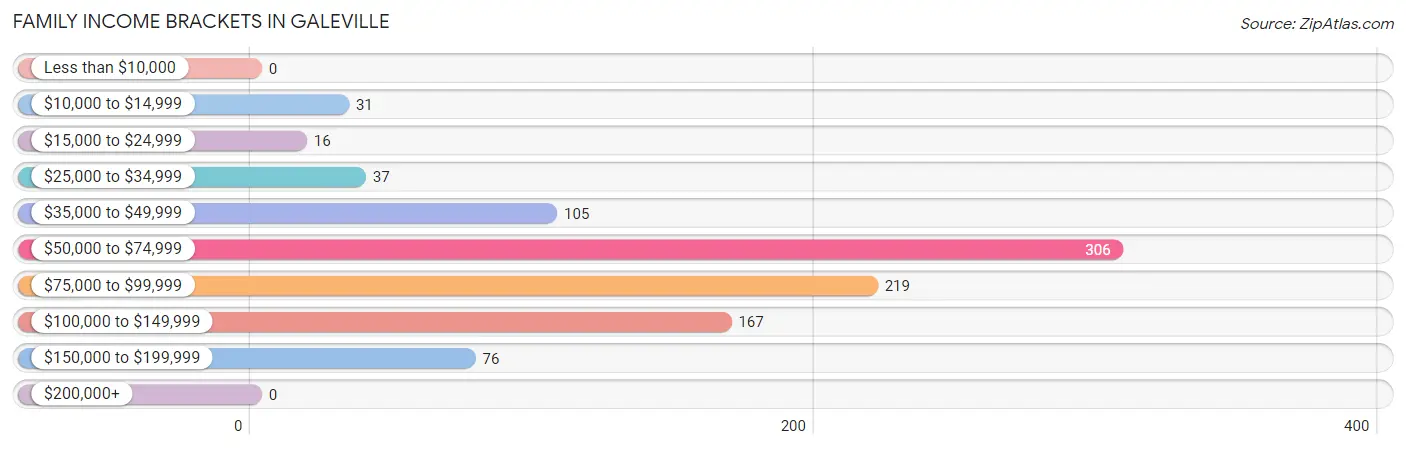
| Income Bracket | # Families | % Families |
| Less than $10,000 | 0 | 0.0% |
| $10,000 to $14,999 | 31 | 3.2% |
| $15,000 to $24,999 | 16 | 1.7% |
| $25,000 to $34,999 | 37 | 3.9% |
| $35,000 to $49,999 | 105 | 11.0% |
| $50,000 to $74,999 | 306 | 32.0% |
| $75,000 to $99,999 | 219 | 22.9% |
| $100,000 to $149,999 | 167 | 17.5% |
| $150,000 to $199,999 | 76 | 7.9% |
| $200,000+ | 0 | 0.0% |
Family Income by Famaliy Size in Galeville
4-person families (134 | 14.0%) account for the highest median family income in Galeville with $109,107 per family, while 2-person families (606 | 63.3%) have the highest median income of $34,936 per family member.
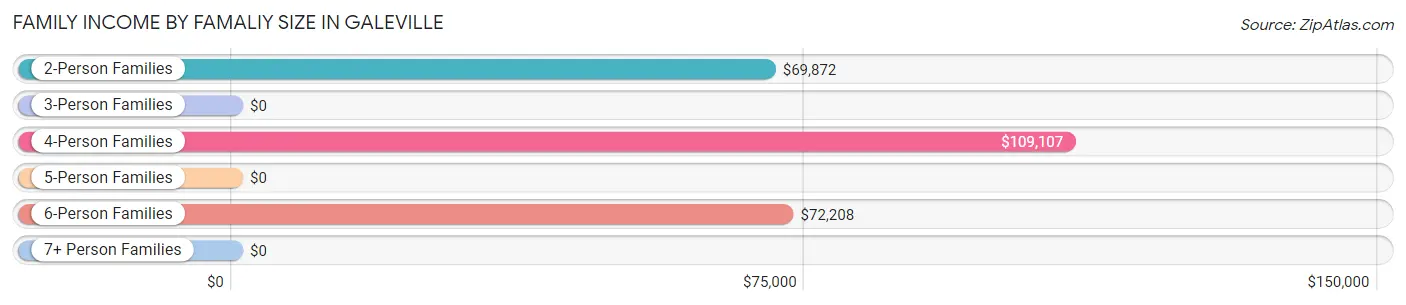
| Income Bracket | # Families | Median Income |
| 2-Person Families | 606 (63.3%) | $69,872 |
| 3-Person Families | 50 (5.2%) | $0 |
| 4-Person Families | 134 (14.0%) | $109,107 |
| 5-Person Families | 66 (6.9%) | $0 |
| 6-Person Families | 101 (10.5%) | $72,208 |
| 7+ Person Families | 0 (0.0%) | $0 |
| Total | 957 (100.0%) | $74,552 |
Family Income by Number of Earners in Galeville
The median family income in Galeville is $74,552, with families comprising 3+ earners (116) having the highest median family income of $141,667, while families with no earners (119) have the lowest median family income of $43,988, accounting for 12.1% and 12.4% of families, respectively.
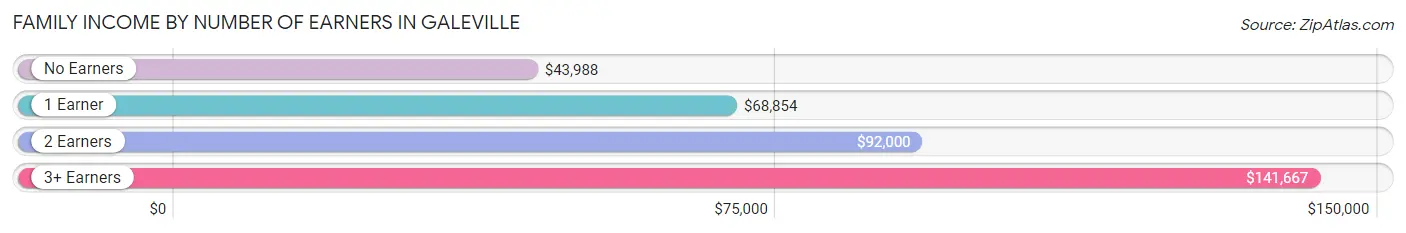
| Number of Earners | # Families | Median Income |
| No Earners | 119 (12.4%) | $43,988 |
| 1 Earner | 450 (47.0%) | $68,854 |
| 2 Earners | 272 (28.4%) | $92,000 |
| 3+ Earners | 116 (12.1%) | $141,667 |
| Total | 957 (100.0%) | $74,552 |
Household Income in Galeville
Household Income Brackets in Galeville
With 646 households falling in the category, the $50,000 to $74,999 income range is the most frequent in Galeville, accounting for 32.4% of all households.
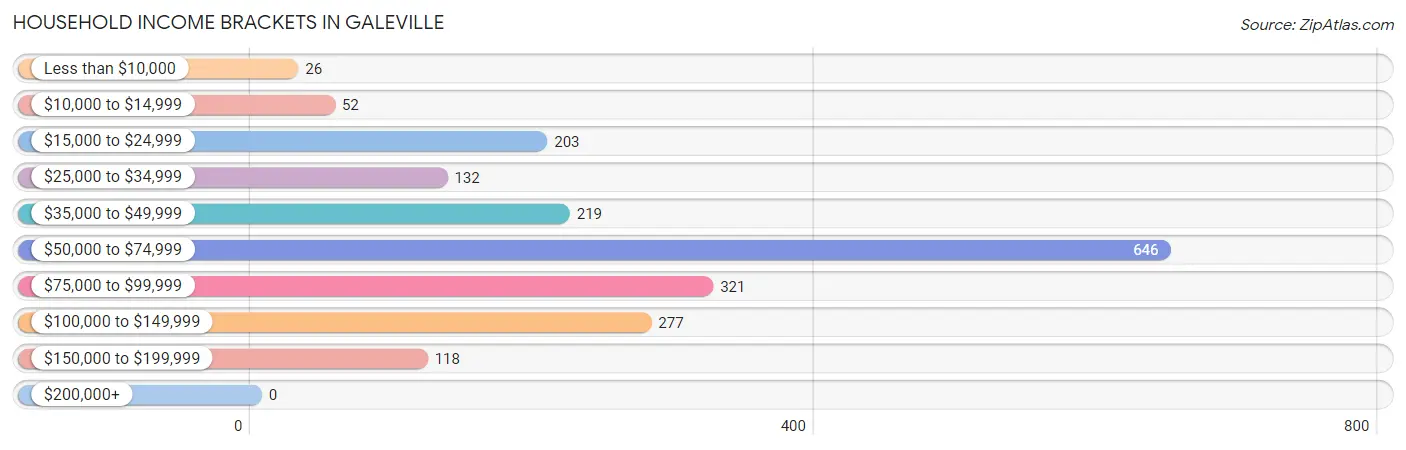
| Income Bracket | # Households | % Households |
| Less than $10,000 | 26 | 1.3% |
| $10,000 to $14,999 | 52 | 2.6% |
| $15,000 to $24,999 | 203 | 10.2% |
| $25,000 to $34,999 | 132 | 6.6% |
| $35,000 to $49,999 | 219 | 11.0% |
| $50,000 to $74,999 | 646 | 32.4% |
| $75,000 to $99,999 | 321 | 16.1% |
| $100,000 to $149,999 | 277 | 13.9% |
| $150,000 to $199,999 | 118 | 5.9% |
| $200,000+ | 0 | 0.0% |
Household Income by Householder Age in Galeville
The median household income in Galeville is $71,415, with the highest median household income of $74,353 found in the 45 to 64 years age bracket for the primary householder. A total of 649 households (32.5%) fall into this category. Meanwhile, the 15 to 24 years age bracket for the primary householder has the lowest median household income of $28,354, with 78 households (3.9%) in this group.
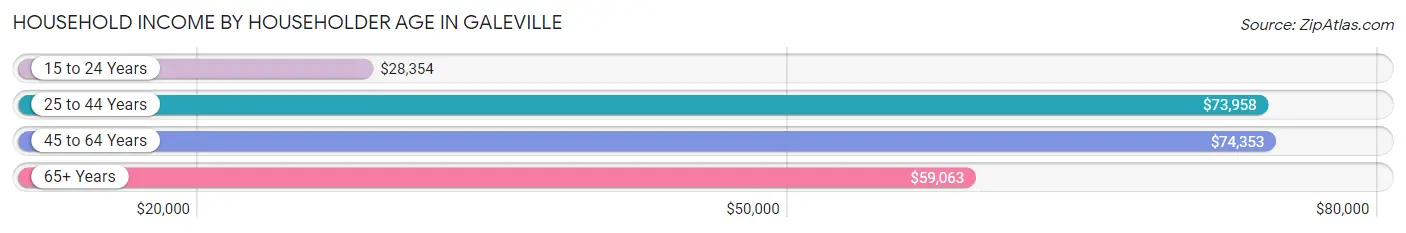
| Income Bracket | # Households | Median Income |
| 15 to 24 Years | 78 (3.9%) | $28,354 |
| 25 to 44 Years | 517 (25.9%) | $73,958 |
| 45 to 64 Years | 649 (32.5%) | $74,353 |
| 65+ Years | 751 (37.6%) | $59,063 |
| Total | 1,995 (100.0%) | $71,415 |
Poverty in Galeville
Income Below Poverty by Sex and Age in Galeville
With 7.8% poverty level for males and 3.3% for females among the residents of Galeville, 18 to 24 year old males and 75 year old and over females are the most vulnerable to poverty, with 39 males (42.4%) and 27 females (9.9%) in their respective age groups living below the poverty level.
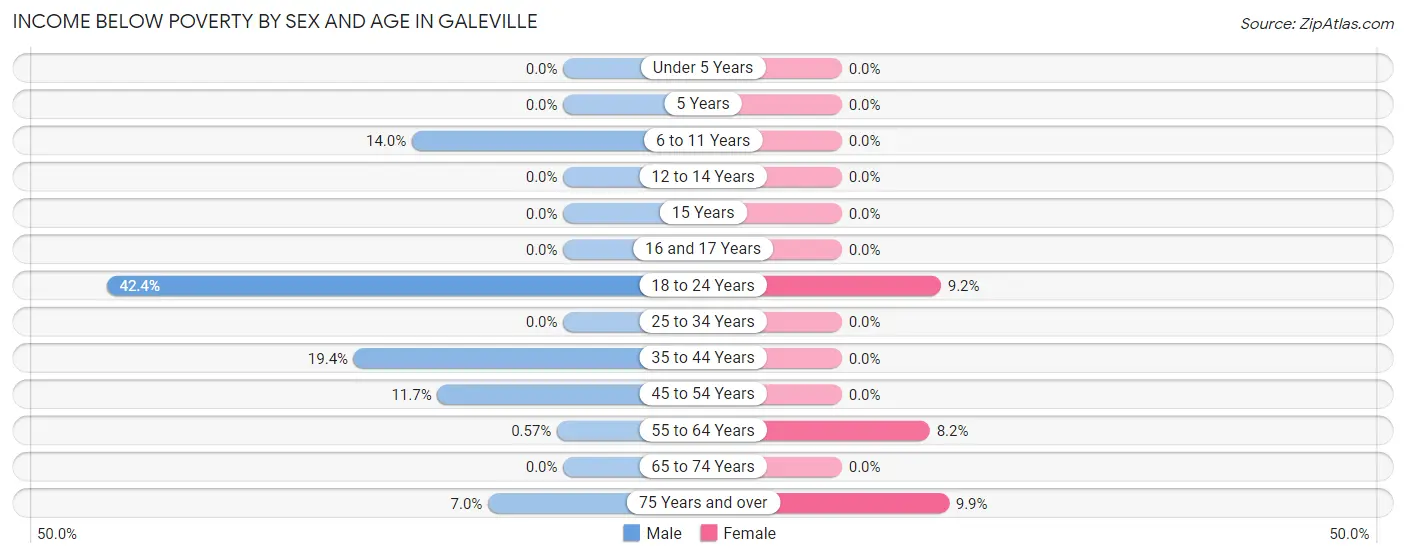
| Age Bracket | Male | Female |
| Under 5 Years | 0 (0.0%) | 0 (0.0%) |
| 5 Years | 0 (0.0%) | 0 (0.0%) |
| 6 to 11 Years | 16 (14.0%) | 0 (0.0%) |
| 12 to 14 Years | 0 (0.0%) | 0 (0.0%) |
| 15 Years | 0 (0.0%) | 0 (0.0%) |
| 16 and 17 Years | 0 (0.0%) | 0 (0.0%) |
| 18 to 24 Years | 39 (42.4%) | 25 (9.2%) |
| 25 to 34 Years | 0 (0.0%) | 0 (0.0%) |
| 35 to 44 Years | 62 (19.4%) | 0 (0.0%) |
| 45 to 54 Years | 34 (11.7%) | 0 (0.0%) |
| 55 to 64 Years | 2 (0.6%) | 31 (8.2%) |
| 65 to 74 Years | 0 (0.0%) | 0 (0.0%) |
| 75 Years and over | 9 (7.0%) | 27 (9.9%) |
| Total | 162 (7.8%) | 83 (3.3%) |
Income Above Poverty by Sex and Age in Galeville
According to the poverty statistics in Galeville, males aged under 5 years and females aged under 5 years are the age groups that are most secure financially, with 100.0% of males and 100.0% of females in these age groups living above the poverty line.
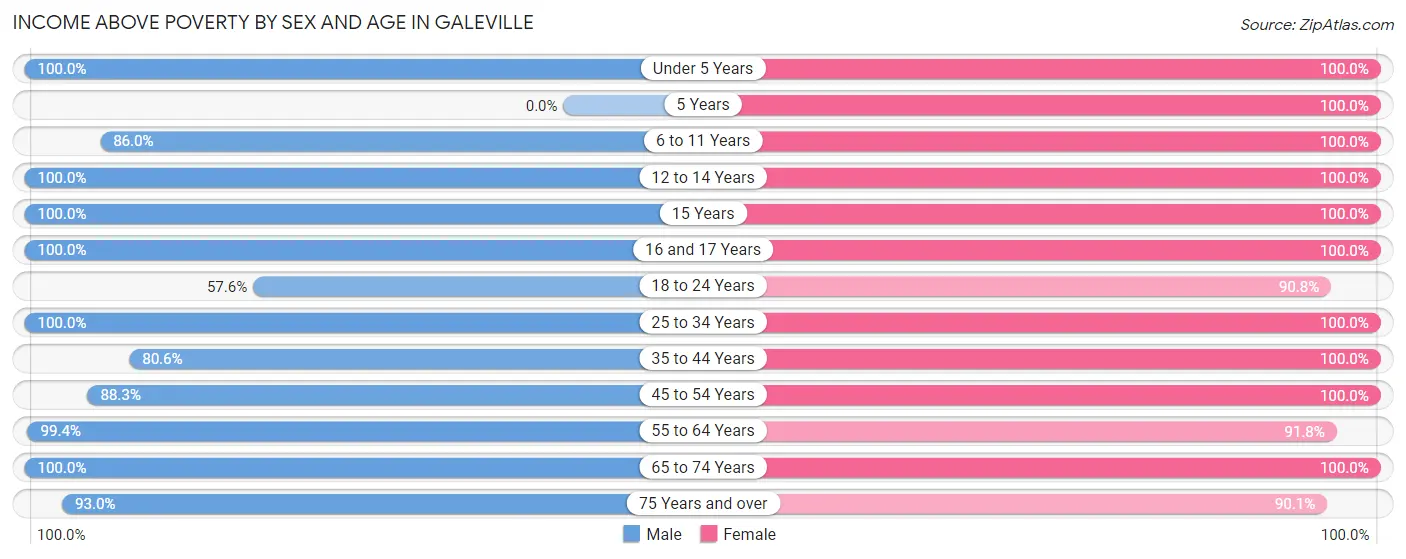
| Age Bracket | Male | Female |
| Under 5 Years | 56 (100.0%) | 147 (100.0%) |
| 5 Years | 0 (0.0%) | 28 (100.0%) |
| 6 to 11 Years | 98 (86.0%) | 81 (100.0%) |
| 12 to 14 Years | 72 (100.0%) | 82 (100.0%) |
| 15 Years | 42 (100.0%) | 70 (100.0%) |
| 16 and 17 Years | 128 (100.0%) | 31 (100.0%) |
| 18 to 24 Years | 53 (57.6%) | 247 (90.8%) |
| 25 to 34 Years | 270 (100.0%) | 237 (100.0%) |
| 35 to 44 Years | 257 (80.6%) | 284 (100.0%) |
| 45 to 54 Years | 257 (88.3%) | 203 (100.0%) |
| 55 to 64 Years | 348 (99.4%) | 349 (91.8%) |
| 65 to 74 Years | 217 (100.0%) | 424 (100.0%) |
| 75 Years and over | 120 (93.0%) | 245 (90.1%) |
| Total | 1,918 (92.2%) | 2,428 (96.7%) |
Income Below Poverty Among Married-Couple Families in Galeville
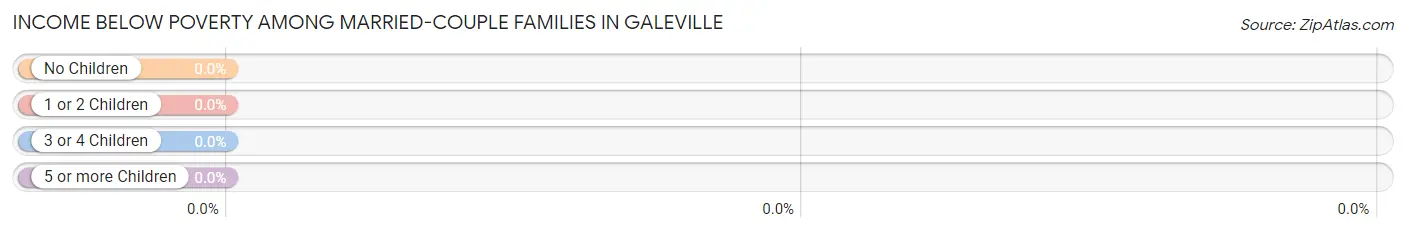
| Children | Above Poverty | Below Poverty |
| No Children | 418 (100.0%) | 0 (0.0%) |
| 1 or 2 Children | 121 (100.0%) | 0 (0.0%) |
| 3 or 4 Children | 91 (100.0%) | 0 (0.0%) |
| 5 or more Children | 0 (0.0%) | 0 (0.0%) |
| Total | 630 (100.0%) | 0 (0.0%) |
Income Below Poverty Among Single-Parent Households in Galeville
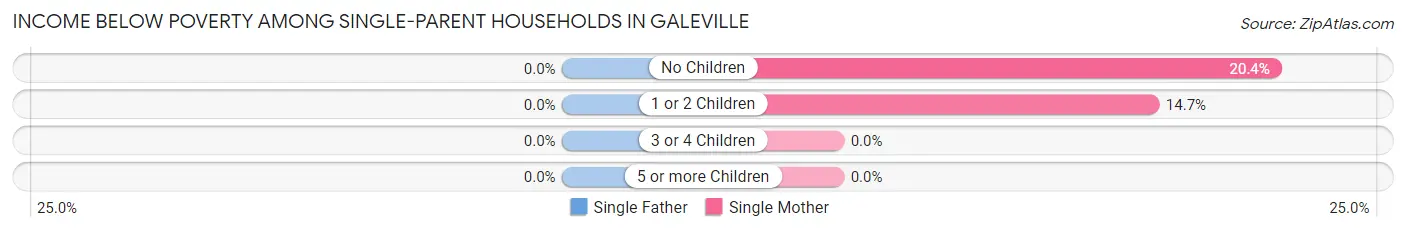
| Children | Single Father | Single Mother |
| No Children | 0 (0.0%) | 31 (20.4%) |
| 1 or 2 Children | 0 (0.0%) | 16 (14.7%) |
| 3 or 4 Children | 0 (0.0%) | 0 (0.0%) |
| 5 or more Children | 0 (0.0%) | 0 (0.0%) |
| Total | 0 (0.0%) | 47 (15.4%) |
Income Below Poverty Among Married-Couple vs Single-Parent Households in Galeville
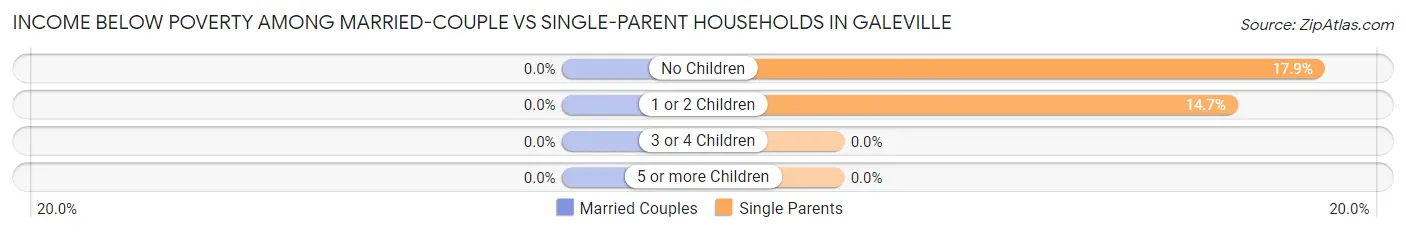
| Children | Married-Couple Families | Single-Parent Households |
| No Children | 0 (0.0%) | 31 (17.9%) |
| 1 or 2 Children | 0 (0.0%) | 16 (14.7%) |
| 3 or 4 Children | 0 (0.0%) | 0 (0.0%) |
| 5 or more Children | 0 (0.0%) | 0 (0.0%) |
| Total | 0 (0.0%) | 47 (14.4%) |
Race in Galeville
The most populous races in Galeville are White / Caucasian (4,036 | 87.9%), Two or more Races (287 | 6.2%), and Asian (165 | 3.6%).
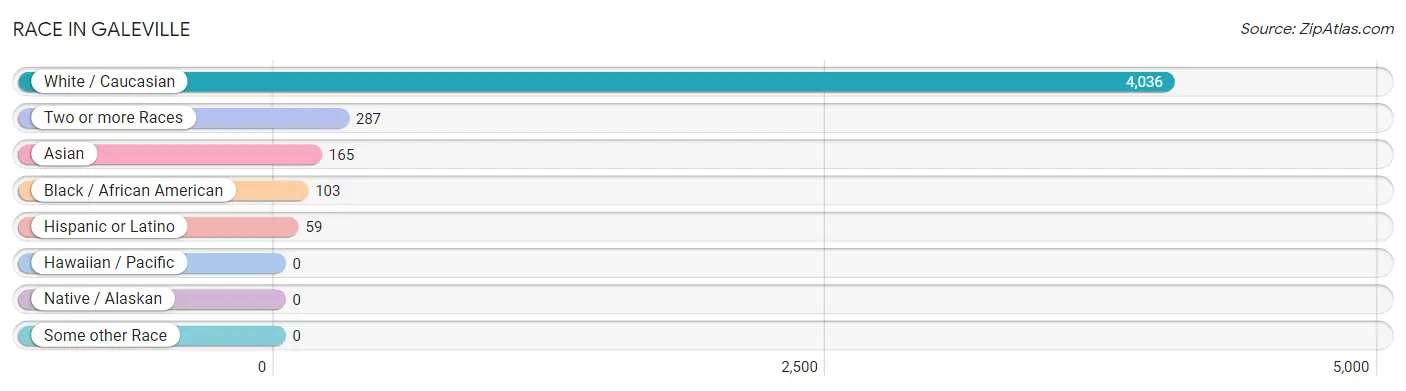
| Race | # Population | % Population |
| Asian | 165 | 3.6% |
| Black / African American | 103 | 2.2% |
| Hawaiian / Pacific | 0 | 0.0% |
| Hispanic or Latino | 59 | 1.3% |
| Native / Alaskan | 0 | 0.0% |
| White / Caucasian | 4,036 | 87.9% |
| Two or more Races | 287 | 6.2% |
| Some other Race | 0 | 0.0% |
| Total | 4,591 | 100.0% |
Ancestry in Galeville
The most populous ancestries reported in Galeville are German (905 | 19.7%), Irish (901 | 19.6%), Italian (487 | 10.6%), Polish (460 | 10.0%), and English (434 | 9.5%), together accounting for 69.4% of all Galeville residents.
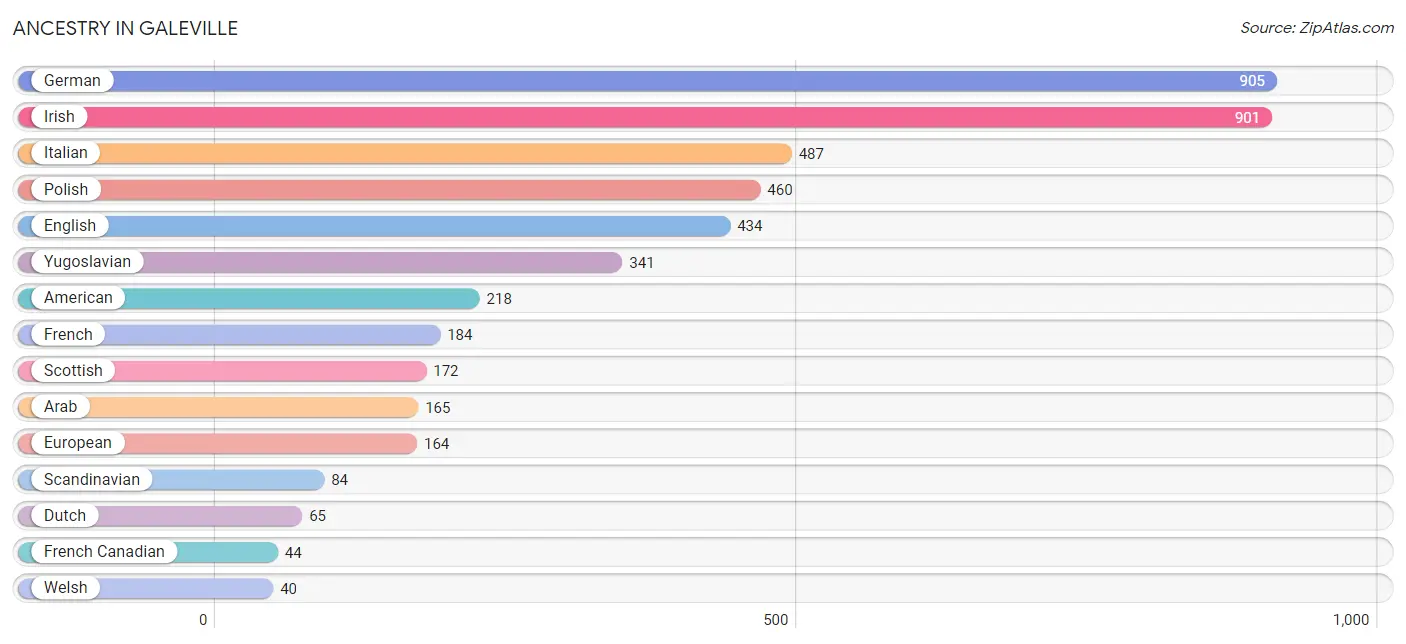
| Ancestry | # Population | % Population |
| American | 218 | 4.8% |
| Arab | 165 | 3.6% |
| British | 16 | 0.4% |
| Canadian | 9 | 0.2% |
| Czech | 18 | 0.4% |
| Dutch | 65 | 1.4% |
| Ecuadorian | 25 | 0.5% |
| English | 434 | 9.5% |
| European | 164 | 3.6% |
| French | 184 | 4.0% |
| French Canadian | 44 | 1.0% |
| German | 905 | 19.7% |
| Hungarian | 24 | 0.5% |
| Irish | 901 | 19.6% |
| Italian | 487 | 10.6% |
| Polish | 460 | 10.0% |
| Portuguese | 10 | 0.2% |
| Russian | 21 | 0.5% |
| Scandinavian | 84 | 1.8% |
| Scotch-Irish | 37 | 0.8% |
| Scottish | 172 | 3.7% |
| South American | 25 | 0.5% |
| Spaniard | 34 | 0.7% |
| Swedish | 15 | 0.3% |
| Thai | 23 | 0.5% |
| Welsh | 40 | 0.9% |
| Yugoslavian | 341 | 7.4% | View All 27 Rows |
Immigrants in Galeville
The most numerous immigrant groups reported in Galeville came from Europe (191 | 4.2%), Bosnia and Herzegovina (180 | 3.9%), Eastern Europe (180 | 3.9%), Ecuador (25 | 0.5%), and Latin America (25 | 0.5%), together accounting for 13.1% of all Galeville residents.
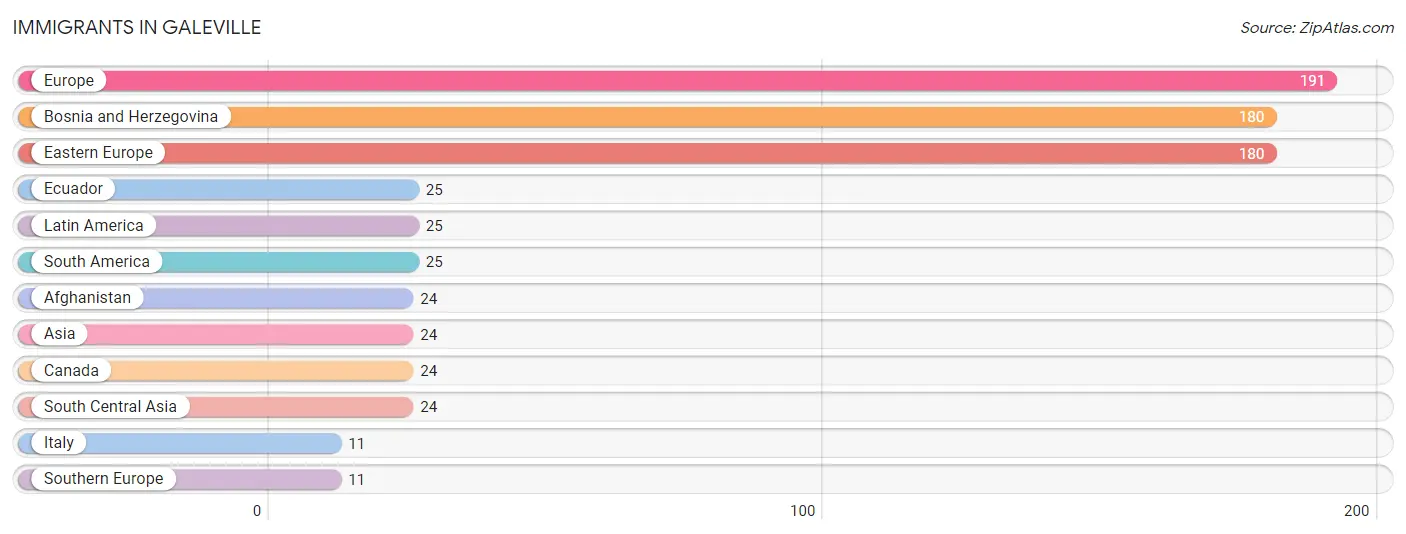
| Immigration Origin | # Population | % Population |
| Afghanistan | 24 | 0.5% |
| Asia | 24 | 0.5% |
| Bosnia and Herzegovina | 180 | 3.9% |
| Canada | 24 | 0.5% |
| Eastern Europe | 180 | 3.9% |
| Ecuador | 25 | 0.5% |
| Europe | 191 | 4.2% |
| Italy | 11 | 0.2% |
| Latin America | 25 | 0.5% |
| South America | 25 | 0.5% |
| South Central Asia | 24 | 0.5% |
| Southern Europe | 11 | 0.2% | View All 12 Rows |
Sex and Age in Galeville
Sex and Age in Galeville
The most populous age groups in Galeville are 60 to 64 Years (274 | 13.2%) for men and 65 to 69 Years (379 | 15.1%) for women.
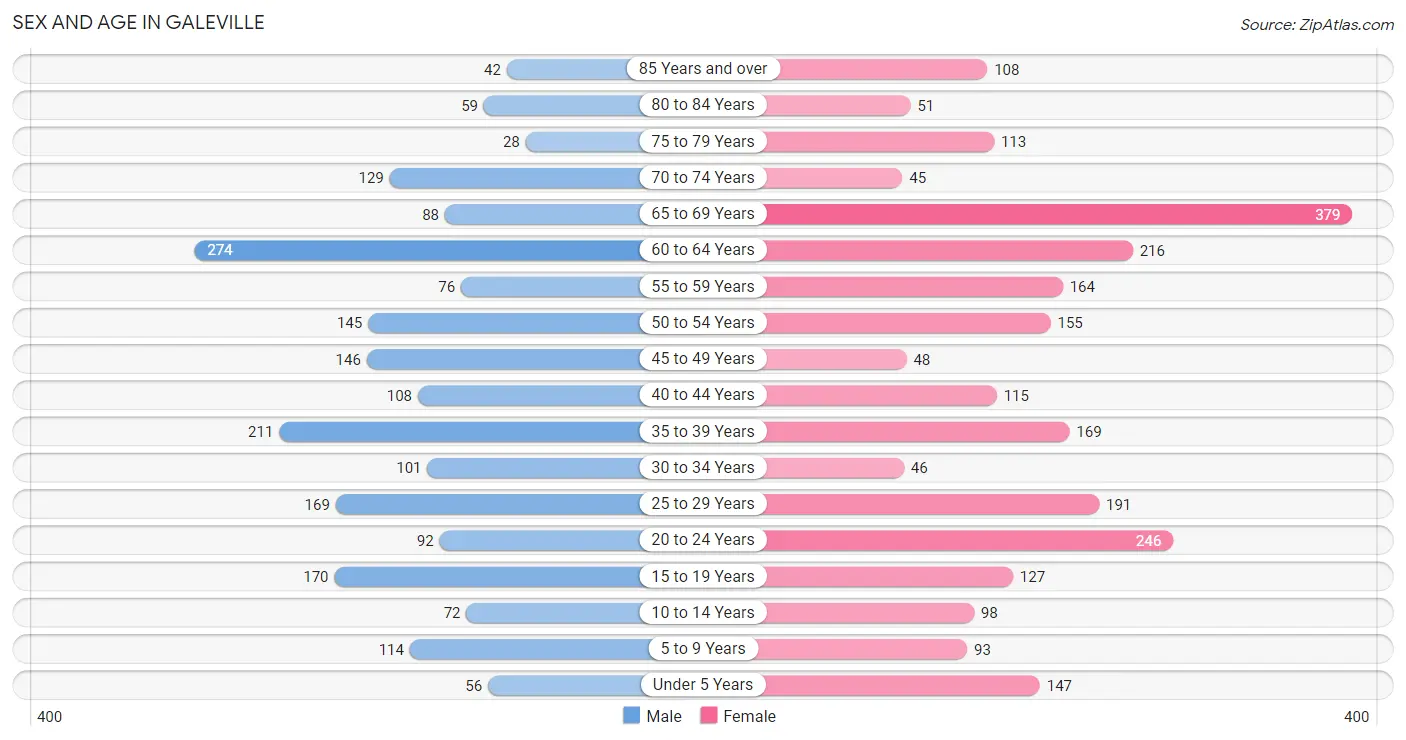
| Age Bracket | Male | Female |
| Under 5 Years | 56 (2.7%) | 147 (5.9%) |
| 5 to 9 Years | 114 (5.5%) | 93 (3.7%) |
| 10 to 14 Years | 72 (3.5%) | 98 (3.9%) |
| 15 to 19 Years | 170 (8.2%) | 127 (5.1%) |
| 20 to 24 Years | 92 (4.4%) | 246 (9.8%) |
| 25 to 29 Years | 169 (8.1%) | 191 (7.6%) |
| 30 to 34 Years | 101 (4.9%) | 46 (1.8%) |
| 35 to 39 Years | 211 (10.1%) | 169 (6.7%) |
| 40 to 44 Years | 108 (5.2%) | 115 (4.6%) |
| 45 to 49 Years | 146 (7.0%) | 48 (1.9%) |
| 50 to 54 Years | 145 (7.0%) | 155 (6.2%) |
| 55 to 59 Years | 76 (3.6%) | 164 (6.5%) |
| 60 to 64 Years | 274 (13.2%) | 216 (8.6%) |
| 65 to 69 Years | 88 (4.2%) | 379 (15.1%) |
| 70 to 74 Years | 129 (6.2%) | 45 (1.8%) |
| 75 to 79 Years | 28 (1.3%) | 113 (4.5%) |
| 80 to 84 Years | 59 (2.8%) | 51 (2.0%) |
| 85 Years and over | 42 (2.0%) | 108 (4.3%) |
| Total | 2,080 (100.0%) | 2,511 (100.0%) |
Families and Households in Galeville
Median Family Size in Galeville
The median family size in Galeville is 3.25 persons per family, with married-couple families (630 | 65.8%) accounting for the largest median family size of 3.51 persons per family. On the other hand, single male/father families (21 | 2.2%) represent the smallest median family size with 2.43 persons per family.
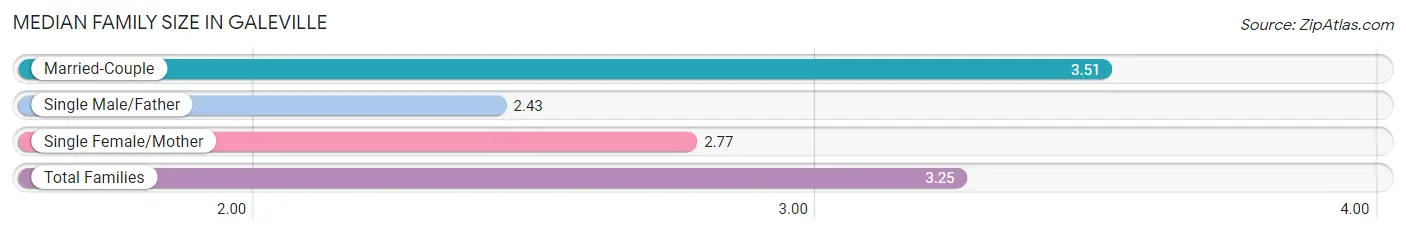
| Family Type | # Families | Family Size |
| Married-Couple | 630 (65.8%) | 3.51 |
| Single Male/Father | 21 (2.2%) | 2.43 |
| Single Female/Mother | 306 (32.0%) | 2.77 |
| Total Families | 957 (100.0%) | 3.25 |
Median Household Size in Galeville
The median household size in Galeville is 2.28 persons per household, with married-couple households (630 | 31.6%) accounting for the largest median household size of 3.51 persons per household. non-family households (1,038 | 52.0%) represent the smallest median household size with 1.26 persons per household.
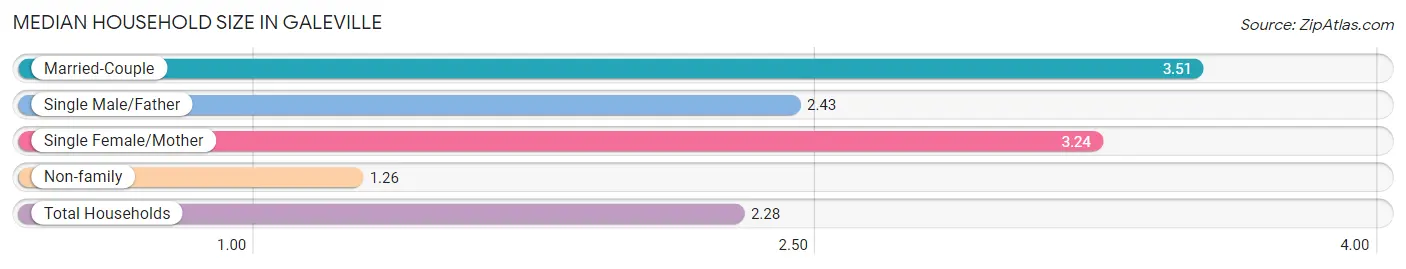
| Household Type | # Households | Household Size |
| Married-Couple | 630 (31.6%) | 3.51 |
| Single Male/Father | 21 (1.1%) | 2.43 |
| Single Female/Mother | 306 (15.3%) | 3.24 |
| Non-family | 1,038 (52.0%) | 1.26 |
| Total Households | 1,995 (100.0%) | 2.28 |
Household Size by Marriage Status in Galeville
Out of a total of 1,995 households in Galeville, 957 (48.0%) are family households, while 1,038 (52.0%) are nonfamily households. The most numerous type of family households are 2-person households, comprising 539, and the most common type of nonfamily households are 1-person households, comprising 785.
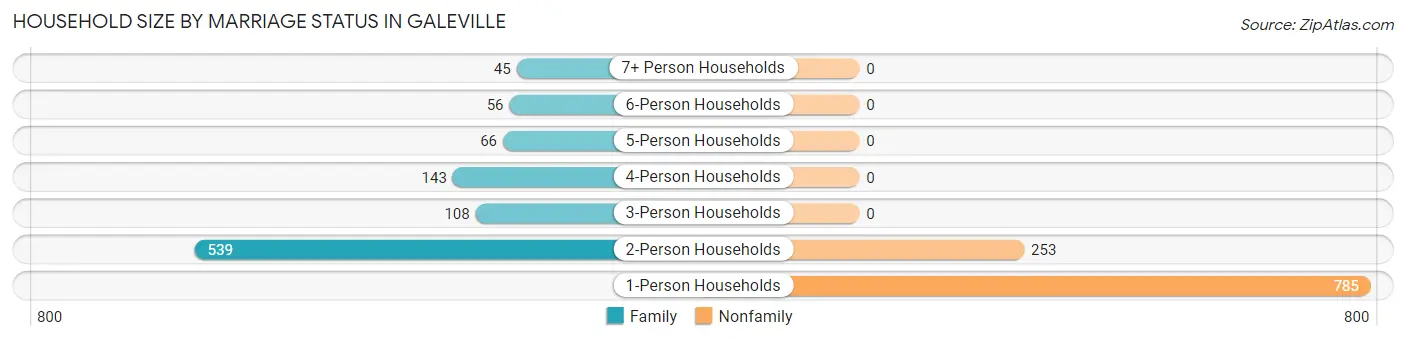
| Household Size | Family Households | Nonfamily Households |
| 1-Person Households | - | 785 (39.4%) |
| 2-Person Households | 539 (27.0%) | 253 (12.7%) |
| 3-Person Households | 108 (5.4%) | 0 (0.0%) |
| 4-Person Households | 143 (7.2%) | 0 (0.0%) |
| 5-Person Households | 66 (3.3%) | 0 (0.0%) |
| 6-Person Households | 56 (2.8%) | 0 (0.0%) |
| 7+ Person Households | 45 (2.3%) | 0 (0.0%) |
| Total | 957 (48.0%) | 1,038 (52.0%) |
Female Fertility in Galeville
Fertility by Age in Galeville
Average fertility rate in Galeville is 64.0 births per 1,000 women. Women in the age bracket of 20 to 34 years have the highest fertility rate with 81.0 births per 1,000 women. Women in the age bracket of 20 to 34 years acount for 62.9% of all women with births.
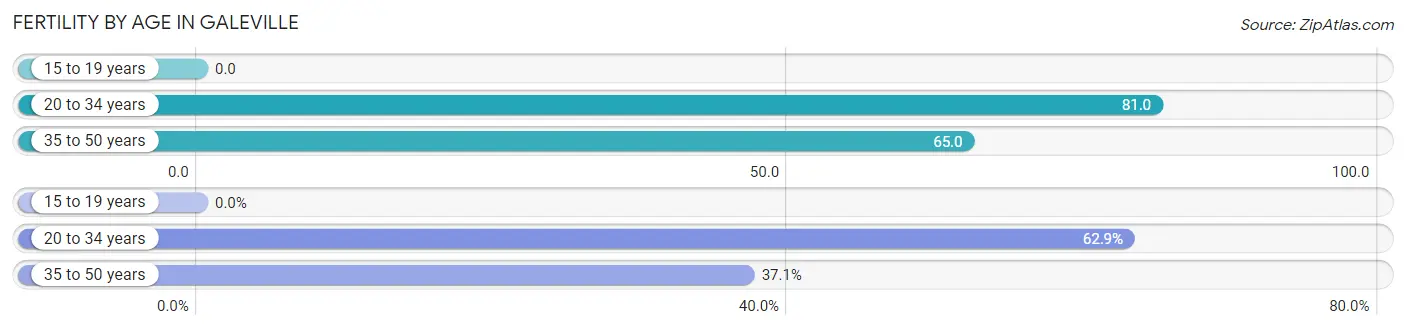
| Age Bracket | Women with Births | Births / 1,000 Women |
| 15 to 19 years | 0 (0.0%) | 0.0 |
| 20 to 34 years | 39 (62.9%) | 81.0 |
| 35 to 50 years | 23 (37.1%) | 65.0 |
| Total | 62 (100.0%) | 64.0 |
Fertility by Age by Marriage Status in Galeville
75.8% of women with births (62) in Galeville are married. The highest percentage of unmarried women with births falls into 20 to 34 years age bracket with 38.5% of them unmarried at the time of birth, while the lowest percentage of unmarried women with births belong to 35 to 50 years age bracket with 0.0% of them unmarried.
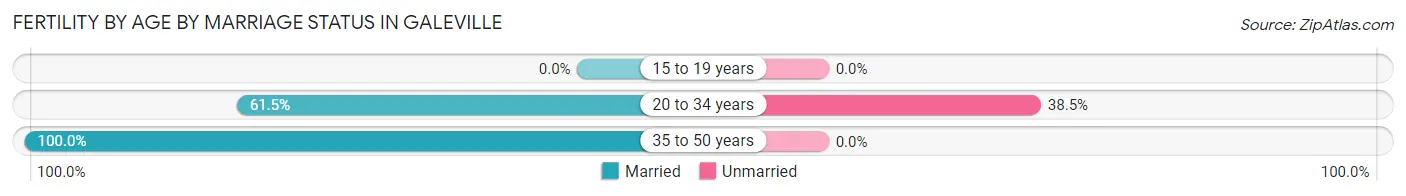
| Age Bracket | Married | Unmarried |
| 15 to 19 years | 0 (0.0%) | 0 (0.0%) |
| 20 to 34 years | 24 (61.5%) | 15 (38.5%) |
| 35 to 50 years | 23 (100.0%) | 0 (0.0%) |
| Total | 47 (75.8%) | 15 (24.2%) |
Fertility by Education in Galeville
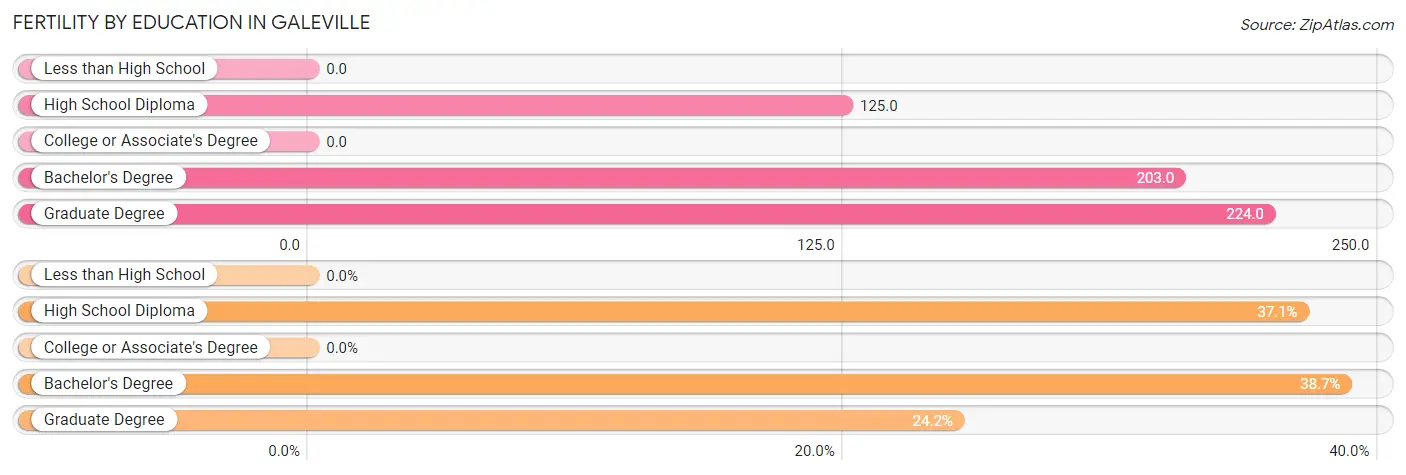
| Educational Attainment | Women with Births | Births / 1,000 Women |
| Less than High School | 0 (0.0%) | 0.0 |
| High School Diploma | 23 (37.1%) | 125.0 |
| College or Associate's Degree | 0 (0.0%) | 0.0 |
| Bachelor's Degree | 24 (38.7%) | 203.0 |
| Graduate Degree | 15 (24.2%) | 224.0 |
| Total | 62 (100.0%) | 64.0 |
Fertility by Education by Marriage Status in Galeville
24.2% of women with births in Galeville are unmarried. Women with the educational attainment of high school diploma are most likely to be married with 100.0% of them married at childbirth, while women with the educational attainment of graduate degree are least likely to be married with 100.0% of them unmarried at childbirth.
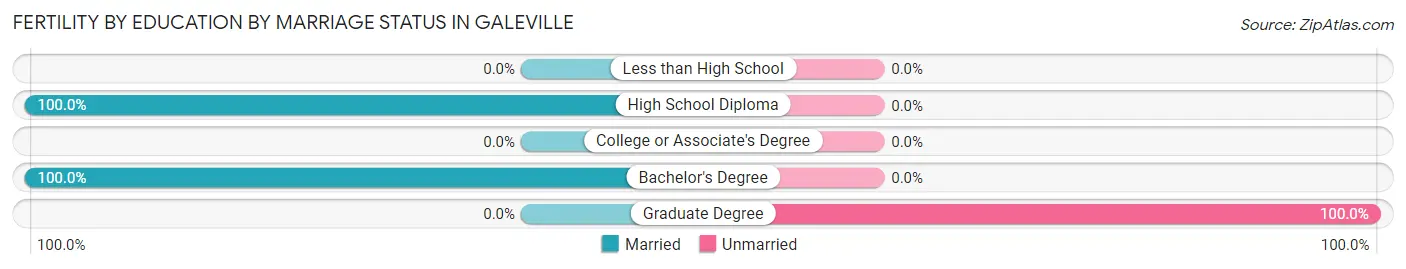
| Educational Attainment | Married | Unmarried |
| Less than High School | 0 (0.0%) | 0 (0.0%) |
| High School Diploma | 23 (100.0%) | 0 (0.0%) |
| College or Associate's Degree | 0 (0.0%) | 0 (0.0%) |
| Bachelor's Degree | 24 (100.0%) | 0 (0.0%) |
| Graduate Degree | 0 (0.0%) | 15 (100.0%) |
| Total | 47 (75.8%) | 15 (24.2%) |
Employment Characteristics in Galeville
Employment by Class of Employer in Galeville
Among the 1,888 employed individuals in Galeville, private company employees (1,010 | 53.5%), local government employees (290 | 15.4%), and not-for-profit organizations (214 | 11.3%) make up the most common classes of employment.
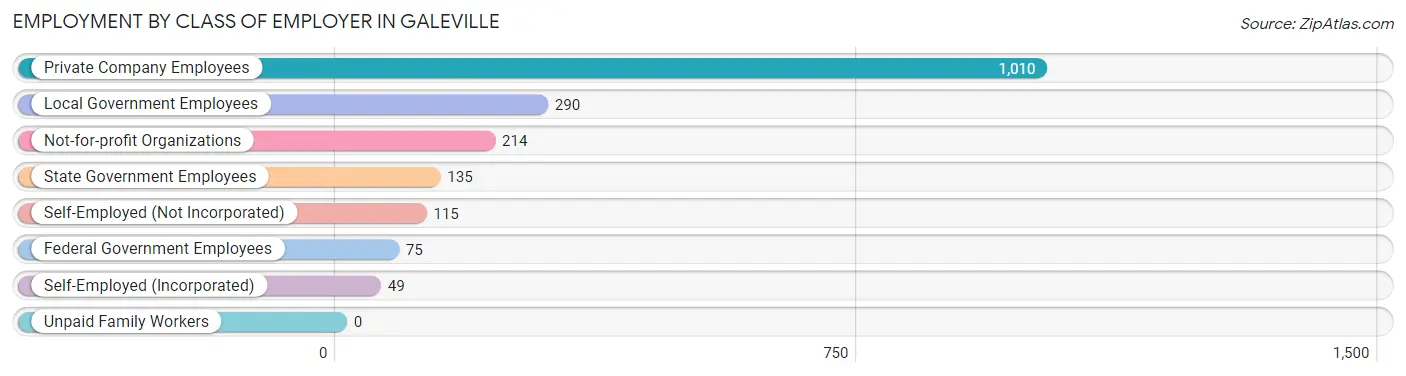
| Employer Class | # Employees | % Employees |
| Private Company Employees | 1,010 | 53.5% |
| Self-Employed (Incorporated) | 49 | 2.6% |
| Self-Employed (Not Incorporated) | 115 | 6.1% |
| Not-for-profit Organizations | 214 | 11.3% |
| Local Government Employees | 290 | 15.4% |
| State Government Employees | 135 | 7.1% |
| Federal Government Employees | 75 | 4.0% |
| Unpaid Family Workers | 0 | 0.0% |
| Total | 1,888 | 100.0% |
Employment Status by Age in Galeville
According to the labor force statistics for Galeville, out of the total population over 16 years of age (3,899), 55.3% or 2,156 individuals are in the labor force, with 10.0% or 216 of them unemployed. The age group with the highest labor force participation rate is 30 to 34 years, with 90.5% or 133 individuals in the labor force. Within the labor force, the 25 to 29 years age range has the highest percentage of unemployed individuals, with 48.8% or 145 of them being unemployed.
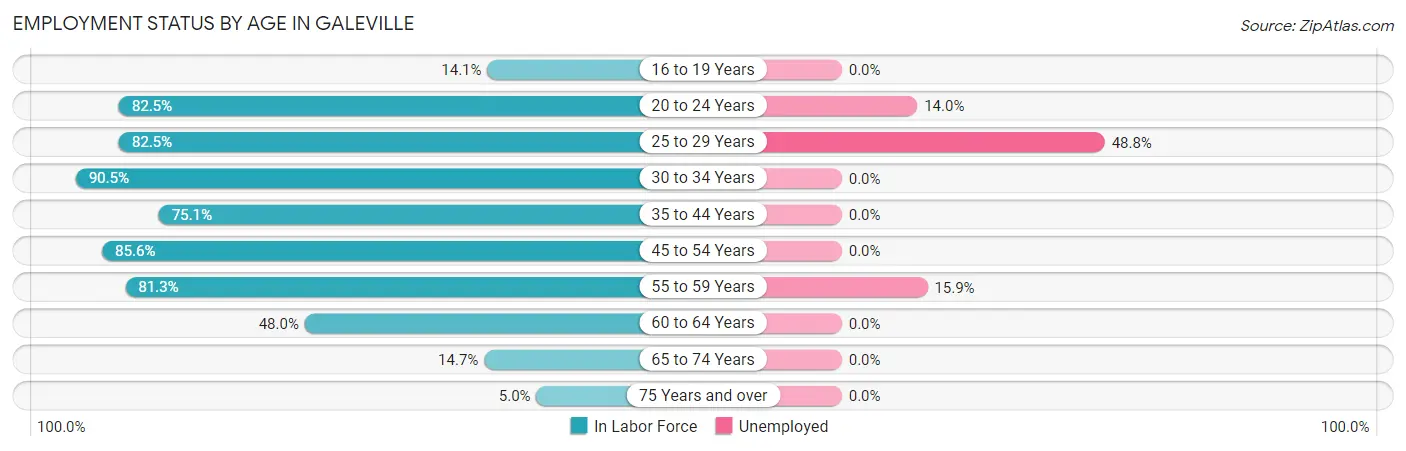
| Age Bracket | In Labor Force | Unemployed |
| 16 to 19 Years | 26 (14.1%) | 0 (0.0%) |
| 20 to 24 Years | 279 (82.5%) | 39 (14.0%) |
| 25 to 29 Years | 297 (82.5%) | 145 (48.8%) |
| 30 to 34 Years | 133 (90.5%) | 0 (0.0%) |
| 35 to 44 Years | 453 (75.1%) | 0 (0.0%) |
| 45 to 54 Years | 423 (85.6%) | 0 (0.0%) |
| 55 to 59 Years | 195 (81.3%) | 31 (15.9%) |
| 60 to 64 Years | 235 (48.0%) | 0 (0.0%) |
| 65 to 74 Years | 94 (14.7%) | 0 (0.0%) |
| 75 Years and over | 20 (5.0%) | 0 (0.0%) |
| Total | 2,156 (55.3%) | 216 (10.0%) |
Employment Status by Educational Attainment in Galeville
According to labor force statistics for Galeville, 74.4% of individuals (1,736) out of the total population between 25 and 64 years of age (2,334) are in the labor force, with 10.1% or 175 of them being unemployed. The group with the highest labor force participation rate are those with the educational attainment of bachelor's degree or higher, with 95.9% or 518 individuals in the labor force. Within the labor force, individuals with high school diploma education have the highest percentage of unemployment, with 23.4% or 91 of them being unemployed.
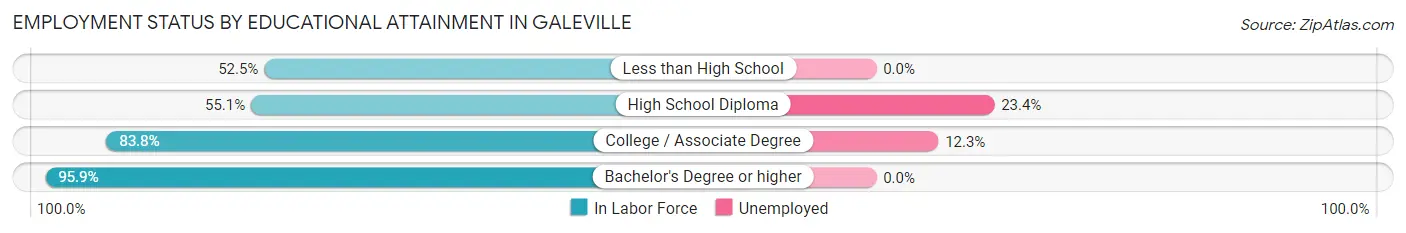
| Educational Attainment | In Labor Force | Unemployed |
| Less than High School | 139 (52.5%) | 0 (0.0%) |
| High School Diploma | 389 (55.1%) | 165 (23.4%) |
| College / Associate Degree | 690 (83.8%) | 101 (12.3%) |
| Bachelor's Degree or higher | 518 (95.9%) | 0 (0.0%) |
| Total | 1,736 (74.4%) | 236 (10.1%) |
Employment Occupations by Sex in Galeville
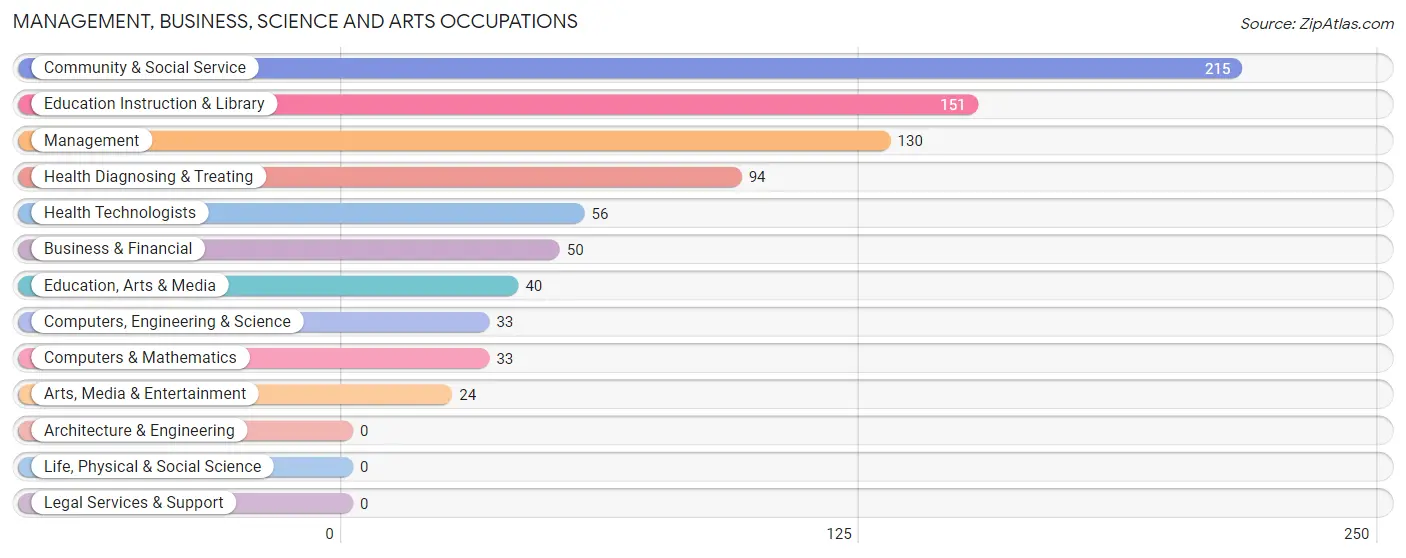
Management, Business, Science and Arts Occupations
The most common Management, Business, Science and Arts occupations in Galeville are Community & Social Service (215 | 11.1%), Education Instruction & Library (151 | 7.8%), Management (130 | 6.7%), Health Diagnosing & Treating (94 | 4.9%), and Health Technologists (56 | 2.9%).
Management, Business, Science and Arts Occupations by Sex
Within the Management, Business, Science and Arts occupations in Galeville, the most male-oriented occupations are Business & Financial (100.0%), Education Instruction & Library (43.7%), and Health Diagnosing & Treating (40.4%), while the most female-oriented occupations are Computers, Engineering & Science (100.0%), Computers & Mathematics (100.0%), and Education, Arts & Media (100.0%).
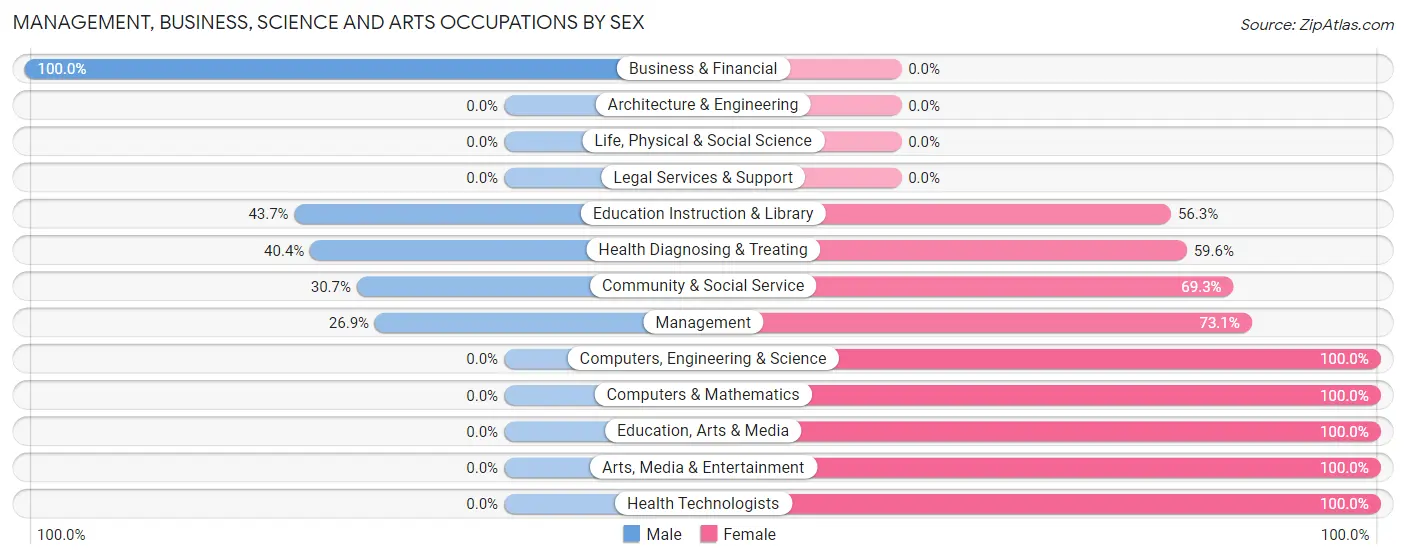
| Occupation | Male | Female |
| Management | 35 (26.9%) | 95 (73.1%) |
| Business & Financial | 50 (100.0%) | 0 (0.0%) |
| Computers, Engineering & Science | 0 (0.0%) | 33 (100.0%) |
| Computers & Mathematics | 0 (0.0%) | 33 (100.0%) |
| Architecture & Engineering | 0 (0.0%) | 0 (0.0%) |
| Life, Physical & Social Science | 0 (0.0%) | 0 (0.0%) |
| Community & Social Service | 66 (30.7%) | 149 (69.3%) |
| Education, Arts & Media | 0 (0.0%) | 40 (100.0%) |
| Legal Services & Support | 0 (0.0%) | 0 (0.0%) |
| Education Instruction & Library | 66 (43.7%) | 85 (56.3%) |
| Arts, Media & Entertainment | 0 (0.0%) | 24 (100.0%) |
| Health Diagnosing & Treating | 38 (40.4%) | 56 (59.6%) |
| Health Technologists | 0 (0.0%) | 56 (100.0%) |
| Total (Category) | 189 (36.2%) | 333 (63.8%) |
| Total (Overall) | 905 (46.7%) | 1,035 (53.3%) |
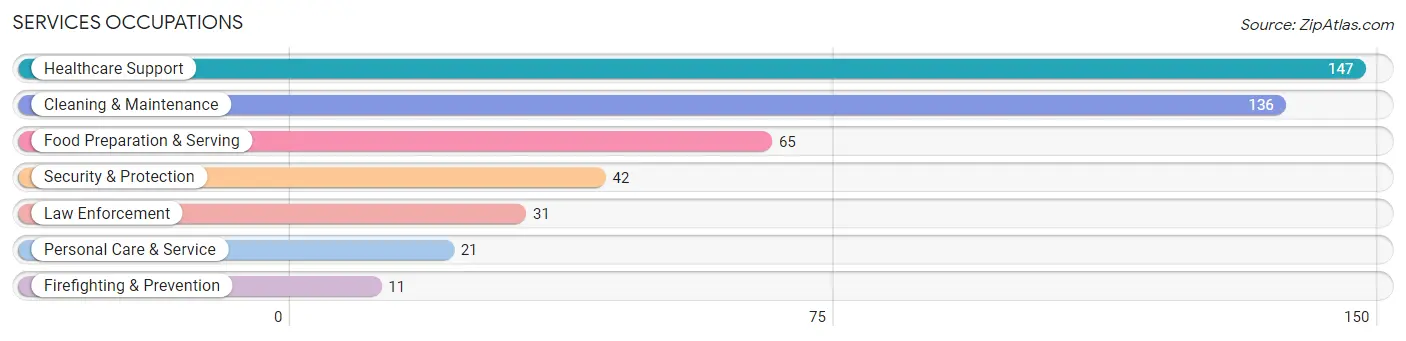
Services Occupations
The most common Services occupations in Galeville are Healthcare Support (147 | 7.6%), Cleaning & Maintenance (136 | 7.0%), Food Preparation & Serving (65 | 3.4%), Security & Protection (42 | 2.2%), and Law Enforcement (31 | 1.6%).
Services Occupations by Sex
Within the Services occupations in Galeville, the most male-oriented occupations are Security & Protection (100.0%), Firefighting & Prevention (100.0%), and Law Enforcement (100.0%), while the most female-oriented occupations are Food Preparation & Serving (100.0%), Personal Care & Service (100.0%), and Healthcare Support (60.5%).
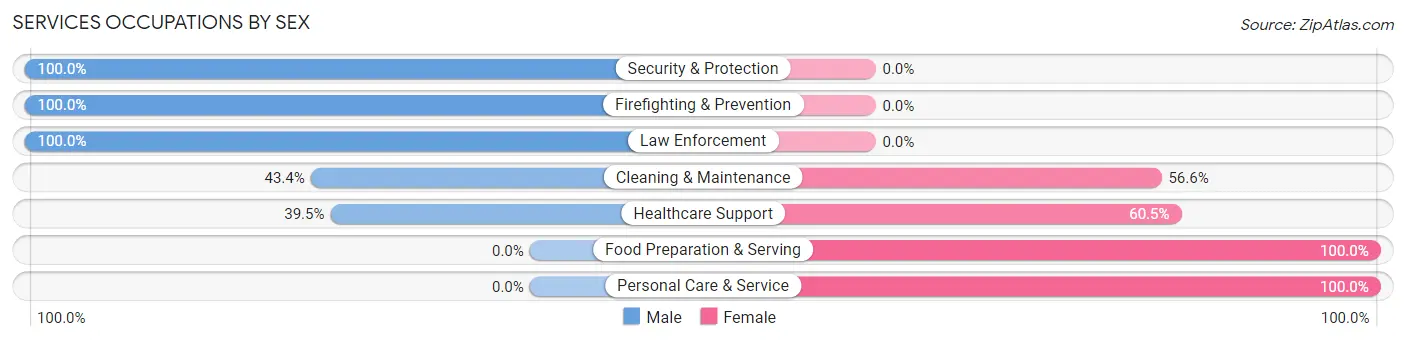
| Occupation | Male | Female |
| Healthcare Support | 58 (39.5%) | 89 (60.5%) |
| Security & Protection | 42 (100.0%) | 0 (0.0%) |
| Firefighting & Prevention | 11 (100.0%) | 0 (0.0%) |
| Law Enforcement | 31 (100.0%) | 0 (0.0%) |
| Food Preparation & Serving | 0 (0.0%) | 65 (100.0%) |
| Cleaning & Maintenance | 59 (43.4%) | 77 (56.6%) |
| Personal Care & Service | 0 (0.0%) | 21 (100.0%) |
| Total (Category) | 159 (38.7%) | 252 (61.3%) |
| Total (Overall) | 905 (46.7%) | 1,035 (53.3%) |
Sales and Office Occupations
The most common Sales and Office occupations in Galeville are Office & Administration (317 | 16.3%), and Sales & Related (172 | 8.9%).

Sales and Office Occupations by Sex

| Occupation | Male | Female |
| Sales & Related | 65 (37.8%) | 107 (62.2%) |
| Office & Administration | 24 (7.6%) | 293 (92.4%) |
| Total (Category) | 89 (18.2%) | 400 (81.8%) |
| Total (Overall) | 905 (46.7%) | 1,035 (53.3%) |
Natural Resources, Construction and Maintenance Occupations
The most common Natural Resources, Construction and Maintenance occupations in Galeville are Construction & Extraction (132 | 6.8%), and Installation, Maintenance & Repair (72 | 3.7%).

Natural Resources, Construction and Maintenance Occupations by Sex

| Occupation | Male | Female |
| Farming, Fishing & Forestry | 0 (0.0%) | 0 (0.0%) |
| Construction & Extraction | 132 (100.0%) | 0 (0.0%) |
| Installation, Maintenance & Repair | 72 (100.0%) | 0 (0.0%) |
| Total (Category) | 204 (100.0%) | 0 (0.0%) |
| Total (Overall) | 905 (46.7%) | 1,035 (53.3%) |
Production, Transportation and Moving Occupations
The most common Production, Transportation and Moving occupations in Galeville are Production (160 | 8.3%), Material Moving (122 | 6.3%), and Transportation (32 | 1.7%).
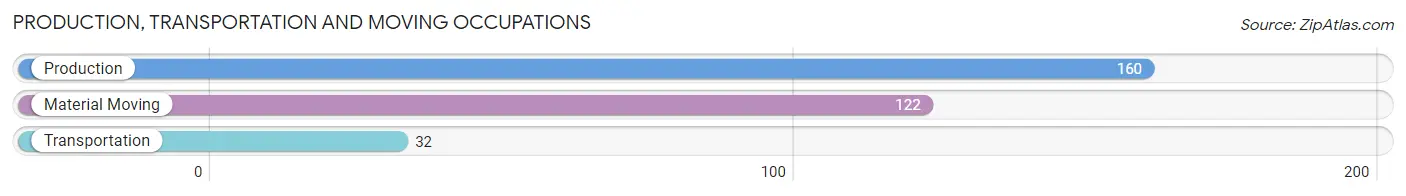
Production, Transportation and Moving Occupations by Sex
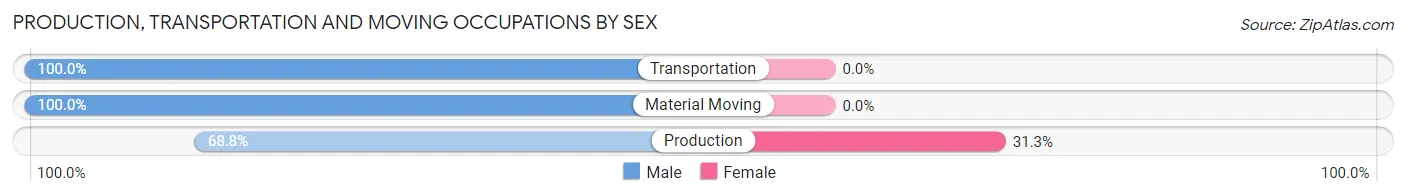
| Occupation | Male | Female |
| Production | 110 (68.8%) | 50 (31.2%) |
| Transportation | 32 (100.0%) | 0 (0.0%) |
| Material Moving | 122 (100.0%) | 0 (0.0%) |
| Total (Category) | 264 (84.1%) | 50 (15.9%) |
| Total (Overall) | 905 (46.7%) | 1,035 (53.3%) |
Employment Industries by Sex in Galeville
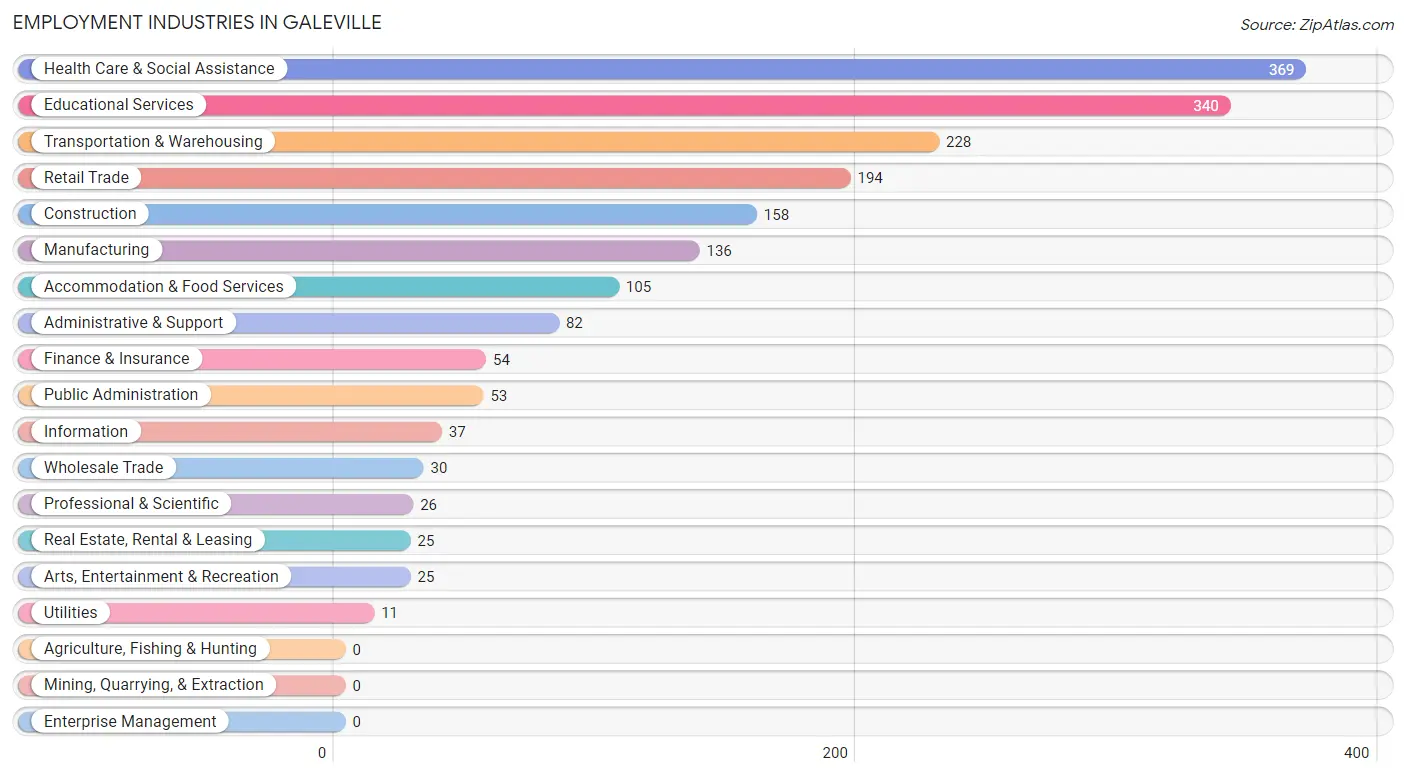
Employment Industries in Galeville
The major employment industries in Galeville include Health Care & Social Assistance (369 | 19.0%), Educational Services (340 | 17.5%), Transportation & Warehousing (228 | 11.7%), Retail Trade (194 | 10.0%), and Construction (158 | 8.1%).
Employment Industries by Sex in Galeville
The Galeville industries that see more men than women are Construction (100.0%), Wholesale Trade (100.0%), and Utilities (100.0%), whereas the industries that tend to have a higher number of women are Professional & Scientific (100.0%), Arts, Entertainment & Recreation (100.0%), and Administrative & Support (82.9%).
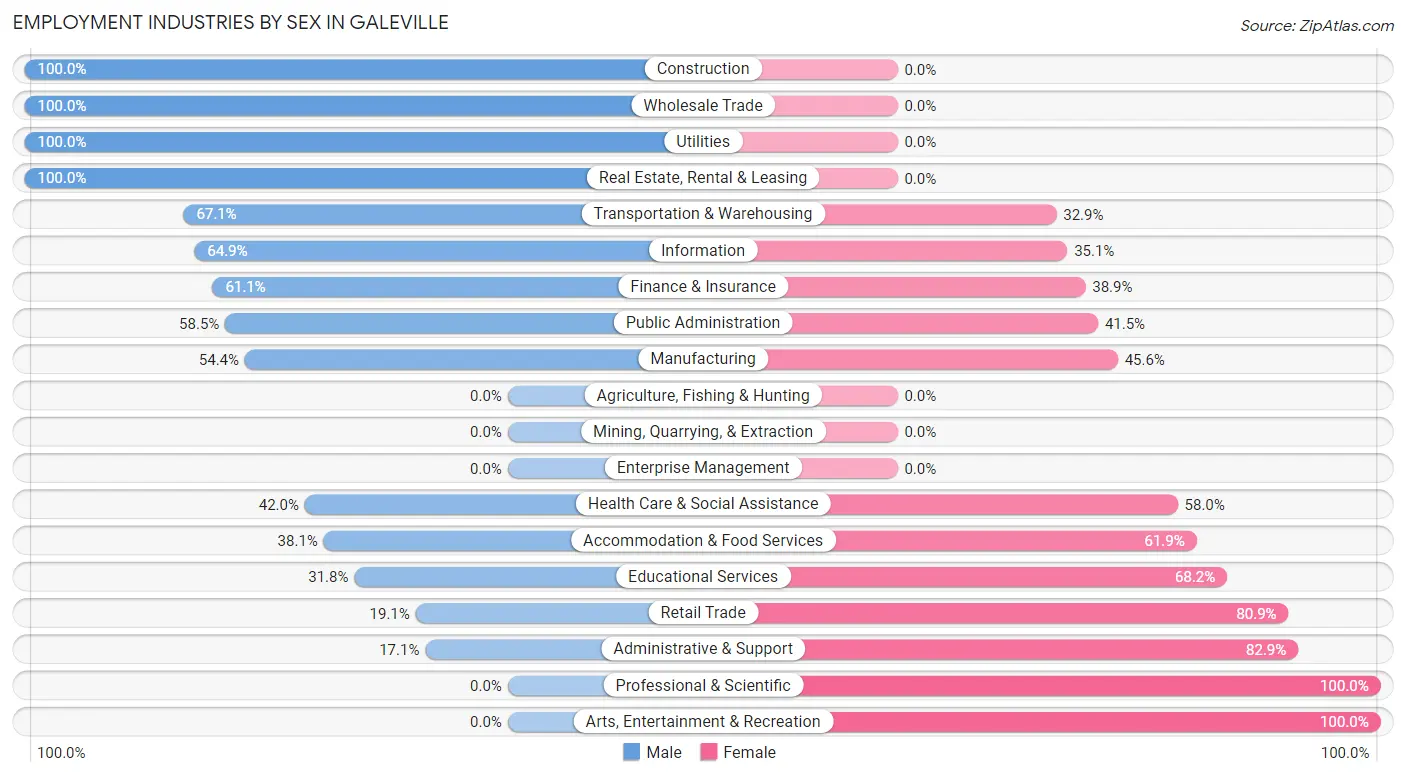
| Industry | Male | Female |
| Agriculture, Fishing & Hunting | 0 (0.0%) | 0 (0.0%) |
| Mining, Quarrying, & Extraction | 0 (0.0%) | 0 (0.0%) |
| Construction | 158 (100.0%) | 0 (0.0%) |
| Manufacturing | 74 (54.4%) | 62 (45.6%) |
| Wholesale Trade | 30 (100.0%) | 0 (0.0%) |
| Retail Trade | 37 (19.1%) | 157 (80.9%) |
| Transportation & Warehousing | 153 (67.1%) | 75 (32.9%) |
| Utilities | 11 (100.0%) | 0 (0.0%) |
| Information | 24 (64.9%) | 13 (35.1%) |
| Finance & Insurance | 33 (61.1%) | 21 (38.9%) |
| Real Estate, Rental & Leasing | 25 (100.0%) | 0 (0.0%) |
| Professional & Scientific | 0 (0.0%) | 26 (100.0%) |
| Enterprise Management | 0 (0.0%) | 0 (0.0%) |
| Administrative & Support | 14 (17.1%) | 68 (82.9%) |
| Educational Services | 108 (31.8%) | 232 (68.2%) |
| Health Care & Social Assistance | 155 (42.0%) | 214 (58.0%) |
| Arts, Entertainment & Recreation | 0 (0.0%) | 25 (100.0%) |
| Accommodation & Food Services | 40 (38.1%) | 65 (61.9%) |
| Public Administration | 31 (58.5%) | 22 (41.5%) |
| Total | 905 (46.7%) | 1,035 (53.3%) |
Education in Galeville
School Enrollment in Galeville
The most common levels of schooling among the 985 students in Galeville are college / undergraduate (287 | 29.1%), high school (235 | 23.9%), and middle school (206 | 20.9%).
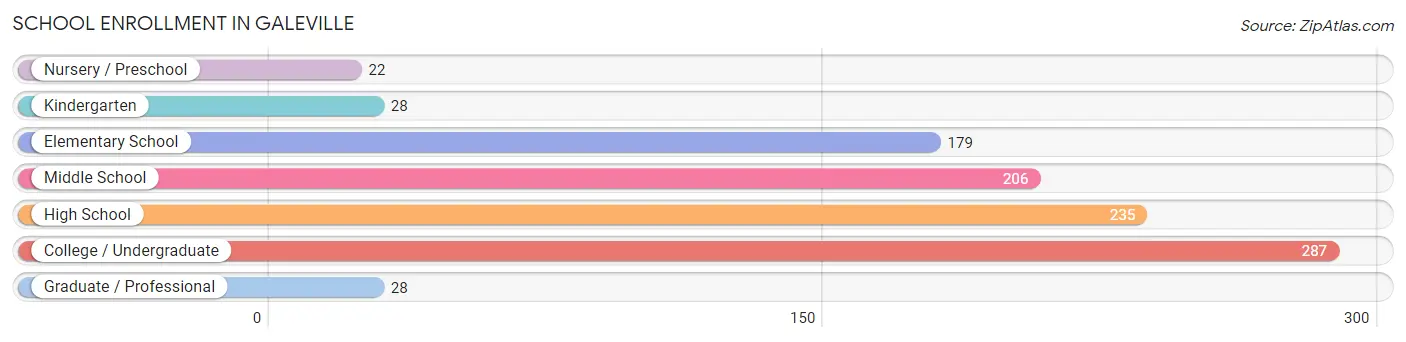
| School Level | # Students | % Students |
| Nursery / Preschool | 22 | 2.2% |
| Kindergarten | 28 | 2.8% |
| Elementary School | 179 | 18.2% |
| Middle School | 206 | 20.9% |
| High School | 235 | 23.9% |
| College / Undergraduate | 287 | 29.1% |
| Graduate / Professional | 28 | 2.8% |
| Total | 985 | 100.0% |
School Enrollment by Age by Funding Source in Galeville
Out of a total of 985 students who are enrolled in schools in Galeville, 90 (9.1%) attend a private institution, while the remaining 895 (90.9%) are enrolled in public schools. The age group of 18 to 19 year olds has the highest likelihood of being enrolled in private schools, with 26 (100.0% in the age bracket) enrolled. Conversely, the age group of 3 to 4 year olds has the lowest likelihood of being enrolled in a private school, with 22 (100.0% in the age bracket) attending a public institution.
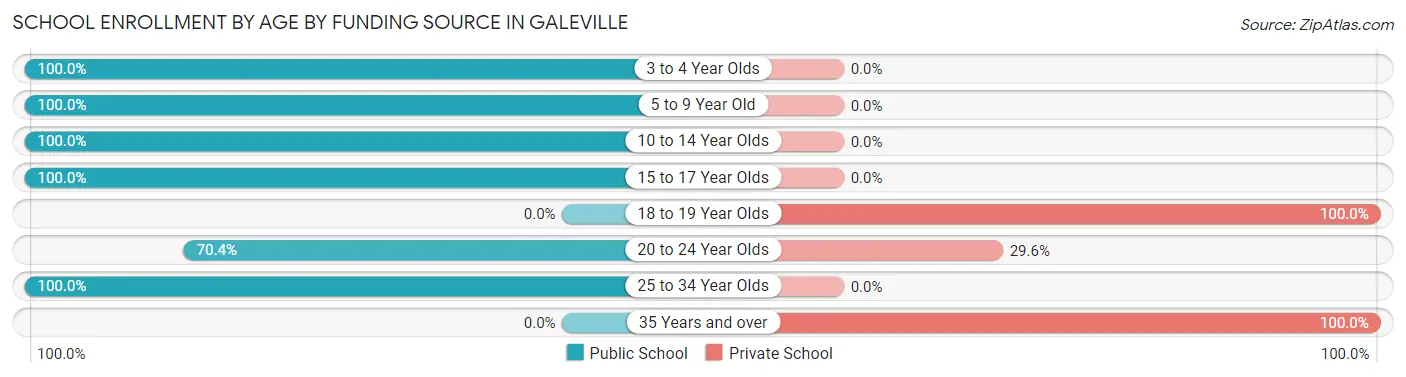
| Age Bracket | Public School | Private School |
| 3 to 4 Year Olds | 22 (100.0%) | 0 (0.0%) |
| 5 to 9 Year Old | 207 (100.0%) | 0 (0.0%) |
| 10 to 14 Year Olds | 170 (100.0%) | 0 (0.0%) |
| 15 to 17 Year Olds | 271 (100.0%) | 0 (0.0%) |
| 18 to 19 Year Olds | 0 (0.0%) | 26 (100.0%) |
| 20 to 24 Year Olds | 114 (70.4%) | 48 (29.6%) |
| 25 to 34 Year Olds | 111 (100.0%) | 0 (0.0%) |
| 35 Years and over | 0 (0.0%) | 16 (100.0%) |
| Total | 895 (90.9%) | 90 (9.1%) |
Educational Attainment by Field of Study in Galeville
Science & technology (217 | 23.6%), social sciences (130 | 14.1%), business (99 | 10.8%), arts & humanities (81 | 8.8%), and engineering (79 | 8.6%) are the most common fields of study among 919 individuals in Galeville who have obtained a bachelor's degree or higher.
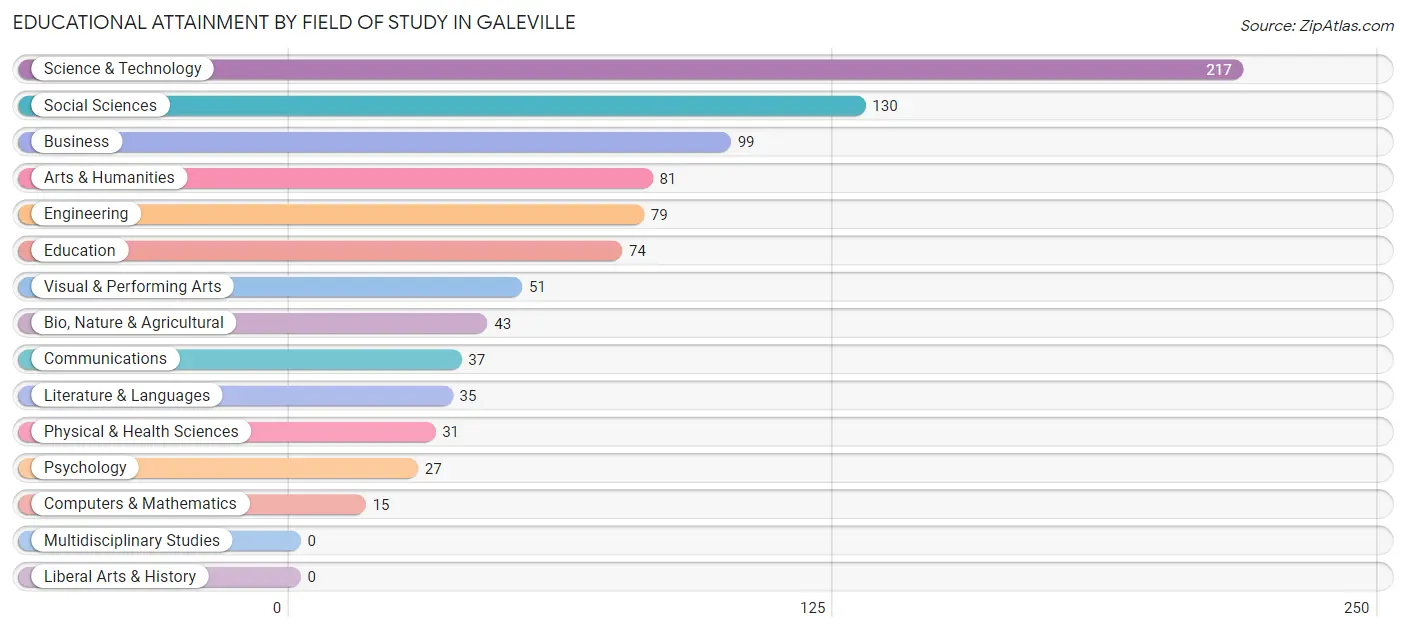
| Field of Study | # Graduates | % Graduates |
| Computers & Mathematics | 15 | 1.6% |
| Bio, Nature & Agricultural | 43 | 4.7% |
| Physical & Health Sciences | 31 | 3.4% |
| Psychology | 27 | 2.9% |
| Social Sciences | 130 | 14.1% |
| Engineering | 79 | 8.6% |
| Multidisciplinary Studies | 0 | 0.0% |
| Science & Technology | 217 | 23.6% |
| Business | 99 | 10.8% |
| Education | 74 | 8.1% |
| Literature & Languages | 35 | 3.8% |
| Liberal Arts & History | 0 | 0.0% |
| Visual & Performing Arts | 51 | 5.6% |
| Communications | 37 | 4.0% |
| Arts & Humanities | 81 | 8.8% |
| Total | 919 | 100.0% |
Transportation & Commute in Galeville
Vehicle Availability by Sex in Galeville
The most prevalent vehicle ownership categories in Galeville are males with 2 vehicles (363, accounting for 41.8%) and females with 2 vehicles (408, making up 35.6%).
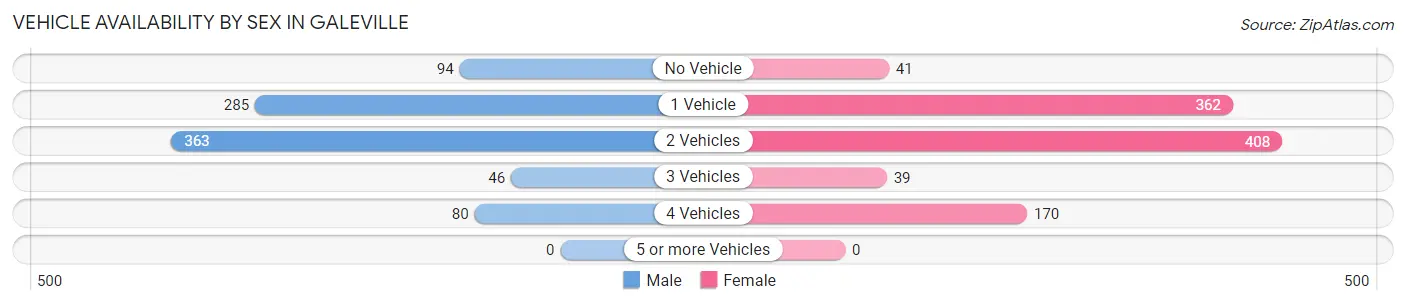
| Vehicles Available | Male | Female |
| No Vehicle | 94 (10.8%) | 41 (4.0%) |
| 1 Vehicle | 285 (32.8%) | 362 (35.5%) |
| 2 Vehicles | 363 (41.8%) | 408 (40.0%) |
| 3 Vehicles | 46 (5.3%) | 39 (3.8%) |
| 4 Vehicles | 80 (9.2%) | 170 (16.7%) |
| 5 or more Vehicles | 0 (0.0%) | 0 (0.0%) |
| Total | 868 (100.0%) | 1,020 (100.0%) |
Commute Time in Galeville
The most frequently occuring commute durations in Galeville are 10 to 14 minutes (705 commuters, 38.7%), 15 to 19 minutes (335 commuters, 18.4%), and 20 to 24 minutes (258 commuters, 14.1%).
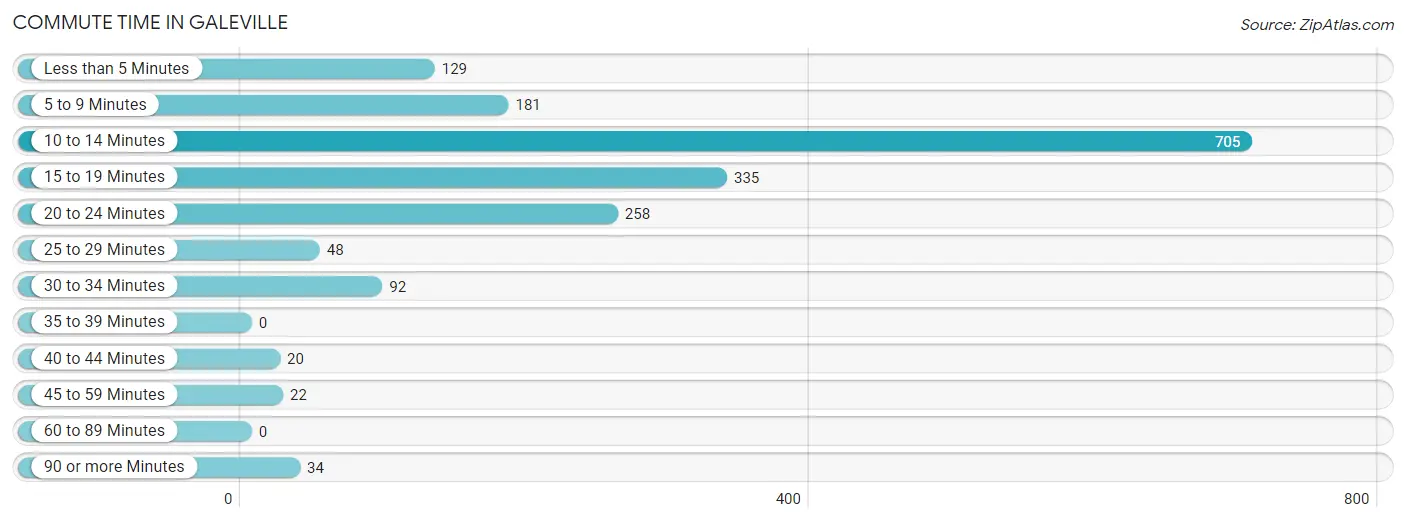
| Commute Time | # Commuters | % Commuters |
| Less than 5 Minutes | 129 | 7.1% |
| 5 to 9 Minutes | 181 | 9.9% |
| 10 to 14 Minutes | 705 | 38.7% |
| 15 to 19 Minutes | 335 | 18.4% |
| 20 to 24 Minutes | 258 | 14.1% |
| 25 to 29 Minutes | 48 | 2.6% |
| 30 to 34 Minutes | 92 | 5.0% |
| 35 to 39 Minutes | 0 | 0.0% |
| 40 to 44 Minutes | 20 | 1.1% |
| 45 to 59 Minutes | 22 | 1.2% |
| 60 to 89 Minutes | 0 | 0.0% |
| 90 or more Minutes | 34 | 1.9% |
Commute Time by Sex in Galeville
The most common commute times in Galeville are 10 to 14 minutes (256 commuters, 31.4%) for males and 10 to 14 minutes (449 commuters, 44.5%) for females.
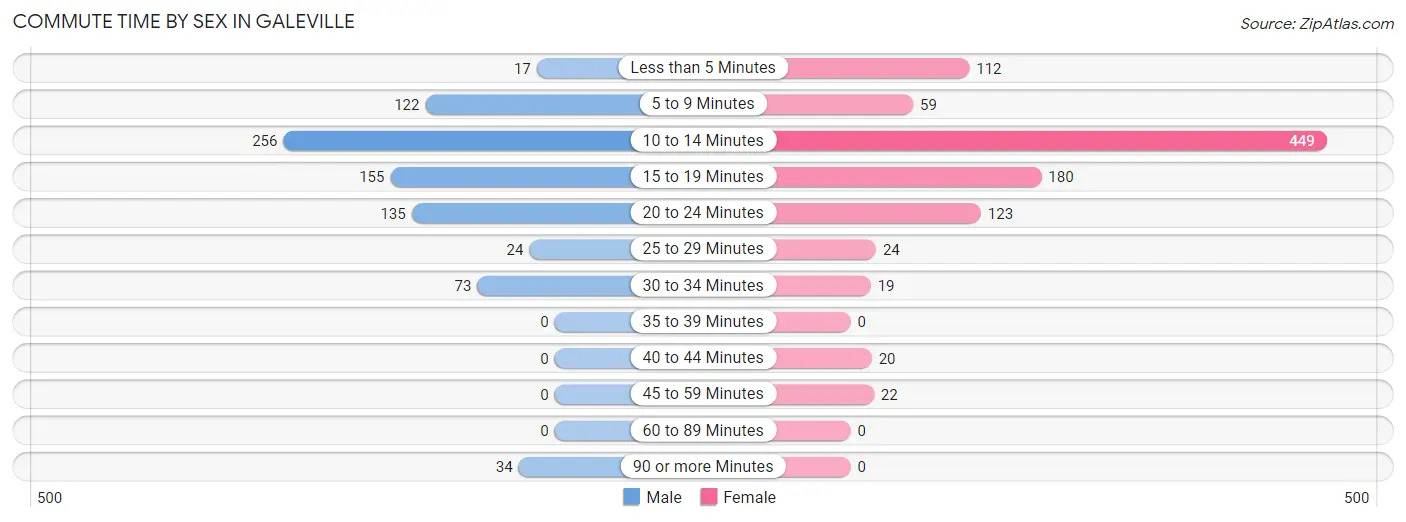
| Commute Time | Male | Female |
| Less than 5 Minutes | 17 (2.1%) | 112 (11.1%) |
| 5 to 9 Minutes | 122 (14.9%) | 59 (5.9%) |
| 10 to 14 Minutes | 256 (31.4%) | 449 (44.5%) |
| 15 to 19 Minutes | 155 (19.0%) | 180 (17.9%) |
| 20 to 24 Minutes | 135 (16.5%) | 123 (12.2%) |
| 25 to 29 Minutes | 24 (2.9%) | 24 (2.4%) |
| 30 to 34 Minutes | 73 (8.9%) | 19 (1.9%) |
| 35 to 39 Minutes | 0 (0.0%) | 0 (0.0%) |
| 40 to 44 Minutes | 0 (0.0%) | 20 (2.0%) |
| 45 to 59 Minutes | 0 (0.0%) | 22 (2.2%) |
| 60 to 89 Minutes | 0 (0.0%) | 0 (0.0%) |
| 90 or more Minutes | 34 (4.2%) | 0 (0.0%) |
Time of Departure to Work by Sex in Galeville
The most frequent times of departure to work in Galeville are 6:00 AM to 6:29 AM (154, 18.9%) for males and 8:00 AM to 8:29 AM (254, 25.2%) for females.
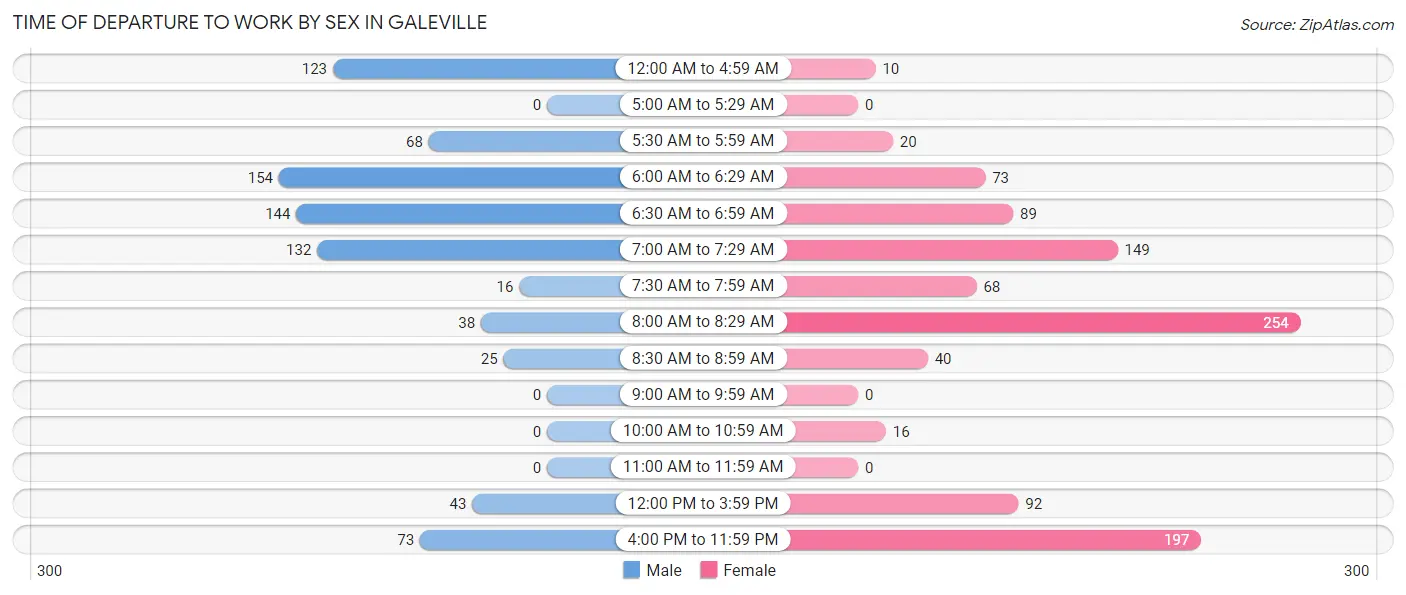
| Time of Departure | Male | Female |
| 12:00 AM to 4:59 AM | 123 (15.1%) | 10 (1.0%) |
| 5:00 AM to 5:29 AM | 0 (0.0%) | 0 (0.0%) |
| 5:30 AM to 5:59 AM | 68 (8.3%) | 20 (2.0%) |
| 6:00 AM to 6:29 AM | 154 (18.9%) | 73 (7.2%) |
| 6:30 AM to 6:59 AM | 144 (17.6%) | 89 (8.8%) |
| 7:00 AM to 7:29 AM | 132 (16.2%) | 149 (14.8%) |
| 7:30 AM to 7:59 AM | 16 (2.0%) | 68 (6.8%) |
| 8:00 AM to 8:29 AM | 38 (4.7%) | 254 (25.2%) |
| 8:30 AM to 8:59 AM | 25 (3.1%) | 40 (4.0%) |
| 9:00 AM to 9:59 AM | 0 (0.0%) | 0 (0.0%) |
| 10:00 AM to 10:59 AM | 0 (0.0%) | 16 (1.6%) |
| 11:00 AM to 11:59 AM | 0 (0.0%) | 0 (0.0%) |
| 12:00 PM to 3:59 PM | 43 (5.3%) | 92 (9.1%) |
| 4:00 PM to 11:59 PM | 73 (8.9%) | 197 (19.5%) |
| Total | 816 (100.0%) | 1,008 (100.0%) |
Housing Occupancy in Galeville
Occupancy by Ownership in Galeville
Of the total 1,995 dwellings in Galeville, owner-occupied units account for 1,312 (65.8%), while renter-occupied units make up 683 (34.2%).
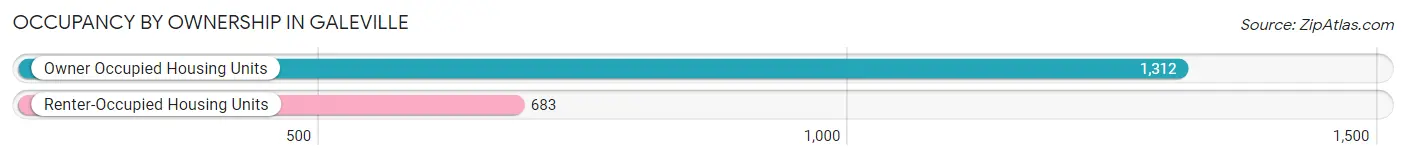
| Occupancy | # Housing Units | % Housing Units |
| Owner Occupied Housing Units | 1,312 | 65.8% |
| Renter-Occupied Housing Units | 683 | 34.2% |
| Total Occupied Housing Units | 1,995 | 100.0% |
Occupancy by Household Size in Galeville
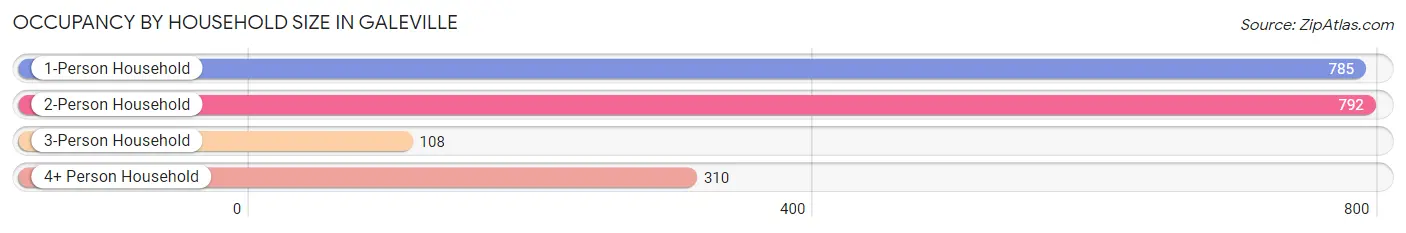
| Household Size | # Housing Units | % Housing Units |
| 1-Person Household | 785 | 39.4% |
| 2-Person Household | 792 | 39.7% |
| 3-Person Household | 108 | 5.4% |
| 4+ Person Household | 310 | 15.5% |
| Total Housing Units | 1,995 | 100.0% |
Occupancy by Ownership by Household Size in Galeville
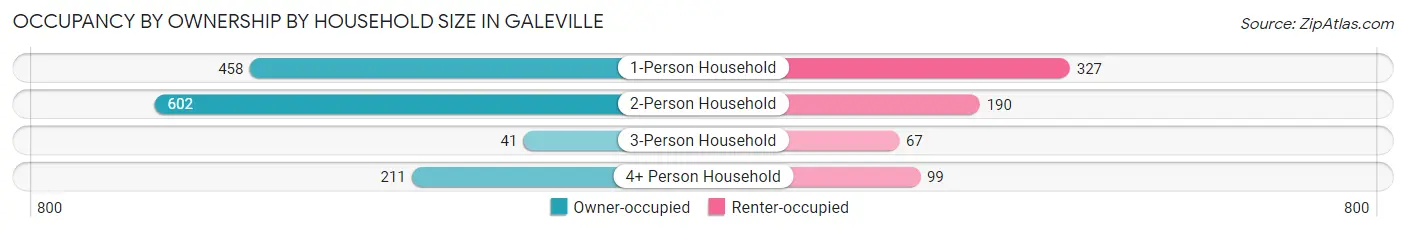
| Household Size | Owner-occupied | Renter-occupied |
| 1-Person Household | 458 (58.3%) | 327 (41.7%) |
| 2-Person Household | 602 (76.0%) | 190 (24.0%) |
| 3-Person Household | 41 (38.0%) | 67 (62.0%) |
| 4+ Person Household | 211 (68.1%) | 99 (31.9%) |
| Total Housing Units | 1,312 (65.8%) | 683 (34.2%) |
Occupancy by Educational Attainment in Galeville
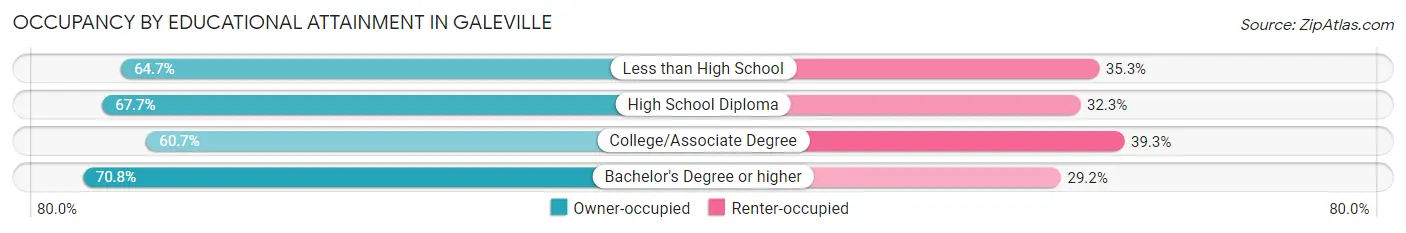
| Household Size | Owner-occupied | Renter-occupied |
| Less than High School | 119 (64.7%) | 65 (35.3%) |
| High School Diploma | 450 (67.7%) | 215 (32.3%) |
| College/Associate Degree | 409 (60.7%) | 265 (39.3%) |
| Bachelor's Degree or higher | 334 (70.8%) | 138 (29.2%) |
Occupancy by Age of Householder in Galeville
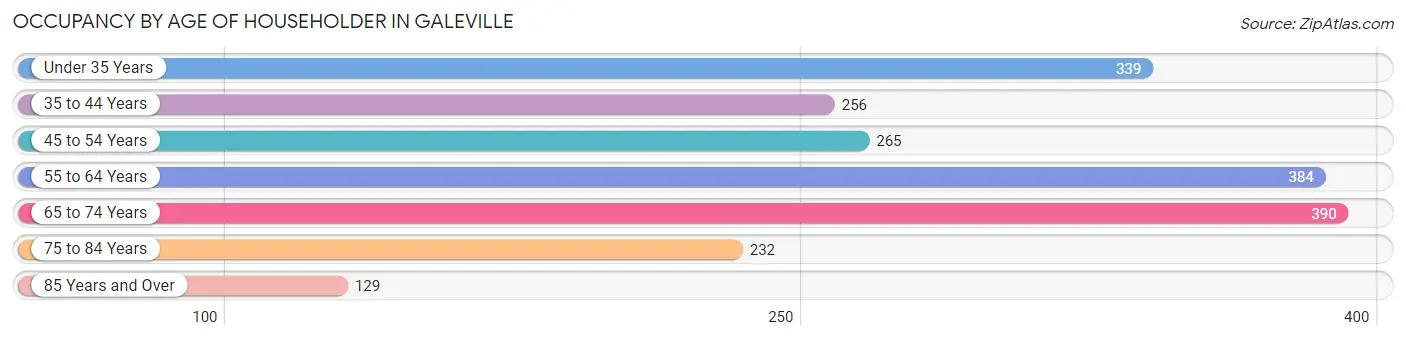
| Age Bracket | # Households | % Households |
| Under 35 Years | 339 | 17.0% |
| 35 to 44 Years | 256 | 12.8% |
| 45 to 54 Years | 265 | 13.3% |
| 55 to 64 Years | 384 | 19.3% |
| 65 to 74 Years | 390 | 19.6% |
| 75 to 84 Years | 232 | 11.6% |
| 85 Years and Over | 129 | 6.5% |
| Total | 1,995 | 100.0% |
Housing Finances in Galeville
Median Income by Occupancy in Galeville
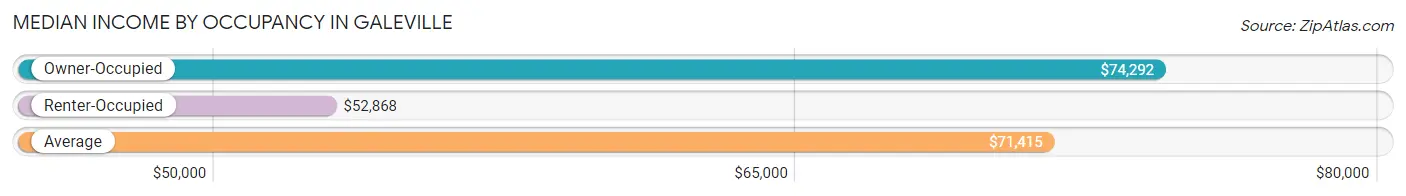
| Occupancy Type | # Households | Median Income |
| Owner-Occupied | 1,312 (65.8%) | $74,292 |
| Renter-Occupied | 683 (34.2%) | $52,868 |
| Average | 1,995 (100.0%) | $71,415 |
Occupancy by Householder Income Bracket in Galeville
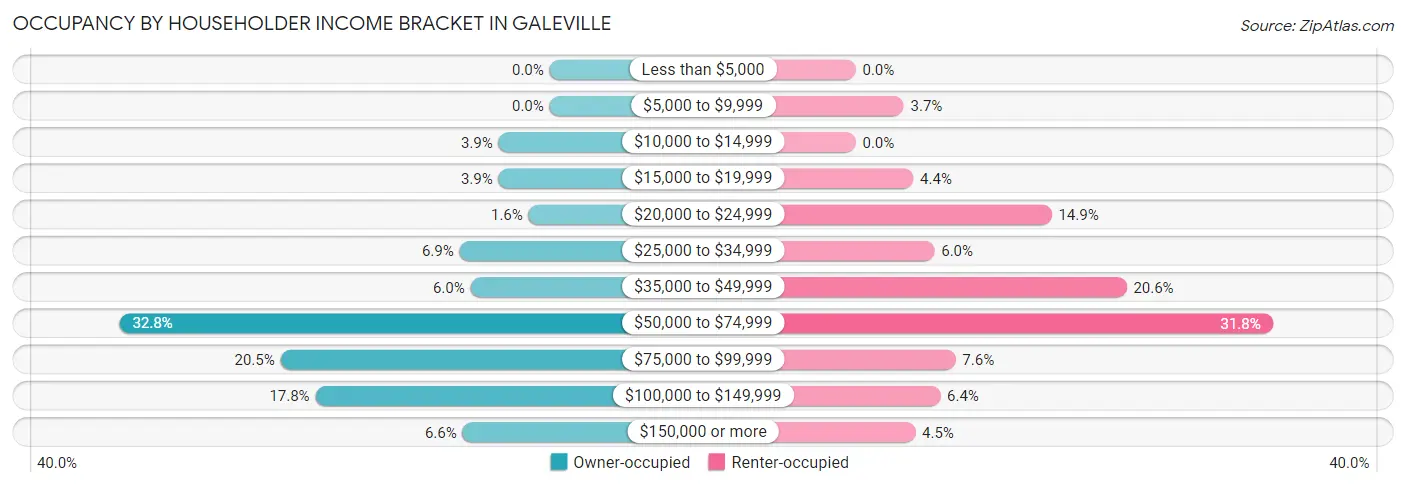
| Income Bracket | Owner-occupied | Renter-occupied |
| Less than $5,000 | 0 (0.0%) | 0 (0.0%) |
| $5,000 to $9,999 | 0 (0.0%) | 25 (3.7%) |
| $10,000 to $14,999 | 51 (3.9%) | 0 (0.0%) |
| $15,000 to $19,999 | 51 (3.9%) | 30 (4.4%) |
| $20,000 to $24,999 | 21 (1.6%) | 102 (14.9%) |
| $25,000 to $34,999 | 90 (6.9%) | 41 (6.0%) |
| $35,000 to $49,999 | 79 (6.0%) | 141 (20.6%) |
| $50,000 to $74,999 | 430 (32.8%) | 217 (31.8%) |
| $75,000 to $99,999 | 269 (20.5%) | 52 (7.6%) |
| $100,000 to $149,999 | 234 (17.8%) | 44 (6.4%) |
| $150,000 or more | 87 (6.6%) | 31 (4.5%) |
| Total | 1,312 (100.0%) | 683 (100.0%) |
Monthly Housing Cost Tiers in Galeville
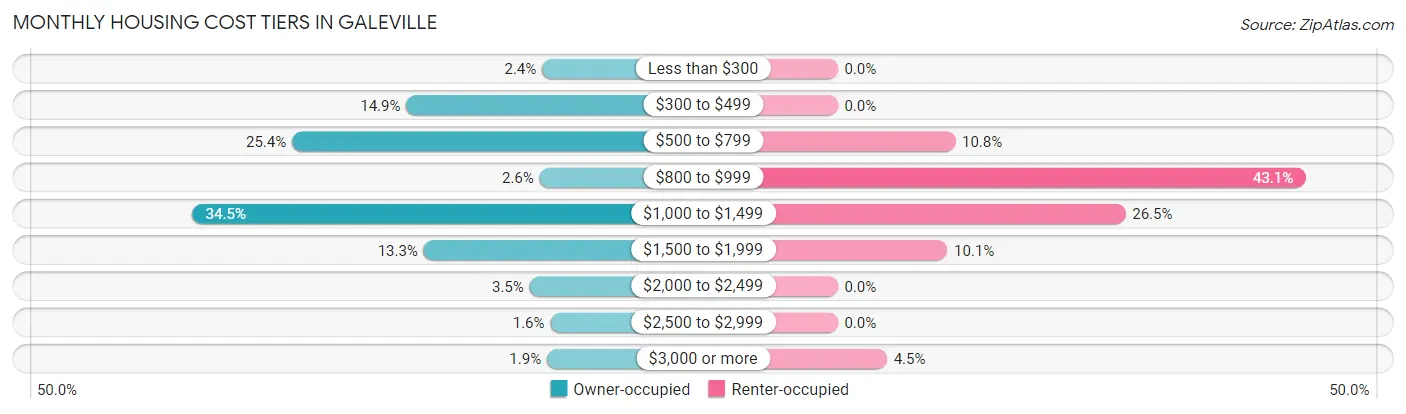
| Monthly Cost | Owner-occupied | Renter-occupied |
| Less than $300 | 31 (2.4%) | 0 (0.0%) |
| $300 to $499 | 195 (14.9%) | 0 (0.0%) |
| $500 to $799 | 333 (25.4%) | 74 (10.8%) |
| $800 to $999 | 34 (2.6%) | 294 (43.0%) |
| $1,000 to $1,499 | 453 (34.5%) | 181 (26.5%) |
| $1,500 to $1,999 | 174 (13.3%) | 69 (10.1%) |
| $2,000 to $2,499 | 46 (3.5%) | 0 (0.0%) |
| $2,500 to $2,999 | 21 (1.6%) | 0 (0.0%) |
| $3,000 or more | 25 (1.9%) | 31 (4.5%) |
| Total | 1,312 (100.0%) | 683 (100.0%) |
Physical Housing Characteristics in Galeville
Housing Structures in Galeville
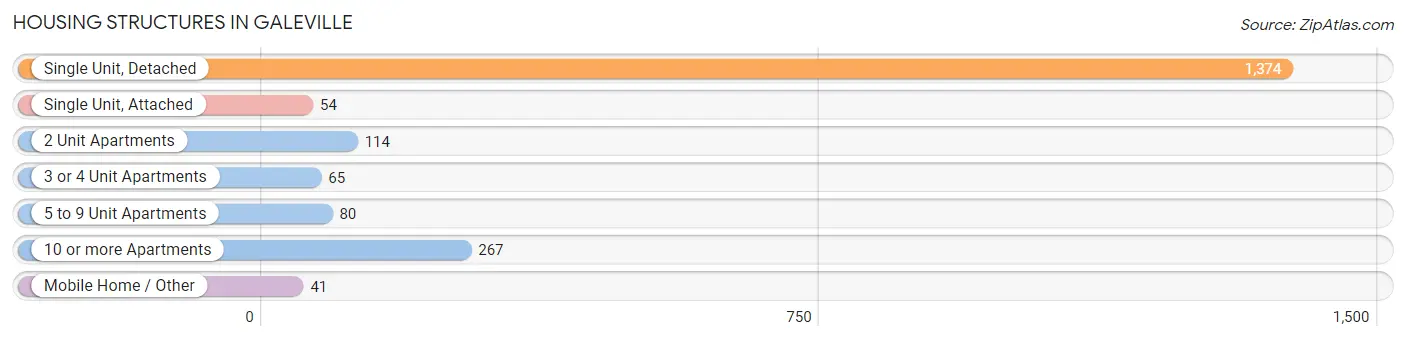
| Structure Type | # Housing Units | % Housing Units |
| Single Unit, Detached | 1,374 | 68.9% |
| Single Unit, Attached | 54 | 2.7% |
| 2 Unit Apartments | 114 | 5.7% |
| 3 or 4 Unit Apartments | 65 | 3.3% |
| 5 to 9 Unit Apartments | 80 | 4.0% |
| 10 or more Apartments | 267 | 13.4% |
| Mobile Home / Other | 41 | 2.1% |
| Total | 1,995 | 100.0% |
Housing Structures by Occupancy in Galeville
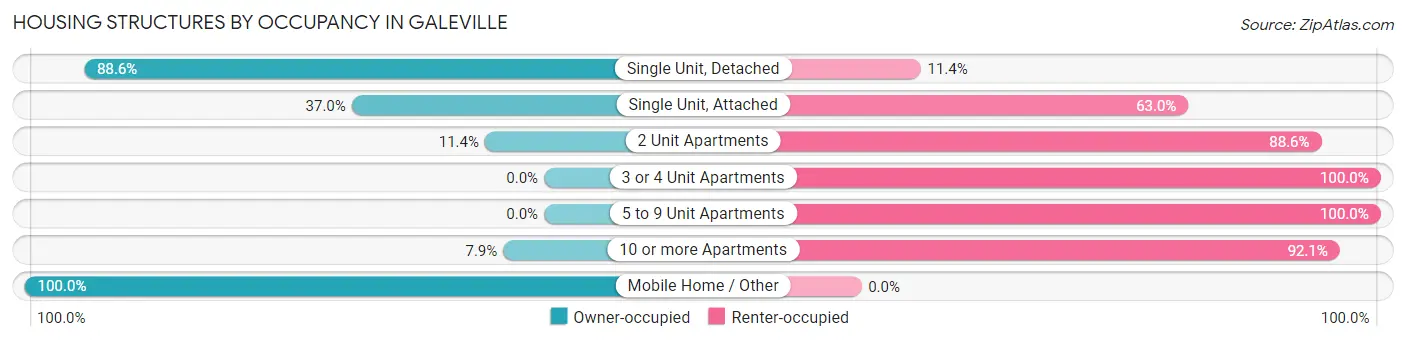
| Structure Type | Owner-occupied | Renter-occupied |
| Single Unit, Detached | 1,217 (88.6%) | 157 (11.4%) |
| Single Unit, Attached | 20 (37.0%) | 34 (63.0%) |
| 2 Unit Apartments | 13 (11.4%) | 101 (88.6%) |
| 3 or 4 Unit Apartments | 0 (0.0%) | 65 (100.0%) |
| 5 to 9 Unit Apartments | 0 (0.0%) | 80 (100.0%) |
| 10 or more Apartments | 21 (7.9%) | 246 (92.1%) |
| Mobile Home / Other | 41 (100.0%) | 0 (0.0%) |
| Total | 1,312 (65.8%) | 683 (34.2%) |
Housing Structures by Number of Rooms in Galeville
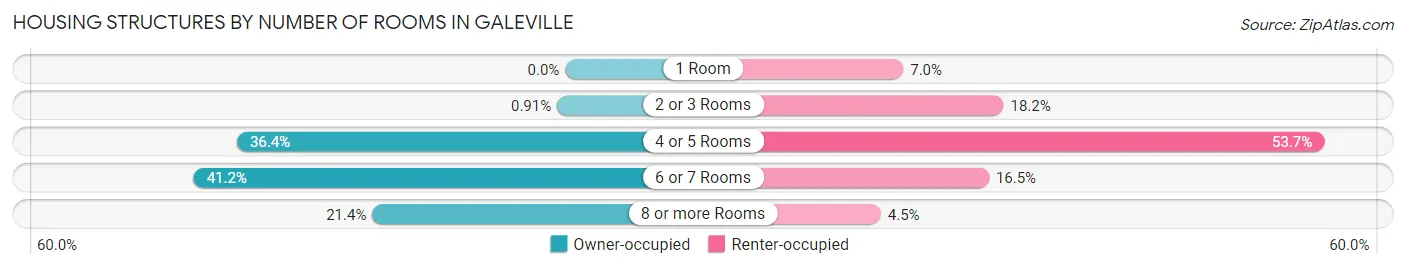
| Number of Rooms | Owner-occupied | Renter-occupied |
| 1 Room | 0 (0.0%) | 48 (7.0%) |
| 2 or 3 Rooms | 12 (0.9%) | 124 (18.2%) |
| 4 or 5 Rooms | 478 (36.4%) | 367 (53.7%) |
| 6 or 7 Rooms | 541 (41.2%) | 113 (16.5%) |
| 8 or more Rooms | 281 (21.4%) | 31 (4.5%) |
| Total | 1,312 (100.0%) | 683 (100.0%) |
Housing Structure by Heating Type in Galeville
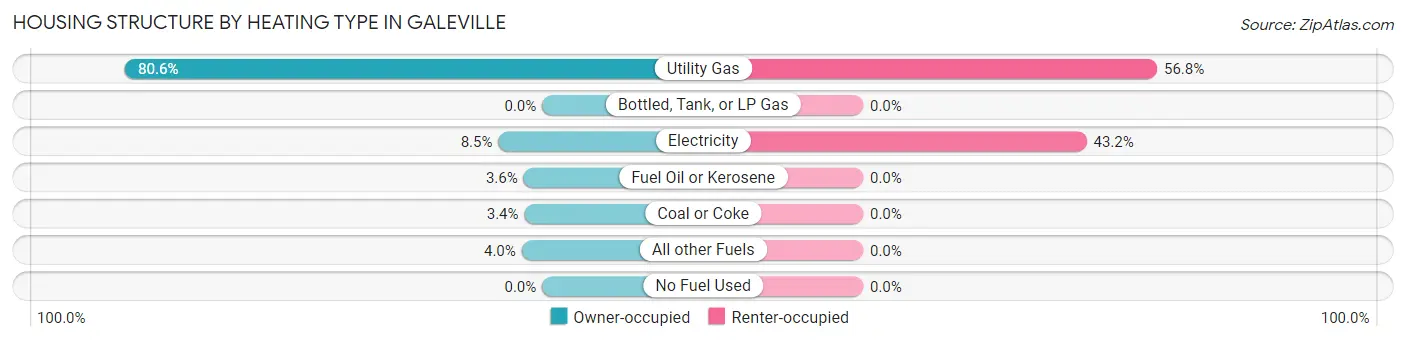
| Heating Type | Owner-occupied | Renter-occupied |
| Utility Gas | 1,057 (80.6%) | 388 (56.8%) |
| Bottled, Tank, or LP Gas | 0 (0.0%) | 0 (0.0%) |
| Electricity | 111 (8.5%) | 295 (43.2%) |
| Fuel Oil or Kerosene | 47 (3.6%) | 0 (0.0%) |
| Coal or Coke | 45 (3.4%) | 0 (0.0%) |
| All other Fuels | 52 (4.0%) | 0 (0.0%) |
| No Fuel Used | 0 (0.0%) | 0 (0.0%) |
| Total | 1,312 (100.0%) | 683 (100.0%) |
Household Vehicle Usage in Galeville
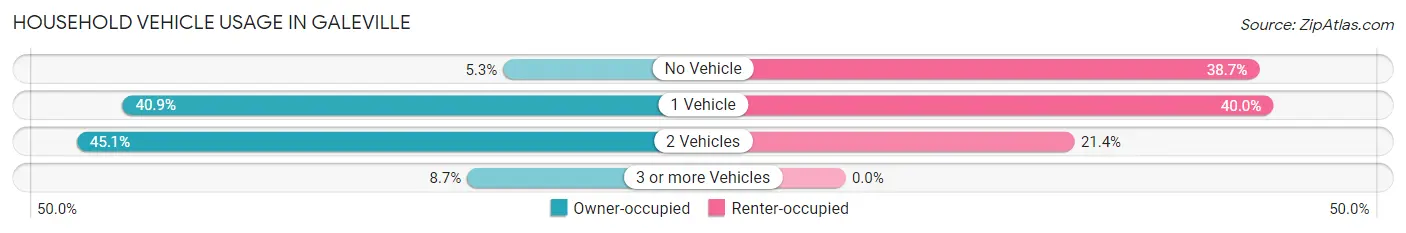
| Vehicles per Household | Owner-occupied | Renter-occupied |
| No Vehicle | 70 (5.3%) | 264 (38.7%) |
| 1 Vehicle | 536 (40.8%) | 273 (40.0%) |
| 2 Vehicles | 592 (45.1%) | 146 (21.4%) |
| 3 or more Vehicles | 114 (8.7%) | 0 (0.0%) |
| Total | 1,312 (100.0%) | 683 (100.0%) |
Real Estate & Mortgages in Galeville
Real Estate and Mortgage Overview in Galeville
| Characteristic | Without Mortgage | With Mortgage |
| Housing Units | 359 | 953 |
| Median Property Value | $104,600 | $121,800 |
| Median Household Income | $68,125 | $76 |
| Monthly Housing Costs | $392 | $25 |
| Real Estate Taxes | $1,903 | $20 |
Property Value by Mortgage Status in Galeville
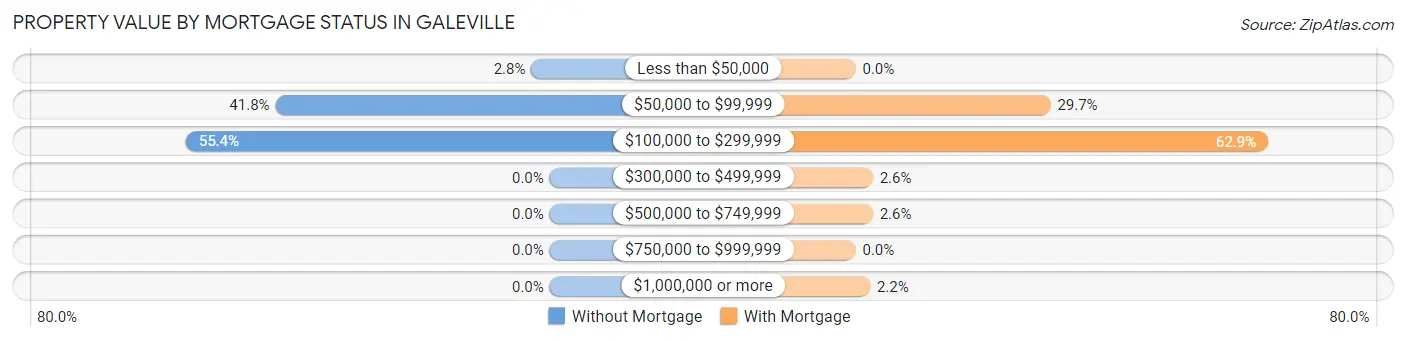
| Property Value | Without Mortgage | With Mortgage |
| Less than $50,000 | 10 (2.8%) | 0 (0.0%) |
| $50,000 to $99,999 | 150 (41.8%) | 283 (29.7%) |
| $100,000 to $299,999 | 199 (55.4%) | 599 (62.8%) |
| $300,000 to $499,999 | 0 (0.0%) | 25 (2.6%) |
| $500,000 to $749,999 | 0 (0.0%) | 25 (2.6%) |
| $750,000 to $999,999 | 0 (0.0%) | 0 (0.0%) |
| $1,000,000 or more | 0 (0.0%) | 21 (2.2%) |
| Total | 359 (100.0%) | 953 (100.0%) |
Household Income by Mortgage Status in Galeville
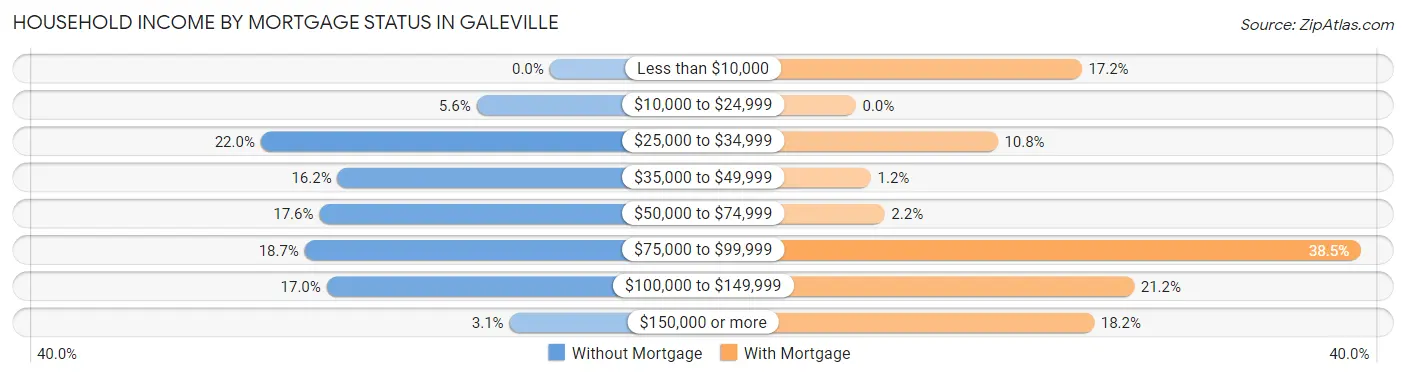
| Household Income | Without Mortgage | With Mortgage |
| Less than $10,000 | 0 (0.0%) | 164 (17.2%) |
| $10,000 to $24,999 | 20 (5.6%) | 0 (0.0%) |
| $25,000 to $34,999 | 79 (22.0%) | 103 (10.8%) |
| $35,000 to $49,999 | 58 (16.2%) | 11 (1.1%) |
| $50,000 to $74,999 | 63 (17.5%) | 21 (2.2%) |
| $75,000 to $99,999 | 67 (18.7%) | 367 (38.5%) |
| $100,000 to $149,999 | 61 (17.0%) | 202 (21.2%) |
| $150,000 or more | 11 (3.1%) | 173 (18.1%) |
| Total | 359 (100.0%) | 953 (100.0%) |
Property Value to Household Income Ratio in Galeville
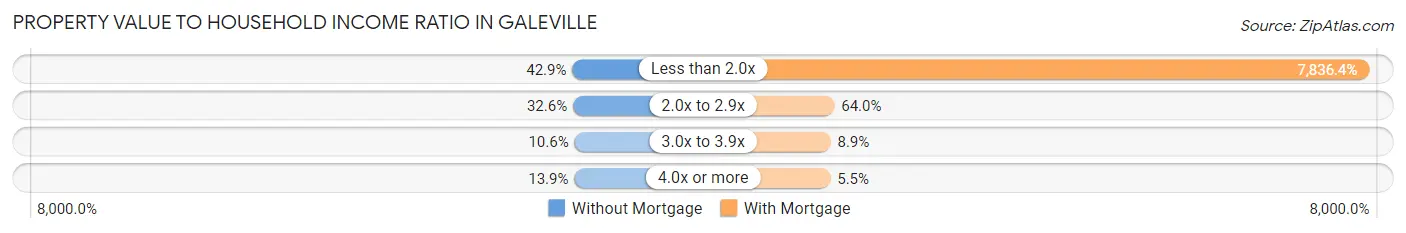
| Value-to-Income Ratio | Without Mortgage | With Mortgage |
| Less than 2.0x | 154 (42.9%) | 74,681 (7,836.4%) |
| 2.0x to 2.9x | 117 (32.6%) | 610 (64.0%) |
| 3.0x to 3.9x | 38 (10.6%) | 85 (8.9%) |
| 4.0x or more | 50 (13.9%) | 52 (5.5%) |
| Total | 359 (100.0%) | 953 (100.0%) |
Real Estate Taxes by Mortgage Status in Galeville
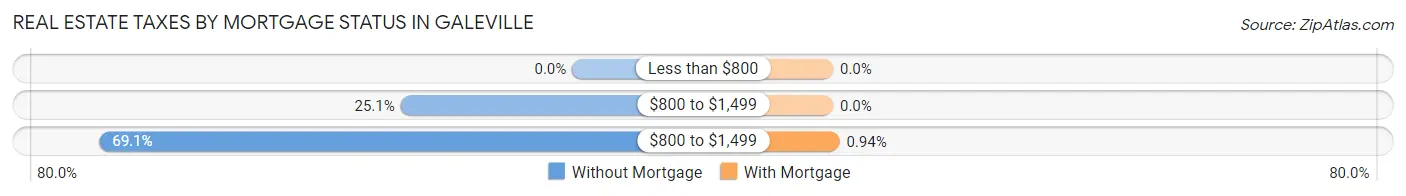
| Property Taxes | Without Mortgage | With Mortgage |
| Less than $800 | 0 (0.0%) | 0 (0.0%) |
| $800 to $1,499 | 90 (25.1%) | 0 (0.0%) |
| $800 to $1,499 | 248 (69.1%) | 9 (0.9%) |
| Total | 359 (100.0%) | 953 (100.0%) |
Health & Disability in Galeville
Health Insurance Coverage by Age in Galeville
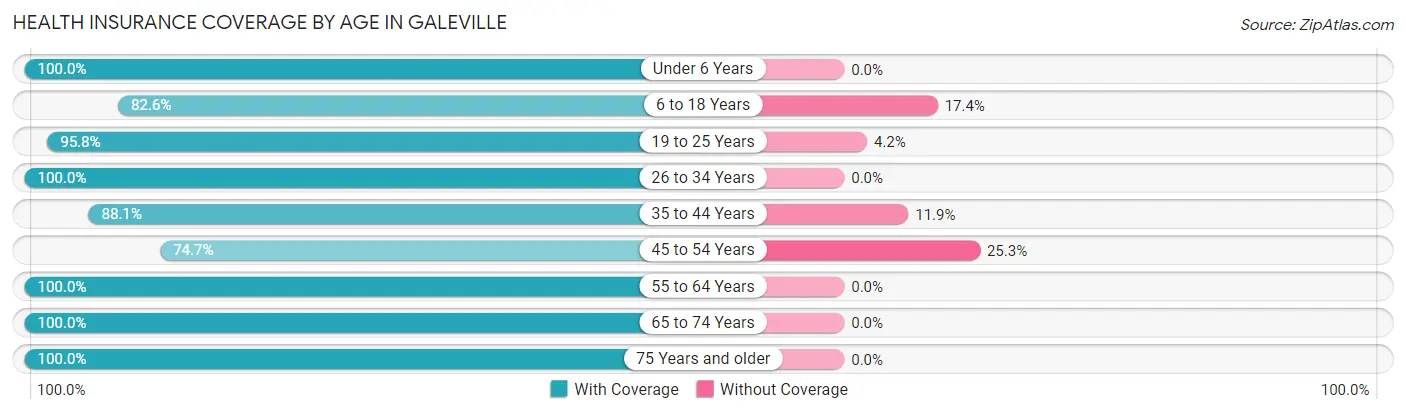
| Age Bracket | With Coverage | Without Coverage |
| Under 6 Years | 231 (100.0%) | 0 (0.0%) |
| 6 to 18 Years | 512 (82.6%) | 108 (17.4%) |
| 19 to 25 Years | 384 (95.8%) | 17 (4.2%) |
| 26 to 34 Years | 470 (100.0%) | 0 (0.0%) |
| 35 to 44 Years | 531 (88.1%) | 72 (11.9%) |
| 45 to 54 Years | 369 (74.7%) | 125 (25.3%) |
| 55 to 64 Years | 730 (100.0%) | 0 (0.0%) |
| 65 to 74 Years | 641 (100.0%) | 0 (0.0%) |
| 75 Years and older | 401 (100.0%) | 0 (0.0%) |
| Total | 4,269 (93.0%) | 322 (7.0%) |
Health Insurance Coverage by Citizenship Status in Galeville
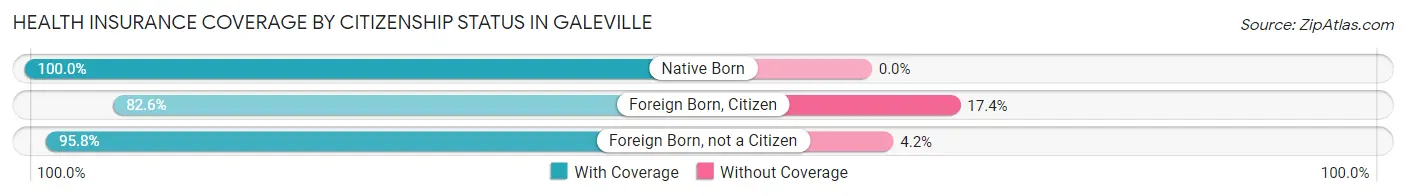
| Citizenship Status | With Coverage | Without Coverage |
| Native Born | 231 (100.0%) | 0 (0.0%) |
| Foreign Born, Citizen | 512 (82.6%) | 108 (17.4%) |
| Foreign Born, not a Citizen | 384 (95.8%) | 17 (4.2%) |
Health Insurance Coverage by Household Income in Galeville
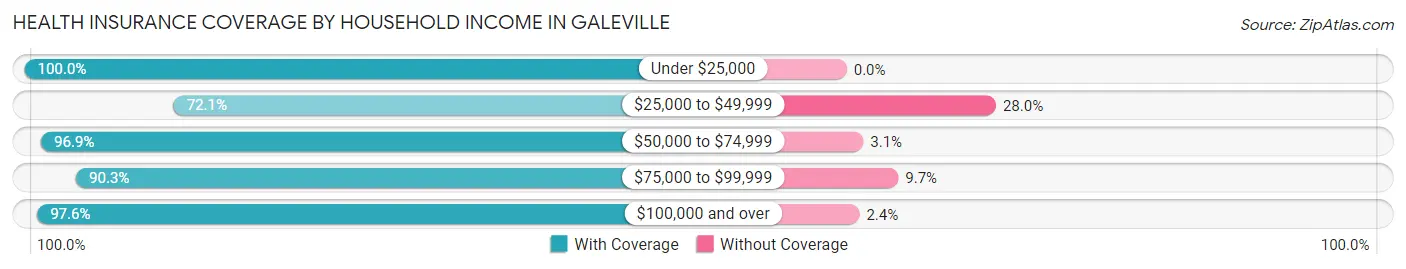
| Household Income | With Coverage | Without Coverage |
| Under $25,000 | 335 (100.0%) | 0 (0.0%) |
| $25,000 to $49,999 | 464 (72.1%) | 180 (28.0%) |
| $50,000 to $74,999 | 1,595 (96.9%) | 51 (3.1%) |
| $75,000 to $99,999 | 561 (90.3%) | 60 (9.7%) |
| $100,000 and over | 1,279 (97.6%) | 31 (2.4%) |
Public vs Private Health Insurance Coverage by Age in Galeville
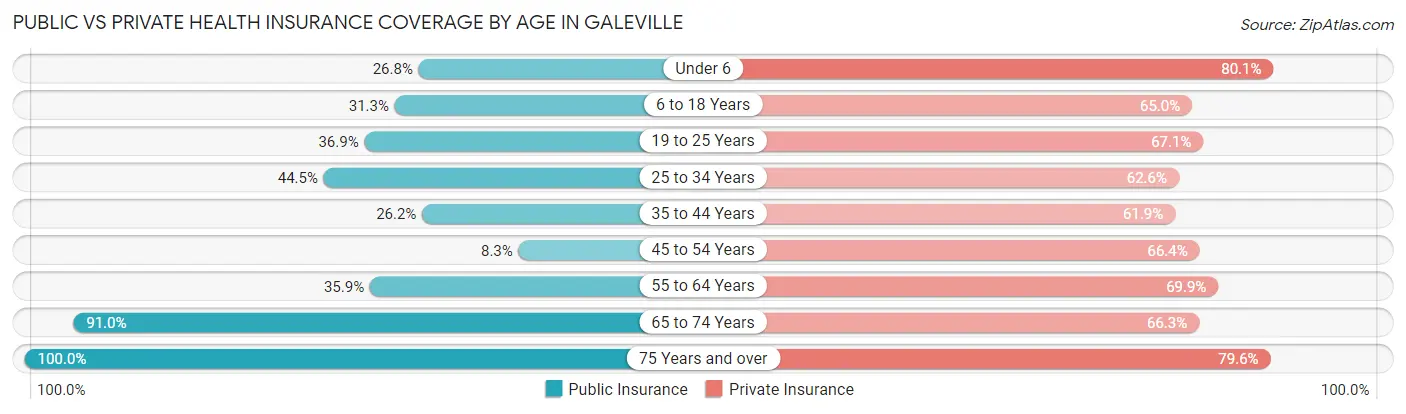
| Age Bracket | Public Insurance | Private Insurance |
| Under 6 | 62 (26.8%) | 185 (80.1%) |
| 6 to 18 Years | 194 (31.3%) | 403 (65.0%) |
| 19 to 25 Years | 148 (36.9%) | 269 (67.1%) |
| 25 to 34 Years | 209 (44.5%) | 294 (62.5%) |
| 35 to 44 Years | 158 (26.2%) | 373 (61.9%) |
| 45 to 54 Years | 41 (8.3%) | 328 (66.4%) |
| 55 to 64 Years | 262 (35.9%) | 510 (69.9%) |
| 65 to 74 Years | 583 (90.9%) | 425 (66.3%) |
| 75 Years and over | 401 (100.0%) | 319 (79.5%) |
| Total | 2,058 (44.8%) | 3,106 (67.6%) |
Disability Status by Sex by Age in Galeville
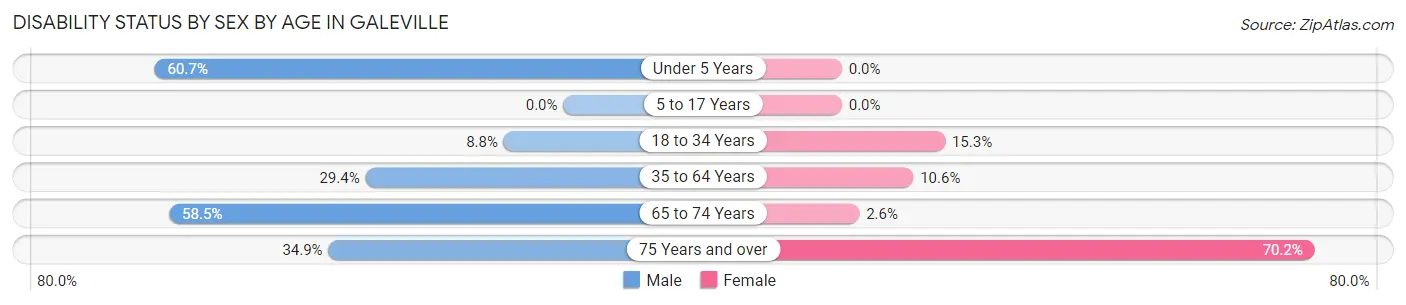
| Age Bracket | Male | Female |
| Under 5 Years | 34 (60.7%) | 0 (0.0%) |
| 5 to 17 Years | 0 (0.0%) | 0 (0.0%) |
| 18 to 34 Years | 32 (8.8%) | 78 (15.3%) |
| 35 to 64 Years | 282 (29.4%) | 92 (10.6%) |
| 65 to 74 Years | 127 (58.5%) | 11 (2.6%) |
| 75 Years and over | 45 (34.9%) | 191 (70.2%) |
Disability Class by Sex by Age in Galeville
Disability Class: Hearing Difficulty
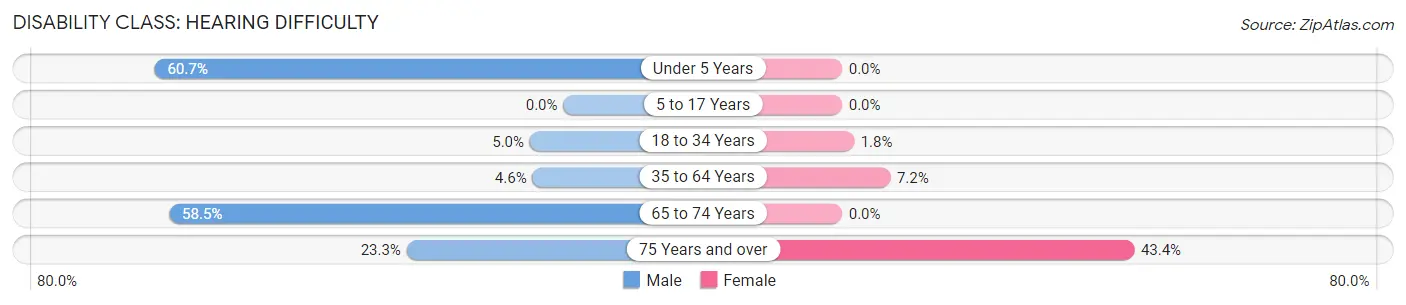
| Age Bracket | Male | Female |
| Under 5 Years | 34 (60.7%) | 0 (0.0%) |
| 5 to 17 Years | 0 (0.0%) | 0 (0.0%) |
| 18 to 34 Years | 18 (5.0%) | 9 (1.8%) |
| 35 to 64 Years | 44 (4.6%) | 62 (7.1%) |
| 65 to 74 Years | 127 (58.5%) | 0 (0.0%) |
| 75 Years and over | 30 (23.3%) | 118 (43.4%) |
Disability Class: Vision Difficulty
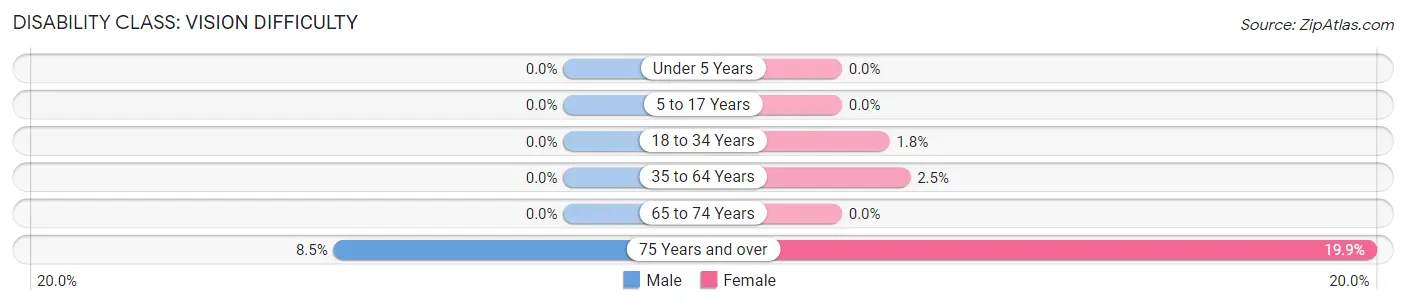
| Age Bracket | Male | Female |
| Under 5 Years | 0 (0.0%) | 0 (0.0%) |
| 5 to 17 Years | 0 (0.0%) | 0 (0.0%) |
| 18 to 34 Years | 0 (0.0%) | 9 (1.8%) |
| 35 to 64 Years | 0 (0.0%) | 22 (2.5%) |
| 65 to 74 Years | 0 (0.0%) | 0 (0.0%) |
| 75 Years and over | 11 (8.5%) | 54 (19.9%) |
Disability Class: Cognitive Difficulty
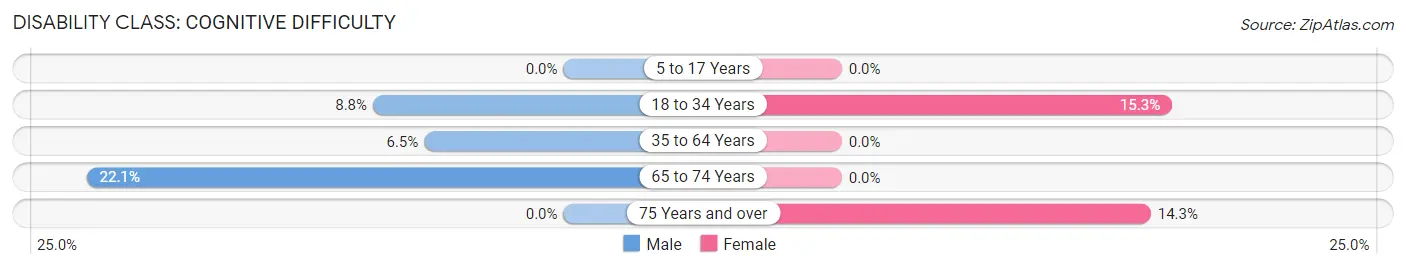
| Age Bracket | Male | Female |
| 5 to 17 Years | 0 (0.0%) | 0 (0.0%) |
| 18 to 34 Years | 32 (8.8%) | 78 (15.3%) |
| 35 to 64 Years | 62 (6.5%) | 0 (0.0%) |
| 65 to 74 Years | 48 (22.1%) | 0 (0.0%) |
| 75 Years and over | 0 (0.0%) | 39 (14.3%) |
Disability Class: Ambulatory Difficulty
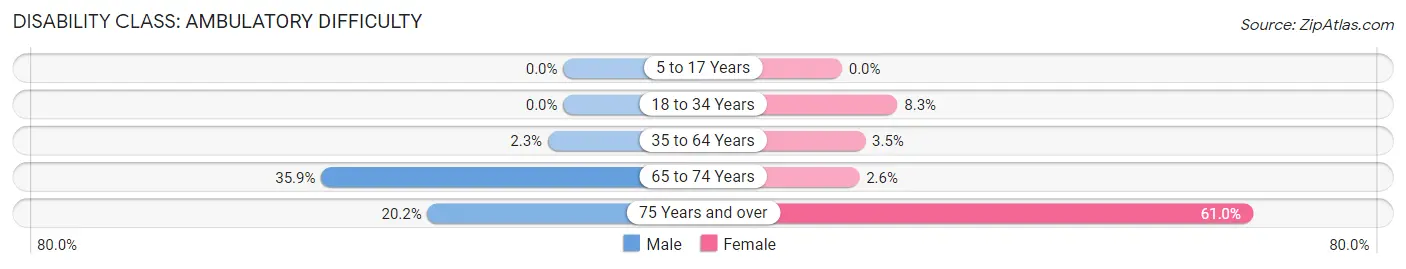
| Age Bracket | Male | Female |
| 5 to 17 Years | 0 (0.0%) | 0 (0.0%) |
| 18 to 34 Years | 0 (0.0%) | 42 (8.3%) |
| 35 to 64 Years | 22 (2.3%) | 30 (3.5%) |
| 65 to 74 Years | 78 (35.9%) | 11 (2.6%) |
| 75 Years and over | 26 (20.2%) | 166 (61.0%) |
Disability Class: Self-Care Difficulty
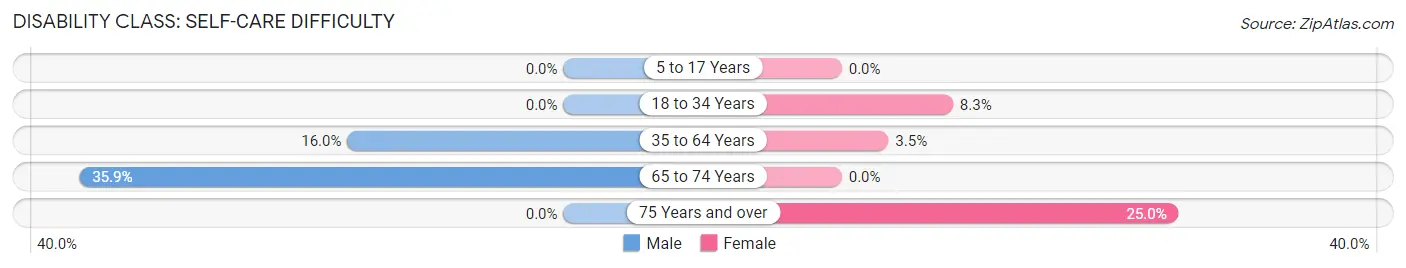
| Age Bracket | Male | Female |
| 5 to 17 Years | 0 (0.0%) | 0 (0.0%) |
| 18 to 34 Years | 0 (0.0%) | 42 (8.3%) |
| 35 to 64 Years | 154 (16.0%) | 30 (3.5%) |
| 65 to 74 Years | 78 (35.9%) | 0 (0.0%) |
| 75 Years and over | 0 (0.0%) | 68 (25.0%) |
Technology Access in Galeville
Computing Device Access in Galeville
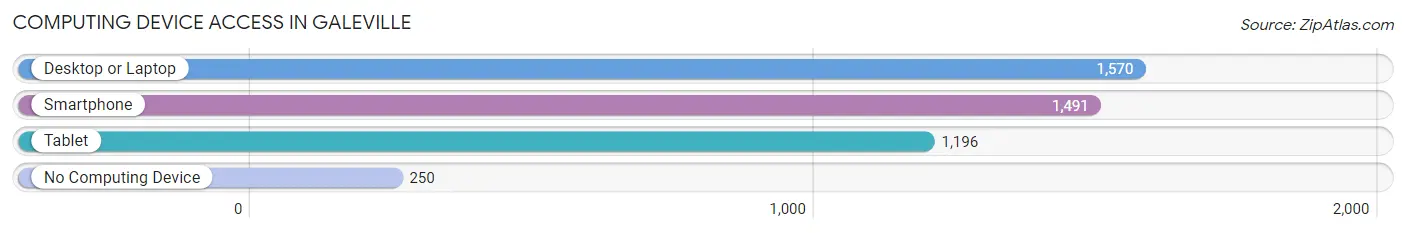
| Device Type | # Households | % Households |
| Desktop or Laptop | 1,570 | 78.7% |
| Smartphone | 1,491 | 74.7% |
| Tablet | 1,196 | 60.0% |
| No Computing Device | 250 | 12.5% |
| Total | 1,995 | 100.0% |
Internet Access in Galeville
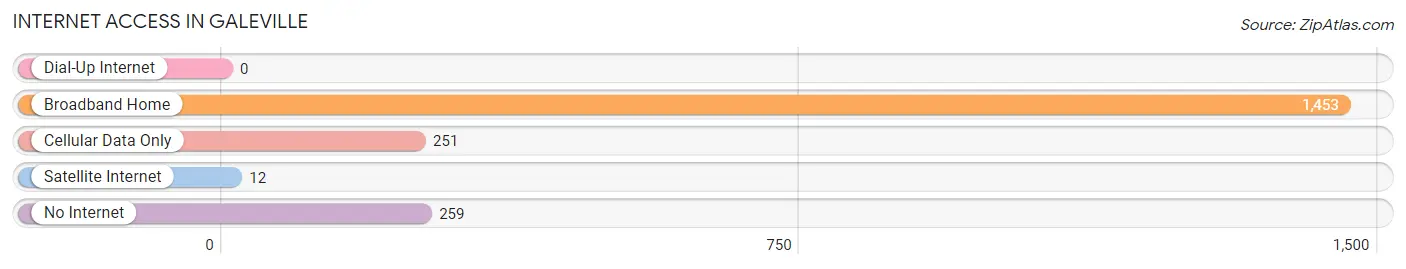
| Internet Type | # Households | % Households |
| Dial-Up Internet | 0 | 0.0% |
| Broadband Home | 1,453 | 72.8% |
| Cellular Data Only | 251 | 12.6% |
| Satellite Internet | 12 | 0.6% |
| No Internet | 259 | 13.0% |
| Total | 1,995 | 100.0% |
Galeville Summary
Galeville is a small hamlet located in the town of Lysander in Onondaga County, New York. It is situated on the eastern shore of Onondaga Lake, approximately 8 miles north of Syracuse. The hamlet is home to a population of approximately 1,000 people and is part of the Syracuse Metropolitan Statistical Area.
History
Galeville was first settled in the early 1800s by a group of settlers from Connecticut. The hamlet was originally known as “Gale’s Mills” after the first settler, John Gale. The name was later changed to “Galeville” in 1832.
Galeville was an important stop on the Syracuse and Chenango Valley Railroad, which ran from Syracuse to Binghamton. The railroad was built in 1869 and provided a direct connection between Syracuse and Binghamton. The railroad was later abandoned in the late 1950s.
Geography
Galeville is located in the town of Lysander in Onondaga County, New York. It is situated on the eastern shore of Onondaga Lake, approximately 8 miles north of Syracuse. The hamlet is located at an elevation of approximately 400 feet above sea level.
The hamlet is located in a rural area and is surrounded by farmland. The nearest major city is Syracuse, which is located approximately 8 miles to the south.
Economy
Galeville’s economy is largely based on agriculture and tourism. The hamlet is home to several farms, which produce a variety of crops, including corn, soybeans, and hay. The hamlet is also home to several wineries, which produce a variety of wines.
Galeville is also a popular tourist destination. The hamlet is home to several parks, including Onondaga Lake Park and Lysander Park. The hamlet is also home to several restaurants, shops, and other attractions.
Demographics
As of the 2010 census, the population of Galeville was 1,000. The racial makeup of the hamlet was 97.2% White, 0.7% African American, 0.2% Native American, 0.2% Asian, 0.2% from other races, and 1.7% from two or more races. Hispanic or Latino of any race were 1.2% of the population.
The median household income in Galeville was $50,000, and the median family income was $54,000. The per capita income in the hamlet was $21,000. Approximately 8.2% of the population was below the poverty line.
Common Questions
What is Per Capita Income in Galeville?
Per Capita income in Galeville is $33,030.
What is the Median Family Income in Galeville?
Median Family Income in Galeville is $74,552.
What is the Median Household income in Galeville?
Median Household Income in Galeville is $71,415.
What is Income or Wage Gap in Galeville?
Income or Wage Gap in Galeville is 5.0%.
Women in Galeville earn 95.0 cents for every dollar earned by a man.
What is Inequality or Gini Index in Galeville?
Inequality or Gini Index in Galeville is 0.31.
What is the Total Population of Galeville?
Total Population of Galeville is 4,591.
What is the Total Male Population of Galeville?
Total Male Population of Galeville is 2,080.
What is the Total Female Population of Galeville?
Total Female Population of Galeville is 2,511.
What is the Ratio of Males per 100 Females in Galeville?
There are 82.84 Males per 100 Females in Galeville.
What is the Ratio of Females per 100 Males in Galeville?
There are 120.72 Females per 100 Males in Galeville.
What is the Median Population Age in Galeville?
Median Population Age in Galeville is 44.1 Years.
What is the Average Family Size in Galeville
Average Family Size in Galeville is 3.2 People.
What is the Average Household Size in Galeville
Average Household Size in Galeville is 2.3 People.
How Large is the Labor Force in Galeville?
There are 2,156 People in the Labor Forcein in Galeville.
What is the Percentage of People in the Labor Force in Galeville?
55.3% of People are in the Labor Force in Galeville.
What is the Unemployment Rate in Galeville?
Unemployment Rate in Galeville is 10.0%.