Zip Codes with the Highest Percentage of Population Employed in Accommodation & Food Services in Rockford, IL
RELATED REPORTS & OPTIONS
Accommodation & Food Services
Rockford
Compare Zip Codes
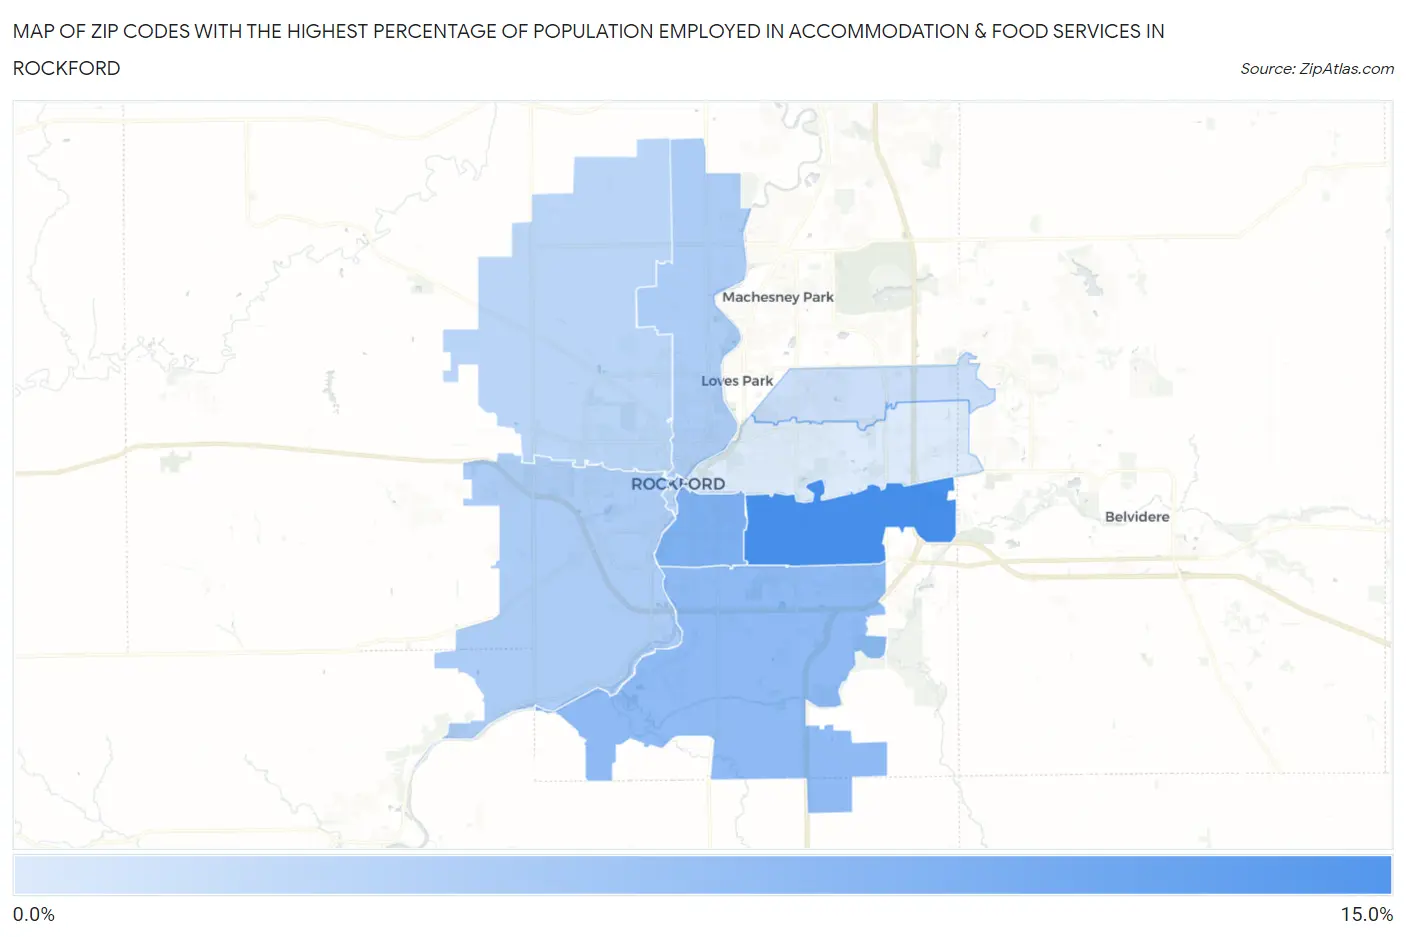
Map of Zip Codes with the Highest Percentage of Population Employed in Accommodation & Food Services in Rockford
3.8%
10.6%
Zip Codes with the Highest Percentage of Population Employed in Accommodation & Food Services in Rockford, IL
| Zip Code | % Employed | vs State | vs National | |
| 1. | 61108 | 10.6% | 6.5%(+4.16)#109 | 6.9%(+3.75)#3,854 |
| 2. | 61104 | 8.0% | 6.5%(+1.53)#270 | 6.9%(+1.12)#7,821 |
| 3. | 61109 | 7.3% | 6.5%(+0.831)#343 | 6.9%(+0.420)#9,518 |
| 4. | 61103 | 5.9% | 6.5%(-0.545)#508 | 6.9%(-0.957)#13,703 |
| 5. | 61102 | 5.9% | 6.5%(-0.562)#510 | 6.9%(-0.974)#13,749 |
| 6. | 61101 | 5.3% | 6.5%(-1.16)#604 | 6.9%(-1.57)#15,761 |
| 7. | 61114 | 4.6% | 6.5%(-1.89)#731 | 6.9%(-2.31)#18,249 |
| 8. | 61107 | 3.8% | 6.5%(-2.70)#870 | 6.9%(-3.11)#20,891 |
1
Common Questions
What are the Top 5 Zip Codes with the Highest Percentage of Population Employed in Accommodation & Food Services in Rockford, IL?
Top 5 Zip Codes with the Highest Percentage of Population Employed in Accommodation & Food Services in Rockford, IL are:
What zip code has the Highest Percentage of Population Employed in Accommodation & Food Services in Rockford, IL?
61108 has the Highest Percentage of Population Employed in Accommodation & Food Services in Rockford, IL with 10.6%.
What is the Percentage of Population Employed in Accommodation & Food Services in Rockford, IL?
Percentage of Population Employed in Accommodation & Food Services in Rockford is 7.0%.
What is the Percentage of Population Employed in Accommodation & Food Services in Illinois?
Percentage of Population Employed in Accommodation & Food Services in Illinois is 6.5%.
What is the Percentage of Population Employed in Accommodation & Food Services in the United States?
Percentage of Population Employed in Accommodation & Food Services in the United States is 6.9%.