Zip Codes with the Highest Percentage of Population Employed in Accommodation & Food Services in Wheaton, IL
RELATED REPORTS & OPTIONS
Accommodation & Food Services
Wheaton
Compare Zip Codes
Map of Zip Codes with the Highest Percentage of Population Employed in Accommodation & Food Services in Wheaton
4.1%
5.1%
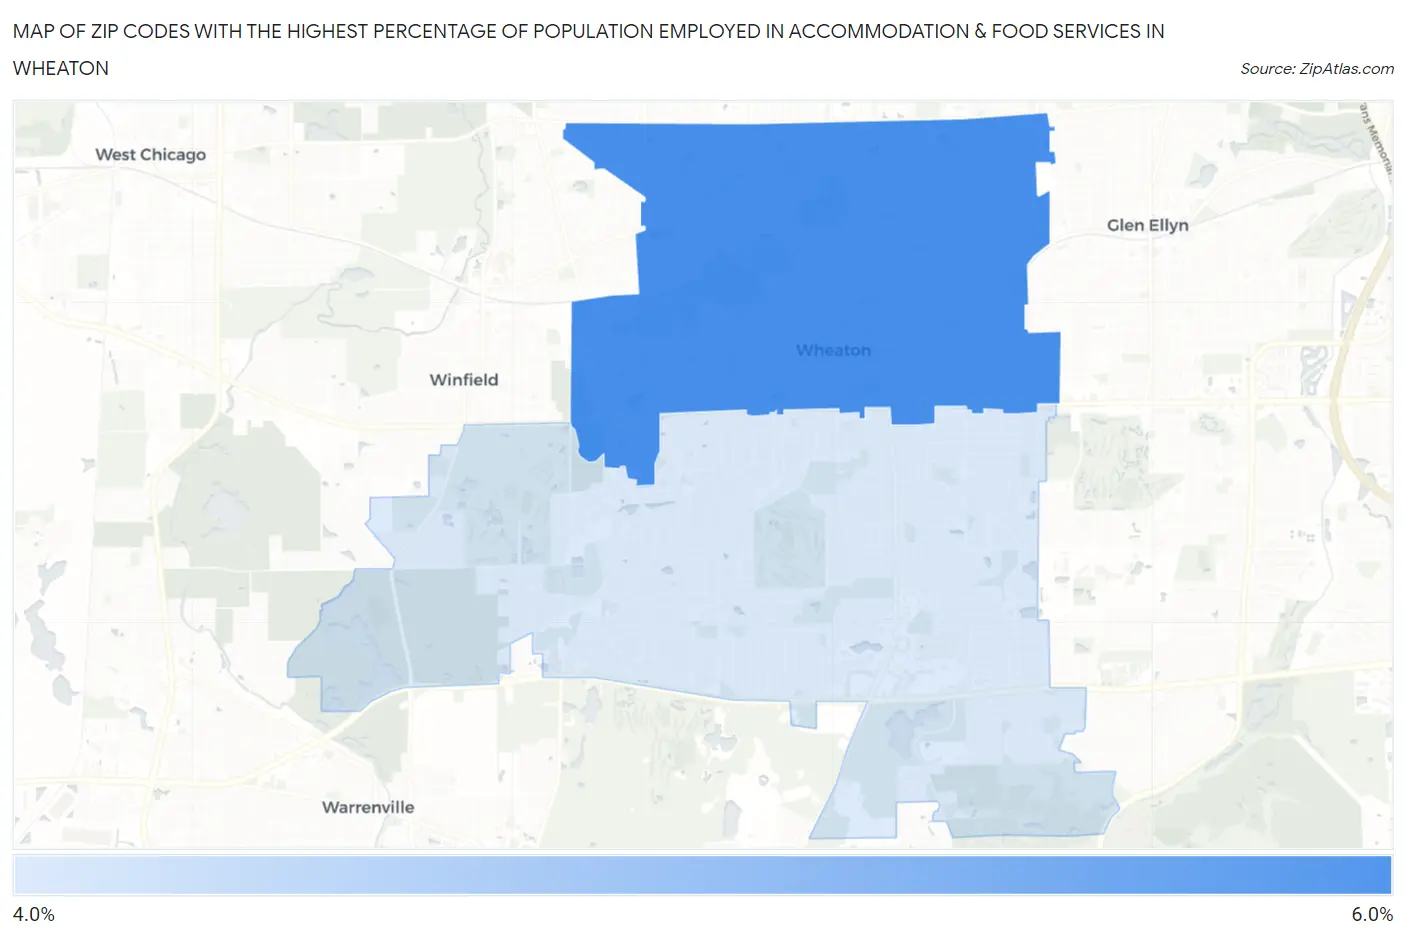
Zip Codes with the Highest Percentage of Population Employed in Accommodation & Food Services in Wheaton, IL
| Zip Code | % Employed | vs State | vs National | |
| 1. | 60187 | 5.1% | 6.5%(-1.36)#640 | 6.9%(-1.78)#16,443 |
| 2. | 60189 | 4.1% | 6.5%(-2.34)#805 | 6.9%(-2.75)#19,724 |
1
Common Questions
What are the Top Zip Codes with the Highest Percentage of Population Employed in Accommodation & Food Services in Wheaton, IL?
Top Zip Codes with the Highest Percentage of Population Employed in Accommodation & Food Services in Wheaton, IL are:
What zip code has the Highest Percentage of Population Employed in Accommodation & Food Services in Wheaton, IL?
60187 has the Highest Percentage of Population Employed in Accommodation & Food Services in Wheaton, IL with 5.1%.
What is the Percentage of Population Employed in Accommodation & Food Services in Wheaton, IL?
Percentage of Population Employed in Accommodation & Food Services in Wheaton is 4.8%.
What is the Percentage of Population Employed in Accommodation & Food Services in Illinois?
Percentage of Population Employed in Accommodation & Food Services in Illinois is 6.5%.
What is the Percentage of Population Employed in Accommodation & Food Services in the United States?
Percentage of Population Employed in Accommodation & Food Services in the United States is 6.9%.