Zip Codes with the Highest Percentage of Population Employed in Accommodation & Food Services in Tinley Park, IL
RELATED REPORTS & OPTIONS
Accommodation & Food Services
Tinley Park
Compare Zip Codes
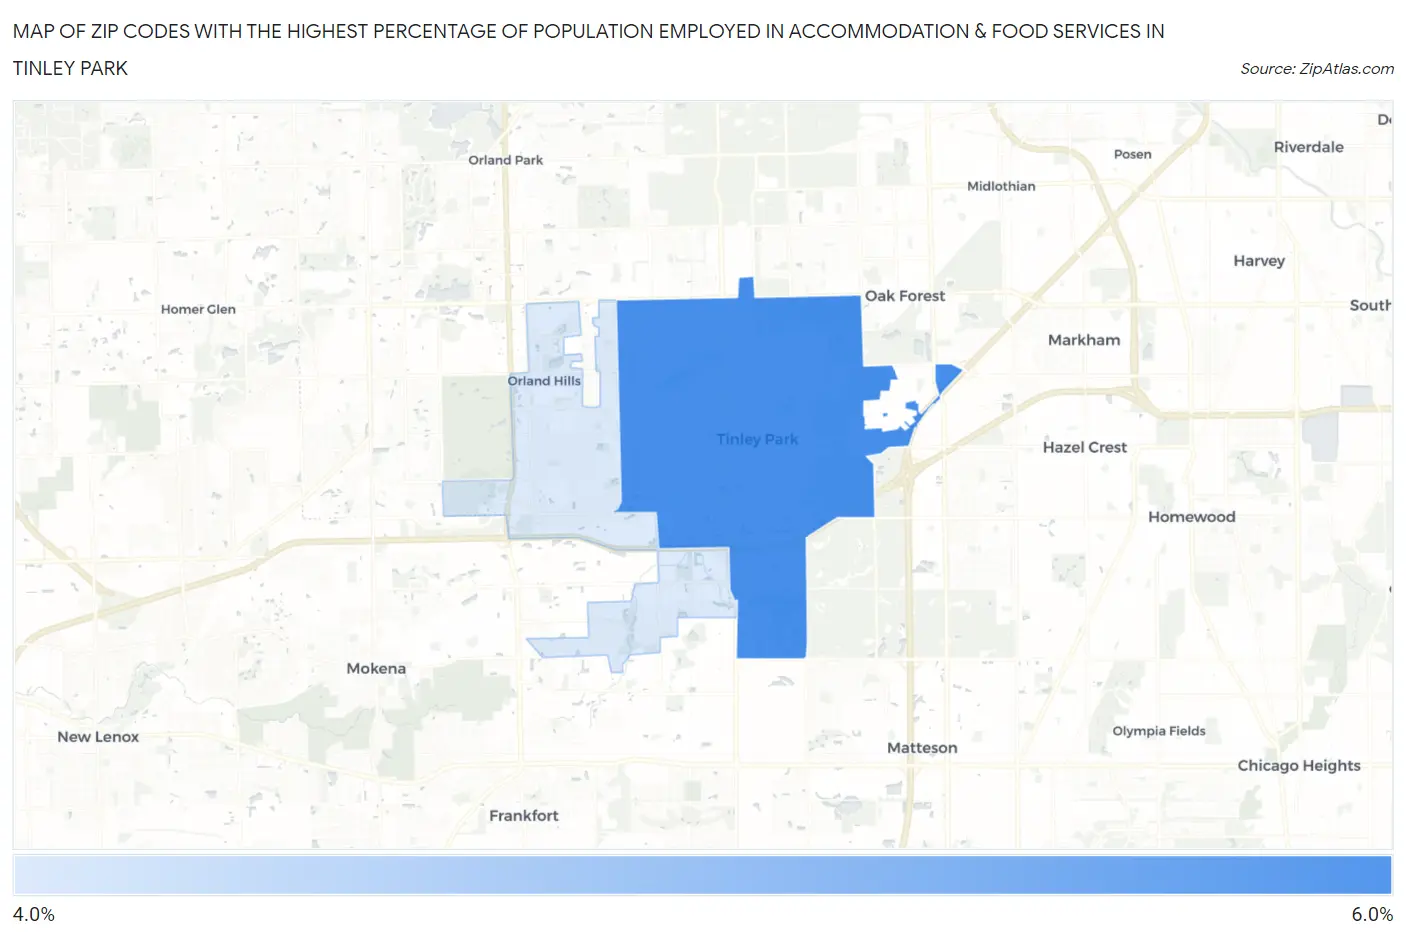
Map of Zip Codes with the Highest Percentage of Population Employed in Accommodation & Food Services in Tinley Park
4.7%
5.2%
Zip Codes with the Highest Percentage of Population Employed in Accommodation & Food Services in Tinley Park, IL
| Zip Code | % Employed | vs State | vs National | |
| 1. | 60477 | 5.2% | 6.5%(-1.31)#633 | 6.9%(-1.72)#16,246 |
| 2. | 60487 | 4.7% | 6.5%(-1.73)#706 | 6.9%(-2.14)#17,693 |
1
Common Questions
What are the Top Zip Codes with the Highest Percentage of Population Employed in Accommodation & Food Services in Tinley Park, IL?
Top Zip Codes with the Highest Percentage of Population Employed in Accommodation & Food Services in Tinley Park, IL are:
What zip code has the Highest Percentage of Population Employed in Accommodation & Food Services in Tinley Park, IL?
60477 has the Highest Percentage of Population Employed in Accommodation & Food Services in Tinley Park, IL with 5.2%.
What is the Percentage of Population Employed in Accommodation & Food Services in Tinley Park, IL?
Percentage of Population Employed in Accommodation & Food Services in Tinley Park is 4.8%.
What is the Percentage of Population Employed in Accommodation & Food Services in Illinois?
Percentage of Population Employed in Accommodation & Food Services in Illinois is 6.5%.
What is the Percentage of Population Employed in Accommodation & Food Services in the United States?
Percentage of Population Employed in Accommodation & Food Services in the United States is 6.9%.